
Submitted:
12 March 2023
Posted:
13 March 2023
You are already at the latest version
Abstract
The use of the commercial simulator Aspen Plus® could bring an amelioration in the accuracy of the predictions of the chemical species composition in the output streams of the anaerobic digestion process, due to availability of a broad library of thermodynamic and phenomena transport properties in this commercial package. In the present investigation, the process simulation model for anaerobic digestion, which was originally developed by Rajendran et al. [1], has been modified by including a stoichiometric-equilibria reactor to calculate the extent of the ionization of the molecules present in the anaerobic digestate. The refined model offers a more accurate prediction of the composition of the biogas because it delves on the chemical equilibrium of the gaseous stream and the anaerobic digestate. Additionally, the refined model allows to assess the possibility of upgrading the gaseous stream to biomethane degree via manufacturing of ammonium bicarbonate. This processing pathway relies on the stabilization of the anaerobic digestate by means of biomass ash-based treatment. First of all, the titration of the manure digestate with the hydrochloric acid showed that a dose of 3.18 mEq/g would be required to attain the targeted pH of zero-point charge, upon addition of the sewage sludge ash in a ratio to the manure digestate of 0.6 ± 0.2 %. Secondly, the profiles of ammonia, carbon dioxide, and methane found in the biogas agree with both the pH of the treated digestate and the processes described in for the simultaneously upgrading the biogas and the production of ammonium bicarbonate. The refined Aspen Plus® model presented in this article needs to be further developed to ensure the standards are attained in all output streams of stabilized anaerobic digestate, biomethane, and isolated added-value chemical fertilizers.
Keywords:
Waste valorization
; stabilization
; nutrient recovery
; closed-loop
; modelling
; circular economy
; ammonium carbonate
; organic fertilizer
; bioenergy
; biogas upgrading
1. Introduction
The anaerobic digestate is the byproduct of the biogas production through anaerobic digestion (AD) of the organic matter. Broadly speaking, the AD is a waste valorization technology that has the simultaneous purposes of recovering energy while treating the waste before disposal or land application as soil amendment [1]. The easiest way of modelling the anaerobic digestion is with the use of an unstructured unsegregated model. A model is considered unstructured if it does not involve the metabolism of the microorganism and it is regarded as unsegregated if there is no differentiation between the species doing the degradation of the biomass [2]. The first order kinetic have been traditionally the most widely used for the modelling of substrate consumption and biogas release during the AD [2,3,4]. This lumping approach has limitations, as recently a new approach (i.e. combining the first-order kinetic model and the Gamma distribution function) has been applied to elucidate that the so-called kinetic constants are not constant during the whole AD [5]. The acetic acid is synthesized in the penultimate stage of the AD (known as acetogenesis) and is the simplest fermentable substrate for the production of biogas, as described in Equation 1. In the area of wastewater treatment, where the AD has wide application for the treatment of the sewage sludge, the concentration of substrates is expressed as Chemical Oxygen Demand (COD) because this generalization allows the use of the same concentration units for different organic pollutants. Thereby, the reaction of biogas production can be further generalized as illustrated in Equation 2, taking into account that the COD of 1 g of CH3COOH is 1.6 g of O2, (following the stoichiometry of Equation 3). It is important to mention that the biogas composition still depends on the type of substrate and in the case of acetic acid it corresponds to equal moles of CH4 and CO2 being produced (Equation 1). The general relation between the consumption of substrate and the production of biogas correspond to Equation 4 and Equation 5. In order to model the production of biogas, it is necessary to introduce the theoretical yield or conversion coefficient of COD to biogas (α). Once again, α depends on the initial substrate and the biogas composition.
being:
The basis of COD has been suggested to be replaced by the volatile solids (VS), particularly at the time of conducting the biochemical methane potential (BMP) test with other residues different from wastewater, such as solid organic wastes and energy crops, because the determination of COD in solid heterogeneous substrates is difficult and open to uncertainty [6]. Since expressing the biogas production as mL/g VS is even a more general approach than the use of the COD basis, it is not possible to calculate analytically the theoretical yield of biogas in these units because the stoichiometric relation of these parameters needs to be determined empirically with a BMP test. According to the British regulation BSI PAS 110:2014 [7], the threshold value of stability of the anaerobic digestate is 450 mL/g VS. This means that the biogas released in the Residual Biogas Potential (RBP) test (i.e. following a particular protocol to conduct the BMP test) should not be greater than that upper limit by the end of the 28-day anaerobic assay, in order to allow the organic manure to be applied to land: The concentration of volatile fatty acids (VFA) in a sample may be determined ahead of an RBP test, by means of gas chromatography. If a digestate sample’s VFA result exceeds 0.774 g COD/g VS, this might indicate that the sample will fail a subsequent RBP test [7]. It should be noted that initially tighter upper limits were proposed, both for the pre-screening of the anaerobic digestate samples (0.43 g COD/g VS) and for the RBP value (250 mL biogas/g VS) [8]. In a revision of the protocol, Banks et al. [9] suggested that reducing the incubation from 28 days to 10 days might be possible considering a threshold value of 200 mL biogas/g VS [9]. The early parameter estimation (of the kinetic constant and the biogas yield) is much appreciated by companies or plants operators whose decision-making processes cannot be held for the whole BMP test, which could run over 100 days [10]. In fact, the reason for all these adaptations of BMP/RBP protocols is to enable their widest application by the stakeholders of the agroindustry, in the simplest manner possible. This standardization pretends a better management of the organic waste: preventing the putrefaction of the organic sludge after land application and reducing the emissions of greenhouse gases. However, this explanation of the AD in layman terms should not hinder the scientific community of using of rigorous computational methods for further understanding the underlying biochemistry of the anaerobic fermentation, improving the design of the bioreactors, and assessing the technical feasibility of other operations around the AD plant. Similarly, taking advantage of the meticulous property and thermodynamic calculations supported by commercial packages for process engineering, such as Aspen Plus® [11], could also offer a better understanding of the AD process and enhance the monitoring of the upstream, mainstream, and downstream operations [12,13]. Particularly, this would allow to analyze the performance at industrial-scale plant level, by following closely the interactions of the elements and molecules of the feedstocks, during all processing steps.
The appraisal of novel processing conditions, like the biomass ash-based treatment of the anaerobic digestate [14], is much more justified by the use of the Aspen Plus® simulation package, which allows to specify a wide range of parameters. The biomass ash-based treatment of the anaerobic digestate aims to improve the properties of the organic material as slow-release fertilizer, due to the sorption processes taking place. Advances on this technology should continue until reaching a high efficiency in the solid-liquid separation, given the high moisture content of the anaerobic digestate (95 wt.%) [15], the large quantities produced of this material (30,000 tonnes per year and per AD plant), and the cost of storage, transportation and land application (£10/tonne for a 10-mile delivery) [16]. The present article informs about the development of the process simulation model (PSM) of Rajendran et al. [11] in Aspen Plus® to monitor the biogas production and the valorization of anaerobic digestate by means of biomass ash-based treatment [14]. An assessment of the synergistic approaches that could reduce the cost of processing and handling the anaerobic digestate, aims to increase the viability of the treatment of anaerobic digestate and promote an overall enhancement of the circular economy [1]. The Aspen Plus® model that has been developed for simulating the conditions of the stabilization of the anaerobic digestate via ash-based treatment and the concentration profiles of the WS fraction of the digestate and the upgraded biogas were compared to the experimental findings and data from literature. Therefore, the results of implementing upstream and downstream operations in the commercial package are presented, with emphasis on stabilizing the anaerobic digestate, upgrading the biogas, and producing a stream of CO2 and NH3 suitable for the manufacturing of ammonium bicarbonate (NH4HCO3).
2. Materials and Methods
The model that Rajendran et al. [11] made available was used as the base to build the PSM (Figure 1). It is regarded as a library model because 46 reactions were implemented in Aspen Plus® v10, some of them with the use of FORTRAN programming language [11]. The AD was represented by a two-stage process comprising of a stoichiometric-equilibria reactor (B2) for the hydrolysis of the molecules of the substrate and a kinetic reactor (B3) involving the stages of acidogenesis, acetogenesis, and methanogenesis. The utilization of the model of Rajendran et al. [11] already represents an improvement with respect to the use of Anaerobic Digestion Model No 1 [17] because the latter is a lumping model while the former is a structure-based model (i.e. molecule-by-molecule), which gives greater insight that cannot be seen with the lumping approach. The model of Rajendran et al [11] offers accurate predictions of biogas production under the testing conditions in which it has been designed. However, the chemistry of the anaerobic digestate has been neglected and it is necessary to include an ionization reactor for simple characterization purposes (e.g. determination of the pH of the anaerobic digestate) and to be able to build the subsequent downstream steps. For the modeling of the biomass ash-based treatment, the streams of HCl, sewage sludge ash (SSA) and manure digestate (MD) were mixed in an ionization reactor (B4) in which the rate of mass transfer and dissociation of the compounds present in the gas, liquid, and solid phases were implemented (Figure 1). The calculation block B4 can be further justified by the need of stripping the CO2 and NH3 off the anaerobic digestate for the NH4HCO3 manufacturing process described by Wang et al. [18]. A theoretical analysis of this downstream synthesis operation is included in the discussion section, although this needs to be confirmed experimentally. Several challenges are expected, such as the fact that using the biogas as stripping agent is less efficient than the use of biomethane (>98 vol.% CH4) for that purpose [19]. On the other hand, the minimization of the requirements of energy and resources for the manufacturing of the NH4HCO3 are in line with the outcomes of the techno-economic assessments of Drapanauskaite et al. [20] and Centorcelli et al. [21], who simulated the preparation of the inorganic fertilizer as part of distillation processes.
The stoichiometric-equilibria reactor (B4) was ruled by the instantaneous equilibrium of gas, liquid, and solid phases. For this purpose, it was necessary to assume a Damköhler number (i.e. reaction rate/mass flow rate) greater than 100 [22] and chemical reactions involving compounds in the same phase (either liquid, gas, or both), which would not be limited by the rates of chemical kinetics and mass transfer between the phases. The Electrolytes Wizard function of Aspen Plus® was applied to correlate some of the ionic species in the liquid phase with the temperature (Equation 6). The parameters A, B, C, and D of Equation 6, where the equilibrium constants (Keq) are the subject, were derived from either Aspen Plus® Components Databank (Table A1) or literature (Table A2). Particularly, the Electrolytes Wizard does not include the acidic dissociation of amino acids and other organic compounds present in the anaerobic digestate as per the original PSM of Rajendran et al. [11] and some of this compounds would need to be added manually. The original PSM only considers the conversion of amino acids to acetic acid and the dissociation of the remaining amino acid molecules that were not converted to biogas was not taken into account. In order to successfully implement the ionization reactor in the Aspen Plus® model, it was necessary to estimate the properties of the system characterizing the blending of the MD and the SSA, such as the critical temperature and the heat of vaporization. The property method model used in this simulation was the Non-Random Two-Liquid model. The Aspen Plus® Components Databanks provided most of the properties for the components of the system and when these information was not available the parameters were determined with the method developed by Joback & Reid [23] and the R-PCER method. The ideal gas heat capacity for the components present in the system were calculated with the Aspen Ideal Gas Heat Capacity Polynomial Equation, while the Heat of vaporization was calculated with the Watson’s correlation [24].
The mixer (i.e. B1 in Figure 1) was employed to merge the composition of multiple feedstock streams and to consider the impact of the SSA on the AD of cow manure (Table 2). In fact, Rajendran et al. [11] initially included this calculation block to appraise the co-digestion of several substrates. The present investigation considered the SSA (Table 1) with the greatest phosphorus content reported by Franz [25], which was obtained over the co-combustion of 85 wt.% sewage sludge and 15 wt.% phosphate-rich bone meal as fuel. It is important to mention that the consideration of the SSA as one of the input streams of the blender (i.e. calculation block B1 in Figure 1) did not affected the AD process because the subsequent calculation blocks B2 and B3 (Figure 1), which were originally developed by Rajendran et al. [11], did not included the effect of the inorganic elements of Table 1. In the present work, the ash-based treatment of the anaerobic digestate was completed by combining the acidification with a second dose of ash in the downstream ionization reactor (B4). The purpose was to balance the stability granted by the isoelectric point of the anaerobic digestate [26,27] and the pH of zero-point charge (pHzpc) of the wood ash [28].
The results reported in this article correspond to 7 different process strategies: Case 1 is the foundation case (labelled as untreated MD) that served as benchmark and it implied the production of MD using the original PSM of Rajendran et al. [11]. In Case 2 a stream of pure hydrochloric acid was incorporated at a 0.1000 times the flowrate of the MD towards the ionization reactor (1HCl:10MD). In Case 3 a stream of hydrochloric acid was incorporated at 0.1176 times the flowrate of the MD towards the stoichiometric-equilibria reactor (1HCl:8.5MD). In Case 4 a stream of hydrochloric acid was incorporated at 0.1212 times the flowrate of the MD towards the ionization reactor (1HCl:8.25MD). The remaining 3 cases are built on Case 3 (i.e. considering the previous acidification of the MD with the dose of 3.18 mEq HCl/g). In this way, in Case 5 the stream of SSA (Table 1) was incorporated at 0.0040 times the flowrate of the MD towards the stoichiometric-equilibria reactor (1SSA:1.76HCl:15MD). In Case 6 the stream of ash (Table 1) was incorporated at 0.0060 times the flowrate of the MD towards the ionization reactor (1SSA:1.18HCl:10MD). In Case 7 the stream of ash was incorporated at 0.0080 times the flowrate of the DM to the stoichiometric-equilibria reactor (1SSA:0.88HCl:7.5MD). According to the study of Zheng et al. [32], the amount of ash that should be added to the digestate to attain the most efficient dewatering is the same as the total solid content of the latter material, which for the samples of SSA and MD would correspond to a ratio of 0.06 (Table 2). The doses of SSA to MD employed in Case 5, Case 6, and Case 7 (0.0060 ± 0.0020) were an order of magnitude lower than the specification provided by Zheng et al. [11], due to the intended preparation of a solid granular fertilizer with the targeted nutrient profile N/P/K 3/1/1 [14]; although attaining this ratio depends on the amount of nutrients that remain in the water-soluble (WS) fraction after the solid-liquid separation. The results of the Aspen Plus® simulation were compared against those previously obtained experimentally and with the software visual MINTEQ [28]. The ANOVA test (p < 0.05) was performed with Microsoft Excel® to identify significant differences between the trends observed.
3. Results
3.1. pH of the Treated Digestate: Simulation and Experimental Results
Figure 2 shows the pH results of MD acidified with HCl (Cases 2 – 4) using doses in the range of 2.70 – 3.28 mEq/g, which were previously employed in the preparation of blended fertilizers with wood fly ash (WFA), wood bottom ash (WBA), food waste digestate (FWD), and agrowaste (PVWD) [28]. The simulation with Aspen Plus® does not provide standard deviation for single runs but the number of iterations was set up to 500 in order to achieve convergence with a tolerance error of 0.0001, 0.00075, 0.00075, and 0.0005 in the calculation blocks B1, B2, B3, and B4 (Figure 1), respectively. Figure 3 illustrates the deviation of the buffer capacity of the digestate: experimental and simulation inflexion points of the M-alkalinity of anaerobic digestate. The model predicts a higher buffer capacity than what were found experimentally (0.5 – 1 mEq HCl/g digestate) and with visual MINTEQ titrations (2 – 2.5 mEq HCl/g digestate). The trends were similar in the sense that both software packages predicted higher buffer capacity for the anaerobic digestates than what was found experimentally (Figure 3). This might be related to the fact that the nature of the digestates tested was different: MD, FWD, and PVWD. The FWD presented greater buffer capacity due to the higher content of ammoniacal nitrogen (NH4+-N) than the PVWD. It is important to highlight that the buffer effects of the VFA were not accounted in the visual MINTEQ simulation, which could explain the greater buffer capacity of MD found in the Aspen Plus® simulation (i.e. Cases 1 – 4; Figure 2 – 4). On the other hand, as elucidated in the previous work [33], the impact of the acid added to the anaerobic digestate on the pH is related to both the concentration of free H+(aq) and the sorption processes involving the anionic species of the acid, particularly in the case of H2SO4 and CH3CH(OH)COOH. Therefore, the dose of acid is better reported as mEq acid/g digestate rather than as mmol H+-acid/g digestate [28]. The severe acidification of the anaerobic digestate (pH < 4) can be justified by working at the isoelectric point of this material [26,27] and the pHzpc upon addition of the ash, to maximize the sorption phenomena underlying the stabilization of the blended fertilizer. Following this balanced approach, the case 3 with a pH of 4.10, which involved a dose of 3.18 mEq HCl/g MD, was used as the base for conducting the addition of the SSA in cases 5 to 7.
Figure 3 also stablishes the correlation of the experimental pH, which is directly measured with a pH probe in the lab, and the pH calculated in the simulations (visual MINTEQ and cases 2 to 4 of Aspen Plus®) with the concentration of free-H+ (mol/L), which could be found at a particular acid dose (mEq/g digestate). There is a significant difference of buffer capacity of the soil organic amendment determined through the 3 methods, particularly in terms of the dose of HCl (p < 0.05). The deviation can be explained by the fact that the simulations (visual MINTEQ and Aspen Plus®) overestimate the inflexion point of the M-alkalinity of the anaerobic digestate compared to the experimental pH [28], leading to a significant greater consumption of acid reagent, which increases the cost of processing the anaerobic digestate. The large error bars in Figure 3 are due to the calculation of the average value of pH in the inflexion point of the titrations (both experimental and simulation), considering the highest and lowest pH values of the schematic titration curve represented in red color (Figure 3).
Figure 3.
Deviation of the buffer capacity of the digestates: Inflexion points of the M-alkalinity of anaerobic digestate (schematic titration curves represented in red color) found with 3 titration methods: Experiments and modelling with Visual MINTEQ and Aspen Plus® (cases 2, 3, and 4).
Figure 3.
Deviation of the buffer capacity of the digestates: Inflexion points of the M-alkalinity of anaerobic digestate (schematic titration curves represented in red color) found with 3 titration methods: Experiments and modelling with Visual MINTEQ and Aspen Plus® (cases 2, 3, and 4).
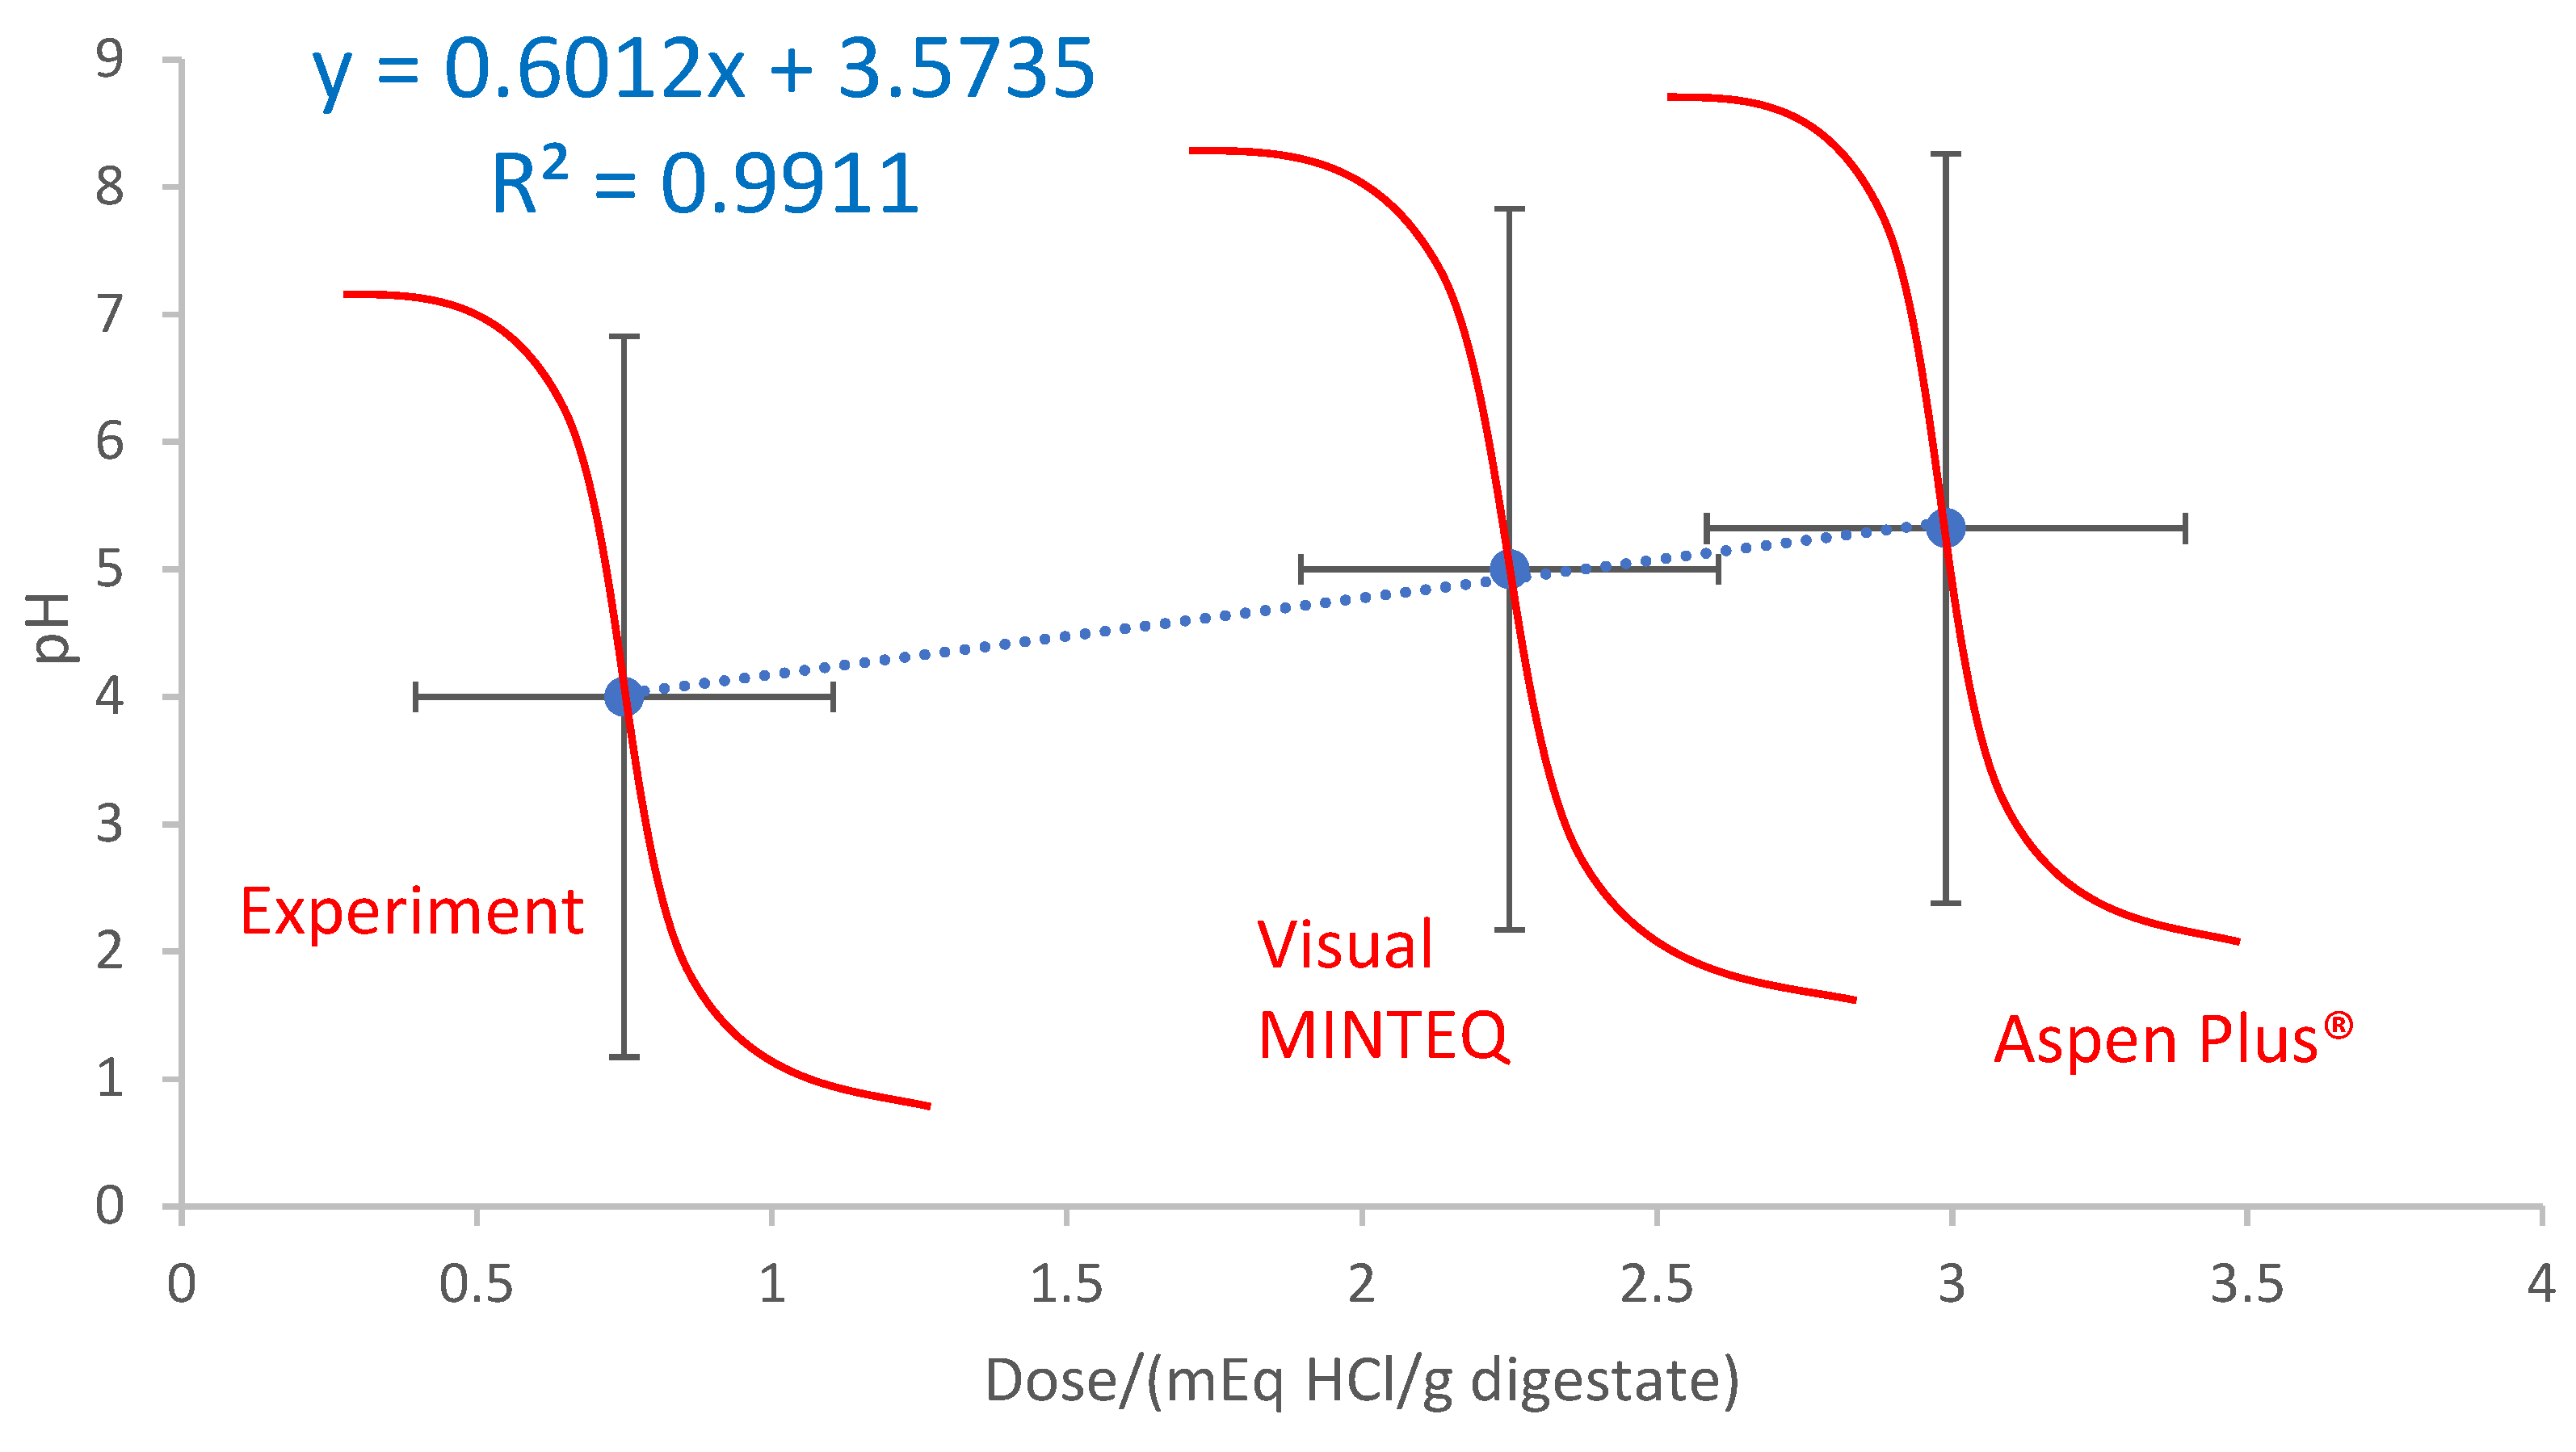
Figure 4 compares the pH range obtained with the Aspen Plus® simulation (11.61 ± 2.09), using a dose 3.18 mEq HCl/g MD and blending ratio (SSA/MD) of 0.0060 ± 0.0020, to the experimental data reported by Moure Abelenda et al. [28] and to the first set of experiments conducted by Moure Abelenda et al. [33]. Despite the HCl dose employed for the Aspen Plus® simulation was ~10 times greater than that of the other acids (H2SO4, HCl, and HNO3), although ~10 times lower the dose of lactic acid, the trend was not followed for the pH of the blend SSA+MD (Figure 4). The pH of the SSA+MD should be greater than 2.71 ± 0.12 but lower than 11.21 ± 1.24 (Figure 4). It is important to highlight that the Aspen Plus® simulations were conducted with the composition of the SSA of Winterthur incinerator (Switzerland) originally reported by Franz [25]. Franz [25] did not include the characterization of the loss of ignition for the determination of other elements that might be present in the SSA (e.g. moisture and carbon) but it was reported that the SSA was poorly crystalized, based on the mineral analysis via X-ray diffraction. In fact, Anderson [29] informed that about 70% of SSA consists of glassy-phase material. Therefore, assuming the content of carbon and moisture as reported in Table 1 (i.e. 50 wt.% of the SSA are black carbon and moisture) leads to a more reliable Aspen Plus® model because lower pH of the blend SSA+MD will be obtained, due to the lower content of alkaline elements in the SSA. The Aspen Plus® model also needs to be improved by oxides of elements like aluminum, with an amphoteric behavior, that act as a base under low pH and as an acid under high pH. On the top of that, the alkaline elements were inputted in the model as hydroxides, formed upon reaction of the oxides with water, although the SSA stream would be less basic if the metals of the SSA were in the form of carbonates. Several conditions could explain the chemical speciation of the metals in the ash derived from a incineration process at mild temperature conditions (< 1000 ºC), as described by Franz [25], including the lengthy storage and the reaction of the SSA with the CO2 of the atmosphere [34]. It is necessary to use a factorial design of experiments to ensure that several parameters (i.e. type of digestate, type of ash, and acidification dose of the anaerobic digestate prior to add the ash) are not changing at the same time when conducting the simulation. The most important conclusion that can be inferred based on Figure 4 is that under the conditions studied, the pHzpc (11.21 ± 1.24 – 12.74 ± 0.11) was always attained for the blend of acidified digestate and ash, unless the lactic acid was employed as acidification agent.
The previous investigation described the need to combine the FWD with a low share of fine ash, such as the WFA, to minimize the increase of pH and maximize the sorption of ammoniacal nitrogen [28]. Although the high NH4+-N content of the FWD has a buffer effect (associated with the P-alkalinity of the anaerobic digestate) that avoids drastic changes of pH, the PVWD is more suitable as it might not lead to an excess of NH3 volatilization (beyond the optimum ratio of NH3 to CO2 for the production of NH4HCO3; Equation 9). This is due to the greater content of undigested vegetable fiber of the PVWD compared to the FWD, which makes the former digestate more suitable to tolerate the greater basicity of the WBA. In fact, the dose of ash added to the anaerobic digestate was found to be less relevant than the properties (e.g. particle size) and composition (e.g. concentration of basic elements) of the ash to determine the final pH of the blend. For this reason, the difference in pH due to the dose of ash is not significant (p < 0.05), except when lactic acid was used as acidification agent. The simulation with Aspen Plus®, testing the addition of the SSA to the MD (cases 5 – 7; Figure 2) appears to have more sensitivity than working in experimental conditions. Therefore, a limitation of the simulation with Aspen Plus® is that the model offers more control on the pH of the blend than the experimental conditions and this might be misleading in the design of the valorization process of the anaerobic digestate via ash treatment. For example, in the simulation the pHzpc can be attained with a milder dose of ash, saving the acid reagent that would be necessary for the prior acidification of the anaerobic digestate to operate at the best conditions for the chemical stabilization [35].
3.2. Nutrient Profile of the Blend of Ash and Digestate in the Stabilization Process
The profile of the WS nutrients in the 7 cases evaluated in the present study is shown in Figure 5. The WS fraction of the organic soil amendment is more reactive than the water-insoluble (WI) fraction. This is important because the WS nutrients are absorbed in the rhizosphere by the plant roots but also this fraction of nutrients is more prone to be lost via leaching and volatilization. According to the data represented in Figure 5, the greatest change in availability was found in the WS K, which increased progressively until reaching a maximum in Case 5 (1SSA:1.76HCl:15MD). The outlier value of WS K in Case 2 (1HCl:10MD) that does not fit with the observed trend for the other 6 cases could be related to the fragility of the model. Thereby, the profile of WS K can be explained by the fact that more severe acidification leads to more solubilization of metals [36]. In addition, the SSA is also a source of K that increases the WS K concentration but as the pH of the blend became closer to the pHzpc the concentration of the WS nutrients is reduced, due to the sorption processes responsible of the chemical stabilization that enhance the properties of the manure as controlled release fertilizer. As can be seen in Figure 5, the ratio of WS N to WS P is kept below a value of 1 in all cases, with the exception of case 7 (1SSA:0.88HCl:7.5MD). The increase on the concentration of WS N could be related to the ammonification phenomenon resulting from the mineralization of WI organic nitrogen [37]. In fact, Figure 6 shows the increase of inorganic nitrogen (mainly NH4+-N) in the WS fraction in the case 6 (1SSA:1.18HCl:10MD) and case 7 (1SSA:0.88HCl:7.5MD) due to the high pH. In the manufacturing of a slow-release fertilizer, it is important to pay special attention to the rate of nutrient release and the concentration of nutrients in the WI fraction. The mass balances of nitrogen, carbon, potassium, phosphorus, magnesium, calcium, and sulfur, considering the different phases implemented in the stoichiometric-equilibria reactor (calculation block B4 of Figure 1), can be established with the research data collected from the simulation of each of the 7 cases, which are offered as excel files in the Supplementary materials: The most relevant data has been summarized in a MS Word file (Table S1, Table S2, and Table S3).
The balanced use of the HCl and ash allows to reach the pHzpc in the blend with the digestate and takes advantage of the amphoteric behavior of some of the components of the ash, because this inorganic material gets in contact with the isoelectric point of the anaerobic digestate. The equilibrium constant of the amino acids that remain in the manure digestate, because they were not converted to VFA and biogas, can be more than a single value because of the presence of several functional groups. Depending on the pH of the medium and the isoelectric point of each amino acid, priority will be given to the release of a proton from a particular functional group. For example, the tyrosine has three different dissociation constants corresponding to the carboxyl group, the protonated amine group and the phenol group (Table A2). In this way, the priority of proton release from tyrosine depends on the pH as follows: below a pH of 2.20 there is no proton release, below a pH of 9.11 the carboxylic acid releases its proton, below 10.07 the protonated amino group releases its proton, and above the pH of 10.07 finally the phenol group releases its proton. This means that the isoelectric point of the tyrosine, at which the zwitterion is stable and this amino acid has a net charge of zero, ranges from a pH of 2.20 up to 9.11. As this amphoteric behavior stabilizes the manure digestate because minimizes the repulsion between molecules, the addition of the SSA as nutrient supplement needs to be planned accordingly since the components detailed in Table 1, such as the Al2O3, can also act as an acid or as a base depending on the pH. In this way, the addition of the SSA can further reduce the repulsion between molecules, promote the solid-liquid separation, and allow the dewatering when the blend reaches the pHzpc.
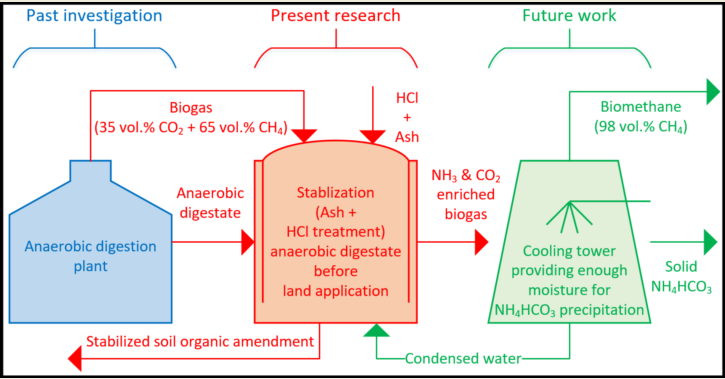
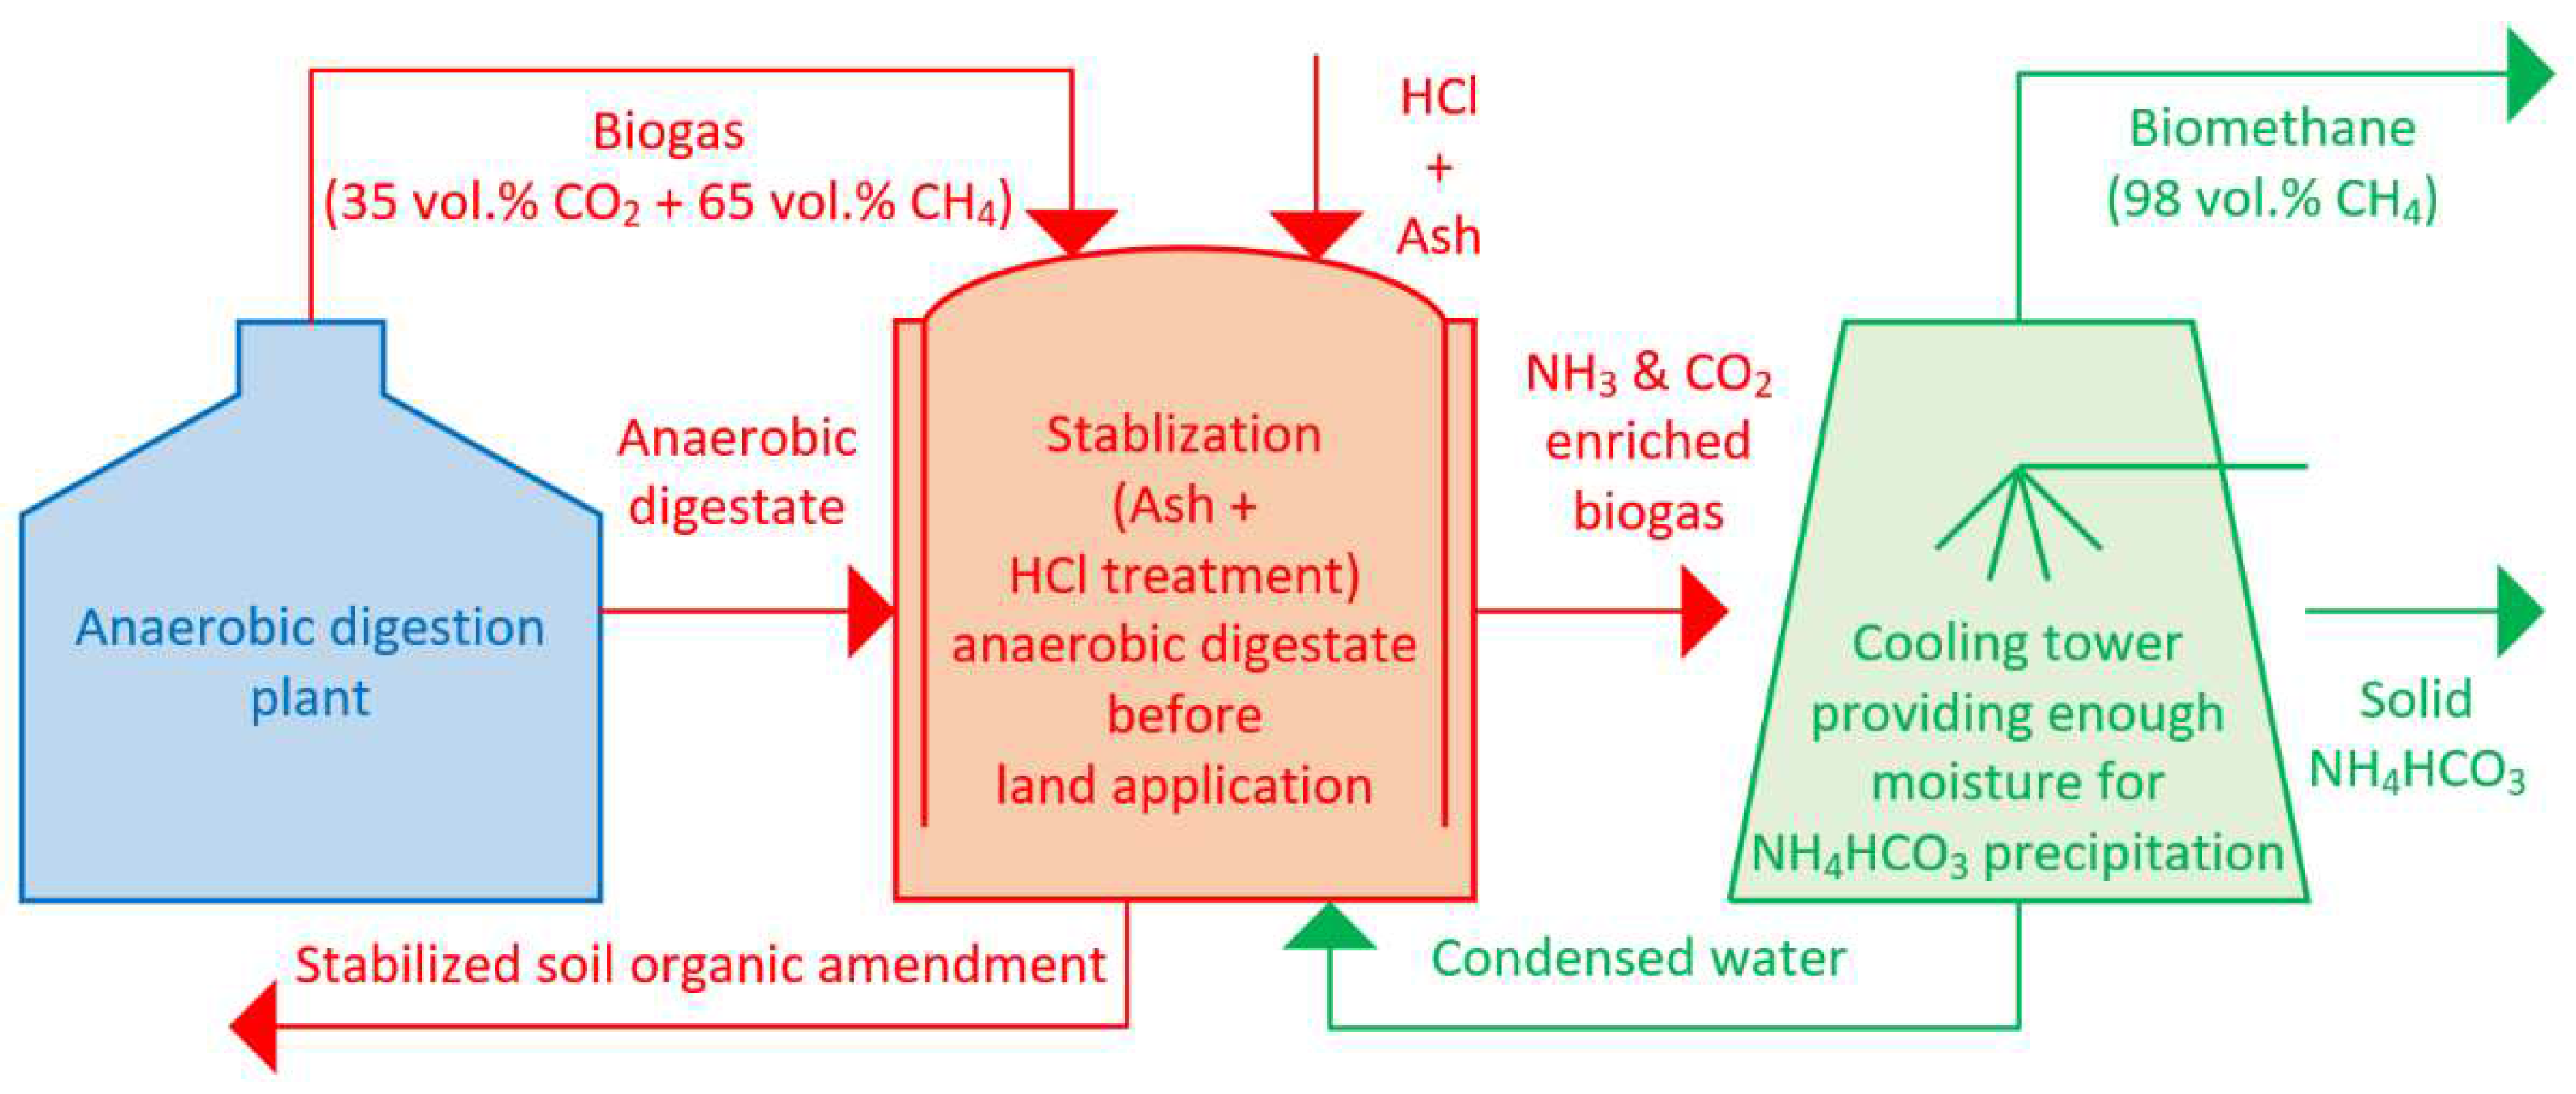
Figure 7 represents a process for the preparation of the blended fertilizer of ash and digestate and synergistically upgradation of the biogas and production of NH4HCO3 in a closed-loop process, which is techno-economically better regarded than the production of (NH4)2SO4 [20]. The ash-based treatment of the digestate at the pHzpc would generate a gaseous stream containing CO2 and NH3 that could be used for the synthesis of NH4HCO3. (Equation 9). The Aspen Plus® simulations of the present article are suitable for the design of the block that is depicted in Figure 7 in red colour. In line with the simulation based on the calculation block B4 (Figure 1) and as in the process designed by Wang et al. [18] for the manufacturing of NH4HCO3, in Figure 7 the stream of biogas coming out of the anaerobic digestion plant enters the stabilization tank as stripping agent,. The stripping process can be enhanced by using biomethane (> 98 vol.%) rather than biogas, as Burke [19] described in the ammonium bicarbonate patented process. In any case, conditions of the pHzpc employed allow the release of NH3 and the CO2. Depending on the carbonate content of the ash, the amount of CO2 released could increase significantly upon addition of the inorganic material to the digestate at the isoelectric point, shortly before the pH of the blend rises to reach the pHzpc. In case not enough CO2 were available in the stripped gas (Equation 17), the cooling and scrubbing shower of Figure 7 could operate with a diluted solution of H2SO4 to produce primarily (NH4)2SO4 and in a lower extent NH4HSO4 and NH4HCO3, as described by Ukwuani & Tao [38]. Under an excess of H2SO4 in the scrubbing solution, the formation of NH4HSO4 will prevail [38] and the condensed water may contain some traces of H2SO4 but this compound will not affect negatively the stabilization treatment of the digestate with ash, upon recirculation of the condensed aqueous scrubbing solution.
Figure 5.
Profile of WS N, WS P, and WS K in the treated MD with HCl and SSA.
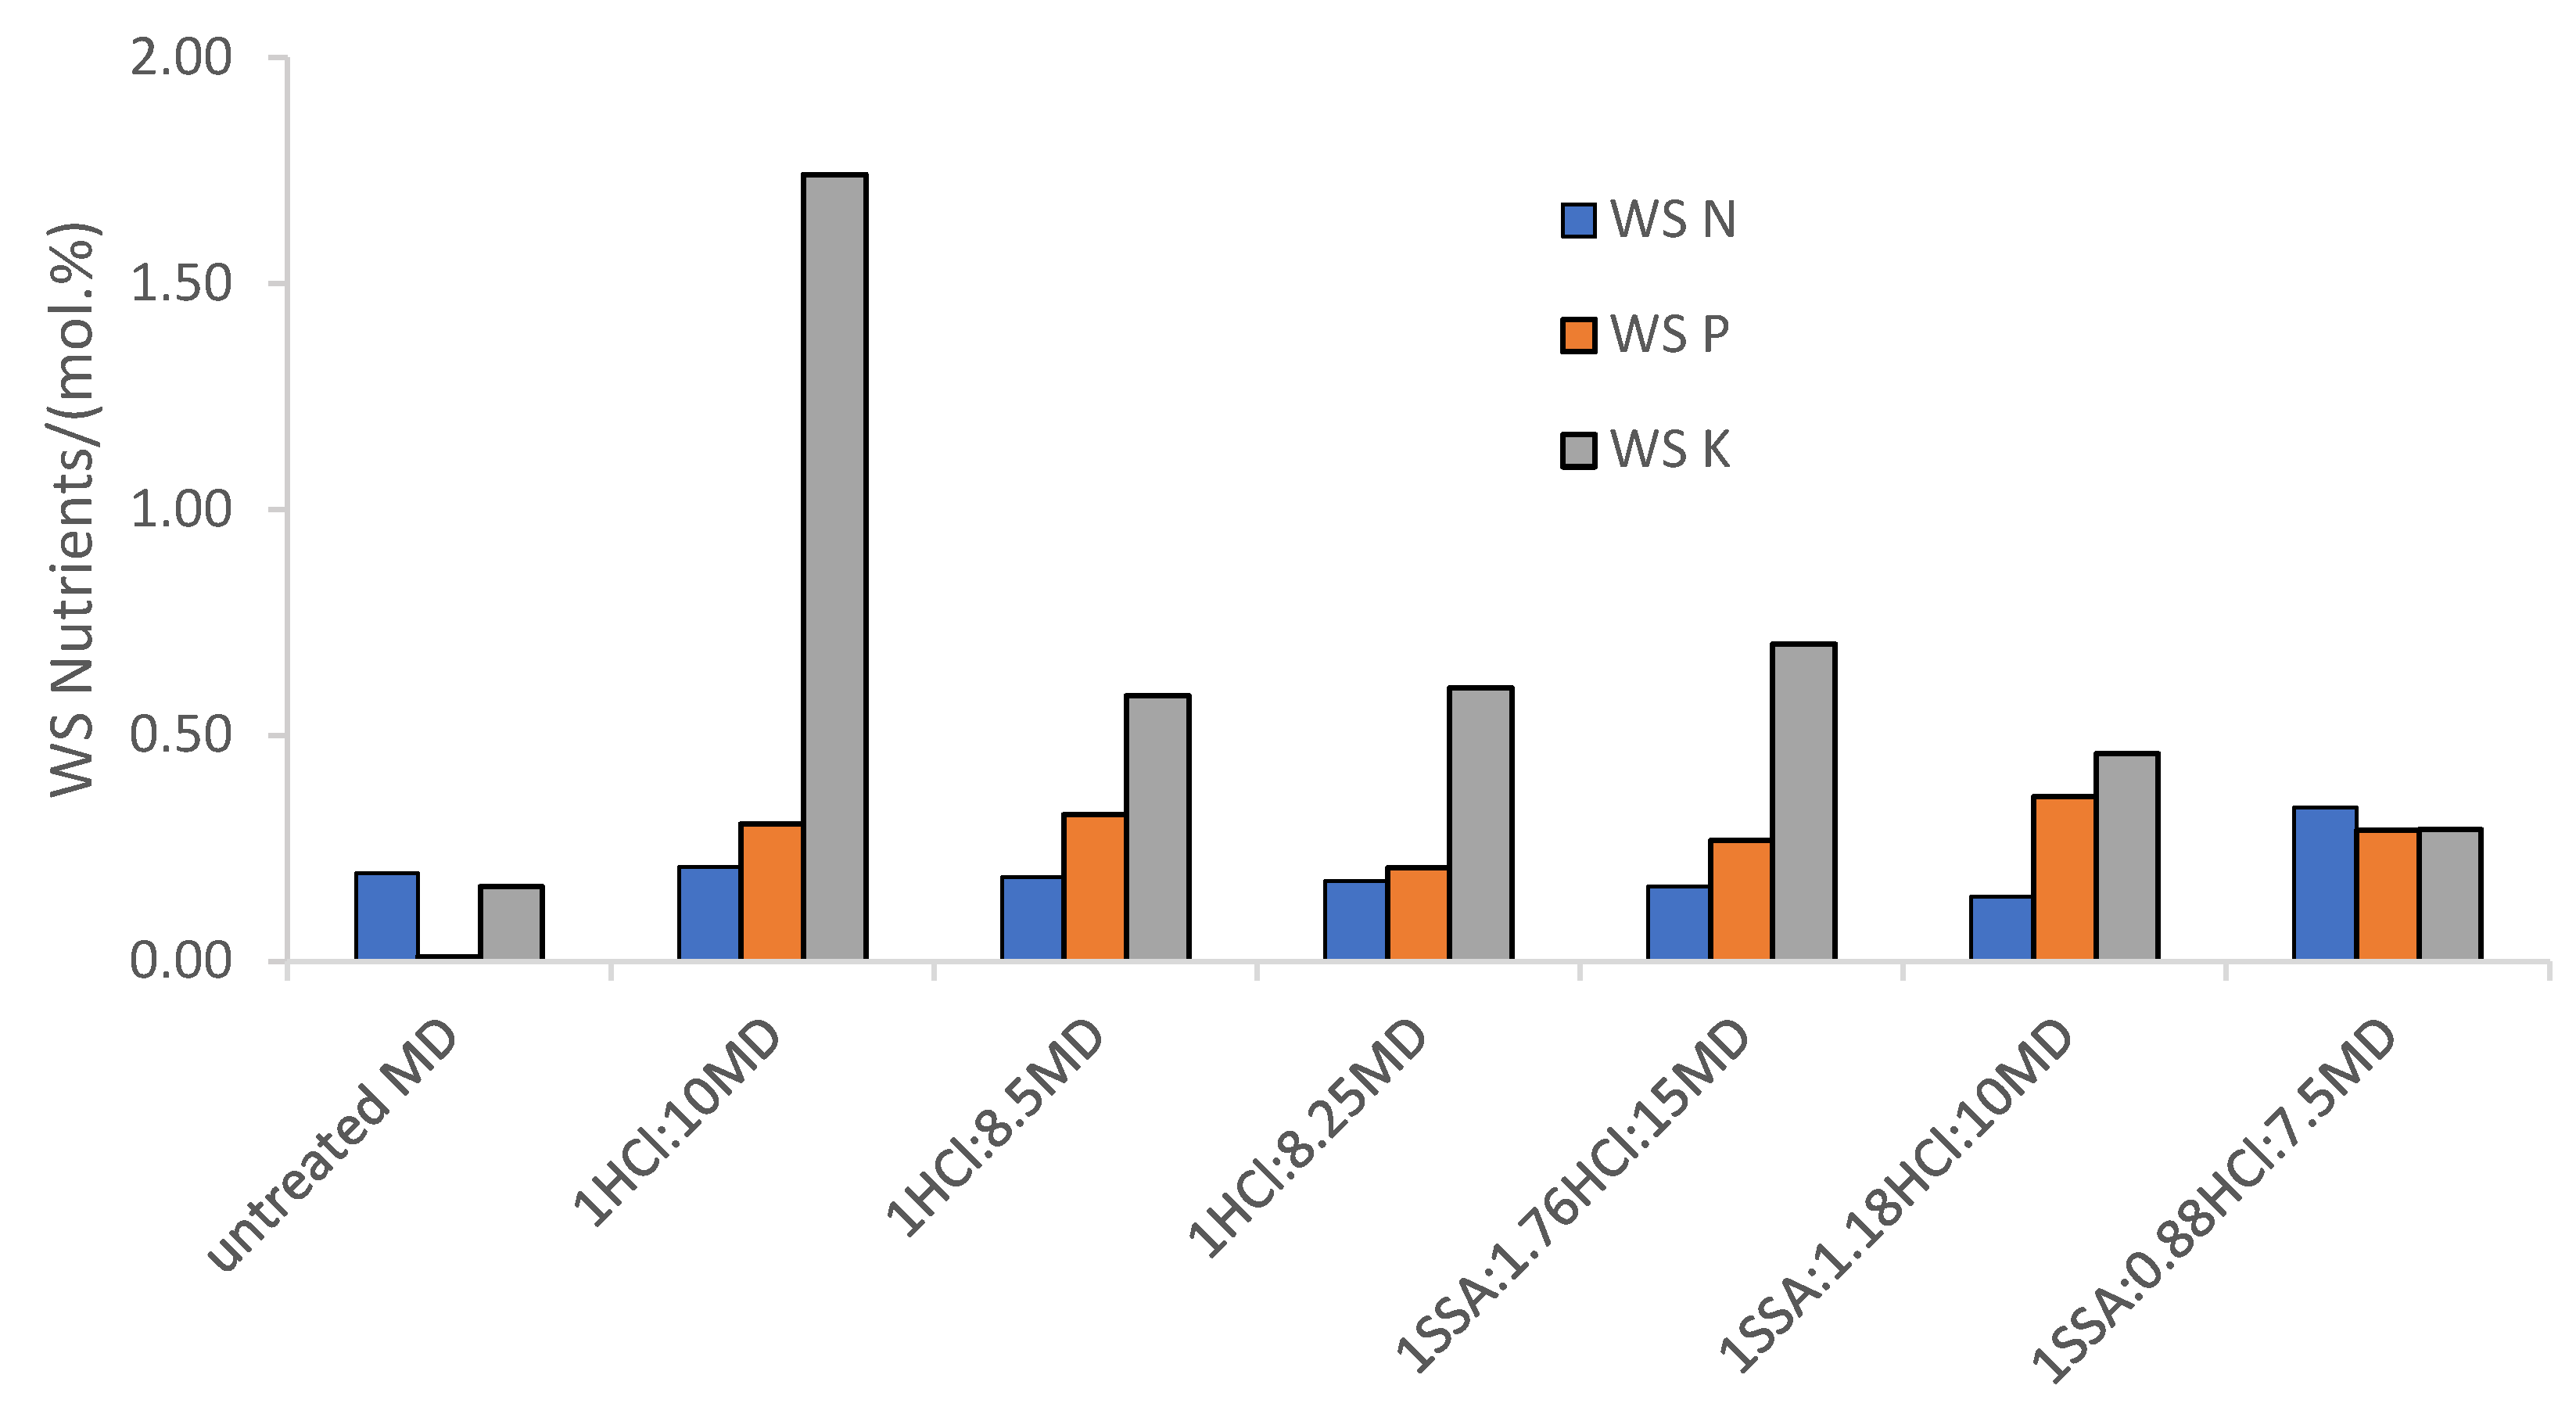
Figure 6.
Share of WS organic and inorganic nitrogen in the treated MD with HCl and SSA.
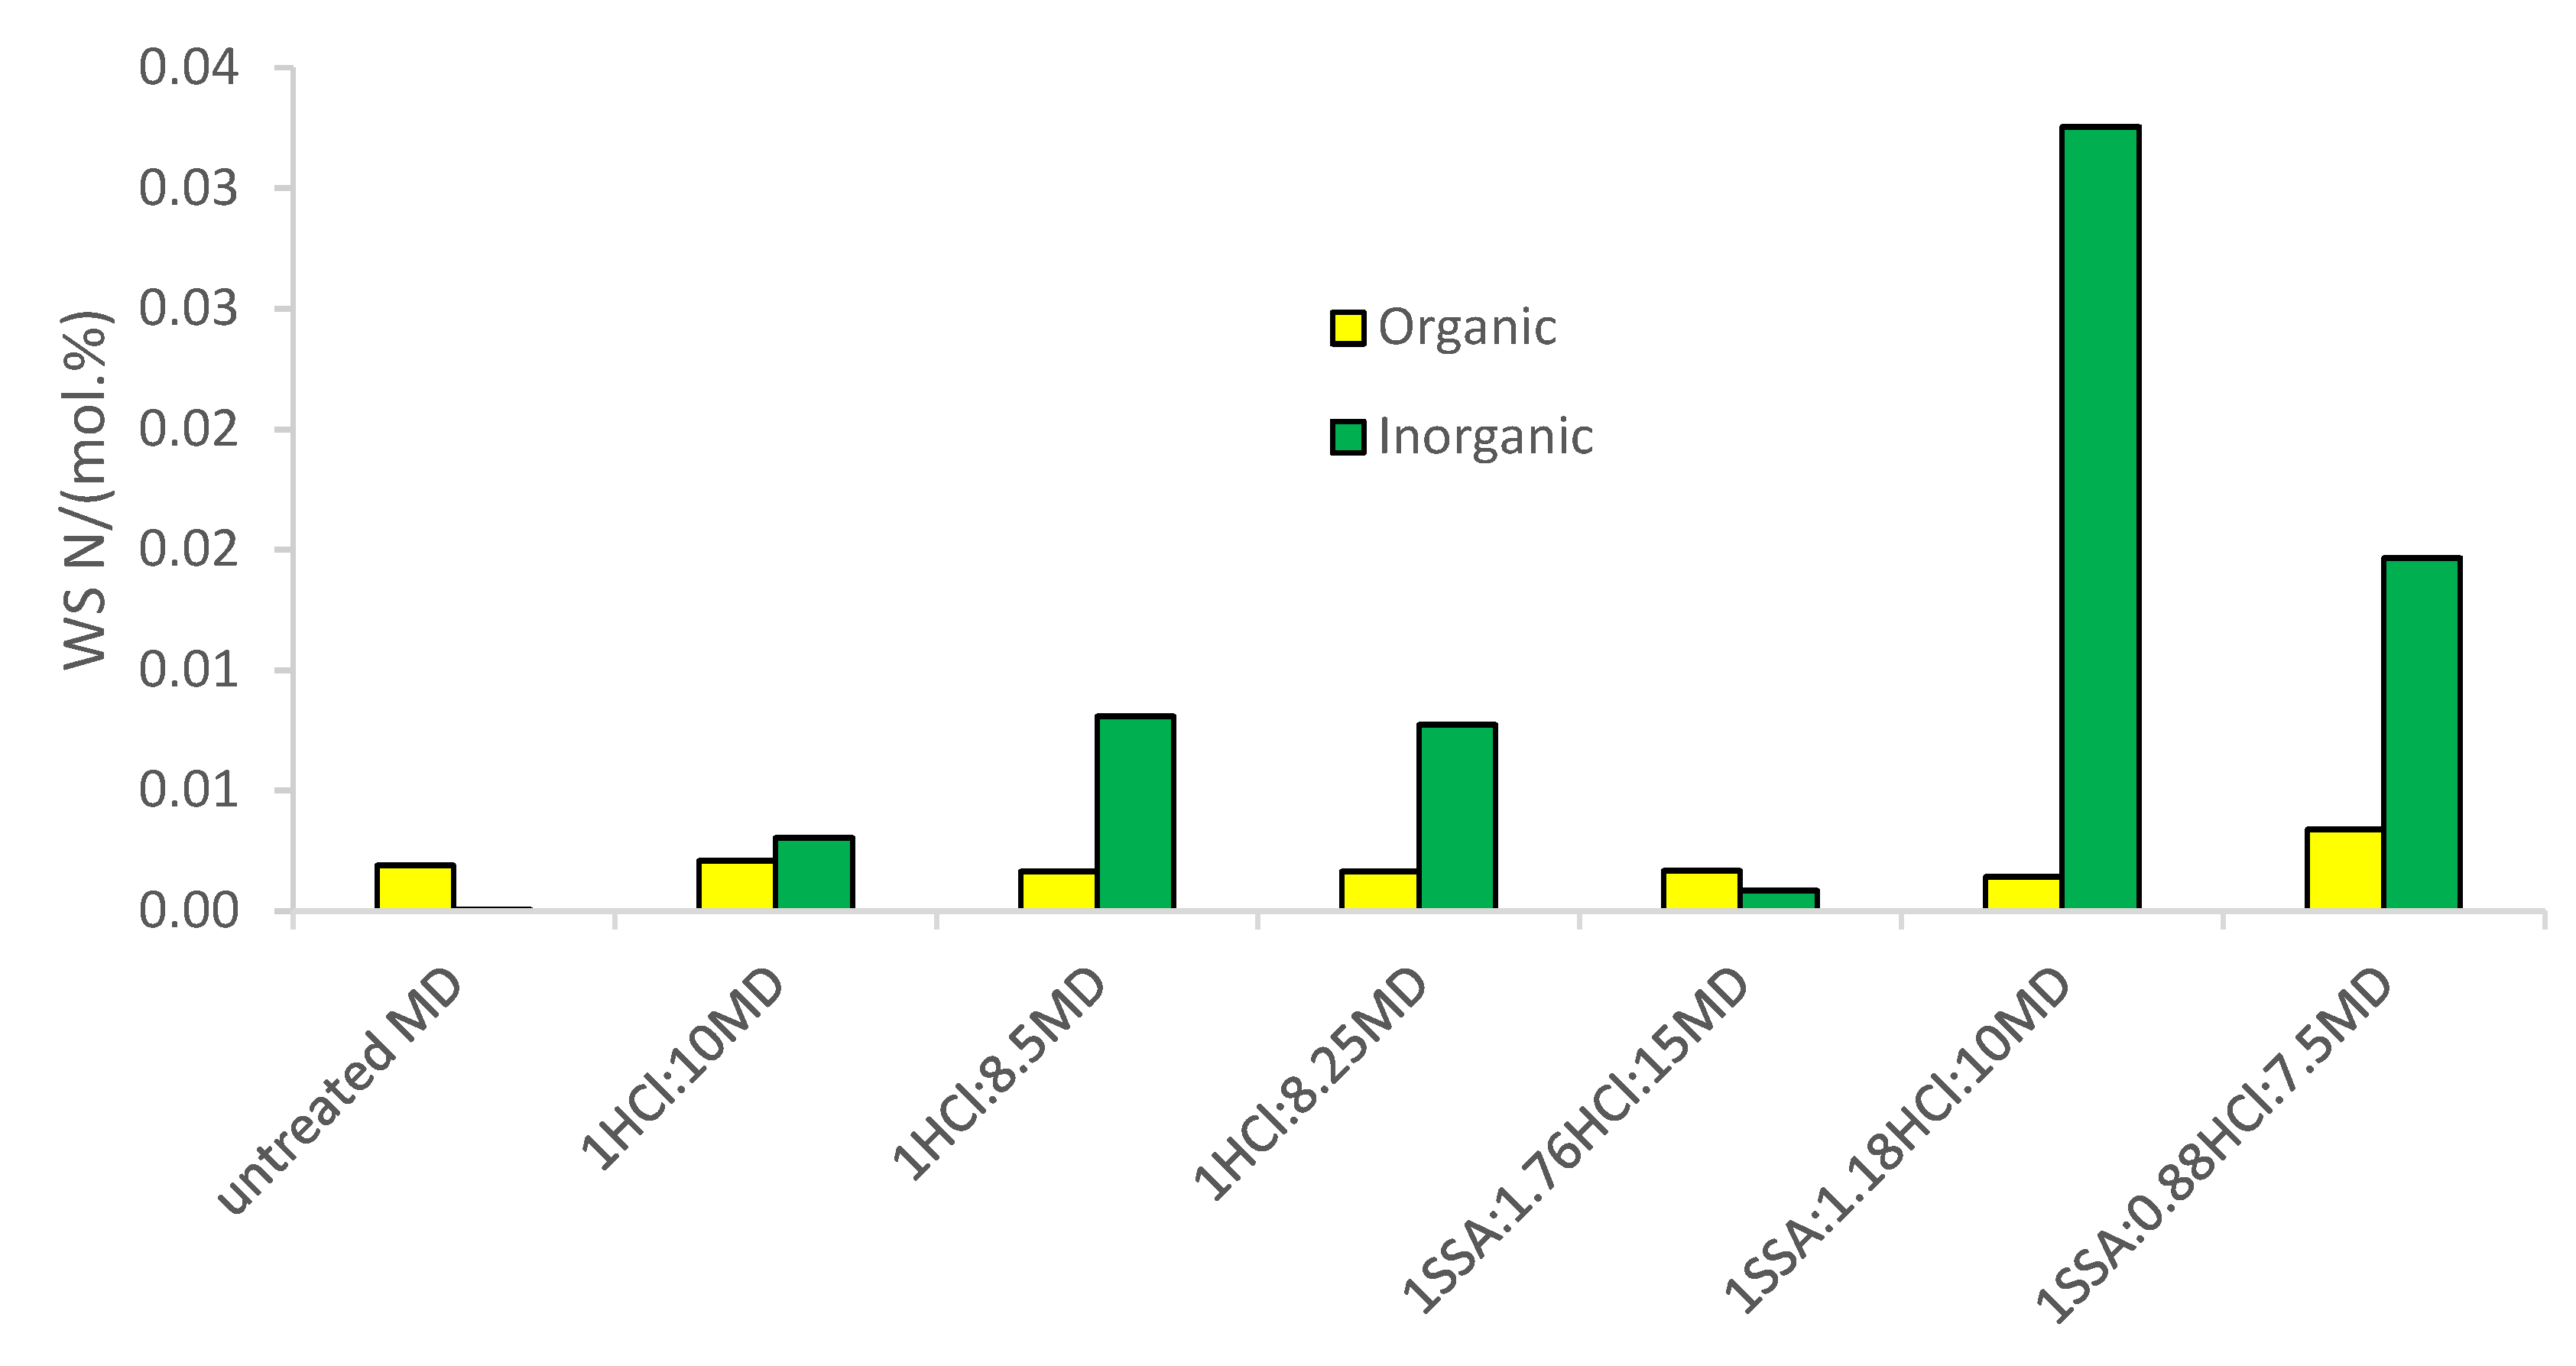
Figure 7.
Ash-based treatment of the anaerobic digestate (present investigation in red color) for the production of NH4HCO3 and upgrading of biogas (future research in green color).
Figure 7.
Ash-based treatment of the anaerobic digestate (present investigation in red color) for the production of NH4HCO3 and upgrading of biogas (future research in green color).
3.3. Composition of the Biogas Released from the Stabilization Process of the MD with the SSA
Figure 8 shows that the volatilization of NH3 is only significant at high pH and this trend is contrary to the volatilization of CO2. In this way, the highest CO2 released is attained with the HCl acidification of MF, prior to the addition of SSA (Figure 9). Case 5 represents an exception to the expected trend and can be explained by the fragility of Newton method-based solver of the model, which has been found sensitive to the initial solutions of the large number of nonlinear equations associated with the chemical and physical equilibria. Finally, the profile of CH4 in the biogas can be explained by the fact that the release of the CO2 could be as representative as the content of the former gas, thus when the release of CO2 was promoted, the share of CH4 in the biogas was lower and vice versa (Figure 10).
4. Discussion
A third of all gaseous emissions (including CH4, CO2, and NH3) associated with the management of organic residues via AD technology are derived from the last stage of storage [39,40]. Although the rate of biogas production reaches its peak during the controlled mesophilic or thermophilic fermentation that occurs in the anaerobic digester, the time of the psychrophilic storage can be 10 times longer [35,41,42]. For this reason, there are storage systems with facilities for the recovery of the biogas [43]. However open lagoons are also used to hold the anaerobic digestate before land application, where these gases are simply emitted to the atmosphere [40,44]. The values reported in the literature (Table 3) are below the upper limit of 450 mL biogas/g VS stablished in the UK regulations [7], hence these digestates would be suitable to be used as organic amendments. Table 3 offers a summary of the residual biogas and methane potentials of different types of digestate (i.e. produced from different substrates and employed different types of solid-liquid separation equipment). Except for the results reported by Gioelli et al. [40], a direct relation could be established between the solid content of the fractions of the anaerobic digestate and the biogas production. This could be explained by the greater concentration of fermentable organic matter (solid fraction > whole digestate > liquid fraction) and the greater surface area of a material which is not submerged in liquid [14]. The results of Sambusiti et al. [45] agree with the higher concentration of biodegradable material in the solids, with a theoretical methane yield of 415 mL CH4/g cellulose, 424 mL CH4/g xylan and 420 mL CH4/g proteins. They further proposed that the liquor might have a greater concentration of less degradable humic substances in addition to ammonia that inhibit the fermentation in concentrations higher than 2.5 g/L.
The role of CH4, CO2, and NH3 in the upstream (i.e. conditioning and pretreatment of the feedstock), mainstream (i.e. operating conditions of the main AD bioreactors), and downstream (i.e. storage, nutrient recovery and solid-liquid separation) should be recognized for the overall monitoring of the valorization technology [12,13,47]. Particularly, the CO2 injection is employed as manure pretreatment to increase the production of CH4 by promoting the bioconversion of the inorganic source of carbon directly through hydrogenotrophic methanogenesis, indirectly through homoacetogenic acetate formation followed by acetolactic methanogenesis or via electron transfer [47]. Therefore, the stabilization reactor was fed with the streams of biogas and anaerobic digestate as described in the Figure 1 and Figure 7. In order to enhance the chemistry of the multiple reactions between the NH3 (aq) and the CO2 (g) data obtained from the investigations related to the absorption of CO2 (g) in aqua-ammonia solutions were considered. According to Mani et al. [48], the reactions between the CO2 (g) and the NH3 (aq) are exothermic and occur at room temperature (293 K) and atmospheric pressure to produce NH4HCO3, ammonium carbonate ((NH4)2CO3), and ammonium carbamate (NH2COONH4). The multiple reactions between the weak acid (Equation 7) and the weak base (Equation 8) correspond with a complex system, which is difficult to represent unless neglecting some equilibria, due to their short availability of thermodynamic data. Based on Equation 7 to Equation 11, the composition of the system CO2-NH3-H2O depends on the concentrations of CO2 (g) and the NH3 (aq), which together with the dissociation of VFA, determine the pH of the system [49].
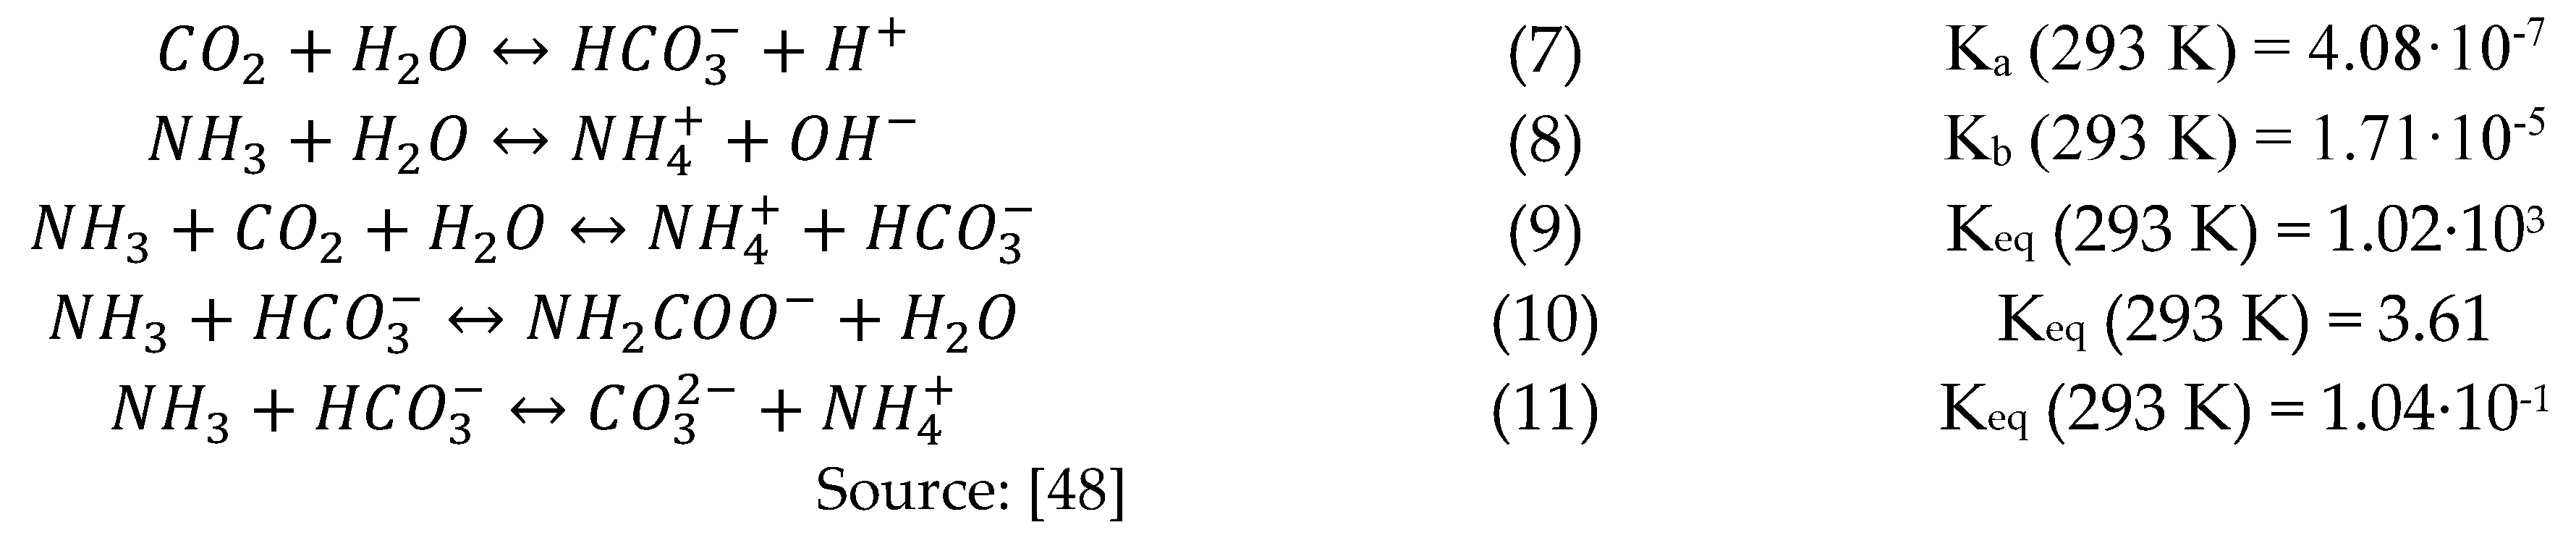
In terms of the rate of the reactions, the hydration of the CO2 (g) represents the bottleneck of the series (Equation 7 to Equation 11), as displayed in the Table 4.
According to Mani et al. [48], if the concentration of CO2 (aq) is equal or greater than that of NH3 (aq), the formation of ammonium bicarbonate prevails (Equation 9). However, under an excess of concentration of NH3, the formation of carbamate (Equation 10) and, to a lesser extent, the formation of ammonium carbonate (Equation 11) take place. According to Budzianowski [53], the solid formation (in a scrubber) can be neglected if the concentration of NH3 does not exceed 5 – 10 wt.%, which corresponds with 50 – 100 mg NH3/L H2O. The concentration of ammonia used in the study of Mani et al. [48] to avoid the formation of solid precipitates (2.5 mol NH3 (aq)/L, 4.3 wt.%, or 42.5 mg NH3 (aq)/L) is in agreement with the threshold value given by Budzianowski [53].
If the NH3 (aq) is not completely consumed by the neutralization reaction with the CO2 (aq), it is more correct to express the equilibria between the NH3 (aq) and the CO2 (g) as Equation 12 and Equation 13. With regard to Equation 11 and Equation 13, it is important to highlight that the UNIQUAC model in Aspen Plus® predicts the subsequent formation of (NH4)2CO3, according to Equation 14 and Equation 15 [55]. Looking at the thermodynamic data available for both reactions at ambient pressure, the formation of ammonium carbamate is more abundant than the ammonium carbonate [48,56]. From the point of view of the kinetics, the formation of carbamate is quicker (kCO2 = kNH3 = 3.37 M-1·s-1; Table 4) because it avoids the hydration of the CO2 (g) (3.25·10-2 s-1; Table 4). Therefore, the formation of ammonium carbamate is more likely with dry ice (i.e. solid carbon dioxide) [57] and it is converted to ammonium carbonate once is freely in an aqueous solution [56]. The combination of ammonia and carbon dioxide under high pressure (110 atm) and temperature (200 ºC) leads to the production of urea [56,58].

Source: [55]
Considering the solubility of the ammonium salts (Table 5), heterogeneous equilibria could be considered for the system NH3-CO2-H2O and homogeneous equilibria could be avoided by pumping CO2 (g) into the system, according to Equation 16 and Equation 17 [48], given the lower solubility of the ammonium bicarbonate (Table 5). In fact, the manufacturing of NH4HCO3 as fertilizer has been proposed following a similar procedure by means of distillation of the liquid fraction of the anaerobic digestate [20].

Table 5.
Solubility of the ammonium salts in the heterogeneous system NH3-CO2-H2O.
| Ammonium salt | Solubility in water/(g/L) | Reference |
|---|---|---|
| NH4HCO3 | 220 | [48] |
| 200 | [53] | |
| (NH4)2CO3 | 320 | [48] |
| 300 | [53] | |
| NH2COONH4 | 790 | [48] |
| 600 | [53] |
Source: [48]
It is important to highlight that carbamate, ammonium carbamate, and ammonium bicarbonate appear in the original code of the PSM (Table S4, Table S5, and Table S6) and only the ammonium carbonate is missed [49]. In the study of Mani et al. [48], the relative abundances of carbamate, bicarbonate, and carbonate were 43.3%, 22.5%, and 34.2%, respectively, at the end of the first hour of CO2 (g) absorption in the NH3 (aq) solution and a reasonable relative proportion of all these chemical species were found after 8 hours of continuous operation (Table 6). However, there was a consistent decrease of carbamate and carbonate in favor of the formation of bicarbonate. It would be expected an increase in the relative amount of bicarbonate if the absorption study continued for longer than 8 hours. As described in Table 6, the profile of these chemical species in the liquid fraction of anaerobic digestate, which can be understood as an aqueous solution with all the species in equilibrium, can be found in the work of Drapanauskaite et al. [20].
When evaluating the synthesis of NH3HCO3 it is necessary to propose an experimental design that minimizes the uncertainty in the collection of the empirical data, for example, using the response surface methodology [59]. This experimental design can be coupled with contemporary machine learning methods, such as the Gaussian process regression, to construct a robust model [60].
5. Conclusions
First of all, the titration of the MD with the HCl showed that a dose of 3.18 mEq/g would be required to attain the pHzpc upon addition of the SSA to the MD following a ratio of 0.6 ± 0.2 %. These doses of HCl and SSA that were applied to the MD to reach the pHzpc in the simulation were significantly different from those found in the experiments employing several acidification agents, ashes and digestates of different nature. Only the use of a very high dose of lactic acid (68.31 ± 36.00 mEq/g digestate) prevented the blend of acidified digestate and wood ash to reach the pHzpc.
Secondly, with regard to the concentration of nutrients in the WS fraction of the MD, only an outlier value was found in the profile of potassium that showed the relative fragility of the Aspen Plus® model and the need to revise it and make it more robust to be able to operate over a wider range of conditions.
Thirdly, the profiles of NH3, CO2, and CH4 found in the biogas agree with the processes described for the simultaneous upgrading and production of NH4HCO3. In this way the acidification to attain the isoelectric point of the anaerobic digestate (pH < 4) promoted the release of CO2 and minimized the volatilization of NH3. Once the SSA was added to stabilize the MD at the pHzpc (11.61 ± 2.09), the opposite trend occurred, thus the volatilization of NH3 increased and the sequestration of CO2 in the blend took place. As the concentration of CO2 in the blend is much greater than that of NH3, the increase of the volatilization of the later compound and the mitigation of the former one led to an upgrading of the biogas to ~80 vol.% CH4.
For future work, it is proposed further development of the model of the biomass ash-based treatment of the anaerobic digestate by optimizing the downstream manufacturing of NH4HCO3 and upgrading of the biogas. It is required to confirm experimentally the exhaustive review of the underlying chemistry of the liquid-gas system with NH3, CO2, H2O, and CH4. This will be followed by the implementation of refined kinetics and equilibria, both physical and chemical, in the Aspen Plus® PSM.
Supplementary Materials
Spreadsheets for the 7 scenarios investigated. A word file summarizing the most relevant data: Table S1, Mass balance of the nutrients monitored in the Aspen Plus® simulations. (1/3); Table S2, Mass balance of the nutrients monitored in the Aspen Plus® simulations. (2/3); Table S3, Mass balance of the nutrients monitored in the Aspen Plus® simulations. (3/3); Table S4, List of the components in the PSM of Rajendran et al. [11]. (1/3); Table S5, List of the components in the PSM of Rajendran et al. [11]. (2/3); Table S6, List of the components in the PSM of Rajendran et al. [11]. (3/3).
Author Contributions
Conceptualization, A.M.A. and F.A.; methodology, A.M.A., A.A. and F.A.; software, A.M.A., A.A. and F.A.; validation, A.M.A. and F.A.; formal analysis, A.M.A., A.A. and F.A.; investigation, A.M.A., A.A., KTS, and F.A.; resources, KTS and F.A.; data curation, A.M.A.; writing—original draft preparation, A.M.A. and A.A.; writing—review and editing, A.M.A. and F.A.; visualization, A.M.A.; supervision, KTS and F.A.; project administration, KTS and F.A.; funding acquisition, A.M.A., KTS and F.A.. All authors have read and agreed to the published version of the manuscript.
Funding
This research was funded by the Engineering and Physical Sciences Research Council of the United Kingdom (EPSRC), grant number EP/N509504/1 and the Natural Environment Research Council of the United Kingdom (NERC) grant number NE/L014122/1.
Data Availability Statement
Research data is publicly available as spreadsheet files in the supplementary material of this article. Restrictions apply to the availability of the data regarding the production facilities where the bioenergy residues (i.e., anaerobic digestate and wood ash) were sampled. Data of the stakeholders of this project is available upon request to the authors with the permission of third parties.
Acknowledgments
The authors would like to acknowledge the funding provided by the doctoral training network of the Engineering and Physical Sciences Research Council, United Kingdom (EPSRC, EP/N509504/1) and the Natural Environment Research Council, United Kingdom (NERC, NE/L014122/1) of the United Kingdom.
Conflicts of Interest
The authors declare no conflict of interest. The funders had no role in the design of the study; in the collection, analyses, or interpretation of data; in the writing of the manuscript; or in the decision to publish the results.
Abbreviations
AD, anaerobic digestion; BMP, biochemical methane potential; COD, chemical oxygen demand; FWD, food waste digestate; Keq, equilibrium constant; MD, manure digestate; mol.%, molar percentage; NH4+-N, ammoniacal nitrogen; pHzpc, pH of zero-point charge; PSM, process simulation model; PVWD, post-harvest vegetable waste digestate; RBP, residual biogas potential; SSA, sewage sludge ash; VFA, volatile fatty acids; vol.%, volume percentage; VS, volatiles solids; WI, water-insoluble; WS, water-soluble; WBA, wood bottom ash; WFA, wood fly ash; α, conversion coefficient of COD to volume of biogas; wt.%, weight percentage.
Appendix A
Table A1.
Parameters from the Aspen Plus® Components Databanks for determination of the equilibrium constants of selected chemical species in the aqueous fraction.
Table A1.
Parameters from the Aspen Plus® Components Databanks for determination of the equilibrium constants of selected chemical species in the aqueous fraction.
| Compound | Formula | Reaction | Parameters for Equation 6 |
|---|---|---|---|
| Ammonia | NH3 | Hydrolysis | A = -1.25656; B = -3335.7; C = 1.4971; D = -0.037057 |
| Bicarbonate | HCO3- | Dissociation | A = 216.05; B = -1243.17; C = -35.4819 |
| Carbon dioxide | CO2 | Hydrolysis | A = 231.465; B = 12092.1; C = -36.7816 |
| Hydrogen sulfide | H2S | Dissociation (1st proton) | A = -41.05; B = 6640.05; C = 15.106 |
| Carbonic acid | CO2 | Dissociation (1st proton) | A = -8.3 |
| Water | H2O | Hydrolysis | A = 132.899; B = -13445.9; C = -22.4773 |
Table A2.
Parameters from literature for determination of the equilibrium constants of selected amino acids in the aqueous fraction.
Table A2.
Parameters from literature for determination of the equilibrium constants of selected amino acids in the aqueous fraction.
| Compound | Formula | Reaction | Equation 6 | Reference |
|---|---|---|---|---|
| Arginine | C6H11N4O2 | Dissociation | A = -30.36 (Guanidinium), -20.91 (Amine), -5.01 (Carboxyl) | [61] |
| Aspartic acid | C4H7NO4 | Dissociation | A = -22.70 (Amine), -8.98 (Carboxyl), -4.42 (Carboxyl) | [62] |
| Glutamic acid | C5H9NO4 | Dissociation | A = -22.40 (Amine), -9.37 (Carboxyl), -4.84 (Carboxyl) | [63] |
| Isoleucine | C6H13NO2 | Dissociation | A = -22.29 (Amine) | [63] |
| Lysine | C6H14N2O | Dissociation | A = -24.22, -5.01 | [61] |
| Methionine | C5H11NO2S | Dissociation | A = -21.18, -5.24 | [64] |
| Phenylalanine | C9H11NO2 | Dissociation | A = -21.00, -4.21 | [61] |
| Proline | C5H9NO2 | Dissociation | A = -22.41 | [61] |
| Serine | C3H7NO3 | Dissociation | A = -5.68 | [63] |
| Threonine | C4H9NO3 | Dissociation | A = -23.99, -6.05 | [61] |
| Tryptophan | C11H11N2O2 | Dissociation | A = -21.60, -5.47 | [61] |
| Tyrosine | C9H11NO3 | Dissociation | A = -23.16, -20.95, -5.06 | [65,66] |
| Valine | C5H11NO2 | Dissociation | A = -5.29 | [63] |
References
- Czekała, W.; Jasiński, T.; Grzelak, M.; Witaszek, K.; Dach, J. Biogas Plant Operation: Digestate as the Valuable Product. Energies 2022, 15, 8275–8275. [Google Scholar] [CrossRef]
- García-Ochoa, F.; Santos, V.E.; Naval, L.; Guardiola, E.; López, B. Kinetic model for anaerobic digestion of livestock manure. Enzyme and Microbial Technology 1999, 25, 55–60. [Google Scholar] [CrossRef]
- Linke, B. Kinetic study of thermophilic anaerobic digestion of solid wastes from potato processing. Biomass and Bioenergy 2006, 30, 892–896. [Google Scholar] [CrossRef]
- Vavilin, V.A.; Fernandez, B.; Palatsi, J.; Flotats, X. Hydrolysis kinetics in anaerobic degradation of particulate organic material: An overview. Waste Management 2008, 28, 939–951. [Google Scholar] [CrossRef] [PubMed]
- Da Silva, C.; Peces, M.; Faundez, M.; Hansen, H.; Campos, J.L.; Dosta, J.; Astals, S. Gamma distribution function to understand anaerobic digestion kinetics: Kinetic constants are not constant. Chemosphere 2022, 306, 10. [Google Scholar] [CrossRef] [PubMed]
- Angelidaki, I.; Alves, M.; Bolzonella, D.; Borzacconi, L.; Campos, J.L.; Guwy, A.J.; Kalyuzhnyi, S.; Jenicek, P.; Van Lier, J.B. Defining the biomethane potential (BMP) of solid organic wastes and energy crops: A proposed protocol for batch assays. Water Science and Technology 2009, 59, 927–934. [Google Scholar] [CrossRef]
- WRAP. BSI PAS 110:2014 Specification for whole digestate, separated liquor and separated fibre derived from the anaerobic digestion of source-segregated biodegradable materials. Available online: https://wrap.org.uk/resources/guide/bsi-pas-110-producing-quality-anaerobic-digestate (accessed on 07-01-2022).
- Walker, M.; Banks, C.; Heaven, S.; Frederickson, J. Residual biogas potential test for digestates; WRAP: 2010. Available online at: https://www.ktbl.de/fileadmin/user_upload/Allgemeines/Download/Ringversuch-Biogas/Residual-Biogas-Potential.pdf (accessed 17-02-2023).
- Banks, C.J.; Haeven, S.; Zhang, Y.; Sapp, M. Review of the application of the Residual Biogas Potential test. Available online: http://www.organics-recycling.org.uk/uploads/article2652/PAS110%20digestate%20stability%20review.pdf (accessed on 14-12-2021).
- Da Silva, C.; Astals, S.; Peces, M.; Campos, J.L.; Guerrero, L. Biochemical methane potential (BMP) tests: Reducing test time by early parameter estimation. Waste Management 2017, 71, 19–24. [Google Scholar] [CrossRef]
- Rajendran, K.; Kankanala, H.R.; Lundin, M.; Taherzadeh, M.J. A novel process simulation model (PSM) for anaerobic digestion using Aspen Plus. Bioresource Technology 2014, 168, 7–13. [Google Scholar] [CrossRef]
- Tabatabaei, M.; Aghbashlo, M.; Valijanian, E.; Panahi, H.K.S.; Nizami, A.S.; Ghanavati, H.; Sulaiman, A.; Mirmohamadsadeghi, S.; Karimi, K. A comprehensive review on recent biological innovations to improve biogas production, Part 2: Mainstream and downstream strategies. Renewable Energy 2020, 146, 1392–1407. [Google Scholar] [CrossRef]
- Tabatabaei, M.; Aghbashlo, M.; Valijanian, E.; Panahi, H.K.S.; Nizami, A.S.; Ghanavati, H.; Sulaiman, A.; Mirmohamadsadeghi, S.; Karimi, K. A comprehensive review on recent biological innovations to improve biogas production, Part 1: Upstream strategies. Renewable Energy 2020, 146, 1204–1220. [Google Scholar] [CrossRef]
- Moure Abelenda, A.; Aiouache, F. Wood Ash Based Treatment of Anaerobic Digestate: State-of-the-Art and Possibilities. Processes 2022, 10. [Google Scholar] [CrossRef]
- Limoli, A.; Langone, M.; Andreottola, G. Ammonia removal from raw manure digestate by means of a turbulent mixing stripping process. Journal of Environmental Management 2016, 176, 1–10. [Google Scholar] [CrossRef]
- Moure Abelenda, A.; Amaechi, C.V. Manufacturing of a Granular Fertilizer Based on Organic Slurry and Hardening Agent. Inventions 2022, 7, 26. [Google Scholar] [CrossRef]
- Batstone, D.J.; Keller, J.; Angelidaki, I.; Kalyuzhnyi, S.V.; Pavlostathis, S.G.; Rozzi, A.; Sanders, W.T.; Siegrist, H.; Vavilin, V.A. The IWA Anaerobic Digestion Model No 1 (ADM1). Water science and technology : a journal of the International Association on Water Pollution Research 2002, 45, 65–73. [Google Scholar] [CrossRef] [PubMed]
- Wang, D.L.; Xin, Y.; Shi, H.; Ai, P.; Yu, L.; Li, X.Q.; Chen, S.L. Closing ammonia loop in efficient biogas production: Recycling ammonia pretreatment of wheat straw. Biosyst. Eng. 2019, 180, 182–190. [Google Scholar] [CrossRef]
- Burke, D.A. Removal of ammonia from fermentation effluent and sequestration as ammonium bicarbonate and/or carbonate. 2010. Available online: https://patents.google.com/patent/US7811455B2/en (accessed on 17-02-2023).
- Drapanauskaite, D.; Handler, R.M.; Fox, N.; Baltrusaitis, J. Transformation of Liquid Digestate from the Solid-Separated Biogas Digestion Reactor Effluent into a Solid NH4HCO3 Fertilizer: Sustainable Process Engineering and Life Cycle Assessment. ACS Sustainable Chemistry and Engineering 2021, 9, 580–588. [Google Scholar] [CrossRef]
- Centorcelli, J.C.; Drapanauskaite, D.; Handler, R.M.; Baltrusaitis, J. Solar Steam Generation Integration into the Ammonium Bicarbonate Recovery from Liquid Biomass Digestate: Process Modeling and Life Cycle Assessment. ACS Sustain. Chem. Eng. 2021, 9, 15278–15286. [Google Scholar] [CrossRef]
- Jennings, A.A.; Kirkner, D.J. Instantaneous Equilbrium Approximation Analysis. Journal of Hydraulic Engineering 1984, 110, 1700–1717, Available online: https://ascelibrary.org/doi/10.1061/%28ASCE%290733-9429%281984%29110%3A12%281700%29?msclkid=6a921569a22211eca0002a5e3cfb7b17 (accessed 09-10-2022).. [Google Scholar] [CrossRef]
- Joback, K.G.; Reid, R.C. Estimation of Pure-Component Pproperties from Goup-Contributions. Chem. Eng. Commun. 1987, 57, 233–243. [Google Scholar] [CrossRef]
- Watson, K.M. Thermodynamics of the Liquid State. Industrial & Engineering Chemistry 1943, 35, 398–406. [Google Scholar] [CrossRef]
- Franz, M. Phosphate fertilizer from sewage sludge ash (SSA). Waste Management 2008, 28, 1809–1818. [Google Scholar] [CrossRef]
- Xu, Y.; Liu, R.; Liu, H.; Geng, H.; Dai, X. Novel anaerobic digestion of waste activated sludge via isoelectric-point pretreatment: Ultra-short solids retention time and high methane yield. Water Research 2022, 220, 118657. [Google Scholar] [CrossRef]
- Xu, Y.; Geng, H.; Chen, R.; Liu, R.; Dai, X. Enhancing methanogenic fermentation of waste activated sludge via isoelectric-point pretreatment: Insights from interfacial thermodynamics, electron transfer and microbial community. Water Research 2021, 197, 117072. [Google Scholar] [CrossRef]
- Moure Abelenda, A.; Semple, K.T.; Lag-Brotons, A.J.; Herbert, B.M.J.; Aggidis, G.; Aiouache, F. Strategies for the production of a stable blended fertilizer of anaerobic digestates and wood ashes. Nature-Based Solutions 2022, 2, 100014. [Google Scholar] [CrossRef]
- Anderson, M. Encouraging prospects for recycling incinerated sewage sludge ash (ISSA) into clay-based building products. J. Chem. Technol. Biotechnol. 2002, 77, 352–360. [Google Scholar] [CrossRef]
- Forbes, M.S.; Raison, R.J.; Skjemstad, J.O. Formation, transformation and transport of black carbon (charcoal) in terrestrial and aquatic ecosystems. Science of the Total Environment 2006, 370, 190–206. [Google Scholar] [CrossRef]
- Budiyono, B.; Widiasa, I.; Johari, S.; Sunarso, S. Study on slaughterhouse wastes potency and characteristic for biogas production. Int J Waste Resour 2011, 1. [Google Scholar] [CrossRef]
- Zheng, Y.; Ke, L.; Xia, D.; Zheng, Y.; Wang, Y.; Li, H.; Li, Q. Enhancement of digestates dewaterability by CTAB combined with CFA pretreatment. Separation and Purification Technology 2016, 163, 282–289. [Google Scholar] [CrossRef]
- Moure Abelenda, A.; Semple, K.T.; Lag-Brotons, A.J.; Herbert, B.M.J.; Aggidis, G.; Aiouache, F. Impact of sulphuric, hydrochloric, nitric, and lactic acids in the preparation of a blend of agro-industrial digestate and wood ash to produce a novel fertiliser. Journal of Environmental Chemical Engineering 2021, 9, 105021. [Google Scholar] [CrossRef]
- Demeyer, A.; Voundi Nkana, J.C.; Verloo, M.G. Characteristics of wood ash and influence on soil properties and nutrient uptake: An overview. Bioresource Technology 2001, 77, 287–295. [Google Scholar] [CrossRef] [PubMed]
- Moure Abelenda, A. Chemical stabilisation of anaerobic digestate via wood ash-based treatment. PhD thesis. School of Engineering, Lancaster University, 2022. [CrossRef]
- Fangueiro, D.; Hjorth, M.; Gioelli, F. Acidification of animal slurry - A review. Journal of environmental management 2015, 149, 46–56. [Google Scholar] [CrossRef]
- Moure Abelenda, A.; Semple, K.T.; Herbert, B.M.J.; Aggidis, G.; Aiouache, F. Valorization of agrowaste digestate via addition of wood ash, acidification, and nitrification. Environmental Technology & Innovation 2022, 28, 102632. [Google Scholar] [CrossRef]
- Ukwuani, A.T.; Tao, W. Developing a vacuum thermal stripping – acid absorption process for ammonia recovery from anaerobic digester effluent. Water Research 2016, 106, 108–115. [Google Scholar] [CrossRef]
- Döhler, H.; Niebaum, A.; Roth, U.; Amon, T.; Balsari, P.; Friedl, G. Greenhouse Gas Emissions and Mitigati-On Costs in Two European Biogas Plants. In Proceedings of the Gülzower Fachgespräche; 2009; p. 399, Available online: https://www.osti.gov/etdeweb/servlets/purl/21309863#page=400 (accessed 17-02-2023). [Google Scholar]
- Gioelli, F.; Dinuccio, E.; Balsari, P. Residual biogas potential from the storage tanks of non-separated digestate and digested liquid fraction. Bioresource Technology 2011, 102, 10248–10251. [Google Scholar] [CrossRef] [PubMed]
- Madani-Hosseini, M.; Mulligan, C.N.; Barrington, S. Acidification of In-Storage-Psychrophilic-Anaerobic-Digestion (ISPAD) process to reduce ammonia volatilization: Model development and validation. Waste Management 2015, 52, 104–111. [Google Scholar] [CrossRef]
- Nohra, J.A.; Barrington, S.; Frigon, J.C.; Guiot, S.R. In storage psychrophilic anaerobic digestion of swine slurry. Resources, Conservation and Recycling 2003, 38, 23–37. [Google Scholar] [CrossRef]
- Hansen, T.L.; Sommer, S.G.; Gabriel, S.; Christensen, T.H. Methane production during storage of anaerobically digested municipal organic waste. J. Environ. Qual. 2006, 35, 830–836. [Google Scholar] [CrossRef] [PubMed]
- Menardo, S.; Gioelli, F.; Balsari, P. The methane yield of digestate: Effect of organic loading rate, hydraulic retention time, and plant feeding. Bioresource Technology 2011, 102, 2348–2351. [Google Scholar] [CrossRef] [PubMed]
- Sambusiti, C.; Monlau, F.; Ficara, E.; Musatti, A.; Rollini, M.; Barakat, A.; Malpei, F. Comparison of various post-treatments for recovering methane from agricultural digestate. Fuel Processing Technology 2015, 137, 359–365. [Google Scholar] [CrossRef]
- Menardo, S.; Balsari, P.; Dinuccio, E.; Gioelli, F. Thermal pre-treatment of solid fraction from mechanically-separated raw and digested slurry to increase methane yield. Bioresource Technology 2011, 102, 2026–2032. [Google Scholar] [CrossRef] [PubMed]
- Žalys, B.; Venslauskas, K.; Navickas, K.; Buivydas, E.; Rubežius, M. The Influence of CO2 Injection into Manure as a Pretreatment Method for Increased Biogas Production. Sustainability 2023, 15, 3670–3670. [Google Scholar] [CrossRef]
- Mani, F.; Peruzzini, M.; Stoppioni, P. CO2 absorption by aqueous NH3 solutions: speciation of ammonium carbamate, bicarbonate and carbonate by a 13C NMR study. Green Chemistry 2006, 8, 995–1000. [Google Scholar] [CrossRef]
- Möller, K.; Müller, T. Effects of anaerobic digestion on digestate nutrient availability and crop growth: A review. Engineering in Life Sciences 2012, 12, 242–257. [Google Scholar] [CrossRef]
- Pocker, Y.; Bjorkquist, D.W. Stopped-flow studies of carbon dioxide hydration and bicarbonate dehydration in water and water-d2. Acid-base and metal ion catalysis. Journal of the American Chemical Society 1977, 99, 6537–6543. [Google Scholar] [CrossRef]
- Stumm, W.; Morgan, J.J. Aquatic chemistry: chemical equilibria and rates in natural waters; John Wiley & Sons: 2012, 148–205. [CrossRef]
- Aqion. Kinetics of the Carbonic Acid System. Available online: https://www.aqion.de/site/carbonic-acid-kinetics#fnref:2:1 (accessed on 17-02-2023).
- Budzianowski, W.M. Benefits of biogas upgrading to biomethane by high-pressure reactive solvent scrubbing. Biofuels Bioprod. Biorefining 2012, 6, 12–20. [Google Scholar] [CrossRef]
- Puxty, G.; Rowland, R.; Attalla, M. Comparison of the rate of CO2 absorption into aqueous ammonia and monoethanolamine. Chem. Eng. Sci. 2010, 65, 915–922. [Google Scholar] [CrossRef]
- Darde, V.; van Well, W.J.M.; Stenby, E.H.; Thomsen, K. Modeling of Carbon Dioxide Absorption by Aqueous Ammonia Solutions Using the Extended UNIQUAC Model. Ind. Eng. Chem. Res. 2010, 49, 12663–12674. [Google Scholar] [CrossRef]
- Kim, H.-W. The Potential of Hydrolyzed Urine as a Solvent for Biogas Upgrading. Graduate School of UNIST, 2019. Available online: https://scholarworks.unist.ac.kr/handle/201301/26039 (accessed 17-02-2023).
- Brooks, L.A.; Audrieta, L.F.; Bluestone, H.; Jofinsox, W.C. Ammonium Carbamate. In Inorganic Syntheses; Inorganic Syntheses; 1946; pp. 85–86. [CrossRef]
- Brouwer, M. Thermodynamics of the urea process. Urea Know How 2009. Available online: https://ureaknowhow.com/pdflib/391_2009%2006%20Brouwer%20UreaKnowHow.com%20Thermodynamics%20of%20the%20%20Urea%20Process.pdf (accessed 17-02-2023).
- Bora, B.J.; Dai Tran, T.; Prasad Shadangi, K.; Sharma, P.; Said, Z.; Kalita, P.; Buradi, A.; Nhanh Nguyen, V.; Niyas, H.; Tuan Pham, M.; et al. Improving combustion and emission characteristics of a biogas/biodiesel-powered dual-fuel diesel engine through trade-off analysis of operation parameters using response surface methodology. Sustainable Energy Technologies and Assessments 2022, 53, 102455–102455. [Google Scholar] [CrossRef]
- Alruqi, M.; Sharma, P. Biomethane Production from the Mixture of Sugarcane Vinasse, Solid Waste and Spent Tea Waste: A Bayesian Approach for Hyperparameter Optimization for Gaussian Process Regression. Fermentation 2023, 9, 120–120. [Google Scholar] [CrossRef]
- Royal Society of Chemistry. The MERCK Index Online. Available online: https://www.rsc.org/merck-index (accessed 17-02-2023).
- IUPAC. Ionisation Constants of Organic Acids in Aqueous Solution; Pergamon Press: Oxford, 1979; Available online: https://searchworks.stanford.edu/view/737801?msclkid=962a727aa1f211ecb6d82beb2299ec7d (accessed 17-02-2023). [Google Scholar]
- Kirk, P.L.; Schmidt, C.L.A. The dissociation constants of certain amino acids. Journal of Biological Chemistry 1929, 81, 237–248. [Google Scholar] [CrossRef]
- Drauz, K.; Grayson, I.; Kleemann, A.; Krimmer, H.P.; Leuchtenberger, W.; Weckbecker, C. Amino Acids. Ullmann's Encyclopedia of Industrial Chemistry, Wiley, 2007. [Google Scholar] [CrossRef]
- Ishimitsu, T.; Hirose, S.; Sakurai, H. Acid dissociation of tyrosine and its related compounds. Chemical and Pharmaceutical Bulletin 1976, 24, 3195–3198. [Google Scholar] [CrossRef] [PubMed]
- Joback, K.G.; Reid, R.C. Estimation of pure-component properties from group-contributions. Chem. Eng. Commun. 1987, 57, 233–243. [Google Scholar] [CrossRef]
Figure 1.
Process flow diagram including the calculation blocks: B1, mixer; B2, stoichiometric-equilibria reactor; B3, kinetic reactor; and B4, ionization reactor, where the dissociation equilibria and mass transfer constants of the chemical species contained in the biogas and the MD are implemented to monitor the stabilization with the ash-based treatment.
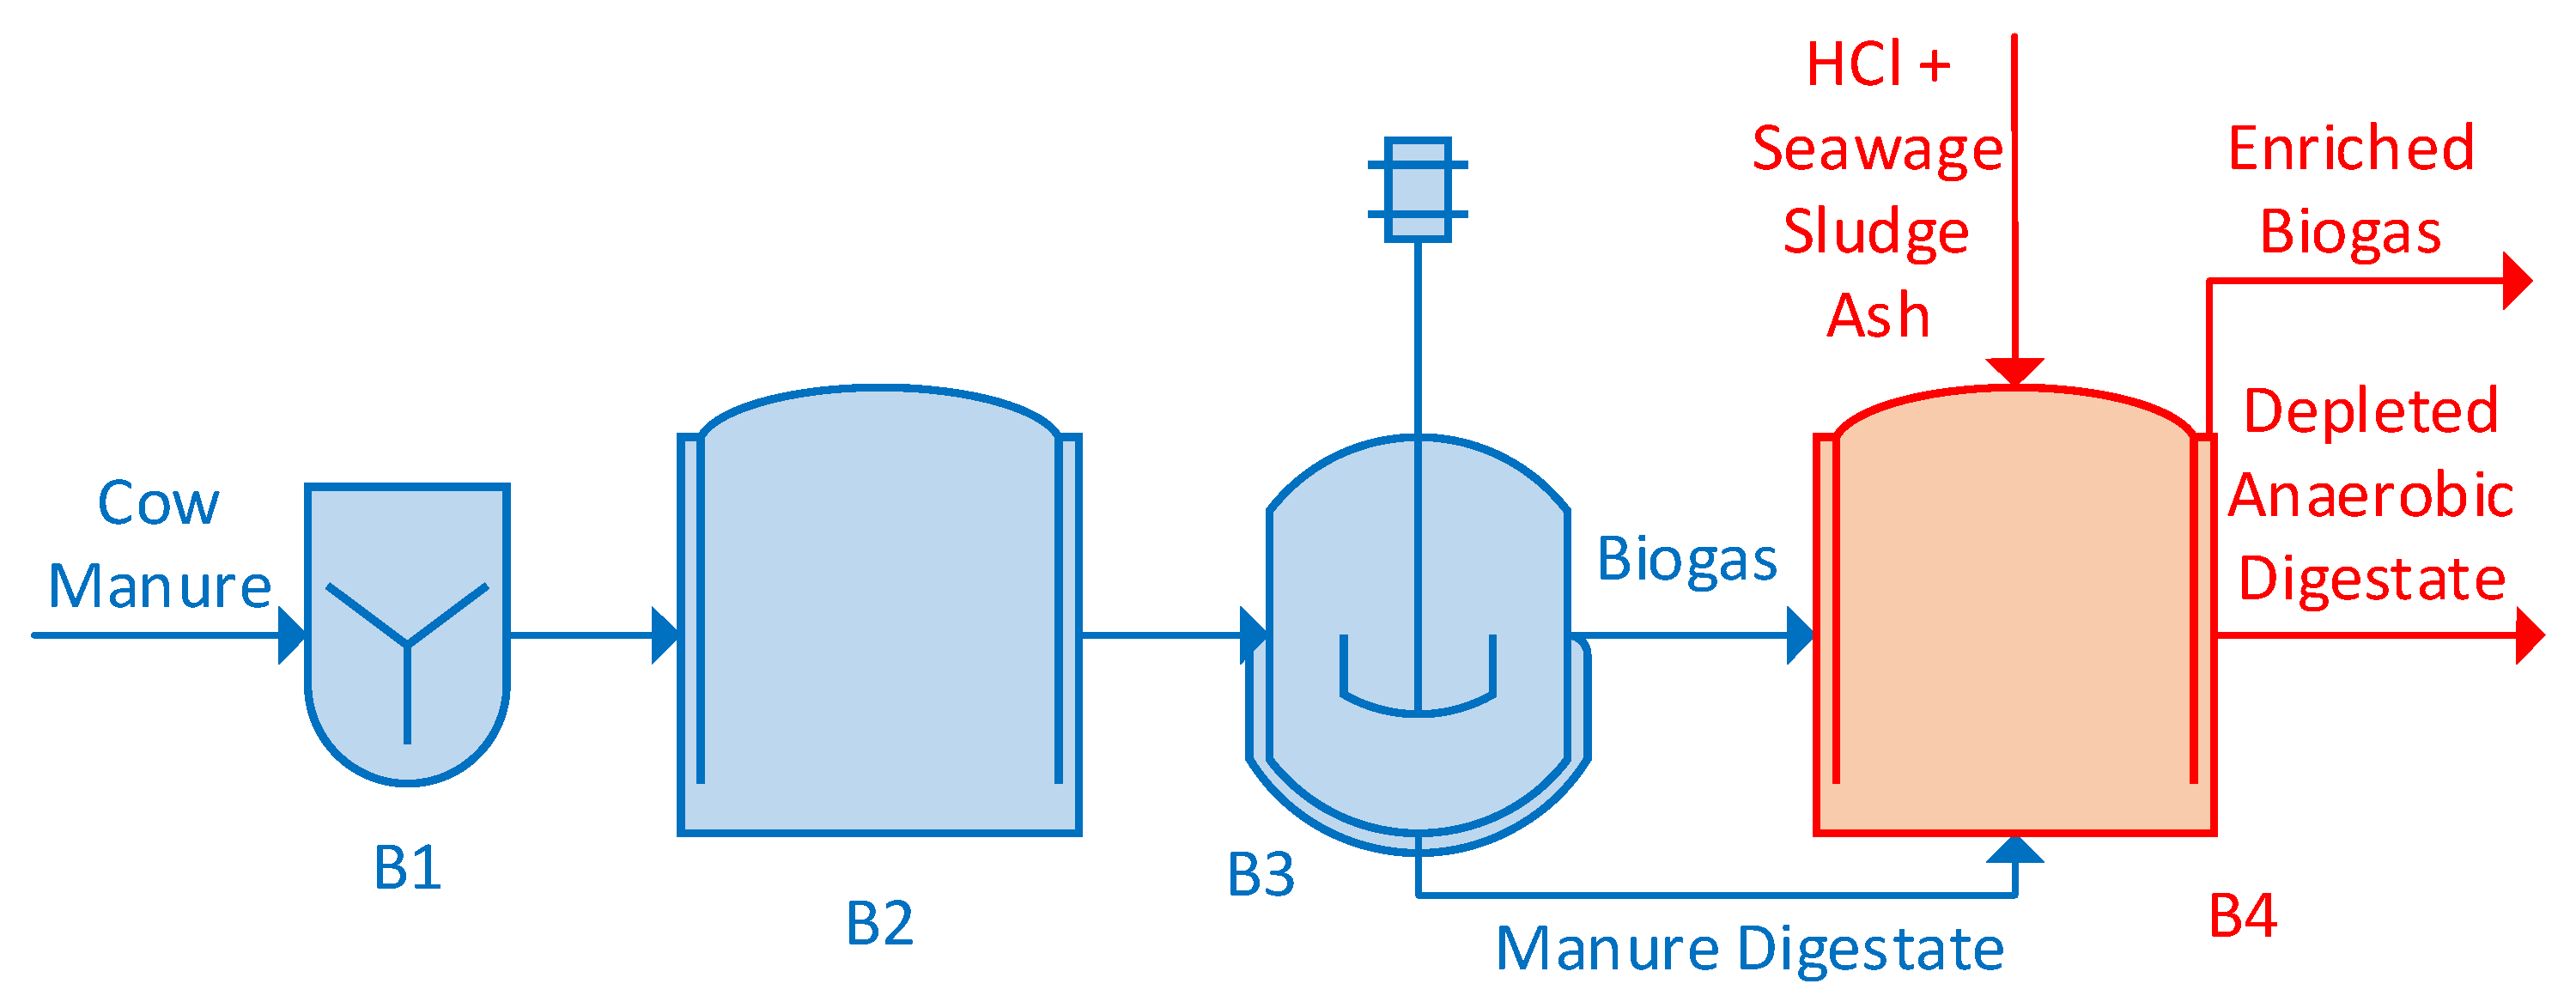
Figure 2.
Effect on the pH of altering the parameters in the process represented in Figure 1 following HCl doses of 2.70 mEq/g MD (1HCl:10MD), 3.18 mEq/g MD (1HCl:8.5MD), and 3.27 mEq/g MD (1HCl:8.25MD) and via addition of SSA to the MD according to the ratios with regard to the dry matter of the digestate of 1/15 (1SSA:1.76HCl:15MD), 1/10 (1SSA:1.18HCl:10MD), and 1/7.5 (1SSA:0.88HCl:7.5MD).
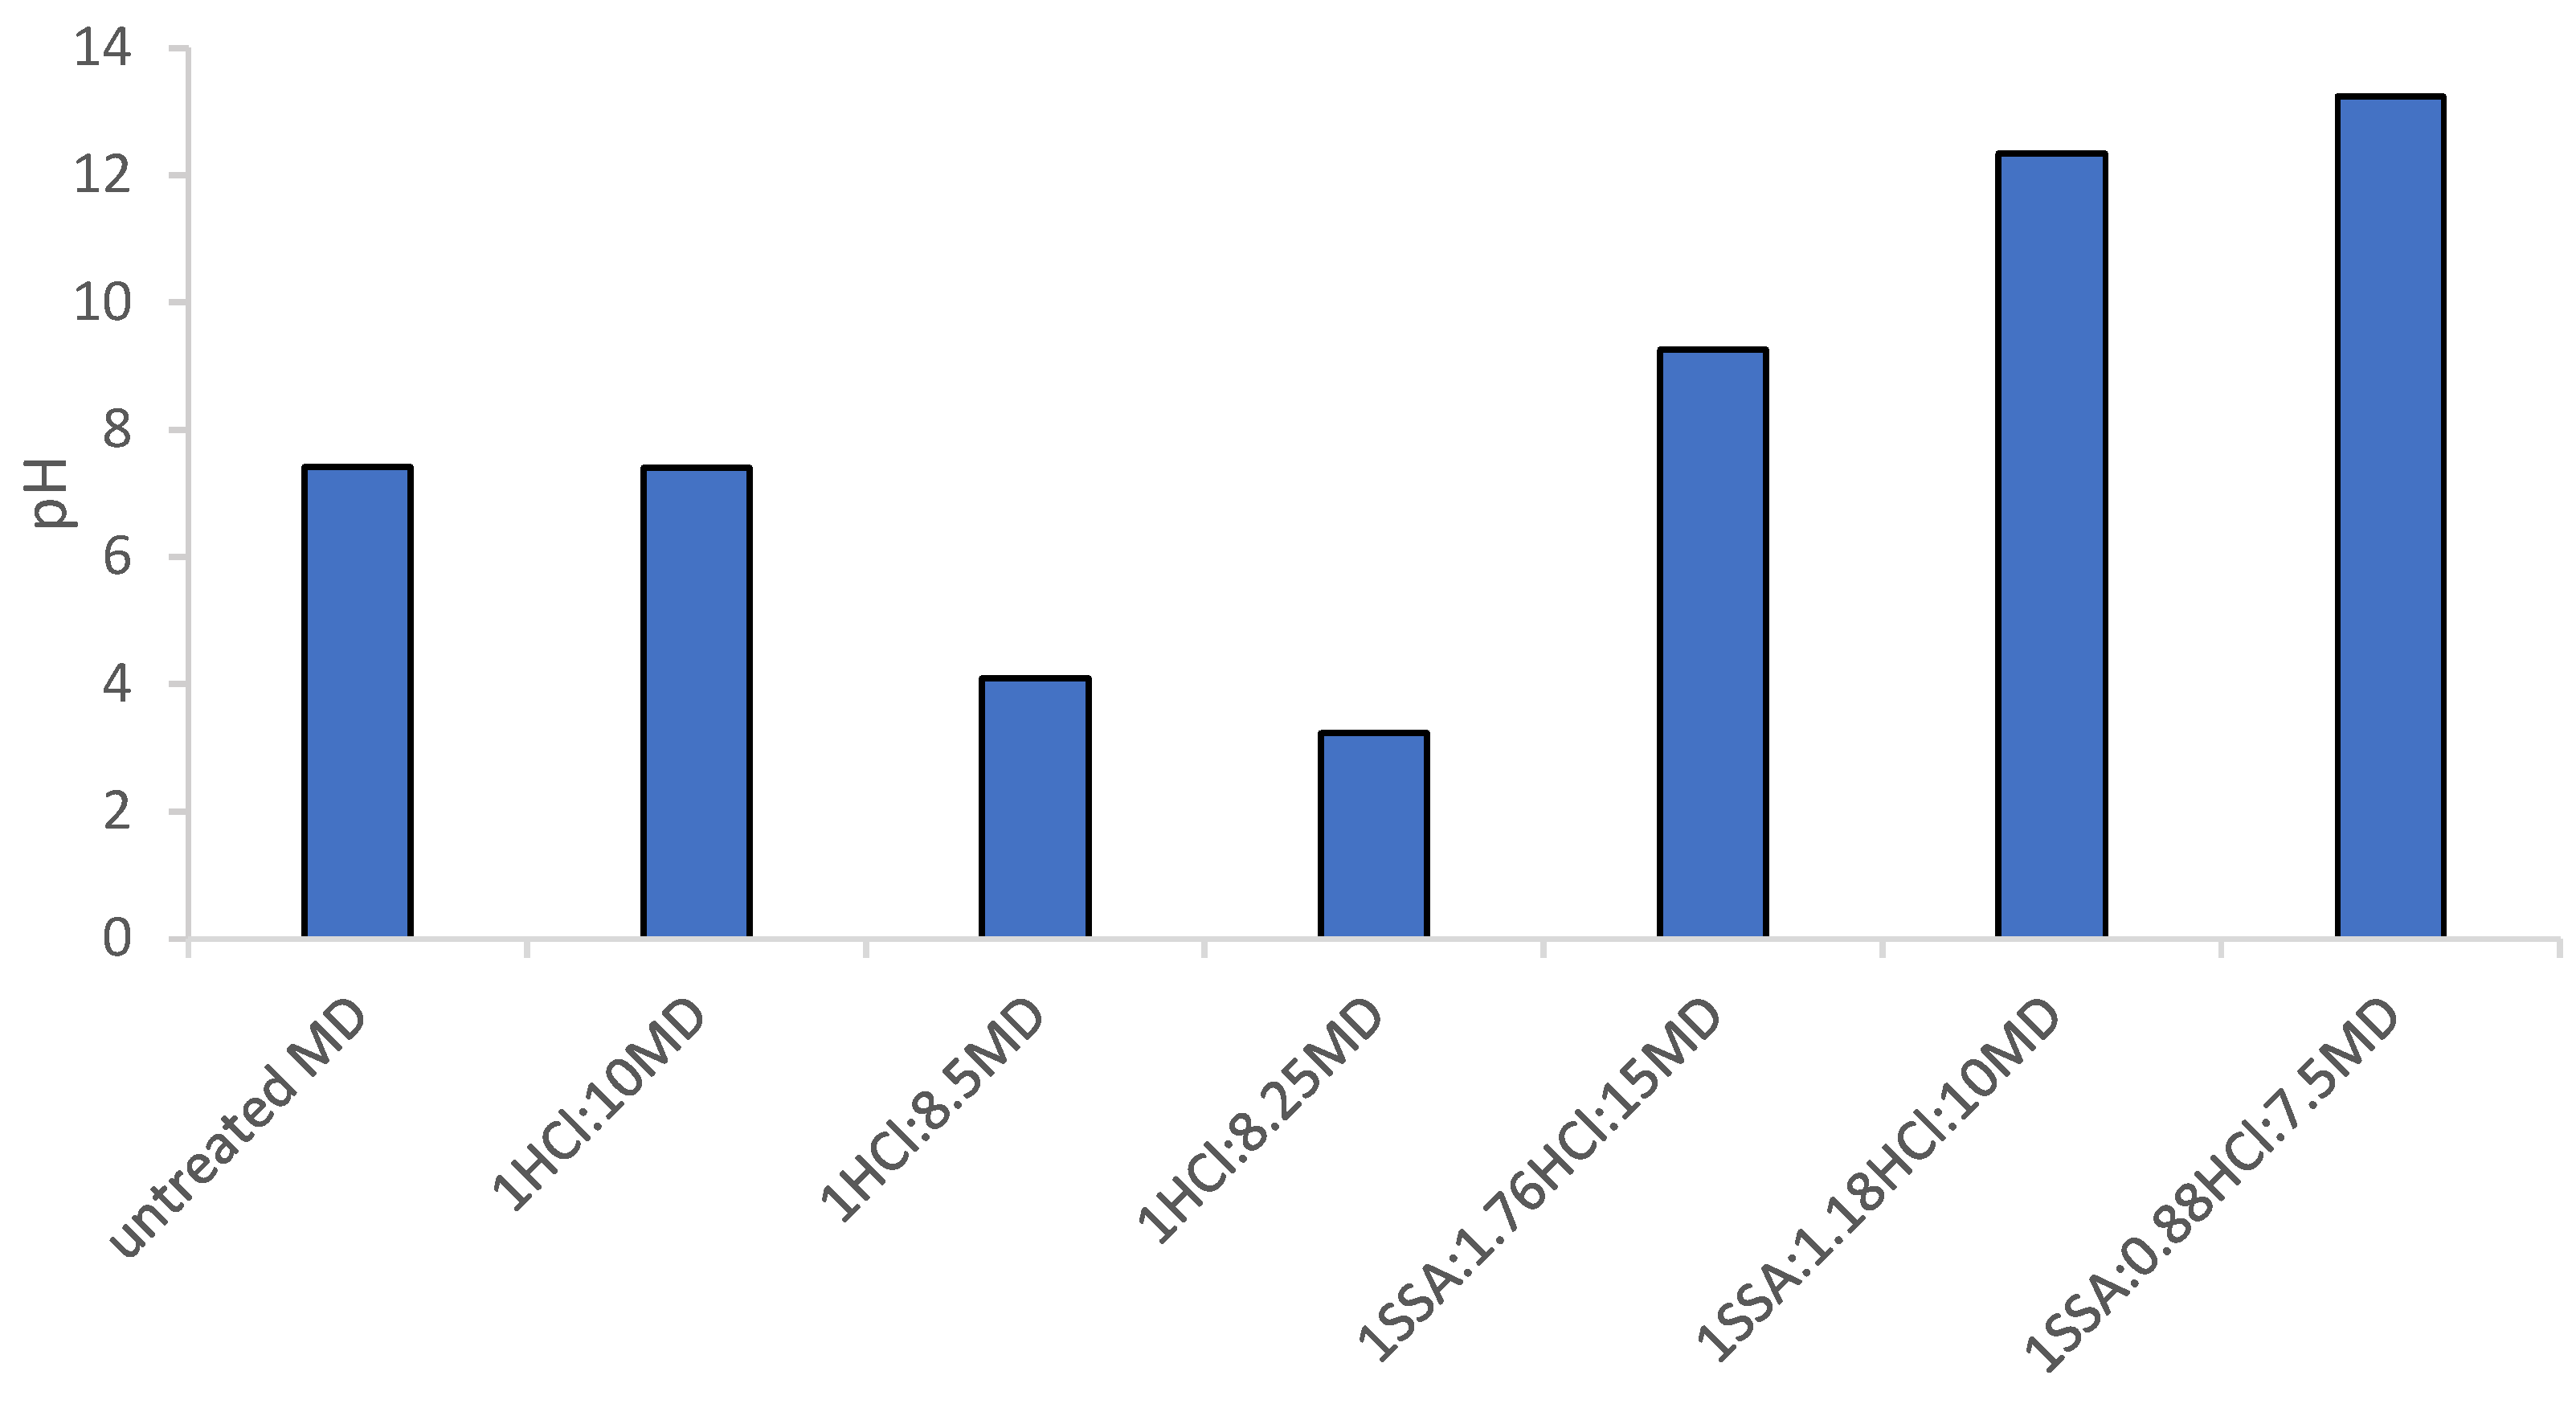
Figure 4.
Dependence of pH on the blending ratio determined in the Aspen Plus® simulation (SSA+MD; including cases 5, 6, and 7) and the experimental work previously reported [28,33].
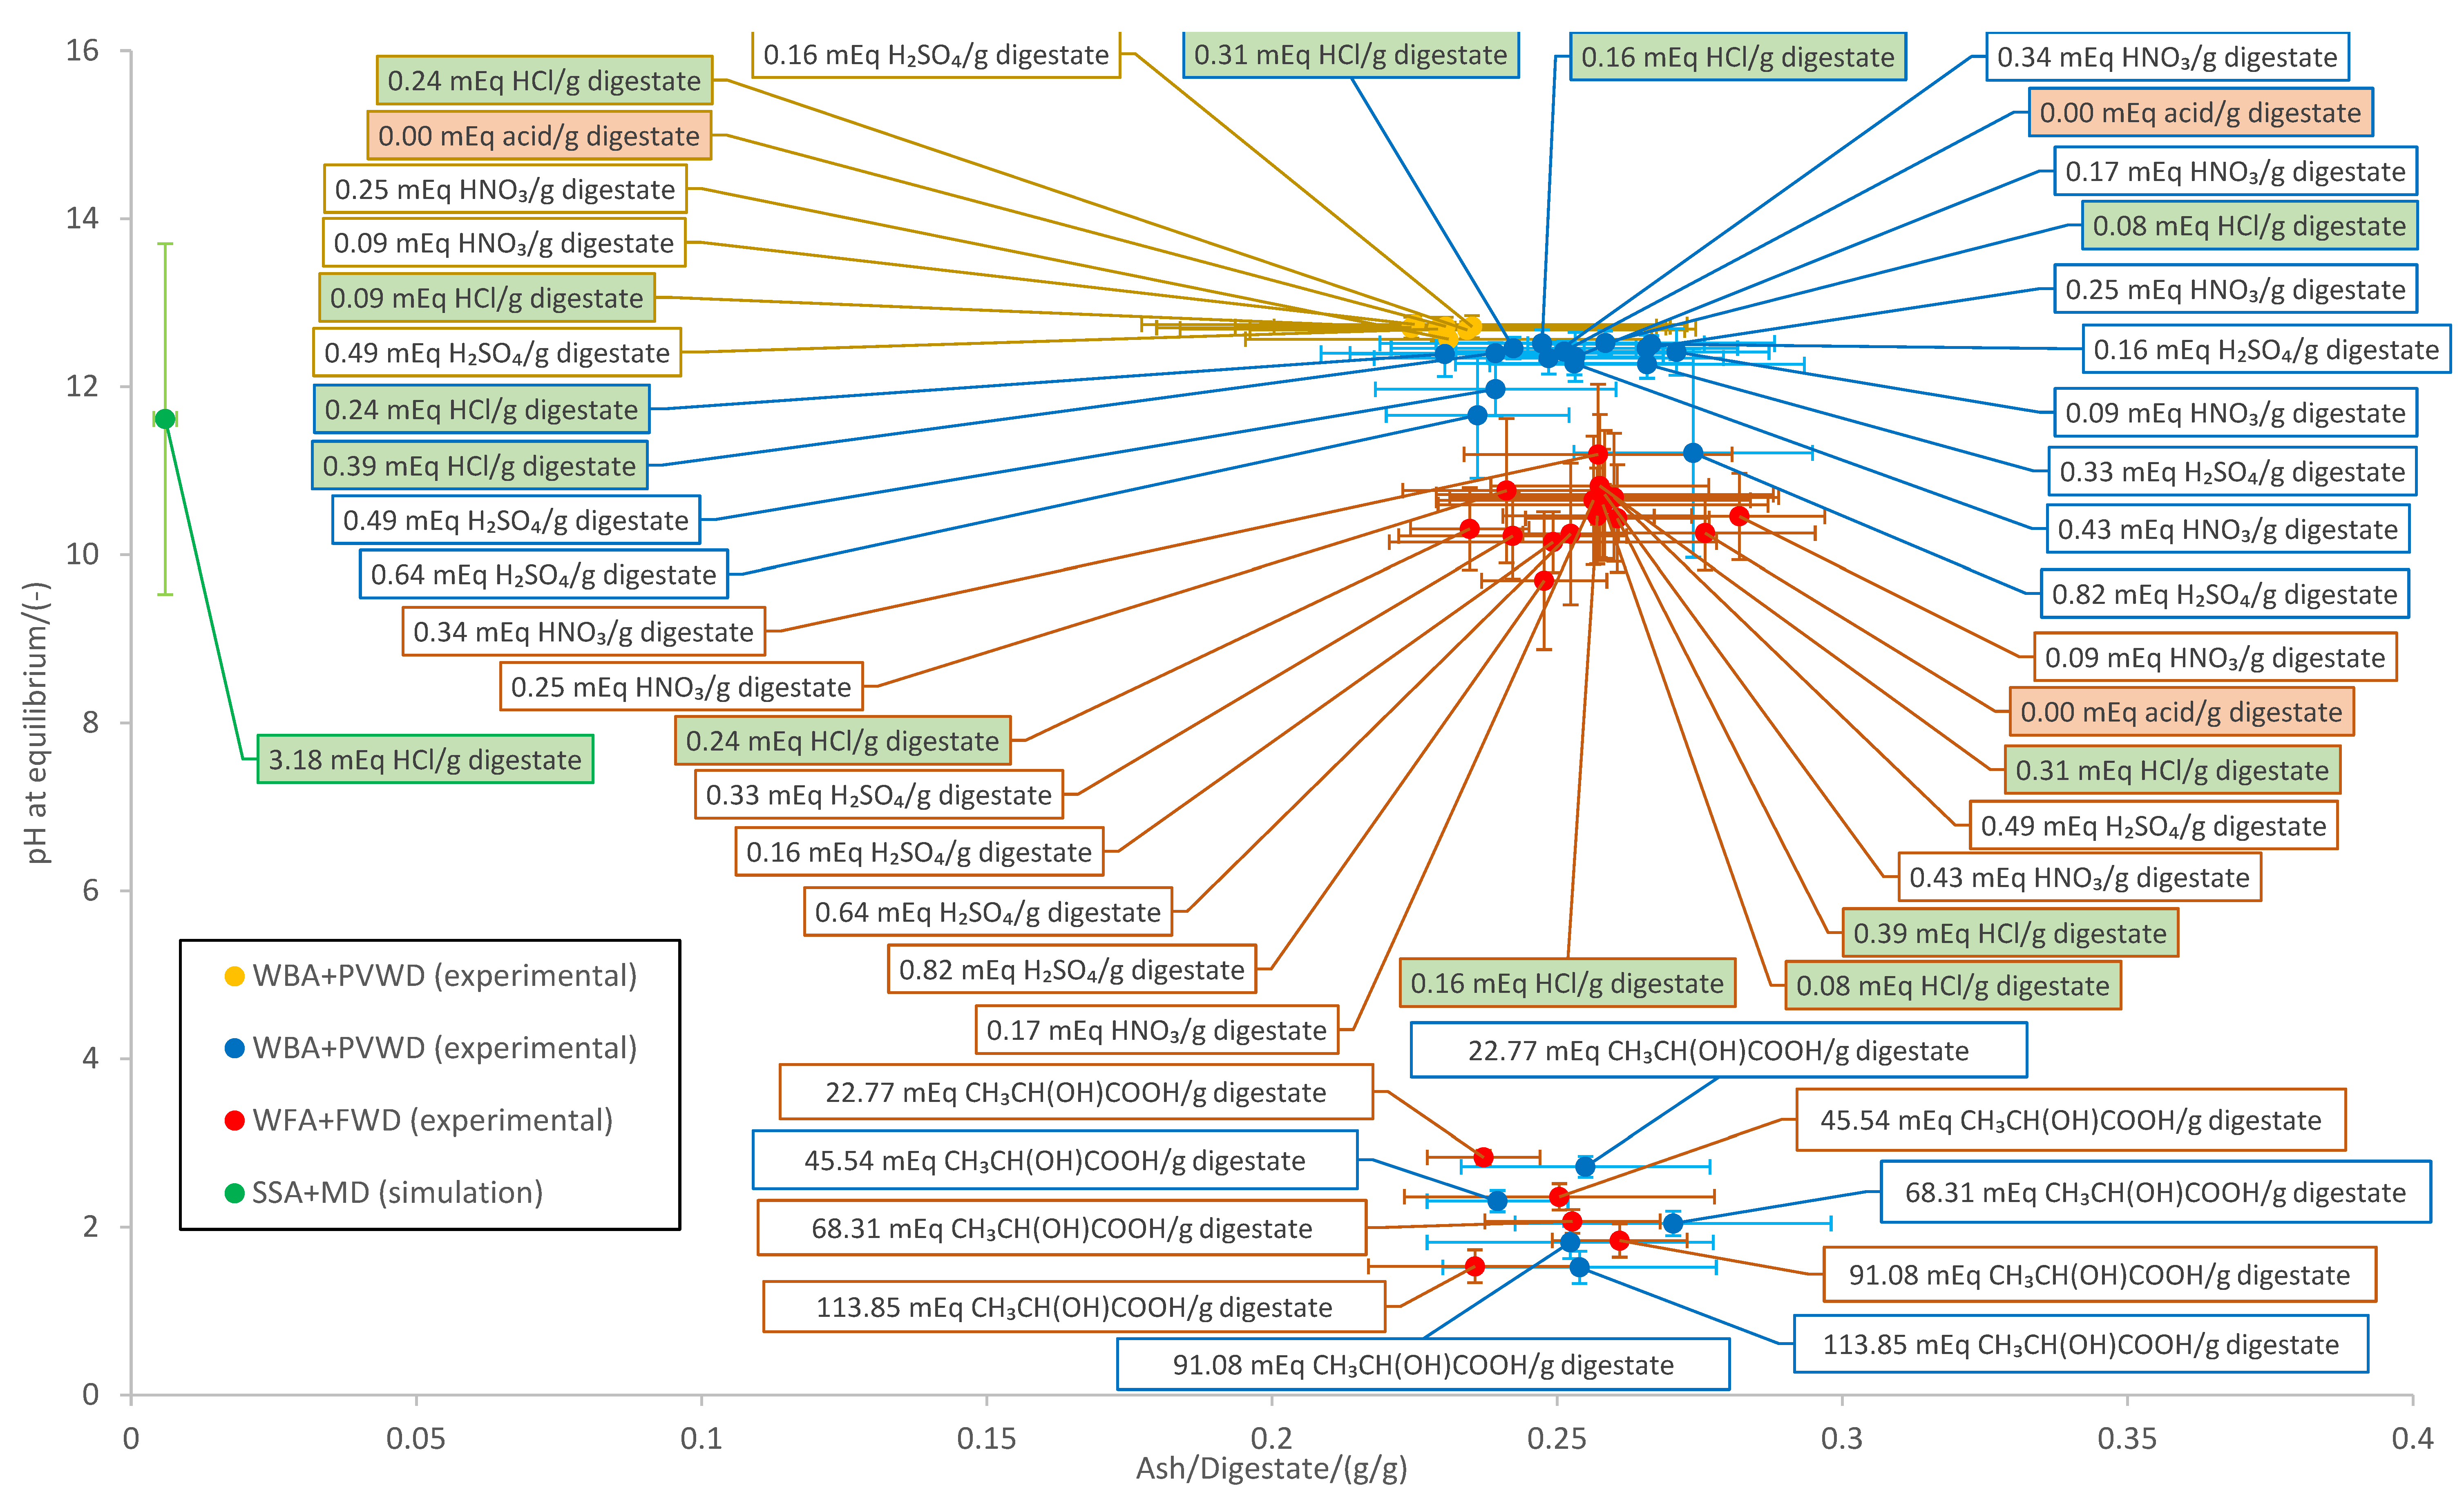
Figure 8.
Ammonia content in the biogas for the 7 cases evaluated.
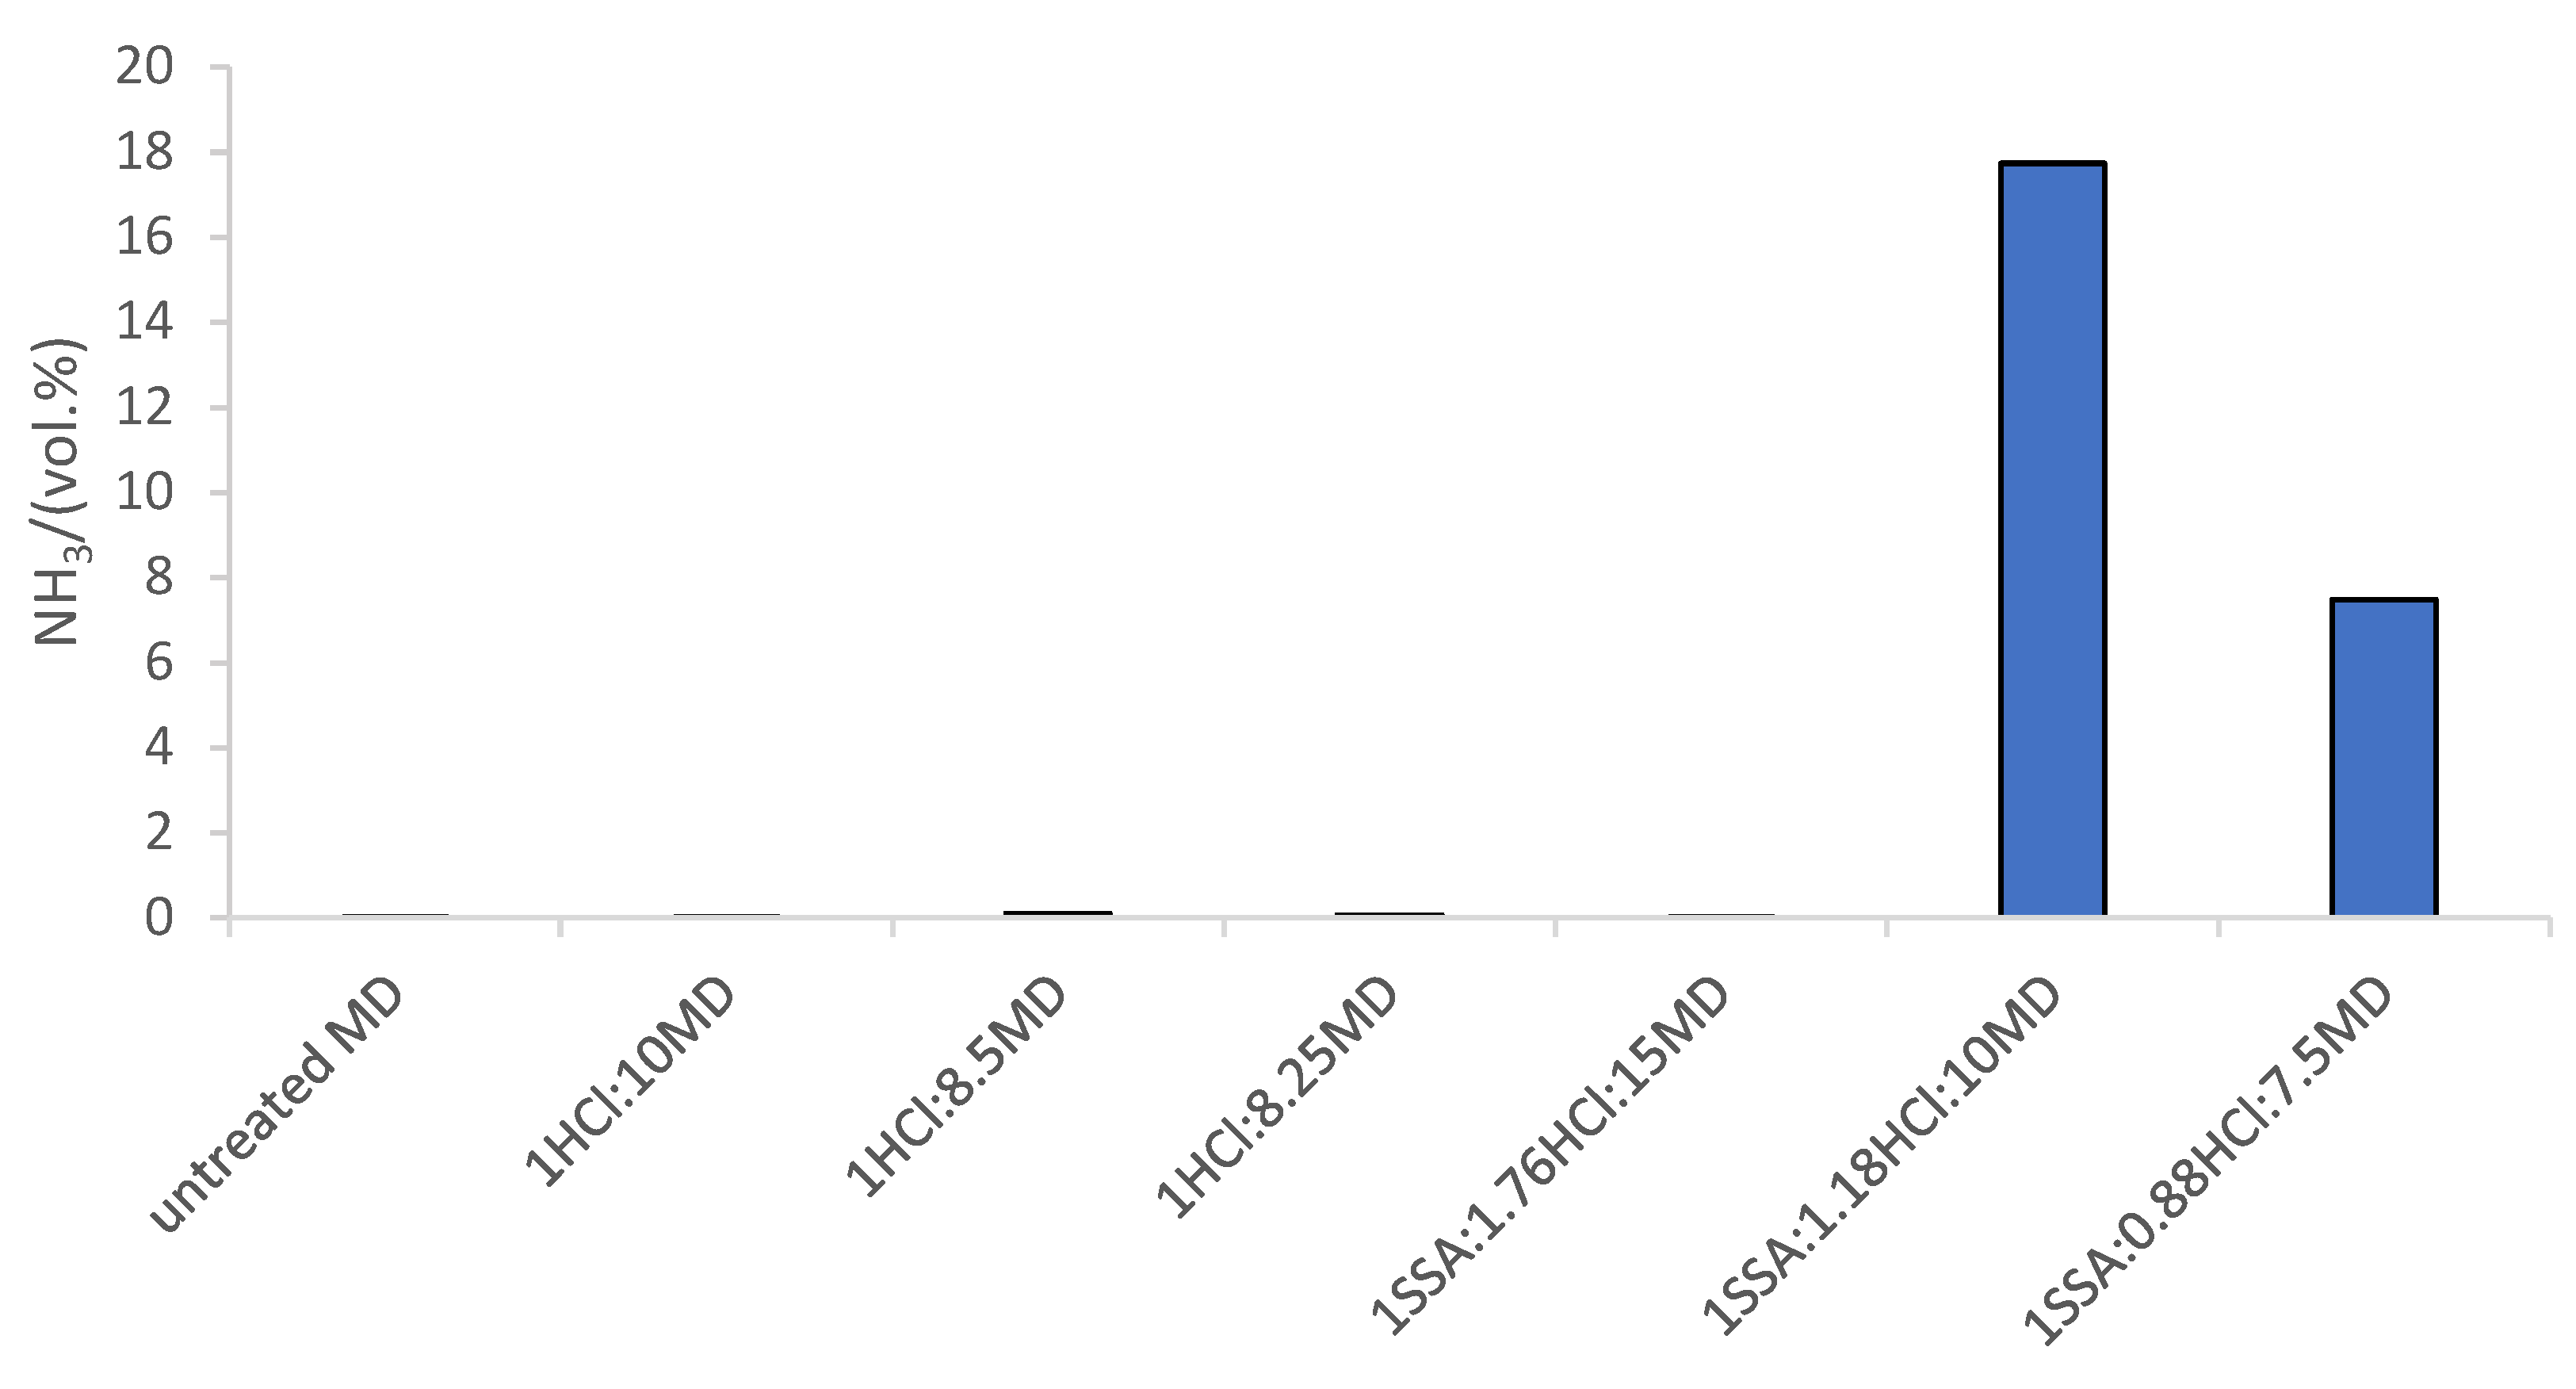
Figure 9.
Carbon dioxide content in the biogas for the 7 cases evaluated.
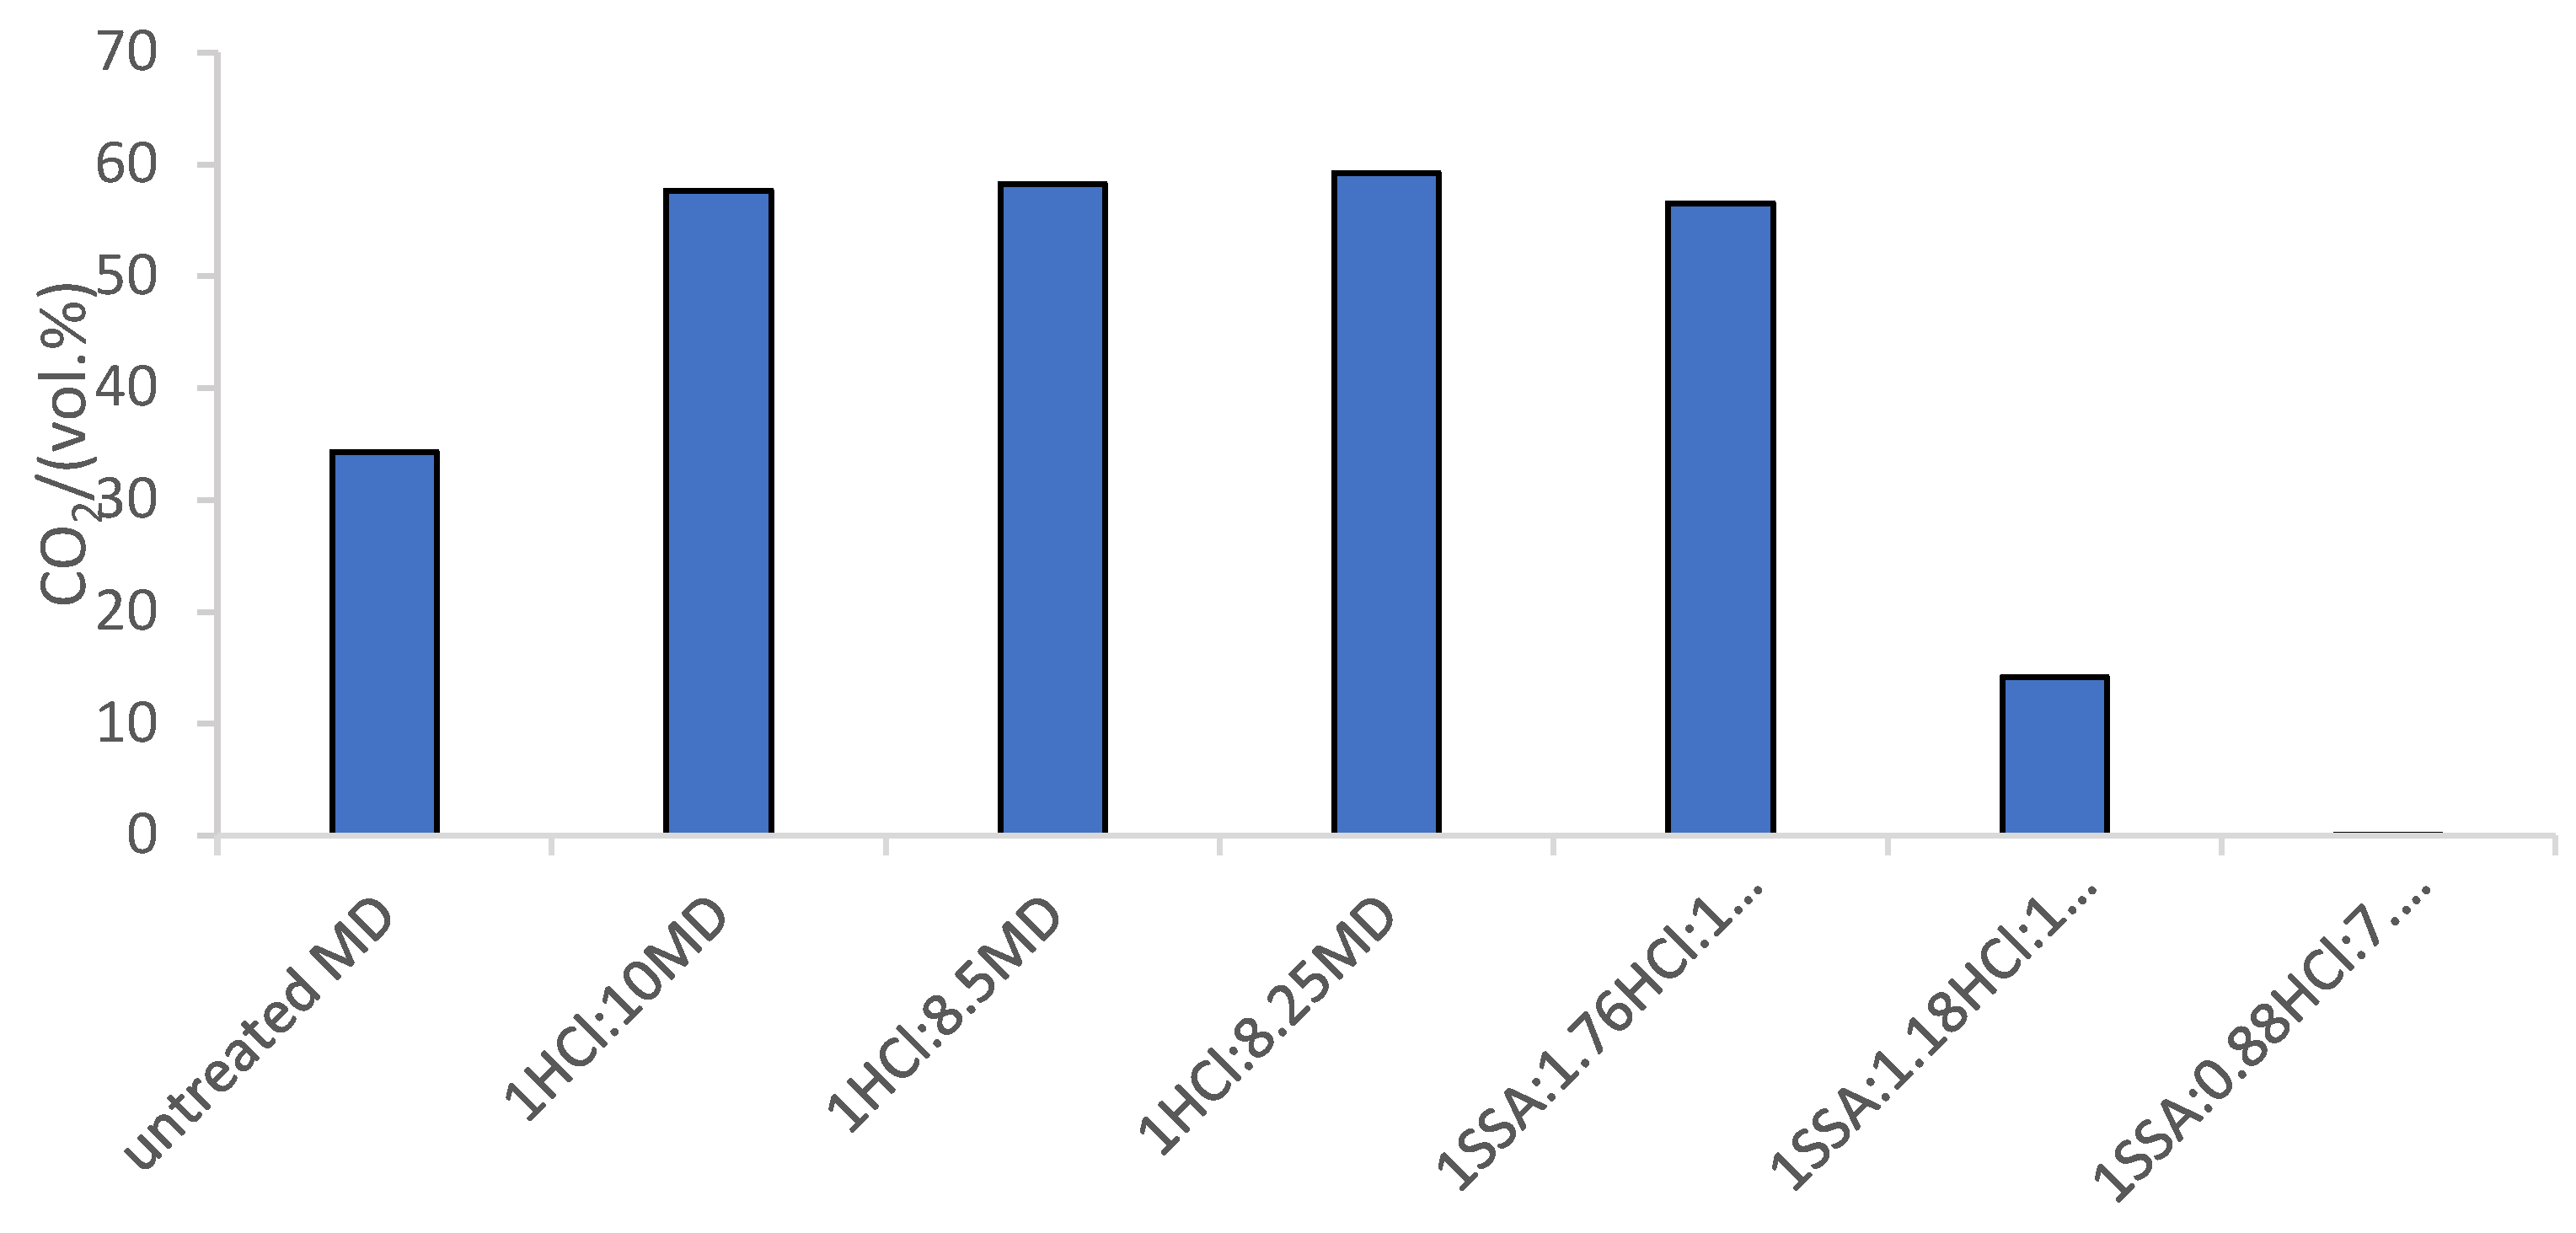
Figure 10.
Methane content in the biogas for the 7 cases evaluated.
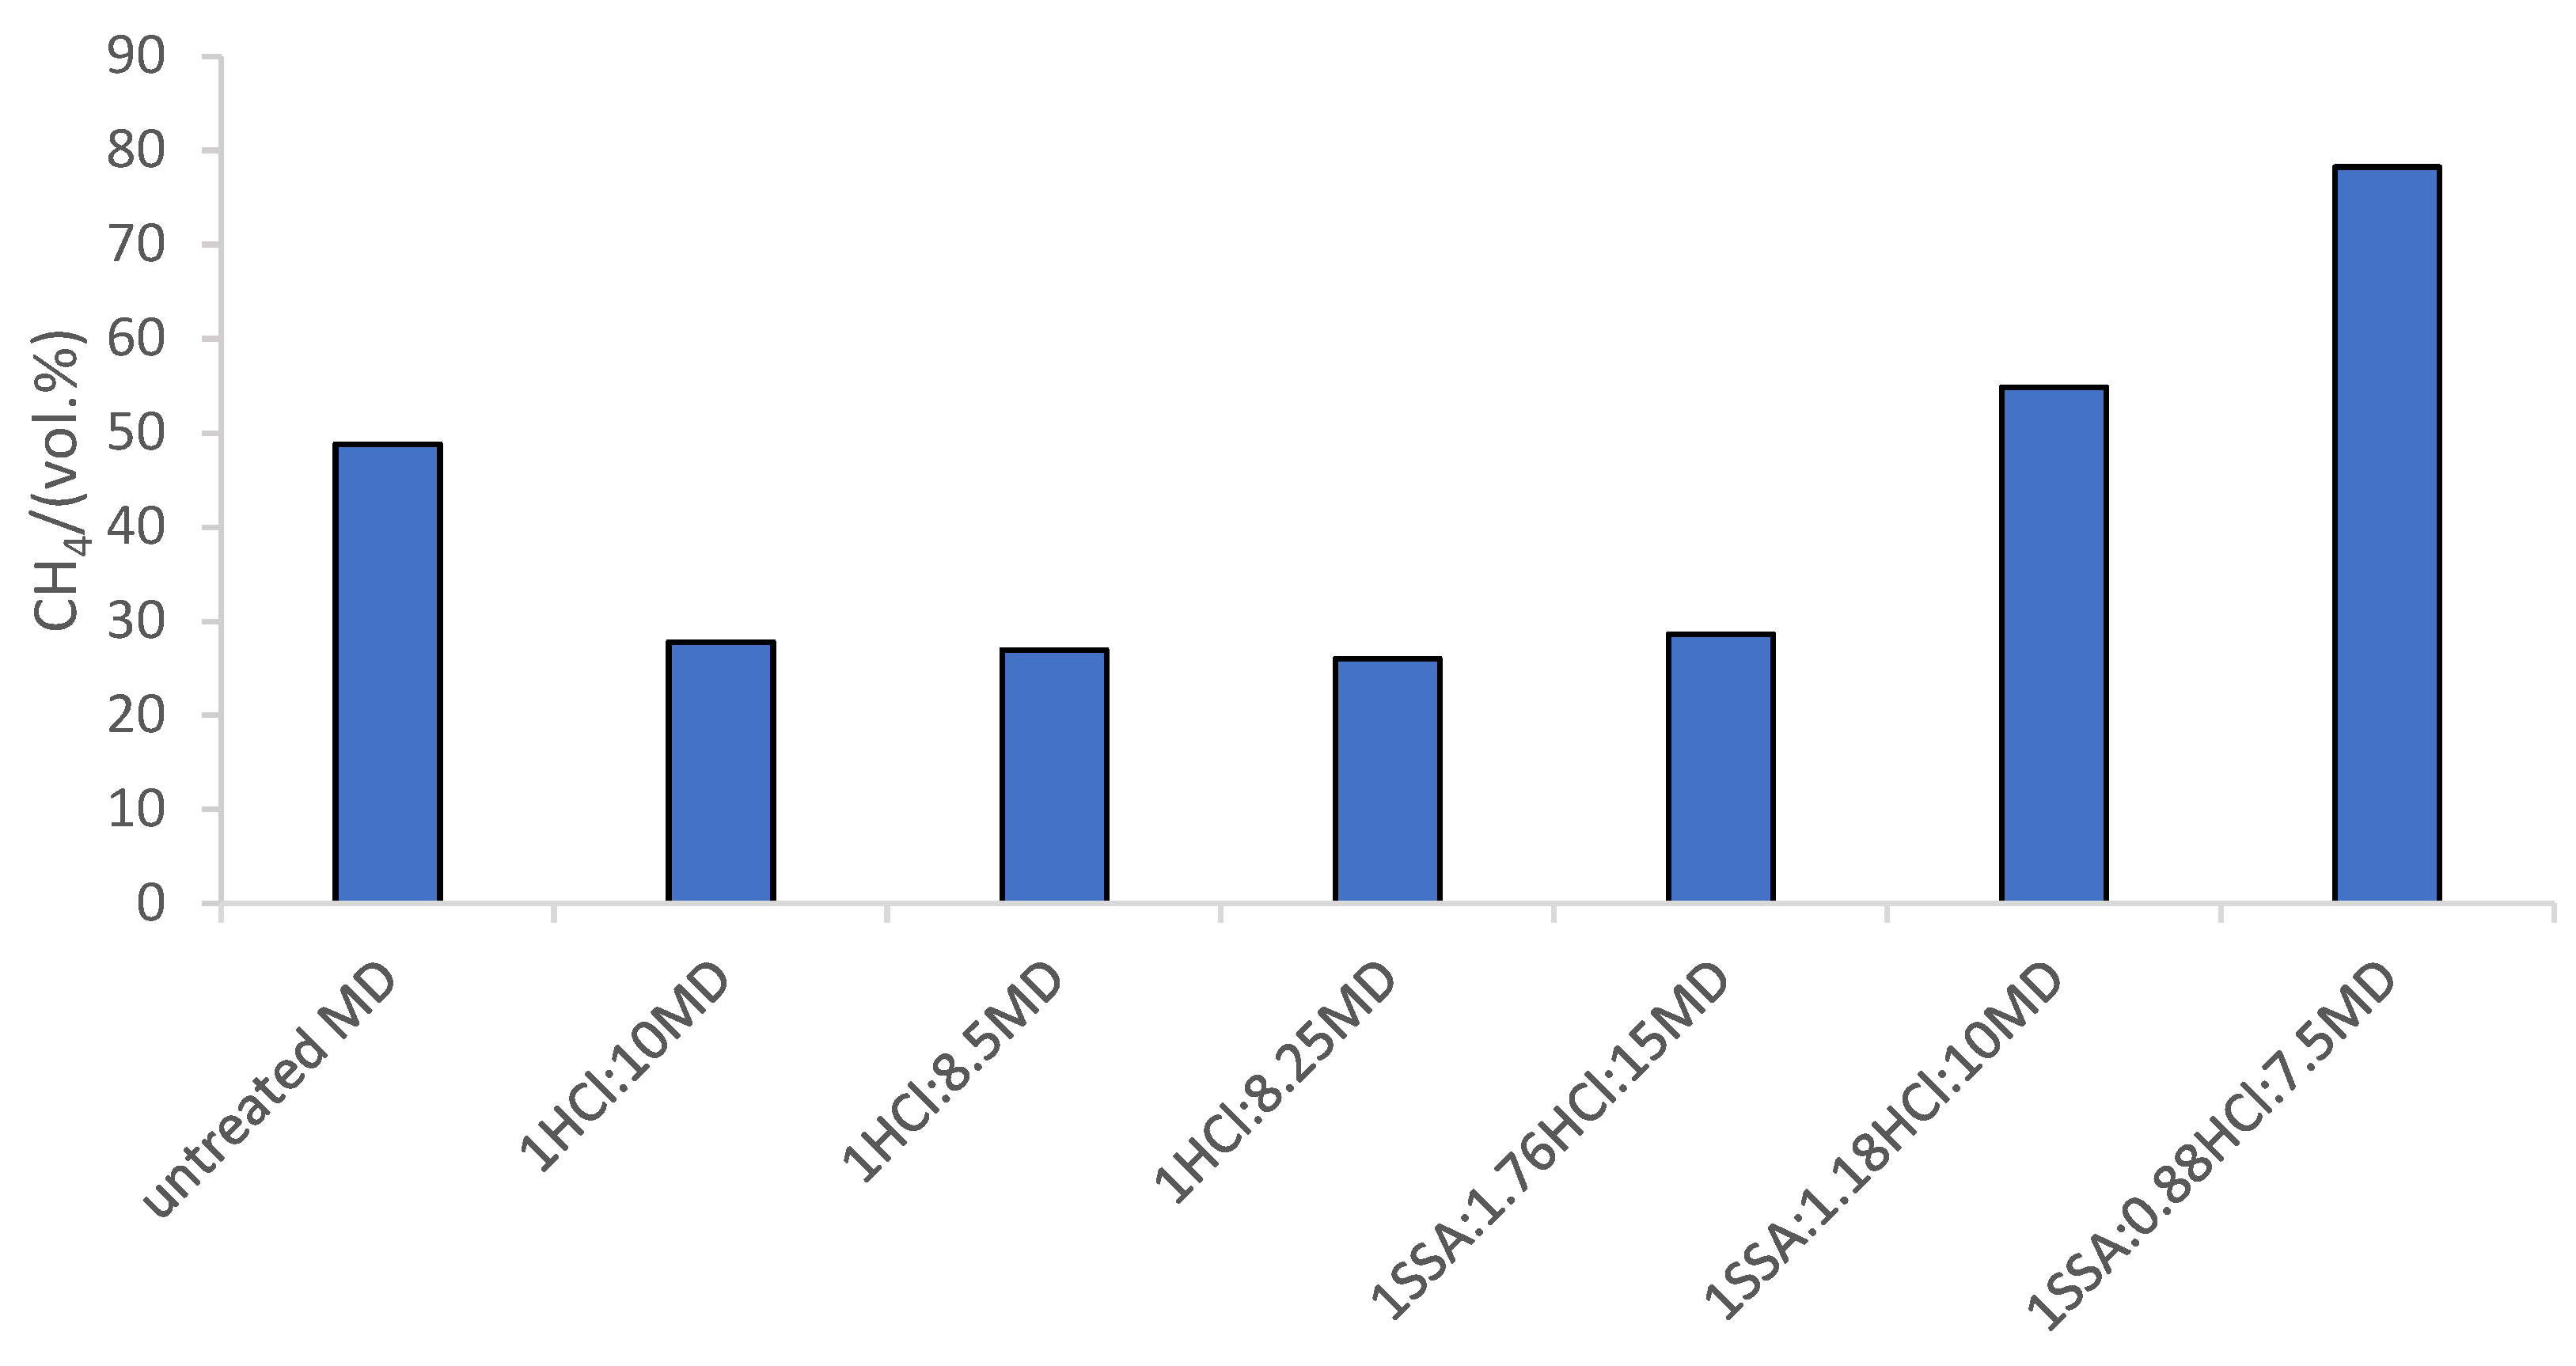
Table 1.
SSA composition reported by Franz [25] from the incinerator of Winterthur (Switzerland).
Table 1.
SSA composition reported by Franz [25] from the incinerator of Winterthur (Switzerland).
| Compound | Mass fraction |
|---|---|
| CaO | 0.1120 |
| SiO2 | 0.0987 |
| Al2O3 | 0.0321 |
| Fe2O3 | 0.0987 |
| P2O5 | 0.1037 |
| MgO | 0.0153 |
| K2O | 0.0030 |
| Na2O | 0.0237 |
| TiO | 0.0025 |
| MnO | 0.0005 |
| SO3 | 0.0099 |
| Cl | 0.0000 |
| H2O (Moisture) 1 | 0.0500 |
| C (Black Carbon, Carbonate, etc.) 1 | 0.4500 |
| Total | 1.0000 |
Table 2.
Composition of the liquid cow manure considered as feedstock for the PSM of Rajendran et al. [11] and based on the data reported by Budiyono et al. [31].
| Component | Mass Fraction |
|---|---|
| H2O (Water) | 0.9400 |
| C6H12O6 (Dextrose) | 0.0100 |
| NH3 (Ammonia) | 0.0010 |
| Cellulose | 0.0220 |
| C5H8O4 (Hemicellulose, Glutaric Acid, etc.) | 0.0100 |
| C57H104O6 (Triolein) | 0.0004 |
| C51H98O6 (Tripalmitin) | 0.0004 |
| C37H68O5 (1-palmitoyl-2-linoleoyl-sn-glycerol) | 0.0004 |
| C13H25O7N3S (Protein) | 0.0030 |
| C4.39H8NO2.1 (Keratin) | 0.0018 |
| Pseudo-component (Inert) 1 | 0.0110 |
| Total | 1.0000 |
1 Originally defined in the case 1 using the cow manure as the feedstock employed in AD of the work of Rajendran et al. [11].
Table 3.
Summary of the residual biogas and methane potentials of anaerobic digestate produced from different substrates and with a variety of solid-liquid separation equipment (e.g. screw press, compression roller, etc.).
Table 3.
Summary of the residual biogas and methane potentials of anaerobic digestate produced from different substrates and with a variety of solid-liquid separation equipment (e.g. screw press, compression roller, etc.).
| Fraction | mL biogas/g VS | mL CH4/g VS | Reference |
|---|---|---|---|
| Whole | 61 | 34 | [40] |
| Liquid | 67 | 39 | |
| Whole | 135 1 | 70 | [45] |
| Solid | 173 | 90 | |
| Whole | 21 – 82 | 3 – 38 | [44] |
| Solid (Fresh) | 152 – 312 | 71 – 157 | [46] |
| Solid (Stored 15 – 30 d) | 153 – 210 | 76 – 109 |
1 Calculated assuming a 52 vol.% of methane in the biogas, based on the data of the anaerobic digestion plant described by the authors.
Table 4.
Reaction orders and kinetic constants of the main reactions occurring in the CO2-NH3-H2O system.
Table 4.
Reaction orders and kinetic constants of the main reactions occurring in the CO2-NH3-H2O system.
| Reaction | Order | Kinetic constants (@ 20 ºC) | References |
|---|---|---|---|
| Equation 7 | 1 2 |
kCO2 = 3.25·10-2 s-1 kHCO3- = 15 M-1·s-1 |
[50,51,52] |
| Equation 8 | 1 | kNH3 = Instantaneous | [53] |
| Equation 9 | 2 | kCO2 = kNH3 = 3.37 M-1·s-1 > 3.25·10-2 s-1 | [53,54] |
| Equation 10 | 2 | kHCO3- = kNH3 = 3.37 M-1·s-1 | [53,54] |
| Equation 11 | 2 | [54] |
Table 6.
Share (relative amounts expressed as percentage in molar scale) of carbamate, bicarbonate, and carbonate in aqueous solutions with the coexistence of NH3(g) and CO2(g) [20,48].
| Nature of the solution | Liquid fraction of anaerobic digestate [20] | 240-mL solution of 2.5 mol NH3(aq)/L bubbled for 8 hours at a rate of 15 L/h of 10 vol.% CO2 and 90% N2 [48] 1 |
|---|---|---|
| % NH2COO- 2 | 1.05 | 14.7 |
| a% HCO3- | 97.24 | 75.7 |
| a% CO32- | 1.70 | 9.6 |
1 The loss of ammonia was less than 1.3 % (molar basis) during the 8-hour absorption test. 2 Relative amounts expressed as percentage in molar scale.
Disclaimer/Publisher’s Note: The statements, opinions and data contained in all publications are solely those of the individual author(s) and contributor(s) and not of MDPI and/or the editor(s). MDPI and/or the editor(s) disclaim responsibility for any injury to people or property resulting from any ideas, methods, instructions or products referred to in the content. |
© 2023 by the authors. Licensee MDPI, Basel, Switzerland. This article is an open access article distributed under the terms and conditions of the Creative Commons Attribution (CC BY) license (http://creativecommons.org/licenses/by/4.0/).
Copyright: This open access article is published under a Creative Commons CC BY 4.0 license, which permit the free download, distribution, and reuse, provided that the author and preprint are cited in any reuse.


