Preprint
Article

Source Apportionment of Ambient Particulate Matter (PM) in two Western Africa Urban Sites (Dakar in Senegal and Bamako in Mali)

Altmetrics

Downloads

159

Views

54

Comments

0

A peer-reviewed article of this preprint also exists.

Submitted:

13 March 2023

Posted:

14 March 2023

You are already at the latest version

Alerts
Abstract
The purpose of this study is to characterize atmospheric pollution and its sources in two West African urban sites during the dry season (January 2009 in Bamako, Mali, and December 2009 in Dakar, Senegal). Particulate Matter (PM) source apportionment was performed using Principal Component Analysis (PCA) and Positive Matrix Factorization (PMF). Carbonaceous components, water-soluble inorganic compounds, and trace elements were analyzed from PM (TSP, PM10, and PM2.5) samples. The measured PM2.5 and PM10 concentrations were 5 to 10 times and 3 to 8 times higher than the 2005 WHO 24-hour standards, respectively. PCA and PMF analyses identify five sources in both cities. The sources contributing to aerosol concentrations (PM2.5 - PM10) in Bamako are motor vehicles (20-13%), solid fuel combustion (16-13%), crustal dust (24-30%), resuspended road dust (26-30%) and secondary aerosols (10-16%). During the sampling period in Bamako, dust was the most prevalent source, accounting for 63% of the total PM10 mass. In Dakar, the main identified sources were motor vehicles (28-19%), mineral dust (16-25%), industries and oil burn-ing (11-10%), sea salts (15-20%), and resuspended road particles (21-29%). The findings also indicate that anthropogenic emissions contribute significantly to the PM2.5 fraction, implying that populations are highly exposed to fine particles.
Keywords: 
Subject: Environmental and Earth Sciences  -   Atmospheric Science and Meteorology

1. Introduction

Particulate matter (PM) can adversely affect human health via inhalation, especially in urban environments [1,2,3], and its role in climate change has long been recognized [4]. Aerosol particles with aerodynamic diameters of less than 2.5 μm (PM2.5) are recognized as the more prone to induce toxicological effects due to their ability to readily penetrate into human lungs [5,6]. The chemical composition of aerosols, such as organic compounds and metals, contributes to their high toxicity [7,8]. The identification and quantitative evaluation of the contributions of different aerosol sources is important for understanding their implications in health and environmental effects and for defining mitigation policies. In developed countries, source characterization of atmospheric pollution has been investigated for several years. This is not the case in developing countries with densely populated regions such as the West Africa capitals. In these urban areas, a large proportion of atmospheric particles is attributable to anthropogenic sources such as traffic (vehicular and two-strokes), biomass and domestic burning (wood and charcoal) and industries [9,10,11,12,13,14,15]. Saharan dust aerosols are also significantly contributing to the total aerosol loads during the dry season, when North-Easterly trade winds (Harmattan) are predominant, which can carry large loads of dust [16,17,18]. In addition, mechanical processes such as resuspension of road particles remain a large source due to the high number of unpaved roads in these cities. Consequently, rapid deterioration of air quality has now become a heavy challenge for the majority of capital cities in West Africa: in order to define policies to reduce particulate matter (PM) pollution at source level, there is an urgent need for a better quantification of the sources of this pollution. PM pollution levels in West Africa are comparable to concentrations observed in European, Asian and United States megacities, well above the international World Health Organization (WHO) recommendations [14,19].
Receptor-oriented source apportionment models are often used to identify the number of aerosol sources and to estimate their contributions to measured concentrations [20,21,22]. In our study, PCA (Principal Component Analysis, [23,24]) is performed in conjunction with PMF (Positive Matrix Factorization, [25]) to investigate and quantify the aerosol sources in West Africa urban sites. These two statistic models are considered here due to their complementarity, accessibility and relatively easy use. The PCA approach requires minimal inputs from the characteristics of the different sources, with an aim at quantifying information both on source profiles and magnitude of absolute concentrations. The PCA is used as an explanatory tool to identify major sources of air pollutants, whereas the PMF is used to quantify the contributions of all sources for all measured pollutants. The PMF is a non-data sensitive technique that can manage and resolve inhomogeneous datasets without any previous univariate analysis. It does not require to know historical emission source profiles and introduces estimated error associated to each measured component. We also used enrichment factor (EF) analyses in addition to PCA and PMF to categorize air pollution sources in our sites. EF compares the ratios for various elements in measured atmospheric concentrations to the corresponding ratios in geological material [26,27].
A dataset from the POLCA (POLlution des Capitales Africaines: African Capital Pollution), a jointly program between African and French universities, is used in this study [8,14,28]. The aim was to characterize atmospheric particulate pollution and its health impact in two African cities: Bamako (Mali) and Dakar (Senegal). Samples collected during intensives campaigns occurring in the selected sites during the dry season (January 2009 in Bamako and December 2009 in Dakar) were analyzed for a comprehensive description of the physico-chemical characteristics of the aerosols, and their relative contributions to the aerosol particles with aerodynamic diameters of less than 2.5 μm (PM2.5), aerosol particles with aerodynamic diameters of less than 10 μm (PM10) and Total Suspended Particles (TSP).
The focus of this paper is on the characterization of aerosol chemical composition and quantification of urban sources in Bamako and Dakar using PMF statistic model in association with PCA analysis. We describe the methodology in Section 2 and discuss the results in Section 3.

2. Materials and Methods

2.1. Description of Monitoring Sites

PM samples were collected during the dry season in Bamako (Mali) and Dakar (Senegal), two West African cities. Bamako, the largest city of Mali, is located on the Niger River in the southwestern part of the country (Figure 1) and had a population of approximately 1.8 million inhabitants during the campaign in 2009 (12.5% of the national population) [29]. Measurements were taken at a downtown crossroad (12°39’N, 8°04’W) between January 20th and February 1st 2009; a dust event episode occurred between January 22nd and January 24th, 2009 (Figure 2). In Dakar, a coastal city in west Senegal (Figure 1) with a population of about 2.5 million people in 2009 (21% of the national population) [30], measurements were performed between December 1st and 13th 2009, near a busy crossroad (14°40’N, 17°25’W). Because of their proximity to markets, both sampling sites are heavily influenced by intensive human activities, but with very different characteristics important for air quality.

2.2. PM Sample Collection

Daily 24-hour integrated aerosol samples were collected by filtration at the two west Africa urban sites using automatic aerosol samplers designed and developed for the INDAAF (International Network to study Deposition and Atmospheric chemistry in Africa, https://indaaf.obs-mip.fr/) program [31]. The system is designed to collect samples simultaneously using six lines, each particle mode (Total Suspended Particle TSP, Particle Matters with diameters less than 10 µm PM10 and Particle Matters with diameters less than 2.5 µm PM2.5) was sampled separately with an individual pump operated at a flow rate of 18±7 l.min-1.

2.3. Meteorological Conditions during Measurements

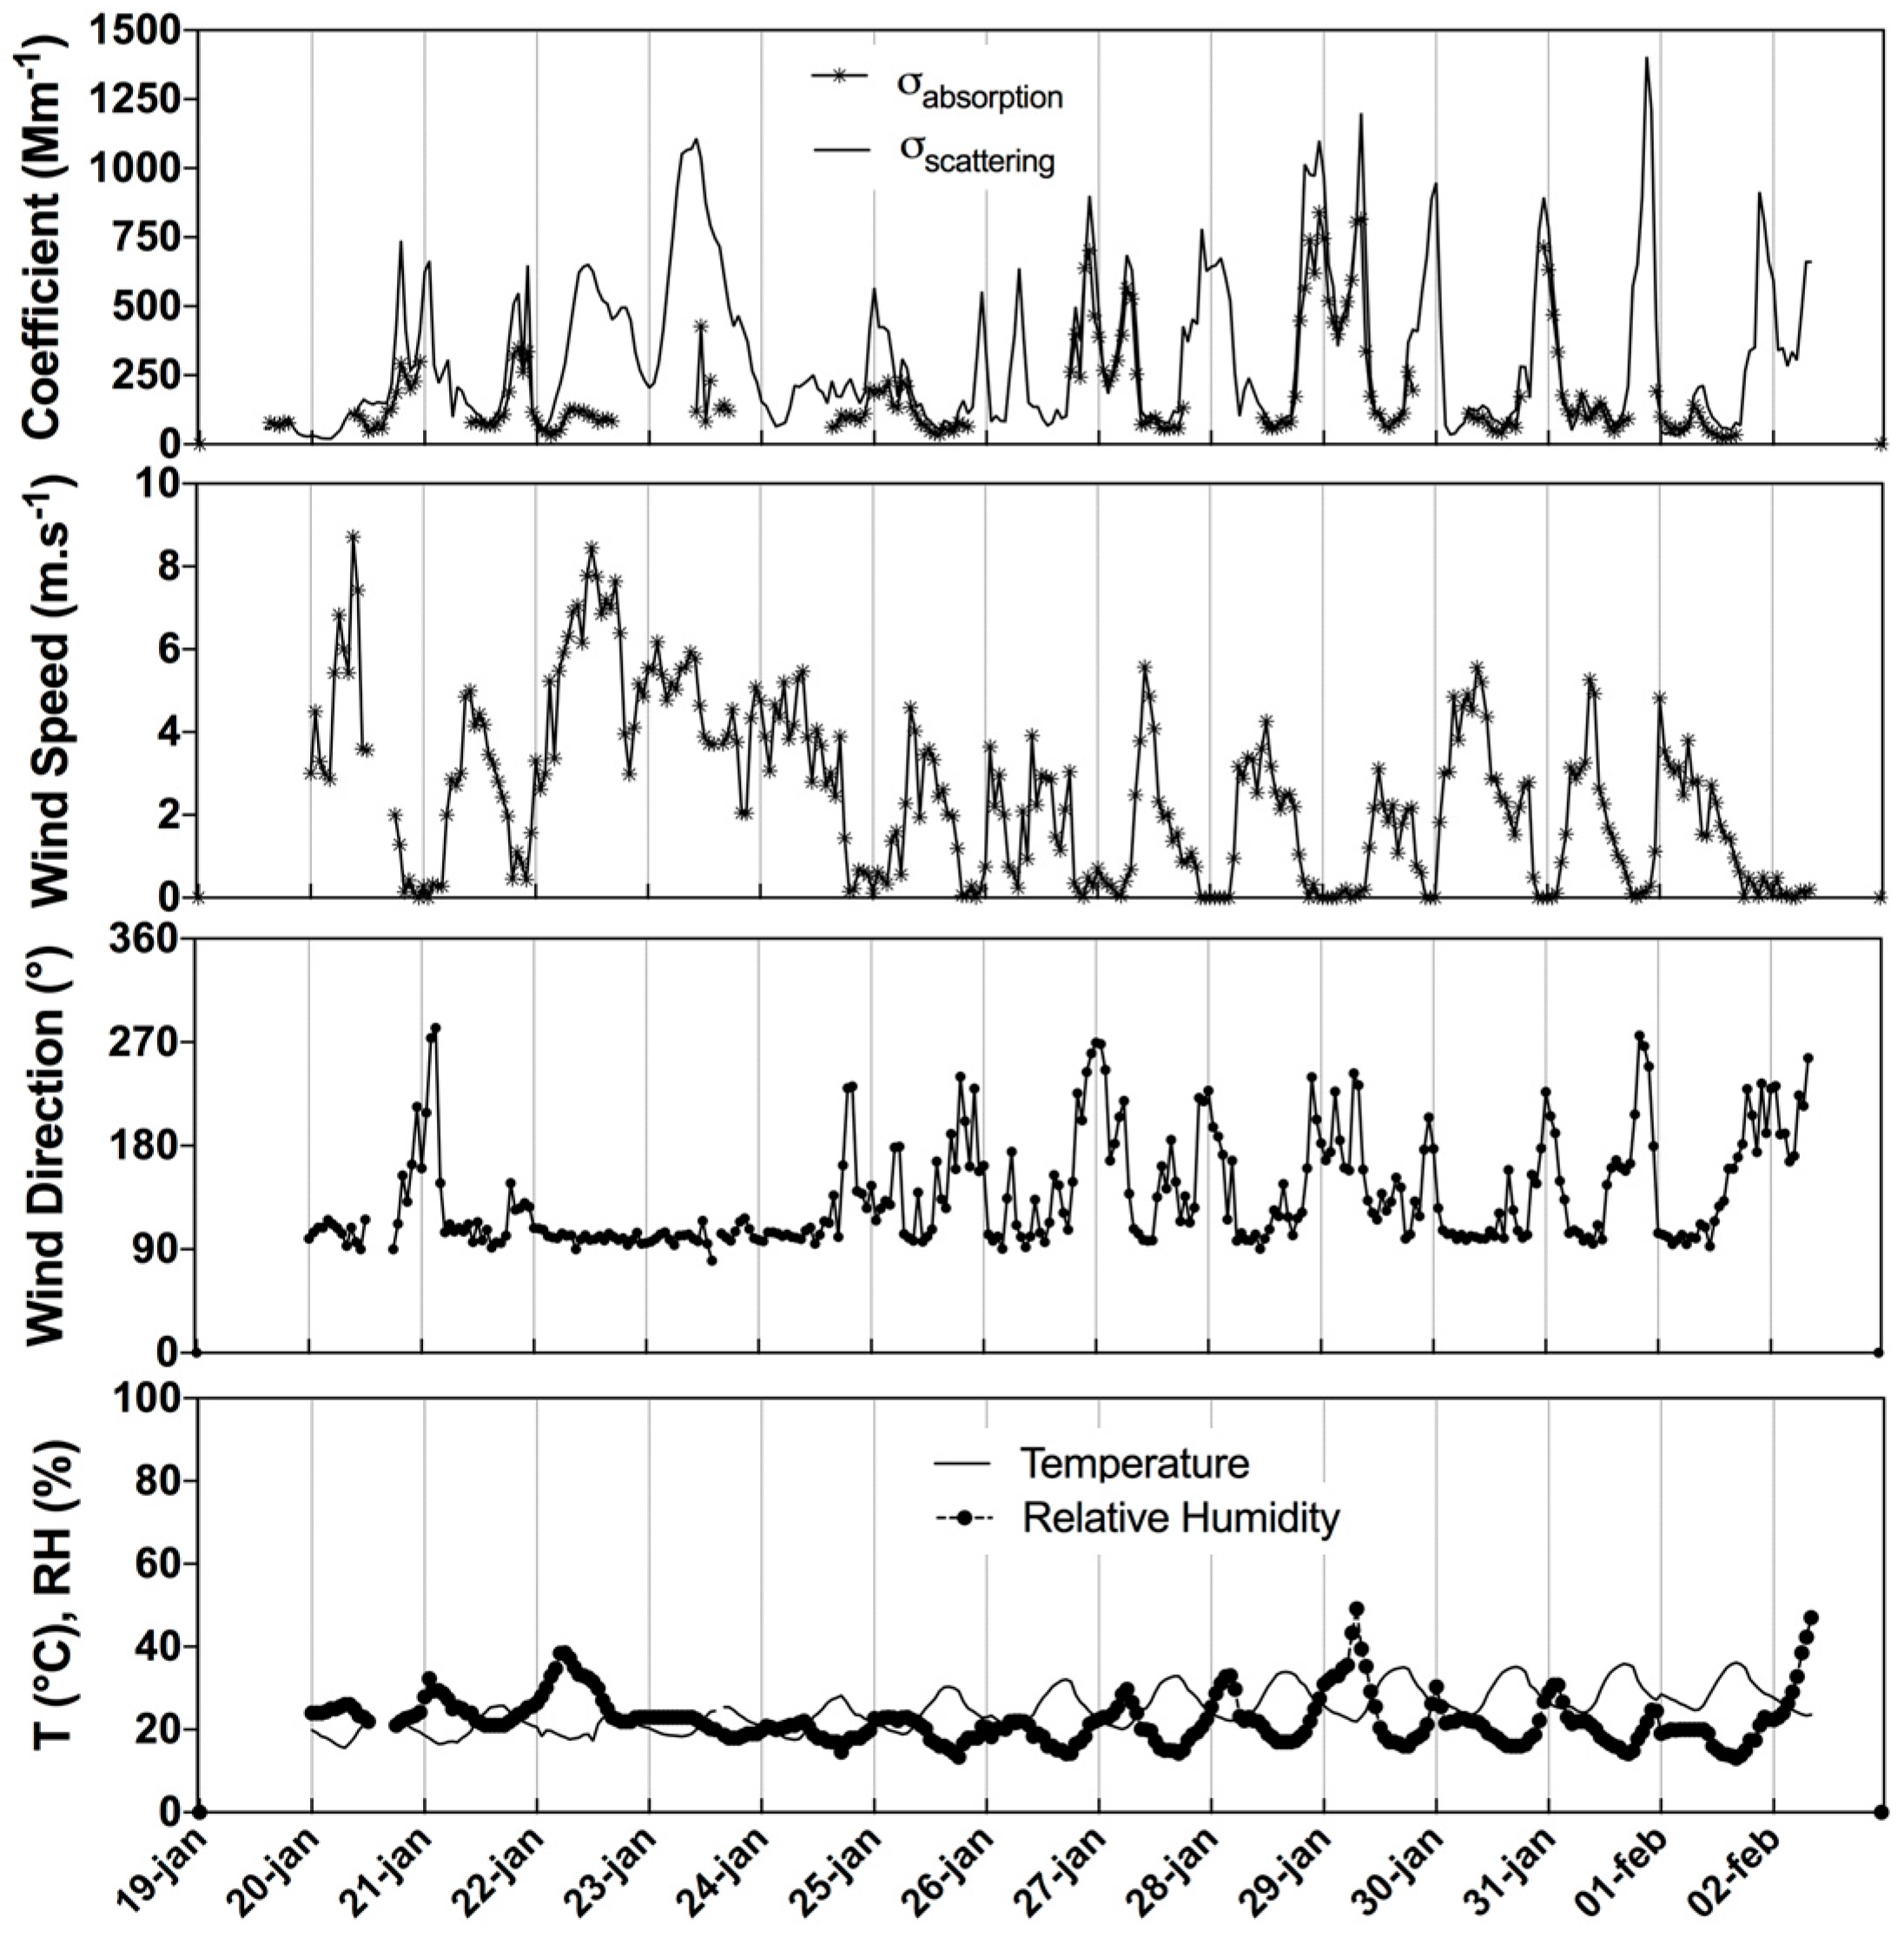
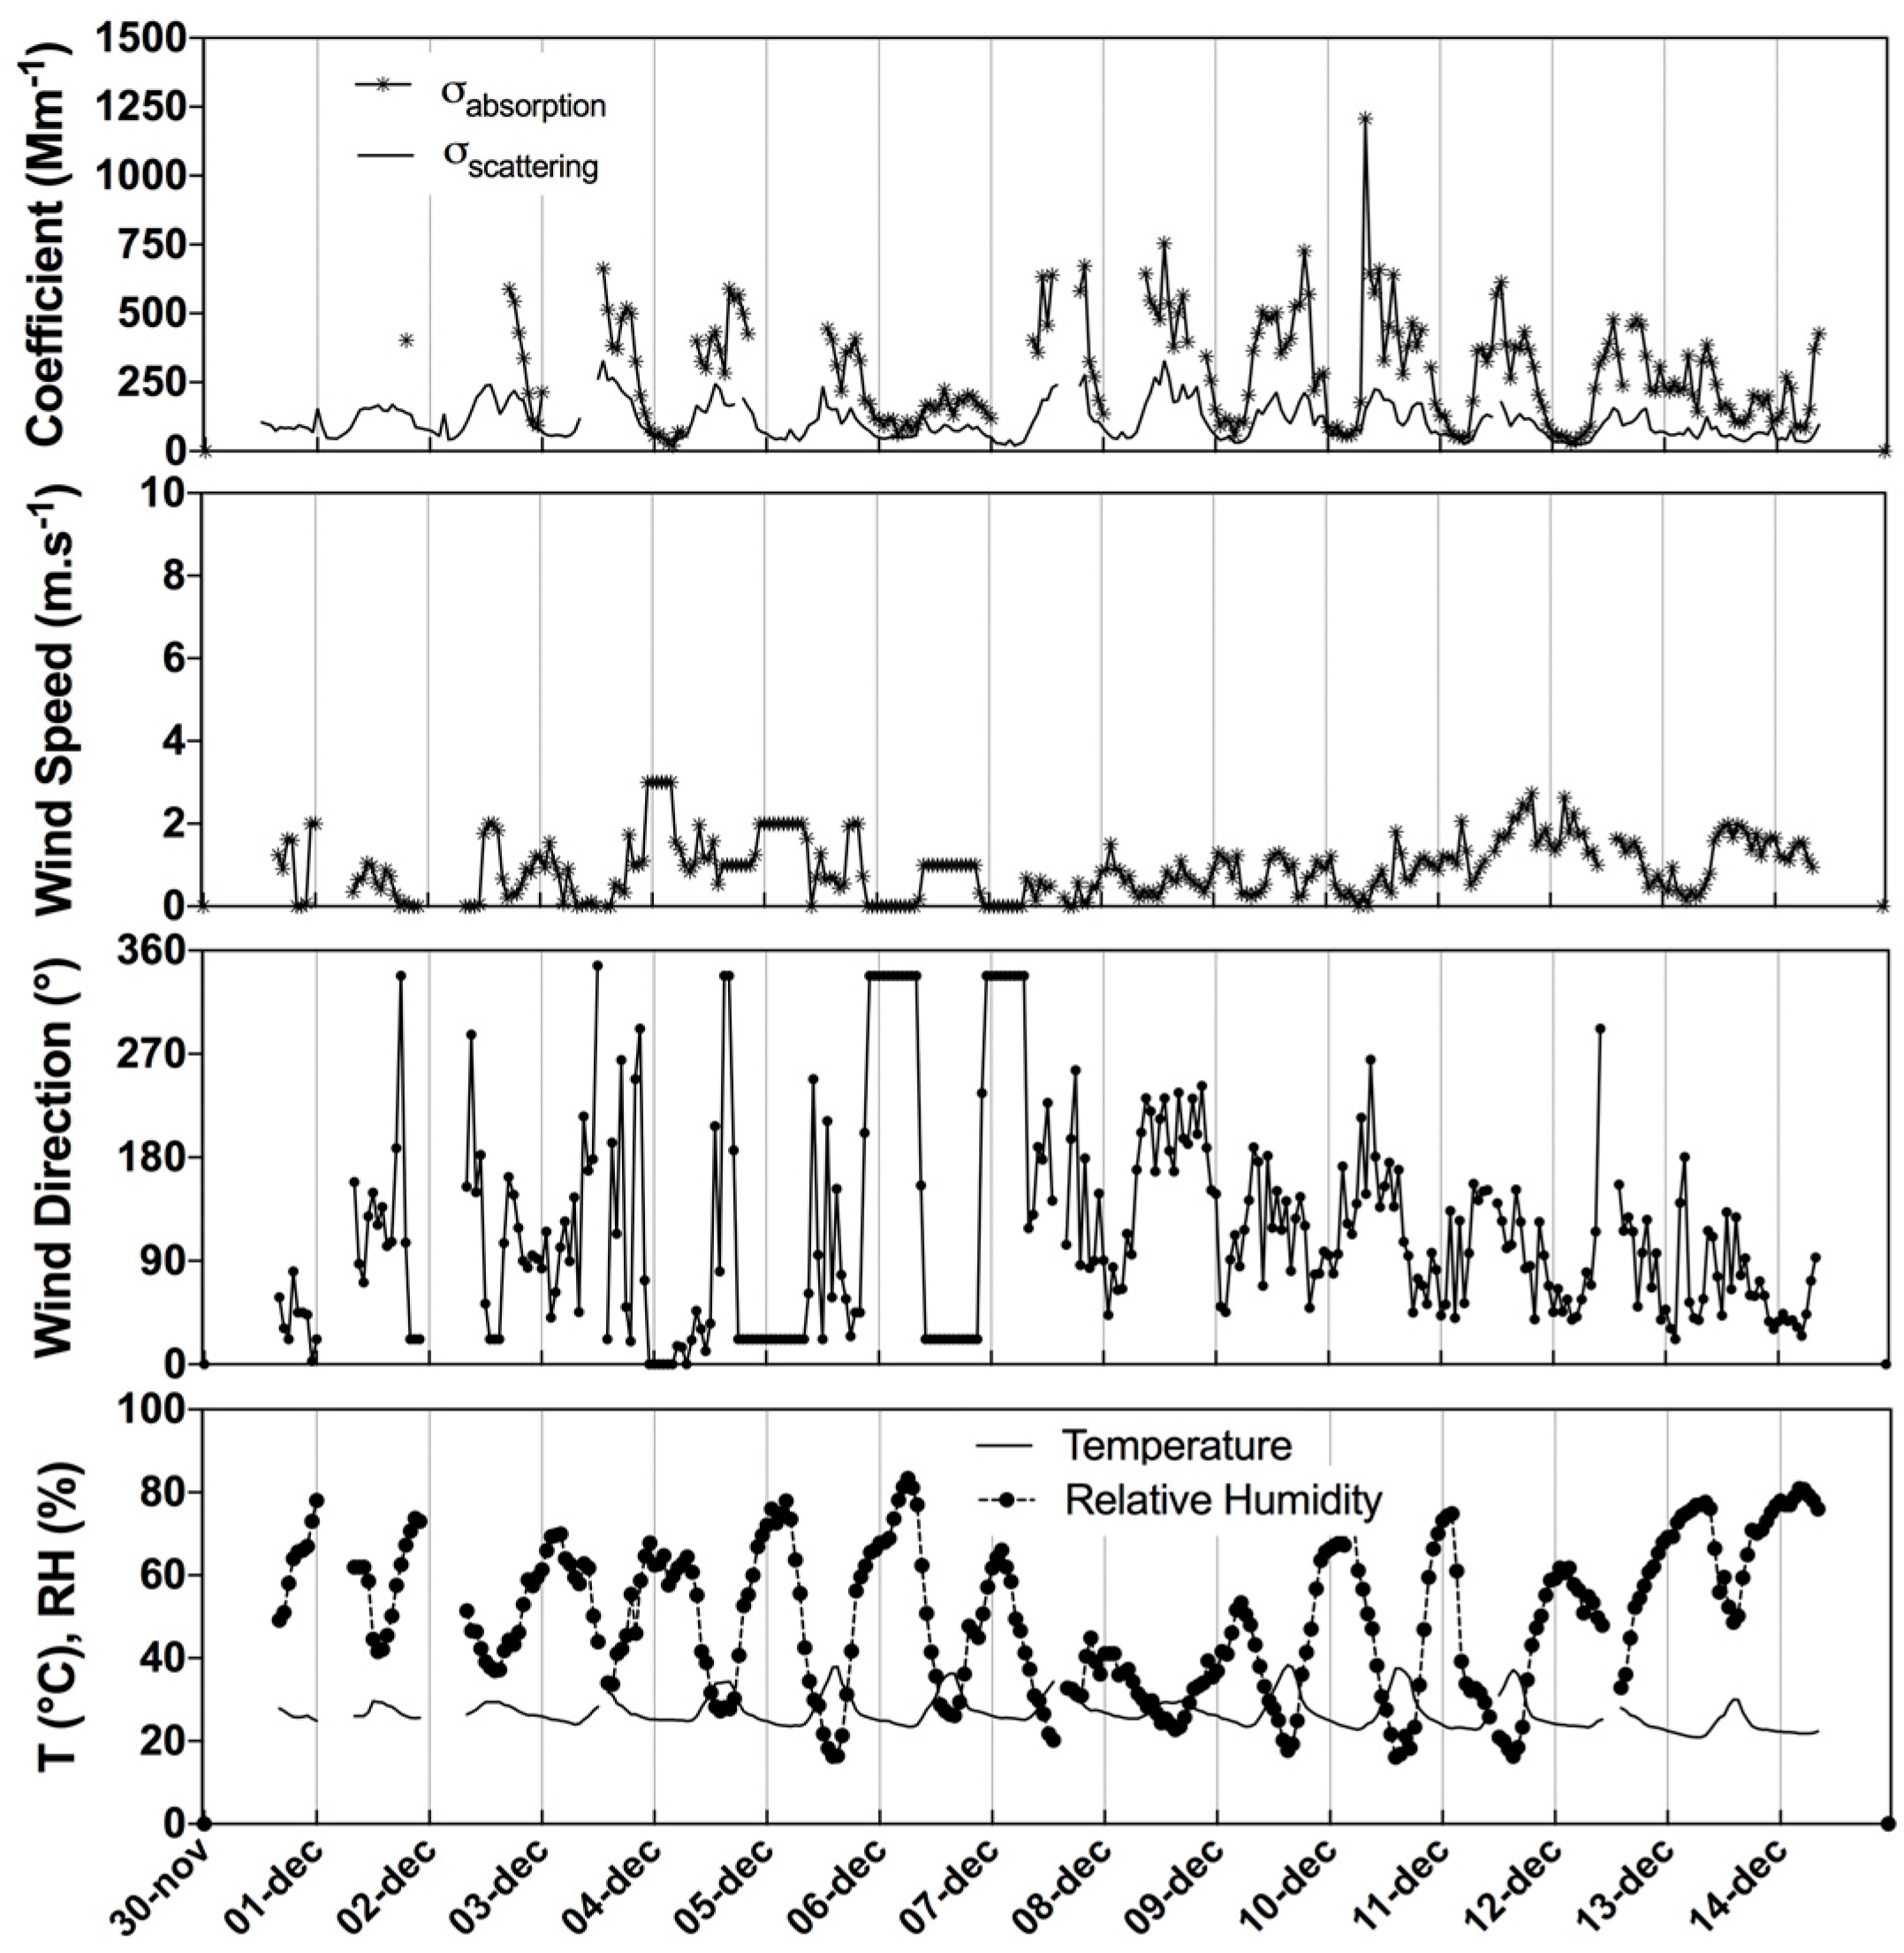
At each sampling site, an automated meteorological station collected wind speed and direction, temperature (T), and relative humidity (RH). The coefficients of light scattering (σscat) and aerosol absorption (σabs) were also measured using a nephelometer (520 nm wavelength, model M903, Ecotech) and aethalometers (model AE-42 with seven wavelengths (370 to 950 nm) and 880 nm wavelength, model AE-16, Magee Scientific). Figure 2 and Figure 3 display the diurnal variations of all of these parameters for the duration of the campaigns. There are distinct diurnal patterns in σscat and σabs for both sites over the entire measurement period, with two daily peaks: a morning peak between 7 and 9 a.m. and an evening peak between 5 and 7 p.m., with a second evening peak at 9 p.m. in Bamako. This diurnal variability is primarily caused by traffic and the evolution of the boundary layer during the day, [14,32], which is common in urban areas.
In Bamako (Figure 2), σscat and σabs generally show evening peaks (9 p.m.) more pronounced than in Dakar, coinciding with a thin boundary layer resulting from low ambient temperature and low westerly wind speed, except for the January 22-23 period, during which the diurnal variation is associated with high light scattering, low aerosol absorption, and high easterly wind speed (8 m.s-1). The large difference observed between σscat and σabs is due to the dust episode that occurred on January 22-23, 2009.
In Dakar (Figure 3), σscat and σabs display large morning and evening peaks coinciding with morning and evening traffic peaks [14]. The lower values were observed late at night when traffic volume and air temperatures were low. Dakar had a lower σscat and a higher σabs than Bamako, indicating that the characteristics of the two cities differed. To support this analysis, a σabs to σscat ratio was calculated and plotted for Bamako and Dakar to characterize traffic or dust influence [33] (Figure S1, Supplement). The mean ratio obtained in Dakar is 2.55±0.99, which is four times higher than the values obtained in Bamako (0.70±0.33), indicating the importance of anthropogenic sources (e.g. traffic emissions) in Dakar, whereas the values in Bamako indicate an area influenced more by dust or resuspended dust particles.

2.4. Chemical Analyses

Aerosol particles were collected on 47 mm quartz filters for carbonaceous analyses and Teflon filters for water soluble ions and metal elements analyses. A calibrated microbalance (Model Mettler MC21S) was used to weigh Teflon filters before and after aerosol sampling for determining the PM gravimetric masses. The samples were conditioned for 24-hour at relative ambient humidity of 30±15% prior to weighing and chemical analysis. TSP, PM10 and PM2.5 were analyzed for carbonaceous (black carbon BC, organic carbon OC and total carbon TC), water-soluble inorganic compounds and metal elements. The details of the quality controls performed on the chemical analysis data, as well as the determination of uncertainties, are provided in the supplemental information.
  • Water soluble inorganic compounds
Half of each Teflon filter was used in the analysis of inorganic ions (Na+, NH4+, K+, Mg2+, Ca2+, SO42-, NO3-, and Cl-), using ion chromatographic (IC) analyzer. These measurements were conducted following the analytical protocol described in Adon et al. [34]. Briefly, cations are analyzed using Dionex ion chromatography (DX-100) and anions with a Dionex DX-500. Water extraction of the filter samples was performed by a 10 min-long sonication in plastic vials with 30 ml deionised ultra-pure water. All analyses were conducted immediately after extraction. The uncertainty for each water-soluble inorganic compound is calculated using the Alleman et al. [35] methodology. More information on the detection limit and uncertainty calculations can be found in Section 1 of the supplemental material.
  • Metal elements
The metal elements were determined by coupling microwave assisted digestion with Induced Coupled Plasma - Mass Spectrometry (ICP-MS). In this study, a special pre-treatment for loaded aerosols was set up following the Celo et al. [36] methodology. First, the samples, placed in 100 ml Teflon bombs, were subject to a microwave-assisted digestion within a mixture of ultra-high purity acids (10 ml 16N HNO3, 0.5 ml 28N HF). A closed vessel microwave assisted reaction system (MARS 5, CEM Corporation, Matthews, NC) was used, with a two-step digestion program. During the first step, the temperature was ramped within 15 min to 160 °C. After a 10 min dwell time, the temperature was ramped to 180 °C and samples were digested at this temperature for 30 min. The precision and accuracy of the analysis were checked by analyzing standard reference materials (NIST SRM 1648) prepared in the same way as the digested samples, spikes and duplicates. Blank filters were used for background substraction. The digests were then transferred to clean polypropylene tubes and diluted to 10 ml with HNO3 0.37N. Samples were analyzed using ultra-sensitive ICP-MS (7500ce Element Technologies).
Over 40 elements were determined, only a part of them being retained for the sake of interpretation. Uncertainties associated with each element, as required by the PMF statistical model, are determined through the analysis of blank filters and the intercomparison of analytical technics (Section 2, Supplement). The estimated uncertainties in Dakar are less than 15%, with the highest values for Ni and Pb, and do not exceed 20% in Bamako. These uncertainties are acceptable for use in source-receptor models such as positive matrix factorization (PMF).
  • Carbonaceous elements
Quartz filters used for carbonaceous analysis were preheated for 24-hour at 600°C to lower carbon blanks before being exposed. Samples (24-hour PM2.5, PM10 and TSP) were analyzed using a two-step combustion technique: total carbon (TC) and black carbon (BC) concentrations were determined using THERMAL (carbon analyzer model G4 ICARUS CS TF, Bruker Axs, Germany) method developed by Cachier et al. [37] and Thermal-Optical Reflectance (TOR, Desert Research Institute analyzer) method following the IMPROVE temperature protocol [38], as indicated in Table S4. Organic carbon (OC) concentrations were finally calculated as the difference between TC and BC.
In the THERMAL technique, carbonates were removed (decarbonated or decarbonation) under HCl fumes prior to analyses due to carbonates interfering with carbon measurements. Sensitivity studies on the influence of decarbonatation have been conducted on Bamako and Dakar samples. Decarbonatation procedure is responsible of a decrease of OC concentration (range 40-46%) and an increase of BC (range 10-23%), depending on the site and size particle fraction (Tables S5 and S6, Supplement).
Because different analytical methods can result in significant differences in OC and BC concentrations [39,40], an intercomparison of the THERMAL and TOR methods was performed as a test of data quality. When using the TOR method, the uncertainty on the average measured TC is less than 10% and 5% when using the THERMAL method. The uncertainty in BC and OC varies by site and ranges from 5 to 30% (Section 3, Supplement). Based on these results, the data with no decarbonatation and measured using the THERMAL technique are considered in the following analysis.

2.5. Methods for Identifying and Quantifying Air Pollution Sources

2.5.1. Principal Component Analysis (PCA)

The PCA technique was used to identify potential sources of air pollution in Dakar and Bamako. The goal of PCA in this case is to reduce the number of variables to a smaller set of factors or sources while retaining as much information as possible from the original dataset [24]. This method helps identify groups of correlated chemical compounds that come from the same air pollution sources. Due to the high variability of elemental concentrations, the chemical composition data are first transformed into a dimensionless standardized form. The new set of variables, known as principal components (PCs), are uncorrelated and ordered so that the first retains the majority of the variation present in all of the original variables. Assuming a linear relationship between observed variables (species concentrations) and a number of p principal components (sources), PCA is expressed in its simplified form as:
Z i j = k = 1 p g i k h k j
Where Zij is the standardized concentration matrix, k=1,…,p is the number of principal components (sources), while gik is the factor loading matrix of correlations between compounds and PCs (sources) and hkj is the matrix of factor scores.
To better identify groups of correlated compounds, the statistical method called “VARIMAX rotation” was applied to the standardized concentration matrix to redistribute variances and provide a more interpretable structure to PCs (sources). After rotation, species from the same source are linked to the same PC with high weights (factor loadings), and this PC is then associated with a specific air pollution source before using PMF to quantify this source.

2.5.2. Positive Matrix Factorization (PMF)

Another statistical method, called Positive Matrix Factorization (PMF version v5.0) was used to quantify the contribution of the various sources to the particulate emissions. The principles and usage of this approach are detailed in the EPA (Environment Protection Agency) PMF user guide (https://www.epa.gov/air-research/epa-positive-matrix-factorization-50-fundamentals-and-user-guide). This method involves a minimization of an objective cost function Q [25,41,42], given by:
Q = i = 1 n j = 1 m e i j 2 s i j 2
Where eij is the residual associated with ith species concentrations measured in the jth sample, sij is an uncertainty estimate for ith species measured in the jth sample, n and m are respectively the numbers of samples and of species.
PMF uses both measured concentrations and uncertainty estimates to generate calculated chemical profiles and time series associated with each of the chemical profiles. The selection of species to be included in the analysis data depends on the goal of the study and on the quality of available species measurements. PMF analysis, like the PCA method, included the selection of 27 chemical variables (Al, Be, Ti, V, Mn, Co, Fe, Tl, K, As, Rb, Mg, Na, Ca, Ni, Se, Cr, Cu, Zn, Cd, Sb, BC, OC, Cl-, SO42- and NO3-) that were detected in the 39 and 36 samples in Bamako and Dakar, respectively. To assess the contribution of the identified factors to the collected data, the analysis includes PM mass as an explicit species. In the species concentrations table, missing values were replaced with the median value of species with assigned uncertainty values multiplied by four times the standard deviation. Species with a percentage of missing data over 70% were excluded from the data set, which is the case for Pb and NH4+. The basic criterion retained for PCA and PMF was that aerosol concentrations must be greater than the detection limit (DL). In this study, the DL values were calculated as in Alleman et al. [35]. When the measured concentrations are less than the DL, an adjustment is required; typically, data below the DL are rejected or replaced by DL/2, with an uncertainty of 5 x DL/6 [42]. This late methodology is applied here. Furthermore, a data quality classification based on the signal-to-noise ratio has been implemented, indicating whether the variability in measurements is real or due to data noise. The species were classified as “strong” if the signal to noise ratio was greater than 2, “weak” if it was between 0.2 and 2, and “bad” if it was less than 0.2 [43]. We multiplied the concentration by 3 for “weak” data. Only PM mass and Sb were categorized as “weak” in our measurements. As a result, the EPA PMF user guide recommended setting an extra modeling uncertainty. It was set at 20% in this study.
Before applying the PMF, isolated event such as dust episode was screened, as the contributions due to dust episodes could not be distinguished by the PMF technique [44].
The performance of PMF model was assessed by comparing reconstructed daily mean PM concentrations from all sources to measured values for each species (Tables S8 and S9, Supplement). The largest uncertainties in Bamako (15% for Ni, 16% for BC and 14% for OC) and in Dakar (10% for PM), can be attributed to data quality because missing values in some of these variables (BC and OC) were replaced by their median values, and associated uncertainties were assigned to be four times the mean values. PM is included as a variable, with high uncertainty determined as for missing values [45]. However, with significant correlation coefficients, there was generally good agreement between measured and calculated concentrations, suggesting that the identified factors effectively reproduce measured masses.

3. Results and Discussion

3.1. Aerosol Chemical Mass Concentrations

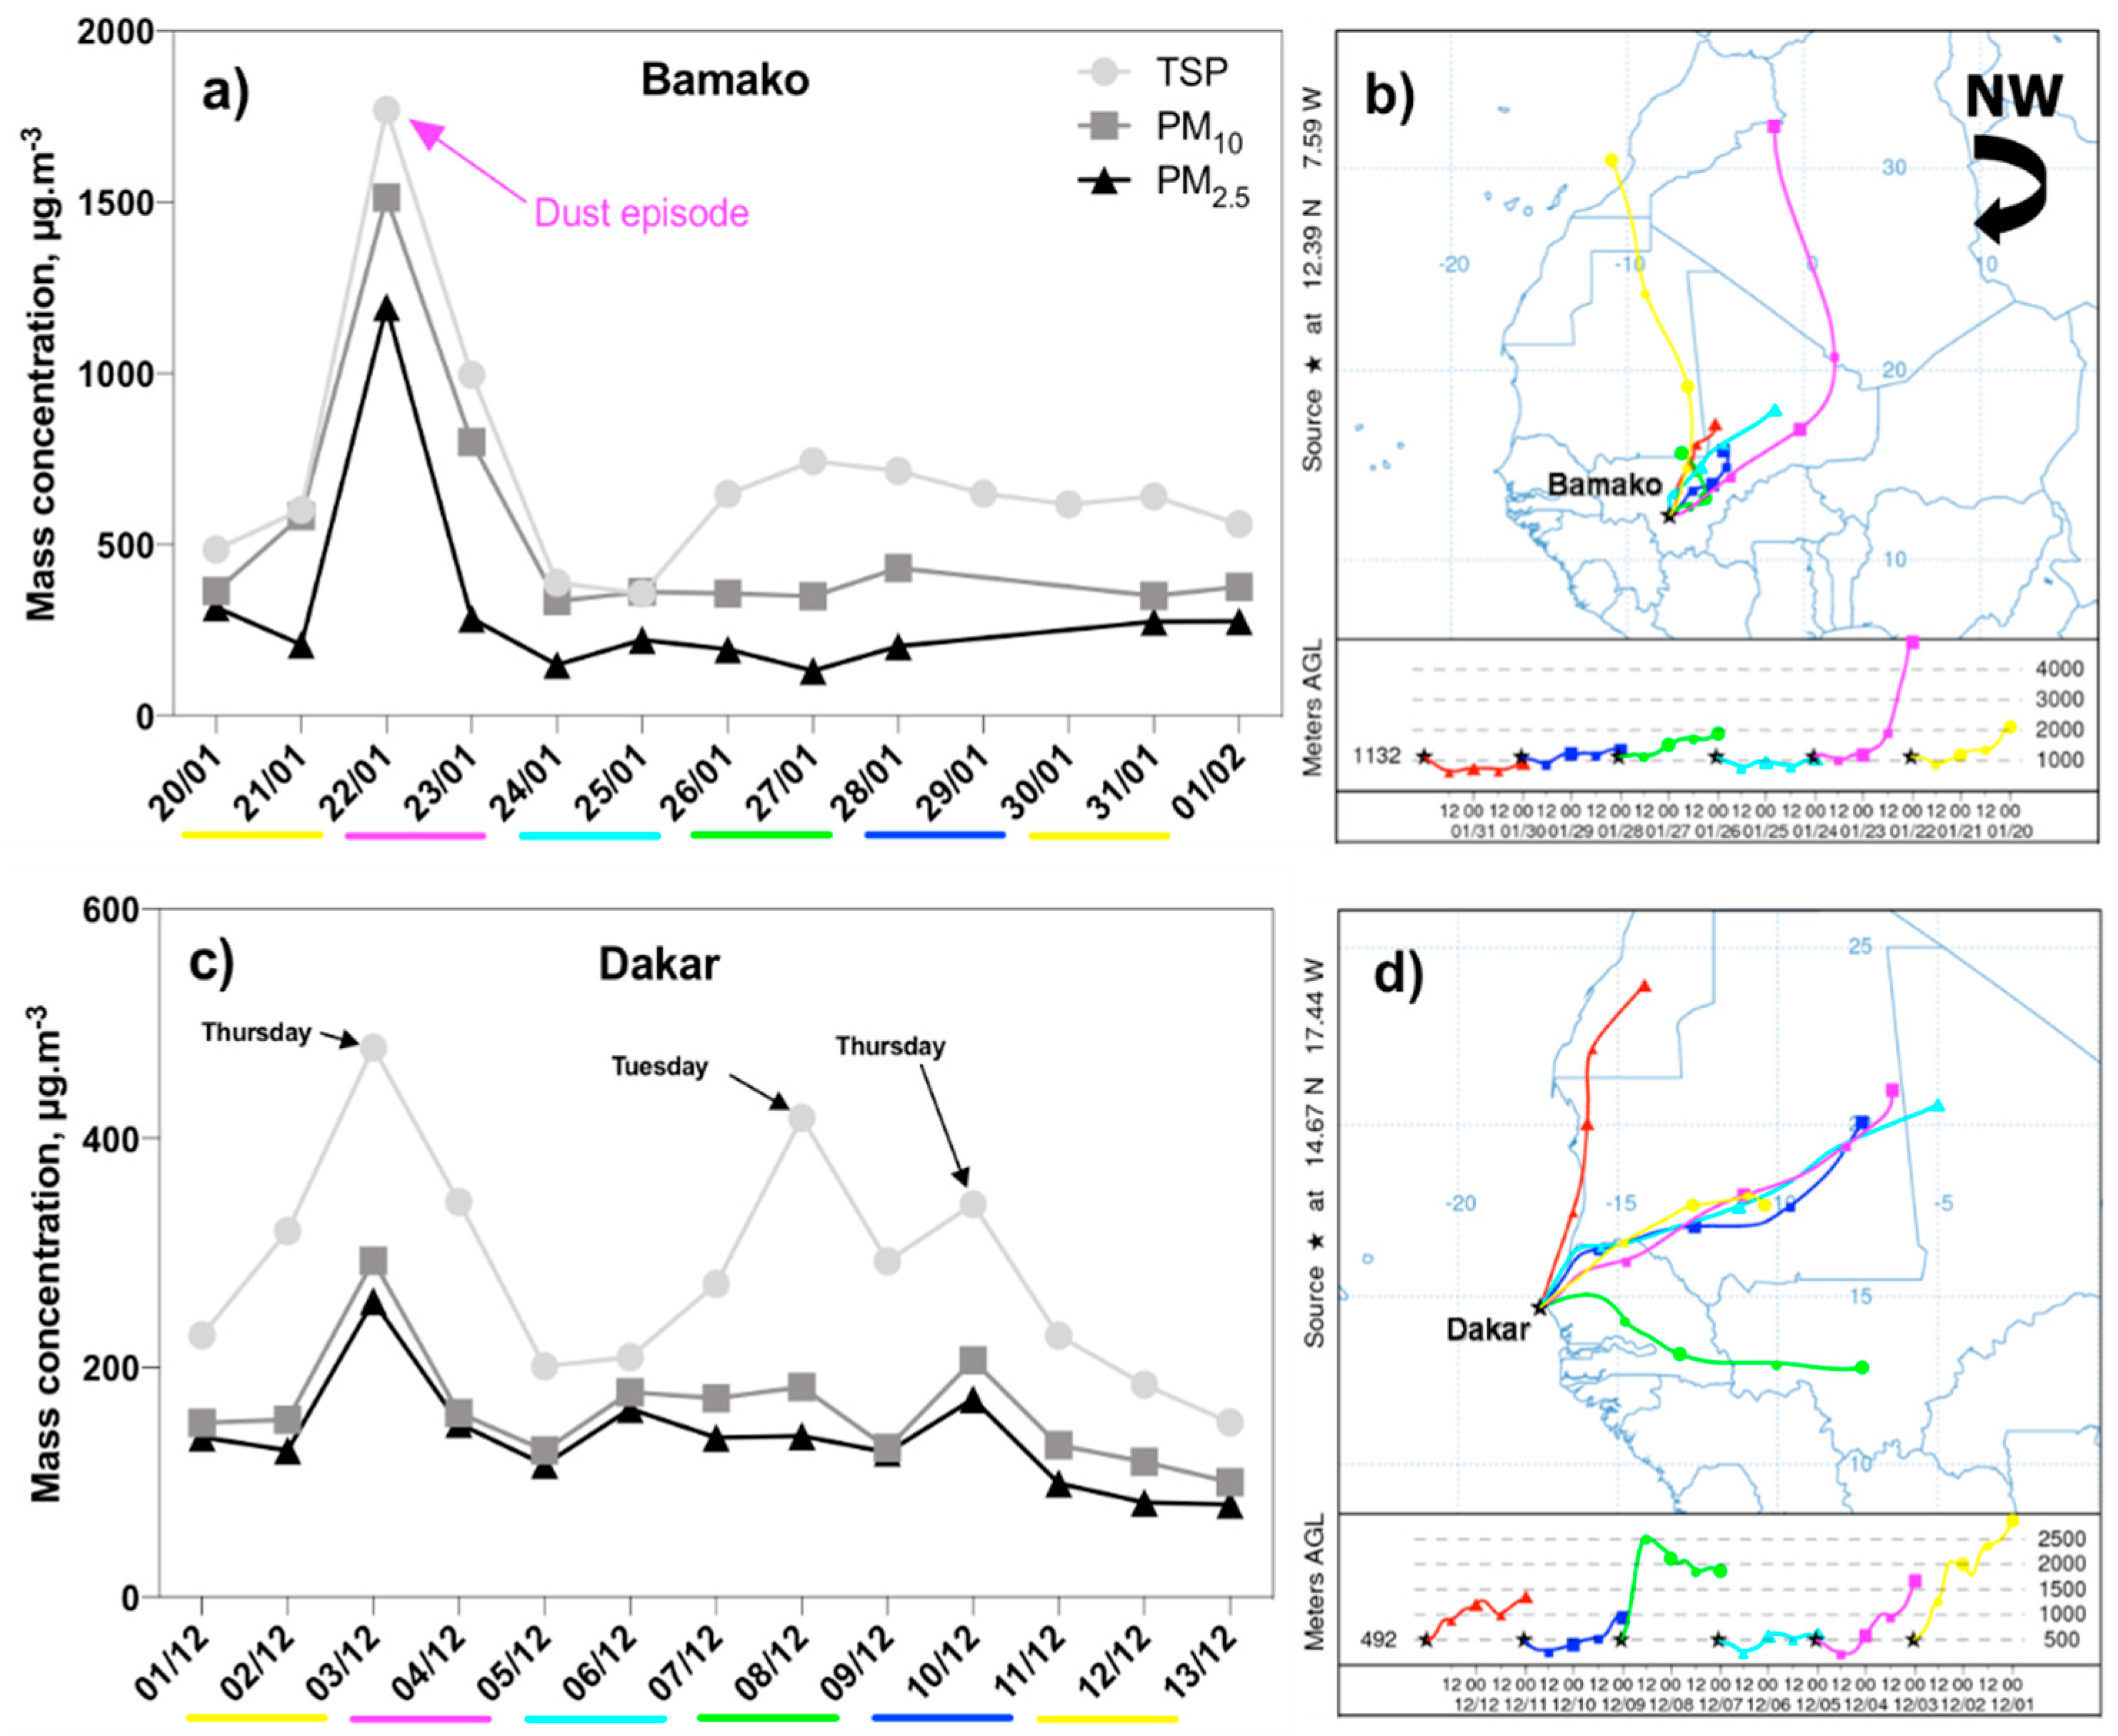
Figure 4 depicts the PM2.5, PM10, and TSP concentrations collected during the POLCA campaigns in Bamako and Dakar, as well as the 48-hour back trajectories analysis from the Hybrid Single-Particle Lagrangian Intergrated Trajectory (HYSPLIT) modeling system [46]. On January 22nd, 2009, extreme daily values of 1769 µg.m-3 for TSP, 1513 µg.m-3 for PM10, and 1194 µg.m-3 for PM2.5 were measured in Bamako (Figure 4a): the HYSPLIT back-trajectories indicated that these high values were caused by a Saharan dust event that occurred that day. According to Figure 4b, the air mass that was stagnating over Bamako at the beginning of the measurements (January 22-23) was coming from the Southwest part of Algeria and had passed over the Great Western Erg. The dust episode has an impact on all PM modes. The average daily PM concentrations remain very high after the dust event (583 µg.m-3 for TSP, 390 µg.m-3 for PM10, and 219 µg.m-3 for PM2.5). These high values are comparable to those found in Abidjan (Côte d’Ivoire) at a site representative of domestic fires during the wet season [47].
The average daily PM concentrations in Dakar ranged from 152 to 479 µg.m-3 for TSP, 82 to 293 µg.m-3 for PM10, and 81 to 258 µg.m-3 for PM2.5 (Figure 4c). These values are comparable to those measured in Conakry (Guinea) in 2004 during the Harmattan period (winds blowing northeast from January to February), namely 80-358 µg.m-3 for PM10 and 38-177 µg.m-3 for PM2.5 [11]. The average PM2.5 concentration (138.2 ± 12.7 µg.m-3) in Dakar is also in the same order of magnitude as the 104.1 µg.m-3 value found at the Cotonou traffic site during the wet season [47]. With the exception of December 11-13, 2009, when air masses passed over the Atlantic Ocean before arriving in Dakar, most air mass back trajectories were from continental origin, implying a mix of sources (dust, biomass burning, and anthropogenic) that may explain the high measured PM concentration during the measurement period (Figure 4d).
Table 1 summarizes the statistics (arithmetic mean, standard deviation and percentage in total mass) of measured mass concentration of chemical composition in Bamako and Dakar. Figures S5 and S6 show the average daily evolution of OC (Organic Carbon), BC (Black Carbon), major inorganic ions and twenty-two metals measured in PM2.5, PM10, and TSP.
In general, OC, BC, metals components, and inorganic ions account for 15-37%, 3-10%, 7-12%, and 3-6% of PM2.5, PM10 and TSP in Bamako, respectively, whereas these percentages are 22-26%, 7-11%, 6-9%, and 13-25% in Dakar (Table 1). Total carbon (OC+BC) was the most abundant component in the atmospheric particle composition, accounting for 18-47% in Bamako and 32-37% in Dakar. These results are consistent with the values reported for urban aerosols by Putaud et al. [48], Querol et al. [49], and Yu et al. [50], who estimated contributions of 20-40% and 25-50% to the ambient PM10 and PM2.5 mass, respectively. The average BC(OC) concentrations in Bamako for the entire period were 23.3(102.4) µg.m-3 for TSP, 18.8(82.4) µg.m-3 for PM10, and 27.1(102.4) µg.m-3 for PM2.5. In Dakar, the average BC(OC) concentrations were 20.1(69.2) µg.m-3 for TSP, 16.4(34.9) µg.m-3 for PM10, and 15.9(35.8) µg.m-3 for PM2.5. Results indicated that, the BC to OC ratio is higher in Dakar (0.29-0.47) than in Bamako (0.23-0.26). Figure S5 shows that during the dust event in Bamako, carbonaceous particles significantly decrease while elements associated with mineral dust significantly increase (especially in TSP and PM10 fractions), highlighting the impact of high dust concentrations on carbonaceous measurements.
As in Bamako, carbonaceous aerosols (BC+OC) are the dominant elements in Dakar, accounting for 32-37% of total mass (Table 1). This is consistent with the findings of Val et al. [8], who discovered a high total carbon content at the same sites, which is typical of urban areas. The second major element, water-soluble inorganic ions, account for 13% of TSP, 25% of PM10, and 16% of PM2.5. Metal mass concentrations range from 8.4 to 20.2 µg.m-3, representing 6 to 9% of total mass, regardless of size fraction. Aside from the location of the measurement sites in the Sahara and Sahel regions, Bamako and to a lesser extent Dakar, are characterized by a large number of unpaved roads, which favor particle resuspension from urban sources such as traffic.
The concentration levels for all components were more important in Bamako than in Dakar, except for the water-soluble compounds for which concentrations in Dakar were 2-6 times higher than in Bamako. This is related to differences in location and meteorology, since Bamako is located in a basin under strong influence of continental air masses, while Dakar is a typical coastal site with high impact of sea breeze which facilitates pollutant dispersion.

3.2. Identification and Apportionment of Sources

3.2.1. Enrichment Factor Calculations

In this section, we calculate Enrichment factors (EF), which are indicators for interpretating the metal element contributions in each source category. Enrichment factors of atmospheric elements were calculated as the ratio of the concentration of an element X to the concentration of a reference element in an aerosol sample compared to the same ratio in average upper crust geological samples [51], as given in the formula:
E F = X E r e f a e r o s o l X E r e f c r u s t
Where X and Eref respectively refer to the concentration (in ppb) of element X and the reference element. Many elements (Al, Ti, Si, Fe, Mn, and Sr), mostly of soil origin are used as references for Eref [11,18,52]. EF interpretations widely vary according to authors, due to the uncertainties associated with reference elements.
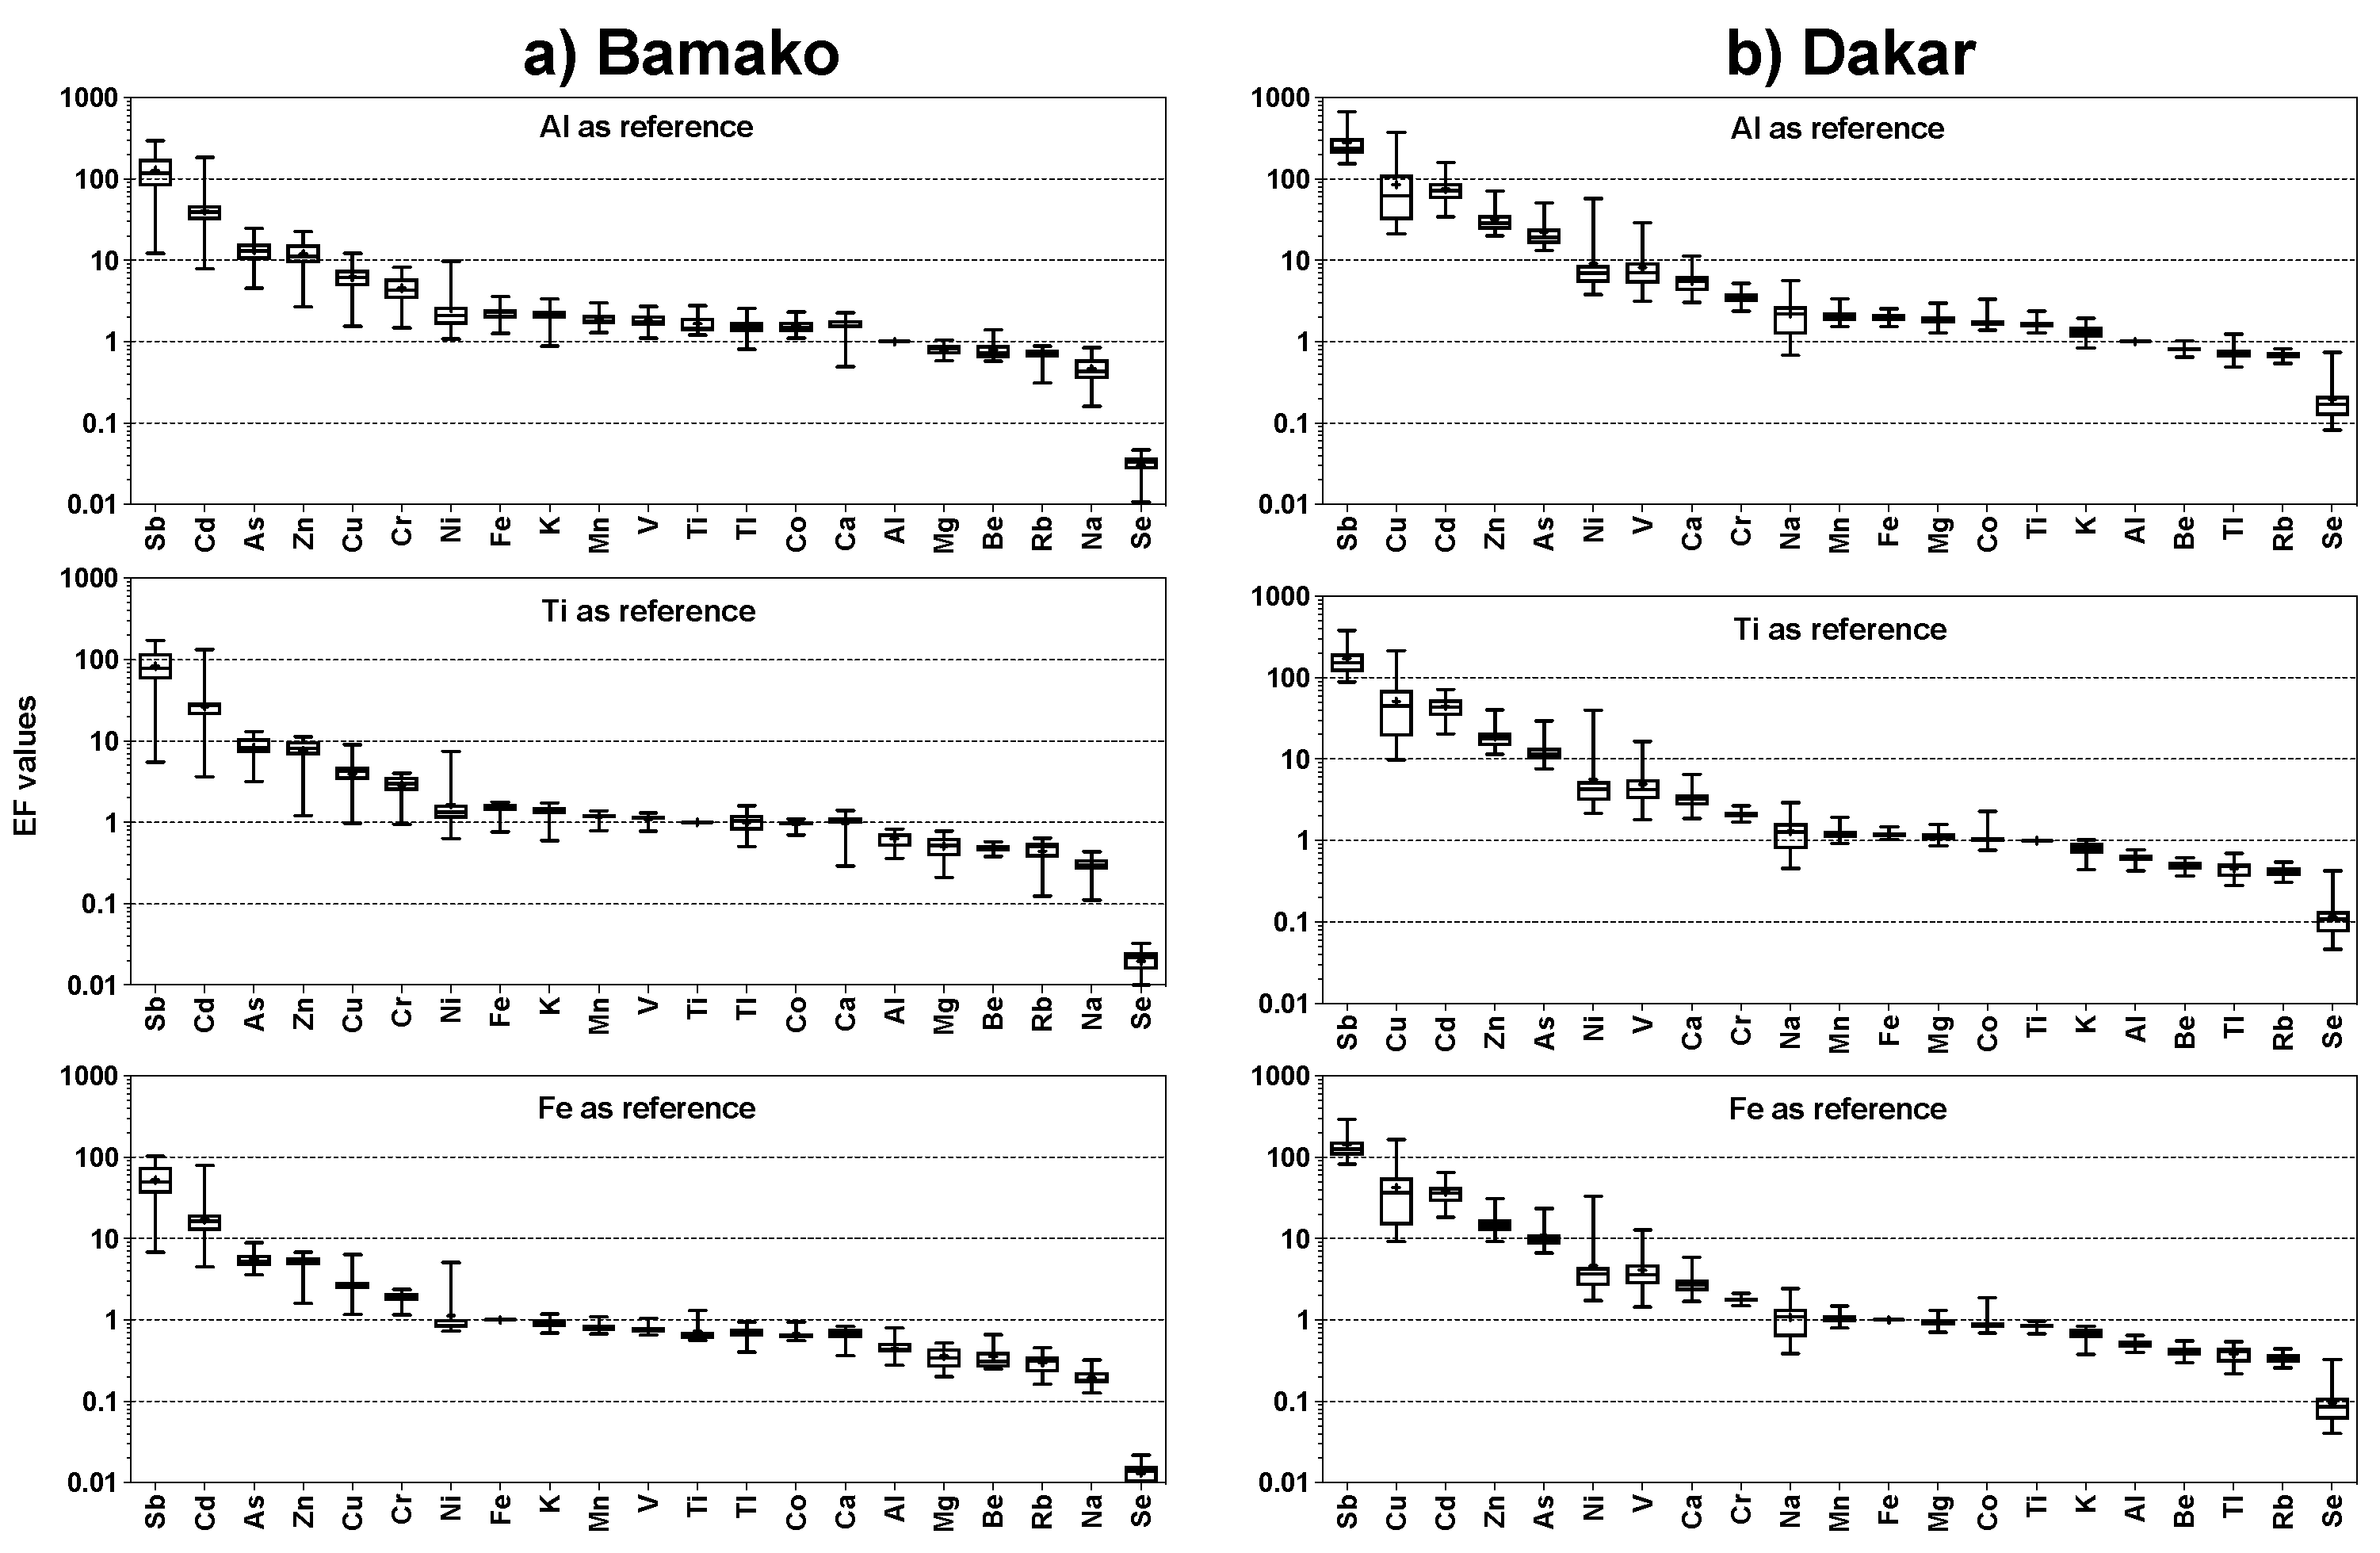
The results obtained for Bamako and Dakar are reported in Figure 5. EF calculations are made using Al, Fe and Ti as crustal references [18,51]. Alleman et al. [35] proposed a classification of sources based on EF, which we used in our study. Elements with EF values less than 5 (Al, Co, Cr, Fe, K, Mg, Mn, Na, Rb, Ti, Be, and Tl), regardless of the reference element, are considered of natural origin, whereas elements with EF values greater than 50 (Sb, Cd, and Cu) are generally from anthropogenic activities. Elements with intermediate EF values (between 5 and 50) could originate from both natural and anthropogenic emissions (As, Ca, Ni, V, and Zn).

3.2.2. PCA for Source Identification

The factor loadings after rotation for Bamako and Dakar are reported in Table 2. The number of optimal Principal Components (PCs) for each measurement site is determined based on the Eigenvalue, which represents the amount of variance explained by each PC greater than one. The table also displays the variability percentage, which expresses the contribution of each principal component, as well as the cumulative percentage, which represents the progressive accumulation of the variability percentage up to 100%. PCA identified five PCs (PC1 to PC5) or sources in both Bamako and Dakar, accounting for 92.9% and 89.5% of the variance, respectively. The factor loadings represent correlations between rotated principal components (PCs) and compounds. Factor loadings greater than 0.600 (highlighted in bold) are considered strong, while those between 0.300 and 0.600 (underlined) are considered moderate [53]. Some compounds have a strong relationship with a specific PC. If these compounds are known to be characteristic of a specific air pollution source, then that source is associated to this PC. Table 3 depicts the possible associations between PCs and pollution sources based on the characteristics of the compounds. However, it is not always possible to link clearly a source to a PC. In this case, a prior knowledge of the sampling sites and their possible sources is crucial.

3.2.3. Source Apportionment via PMF

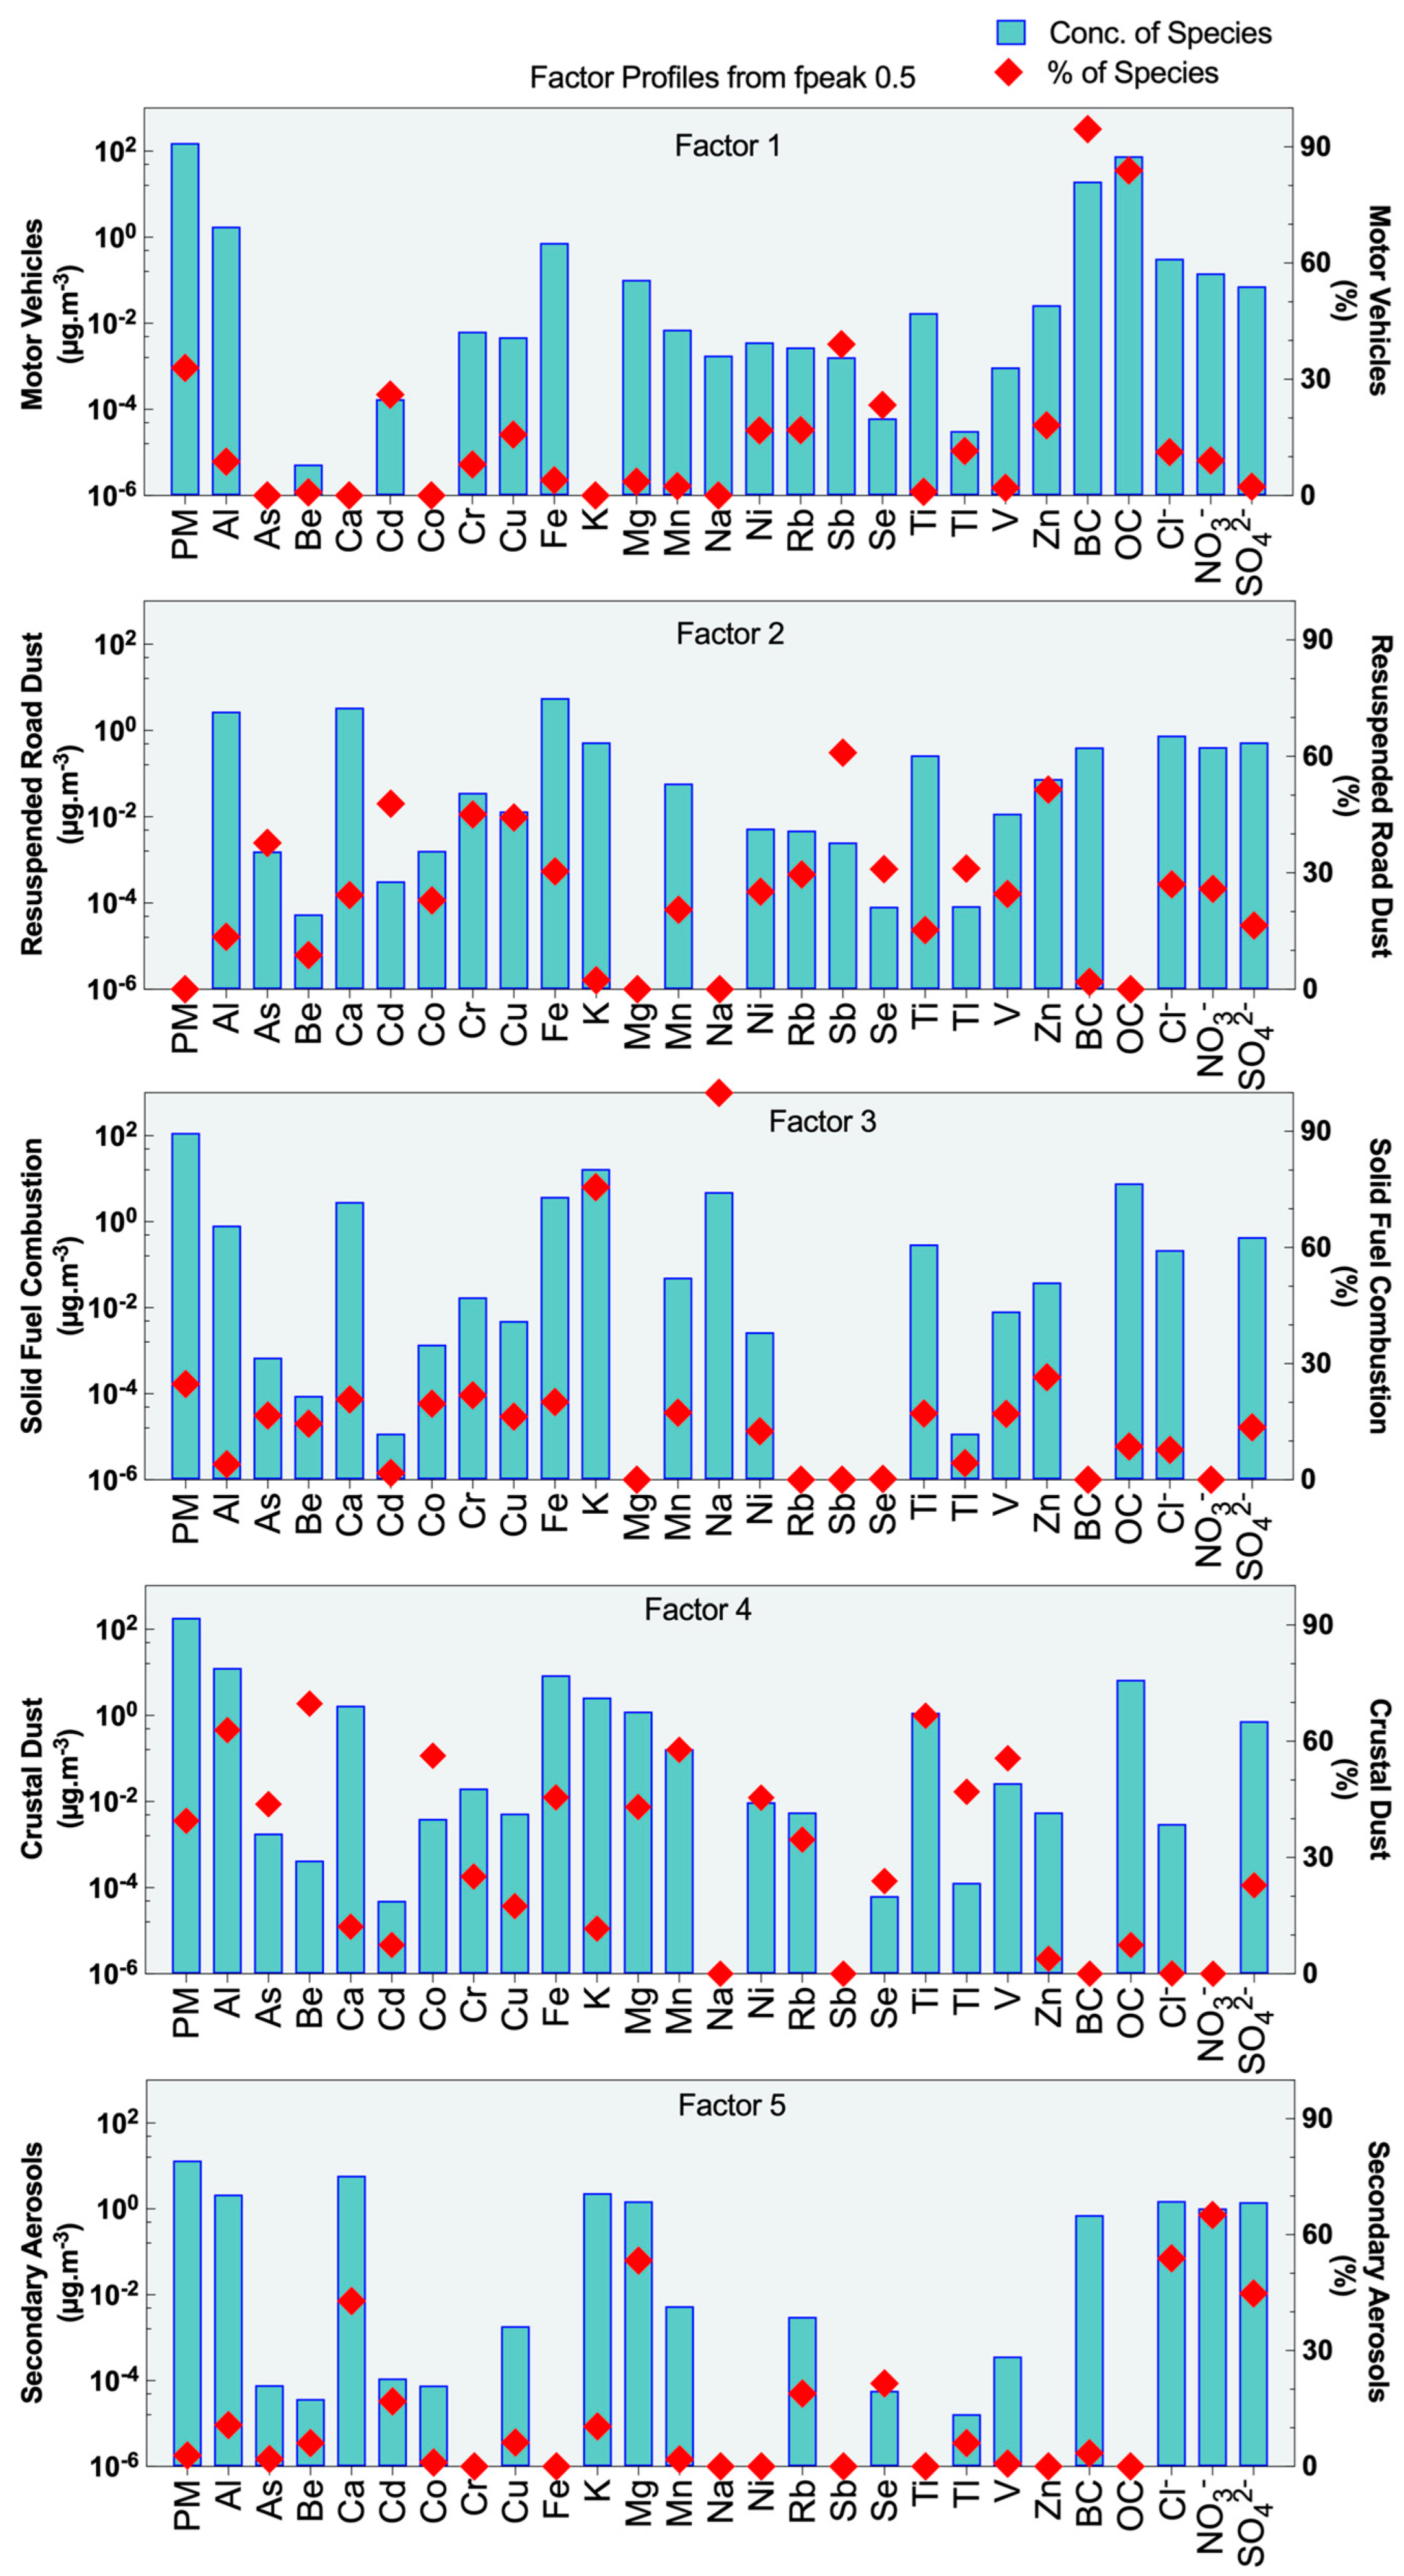
The PMF was running in various configurations, testing a variety of factors (3 to 7 factors for each set of samples). The optimum solutions for the base run were obtained using 5 factors or sources in both Bamako and Dakar, matching the number of principal components (PCs) obtained using PCA. The correlations between the PCs obtained with PCA and the factors derived from the PMF receptor model were calculated to verify the coherence of these source identifications (Table 4). The two methods show a strong correspondence, which allows an investigation of the source profiles in Bamako and Dakar. The goal is to identify the nature of the sources by calculating their relative contribution to each of the chemical compounds.

Bamako

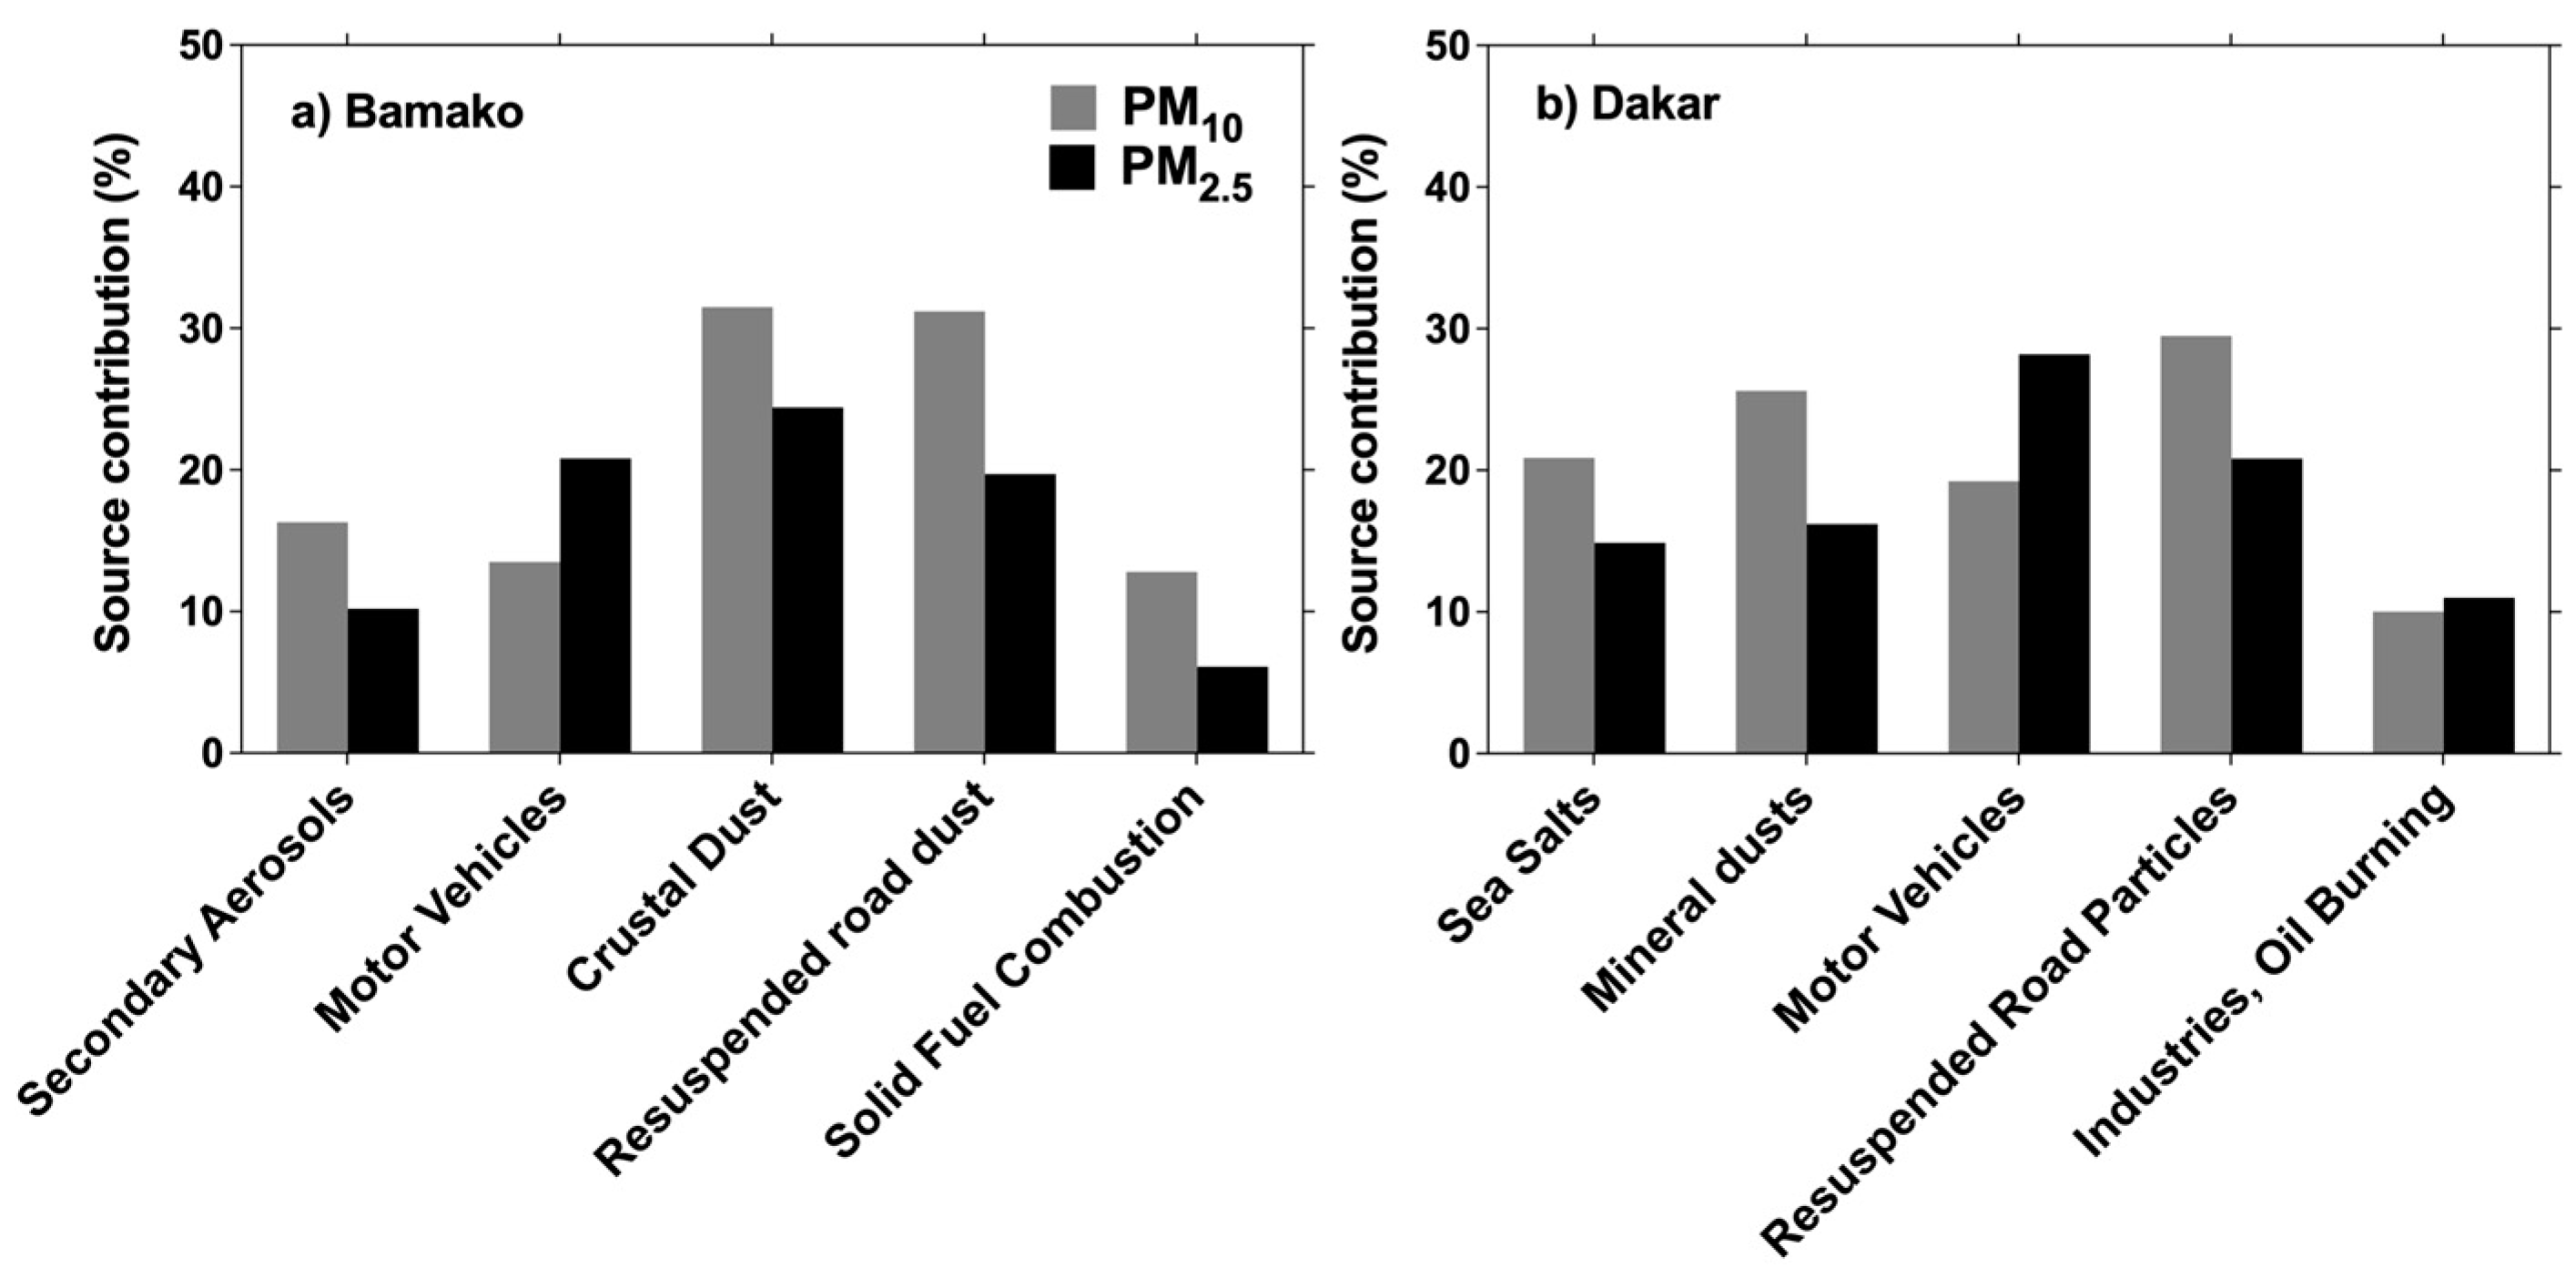
Motor vehicles: high factor loadings (0.742-0.753) are seen for in PCA in Table 2 and high contributions (83-94%) in PMF (Figure 6), both for OC and BC, which can be linked with fuel combustion emissions [54]. Several authors [55,56,57] have reported OC/BC mass concentration ratios of 1.1 for traffic emissions, 3.3 for secondary organic carbon formation, 6.6 for biofuel combustion and 12 for long-range transport. The OC/BC ratio for this factor ranges from 3.8 to 4.4 in Table 2, indicating probable mixtures of various combustion sources such as two-wheel two-stroke (using a mixture of oil and gasoline), personal and public car emissions. This source accounted for 13 and 20% of total PM10 and PM2.5, respectively (Figure 8a).
Resuspended road dust: In PMF, Sb (61%), Zn (51%) and Cd (48%) dominate the factor loadings. In the PCA results, Sb and Zn have also the highest factor loadings (0.892 and 0.698, respectively) (Table 2). Sb, Zn and Cd trends in Bamako did not show peaks during the dust episode (Figure S5), indicating that these elements are primarily emitted by anthropogenic activities such as brakes and tyre wear, fuel combustion, or biomass burning [58,59]. All of these point sources were present near the site, with open waste burning occurring in Bamako in the evenings. Furthermore, the high EF values reported in Figure 5 support the anthropogenic origin of these elements [35]. Sb, Zn, and Cd emissions from tire and brake wear have been well documented [60,61] and the majority of roads surrounding the measurement site were unpaved. This factor contributed approximately 26% of total PM2.5 and 30% of total PM10.
Solid fuel combustion: The factor was notable for its high Na and K contributions to total PM mass, which were around 99% for Na and 75% for K in the PMF analysis (Figure 6). Furthermore, in the PCA, these two species have the highest factor loadings (0.879-0.930) (Table 2, PC2). K is a tracer typical for emissions from wood combustion [62]. Zn, Fe, Cr and Co are also abundant in this factor, accounting for 20% of the total mass of each species, reflecting the importance of emissions from common local activities at the sampling site, such as street food preparation, traditional forges, smelters and unidentified combustion sources. We can conclude that this factor is most likely related to solid fuel combustions due to the mix of anthropogenic combustion sources. This source accounts for 16% and 13% of the total PM2.5 and PM10 mass concentrations, respectively.
Crustal dust: The factor is characterized by high contribution of Ti (67%), Be (70%), Mn (58%), Co (56%), V (56 %), Al (63%), and Fe (46%) (Figure 6), with the majority of them exhibiting high loadings in the PCA results (Table 2, PC4). Metals were the second most abundant component in Bamako. Al was the most abundant metal found in all particle modes (Table 1), with average daily concentrations of 17.9 µg.m-3 in PM2.5, 22.2 µg.m-3 in PM10, and 21.2 µg.m-3 in TSP, followed by Fe, which had values of 14.3 µg.m-3 in PM2.5, 20.4 µg.m-3 in PM10, and 21.9 µg.m-3 in TSP. During the dust episode, daily Al and Fe concentrations rise by nearly a factor of 13 (from 6.3 to 82.2 µg.m-3) and 12 (from 5.3 to 66.7 µg.m-3), respectively. The peak concentrations of Al and Fe during the dust episode (Figure S5) are very close to the values reported by Adepetu et al. [63] in typical continental crustal rocks of 81.3 and 50 µg.m-3, respectively. The average Fe/Al ratio varies from 0.79 (PM2.5) to 1.03 (TSP). These values are comparable to those reported in the literature for typical crustal dust elements [62,64], which is consistent with their enrichment factors (EF) close to unity, regardless of the reference element (Figure 5). This source is most likely due to Saharan desert crustal dust predominating in PM concentrations during dust storms. Crustal dust was the dominant source in the PM10 (30%), but remains important in PM2.5 fraction (24%).
Secondary aerosols: The factor contains significant contributions from NO3- (65%), Cl- and Mg (53%), SO42- (45%), and Ca (43%) (Figure 6). The PCA results also show that some of these compounds have high factor loadings (0.908 for NO3- and 0.728 for Cl-) and Ca has moderate loading (0.443) (Table 2). Except for Mg and Ca, none of these water-soluble species showed a peak during the dust episode (Figure S5), indicating sources other than dust. NO3- and Cl- could can also be associated with anthropogenic activities [62,65]. Because the concentrations of non-soluble Mg and Ca peak during the dust episode, a fraction of these two compounds can be considered from crustal dust. Because Bamako is located in a basin with low wind speeds and high temperatures that favor gas-to-particle conversion mechanisms [66], chemical processes in dust wells present during the field campaign may result in secondary aerosol formation. This source accounts for 10% and 16% of the total PM2.5 and PM10 emissions, respectively.
Figure 6. Profiles of the five factors identified by the PMF in Bamako.
Preprints 69743 g006

Dakar

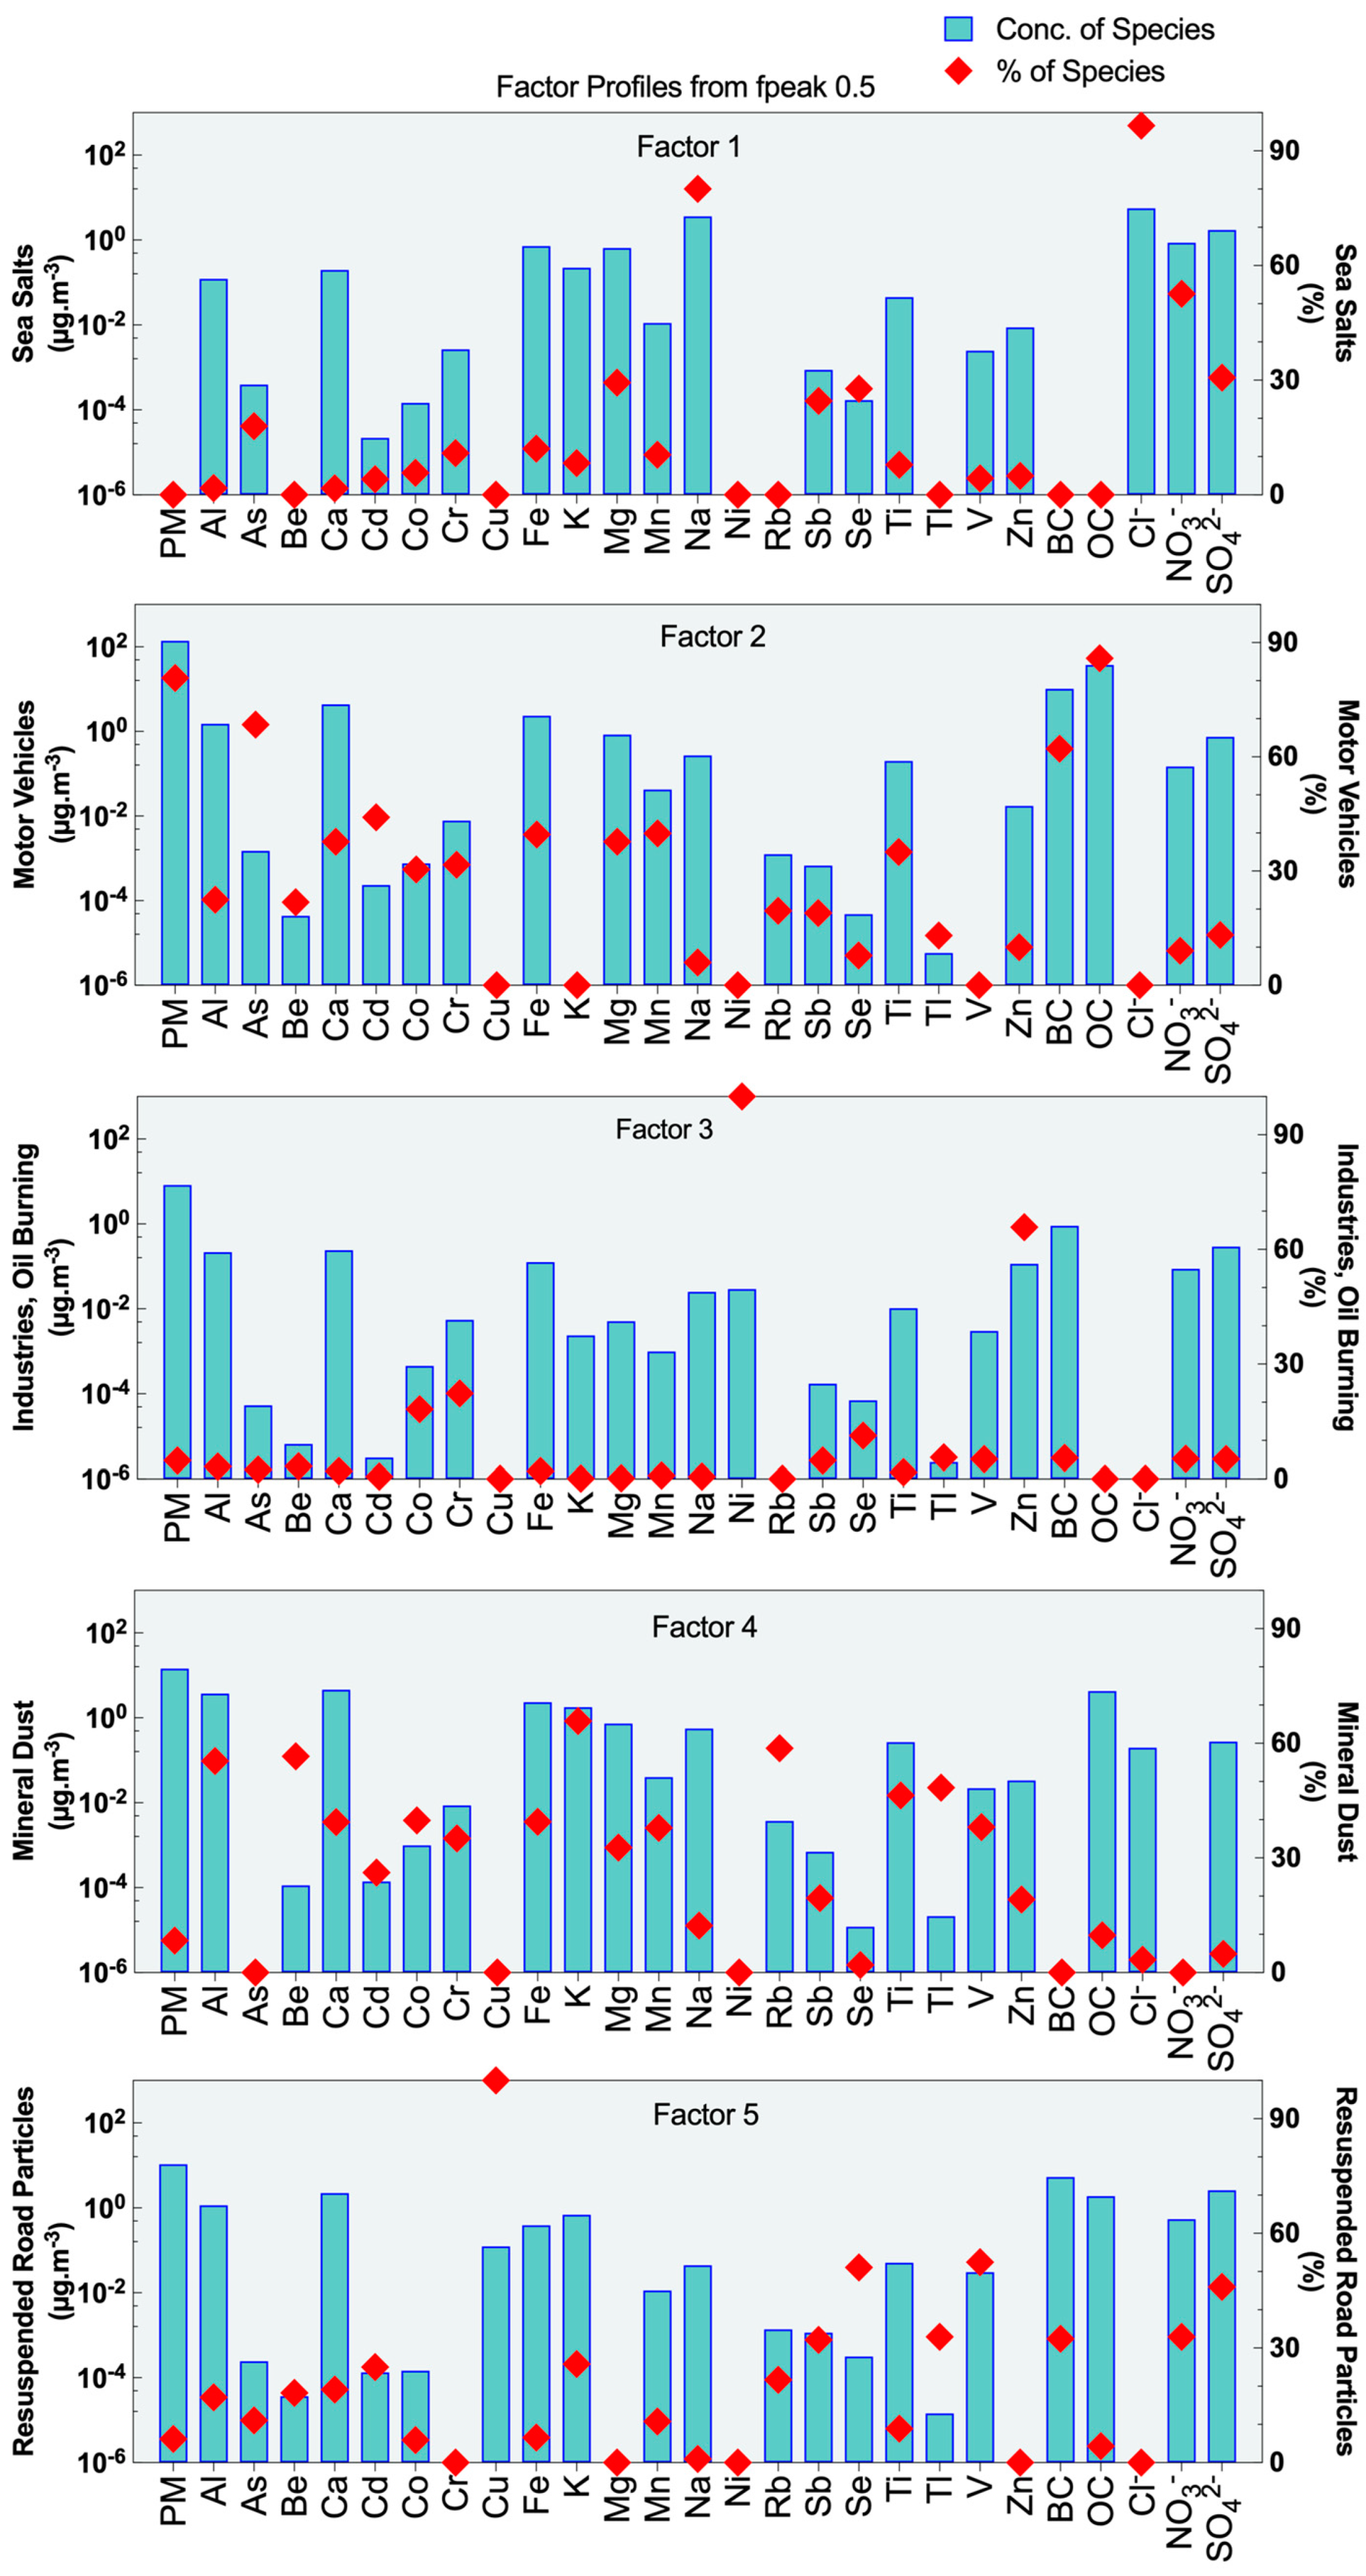
Sea salts: This source is characterized by high contribution of Cl (97%), Na (80%), and moderate presence of Mg (29%) (Figure 7). PCA analysis also reveals that these elements have high factor loadings (0.906, 0.782, and 0.441, respectively) (Table 2, PC3). The ratio Na/Mg ratio was investigated to confirm the marine origin of these elements. The calculated ratio of 8.3 is very close to the 8.4 found in sea water [67]. Yuan et al. [68] and Alleman et al. [35] also found values of 8.4 and 8.5, respectively. This source also contains NO3- (53%) and SO42- (31%) species with loading in the PCA of 0.832 and 0.529, respectively. As a result of condensation processes, sulfate and nitrate may be found in marine aerosols [69]. This is consistent with Dakar being surrounded on the three sides by the Atlantic Ocean (Figure 1). Sea salts represent 20% of the PM10 and 15% of the PM2.5 (Figure 8b).
Motor Vehicles: This source contains 86% of total OC and 62% of total BC (Figure 7), and PCA results show the highest factor loadings of 0.807 and 0.789 for these species, respectively (Table 2, PC4). These species are common combustion tracers, such as motor vehicle emissions [69,70]. The OC/BC ratio of 3.3 is comparable to the value found in Pio et al. [57] for traffic diesel and gasoline emissions. It should be noted, that diesel old vehicles account for more than 60% of Dakar’s public transportation. This source contributed for about 19% and 28% of total PM2.5 and PM10 mass concentrations, respectively.
Industries, Oil burning: The source is characterized by high contribution of Ni (100%) and Zn (66%) and moderate contributions of Cr and Co (Figure 7). PCA analysis also reveals high factor loading for Ni (0.949), Cr (0.658), moderate loading for Co (0.596) (Table 2, PC5), suggesting emissions form oil combustion [69,71], related to shipping activities at the port of Dakar located near the site. The presence of additional species (Zn, Cr, Co) is most likely related to industrial activities. The Dakar industrial area is about one kilometer northeast of the measurement site, and winds from this direction prevailed on average throughout the campaign (Figure 1). The industries and oil burning sources accounted for approximately 10% of the measured PM2.5 and PM10 concentrations.
Mineral dust: The factor reveals high loadings of Al, Ti and Fe in PCA, generally greater than 0.6 (Table 2, PC1), and contains high contributions ranging from 40% to 60% in PMF (Figure 7). Additional elements such as Rb, Co, Cr and Mn are also abundant in this factor. EF calculations (Figure 5) show that all of these elements have values close to unity, confirming their natural origin [11,18,69,72]. This result is consistent with the combined mineral dust and resuspended particles hypothesis for this source. Mineral dust contributes approximately 25% and 16% of the aerosol mass on average for PM10 and PM2.5 concentrations, respectively.
Resuspended road particles: The factor has high contribution of Cu (100%), V (52%), Se (51%), and moderate contribution of SO42- (46%), Cd, K, Sb, Tl, BC, and NO3- (25-30%) (Figure 7). PCA also exhibits significant loadings of V, SO42-, Cd, Zn, and moderate loadings of Se, K, Sb, Tl, BC, NO3- (Table 2, PC2). Cu, Sb, and Cd are thought to be anthropogenic due to their high EF values (>50) (Figure 5). Cu and Sb are components of brake linings [60,61], while Se, K are good tracers for coal/wood combustion [73,74]. The presence of various compounds in this factor allows for the possibility of mixing solid fuel combustion with other minor sources such as car repair, restoration, and copper smelting activities around the site. The Dakar measurement site is very close to the two biggest car parks in the city. In the Dakar traffic site, resuspended road particles are one of the most significant sources of PM10 (29%) and PM2.5 (21%).
Figure 7. Profiles of the five factors identified by the PMF in Dakar.
Preprints 69743 g007
Figure 8. PM10 and PM2.5 source contributions estimated by PMF in a) Bamako and b) Dakar.
Preprints 69743 g008

4. Conclusions

This paper provides an exhaustive analysis of the chemical composition of particulate matter as well as an apportionment of air pollution sources in two African cities (Bamako in Mali and Dakar in Senegal). Our methodology began with identifying the source profiles using Principal Component Analysis (PCA). The Positive Matrix Factor (PMF) receptor model was then used to quantify these sources. These techniques allow to characterize and apportion five principal sources of particle emissions (PM2.5-PM10) in Bamako: crustal dust (24-30%), resuspended road dust (26-30%) relayed to anthropogenic activities, solid fuel combustion (16-13%), motor vehicles (20-13%) and secondary aerosols (10-16%). In Dakar, the main sources are resuspended road particles (21-29%), mineral dust (16-25%), sea salts (15-20%), motor vehicle emissions (28-19%), and industries and oil combustion (11-10%).
Anthropogenic sources dominate at both urban sites, accounting for up to 60% of the PM2.5 particles. The measured PM2.5 and PM10 concentrations exceeded the WHO’s 24-hour air quality guidelines of 25 and 50 µg.m-3, respectively. These measurements were obtained in 2009: this detailed analysis could serve as a basis for future studies of changes in the composition of particulate matter in African studies since the late 2000s. Long-term monitoring is needed to improve our understanding and quantification of PM sources, because atmospheric pollutants in West Africa vary with the seasons and are often poorly documented, posing a serious problem for human health and climate change.

Supplementary Materials

The following supporting information can be downloaded at the website of this paper posted on Preprints.org.

Author Contributions

Conceptualization, T.D. and C.L.; methodology, T.D., C.L. and C.G.-L.; validation, T.D., E.G. and C.L.; formal analysis, T.D., M.-R.L.-O., E.G. and C.Z.; investigation, T.D., C.L., C.G.-L., S.A.N., V.Y. and M.-R.L.-O.; writing—original draft preparation, T.D., C.L. and C.G.-L.; writing—review and editing, T.D., C.L. and C.G.; visualization, T.D.; supervision, C.L. All authors have read and agreed to the published version of the manuscript.

Funding

This research was funded by the CORUS 2 program (Cooperation for Academic and Scientific Research), grant number 94-2009.

Institutional Review Board Statement

Not applicable.

Informed Consent Statement

Not applicable.

Data Availability Statement

The data presented in this study are available on request from the corresponding author.

Acknowledgments

The authors would like to thank the CORUS2 POLCA and AMMA2 programs. We also want to thank the Paul Sabatier University for their financial support, the University of Bamako and the Laboratory of Atmospheric Physics and Oceanographic - Simeon Fongang at the University Cheikh Anta Diop of Dakar for their collaboration. Cyril Zouiten and the GET laboratory (Géosciences Environnement Toulouse) are acknowledged for element trace analysis.

Conflicts of Interest

The authors declare no conflict of interest.

References

  1. Dockery, D.W.; Pope, C.A. Acute Respiratory Effects of Particulate Air Pollution. Annual Review of Public Health, 1994, 15, 107–132. [Google Scholar] [CrossRef]
  2. Pope, C.A.; 3rd, Burnett, R.T.; Thun, M.J.; Calle, E.E.; Krewski, D.; Ito, K.; Thurston, G.D. Lung cancer, cardiopulmonary mortality, and long-term exposure to fine particulate air pollution. JAMA 2002, 287, 1132–1141. [Google Scholar] [CrossRef]
  3. Hamanaka, RB; Mutlu, GM. Particulate Matter Air Pollution: Effects on the Cardiovascular System. Front Endocrinol (Lausanne), 2018, 9:680. doi: 10.3389/fendo.2018.00680. PMID: 30505291; PMCID: PMC6250783.
  4. IPCC, 2007: Climate Change 2007: Synthesis Report. Geneva: IPCC. ISBN 2-9169-122-4.
  5. Huang, S.-L.; Hsu, M.-K.; Chan, C.-C. Effects of Submicrometer Particle Compositions on Cytokine Production and Lipid Peroxidation of Human Bronchial Epithelial Cells. Environmental Health Perspectives, 2007, 111, 478–482. [Google Scholar] [CrossRef]
  6. Seagrave, J.; McDonald, J.D.; Bedrick, E.; Edgerton, E.S.; Gigliotti, A.P.; Jansen, J.J.; Ke, L.; Naeher, L.P.; Seilkop, S.K.; Zheng, M.; Mauderly, J.L. Lung toxicity of ambient particulate matter from southeastern U.S. sites with different contributing sources: relationships between composition and effects. Environ. Health Perspect., 2006, 114, 1387–1393. [Google Scholar] [CrossRef]
  7. Happo, M.S.; Hirvonen, M.-R.; Halinen, A.I.; Jalava, P.I.; Pennanen, A.S.; Sillanpaa, M.; Hillamo, R.; Salonen, R.O. Chemical compositions responsible for inflammation and tissue damage in the mouse lung by coarse and fine particulate samples from contrasting air pollution in Europe. Inhal. Toxicol., 2008, 20, 1215–1231. [Google Scholar] [CrossRef]
  8. Val, S.; Liousse, C.; Doumbia, E.H.T.; Galy-Lacaux, C.; Cachier, H.; Marchand, N.; Badel, A.; Gardrat, E.; Sylvestre, A. , Baeza-Squiban, A. Physico-chemical characterization of African urban aerosols (Bamako in Mali and Dakar in Senegal) and their toxic effects in human bronchial epithelial cells: description of a worrying situation. Particle and Fibre Toxicology, 2013, 10, 10. [Google Scholar] [CrossRef]
  9. Arku, R.E.; Vallarino, J.; Dionisio, K.L.; Willis, R.; Choi, H.; Wilson, J.G.; Hemphill, C.; Agyei-Mensah, S.; Spengler, J.D.; Ezzati, M. Characterizing air pollution in two low-income neighborhoods in Accra, Ghana. Science of The Total Environment, 2008, 402, 217–231. [Google Scholar] [CrossRef]
  10. Kouassi, K.S.; Billet, S.; Garçon, G.; Verdin, A.; Diouf, A.; Cazier, F.; Djaman, J.; Courcot, D.; Shirali, P. Oxidative damage induced in A549 cells by physically and chemically characterized air particulate matter (PM2.5) collected in Abidjan, Côte d’Ivoire. Journal of Applied Toxicology, 2010, 30, 310–320. [Google Scholar] [CrossRef]
  11. Weinstein, J.P.; Hedges, S.R.; Kimbrough, S. Characterization and aerosol mass balance of PM2.5 and PM10 collected in Conakry, Guinea during the 2004 Harmattan period. Chemosphere, 2010, 78, 980–988. [Google Scholar] [CrossRef]
  12. Dionisio, K.L.; Rooney, M.S.; Arku, R.E.; Friedman, A.B.; Hughes, A.F.; Vallarino, J.; Agyei-Mensah, S.; Spengler, J.D.; Ezzati, M. Within-Neighborhood Patterns and Sources of Particle Pollution: Mobile Monitoring and Geographic Information System Analysis in Four Communities in Accra, Ghana. Environmental Health Perspectives, 2010, 118, 607–613. [Google Scholar] [CrossRef]
  13. Assamoi, E.-M.; Liousse, C. A new inventory for two-wheel vehicle emissions in West Africa for 2002. Atmospheric Environment, 2010, 44, 3985–3996. [Google Scholar] [CrossRef]
  14. Doumbia, E.H.T.; Liousse, C.; Galy-Lacaux, C.; Ndiaye, S.A.; Diop, B.; Ouafo, M.; Assamoi, E.M.; Gardrat, E.; Castera, P.; Rosset, R.; Akpo, A.; Sigha, L. Real time black carbon measurements in West and Central Africa urban sites. Atmospheric Environment, 2012, 54, 529–537. [Google Scholar] [CrossRef]
  15. Mukherjee, A.; Agrawal, M. World air particulate matter: sources, distribution and health effects. Environ Chem Lett, 2017; 15, 283–309. [Google Scholar] [CrossRef]
  16. Bertrand, J.; Baudet, J.; Drochon, A. Importance des aérosols naturels en Afrique de l’Ouest. Journal de Recherhce Atmosphérique, 1974, 8, 845–860. [Google Scholar]
  17. Asubiojo, O.I.; Obioh, I.B.; Oluyemi, E.A.; Oluwole, A.F.; Spyrou, N.M.; Farooqi, A.S.; Arshed, W.; Akanle, O.A. Elemental characterization of airborne particulates at two Nigerian locations during the Harmattan season. Journal of Radioanalytical and Nuclear Chemistry Articles, 1993, 167, 283–293. [Google Scholar] [CrossRef]
  18. Eltayeb, M.A.H.; Injuk, J.; Maenhaut, W.; Van Grieken, R.E. Elemental composition of mineral aerosol generated from Sudan Sahara sand. Journal of atmospheric chemistry, 2001; 40, 247–273. [Google Scholar] [CrossRef]
  19. Gnamien, S.; Yoboué, V.; Liousse, C.; Ossohou, M.; Keita, S.; Bahino, J.; Siélé, S.; Diaby, L. Particulate Pollution in Korhogo and Abidjan (Cote d’Ivoire) during the Dry Season. Aerosol Air Qual. Res., 2021, 21, 200201. [Google Scholar] [CrossRef]
  20. Larsen, R.K.; Baker, J.E. Source Apportionment of Polycyclic Aromatic Hydrocarbons in the Urban Atmosphere:  A Comparison of Three Methods. Environ. Sci. Technol., 2003, 37, 1873–1881. [Google Scholar] [CrossRef]
  21. Yang, H.; Yu, J.Z.; Ho, S.S.H.; Xu, J.; Wu, W.-S.; Wan, C.H.; Wang, Xiaodong; Wang, Xiaorong; Wang, L. The chemical composition of inorganic and carbonaceous materials in PM2.5 in Nanjing, China. Atmospheric Environment 2005, 39, 3735–3749. [Google Scholar] [CrossRef]
  22. Xu, L.; Chen, X.; Chen, J.; Zhang, F.; He, C.; Du, K.; Wang, Y. Characterization of PM10 atmospheric aerosol at urban and urban background sites in Fuzhou city, China. Environmental Science and Pollution Research, 2012, 19, 1443–1453. [Google Scholar] [CrossRef]
  23. Gordon, G.E. Receptor models. Environ. Sci. Technol., 1991, 22, 1132–1142. [Google Scholar] [CrossRef]
  24. Hopke, P.K. An introduction to receptor modeling. Chemometrics and Intelligent Laboratory Systems, 1991, 10, 21–43. [Google Scholar] [CrossRef]
  25. Paatero, P.; Tapper, U. Analysis of different modes of factor analysis as least squares fit problems. Chemometrics and Intelligent Laboratory Systems, 1993, 18, 183–194. [Google Scholar] [CrossRef]
  26. Watson, J.G.; Chow, J.C. Particulate pattern recognition. In Introduction to Environmental Forensics, Murphy, B. L.; Morrison, R., Eds.; Academic Press: New York, NY, 2002, pp. 429-460.
  27. Zhang, R.; Han, Z.; Shen, Z.; Cao, J. Continuous measurement of number concentrations and elemental composition of aerosol particles for a dust storm event in Beijing. Advances in Atmospheric Sciences, 2008, 25, 89–95. [Google Scholar] [CrossRef]
  28. Adon, M.; Yoboue, V.; Galy-Lacaux, C.; Liousse, C.; Diop, B.; Doumbia, E.H.T.; Gardrat, E.; and Ndiaye, S.A. , 2016. Measurements of NO2, SO2, NH3, HNO3 and O3 in West Africa urban environments. Atmospheric Environment, 2016, 135, 31–40. [Google Scholar] [CrossRef]
  29. RGPH, Recensement Général de la Population et de l'Habitat du Mali. Institut National de la Statistique (INSTAT), 2009, https://demostaf.web.ined.fr/index.php/catalog/348.
  30. ANSD, Agence National de la Statistique et de la Démographie. Rapport national sur la Situation économique et sociale du Sénégal, Démographie, Edition 2009, https://www.ansd.sn/ressources/ses/chapitres/1-Demographie_2009.pdf.
  31. Ouafo-Leumbe, M.R.; Galy-Lacaux, C.; Liousse, C.; Pont, V.; Akpo, A.; Doumbia, E.H.T.; Gardrat, E.; Zouiten, C.; Sigha-Nkamdjou, L.; Edkodeck, G.E. Chemical composition and sources of atmospheric aerosols at Djougou (Benin). Meteorol. Atmos. Phys., 2018, 130, 591–609. [Google Scholar] [CrossRef]
  32. Lyamani, H.; Olmo, F.J.; Alados-Arboledas, L. Light scattering and absorption properties of aerosol particles in the urban environment of Granada, Spain. Atmospheric Environment, 2008, 42, 2630–2642. [Google Scholar] [CrossRef]
  33. Esteve, A.R.; Estellés, V.; Utrillas, M.P.; Martínez-Lozano, J.A. In-situ integrating nephelometer measurements of the scattering properties of atmospheric aerosols at an urban coastal site in western Mediterranean. Atmospheric Environment, 2012, 47, 43–50. [Google Scholar] [CrossRef]
  34. Adon, M.; Galy-Lacaux, C.; Yoboué, V.; Delon, C.; Lacaux, J.P.; Castera, P.; Gardrat, E.; Pienaar, J.; Al Ourabi, H.; Laouali, D.; others. Long term measurements of sulfur dioxide, nitrogen dioxide, ammonia, nitric acid and ozone in Africa using passive samplers. Atmos. Chem. Phys, 2010, 10, 7467-7487. [CrossRef]
  35. Alleman, L.Y.; Lamaison, L.; Perdrix, E.; Robache, A.; Galloo, J.-C. PM10 metal concentrations and source identification using positive matrix factorization and wind sectoring in a French industrial zone. Atmospheric Research, 2010, 96, 612–625. [Google Scholar] [CrossRef]
  36. Celo, V.; Dabek-Zlotorzynska, E.; Mathieu, D.; Okonskaia, I. Validation of simple microwave-assisted acid digestion method using microvessels for analysis of trace elements in atmospheric PM2.5 in monitoring and fingerprinting studies. The Open Chemical & Biomedical Methods Journal, 2010, 3, 141–150. [Google Scholar]
  37. Cachier, H.; Brémond, M.P.; Buat-Ménard, P. Determination of atmospheric soot carbon with a simple thermal method. Tellus Series B-Chemical and Physical Meteorology, 1989, 41(B), 379-390. [CrossRef]
  38. Chow, J.C.; Watson, J.G.; Pritchett, L.C.; Pierson, W.R.; Frazier, C.A.; Purcell, R.G. The DRI thermal/optical reflectance carbon analysis system: description, evaluation and applications in U.S. Air quality studies. Atmospheric Environment. Part A. General Topics, 1993, 27, 1185–1201. [Google Scholar] [CrossRef]
  39. Schmid, H.; Laskus, L.; Jürgen Abraham, H.; Baltensperger, U.; Lavanchy, V.; Bizjak, M.; Burba, P.; Cachier, H.; Crow, D.; Chow, J.; Gnauk, T.; Even, A.; ten Brink, H.; Giesen, K.-P.; Hitzenberger, R.; Hueglin, C.; Maenhaut, W.; Pio, C.; Carvalho, A.; Putaud, J.-P.; Toom-Sauntry, D.; Puxbaum, H. Results of the “carbon conference” international aerosol carbon round robin test stage I. Atmospheric Environment, 2001, 35, 2111–2121. [Google Scholar] [CrossRef]
  40. Hitzenberger, R.; Petzold, A.; Bauer, H.; Ctyroky, P.; Pouresmaeil, P.; Laskus, L.; Puxbaum, H. Intercomparison of Thermal and Optical Measurement Methods for Elemental Carbon and Black Carbon at an Urban Location. Environ. Sci. Technol., 2006, 40, 6377–6383. [Google Scholar] [CrossRef]
  41. Paatero, P.; Tapper, U. Positive matrix factorization: A non-negative factor model with optimal utilization of error estimates of data values. Environmetrics, 1994, 5, 111–126. [Google Scholar] [CrossRef]
  42. Polissar, A.V.; Hopke, P.K.; Poirot, R.L. Atmospheric Aerosol over Vermont:  Chemical Composition and Sources. Environ. Sci. Technol., 2001, 35, 4604–4621. [Google Scholar] [CrossRef]
  43. Paatero, P.; Hopke, P.K. Discarding or downweighting high-noise variables in factor analytic models. Analytica Chimica Acta, 2003, 490, 277–289. [Google Scholar] [CrossRef]
  44. Song, Y.; Xie, S.; Zhang, Y.; Zeng, L.; Salmon, L.G.; Zheng, M. Source apportionment of PM2.5 in Beijing using principal component analysis/absolute principal component scores and UNMIX. Science of The Total Environment, 2006, 372, 278–286. [Google Scholar] [CrossRef]
  45. Gupta, I.; Salunkhe, A.; Kumar, R. Source Apportionment of PM10 by Positive Matrix Factorization in Urban Area of Mumbai, India. Scientific World Journal, 2012.
  46. Draxler, R.R. and Hess, G.D. An overview of the HYSPLIT_4 modelling system for trajectories, dispersion, and deposition. Aust. Meteorol. Mag., 1998, 47, 295–308. [Google Scholar]
  47. Adon, A.J.; Liousse, C.; Doumbia, E.H.T.; Baeza-Squiban, A.; Cachier, H.; Léon, J.-F.; Yoboue, V.; Akpo, A.B.; Galy-Lacaux, C.; Zoutien, C.; Xu, H.; Gardrat, E.; Keita, S. Physico-chemical characterization of urban aerosols from specific combustion sources in West Africa at Abidjan in Côte d’Ivoire and Cotonou in Benin in the frame of DACCIWA program. Atmospheric Chem. Phys. Discuss. 2019; 1–69. [Google Scholar] [CrossRef]
  48. Putaud, J.-P.; Raes, F.; Van Dingenen, R.; Brüggemann, E.; Facchini, M.-C.; Decesari, S.; Fuzzi, S.; Gehrig, R.; Hüglin, C.; Laj, P.; Lorbeer, G.; Maenhaut, W.; Mihalopoulos, N.; Müller, K.; Querol, X.; Rodriguez, S.; Schneider, J.; Spindler, G.; Brink, H. ten; Tørseth, K.; Wiedensohler, A. A European aerosol phenomenology-2: chemical characteristics of particulate matter at kerbside, urban, rural and background sites in Europe. Atmospheric Environment, 2004, 38, 2579–2595. [Google Scholar] [CrossRef]
  49. Querol, X.; Alastuey, A.; Viana, M.M.; Rodriguez, S.; Artiñano, B.; Salvador, P.; Garcia do Santos, S.; Fernandez Patier, R.; Ruiz, C.R.; de la Rosa, J.; Sanchez de la Campa, A.; Menendez, M.; Gil, J.I. Speciation and origin of PM10 and PM2.5 in Spain. Journal of Aerosol Science, 2004, 35, 1151–1172. [Google Scholar] [CrossRef]
  50. Yu, J.Z.; Tung, J.W.T.; Wu, A.W.M.; Lau, A.K.H.; Louie, P.K.-K.; Fung, J.C.H. Abundance and seasonal characteristics of elemental and organic carbon in Hong Kong PM10. Atmospheric Environment, 2004, 38, 1511–1521. [Google Scholar] [CrossRef]
  51. McLennan, S.M. Relationships between the trace element composition of sedimentary rocks and upper continental crust. Geochem. Geophys. Geosyst., 2001, 2, 1021–24. [Google Scholar] [CrossRef]
  52. Dongarrà, G.; Manno, E.; Varrica, D.; Vultaggio, M. Mass levels, crustal component and trace elements in PM10 in Palermo, Italy. Atmospheric Environment, 2007, 41, 7977–7986. [Google Scholar] [CrossRef]
  53. Nyanganyura, D.; Maenhaut, W.; Mathuthu, M.; Makarau, A.; Meixner, F.X. The chemical composition of tropospheric aerosols and their contributing sources to a continental background site in northern Zimbabwe from 1994 to 2000. Atmospheric Environment, 2007, 41, 2644–2659. [Google Scholar] [CrossRef]
  54. Zheng, M.; Salmon, L.G.; Schauer, J.J.; Zeng, L.; Kiang, C.S.; Zhang, Y.; Cass, G.R. Seasonal trends in PM2.5 source contributions in Beijing, China. Atmospheric Environment, 2005, 39, 3967–3976. [Google Scholar] [CrossRef]
  55. Guinot, B.; Cachier, H.; Sciare, J.; Tong, Y.; Xin, W.; Jianhua, Y. Beijing aerosol: Atmospheric interactions and new trends. J. Geophys. Res., 2007, 112, D14314. [Google Scholar] [CrossRef]
  56. Sandradewi, J.; Prévôt, A.S.H.; Weingartner, E.; Schmidhauser, R.; Gysel, M.; Baltensperger, U. A study of wood burning and traffic aerosols in an Alpine valley using a multi-wavelength Aethalometer. Atmospheric Environment, 2008, 42, 101–112. [Google Scholar] [CrossRef]
  57. Pio, C.; Cerqueira, M.; Harrison, R.M.; Nunes, T.; Mirante, F.; Alves, C.; Oliveira, C.; Sanchez de la Campa, A.; Artíñano, B.; Matos, M. OC/EC ratio observations in Europe: Re-thinking the approach for apportionment between primary and secondary organic carbon. Atmospheric Environment, 2011, 45, 6121–6132. [Google Scholar] [CrossRef]
  58. Sternbeck, J.; Sjödin, Å.; Andréasson, K. Metal emissions from road traffic and the influence of resuspension-results from two tunnel studies. Atmospheric Environment, 2002, 36, 4735–4744. [Google Scholar] [CrossRef]
  59. Thorpe, A.; Harrison, R.M. Sources and properties of non-exhaust particulate matter from road traffic: a review. Sci. Total Environ., 2008, 400, 270–282. [Google Scholar] [CrossRef]
  60. Bukowiecki, N.; Lienemann, P.; Hill, M.; Furger, M.; Richard, A.; Amato, F.; Prévôt, A.S.H.; Baltensperger, U.; Buchmann, B.; Gehrig, R. PM10 emission factors for non-exhaust particles generated by road traffic in an urban street canyon and along a freeway in Switzerland. Atmospheric Environment, 2010, 44, 2330–2340. [Google Scholar] [CrossRef]
  61. Amato, F.; Pandolfi, M.; Moreno, T.; Furger, M.; Pey, J.; Alastuey, A.; Bukowiecki, N.; Prevot, A.S.H.; Baltensperger, U.; Querol, X. Sources and variability of inhalable road dust particles in three European cities. Atmospheric Environment, 2011, 45, 6777–6787. [Google Scholar] [CrossRef]
  62. Watson, J.G.; Chow, J.C. Source characterization of major emission sources in the Imperial and Mexicali Valleys along the US/Mexico border. Science of The Total Environment, 2001, 276, 33–47. [Google Scholar] [CrossRef]
  63. Adepetu, J.A.; Asubiojo, O.I.; Iskander, F.Y.; Bauer, T.L. Elemental composition of Nigerian harmattan dust. Journal of radioanalytical and nuclear chemistry, 1988, 121, 141–147. [Google Scholar] [CrossRef]
  64. Almeida, S.M.; Pio, C.A.; Freitas, M.C.; Reis, M.A.; Trancoso, M.A. Source apportionment of fine and coarse particulate matter in a sub-urban area at the Western European Coast. Atmospheric Environment, 2005, 39, 3127–3138. [Google Scholar] [CrossRef]
  65. Liousse, C.; Galy-Lacaux, C. Urban pollution in West Africa. La Météorologie, 2010.
  66. Seinfeld, J.H.; Pandis, S.N. Atmospheric chemistry and physics: from air pollution to climate change, Wiley, 2006, New York.
  67. Millero, F.J.; Feistel, R.; Wright, D.G.; McDougall, T.J. The composition of Standard Seawater and the definition of the Reference-Composition Salinity Scale. Deep Sea Research Part I: Oceanographic Research Papers, 2008, 55, 50–72. [Google Scholar] [CrossRef]
  68. Yuan, Z.; Lau, A.K.H.; Zhang, H.; Yu, J.Z.; Louie, P.K.K.; Fung, J.C.H. Identification and spatiotemporal variations of dominant PM10 sources over Hong Kong. Atmospheric Environment, 2006, 40, 1803–1815. [Google Scholar] [CrossRef]
  69. Watson, J. Desert Research Institute, Protocol for Applying and Validating the CMB Model for PM2.5 and VOC. US Environmental Protection Agency, Air Quality Modeling Group, 2004. [Google Scholar]
  70. Allen, J.O.; Mayo, P.R.; Hughes, L.S.; Salmon, L.G.; Cass, G.R. Emissions of size-segregated aerosols from on-road vehicles in the Caldecott tunnel. Environ. Sci. Technol., 2001, 35, 4189–4197. [Google Scholar] [CrossRef]
  71. Pacyna, J.M.; Pacyna, E.G. An assessment of global and regional emissions of trace metals to the atmosphere from anthropogenic sources worldwide. Environmental Reviews, 2001, 9, 269–298. [Google Scholar] [CrossRef]
  72. Petaloti, C.; Triantafyllou, A.; Kouimtzis, T.; Samara, C. Trace elements in atmospheric particulate matter over a coal burning power production area of western Macedonia, Greece. Chemosphere, 2006, 65, 2233–2243. [Google Scholar] [CrossRef]
  73. Lee, S.; Liu, W.; Wang, Y.; Russell, A.G.; Edgerton, E.S. Source apportionment of PM2.5: Comparing PMF and CMB results for four ambient monitoring sites in the southeastern United States. Atmospheric Environment, 2008, 42, 4126–4137. [Google Scholar] [CrossRef]
  74. Cohen, D.D.; Crawford, J.; Stelcer, E.; Bac, V.T. Characterisation and source apportionment of fine particulate sources at Hanoi from 2001 to 2008. Atmospheric Environment, 2010, 44, 320–328. [Google Scholar] [CrossRef]
  75. Pakkanen, T.A.; Kerminen, V.-M.; Korhonen, C.H.; Hillamo, R.E.; Aarnio, P.; Koskentalo, T.; Maenhaut, W. Urban and rural ultrafine (PM0.1) particles in the Helsinki area. Atmospheric Environment, 2001, 35, 4593–4607. [Google Scholar] [CrossRef]
  76. Swami, K.; Judd, C.D.; Orsini, J.; Yang, K.X.; Husain, L. Microwave assisted digestion of atmospheric aerosol samples followed by inductively coupled plasma mass spectrometry determination of trace elements. Fresenius J. Anal. Chem., 2001, 369, 63–70. [Google Scholar] [CrossRef]
  77. Sandroni, V. and Smith, C.M. Microwave digestion of sludge, soil and sediment samples for metal analysis by inductively coupled plasma–atomic emission spectrometry. Analytica Chimica Acta, 2002, 468, 335–344. [Google Scholar] [CrossRef]
  78. Andreae, M.O.; Browell, E.V.; Garstang, M.; Gregory, G.L.; Harriss, R.C.; Hill, G.F.; Jacob, D.J.; Pereira, M.C.; Sachse, G.W.; Setzer, A.W.; Dias, P.L.S.; Talbot, R.W.; Torres, A.L.; Wofsy, S.C. Biomass-burning emissions and associated haze layers over Amazonia. J. Geophys. Res., 1988, 93, 1509–1527. [Google Scholar] [CrossRef]
  79. Chow, J.C.; Watson, J.G.; Chen, L.-W.A.; Chang, M.-C.O.; Miranda, G.P. Comparison of the DRI/OGC and Model 2001 Thermal/Optical Carbon Analyzers, 2005.
  80. Andreae, M.O. and Gelencsér, A. Black carbon or brown carbon? The nature of light-absorbing carbonaceous aerosols. Atmospheric Chemistry and Physics Discussions, 2006, 6, 3419–3463. [Google Scholar] [CrossRef]
  81. Cheng, Y.; Zheng, M.; He, K.; Chen, Y.; Yan, B.; Russell, A.G.; Shi, W.; Jiao, Z.; Sheng, G.; Fu, J.; Edgerton, E.S. Comparison of two thermal-optical methods for the determination of organic carbon and elemental carbon: Results from the southeastern United States. Atmospheric Environment, 2011, 45, 1913–1918. [Google Scholar] [CrossRef]
  82. Sciare, J.; Oikonomou, K.; Favez, O.; Markaki, Z.; Liakakou, E.; Cachier, H.; Mihalopoulos, N. and al. Long-term measurements of carbonaceous aerosols in the Eastern Mediterranean: evidence of long-range transport of biomass burning. Atmospheric Chemistry and Physics Discussions, 2008, 8, 6949–6982. [Google Scholar] [CrossRef]
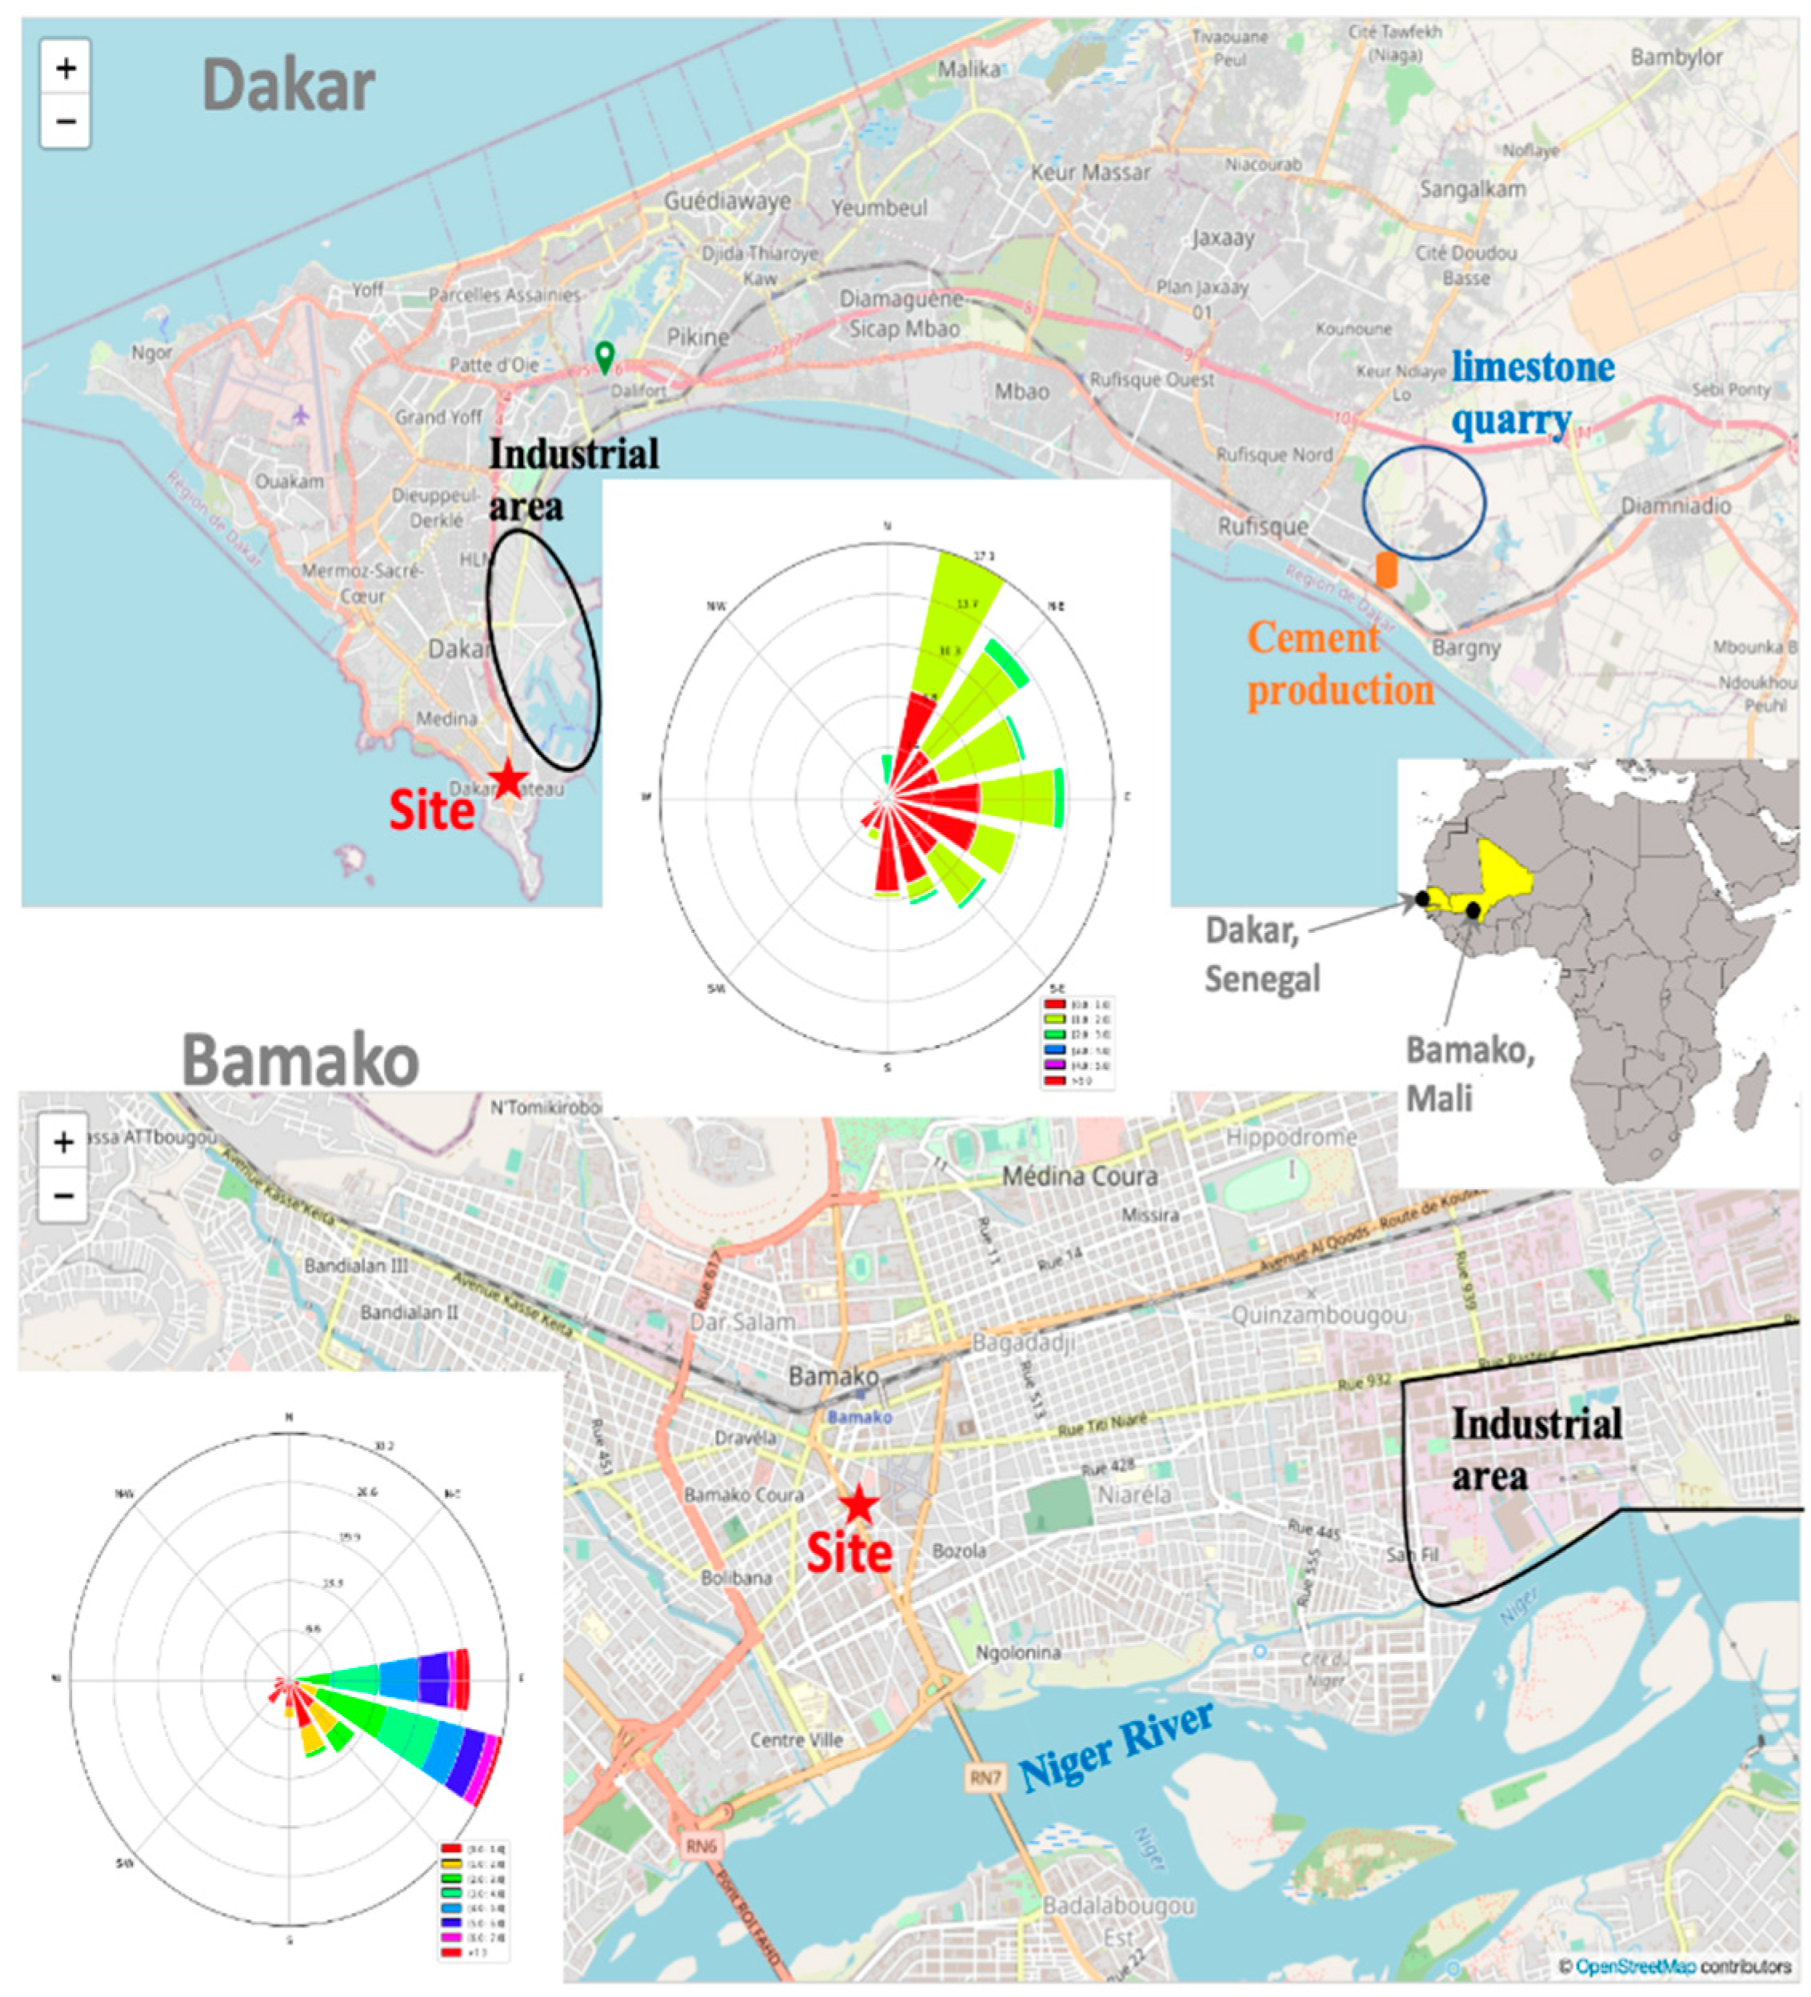
Figure 1. Map of measurement sites with superimposed wind roses during the two field campaigns in Dakar (top) and Bamako (down).
Preprints 69743 g001
Figure 2. Map Light scattering and absorption coefficients, as well as meteorological data collected in Bamako during the dry season of 2009 (January 19 to February 2).
Preprints 69743 g002
Figure 3. Map Light scattering and absorption coefficients, as well as meteorological data collected in Dakar during the dry season of 2009 (November 19 to December 14).
Preprints 69743 g003
Figure 4. Map Daily evolution of PM (TSP, PM10, and PM2.5) mass concentrations (a) in Bamako and (c) Dakar, as well as HYSPLIT 48-hour air mass back trajectories arriving (b) in Bamako for the period from 20 January to 1 February 2009, and (d) in Dakar for the period from 1 to 13 December 2009.
Preprints 69743 g004
Figure 5. Enrichment Factor (EF) values for PM elemental composition calculated in (a) Bamako and (b) Dakar using various reference elements.
Preprints 69743 g005
Table 1. Average 24-hour concentrations (in µg.m-3) for TSP, PM10, PM2.5 and associated elemental compositions in Bamako (including dust episode) and Dakar. Values in parentheses are percentages in total masses.
Bamako Dakar
Species TSP PM10 PM2.5 TSP PM10 PM2.5
Mass PM 705.3 ± 99.3 503.6 ± 112.4 276.8 ± 94.7 274.9 ± 27.43 155.9 ± 15.7 138.2 ± 12.7
Cl- 3.43 (<1) 3.36 (<1) 2.12 (<1) 8.45 (3) 8.13 (5) 1.77 (1)
NO3- 1.87 (<1) 1.87 (<1) 1.18 (<1) 2.06 (<1) 2.31 (1) 0.97 (<1)
SO42- 4.44 (<1) 4.29 (<1) 2.98 (1) 6.18 (2) 7.49 (5) 4.75 (3)
Na+ 2.21 (<1) 1.70 (<1) 1.02 (<1) 5.1 (2) 5.04 (3) 1.21 (<1)
K+ 3.5 (<1) 3.17 (<1) 2.02 (<1) 0.99 (<1) 0.99 (<1) 0.59 (<1)
Mg2+ 0.87 (<1) 0.75 (<1) 0.49 (<1) 0.72 (<1) 0.71 (<1) 0.28 (<1)
Ca2+ 7.14 (1) 7.09 (1) 5.29 (2) 12.17 (4) 13.65 (9) 11.43 (8)
Inorganic ions 24.06 (3) 22.99 (5) 15.69 (6) 36.09 (13) 38.95 (25) 21.50 (16)
BC 23.34 (3) 18.85 (4) 27.11 (10) 20.14 (7) 16.41 (11) 15.88 (11)
OC 102.4 (15) 82.38 (16) 102.4 (37) 69.19 (25) 34.92 (22) 35.83 (26)
TC 125.74 (18) 101.23 (20) 129.51 (47) 89.33 (32) 51.33 (33) 51.71 (37)
Al 21.23 (3) 22.24 (4) 17.98 (6) 9.66 (3) 7.07 (4) 4.11 (3)
Fe 21.91 (3) 20.41 (4) 14.28 (5) 9.00 (3) 5.54 (3) 3.49 (2)
Ti 2.35 2.14 1.47 0.89 0.54 0.34
Mn 0.35 0.32 0.22 0.15 0.11 0.06
Zn 0.18 0.15 0.12 0.21 0.16 0.11
Cr 0.10 0.09 0.06 0.04 0.02 0.02
V 0.06 0.05 0.04 0.07 0.07 0.05
Cu 0.03 0.04 0.02 0.08 0.19 0.13
Ni 0.02 0.02 0.03 0.03 0.03 0.03
Pb 0.02 0.02 0.04 0.03 0.03 0.02
Rb 0.02 0.02 0.015 0.009 0.007 0.004
Co 0.009 0.008 0.005 0.004 0.002 0.0016
Sb 0.004 0.005 0.004 0.005 0.0044 0.0028
As 0.005 0.0045 0.003 0.003 0.0020 0.0014
Be 0.0008 0.0008 0.0005 0.0003 0.0002 0.0001
Cd 0.0007 0.0007 0.0008 0.0007 0.0006 0.0004
Se 0.0003 0.0003 0.0002 0.0007 0.0008 0.0005
Tl 0.0003 0.0003 0.0002 0.00005 0.00005 0.00003
Metals 46.29 (7) 45.53 (9) 34.29 (12) 20.18 (7) 13.78 (9) 8.38 (6)
Table 2. Correlations between chemical compounds and principal components (PCs) in Bamako and Dakar (factor loadings ≥ 0.600 are highlighted in bold, while moderate factor loadings (0.300-0.600) being underlined, categorization based on Nyanganyura et al. [53]).
Bamako Dakar
PC1 PC2 PC3 PC4 PC5 PC1 PC2 PC3 PC4 PC5
Eigenvalue 15.386 3.180 1.284 1.228 1.012 17.126 3.231 1.560 1.137 1.107
Variability 56.986 11.777 8.459 8.251 7.452 63.431 11.967 5.776 4.210 4.100
Cumulative 56.986 68.763 77.222 85.472 92.924 63.431 75.398 81.174 85.384 89.484
Factor loadings
Al 0.982 0.051 -0.041 0.035 -0.120 0.688 0.334 0.300 0.341 0.385
As 0.938 0.143 0.206 0.099 -0.111 0.154 0.177 0.470 0.577 0.245
Be 0.976 0.105 -0.086 0.032 -0.143 0.629 0.469 0.237 0.342 0.410
Ca 0.620 0.582 0.167 0.443 0.051 0.294 0.746 0.144 0.399 0.341
Cd 0.184 -0.218 0.251 0.233 0.643 0.277 0.699 0.262 0.441 0.252
Co 0.972 0.143 0.015 0.086 -0.121 0.542 0.347 0.225 0.407 0.596
Cr 0.830 0.291 0.358 0.232 0.074 0.509 0.158 0.259 0.428 0.658
Cu 0.642 0.291 0.512 0.276 0.089 0.097 0.360 0.312 -0.729 -0.107
Fe 0.964 0.181 0.085 0.129 -0.068 0.653 0.293 0.351 0.465 0.362
K 0.370 0.879 0.041 0.236 0.051 0.702 0.415 0.357 0.253 0.282
Mg 0.920 0.241 -0.069 0.181 -0.105 0.620 0.297 0.441 0.453 0.306
Mn 0.974 0.130 0.001 0.079 -0.123 0.594 0.425 0.319 0.481 0.318
Na 0.152 0.930 0.073 0.227 0.071 0.459 0.113 0.782 0.239 0.159
Ni 0.870 0.063 -0.134 0.012 0.119 -0.178 -0.004 -0.049 -0.062 0.949
Rb -0.202 -0.081 0.892 0.101 0.317 0.707 0.394 0.283 0.352 0.306
Sb 0.841 0.057 0.278 0.299 0.155 0.546 0.361 0.471 -0.100 0.267
Se 0.977 0.107 -0.056 0.036 -0.134 0.170 0.363 0.657 -0.319 0.376
Ti 0.980 0.038 0.095 0.078 -0.013 0.663 0.352 0.282 0.424 0.385
Tl 0.980 0.124 0.014 0.076 -0.104 0.612 0.534 0.184 0.191 0.402
V 0.264 0.414 0.698 0.294 0.301 0.346 0.636 0.342 -0.161 0.381
Zn -0.481 0.201 0.143 0.045 0.753 0.477 0.659 0.338 0.289 0.173
BC -0.359 0.373 0.288 -0.013 0.742 0.078 0.382 0.073 0.807 0.074
OC 0.187 0.349 0.443 0.728 0.213 0.472 0.078 0.117 0.789 0.091
Cl- 0.133 0.312 0.095 0.908 0.080 0.197 0.097 0.906 0.152 -0.003
NO3- 0.889 0.230 0.004 0.284 -0.058 -0.112 0.382 0.832 0.021 0.196
SO42- 0.982 0.051 -0.041 0.035 -0.120 -0.051 0.778 0.529 -0.042 0.193
Table 3. Principal component (PC) and potential source associations (chemical species with high factor loadings are in bold, while the other species have moderate factor loadings).
Rotated Potential Sources Characteristic Compounds
Bamako PC1 Dust Al, As, Be, Cr, Co, Fe, Ti, Mg, Mn, V, Tl, Rb, Se, Ni,
PC2 Solid fuel Na, K, Ca, Zn, NO3-, Cl-, OC
PC3 Resuspended road Sb, Zn, Cu, Cl-, Cr
PC4 Secondary aerosols NO3-, Cl-, Ca
PC5 Vehicle BC, OC, Cd, Zn
Dakar PC1 Dust Al, Be, Rb, K, Ti, Tl, Be, Fe, Mg, Co, Mn, Na, Sb, Cr,
PC2 Industries, Oil Ca, Cd, V, Zn, SO42-, Tl, K, Mn, Be, NO3-, BC, Ti, Al,
PC3 Salts Na, Cl-, NO3-, Se, SO42-, As, K, Mg, Al, Cu, Fe, Mn, Sb,
PC4 Vehicle BC, OC, Cd, Co, Cr, Fe, Mg, Mn, As, Al, Be, Ti, Ca, Rb
PC5 Resuspend road Ni, Cr, Co, Be, Al, Tl, Ca, Fe, Mg, Mn, Rb, Se, Ti, V
Table 4. Correlations between principal components (PCs) of PCA and sources of the PMF model (Factors).
Bamako Factor 1 Factor 2 Factor 3 Factor 4 Factor 5
PC1 -0.72 0.00 -0.07 0.84 -0.06
PC2 -0.13 -0.46 0.82 -0.40 0.10
PC3 0.30 0.71 -0.13 -0.63 -0.07
PC4 -0.22 0.19 -0.01 -0.56 0.78
PC5 0.81 0.13 -0.17 -0.70 -0.05
Dakar Factor 1 Factor 2 Factor 3 Factor 4 Factor 5
PC1 -0.24 0.14 -0.33 0.84 -0.34
PC2 -0.32 -0.13 -0.18 0.28 0.57
PC3 0.89 -0.38 -0.34 -0.33 0.05
PC4 -0.16 0.78 -0.15 0.28 -0.72
PC5 -0.35 -0.11 0.57 0.32 -0.38
Disclaimer/Publisher’s Note: The statements, opinions and data contained in all publications are solely those of the individual author(s) and contributor(s) and not of MDPI and/or the editor(s). MDPI and/or the editor(s) disclaim responsibility for any injury to people or property resulting from any ideas, methods, instructions or products referred to in the content.
Copyright: This open access article is published under a Creative Commons CC BY 4.0 license, which permit the free download, distribution, and reuse, provided that the author and preprint are cited in any reuse.
Prerpints.org logo

Preprints.org is a free preprint server supported by MDPI in Basel, Switzerland.

Subscribe

© 2024 MDPI (Basel, Switzerland) unless otherwise stated