Preprint
Article

The Transverse Momentum Distribution of J/ψ Mesons Produced in Pp Collisions at the LHC

Altmetrics

Downloads

141

Views

21

Comments

0

A peer-reviewed article of this preprint also exists.

This version is not peer-reviewed

Submitted:

08 March 2023

Posted:

14 March 2023

You are already at the latest version

Alerts
Abstract
The transverse momentum distribution of J/ψ mesons produced in pp collisions at the center-of-mass energy 5 TeV, 7 TeV,and 13 TeV is described by the modified Hagedorn function which is based on the Tsallis function and Hagedorn function. The calculated results by the modified Hagedorn function are in accord with experimental data measured by the LHCb Collaboration at LHC. The related parameters are obtained and analyzed.
Keywords: 
Subject: Physical Sciences  -   Nuclear and High Energy Physics

1. Introduction

More and more scientific workers get involved in exploring the origin of the universe. According to modern cosmology, the quark-gluon plasma (QGP) is the initial state after the Big Bang and the original state of matter. So, exploring and studying the QGP is a way to understand the universe’s evolution. In the extremely high temperature and high-density particle collision area may be production the QGP. In the experimental, accelerated the speed of the two antithetical heavy nuclei approach the speed of light and have a central collision to be formed a small ‘big bang’ and produced the QGP. Creating and studying the QGP has become the main goal of the high energy heavy ion collision experiment. But, the new form of nuclear matter (QGP) cannot be directly observed by the detectors. We can only analyze the final particles of relativistic heavy ion collisions to infer the properties of QGP. To date, we have got a lot of experimental data provided by the Relativistic Heavy Ion Collider (RHIC) and the Large Hadron Collider (LHC) to study. And, scientists have obtained some achievements about the QCD diagram and nuclear matter [1,2].
In the whole process of collision, the collision system is emitted particles and nuclear fragments constantly. The kinds and dynamical properties of the particles and nuclear fragments emitted at different stages are not the same. Therefore, the final products of collisions have carried on a lot of the evolution information of collision progress [3]. The transverse momentum distribution of final state particles is an important object of observation in the experimentally, it can provide more important information to study the kinetic freezing temperature, the radial velocity of particles, chemical potential, the transverse excitation degree of collision system, and so on. In this paper, we described the transverse momentum distribution of J/ψ mesons produced in pp collisions at different collision energy, extracted and analyzed some related parameters.

2. The model and method

In our previous work [4,5,6,7,8], we have revised some thermodynamic statistical distributions based on the multisource thermal model. In the work [4,5], we put forward two components of statistical models which are the two-component Elang distribution and the two-component Schwinger mechanism. We used the two revised model to analyze the transverse momentum distributions of φmesons, Ω hyperons, and negatively charged particles produced in Au-Au collisions with different centrality intervals, measured by the STAR Collaboration at 7.7 GeV, 11.5 GeV, 19.6 GeV, 27 GeV, and 39 GeV in the beam energy scan programat RHIC. And, we used the two methods to study the transverse momentum spectra of J/ψ and Υmesons produced in pp, p-Pb, Pb-Pb collisions measured by LHCb and ALICE Collaboration at LHC. In the work [6], we structured a two-component statistical model which is a super position of the Tsallis statistics and the inverse power law. We used this two-component statistical model to analyze the transverse momentum distributions of J/ψ and Υmesons produced in pp, p-Pb collisions at 5 TeV, 7 TeV, 8 TeV, and 13 TeV measured by LHCb Collaboration at LHC. In the work [7], We used two models(the two-component Schwinger mechanism and the two-component statistical model which is based on the Tsallis statistics and the inverse power law) to study the Λ c + , Λ b 0 baryons, D 0 , B ¯ 0 mesons and some related particles produced in pp, p-Pb collisions at 5 TeV, 7 TeV, 8 TeV,and 13 TeV. From our prophase related work, one can see that our revised models could describe the experimental data very well. And based on our revised models, we extracted some related important parameters and analyzed their trend with rapidity and collision energy. Through these studies works, we try to get some useful information about the collision mechanism, the evolution of thecollision system and the QGP.
In this work, we use the modified Hagedorn function to study the transverse momentum distribution of J/ψ mesons produced in pp collisions at the center-of-mass energy 5 TeV, 7 TeV, and 13 TeV. To complete this paper, we will introduce this function briefly in the following paragraphs.
In the reference [9,10],the Hagedorn function is written as:
d 2 N 2 π N e v p t d p t d y = C ( 1 + m t p 0 ) n
In this function, C is the fitting constant, m t = p t 2 + m 0 2 denotes the transverse mass, p0 and n are the free parameters. Based on Quantum Chromodynamics, the Hagedorn function can be described the high transverse momentum part of transverse momentum distributions of hadrons very well.
It is well-known that the Tsallis function is a very useful method to study the transverse momentum of final state particles in pp collisions at RHIC and LHC energy range. The simplest form of the Tsallis function is:
d 2 N 2 π N e v p t d p t d y = C q ( 1 + ( q 1 ) m t T ) 1 / ( q 1 )
By comparing the Hagedorn function and Tsallis function, one can see that when the parameter n can be expressed as 1 / ( q 1 ) and p0 can be expressed as nT (T is effective temperature), the Hagedorn function and the Tsallis function are mathematically equivalent. So, we could revise function (1) to
d 2 N 2 π N e v p t d p t d y = C ( 1 + m t n T 0 ) n
In the references [11,12,13,14], m t can be transform to γ t ( m t p t β t ) , and γ t = 1 1 β t 2 . In this way, function (3) can be written as
d 2 N 2 π N e v p t d p t d y = C ( 1 + γ t ( m t p t β t ) n T 0 ) n
Function (4) is the form of the modified Hagedorn function. We have used the function (4) to study the transverse momentum distribution of J/ψ mesons produced in pp collisions at 5 TeV, 7 TeV, 8 TeV, and 13 TeV measured by LHCb Collaboration at LHC. The following section introduced the details of our research work.

3. Results and discussion

Figure 1 shows the transverse momentum distribution of J/ψ mesons produced in pp collisions at s = 5 TeV. Figure 1(a) presents the results of prompt J/ψ mesons and Figure 1(b) present the results of nonprompt J/ψ mesons, respectively. The hollow symbols with the error bars represent the experimental data measured by the LHCb Collaboration in literature [15], the different rapidity ranges are denoted by different symbols in the panels. The solid curves are our results calculated by the modified Hagedorn function. The values of free parameters (n, T0, βt) and degree of freedom ( χ 2 / d o f ) corresponding to each curve in Figure 1 are listed in Table 1. One can see that the modified Hagedorn function could describe the experimental data measured in pp collisions at the center-of-mass energy 5 TeV by the LHCb Collaboration.The trends of parameters on the rapidity will be discussed later.
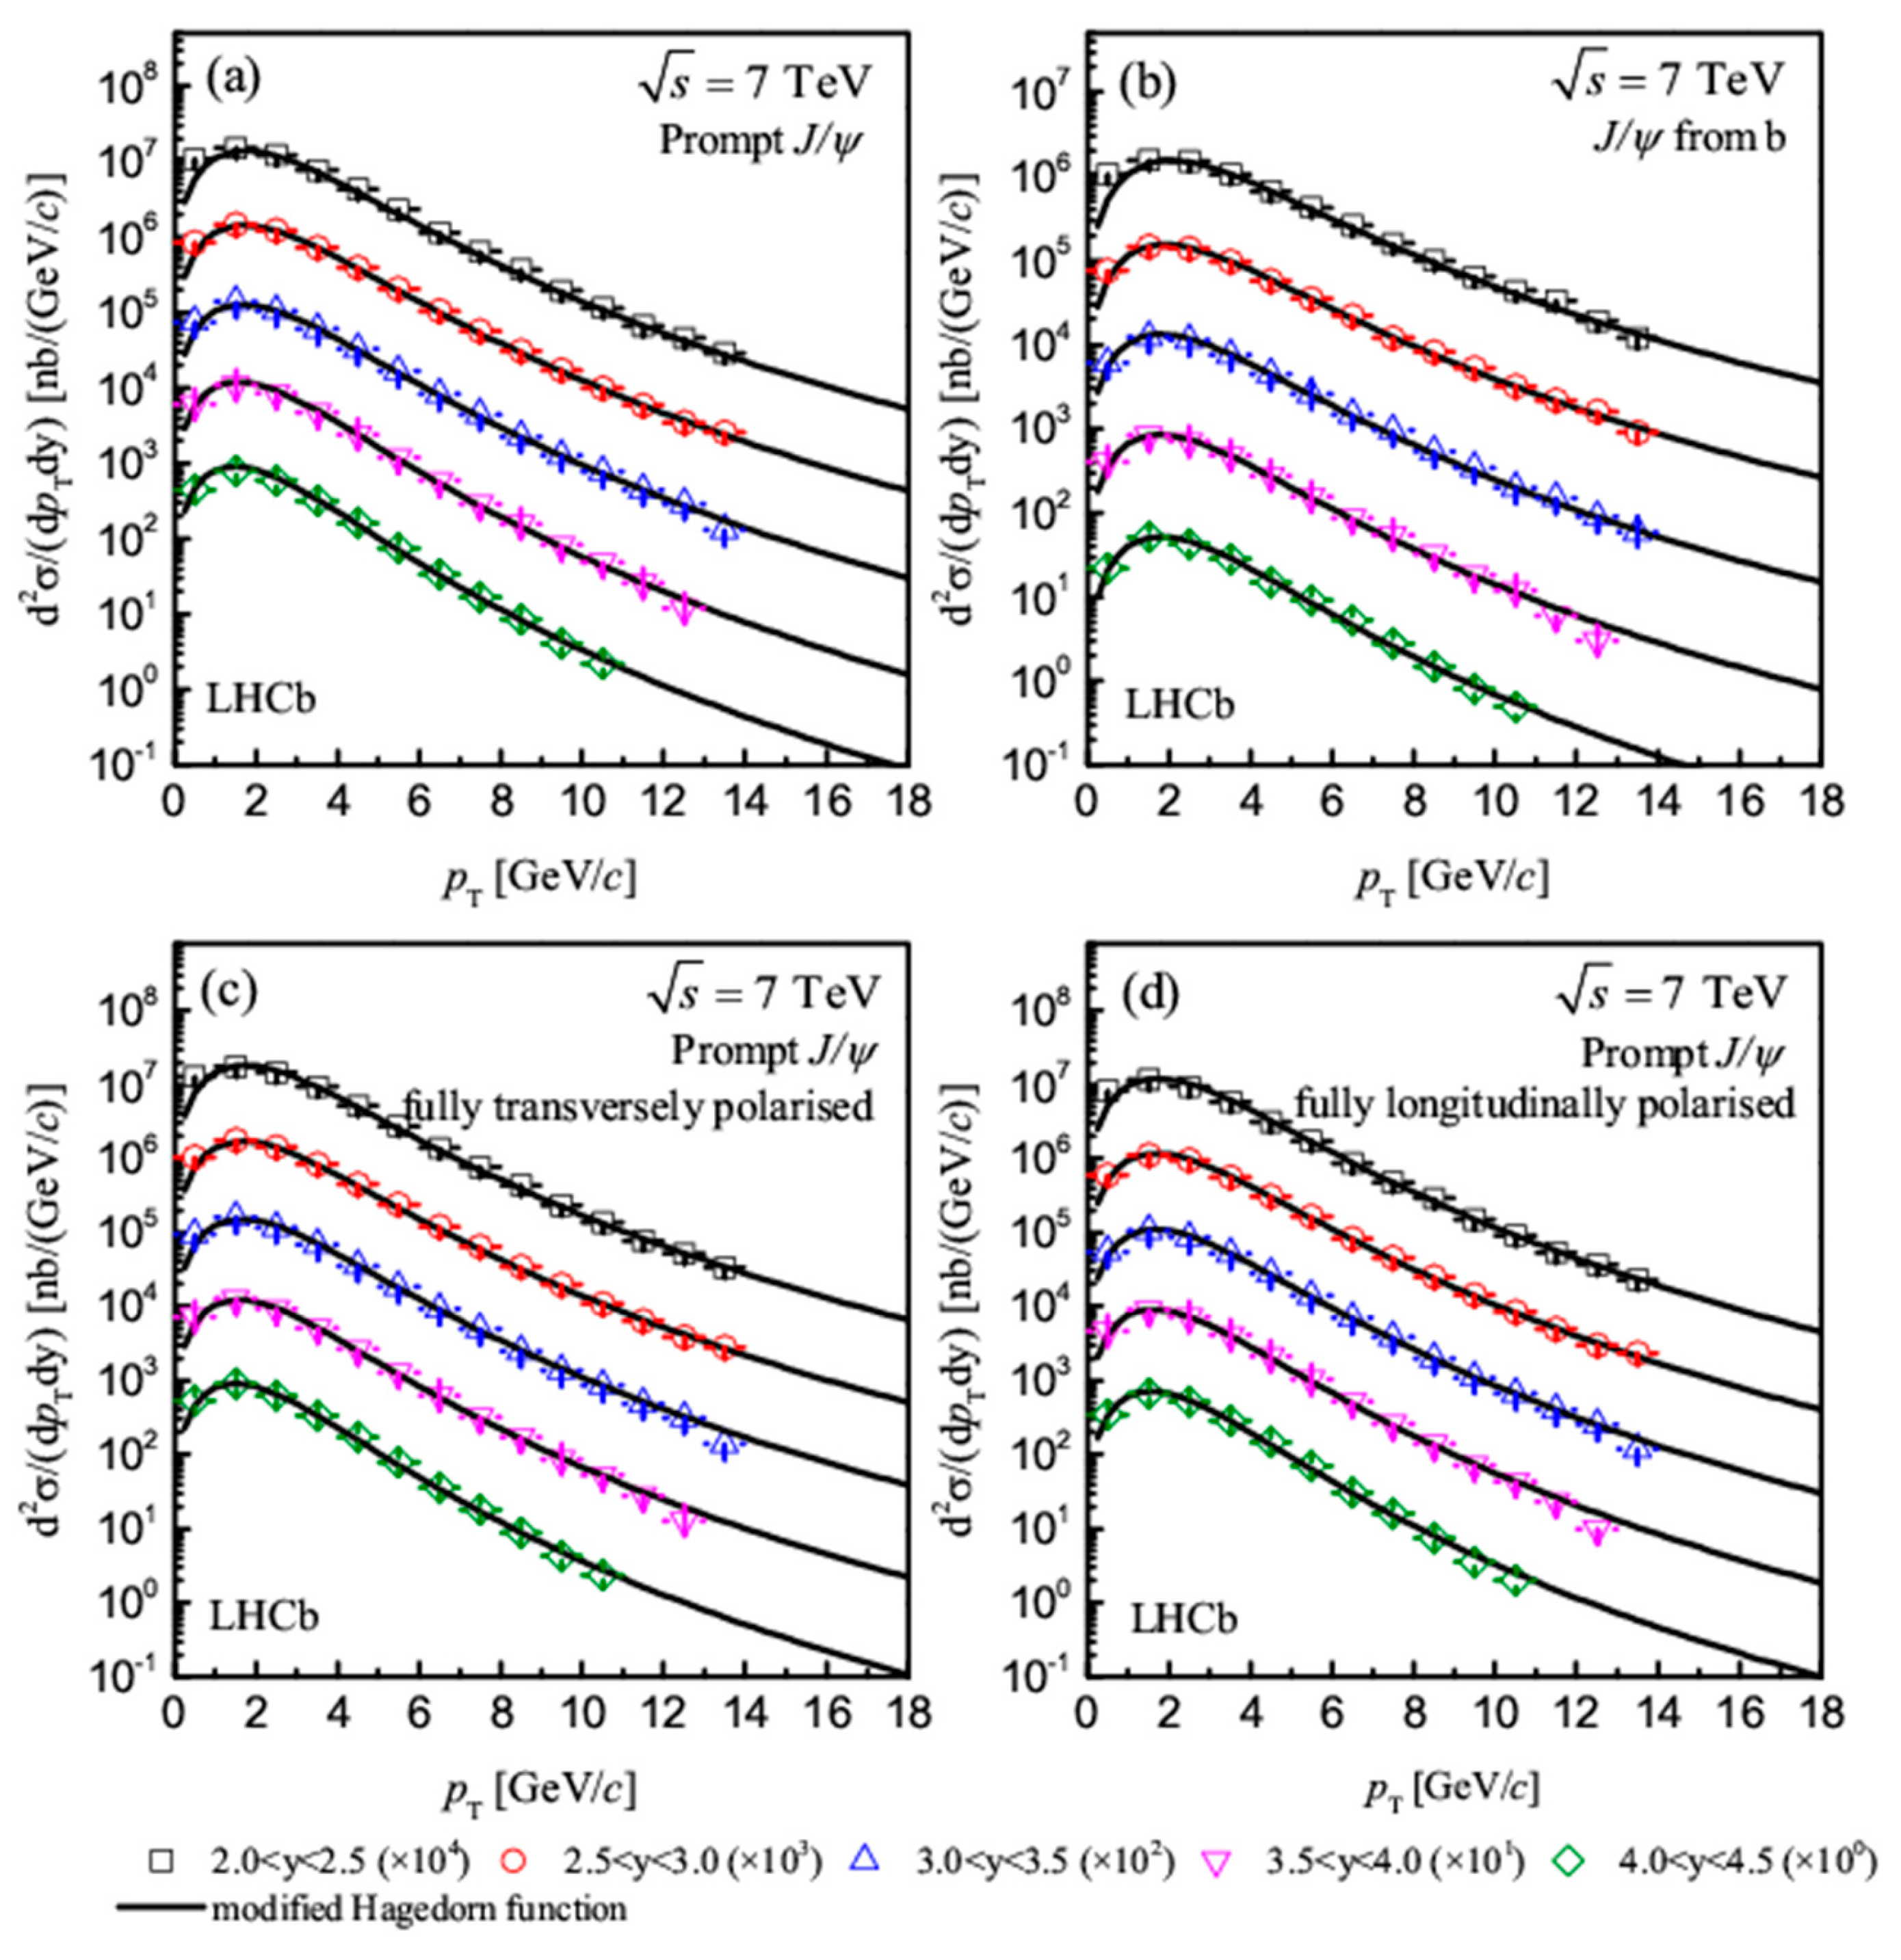
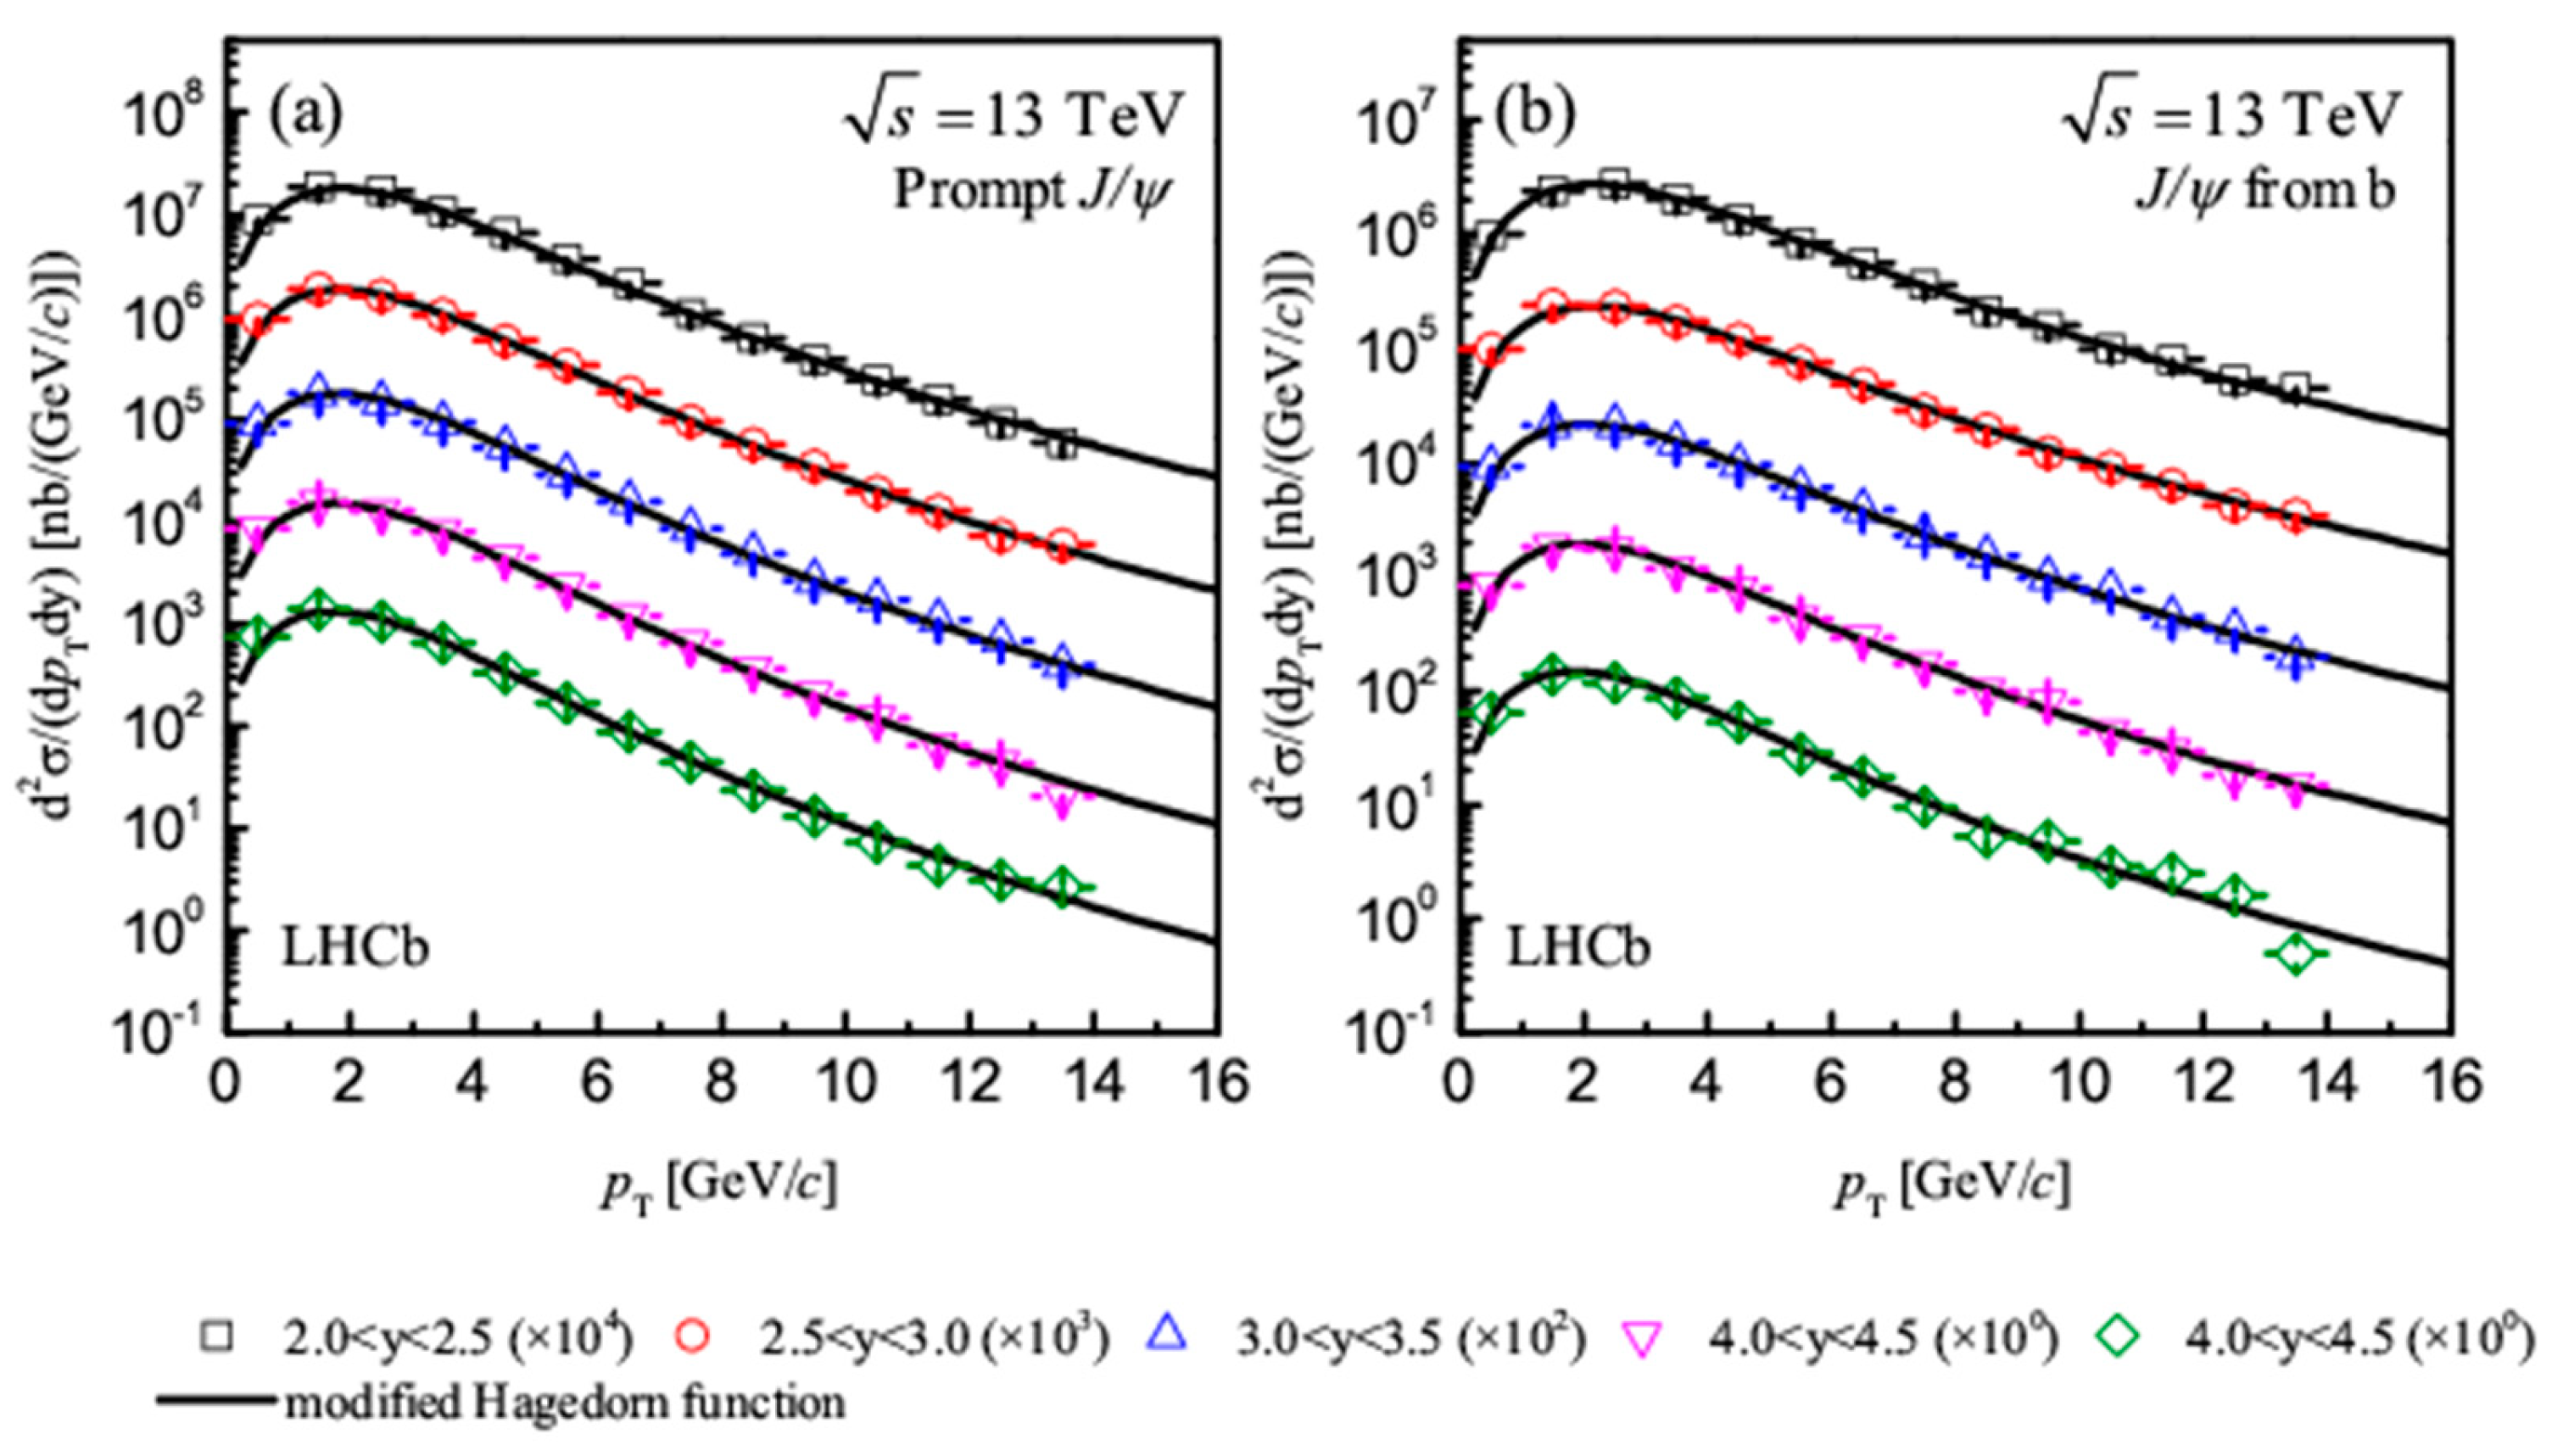
Figure 2 and Figure 3 are similar to Figure 1. Figure 2 show the transverse momentum spectra of 2(a) prompt J/ψ, 2(b) J/ψ from b, 2(c) prompt J/ψ with fully transversely polarized, 2(d) prompt J/ψ with fully longitudinally polarized in pp collisions at s = 7 TeV, respectively. Figure 3(a) and (b) show the results of prompt J/ψ and J/ψ from b mesons in pp collisions at s = 13 TeV, respectively. The hollow symbols with the error bars represent the experimental data measured by the LHCb Collaboration in literatures [16,17]. The solid curves are our results calculated by the modified Hagedorn function. The values of free parameters (n, T0, βt) and degree of freedom ( χ 2 / d o f ) corresponding to each curve in Figure 2 and Figure 3 are listed in Table 1, which will be discussed later. One can see that the results calculated by the modified Hagedorn function are fitted well with the experimental data.
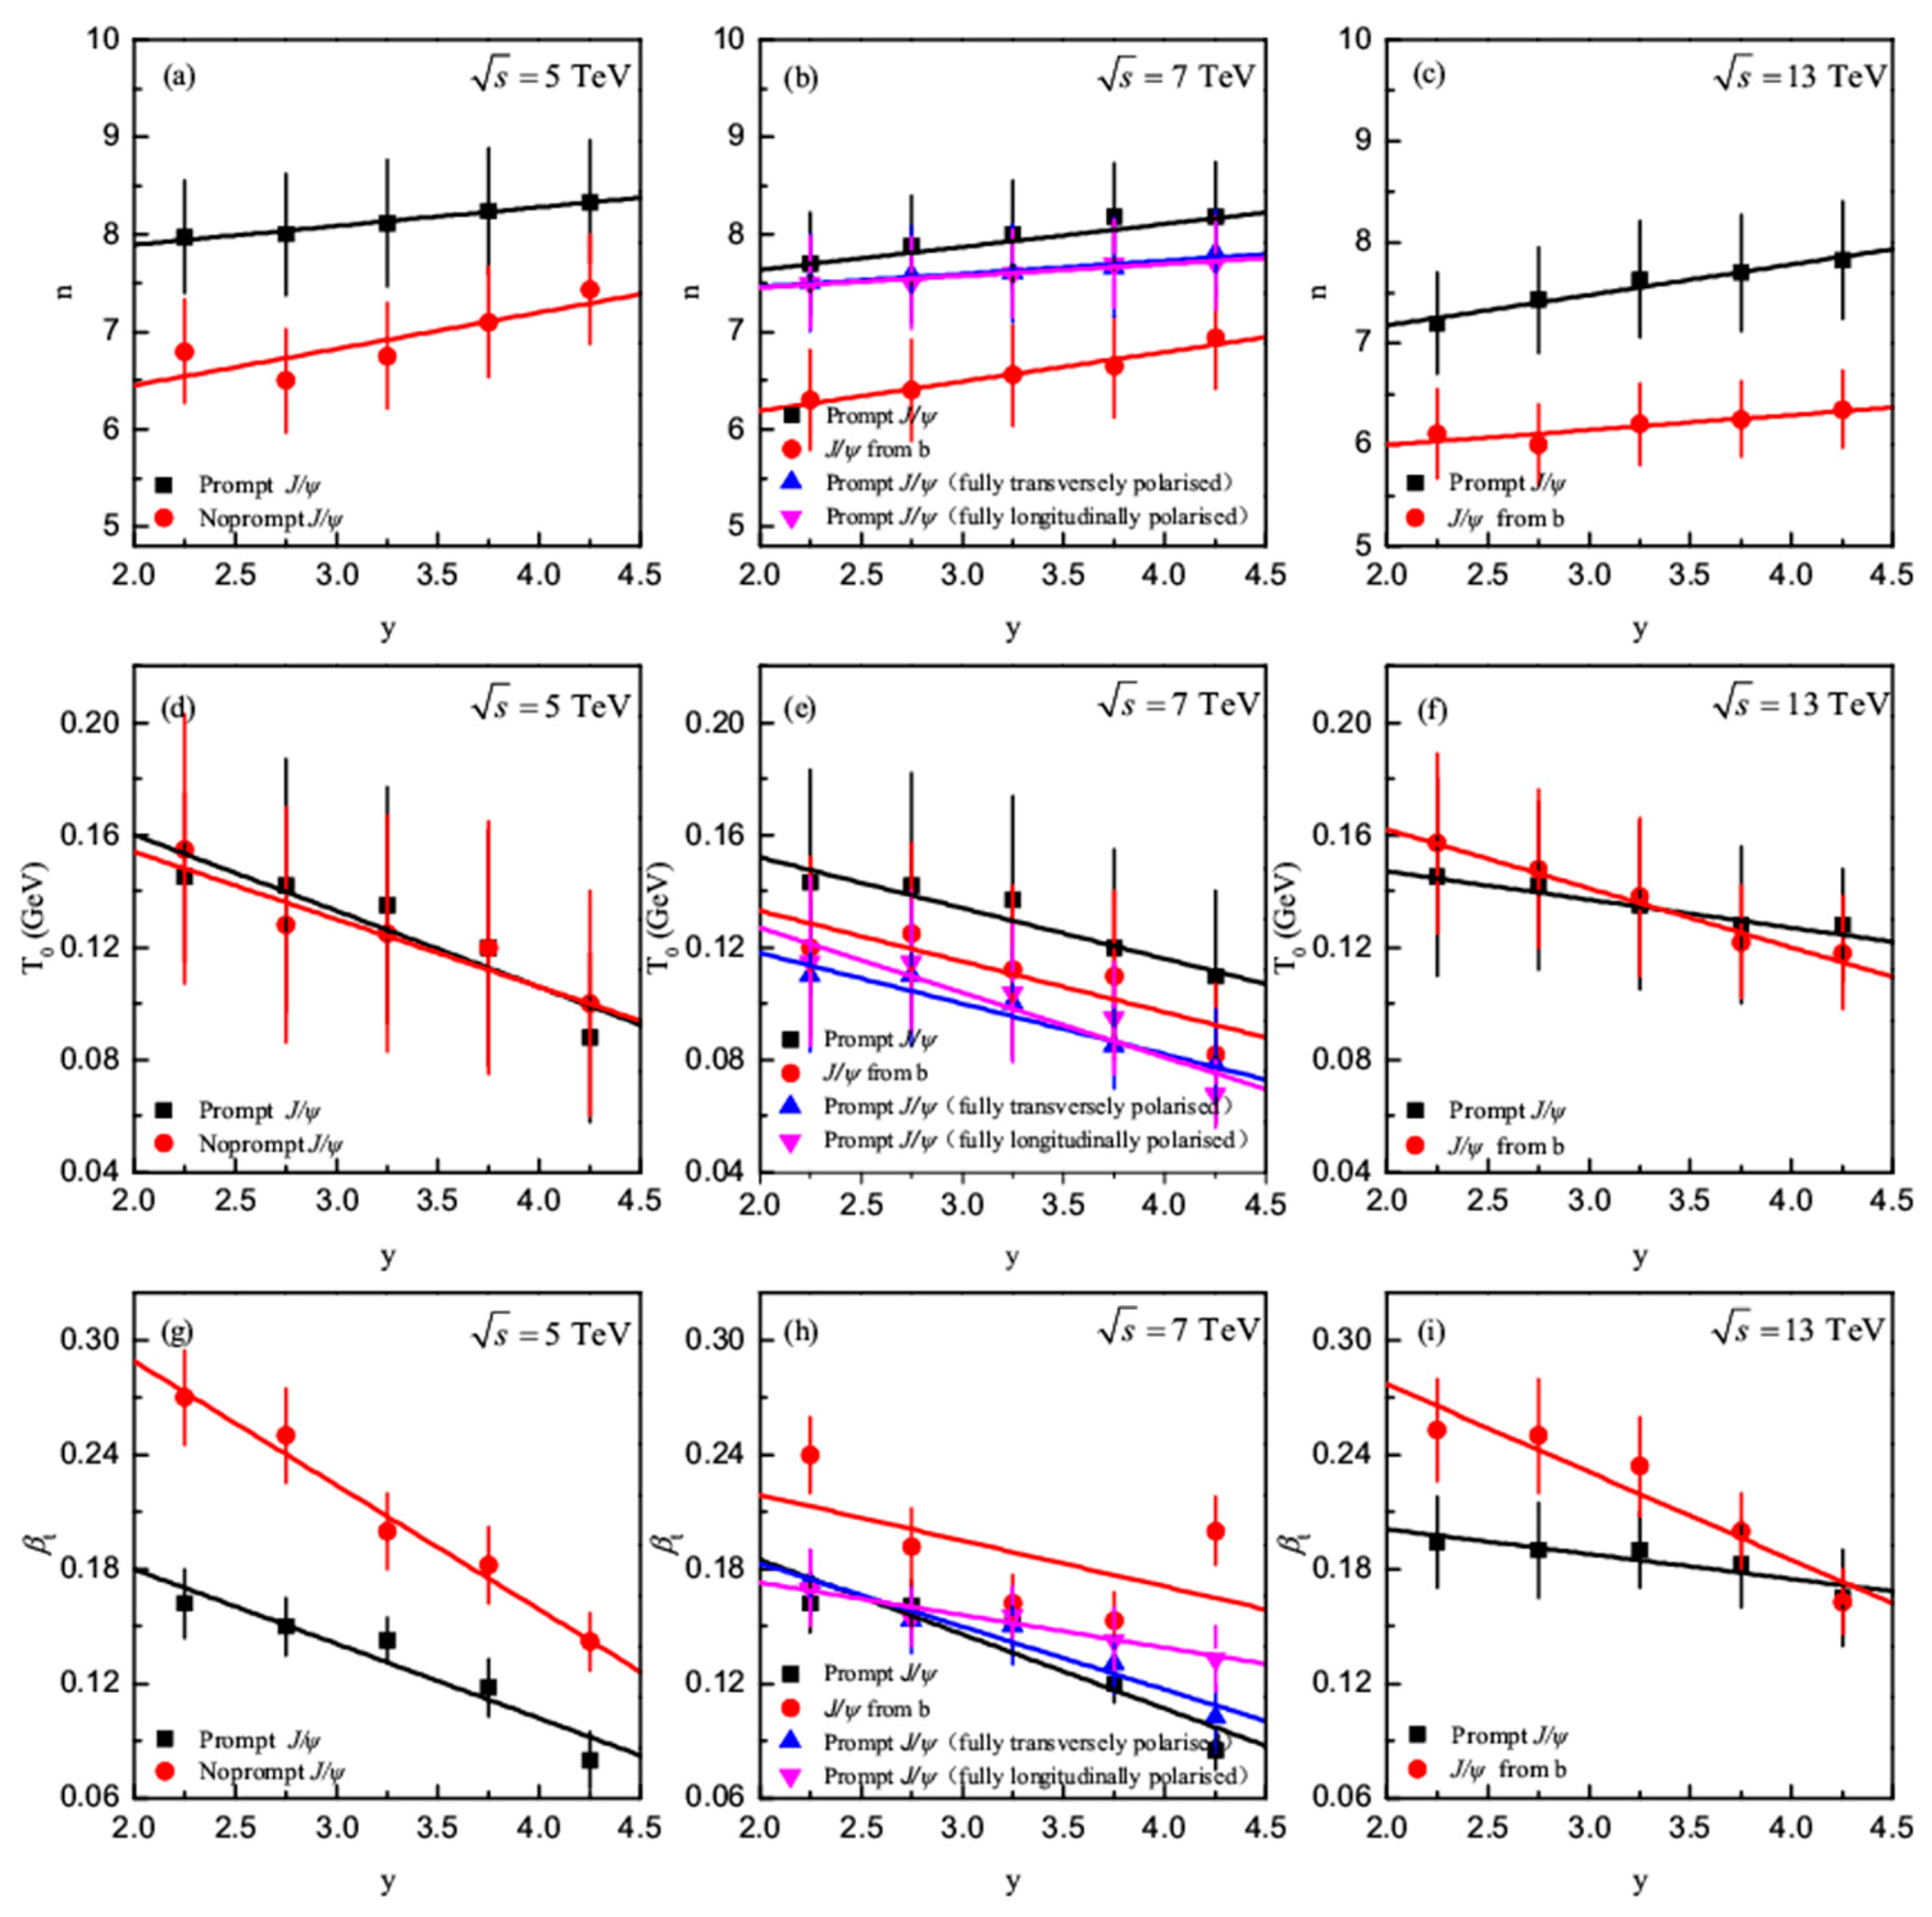
In order to see clearly the relationship of free parameters (n, T0, βt) and rapidity(y) for J/ψ mesons produced in pp collisions at 5 TeV, 7 TeV and 13 TeV, we plot the parameter values listed in Table 1 in Figure 4. In this Figure, the solid symbols are parameters and the solid lines are our fitted results by the least square method. One can see that one parameter (n) is increased with the rapidity increase, and the other two parameters (T0 and βt) are decreased with the rapidity increase. In addition, we find the trend of βt has an abnormal phenomenon for J/ψ mesons produced in pp collisions at s = 7TeV.
In this paper, we described the transverse momentum distribution of J/ψ mesons produced in pp collisionsat the center-of-mass energy 5 TeV, 7 TeV, and 13 TeV by the modified Hagedorn function. From our calculated curves and the experimental data are present in Figure 1, Figure 2 and Figure 3 and the degree of freedom ( χ 2 / d o f ) listed in Table 1, we found that the modified Hagedorn function is good way to study the transverse momentum distribution of J/ψ mesons produced in pp collisions at LHC energy regions. Based on the work of describing the transverse momentum distribution of J/ψ mesons, we extracted the three free parameters (n, T0, βt). As mentioned in literature [10], for point quark–quark scattering n ≈ 4, and the n parameter gets bigger when multiple scattering centers are involved [10,18,19,20]. Our research result show the parameter n is increased with the rapidity increase and not obviously different with the collision energy increased at LHC. This result suggests that with the rapidity increased, the more multiple scattering centers are involved. βt is the average transverse (radial) flow velocity, and T0 is an estimate for kinetic freeze-out temperature. The two parameters (T0 and βt) are decreased with the rapidity increase. This result means that the collision system may be have faster expansion and higher excitation degree in low rapidity region.

Data Availability Statement

All data are quoted from the mentioned references. As a phenomenological work, this paper does not report new data.

Acknowledgments

Author Li-Na Gao acknowledges the financial support from the National Natural Science Foundation of China under Grant No. 11847003, the Shanxi Provincial Science and Technology Innovation Plan under Grant No. 2019L0804, the university student innovation and entrepreneurship training program of Taiyuan Normal University No. CXCY 2276, the Doctoral Scientific Research Foundation of Taiyuan Normal University under Grant No. I170167, and the Doctoral Scientific Research Foundation of Shanxi Province under Grant No. I170269.

Conflicts of Interest

The authors declare that there are no conflicts of interest regarding the publication of this paper.

References

  1. P. Moreau, O. Soloveva, and I. Grishmanovskii et al.. Properties of the QGP created in heavy-ion collisions [J]. AstronomischeNachrichten, 2021, 342, 715-726.
  2. C. A. Graeff, M. D. Alloy, and K. D. Marquez et al. Hadron-quark phase transition: the QCD phase diagram and stellar conversion [J]. Journal of Cosmology and Astroparticle Physics, 2019, 2019, 024. [CrossRef]
  3. S. Domdey, B. Z. Kopeliovich, and H. J. Pirner. Jet-evolution in the quark-gluon plasma from RHIC to the LHC [J]. Nuclear Physics A, 2011, 856, 134-153. [CrossRef]
  4. L. N. Gao, Fu-Hu Liu and Roy A. Lacey. Excitation functions of parameters in Erlang distribution, Schwinger mechanism, and Tsallis statistics in RHIC BES program. The European Physical Journal A, 2016, 52, 137. [CrossRef]
  5. L. N. Gao and Fu-Hu Liu. Comparing Erlang Distribution and Schwinger Mechanism on Transverse Momentum Spectra in High Energy Collisions.Advances in High Energy Physics, 2016, 2016, 1505823. [CrossRef]
  6. L. N. Gao, Fu-Hu Liu, and Bao-Chun Li. Rapidity Dependent Transverse Momentum Spectra of Heavy Quarkonia Produced in Small Collision Systems at the LHC. Advances in High Energy Physics.2019, 2019, 6739315. [CrossRef]
  7. L. N. Gao, Fu-Hu Liu. Transverse momentum spectra of heavy baryons and mesons in forward rapidity range in small collision system at the LHC. Indian Journal of Physics. 2020, 94, 1431-1450. [CrossRef]
  8. L. N. Gao, Er-Qin Wang. Transverse momenta and pseudo-rapidity spectrum of the top quark, lepton and b jet in proton-proton collisions at LHC. Advances in High Energy Physics, 2021, 2021, 6660669. [CrossRef]
  9. R. Hagedorn. Multiplicities, pT distributions and the expected hadron→ quark-gluon phase transition [J]. RivistadelNuovoCimento, 1983, 6(CERN-TH-3684), 1.
  10. K. K. Olimov, F. H. Liu, and K.A. Musaev et al. Multiplicity dependencies of midrapidity transverse momentumspectra of identified charged particles in p+pcollisions at (s)1/2=13 TeV at LHC. International Journal of Modern Physics A, 2021, 36, 2150149. [CrossRef]
  11. P. K. Khandai, P. Sett, and P. Shukla et al.. System size dependence of hadron pTspectra in p+p and Au+Au collisions at √SNN = 200 GeV [J]. Journal of Physics G, 2014, 41, 025105.
  12. K. K. Olimov, A. lqbal, and S. Masood. Systematic analysis of midrapidity transverse momentum spectra of identified charged particles in p+ p collisions at √SNN = 2.76, 5.02, and 7 TeV at the LHC [J]. International Journal of Modern Physics A, 2020, 35, 2050167. [CrossRef]
  13. K. K. Olimov, S. Z. Kanokova, and A. K.Olimov et al. Combined analysis of midrapidity transverse momentum spectra of the charged pions and kaons, protons and antiprotons in p+p and Pb+ Pb collisions at √SNN =2.76 and 5.02 TeV at the LHC [J]. Modern Physics Letters A, 2020, 35, 2050237. [CrossRef]
  14. K. K. Olimov, S. Z. Kanokova, and K.Olimov et al. Average transverse expansion velocities and global freeze-out temperatures in central Cu+Cu, Au+Au, and Pb+Pb collisions at high energies at RHIC and LHC [J]. Modern Physics Letters A, 2020, 35, 2050115. [CrossRef]
  15. R. Aaij, A.S.W. Abdelmotteleb, and C.Abellán Beteta et al. Measurement of J/ψ production cross-sections in pp collisions at √s =5 TeV [J]. Journal of High Energy Physics, 2021, 11, 181.
  16. R. Aaij, B. Adeva, and M. Adinolfi et al..Measurement of J/ψproduction in pp collisions at √s =7 TeV [J]. The European Physical Journal C, 2011, 71, 1645.
  17. R. Aaij, B. Adeva, and M. Adinolfi et al..Measurement of forward J/ψ production cross-sections in pp collisions at s√ =13 TeV [J]. Journal of High Energy Physics, 2015, 10, 172.
  18. P. K. Khandai, P. Sett, and P. Shukla et al..Hadron spectra in p+p collisions at RHIC and LHC energies [J].International Journal of Modern Physics A, 2013, 28, 1350066. [CrossRef]
  19. R. Blankenbecler, S. J. Brodsky, and J. Gunion. Analysis of particle production at large transverse momentum [J]. Physical Review D, 1975, 12, 3469. [CrossRef]
  20. S. J. Brodsky, H. J. Pirner, and J. Raufeisen. Scaling properties of high pTinclusive hadron production [J].Physices Letters B, 2006, 637, 58. [CrossRef]
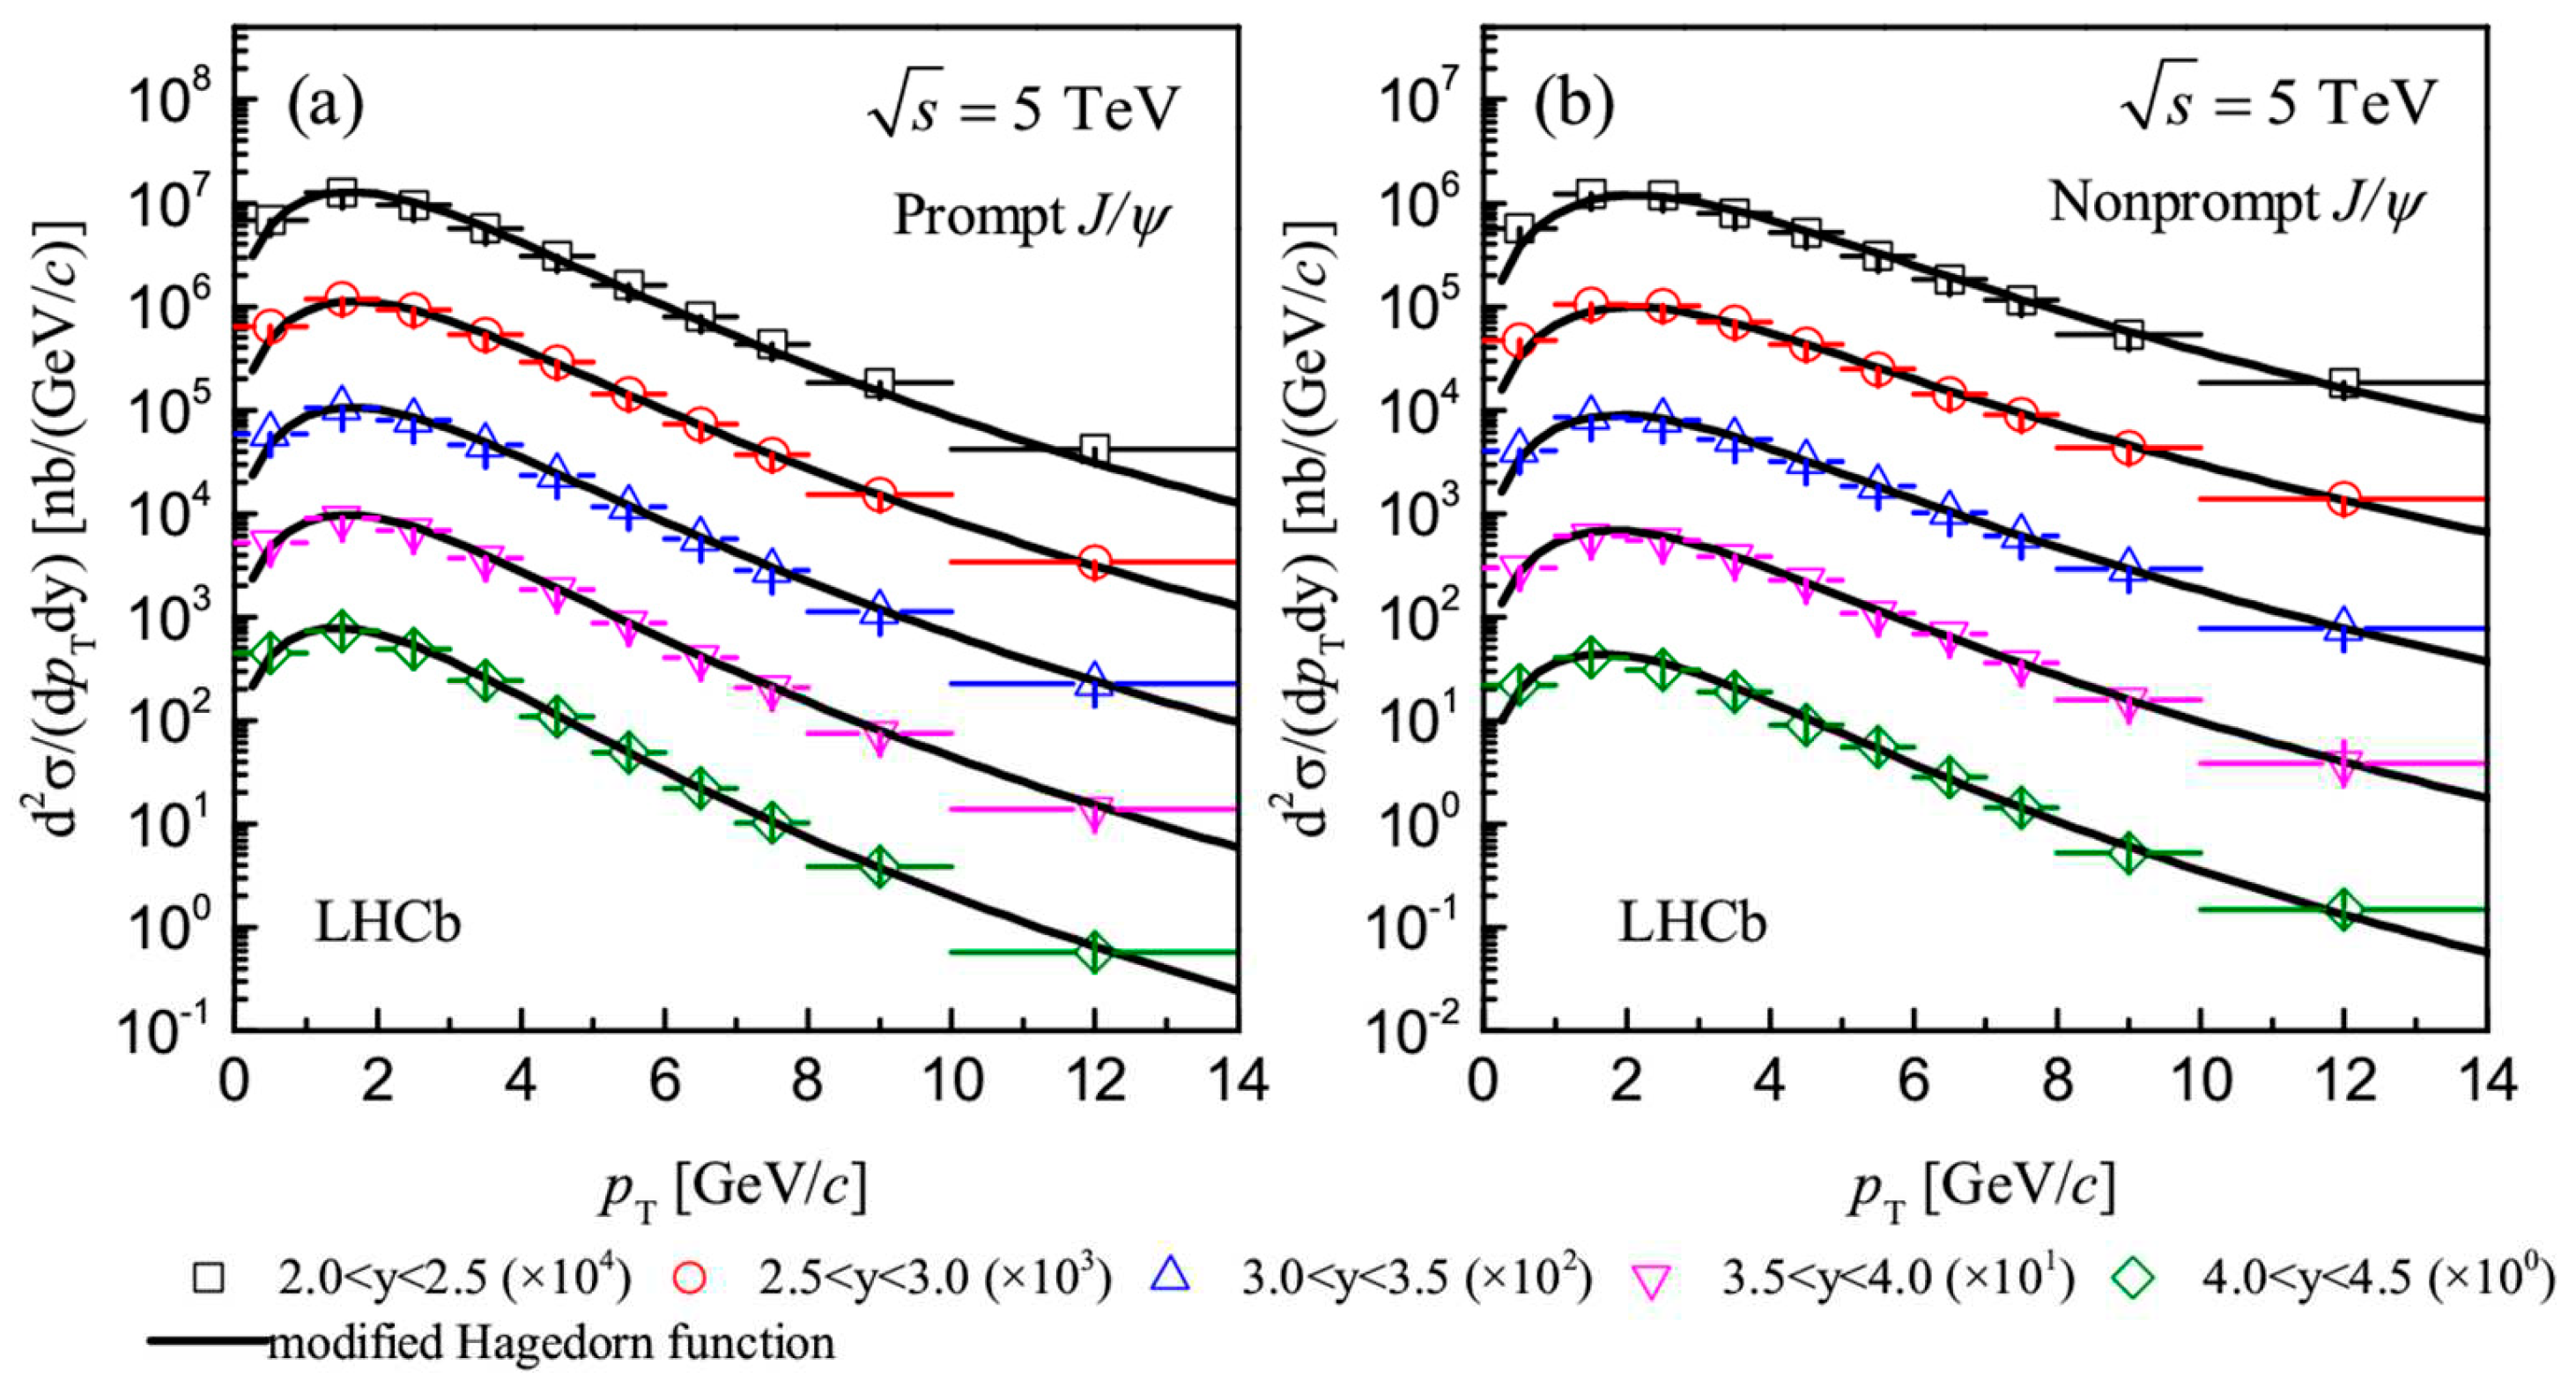
Figure 1. Transverse momentum distribution of(a) prompt J/ψ (b) nopromptJ/ψmesonsproduced in pp collisions at s = 5 TeV.The hollowsymbolswith the error bars represent the experimental data of the LHCb Collaboration in literature [15], the curves are our results calculated by the modified Hagedorn function.
Preprints 69547 g001
Figure 2. The same as Figure 1, but showing the results of(a) prompt J/ψ (b) J/ψ from b (c) prompt J/ψ (assuming fully transversely polarised) (d)prompt J/ψ (assuming fully longitudinally polarised) mesons produced in pp collisions at s = 7TeV. The experimental data are pouted from the literature [16].
Preprints 69547 g002
Figure 3. The same as Figure 1, but showing the results of(a) prompt J/ψ (b) J/ψ from b mesons produced in pp collisions at s = 13 TeV. The experimental data are pouted from the literature [17].
Preprints 69547 g003
Figure 4. The relationship of free parameters (n, T0, βt) and rapidity(y) for J/ψmesons produced in pp collisions at 5 TeV, 7 TeV, and13TeV. The solid symbols are quoted in Table 2, and the lines are our fitted results by the least square method.
Preprints 69547 g004
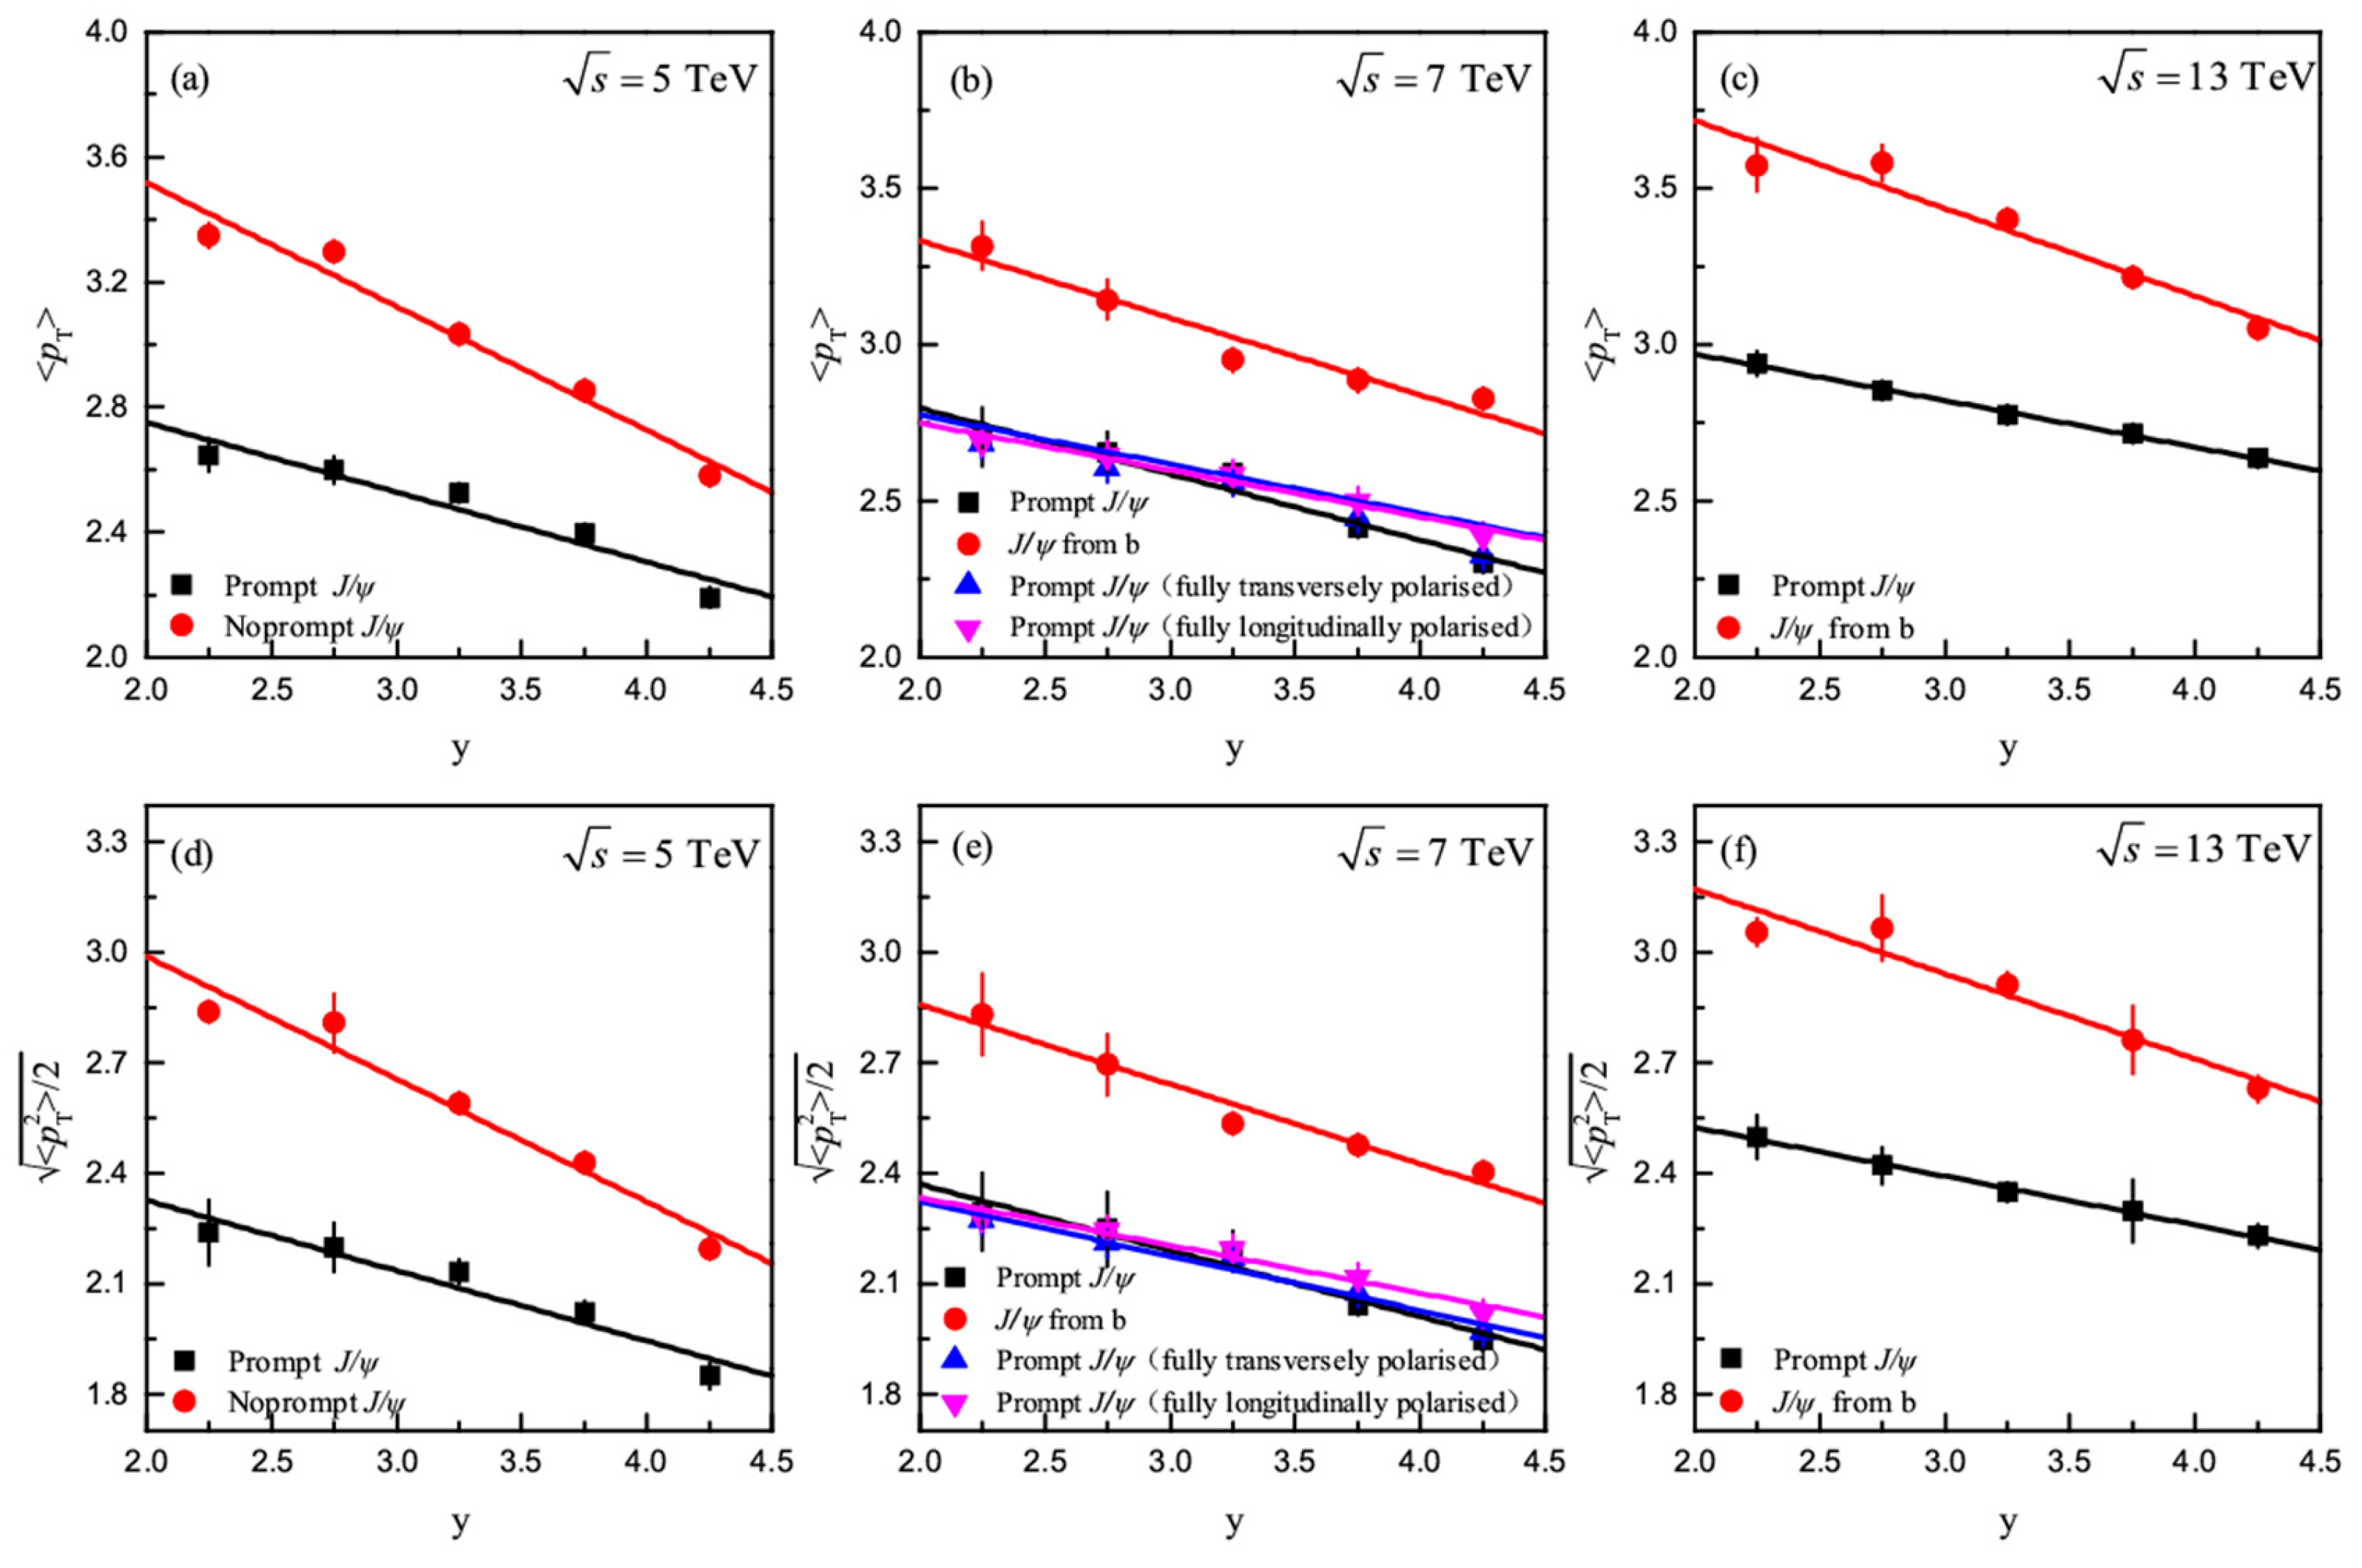
Figure 5. The same as Figure 4, but showing the relationship between physical quantity ((a)-(c) p T , (d)-(f) p T 2 2 )and yforJ/ψmesons produced in pp collisions at 5 TeV, 7 TeV, and 13 TeV.
Preprints 69547 g005
Table 1. Values of parameters and χ 2 / d o f corresponding to the curves in Figure 1, Figure 2 and Figure 3.
Figure Type n T0(GeV) βt χ 2 / d o f p T ( GeV / c ) p T 2 / 2 ( GeV / c )
Figure 1(a) 2.0<y<2.5 7.975±0.580 0.145±0.030 0.162±0.018 1.875 2.647±0.051 2.238±0.088
2.5<y<3.0 8.000±0.620 0.142±0.045 0.150±0.015 0.751 2.600±0.042 2.199±0.067
3.0<y<3.5 8.120±0.650 0.135±0.042 0.143±0.012 0.694 2.526±0.023 2.134±0.033
3.5<y<4.0 8.243±0.650 0.120±0.042 0.118±0.015 0.402 2.397±0.014 2.024±0.028
4.0<y<4.5 8.335±0.635 0.088±0.030 0.080±0.015 0.357 2.191±0.032 1.849±0.034
Figure 1(b) 2.0<y<2.5 6.800±0.530 0.155±0.048 0.270±0.025 1.467 3.350±0.038 2.840±0.027
2.5<y<3.0 6.500±0.530 0.128±0.042 0.250±0.025 1.672 3.298±0.033 2.809±0.078
3.0<y<3.5 6.752±0.543 0.125±0.042 0.200±0.020 0.379 3.036±0.027 2.592±0.026
3.5<y<4.0 7.102±0.570 0.120±0.045 0.182±0.020 0.333 2.852±0.029 2.428±0.027
4.0<y<4.5 7.433±0.565 0.100±0.040 0.142±0.015 0.883 2.584±0.032 2.196±0.031
Figure 2(a) 2.0<y<2.5 7.703±0.522 0.143±0.040 0.162±0.015 1.256 2.706±0.093 2.294±0.104
2.5<y<3.0 7.880±0.520 0.142±0.040 0.161±0.013 0.352 2.657±0.064 2.248±0.100
3.0<y<3.5 8.000±0.550 0.137±0.037 0.152±0.013 0.460 2.590±0.033 2.189±0.053
3.5<y<4.0 8.182±0.550 0.120±0.035 0.120±0.010 0.312 2.414±0.013 2.040±0.012
4.0<y<4.5 8.184±0.556 0.110±0.030 0.085±0.010 0.173 2.300±0.024 1.947±0.013
Figure 2(b) 2.0<y<2.5 6.303±0.517 0.120±0.032 0.240±0.020 1.490 3.316±0.075 2.833±0.109
2.5<y<3.0 6.400±0.520 0.125±0.032 0.192±0.020 0.277 3.143±0.062 2.696±0.082
3.0<y<3.5 6.555±0.520 0.112±0.030 0.162±0.015 0.153 2.951±0.037 2.534±0.021
3.5<y<4.0 6.648±0.520 0.110±0.030 0.153±0.015 0.483 2.886±0.035 2.477±0.019
4.0<y<4.5 6.935±0.525 0.082±0.025 0.200±0.018 0.147 2.827±0.021 2.403±0.014
Figure 2(c) 2.0<y<2.5 7.505±0.500 0.110±0.027 0.173±0.017 0.823 2.679±0.035 2.270±0.013
2.5<y<3.0 7.583±0.500 0.110±0.025 0.153±0.017 0.440 2.604±0.028 2.208±0.028
3.0<y<3.5 7.602±0.503 0.100±0.020 0.150±0.020 0.690 2.559±0.020 2.169±0.012
3.5<y<4.0 7.660±0.510 0.085±0.015 0.130±0.015 0.578 2.445±0.022 2.072±0.012
4.0<y<4.5 7.801±0.450 0.078±0.020 0.102±0.018 0.227 2.322±0.018 1.967±0.010
Figure 2(d) 2.0<y<2.5 7.503±0.477 0.115±0.030 0.170±0.020 0.706 2.688±0.025 2.279±0.036
2.5<y<3.0 7.505±0.470 0.115±0.025 0.155±0.015 0.158 2.646±0.023 2.246±0.029
3.0<y<3.5 7.600±0.450 0.104±0.025 0.156±0.015 0.254 2.588±0.018 2.193±0.011
3.5<y<4.0 7.702±0.450 0.095±0.020 0.143±0.017 0.945 2.500±0.015 2.116±0.013
4.0<y<4.5 7.706±0.474 0.068±0.012 0.133±0.017 0.283 2.386±0.019 2.018±0.014
Figure 3(a) 2.0<y<2.5 7.202±0.500 0.145±0.035 0.194±0.024 0.950 2.940±0.037 2.500±0.059
2.5<y<3.0 7.430±0.520 0.142±0.030 0.190±0.025 0.849 2.853±0.022 2.421±0.049
3.0<y<3.5 7.632±0.578 0.135±0.030 0.190±0.020 0.799 2.777±0.012 2.349±0.018
3.5<y<4.0 7.701±0.580 0.128±0.028 0.183±0.023 1.703 2.716±0.005 2.296±0.084
4.0<y<4.5 7.820±0.580 0.128±0.020 0.165±0.025 1.578 2.637±0.003 2.230±0.031
Figure 3(b) 2.0<y<2.5 6.107±0.443 0.157±0.032 0.253±0.027 0.439 3.574±0.084 3.055±0.037
2.5<y<3.0 6.000±0.400 0.148±0.028 0.250±0.030 0.540 3.581±0.055 3.065±0.088
3.0<y<3.5 6.203±0.403 0.138±0.028 0.234±0.026 0.608 3.402±0.021 2.912±0.033
3.5<y<4.0 6.252±0.372 0.122±0.020 0.200±0.020 0.529 3.217±0.026 2.762±0.091
4.0<y<4.5 6.350±0.380 0.118±0.020 0.163±0.017 1.909 3.053±0.022 2.629±0.036
Table 2. Values of intercepts, slopes, and χ 2 / d o f corresponding to the lines in Figure 4 and Figure 5.
Figure Type Intercept Slope χ 2 / d o f
Figure 4(a) prompt J/ψ 7.509±0.057 0.193±0.017 0.003
nopromptJ/ψ 5.703±0.429 0.374±0.129 0.193
Figure 4(b) prompt J/ψ 7.168±0.101 0.253±0.030 0.010
J/ψ from b 5.585±0.111 0.302±0.033 0.014
prompt J/ψ(fully transversely polarized) 7.195±0.067 0.134±0.020 0.006
prompt J/ψ(fully longitudinally polarized) 7.211±0.064 0.121±0.019 0.006
Figure 4(c) prompt J/ψ 6.577±0.108 0.301±0.033 0.012
J/ψ from b 5.703±0.141 0.148±0.042 0.035
Figure 4(d) prompt J/ψ 0.214±0.019 -0.027±0.006 0.095
nopromptJ/ψ 0.202±0.014 -0.024±0.004 0.029
Figure 4(e) prompt J/ψ 0.188±0.010 -0.018±0.003 0.021
J/ψ from b 0.169±0.018 -0.018±0.005 0.116
prompt J/ψ(fully transversely polarized) 0.154±0.008 -0.018±0.002 0.041
prompt J/ψ(fully longitudinally polarized) 0.173±0.015 -0.023±0.005 0.252
Figure 4(f) prompt J/ψ 0.167±0.004 -0.010±0.001 0.008
J/ψ from b 0.204±0.005 -0.021±0.002 0.020
Figure 4(g) prompt J/ψ 0.258±0.021 -0.039±0.006 0.684
nopromptJ/ψ 0.419±0.015 -0.065±0.005 0.145
Figure 4(h) prompt J/ψ 0.263±0.026 -0.039±0.008 1.336
J/ψ from b 0.267±0.061 -0.024±0.018 3.890
prompt J/ψ(fully transversely polarized) 0.249±0.014 -0.033±0.004 0.172
prompt J/ψ(fully longitudinally polarized) 0.207±0.007 -0.017±0.002 0.072
Figure 4(i) prompt J/ψ 0.227±0.011 -0.013±0.003 0.071
J/ψ from b 0.369±0.025 -0.046±0.007 0.339
Figure 5(a) prompt J/ψ 3.197±0.106 -0.223±0.032 5.515
nopromptJ/ψ 4.310±0.122 -0.396±0.037 3.867
Figure 5(b) prompt J/ψ 3.219±0.079 -0.211±0.024 1.735
J/ψ from b 3.827±0.106 -0.247±0.032 3.345
prompt J/ψ(fully transversely polarized) 3.089±0.052 -0.157±0.016 1.976
prompt J/ψ(fully longitudinally polarized) 3.049±0.049 -0.150±0.015 1.941
Figure 5(c) prompt J/ψ 3.268±0.014 -0.149±0.004 0.639
J/ψ from b 4.279±0.121 -0.281±0.036 2.582
Figure 5(d) prompt J/ψ 2.708±0.090 -0.191±0.027 1.809
nopromptJ/ψ 3.658±0.115 -0.334±0.035 3.347
Figure 5(e) prompt J/ψ 2.730±0.063 -0.180±0.019 1.212
J/ψ from b 3.290±0.072 -0.216±0.022 3.840
prompt J/ψ(fully transversely polarized) 2.619±0.045 -0.148±0.013 4.597
prompt J/ψ(fully longitudinally polarized) 2.594±0.043 -0.130±0.013 2.625
Figure 5(f) prompt J/ψ 2.791±0.015 -0.133±0.005 0.121
J/ψ from b 3.635±0.101 -0.231±0.030 1.463
Disclaimer/Publisher’s Note: The statements, opinions and data contained in all publications are solely those of the individual author(s) and contributor(s) and not of MDPI and/or the editor(s). MDPI and/or the editor(s) disclaim responsibility for any injury to people or property resulting from any ideas, methods, instructions or products referred to in the content.
Copyright: This open access article is published under a Creative Commons CC BY 4.0 license, which permit the free download, distribution, and reuse, provided that the author and preprint are cited in any reuse.
Prerpints.org logo

Preprints.org is a free preprint server supported by MDPI in Basel, Switzerland.

Subscribe

© 2024 MDPI (Basel, Switzerland) unless otherwise stated