Submitted:
14 March 2023
Posted:
15 March 2023
You are already at the latest version
Abstract
Keywords:
1. Introduction
2. Materials and Methods
2.1. Bacteria Growth Conditions and Treatments
2.2. RNA Extraction, Library Preparation and Illumina Hiseq Sequencing
2.3. Metabolites Measurement and Analysis
2.4. Gene Expression Verification
2.5. Statistical Analysis
3. Results
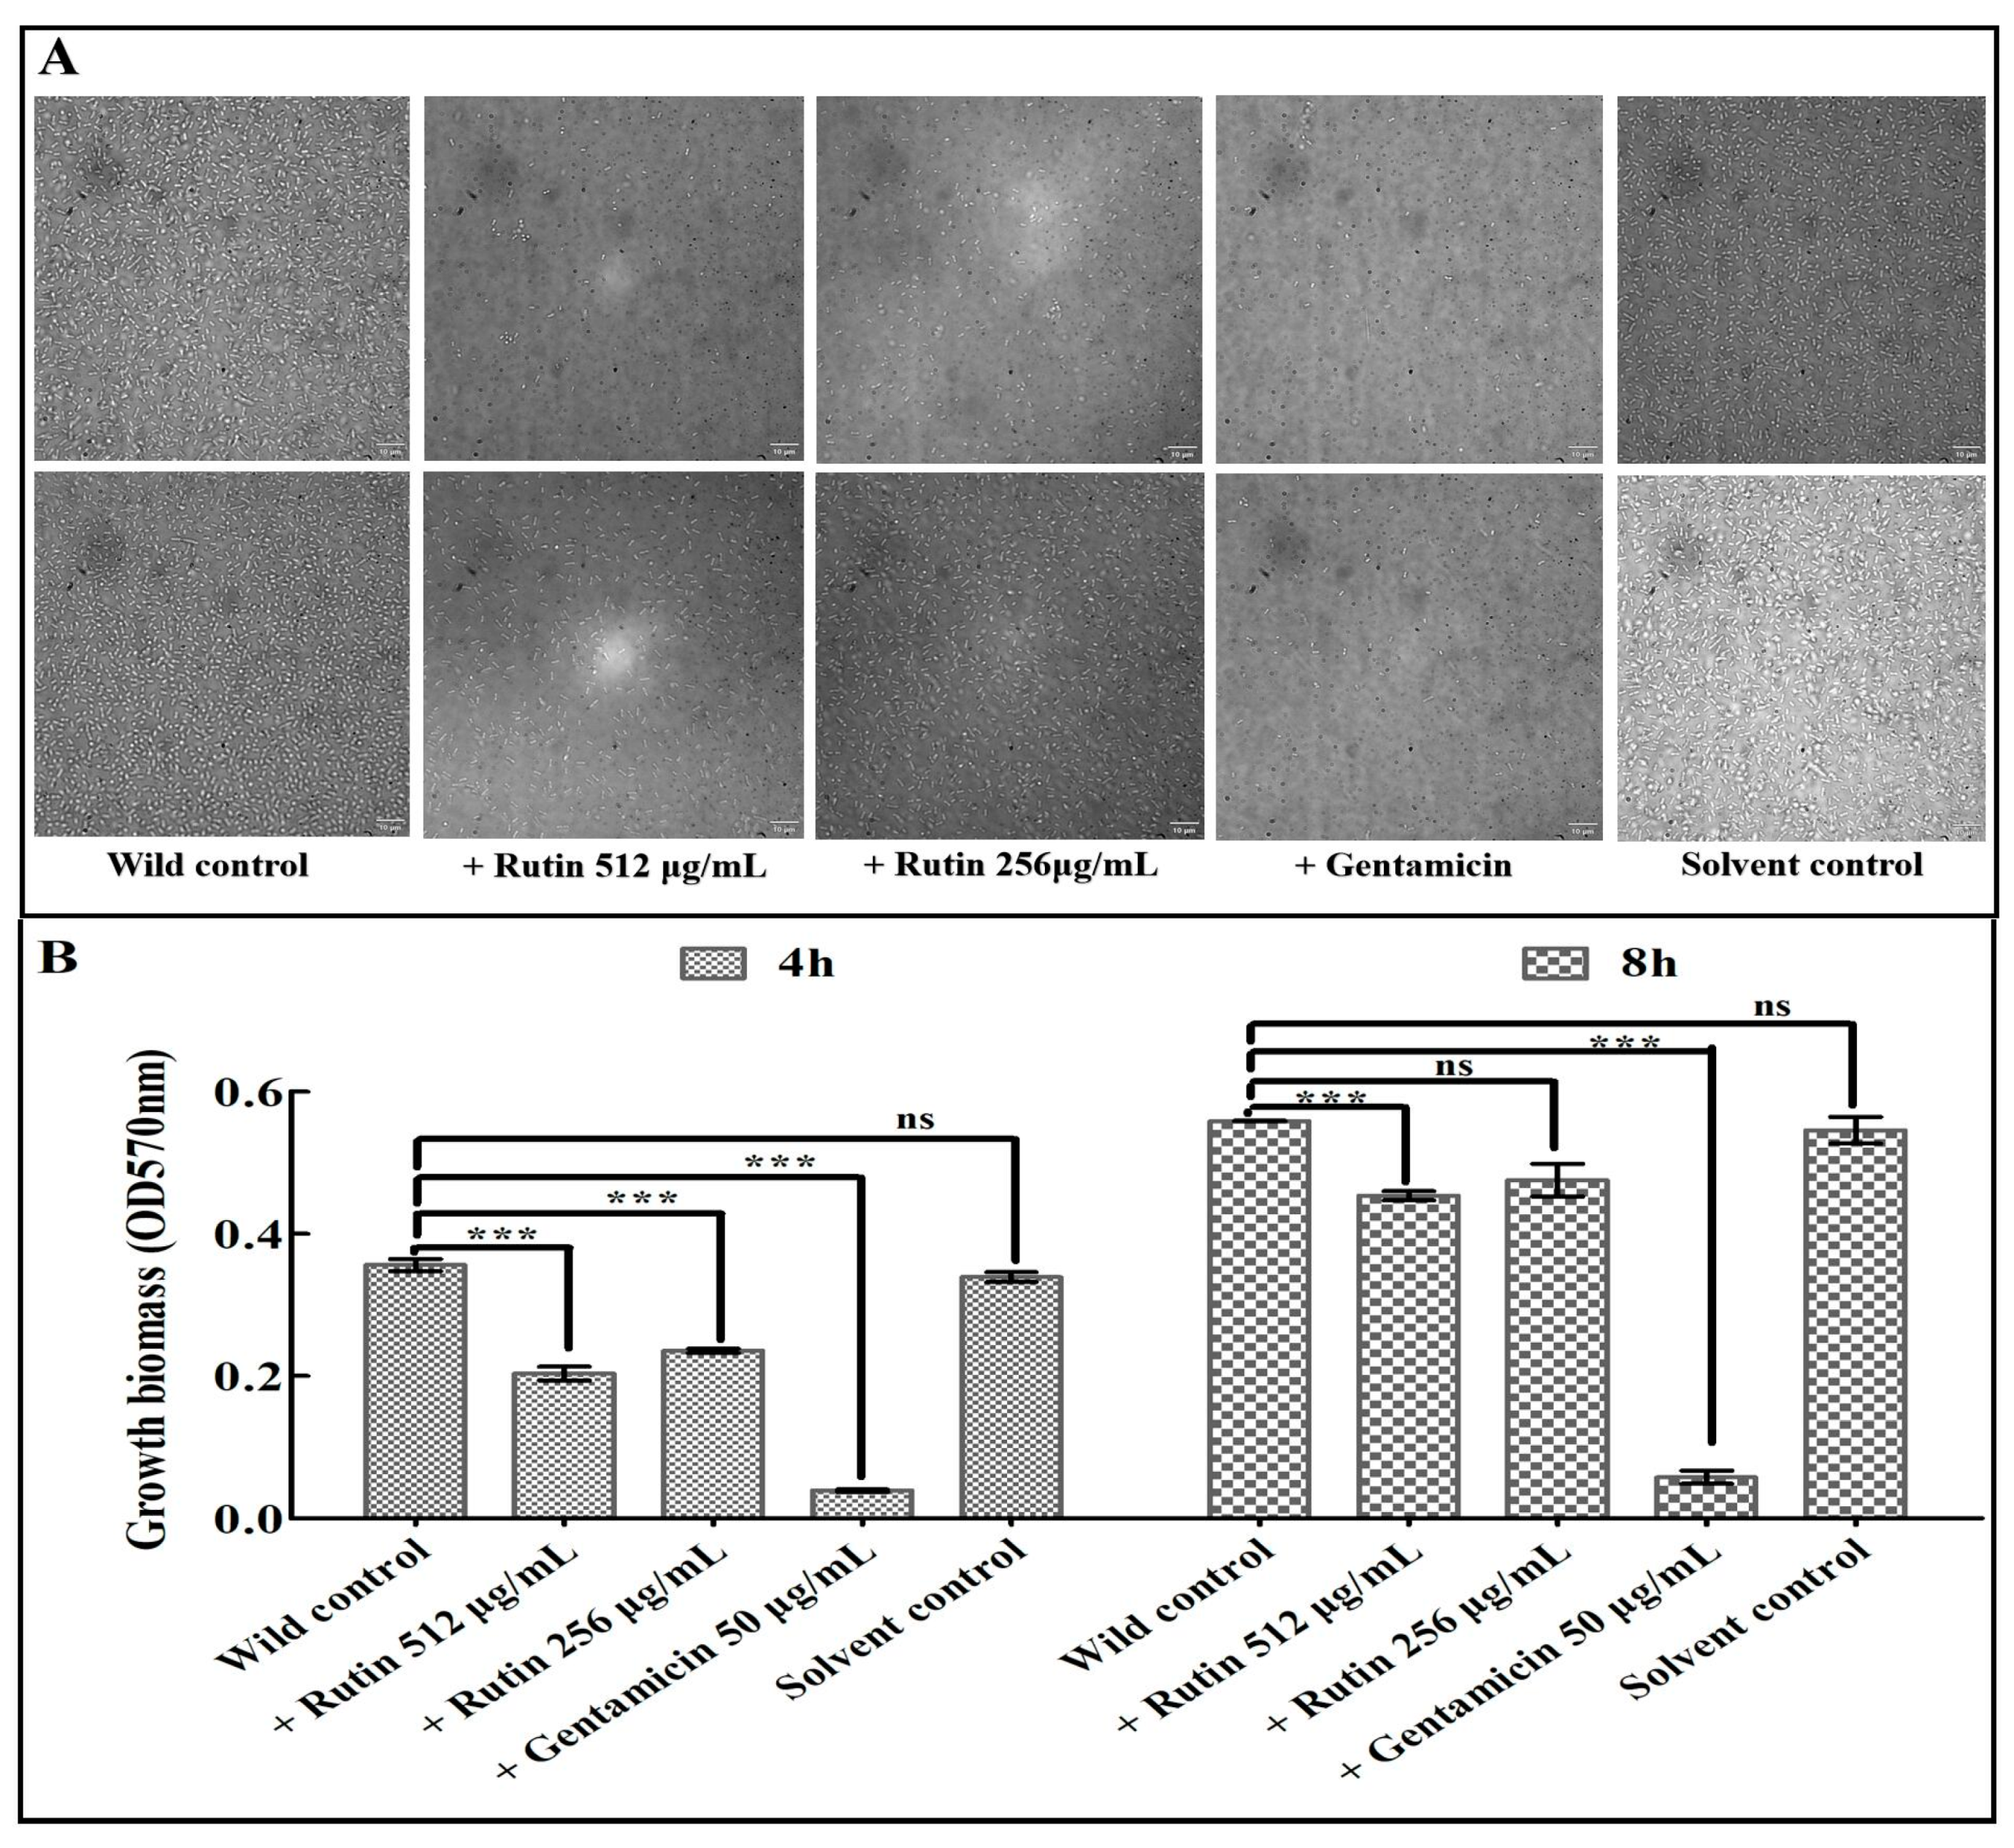
3.1. Inhibition of Rutin and Luteolin on the Growth of K. pneumoniae Strain
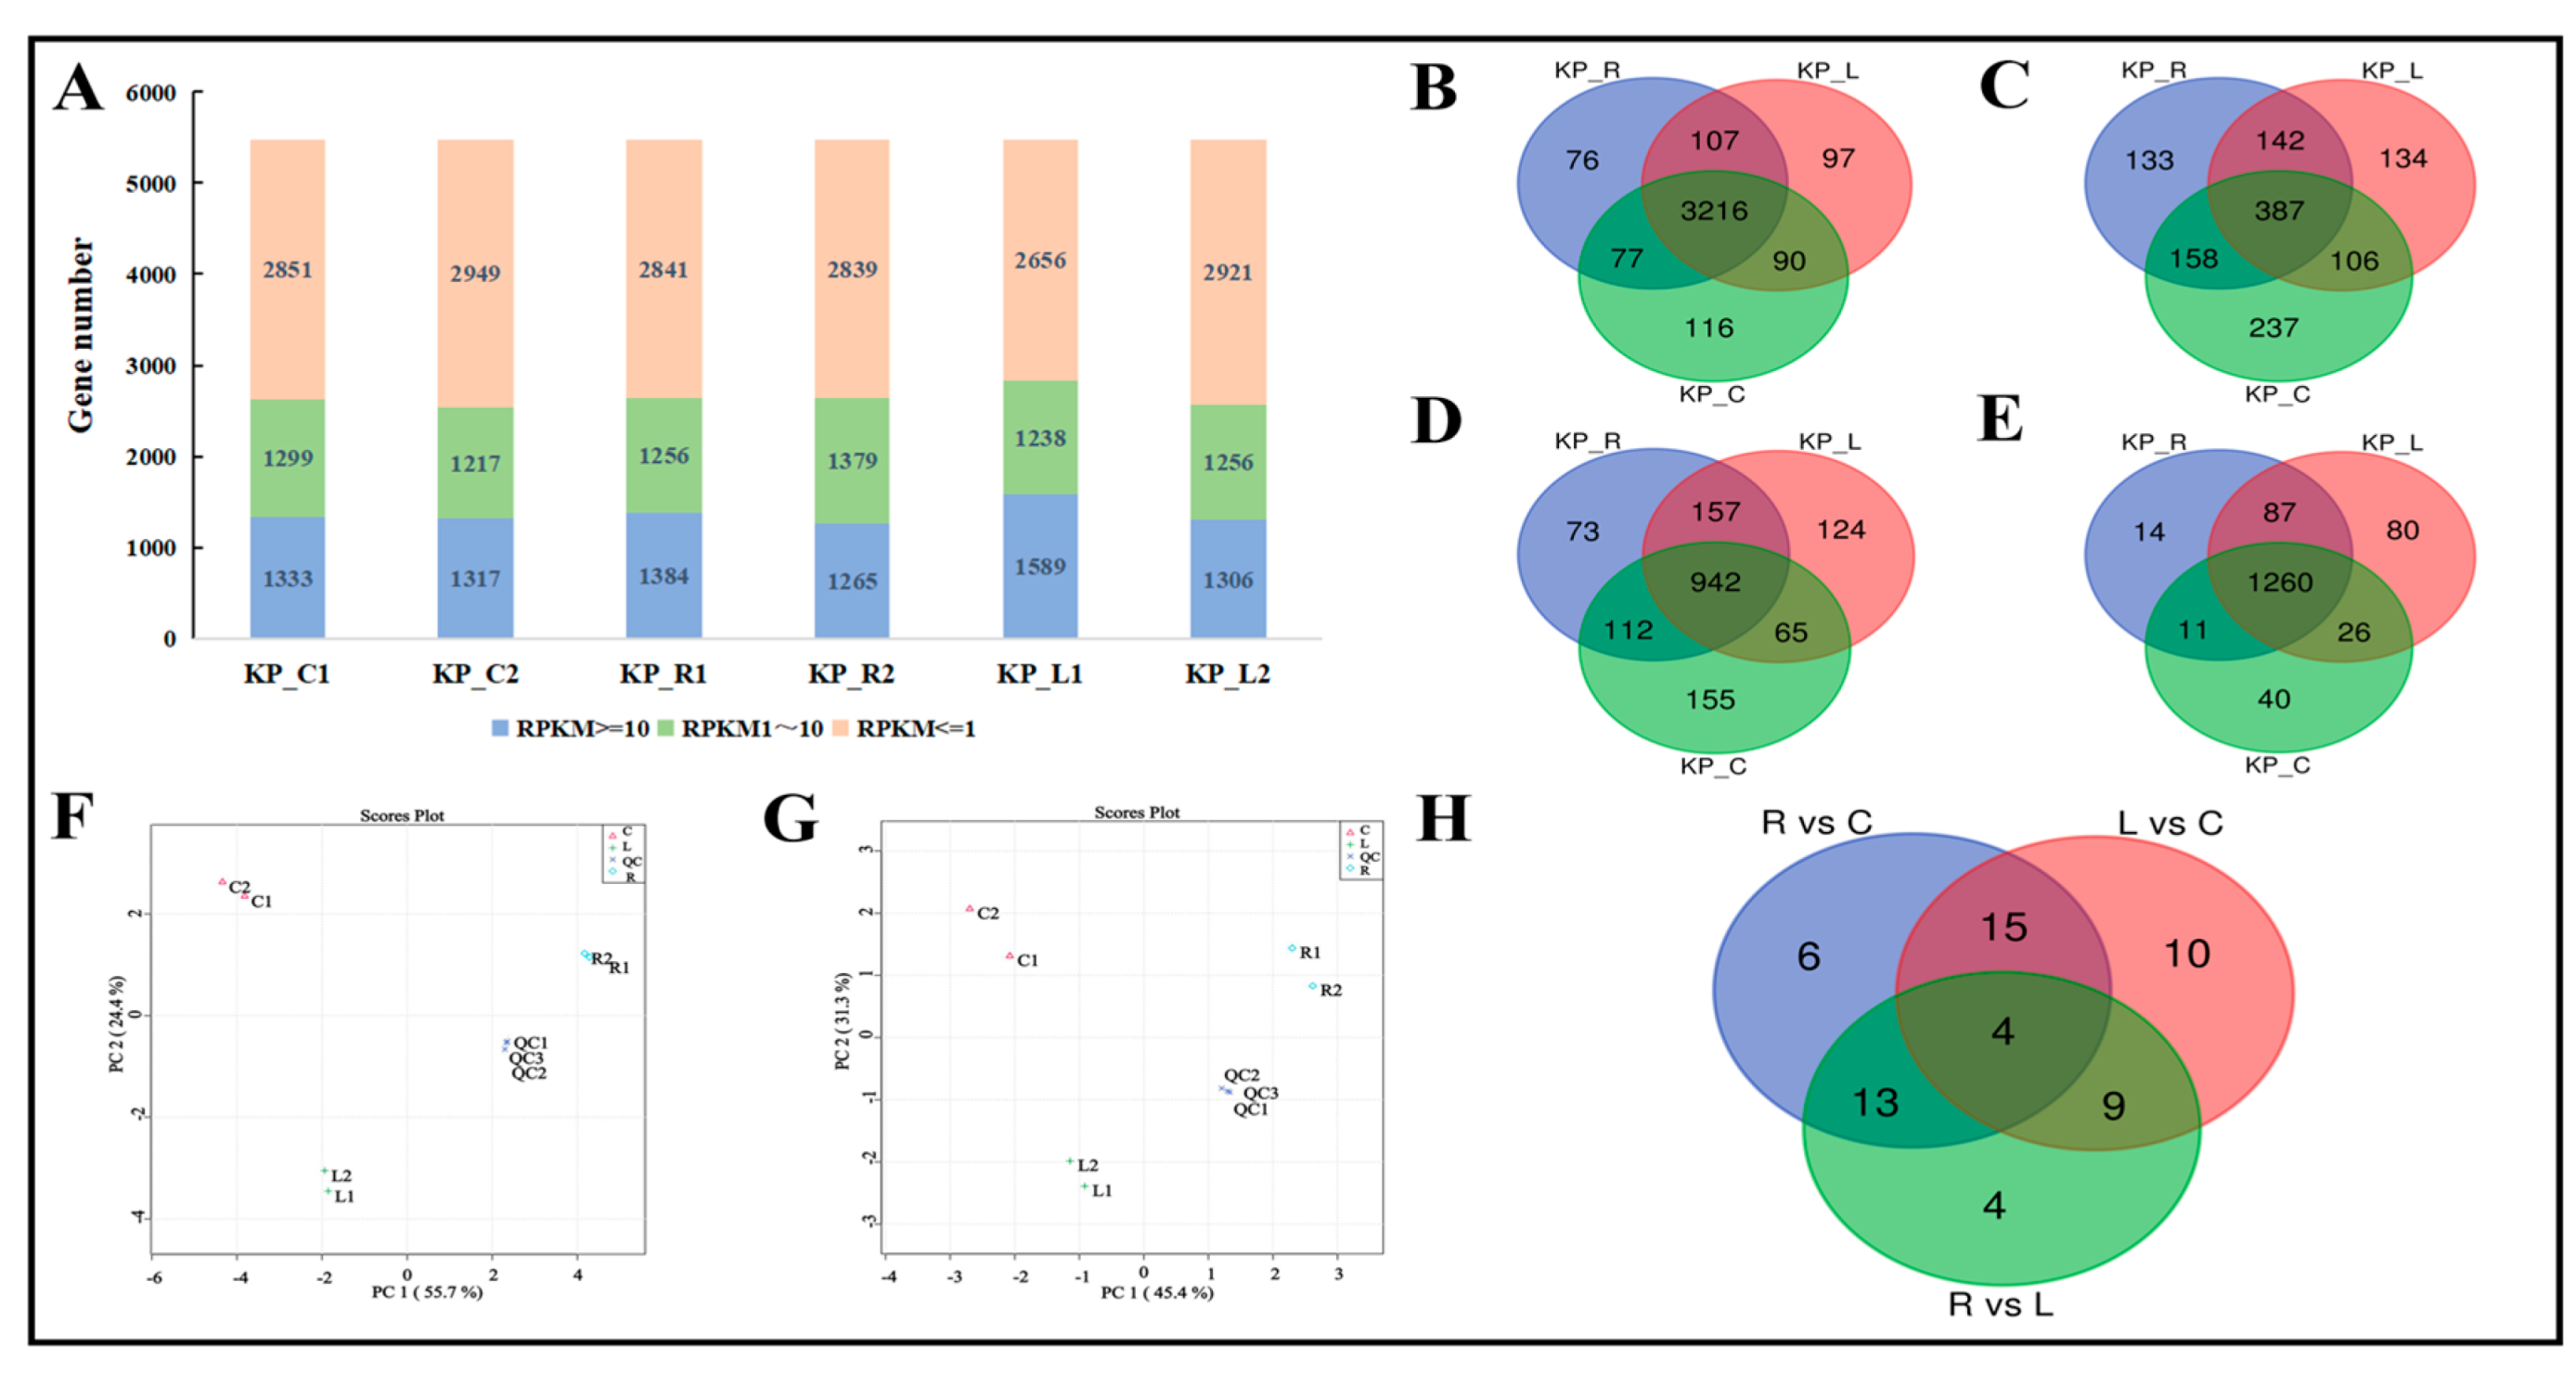
3.2 Differentially Expressed Genes and Metabolites in Response to Rutin and Luteolin Treatments
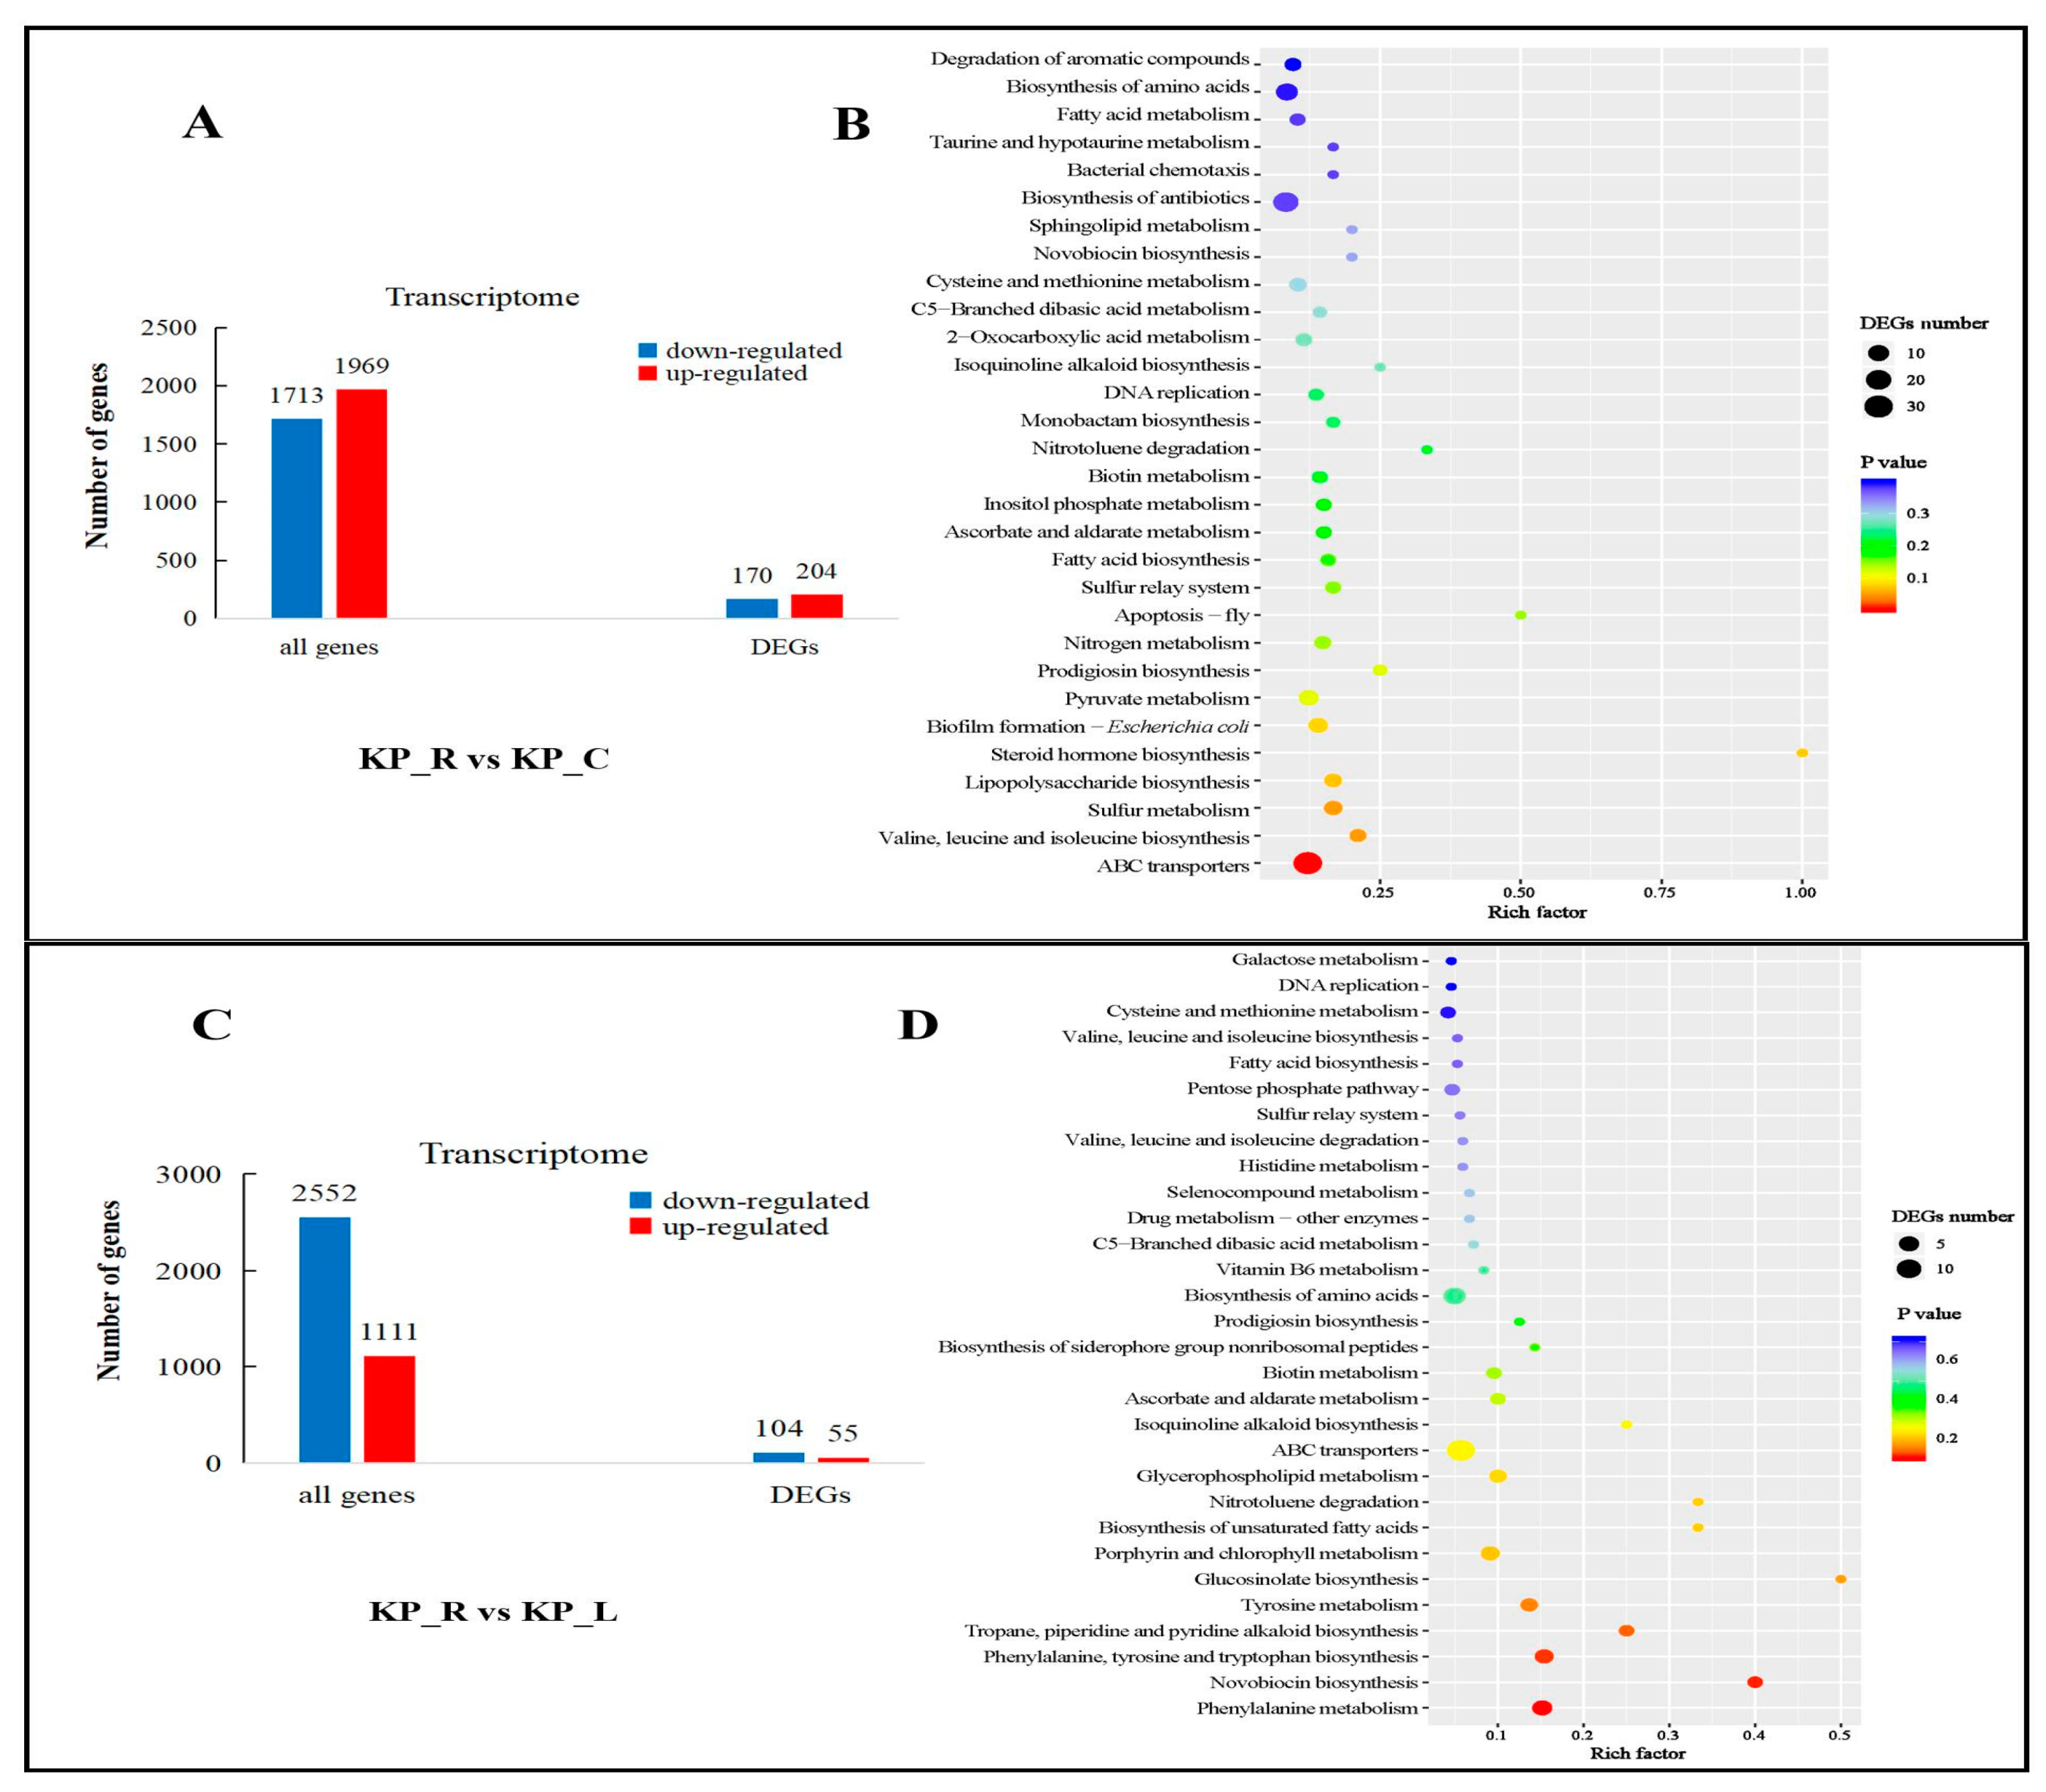
3.3. Annotation and Enrichment Analysis of DEGs
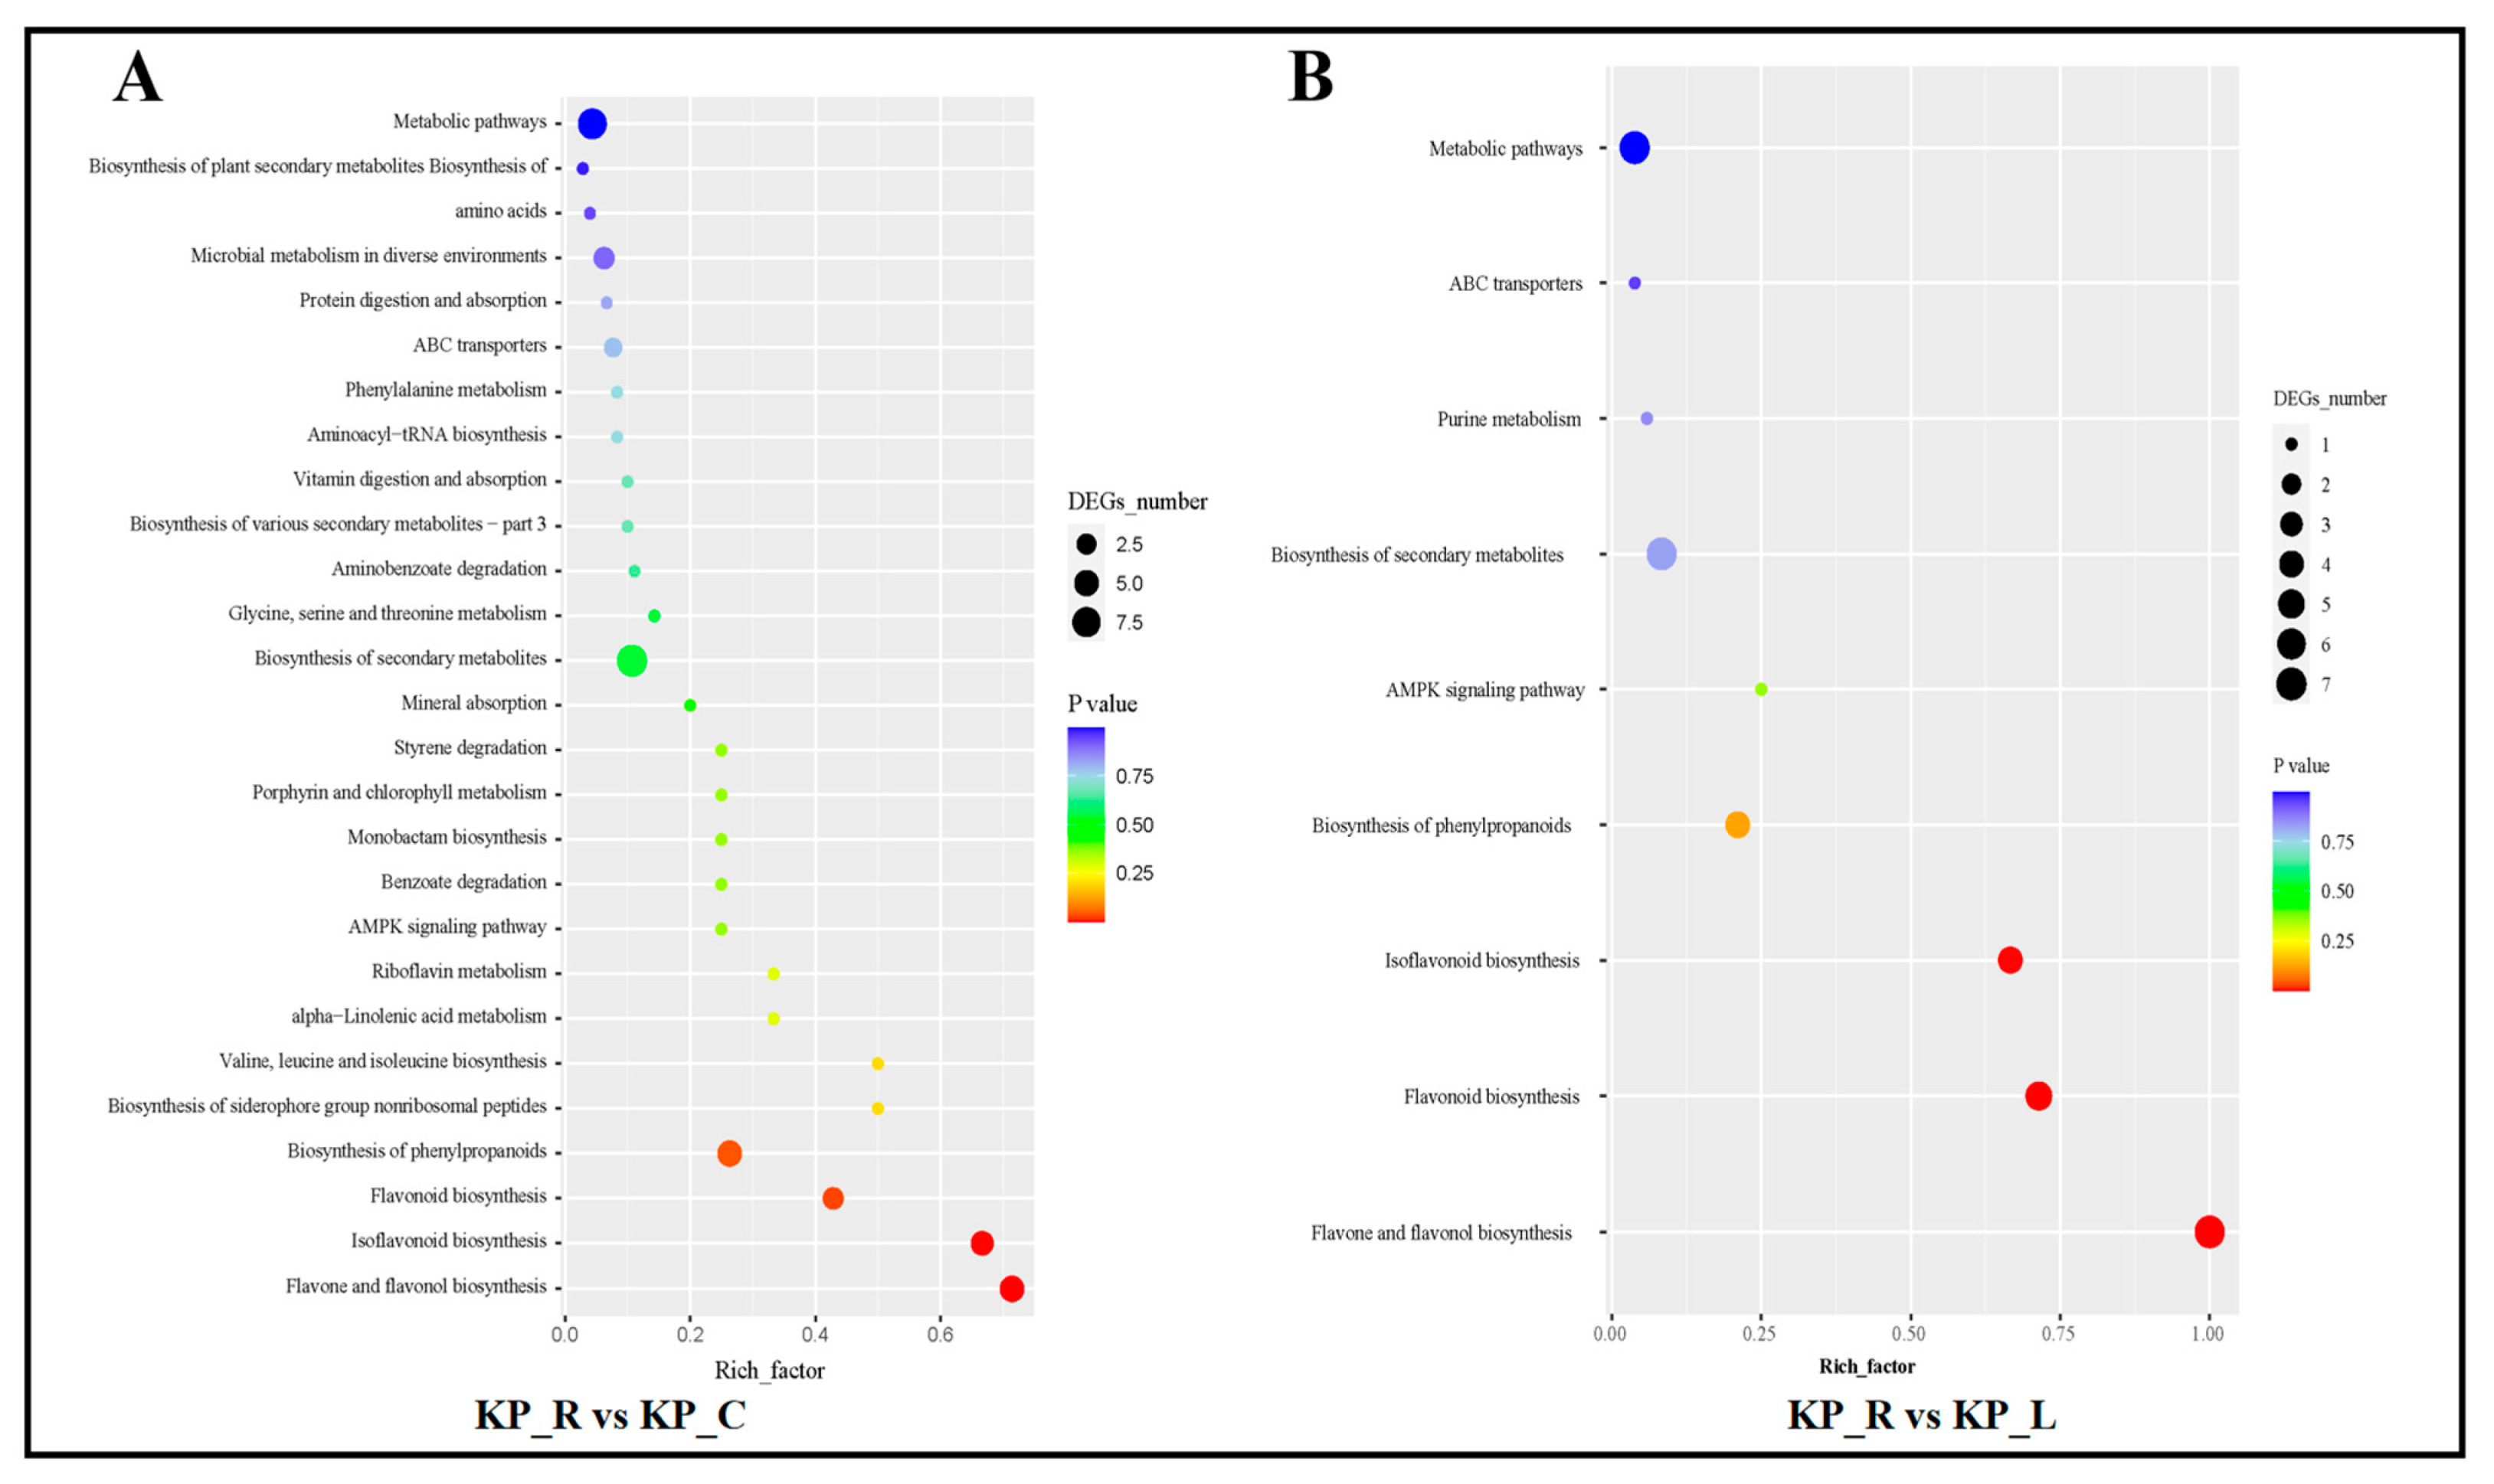
3.4. Annotation and Enrichment Analysis of DEMs
3.5. Integrated Analysis of Transcriptomics and Metabolomics
3.6. Correlation Network Between the Metabolites and Genes
3.8. Gene Validation
4. Discussion
5. Conclusions
Supplementary Materials
Author Contributions
Funding
Institutional Review Board Statement
Informed Consent Statement
Data Availability Statement
Acknowledgments
Conflicts of Interest
References
- Kupnik, K.; Primožič, M.; Vasić, K.; Knez, Ž.; Leitgeb, M. A Comprehensive Study of the Antibacterial Activity of Bioactive Juice and Extracts from Pomegranate ( Punica granatum L.) Peels and Seeds. Plants (Basel, Switzerland) 2021, 10. [Google Scholar] [CrossRef] [PubMed]
- Fu, Y.; Yang. Z; Cai. Y.; Liu, H.; Li, S.; Kou. N.; Wu. J.; Zhang. Q. Effect of Bloodletting at Shaoshang and Shangyang Acupuncture Points on Outcome and Prognosis of Severe Community-Acquired Pneumonia in the Elderly. Disease markers 2021, 2021, 3295021. [Google Scholar] [CrossRef] [PubMed]
- Wang. P.; Jiang. S.; Li. Y.; Luo. Q.; Lin. J.; Hu. L.; Liu. X.; Xue. F.Virus-like mesoporous silica-coated plasmonic Ag nanocube with strong bacteria adhesion for diabetic wound ulcer healing. Nanomedicine : nanotechnology, biology, and medicine 2021, 34, 102381. [Google Scholar]
- Singh. V.; Chibale. K. Strategies to Combat Multi-Drug Resistance in Tuberculosis. Accounts of chemical research 2021, 54, 2361–2376. [Google Scholar] [CrossRef] [PubMed]
- 5. Montenegro. C.; Gonçalves. G.; Oliveira Filho. A.; Lira. A.; Cassiano. T.; Lima. N.; Barbosa-Filho. J.; Diniz. M.; Pessôa. H. In Silico Study and Bioprospection of the Antibacterial and Antioxidant Effects of Flavone and Its Hydroxylated Derivatives. Molecules (Basel, Switzerland), 2017; 22.
- Farhadi. F.; Khameneh. B.; Iranshahi. M. Antibacterial activity of flavonoids and their structure-activity relationship: An update review. Phytotherapy research : PTR 2019, 33, 13–40. [Google Scholar] [CrossRef]
- Lin. S.; Wade. J.; Liu. S. De Novo Design of Flavonoid-Based Mimetics of Cationic Antimicrobial Peptides: Discovery, Development, and Applications. Accounts of chemical research 2021, 54, 104–119. [Google Scholar] [CrossRef] [PubMed]
- 8. Sheng. Z.; Jiang. Y.; Liu. J.; Yang. B. UHPLC-MS/MS Analysis on Flavonoids Composition in and Their Antioxidant Activity. Antioxidants (Basel, Switzerland), 2021; 10.
- Wang. Z.; Yu. Q.; Shen. W.; El Mohtar. C.; Zhao. X.; Gmitter. F. Functional study of CHS gene family members in citrus revealed a novel CHS gene affecting the production of flavonoids. BMC plant biology 2018, 18, 189. [Google Scholar]
- Li. G.; Ding. K.; Qiao. Y.; Zhang. L.; Zheng. L.; Pan. T.; Zhang. L. Flavonoids Regulate Inflammation and Oxidative Stress in Cancer. Molecules 2020, 25, 5628. [Google Scholar] [CrossRef] [PubMed]
- Harborne. JB.; Williams. CA. Advances in flavonoid research since 1992. Phytochemistry 2000, 55, 481–504. [Google Scholar] [CrossRef]
- Cushnie. T.; Lamb. A. Antimicrobial activity of flavonoids. International journal of antimicrobial agents 2005, 26, 343–356. [Google Scholar] [CrossRef]
- Farhadi. F.; Khameneh. B.; Iranshahi. M.; Iranshahy. M. Antibacterial activity of flavonoids and their structure-activity relationship: An update review. Phytotherapy research : PTR 2019, 33, 13–40. [Google Scholar] [CrossRef] [PubMed]
- 14. Aleebrahim-Dehkordy. E.; Rafieian-Kopaei. M. In Vitro Evaluation of Antioxidant Activity and Antibacterial Effects and Measurement of Total Phenolic and Flavonoid Contents of Quercus brantii L. Fruit Extract. 2019; 16, 408–416.
- Benevides Bahiense. J.; Marques. F.; Figueira. M.; Vargas. T.; Kondratyuk. T.; Endringer. D.; Scherer. R.; Fronza. M. Potential anti-inflammatory, antioxidant and antimicrobial activities of Sambucus australis. Pharmaceutical biology 2017, 55, 991–997. [Google Scholar] [CrossRef] [PubMed]
- 16. Duda-Madej. A.; Kozłowska. J.; Krzyżek. P.; Anioł. M.; Seniuk. A.; Jermakow. K.; Dworniczek. E. Antimicrobial O-Alkyl Derivatives of Naringenin and Their Oximes Against Multidrug-Resistant Bacteria. Molecules (Basel, Switzerland), 2020; 25.
- Xiao. Z.; Wang. X.; Wang. P.; Zhou. Y.; Zhang. J.; Zhang. L.; Zhou. J.; Zhou. S.; Ouyang. H.; Lin. X. Design, synthesis and evaluation of novel fluoroquinolone-flavonoid hybrids as potent antibiotics against drug-resistant microorganisms. European journal of medicinal chemistry 2014, 80, 92–100. [Google Scholar] [CrossRef] [PubMed]
- Eumkeb. G.; Chukrathok. S. Synergistic activity and mechanism of action of ceftazidime and apigenin combination against ceftazidime-resistant Enterobacter cloacae. Phytomedicine 2013, 20, 262–269. [Google Scholar] [CrossRef] [PubMed]
- Lo Giudice. A.; Bruni. V.; Michaud. L. Characterization of Antarctic psychrotrophic bacteria with antibacterial activities against terrestrial microorganisms. Journal of basic microbiology 2007, 47, 496–505. [Google Scholar] [CrossRef]
- Wallace. J.; Bowlin. N.; Mills. D.; Saenkham. P.; Kwasny. S.; Opperman. T.; Williams. J.; Rock. C.; Bowlin. T.; Moir. D. Discovery of bacterial fatty acid synthase type II inhibitors using a novel cellular bioluminescent reporter assay. Antimicrobial agents and chemotherapy 2015, 59, 5775–5787. [Google Scholar] [CrossRef] [PubMed]
- Rütschlin. S.; Böttcher. T. Inhibitors of Bacterial Swarming Behavior. Chemistry (Weinheim an der Bergstrasse, Germany) 2020, 26, 964–979. [Google Scholar]
- Górniak. I.; Bartoszewski. R.; Króliczewski. J. Comprehensive review of antimicrobial activities of plant flavonoids. Phytochemistry Reviews 2019, 18, 241–272. [Google Scholar] [CrossRef]
- Lee. J.; Regmi. S.; Kim. J.; Cho. M.; Yun. H.; Lee. C.; Lee. J. Apple flavonoid phloretin inhibits Escherichia coli O157, H7 biofilm formation and ameliorates colon inflammation in rats. Infection and immunity 2011, 79, 4819–4827. [Google Scholar] [CrossRef]
- Silva. L.; Zimmer. K.; Macedo. A.; Trentin. D. Plant Natural Products Targeting Bacterial Virulence Factors. Chemical reviews 2016, 116, 9162–9236. [Google Scholar] [CrossRef]
- Tsou. L.; Lara-Tejero. M.; RoseFigura. J.; Zhang. Z.; Wang. Y.; Yount. J.; Lefebre. M.; Dossa. P.; Kato. J.; Guan. F. Antibacterial Flavonoids from Medicinal Plants Covalently Inactivate Type III Protein Secretion Substrates. Journal of the American Chemical Society 2016, 138, 2209–2218. [Google Scholar] [CrossRef] [PubMed]
- Mehta. J.; Utkarsh. K.; Fuloria. S.; Singh. T.; Sekar. M.; Salaria. D.; Rolta. R.; Begum. MY.; Gan. SH.; Rani. NNIM. Antibacterial Potential of Bacopa monnieri (L.) Wettst. and Its Bioactive Molecules against Uropathogens—An In Silico Study to Identify Potential Lead Molecule(s) for the Development of New Drugs to Treat Urinary Tract Infections. Molecules 2022, 27, 4971. [Google Scholar]
- Ble-González. EA.; Gómez-Rivera. A.; Zamilpa. A.; López-Rodríguez. R.; Lobato-García. CE.; Álvarez-Fitz. P.; Gutierrez-Roman. AS.; Perez-García. MD.; Bugarin. A.; González-Cortazar. M. Ellagitannin, Phenols, and Flavonoids as Antibacterials from Acalypha arvensis (Euphorbiaceae). Plants 2022, 11, 300. [Google Scholar]
- Cushnie. T.; Lamb. A. Recent advances in understanding the antibacterial properties of flavonoids. International journal of antimicrobial agents 2011, 38, 99–107. [Google Scholar] [CrossRef] [PubMed]
- Lewis. K.; Ausubel. F. Prospects for plant-derived antibacterials. Nature biotechnology 2006, 24, 1504–1507. [Google Scholar] [CrossRef] [PubMed]
- Wang. Z.; Ding. Z.; Li. Z.; Ding. Y.; Jiang. F.; Liu. J. Antioxidant and antibacterial study of 10 flavonoids revealed rutin as a potential antibiofilm agent in Klebsiella pneumoniae strains isolated from hospitalized patients. Microbial pathogenesis 2021, 105121. [Google Scholar]
- Chia. L.; Hornung. B.; Aalvink. S.; Schaap. P.; de Vos. W.; Knol. J.; Belzer. C. Deciphering the trophic interaction between Akkermansia muciniphila and the butyrogenic gut commensal Anaerostipes caccae using a metatranscriptomic approach. Antonie van Leeuwenhoek 2018, 111, 859–873. [Google Scholar] [CrossRef] [PubMed]
- De Araujo. C.; Balestrino. D.; Roth. L.; Charbonnel. N.; Forestier, C. Quorum sensing affects biofilm formation through lipopolysaccharide synthesis in Klebsiella pneumoniae. Research in microbiology 2010, 161, 595–603. [Google Scholar] [CrossRef] [PubMed]
- Livak. KJ.; Schmittgen. TD. Analysis of Relative Gene Expression Data Using Real-Time Quantitative PCR and the 2−ΔΔCT Method. Methods 2001, 25, 402–408. [Google Scholar] [CrossRef]
- Inagaki. K.; Lucar. J.; Blackshear. C.; Hobbs. CV. Methicillin-susceptible and Methicillin-resistant Staphylococcus aureus Bacteremia: Nationwide Estimates of 30-Day Readmission, In-hospital Mortality, Length of Stay, and Cost in the United States. Clinical Infectious Diseases 2019, 69, 2112–2118. [Google Scholar]
- Acquaviva. R.; D’Angeli. F.; Malfa. GA.; Ronsisvalle. S.; Garozzo. A.; Stivala. A.; Ragusa. S.; Nicolosi. D.; Salmeri. M.; Genovese. C. Antibacterial and anti-biofilm activities of walnut pellicle extract (Juglans regia L.) against coagulase-negative staphylococci. Natural product research 2021, 35, 2076–2081. [Google Scholar] [CrossRef] [PubMed]
- Abdel-Shafi. S.; Al-Mohammadi. A-R.; Sitohy. M.; Mosa. B.; Ismaiel. A.; Enan. G.; Osman. A. Antimicrobial Activity and Chemical Constitution of the Crude, Phenolic-Rich Extracts of Hibiscus sabdariffa, Brassica oleracea and Beta vulgaris. Molecules 2019, 24, 4280. [Google Scholar] [CrossRef] [PubMed]
- Khan. M.; Tang. H.; Lyles. J.; Pineau. R.; Mashwani. Z.; Quave. C. Antibacterial Properties of Medicinal Plants From Pakistan Against Multidrug-Resistant ESKAPE Pathogens. Frontiers in pharmacology 2018, 9, 815. [Google Scholar] [CrossRef] [PubMed]
- Wang. T-y.; Li. Q.; Bi. K-s. Bioactive flavonoids in medicinal plants: Structure, activity and biological fate. Asian Journal of Pharmaceutical Sciences 2018, 13, 12–23. [Google Scholar] [CrossRef] [PubMed]
- Mandalari. G.; Bennett. R.; Bisignano. G.; Trombetta. D.; Saija. A.; Faulds. C.; Gasson. M.; Narbad. A. Antimicrobial activity of flavonoids extracted from bergamot (Citrus bergamia Risso) peel, a byproduct of the essential oil industry. Journal of applied microbiology 2007, 103, 2056–2064. [Google Scholar] [CrossRef]
- Wang. S.; Wang. C.; Gao. L.; Cai. H.; Zhou. Y.; Yang. Y.; Xu. C.; Ding. W.; Chen. J.; Muhammad. I. Rutin Inhibits Streptococcus suis Biofilm Formation by Affecting CPS Biosynthesis. Front Pharmacol 2017, 8, 379. [Google Scholar] [CrossRef] [PubMed]
- Pal. A.; Tripathi. A. Quercetin inhibits carbapenemase and efflux pump activities among carbapenem-resistant Gram-negative bacteria. APMIS : acta pathologica, microbiologica, et immunologica Scandinavica 2020, 128, 251–259. [Google Scholar] [CrossRef]
- Orhan. D.; Ozçelik. B.; Ozgen. S.; Ergun. F. Antibacterial, antifungal, and antiviral activities of some flavonoids. Microbiological research 2010, 165, 496–504. [Google Scholar] [CrossRef]
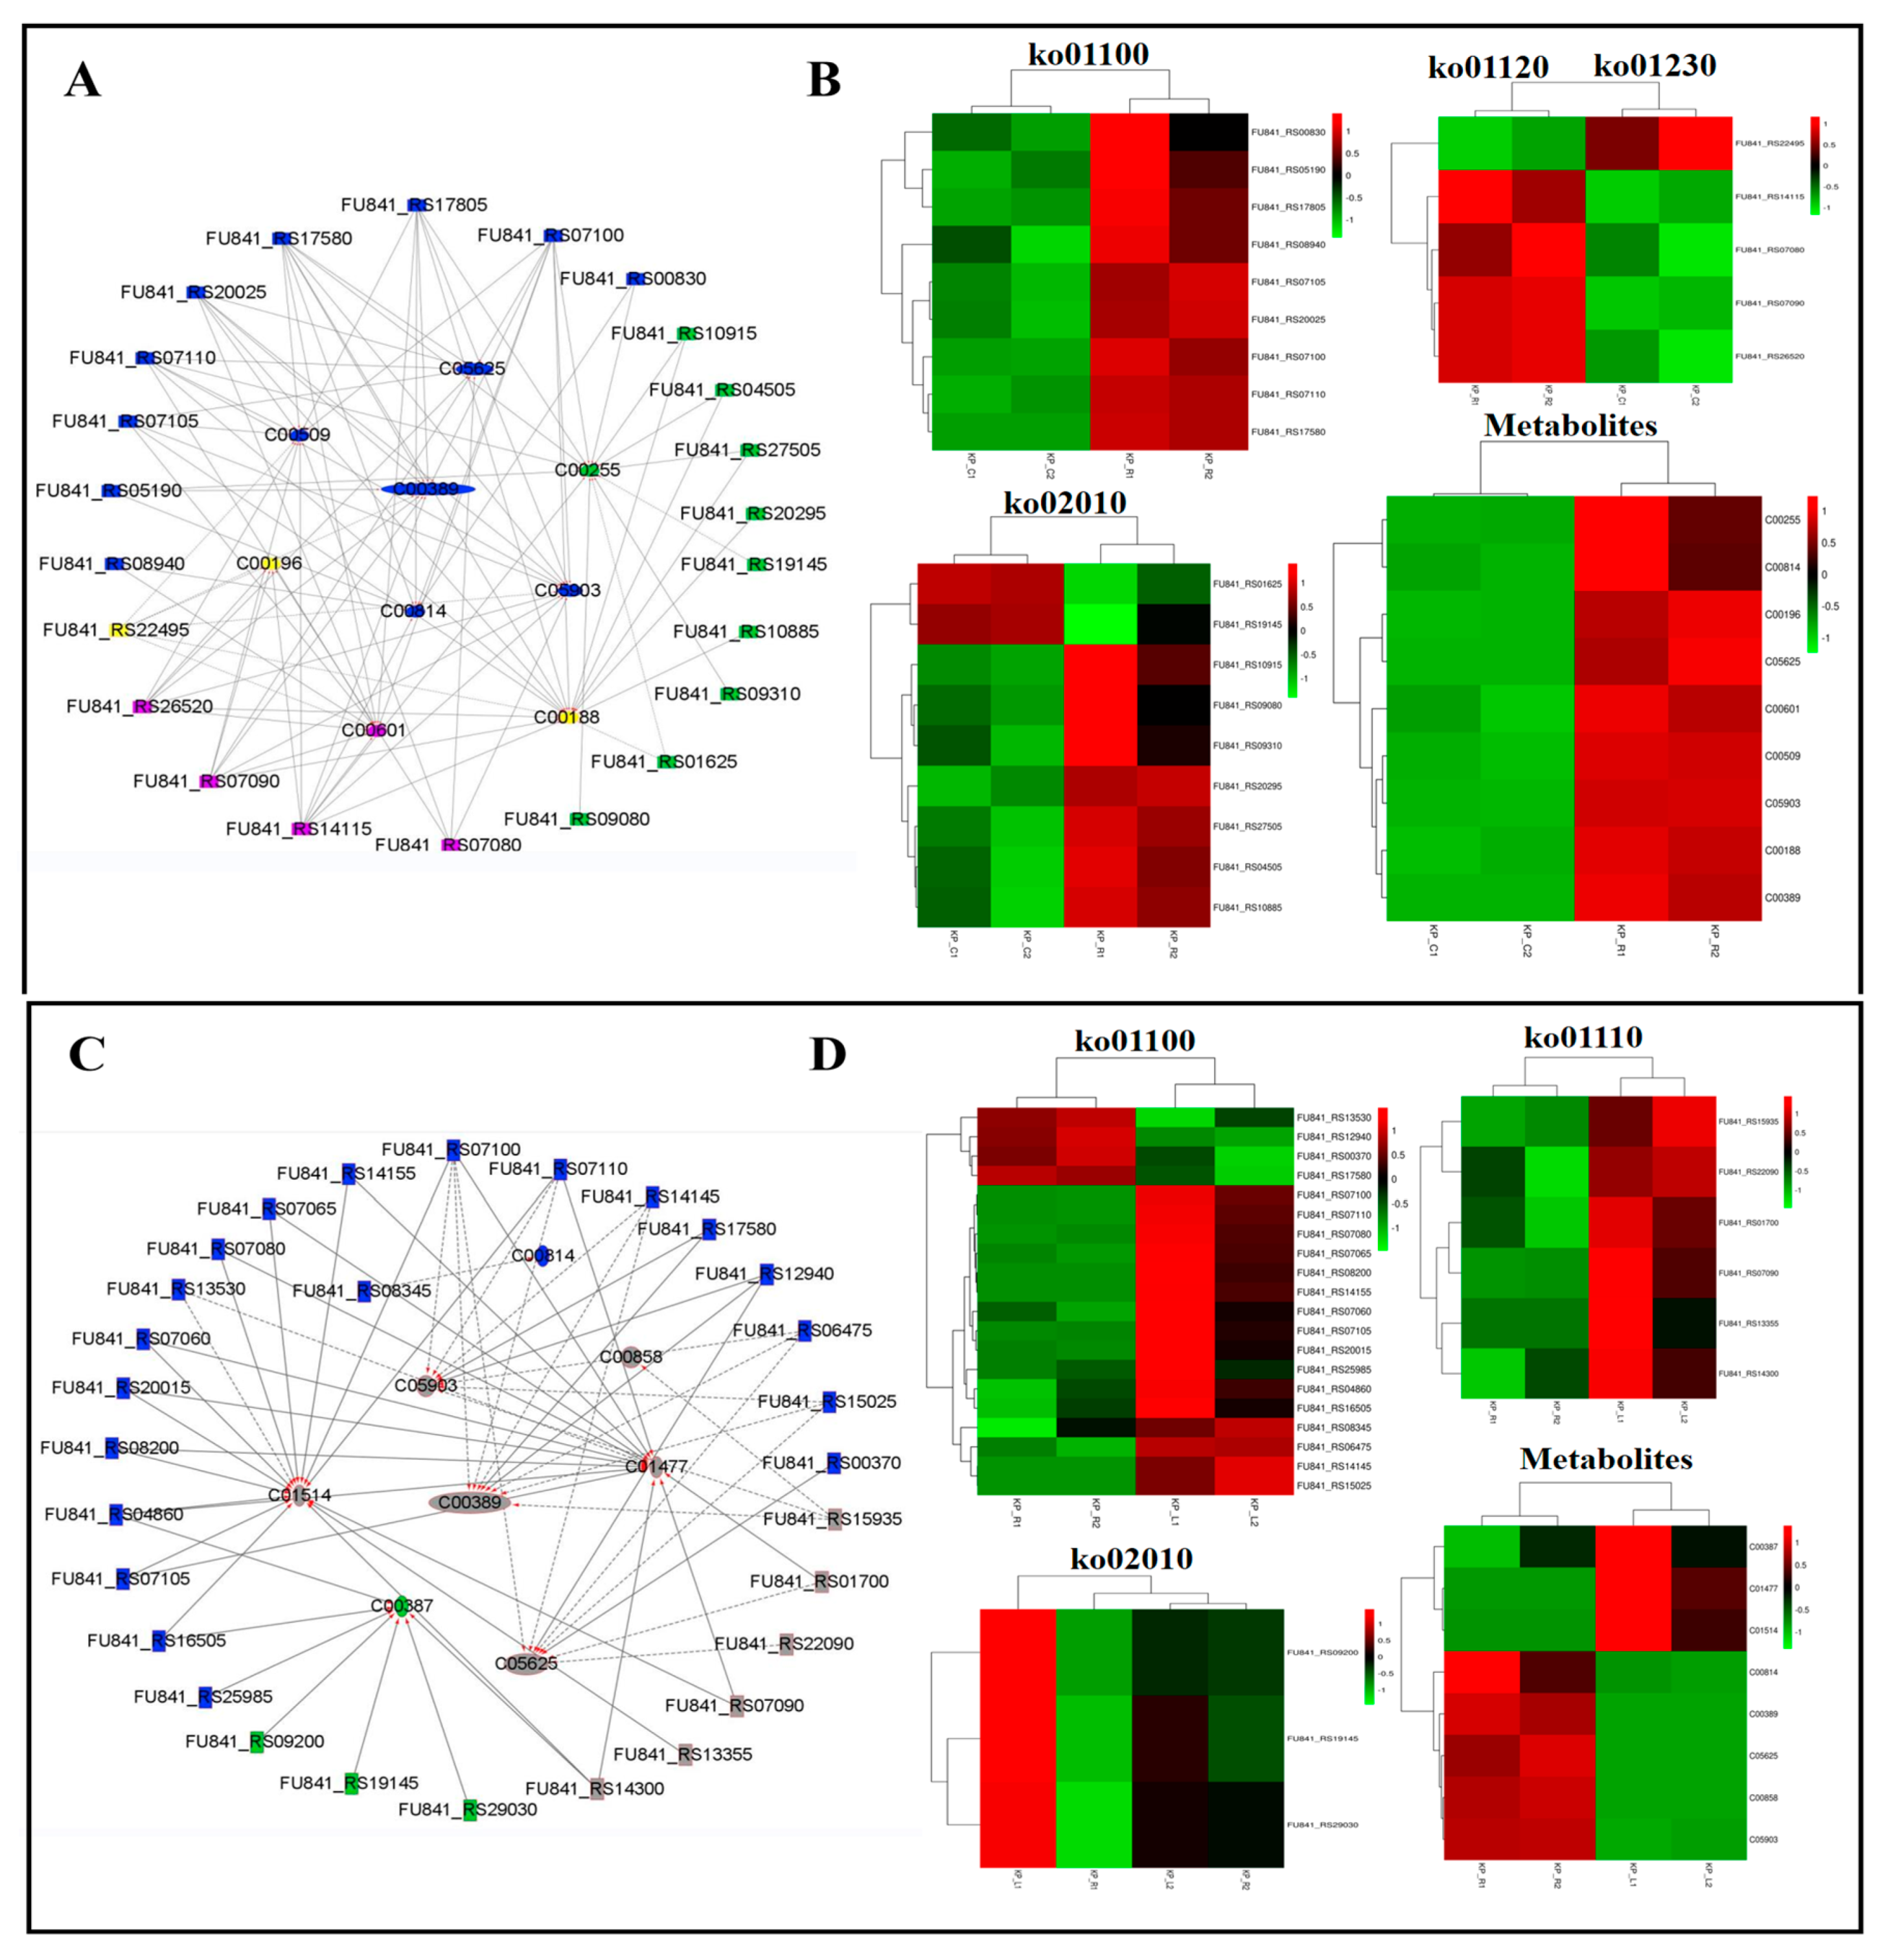
| z | Layer 1 | Layer 2 | Lyaer 3 | DEGs | DEMs |
|---|---|---|---|---|---|
| ko00260 | Metabolism | 1.5 Amino acid metabolism | Glycine, serine and threonine metabolism | 4 | 1 |
| ko00261 | Metabolism | 1.10 Biosynthesis of other secondary metabolites | Monobactam biosynthesis | 2 | 1 |
| ko00290 | Metabolism | 1.5 Amino acid metabolism | Valine, leucine and isoleucine biosynthesis | 4 | 1 |
| ko00360 | Metabolism | 1.5 Amino acid metabolism | Phenylalanine metabolism | 2 | 1 |
| ko00362 | Metabolism | 1.11 Xenobiotics biodegradation and metabolism | Benzoate degradation | 3 | 1 |
| ko00740 | Metabolism | 1.8 Metabolism of cofactors and vitamins | Riboflavin metabolism | 1 | 1 |
| ko01053 | Metabolism | 1.9 Metabolism of terpenoids and polyketides | Biosynthesis of siderophore group nonribosomal peptides | 1 | 1 |
| ko01100 | Metabolism | 1.0 Global and overview maps | Metabolic pathways | 62 | 8 |
| ko01110 | Metabolism | 1.0 Global and overview maps | Biosynthesis of secondary metabolites | 24 | 9 |
| ko01120 | Metabolism | 1.0 Global and overview maps | Microbial metabolism in diverse environments | 26 | 3 |
| ko01230 | Metabolism | 1.0 Global and overview maps | Biosynthesis of amino acids | 12 | 1 |
| ko02010 | Environmental Information Processing | 3.1 Membrane transport | ABC transporters | 30 | 2 |
| Pathway | Layer 1 | Layer 2 | Layer 3 | DEGs | DEMs |
|---|---|---|---|---|---|
| ko00230 | Metabolism | 1.4 Nucleotide metabolism | Purine metabolism | 1 | 1 |
| ko01100 | Metabolism | 1.0 Global and overview maps | Metabolic pathways | 38 | 7 |
| ko01110 | Metabolism | 1.0 Global and overview maps | Biosynthesis of secondary metabolites | 12 | 7 |
| ko02010 | Environmental Information Processing | 3.1 Membrane transport | ABC transporters | 14 | 1 |
Disclaimer/Publisher’s Note: The statements, opinions and data contained in all publications are solely those of the individual author(s) and contributor(s) and not of MDPI and/or the editor(s). MDPI and/or the editor(s) disclaim responsibility for any injury to people or property resulting from any ideas, methods, instructions or products referred to in the content. |
© 2023 by the authors. Licensee MDPI, Basel, Switzerland. This article is an open access article distributed under the terms and conditions of the Creative Commons Attribution (CC BY) license (http://creativecommons.org/licenses/by/4.0/).


