1. Introduction
Fluid-structure interaction (FSI) is a phenomenon that occurs when a fluid interacts with a solid object. This interaction can be studied by examining changes in the structural properties of the solid and the complexity of the fluids. The key parameters that play a significant role in FSI include fluid velocity, fluid viscosity, Young’s modulus of the solid, density of the solid, and the Poisson ratio of the structure [
1,
2]. The study of FSI and different multi-physics problems has received increasing attention in recent years due to their importance in various fields of applied sciences and engineering, including turbo machinery [
3], bridge decks [
4], aerospace [
5,
6,
7], parachute dynamics [
8], flow around elastic structures, blood flow in the cardiovascular system [
9], the study of hemodynamics [
10,
11,
12], and the flutter analysis of airplanes [
13].
Recent developments in this field include the shift from defined purpose to more general approaches, the need to capture complex and general systems, and the demand for robust high-quality approaches that can accurately predict outcomes in complex cases. As a result, there has been a growing interest in the development and application of simulation techniques for FSI in recent decades [
14,
15,
16].
The FSI interface utilizes an Arbitrary Lagrange Euler method, where the fluid flow is formulated using an Eulerian description in a spatial frame, while solid mechanics is formulated using a Lagrangian description, i.e., a material frame. Several researchers have proposed different techniques to address the FSI problem, including an extended ALE method proposed by S. Basting et al. [
17] and various mesh moving techniques for monolithically-coupled fluid-structure interactions in an Arbitrary Lagrangian-Eulerian coordinate analyzed by T. Wick [
18]. J. Hron, M. Razzaq, and S. Turek analyzed a monolithic algorithm to solve the problem of time-dependent interaction between an incompressible viscous fluid interacting with an elastic solid, which is the method of choice [
1,
19].
This study focuses on the deformations of an elastic vertical flap in a fluid channel for various inlet mean velocities. Analysis of the displacements of the elastic wall geometries and pressure distribution is conducted, and changes in the flow patterns are observed with the deformations. Additionally, the proposed model is applied to hemodynamical geometries and wall shear stress analysis to demonstrate the significant benefits of this method. The results of this study have broad implications, including great health importance and extensive mathematical model incorporation. Furthermore, the FSI case presented in this study has applications in MEMS devices, where the deformation of the flap due to fluid interaction can provide useful insights about structural properties and aid in designing transduction mechanisms for these devices [
20].
The remainder of this article is organized as follows.
Section 2 describes the mathematical formulation of the FSI problem.
Section 3 explains the FEM discretization of the problem, and
Section 4 outlines the solution algorithm procedures used to numerically solve the problem. The simulated results for the flap geometry and aneurysm configuration are presented in
Section 5, followed by conclusions and future outlooks and suggestions in
Section 6.
2. FSI Problem Formulation
A universal FSI problem comprises of fluid description, solid description, interface conditions and constraints for remaining boundaries. In this article, the incompressible Newtonian fluid flow interacting with a vertical elastic flap and elastic boundary are taken.
2.1. Fluid Model
The fluid properties are represented by the
velocity and
pressure, where the fluid is assumed to be Newtonian with constant density,
, and kinematic viscosity,
. The balance equation is given by:
In order to solve the balance equation, it is crucial to establish the fundamental relationship for the stress tensor. A constant density Newtonian fluid is used for this purpose, which is expressed as:
here,
represents the dynamic viscosity and
denotes the identity matrix. The Lagrangian multiplier, denoted by
, corresponds to the incompressibility constraint in (
1). The stress tensor is represented by
. The negative term
refers to the inviscid reactive component of the Cauchy stress tensor.
2.2. Structure Model
Let us consider a solid object that is elastic and has variable density. Let
be the displacement and
be its velocity. The balance equation can be expressed as follows:
where
denotes the stress tensor. Alternatively, we can write the above equation in a Lagrangian description with respect to a certain initial state
:
here,
,
is the inverse deformation gradient, and
. The equations for the stress tensor for compressible and incompressible structures can be treated in the same way. The undeformed structure density is denoted by
. Poisson ratio
and Young’s modulus
E determine the elasticity of the structure as follows:
where
and
are defined as:
The Poisson ratio for incompressible structures is
, while for compressible structures, it is less than
. The relationship between stress and strain relies on the second Piola-Kirchhoff stress tensor
S and the Green Lagrangian strain tensor
E, which are functions of the Green Lagrangian strain tensor. The second Piola-Kirchhoff stress tensor, as described in [
2], can be obtained from the Cauchy stress tensor
as follows:
where
J is the determinant of the deformation gradient tensor
F (see [
21]), given by
The Green Lagrangian strain tensor
E can be expressed as
the St. Venant-Kirchhoff material model defines the Cauchy stress tensor
in this current study as:
where
J denotes the determinant of the deformation gradient tensor
F (see [
21]), which is expressed as:
Mooney Rivlin Modeling Using Polynomial-Based Functions
A polynomial-based hyperelastic model has been implemented using the COMSOL multiphysics module [
22], with two material model parameters. The model’s equation for strain energy is defined as follows:
The strain energy density definition for the Mooney Rivlin model with two parameters is given by the following two equations [
10]:
The material properties used for the simulation are the bulk modulus of
, and coefficients of the model
and
. The fluid-structure interaction problem is constructed using a pseudo-solid mapping method [
23]. The resulting dimensionless system, incorporating the material relation previously mentioned, is presented below:
the parameter
represents the ratio of solid to fluid density, i.e.,
. In order to maintain the no-slip conditions at the fluid structure interface, the following Neumann and Dirichlet constraints are applied.
3. FEM Discretization
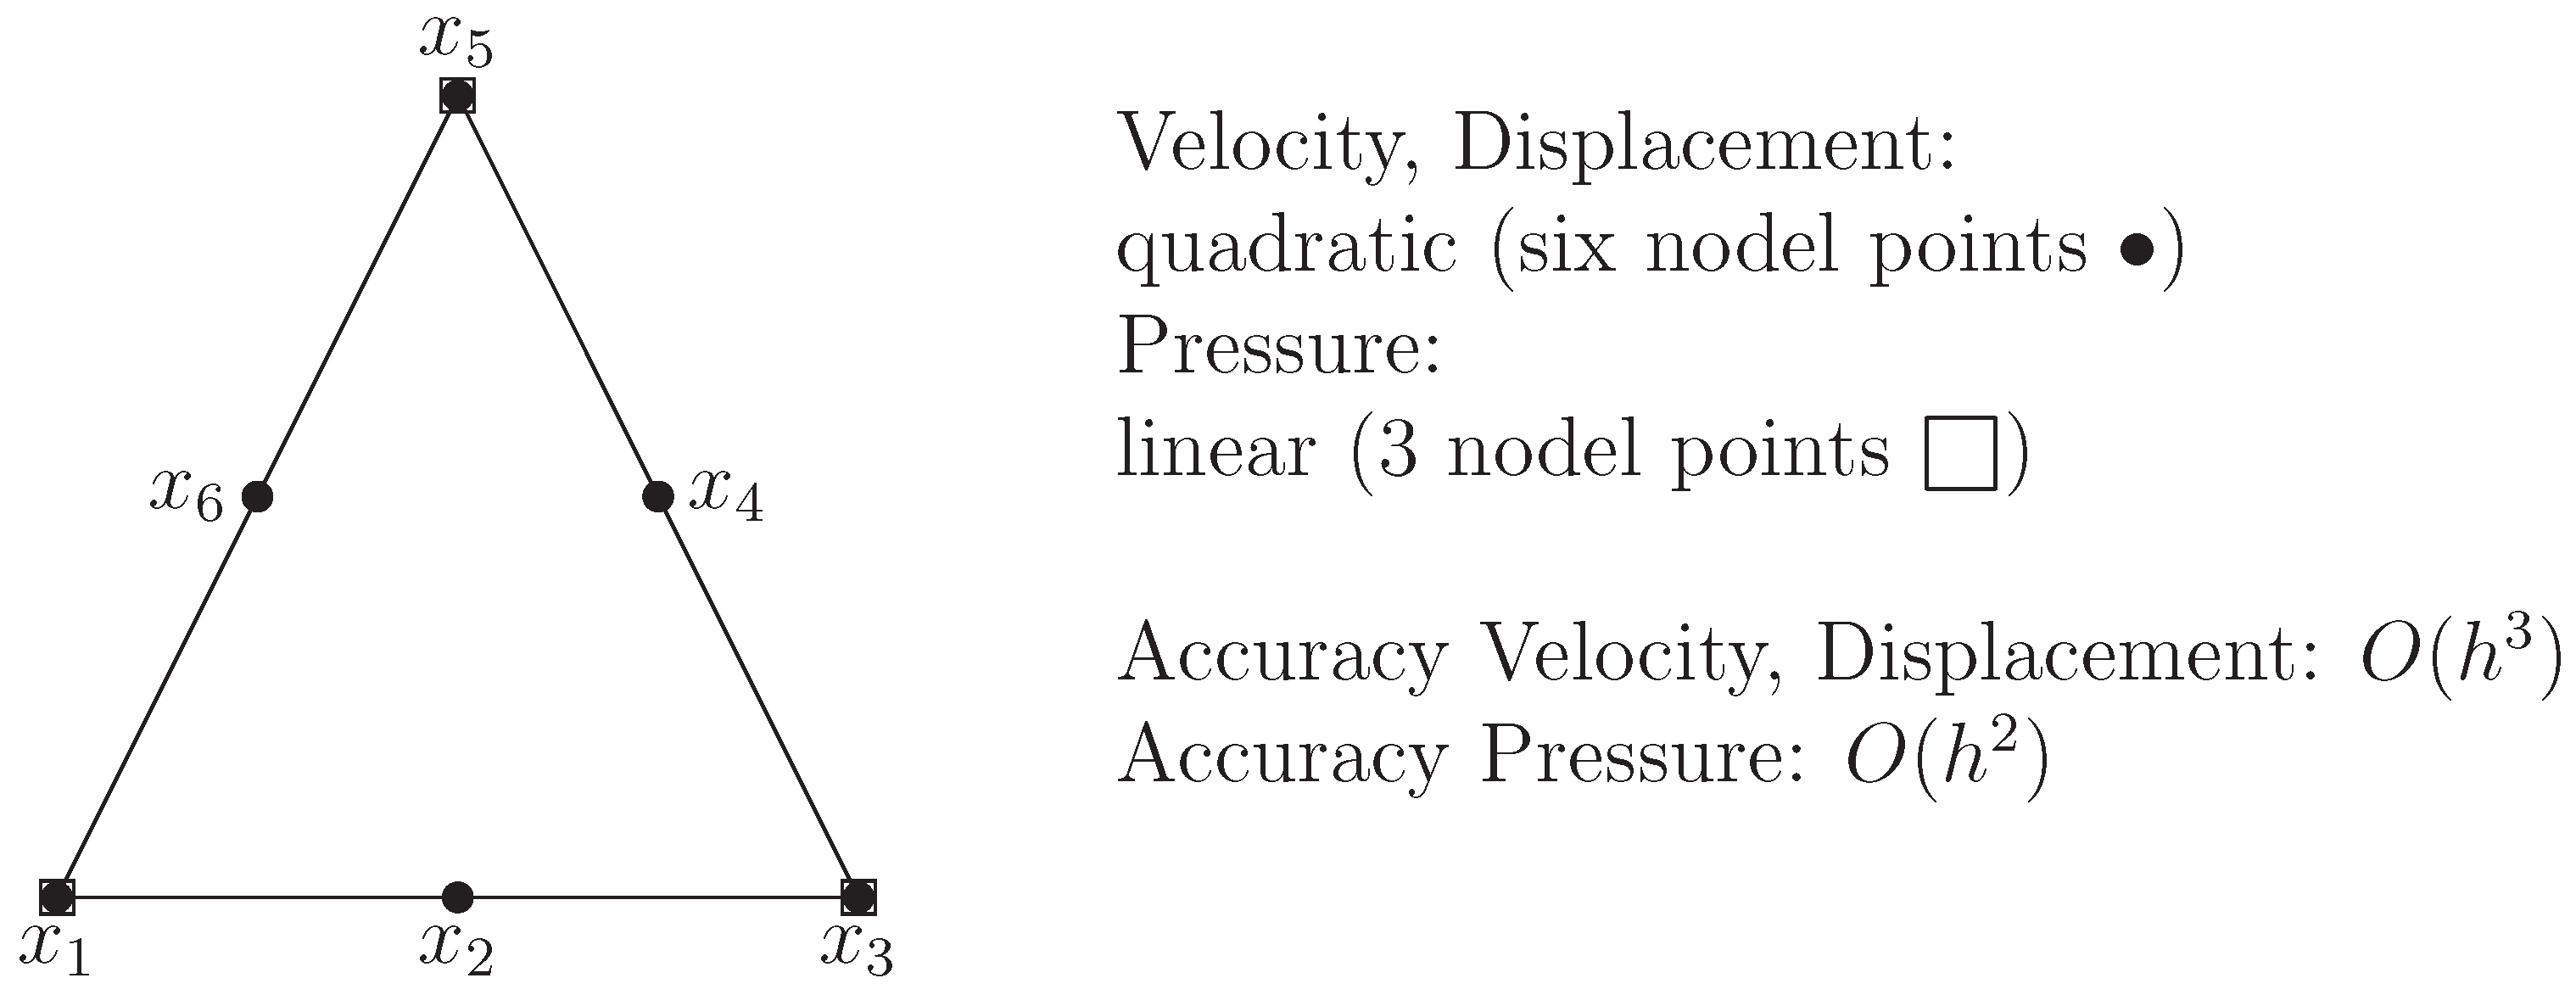
The Taylor-Hood pair
is a popular finite element space selection due to its optimal convergence properties and satisfaction of the LBB stability condition [
24]. By transitioning from a discontinuous space to a continuous one, the pressure space’s dimension is reduced, thereby saving degrees of freedom.
Figure 1 illustrates the degrees of freedom.
The basis function
of
element is given by [
25]
and the basis vector set is
For
element, we have
and the basis vector set is
4. Solution Algorithm
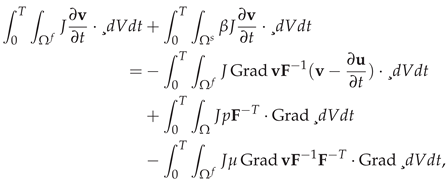
To solve the system of nonlinear algebraic equations of saddle point type presented in (
25), we employ the Newton iteration method, which can exhibit quadratic convergence for solutions that are sufficiently close. This method involves finding a root of the residual
by utilizing the already-known function value and its first derivative. The formula for the Newton iteration with damping is given as follows:
here,
denotes the solution vector,
n represents the iteration number, and
is the damping parameter. The Jacobian matrix
is computed by the finite differences taking the residual matrix
In Equation (
28), the coefficients
represent the increments at each iteration step
n, while
denotes the unit basis vectors in
. For a more detailed explanation, please refer to [
26,
27]. Furthermore, the parameter
is chosen such that the error measure decreases with each iteration.
The damping parameter in the Newton iteration greatly enhances its robustness, particularly when the current approximation
is not close enough to the final solution. For more information, please refer to [
26,
28]. In this
problem, we employ a direct solver for sparse systems such as MUMPS [
29]. Algorithm 1 presents the Newton iteration algorithm used in this study. Algorithm 1 outlines the Newton iteration and line search method used in this study.
|
Algorithm 1
Newton iteration and line search
|
- 1:
Input nonlinear tolerance parameter - 2:
Initialize and take as the starting guess. - 3:
Build the residual vector . - 4:
Compute the Jacobian matrix . - 5:
Solve the linear system for correction of :
- 6:
Find the optimal step length . - 7:
Update the solution: . |
4.1. Problem Definition
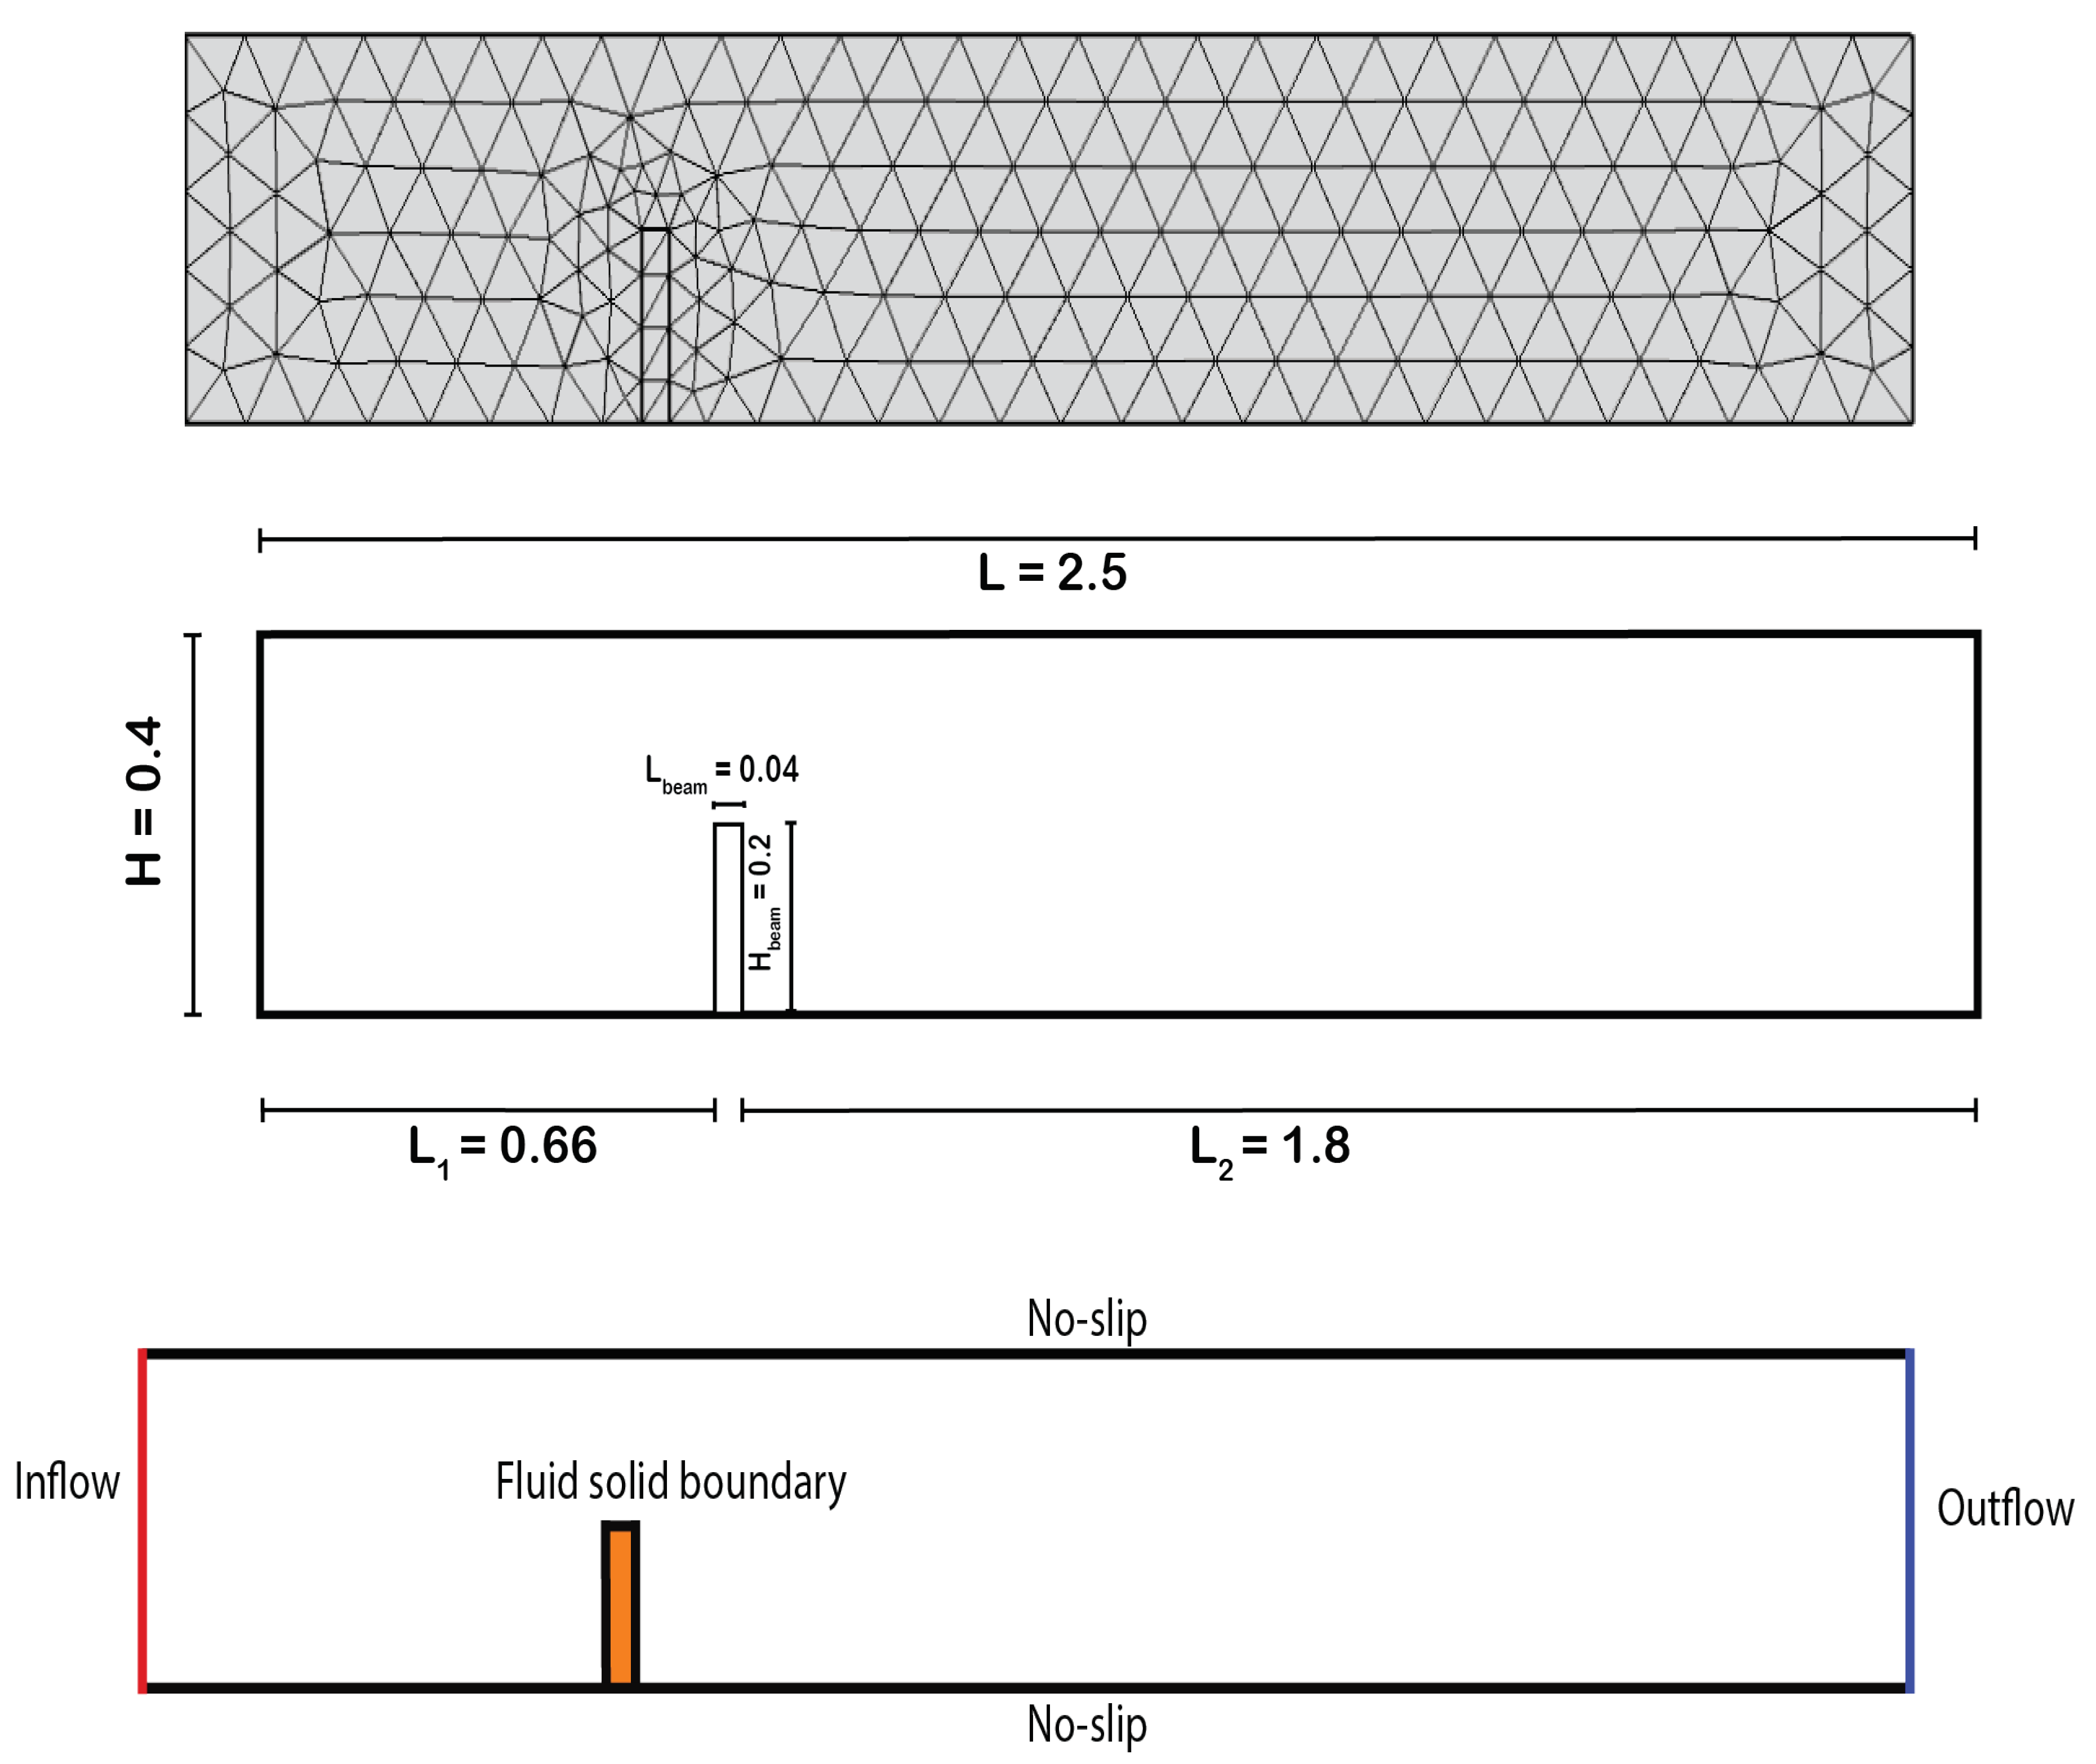
The rectangular fluid channel in this problem has a length of
and a height of
. The rectangular solid flap has a width of
and a height of
. The complete geometry of the channel with a vertical flap is depicted in
Figure 2, which includes the coarse mesh, geometrical details, and boundary conditions specification.
Table 1 gives the material properties.
For this particular problem, the channel cross-section is rectangular with a length of
and a height of
. The rectangular solid flap has a width of
and a height of
. A parabolic inflow velocity profile is applied on the left wall with a maximum inflow velocity of
given by:
here,
is equal to
of
. The top and bottom walls and the vertical flap are assigned no-slip boundary conditions. On the right wall, a do-nothing boundary condition is set. Additionally, the fluid-solid interface is assumed to have equal normal stresses, i.e.,
Figure 2 illustrates the complete geometry of the channel with a vertical flap, including the coarse mesh, geometrical details, and boundary conditions specifications. The drag coefficient and lift coefficient are computed using the following equations:
where
and
are given by:
respectively. Here,
S represents the surface of the vertical flap, and
is the unit normal vector to
S. The symbols
,
p,
, and
denote the density, pressure, dynamic viscosity, and tangential velocity, respectively. The constant
L represents the characteristic length scale of the geometry, and
is the mean inflow velocity.
5. Numerical Results
The present configuration is based on the FSI1-benchmark presented in [
30], which is a well-established benchmark for validating fluid-structure interaction (FSI) simulations. The benchmark features a rectangular channel with a vertical flap, where the goal is to study the interaction between the fluid and the flexible structure. The geometry of the benchmark is relatively simple, with the channel length and height fixed at 2.5m and 0.4m, respectively. The width and height of the vertical flap are set at 0.04m and 0.2m, respectively.
The benchmark involves relatively small beam displacements (around ), making it challenging to ensure grid-independent convergence. As such, accurate numerical simulations of this benchmark require careful consideration of grid resolution, numerical scheme, and time-step size. To further validate the implementation, we consider the significant deformations of the vertical flap induced by the SVK material model, Neo-Hookean model, and Mooney-Rivlin models, which have a noticeable impact on the fluid flow behavior. Through these simulations, we aim to demonstrate the effectiveness and accuracy of our FSI solver in capturing the complex fluid-structure interaction phenomena.
5.1. Case 1: SVK material model for the vertical flap and rigid walls
In Case
Section 5.1, all the outer boundaries are kept rigid while the SVK material model is applied to a vertical flap located inside the fluid channel. The figures presented in this section show the results for the SVK material model.
Figure 3 provides an insight into the significant deformation of the flap due to the effect of fluid flow velocity magnitude. The surface velocity plot along with arrow representation is shown for a velocity of
.
Figure 4 displays the pressure distribution within the channel and areas with high-pressure distributions. The pressure contours are presented for a velocity of
. Furthermore,
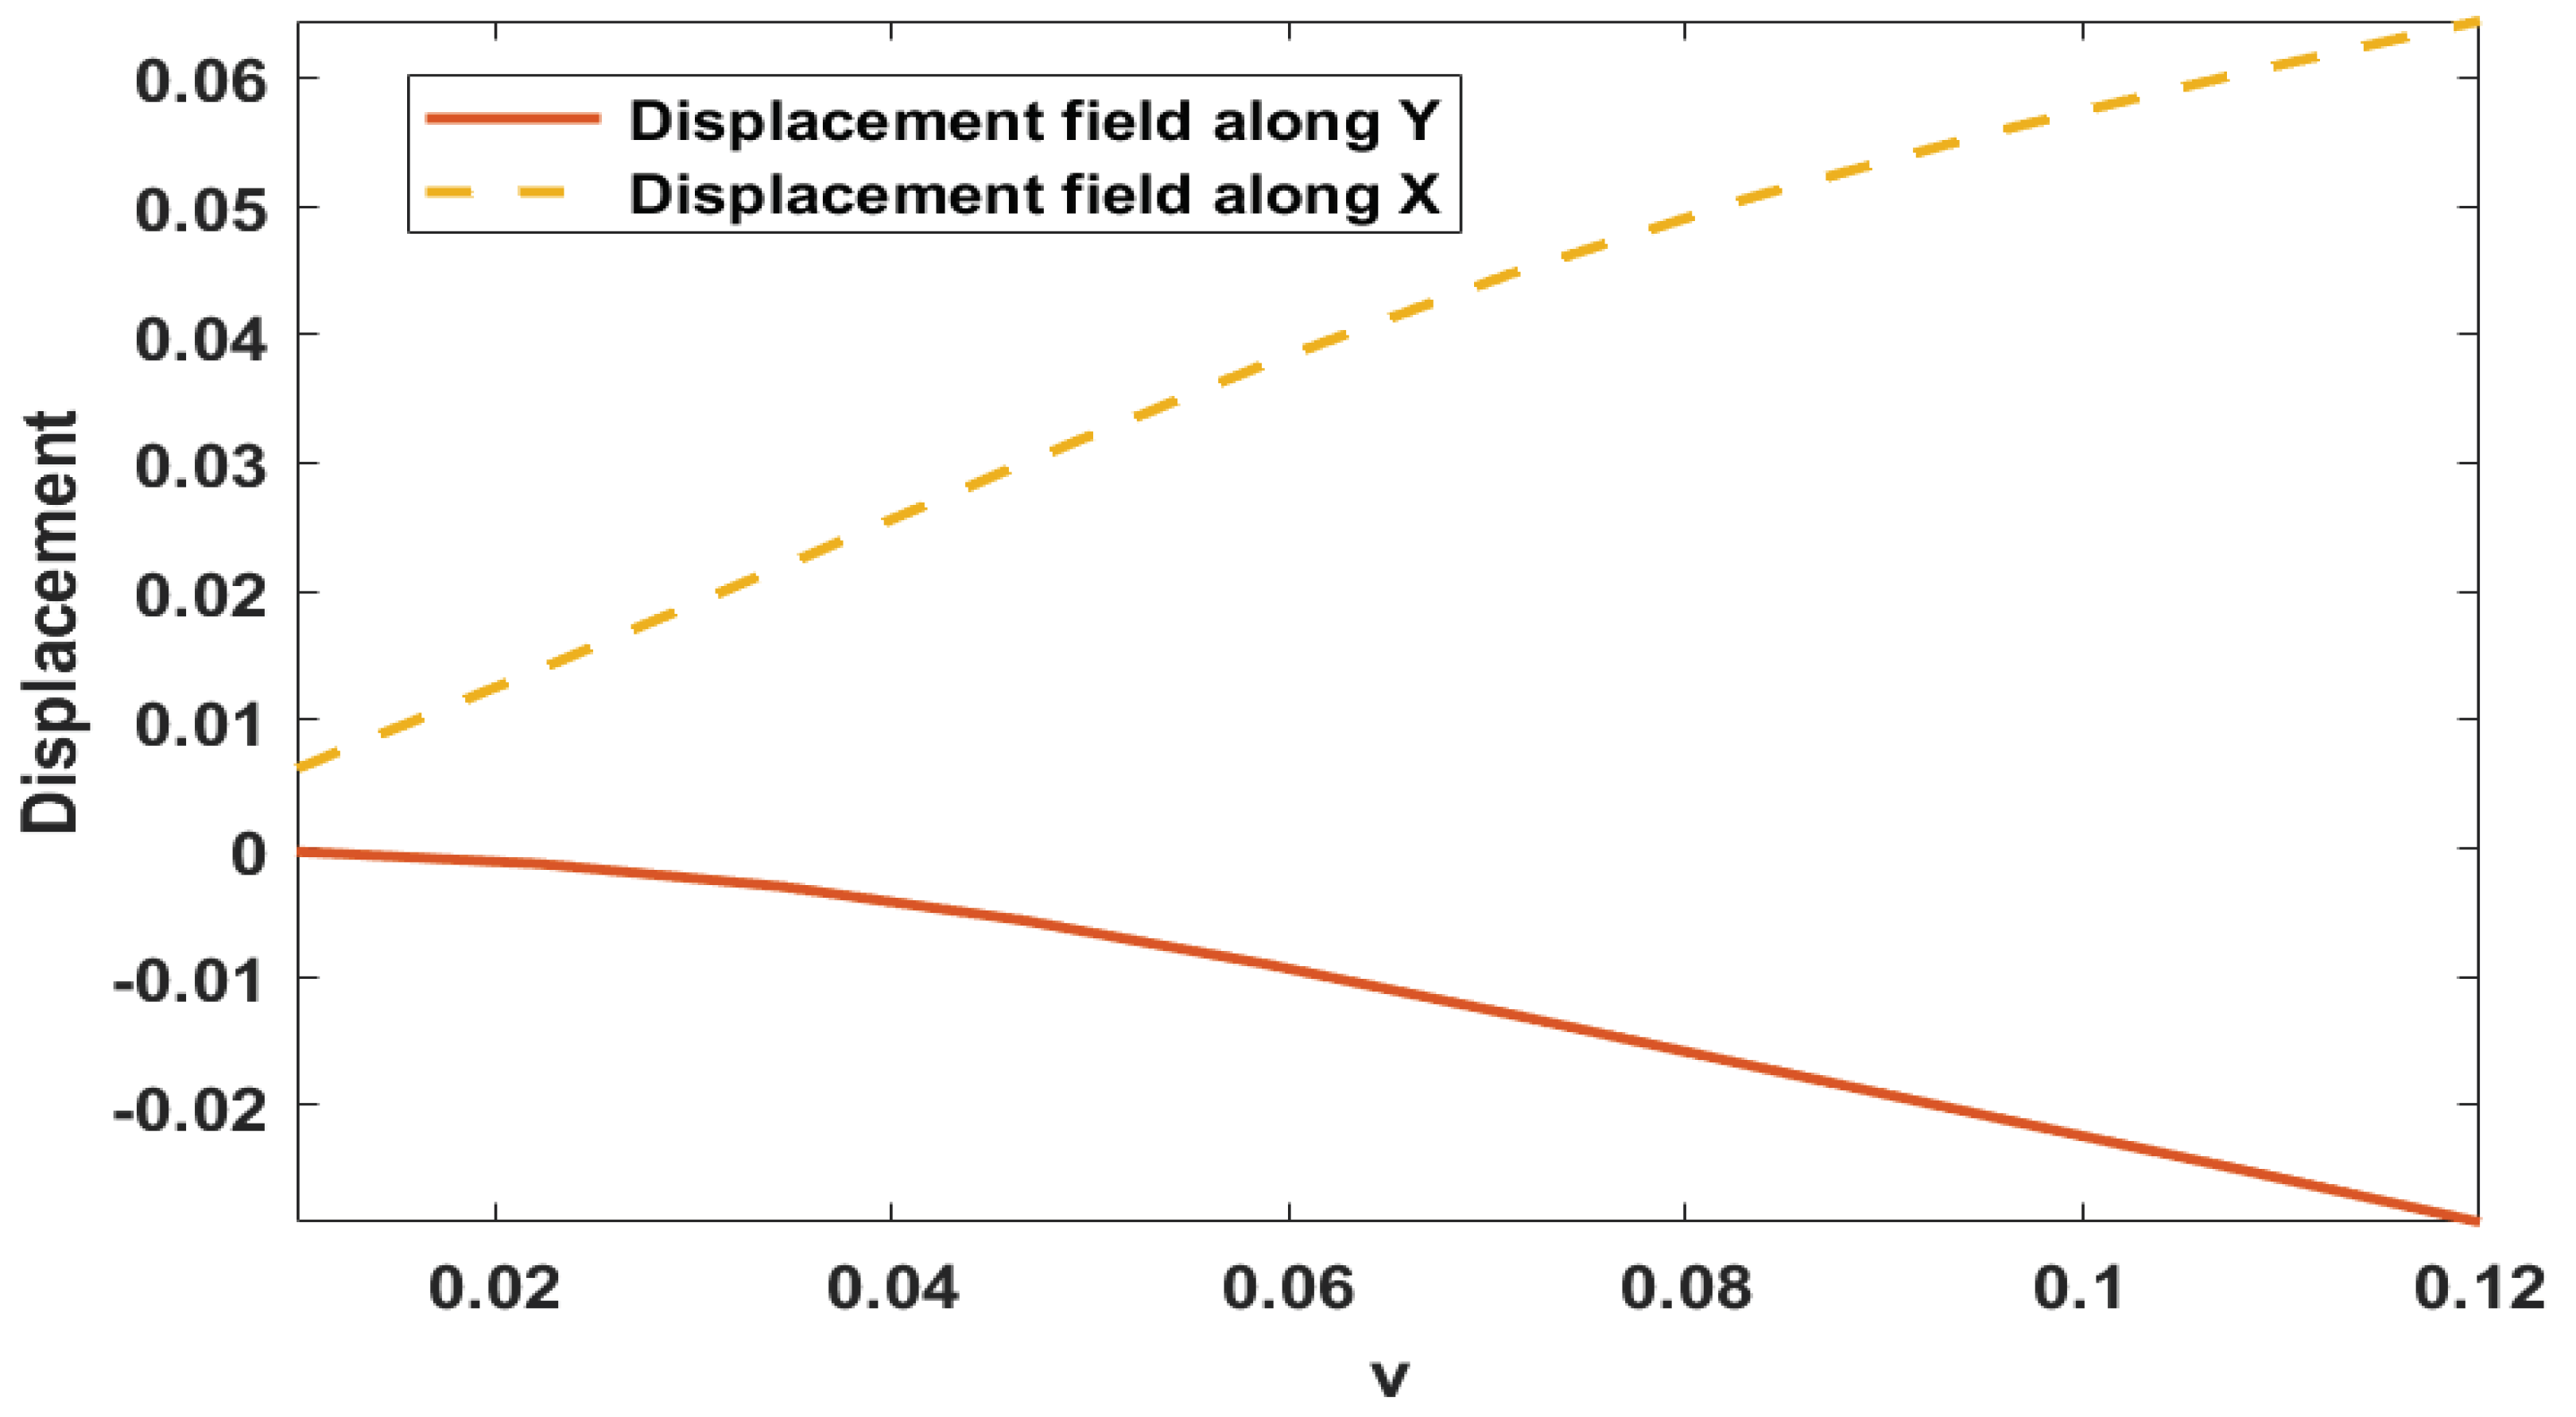
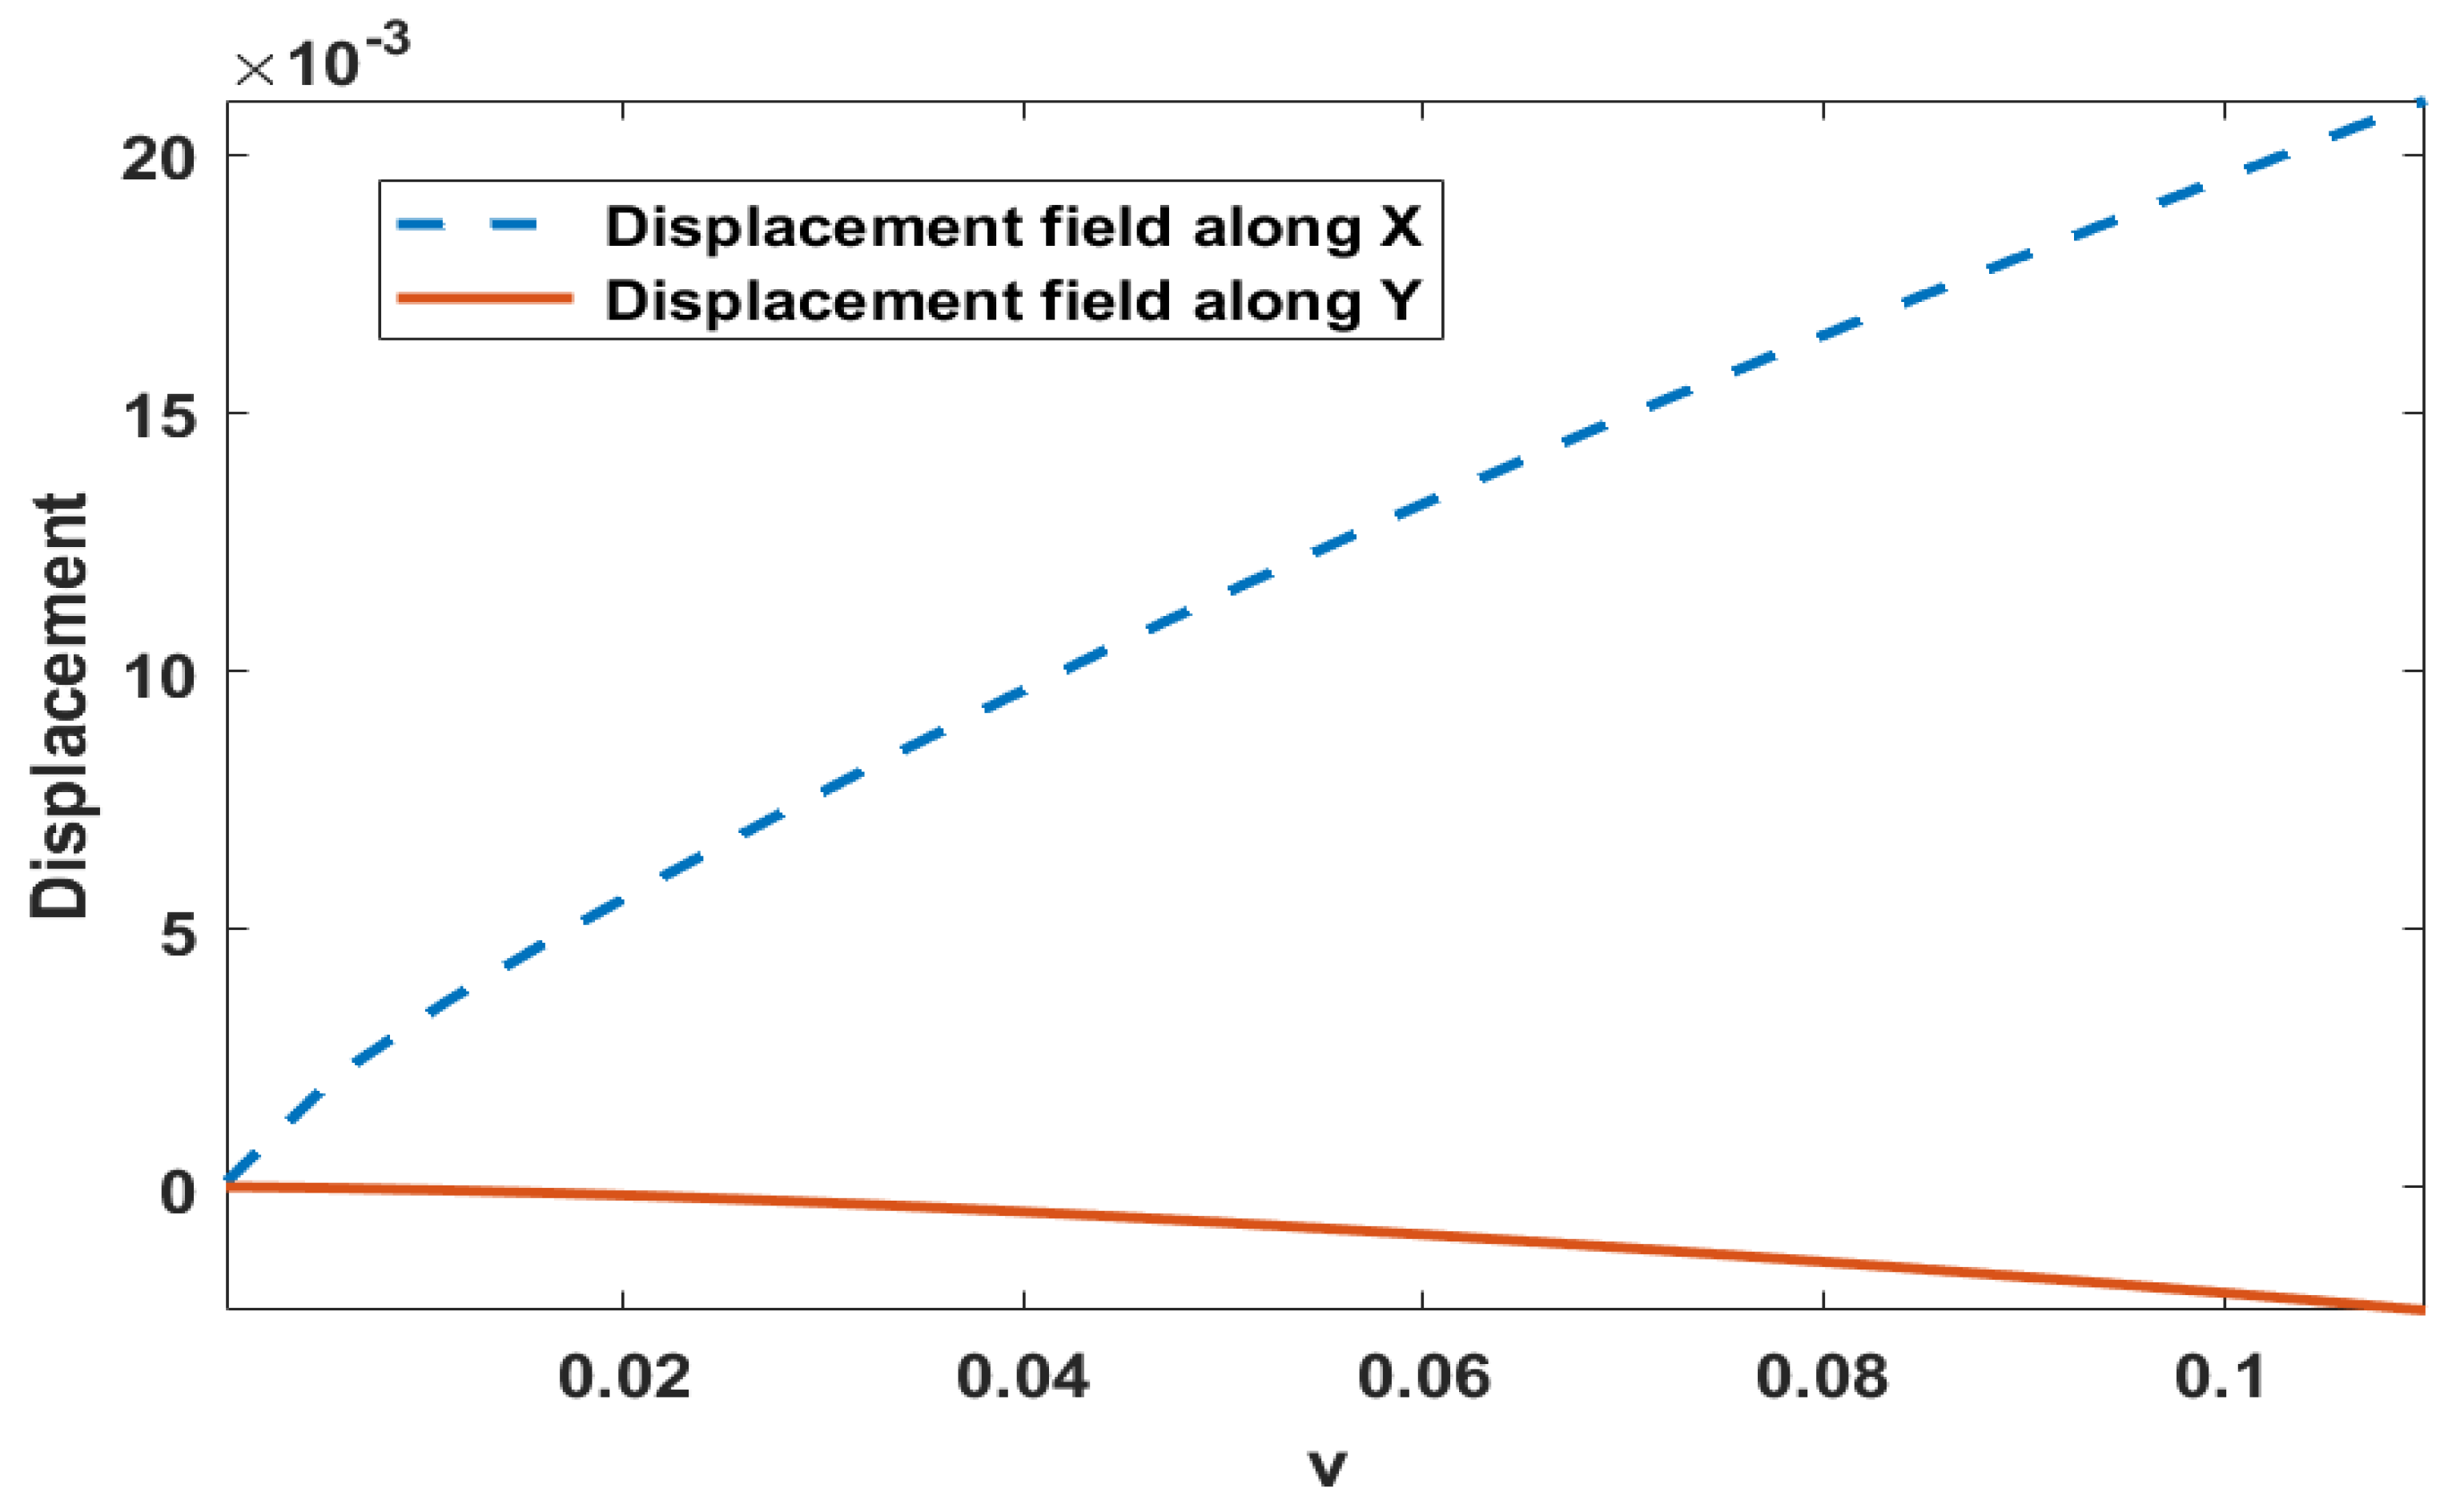
Figure 5 demonstrates the
X and
Y displacement fields of the top of the flap under the effect of fluid. The flap experiences noticeable displacement due to the applied fluid force. These results provide insight into the behavior of the SVK material model applied to the vertical flap under the effect of fluid flow velocity magnitude. The pressure distribution and displacement fields illustrate the impact of fluid flow on the flap, and these findings can be useful for further research in this field.
5.2. Case 2: SVK (Top Roof) and Neo-Hookean (Vertical Flap)
In Case
Section 5.2, the SVK material model is utilized at the top solid wall, while a Neo-Hookean material model is implemented on a vertical flap within the fluid channel.
Figure 6,
Figure 7 and
Figure 8 depict the vector magnitude, pressure distribution, and displacement on the vertical bar, providing an insight into the behavior of the system under the combined effects of fluid flow and material properties.
Figure 6 displays the surface velocity plot and arrow representation, showing the magnitude of the fluid flow and the small deformation of the flap under the fluid flow. In
Figure 7, the pressure distribution and the area of great impact are clearly visible. Finally,
Figure 8 illustrates the
X and
Y displacement fields of the top of the flap under the effect of fluid. The figures demonstrate that the Neo-Hookean material model significantly affects the deformation of the vertical flap, whereas the SVK material model has a relatively minor impact on the behavior of the top roof.
In summary, the results of Case
Section 5.2 highlight the importance of selecting appropriate material models for each component of the system and the need to consider the combined effects of fluid flow and material properties in designing and analyzing fluid-structure interaction problems.
5.3. Case 3: SVK (Top Roof) and Mooney Rivlin (vertical Flap)
In Case 3, the SVK material model is assigned to the upper elastic wall, while the Mooney-Rivlin material properties are assigned to the vertical elastic flap. This case aims to understand the behavior of the Mooney-Rivlin material model under the influence of fluid flow.
The figures presented in this section, i.e.,
Figure 9,
Figure 10 and
Figure 11, provide a detailed understanding of the behavior of the Mooney-Rivlin material model under the influence of fluid flow.
Figure 9 shows the vector magnitude of the fluid flow and the very little deformation of the flap under the fluid flow. The figure also shows the direction of the fluid flow using arrow representation. In
Figure 10, pressure distribution, and area of great impact are quite evident. This figure highlights the maximum pressure points on the flap, providing insights into the structural integrity of the material model. Finally,
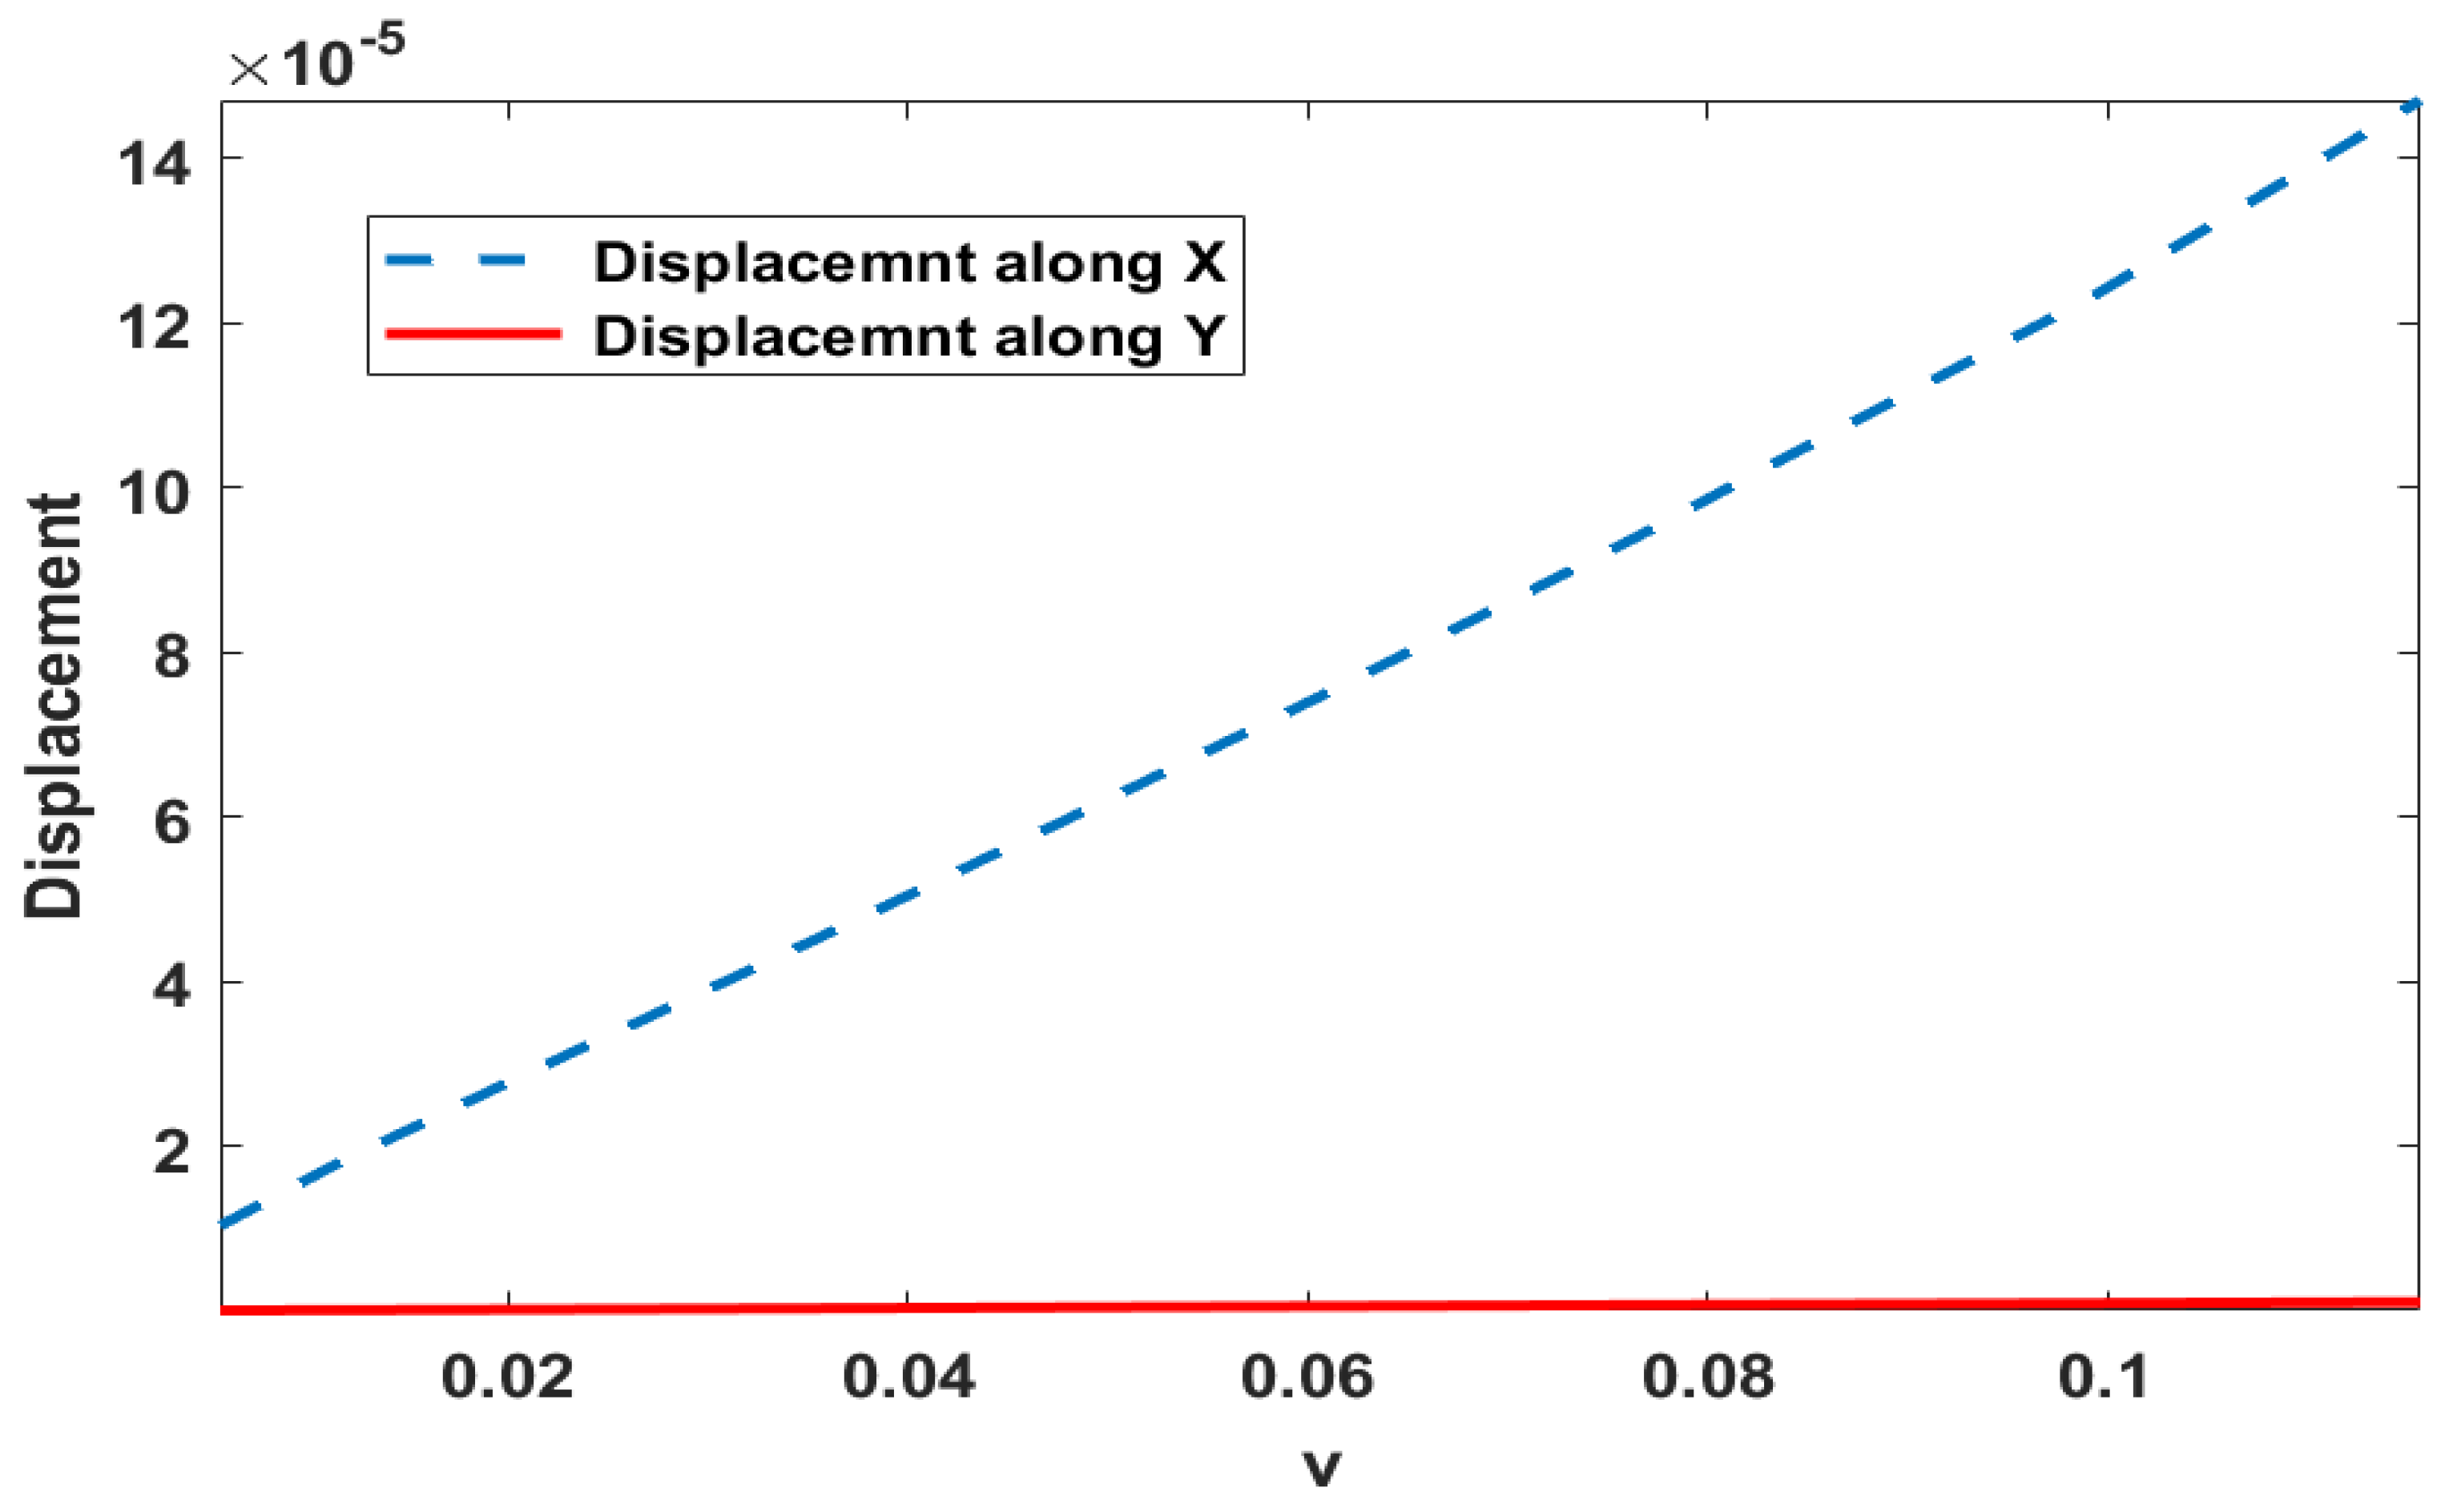
Figure 11 shows the
X and
Y displacement fields of the top of the flap under the effect of fluid.
The results obtained from this case can be used to improve the design of materials used in various applications, such as in the aerospace industry or medical devices. By understanding the behavior of different material models under the influence of fluid flow, engineers can design more efficient and robust materials that can withstand fluid forces. Additionally, the numerical simulation approach used in this study can be extended to other complex geometries and material models to gain a better understanding of their behavior under different conditions.
5.4. Calculation of Drag and Lift
To evaluate the performance of the fluid-structure interaction, the parametric sweep function was utilized to simulate the flow at various inlet velocities. In this study, Drag and Lift forces were calculated using the localized stress components. Drag force was determined by performing fourth-order integration of stress in the x-direction, while the Lift force was computed by integrating the stress in the y-direction. These calculations were carried out by performing surface integration across the flap.
To provide a graphical representation of the Drag and Lift forces for the three cases considered,
Figure 12 shows the Drag and Lift forces for Case 1,
Figure 13 illustrates the Drag and Lift forces for Case 2, and
Figure 14 presents the Drag and Lift forces for Case 3. These figures provide insight into the variations of Drag and Lift forces for different inlet velocities and material models.
5.5. Incorporating Non-Newtonian Fluid Model
Additionally, the Carreau fluid model has been widely used in simulating blood flow due to its accuracy in describing the non-Newtonian behavior of blood. The shear-thinning property of blood is due to the presence of large macromolecules, such as proteins and red blood cells, which can undergo deformation in response to shear stress [
31]. The present study investigates the impact of non-Newtonian fluid on the hemodynamic problem at hand. To accurately model the rheological behavior of blood, the Carreau fluid model has been adopted [
32]. This model accounts for the shear-thinning behavior observed in blood, as well as other non-Newtonian effects [
31]. The viscosity is incorporated using the following equation:
where
and
are the low and high shear rate asymptotic values,
is the deformation gradient, and parameters
n and
K control the transition region. The values of the parameters are chosen to be
,
,
, and
.
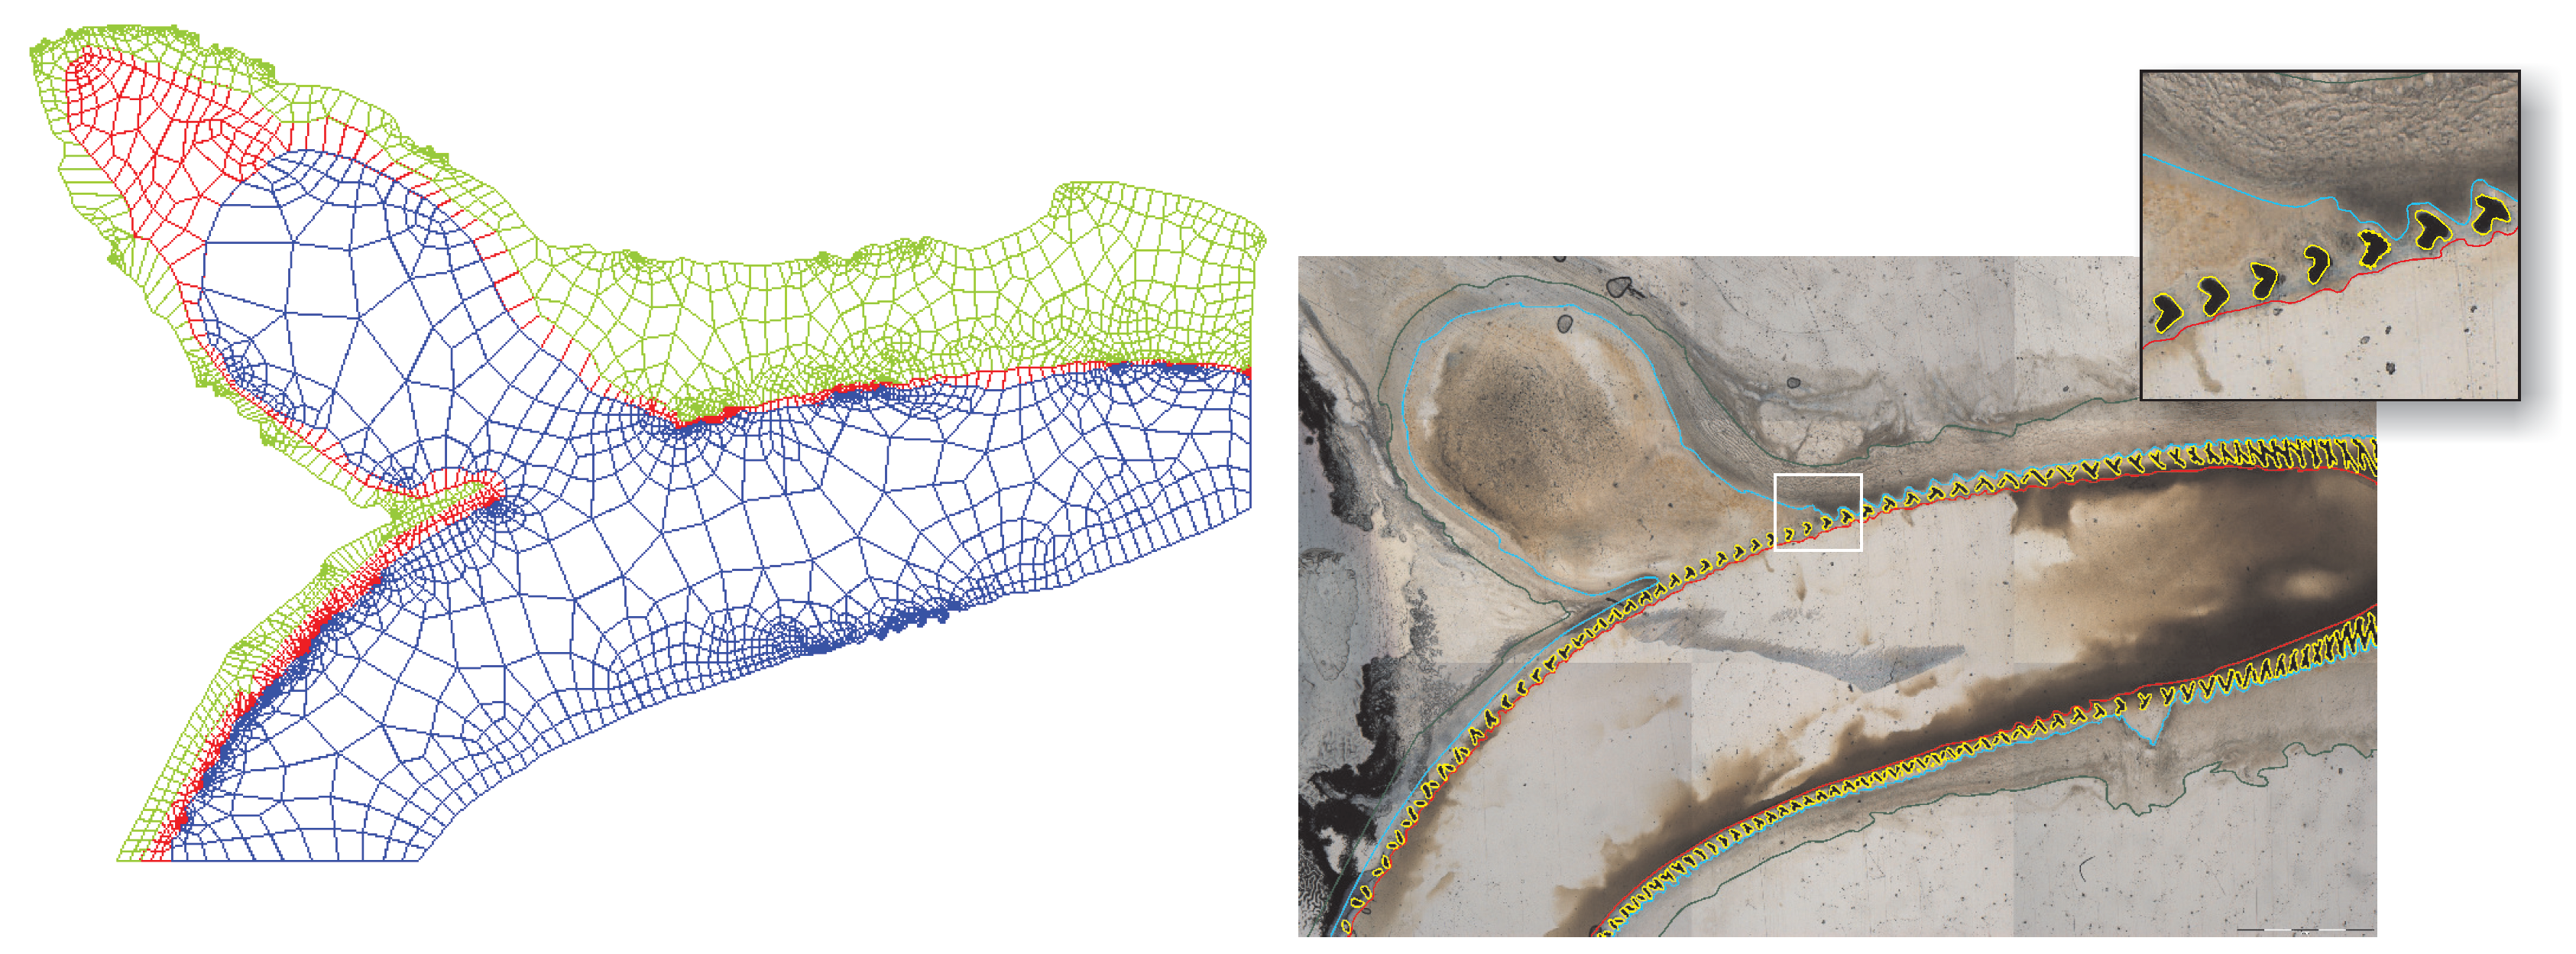
Figure 15 (left) shows a coarse mesh based on abstracted biomedical data, where the red and green colors represent elastic walls with separate stiffness and the blue color represents the flow region. On the right side of the same figure, a cut plane of
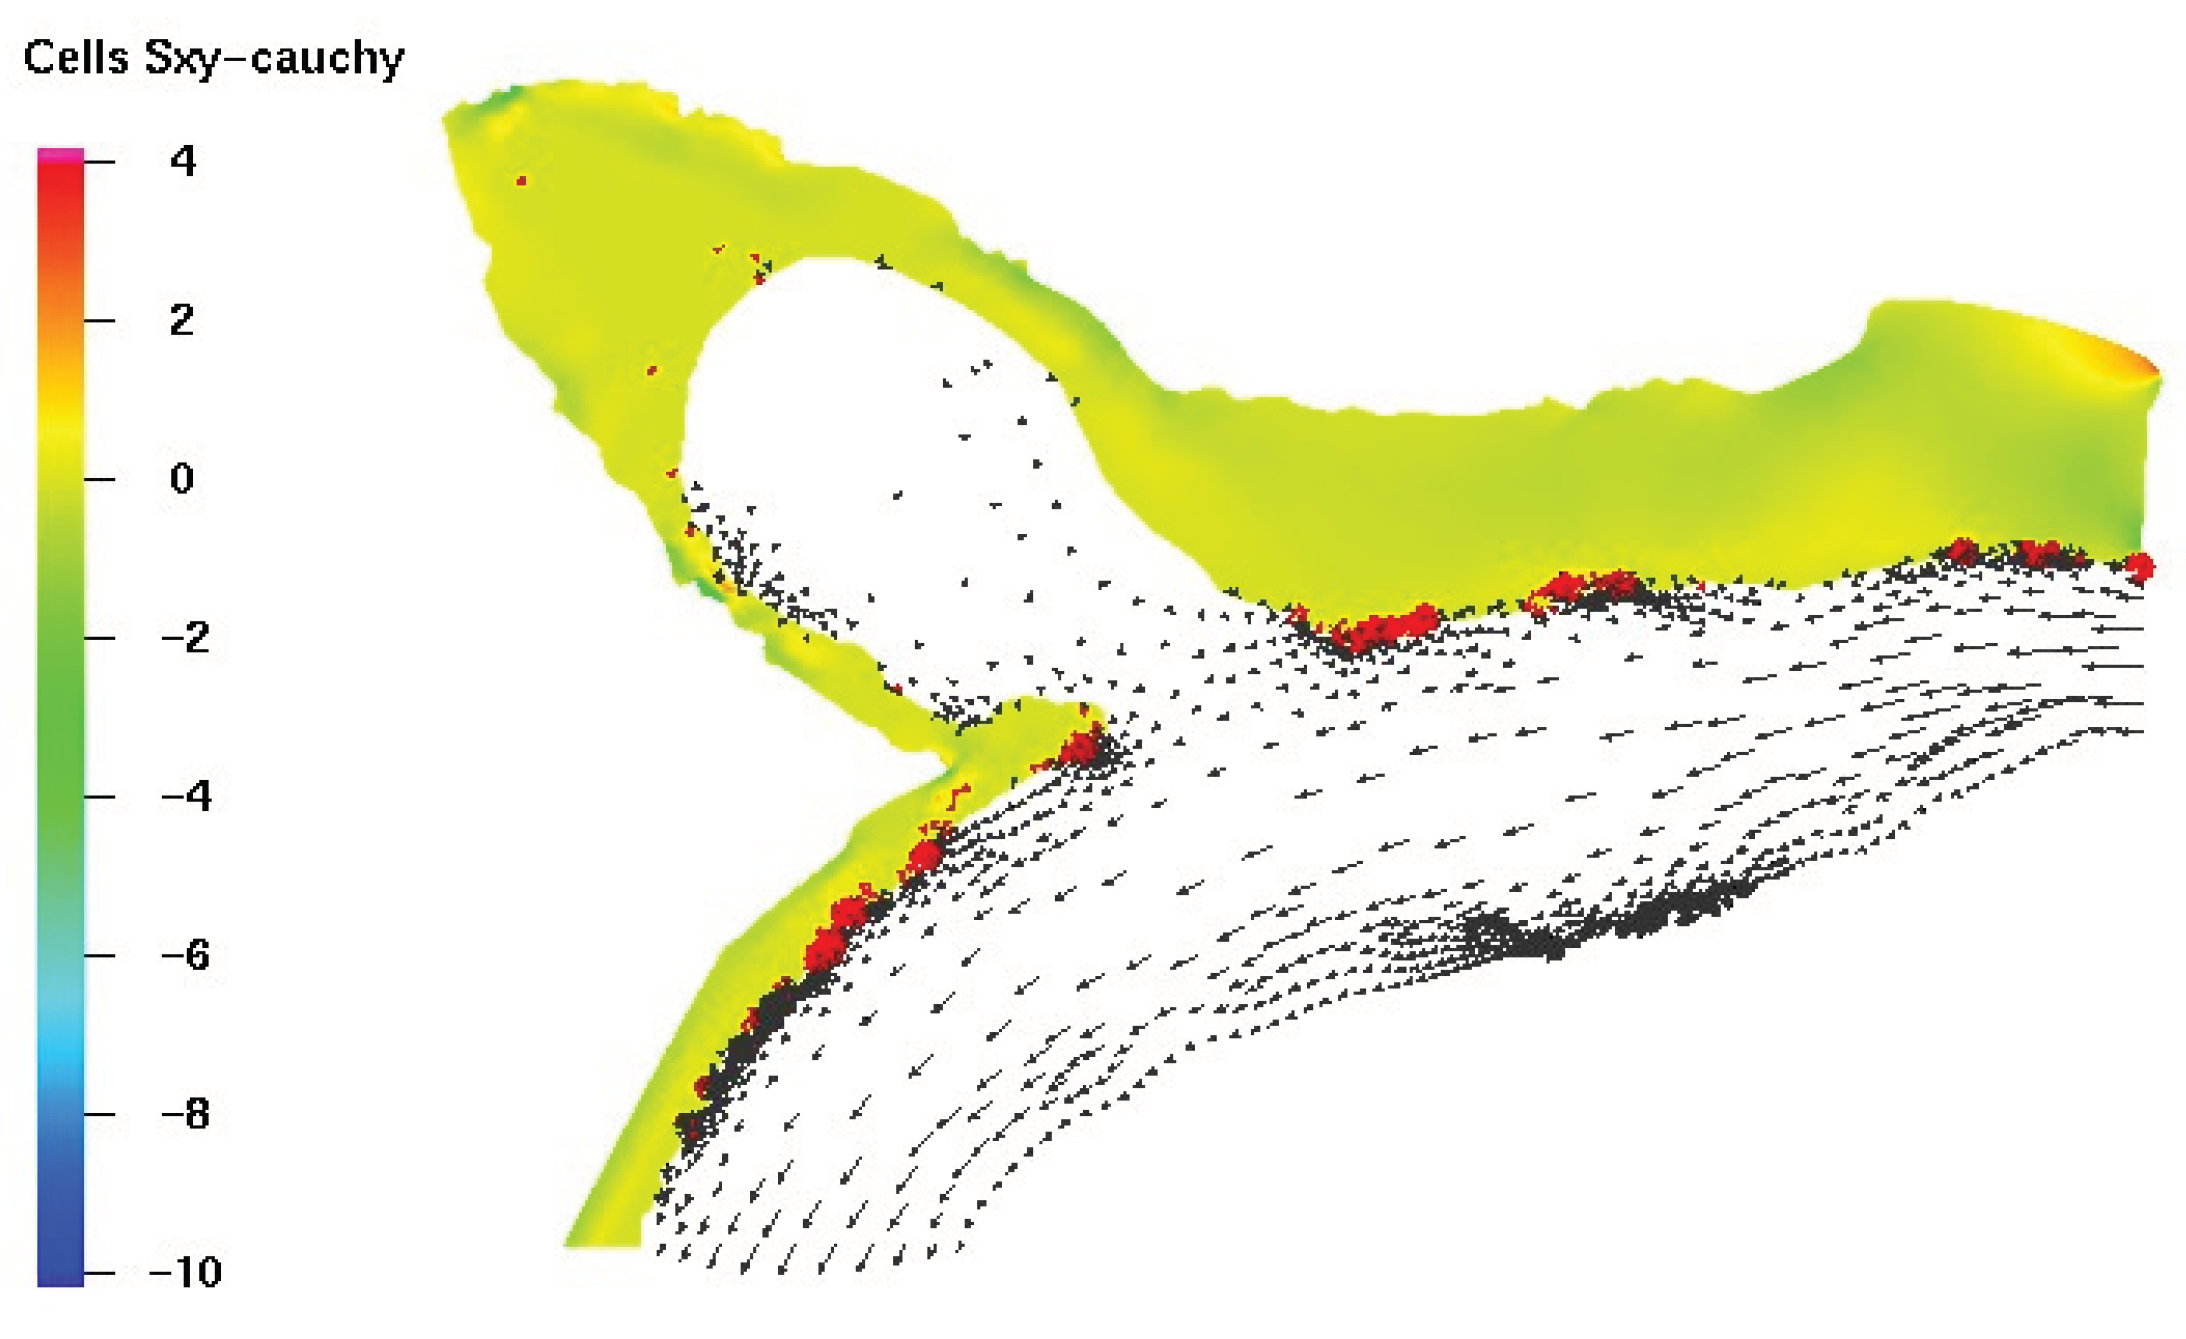
specimens computed tomographic image and magnetic resonance imaging data of human neurocrania is shown. The stress distribution effects at peak systole are illustrated in
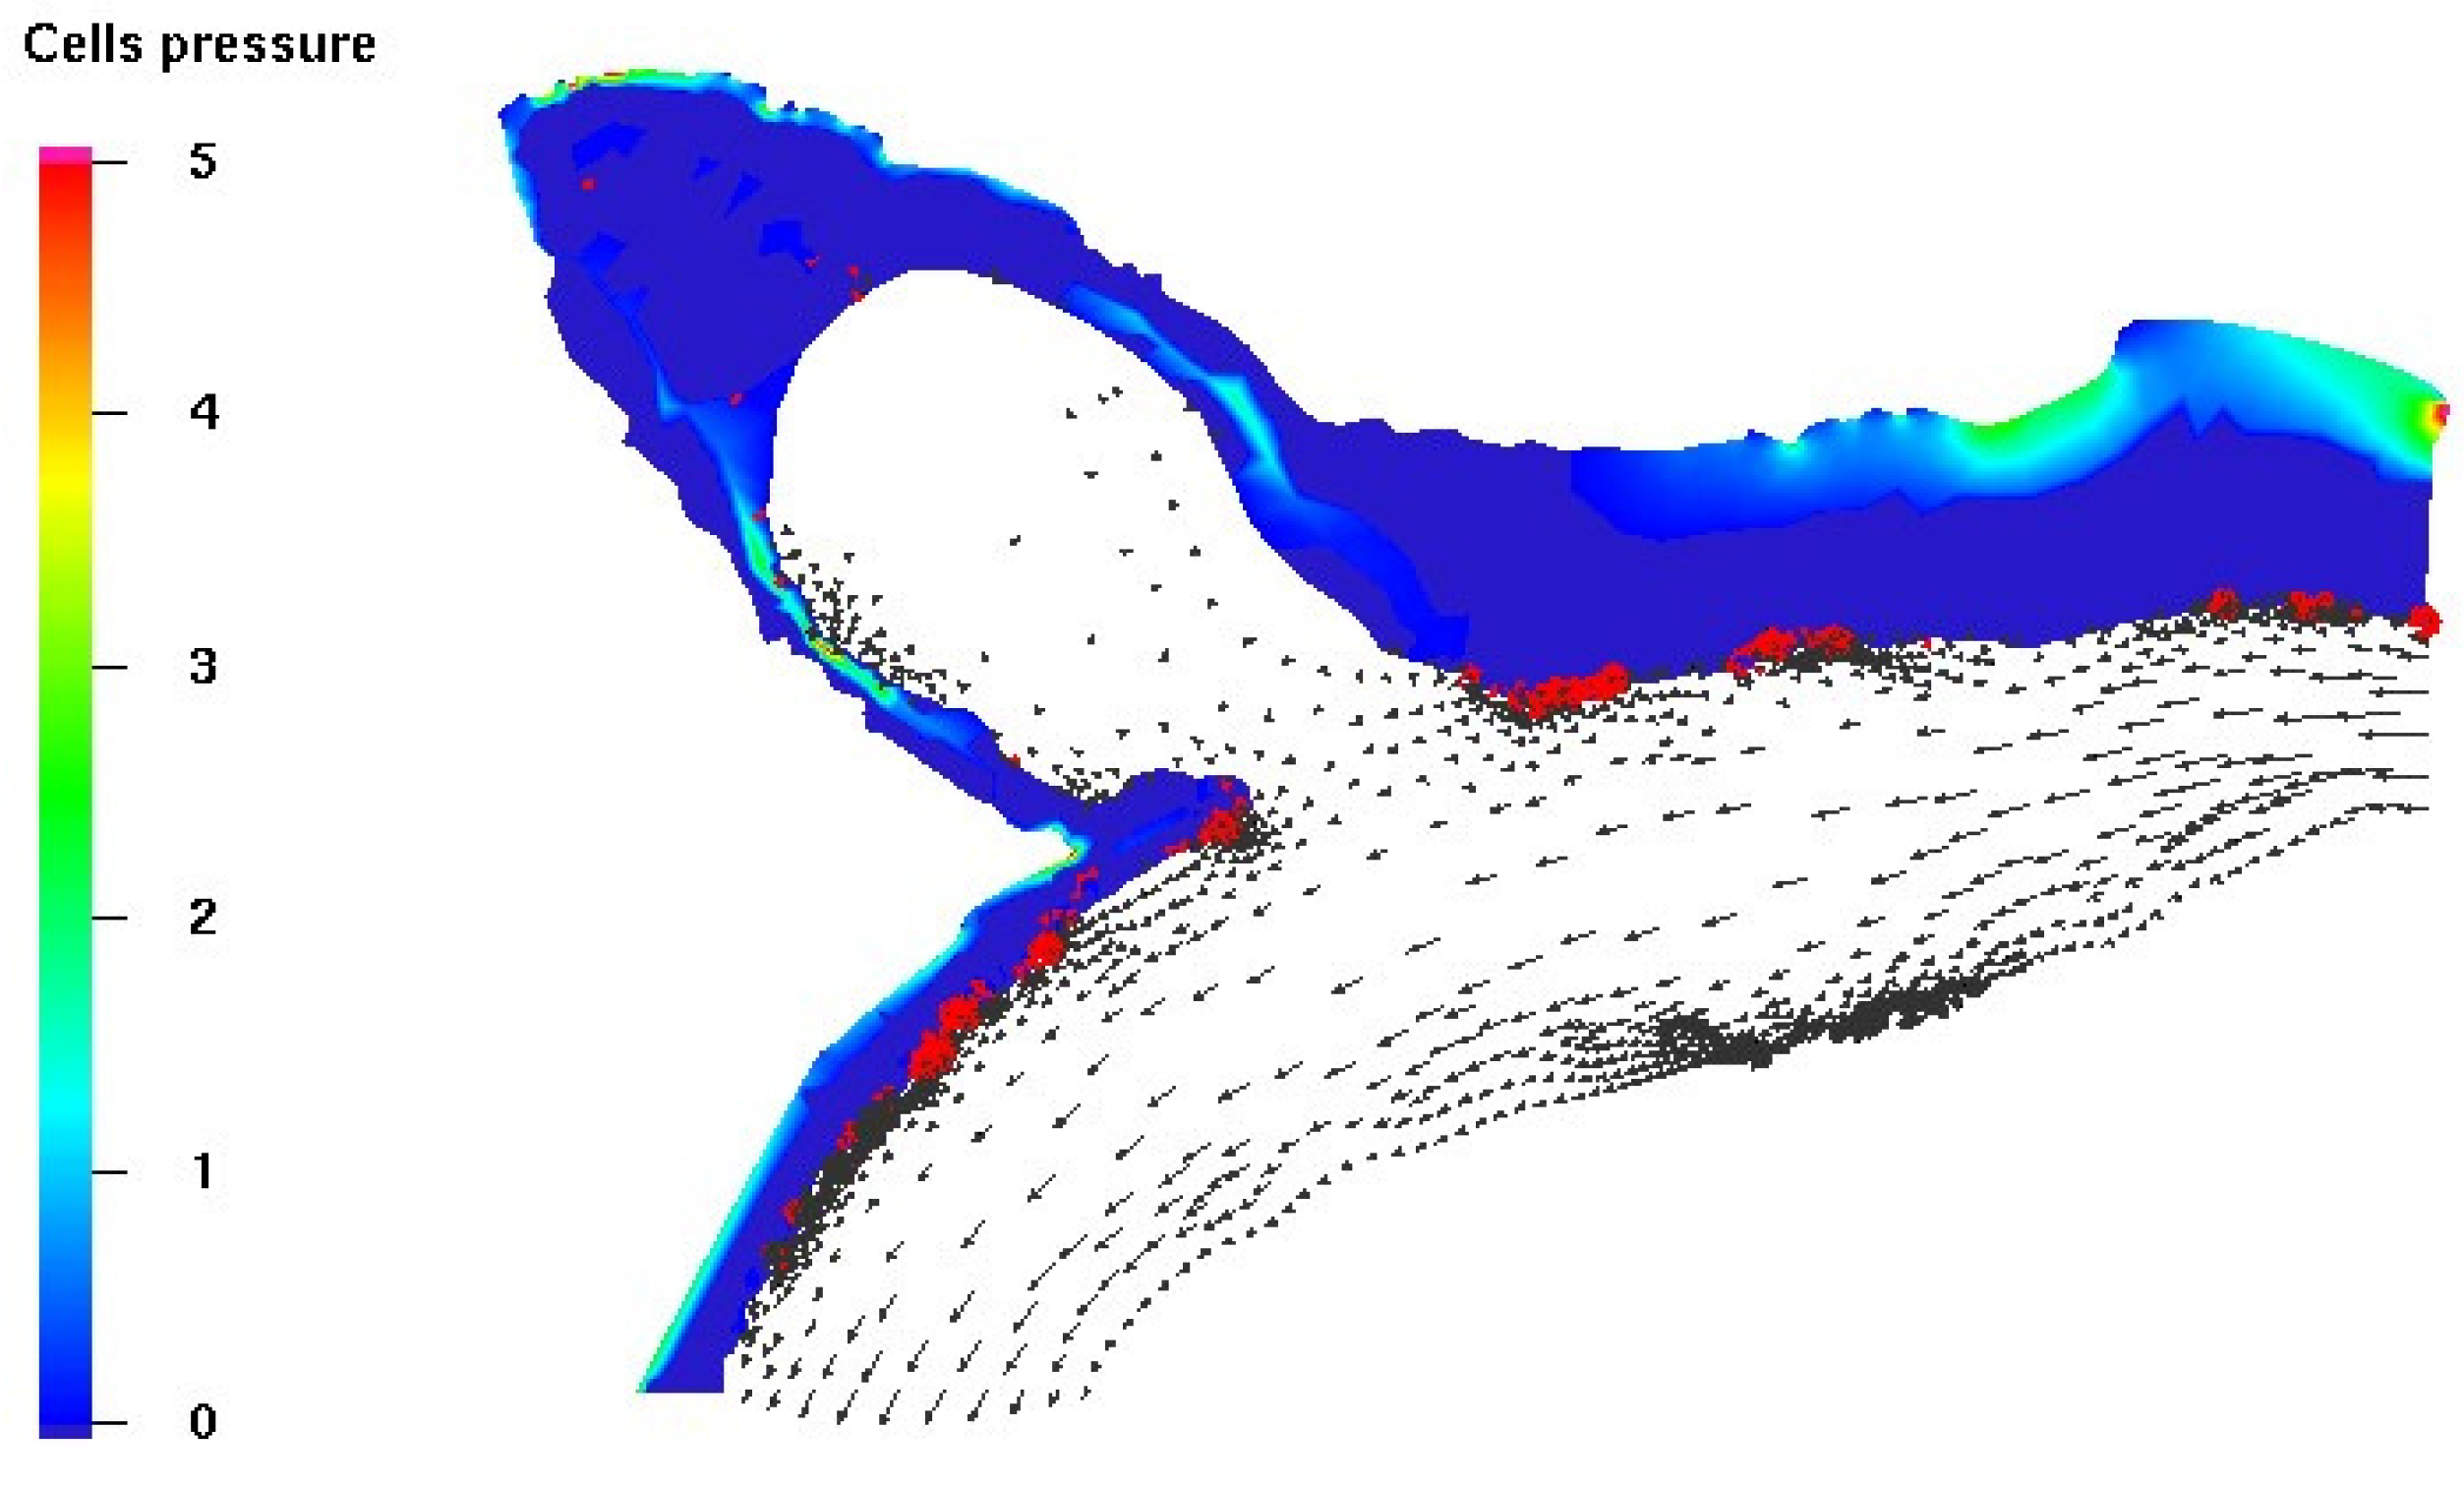
Figure 16. The pressure on the wall is nearly constant when the flow is fully developed, as indicated in
Figure 17.
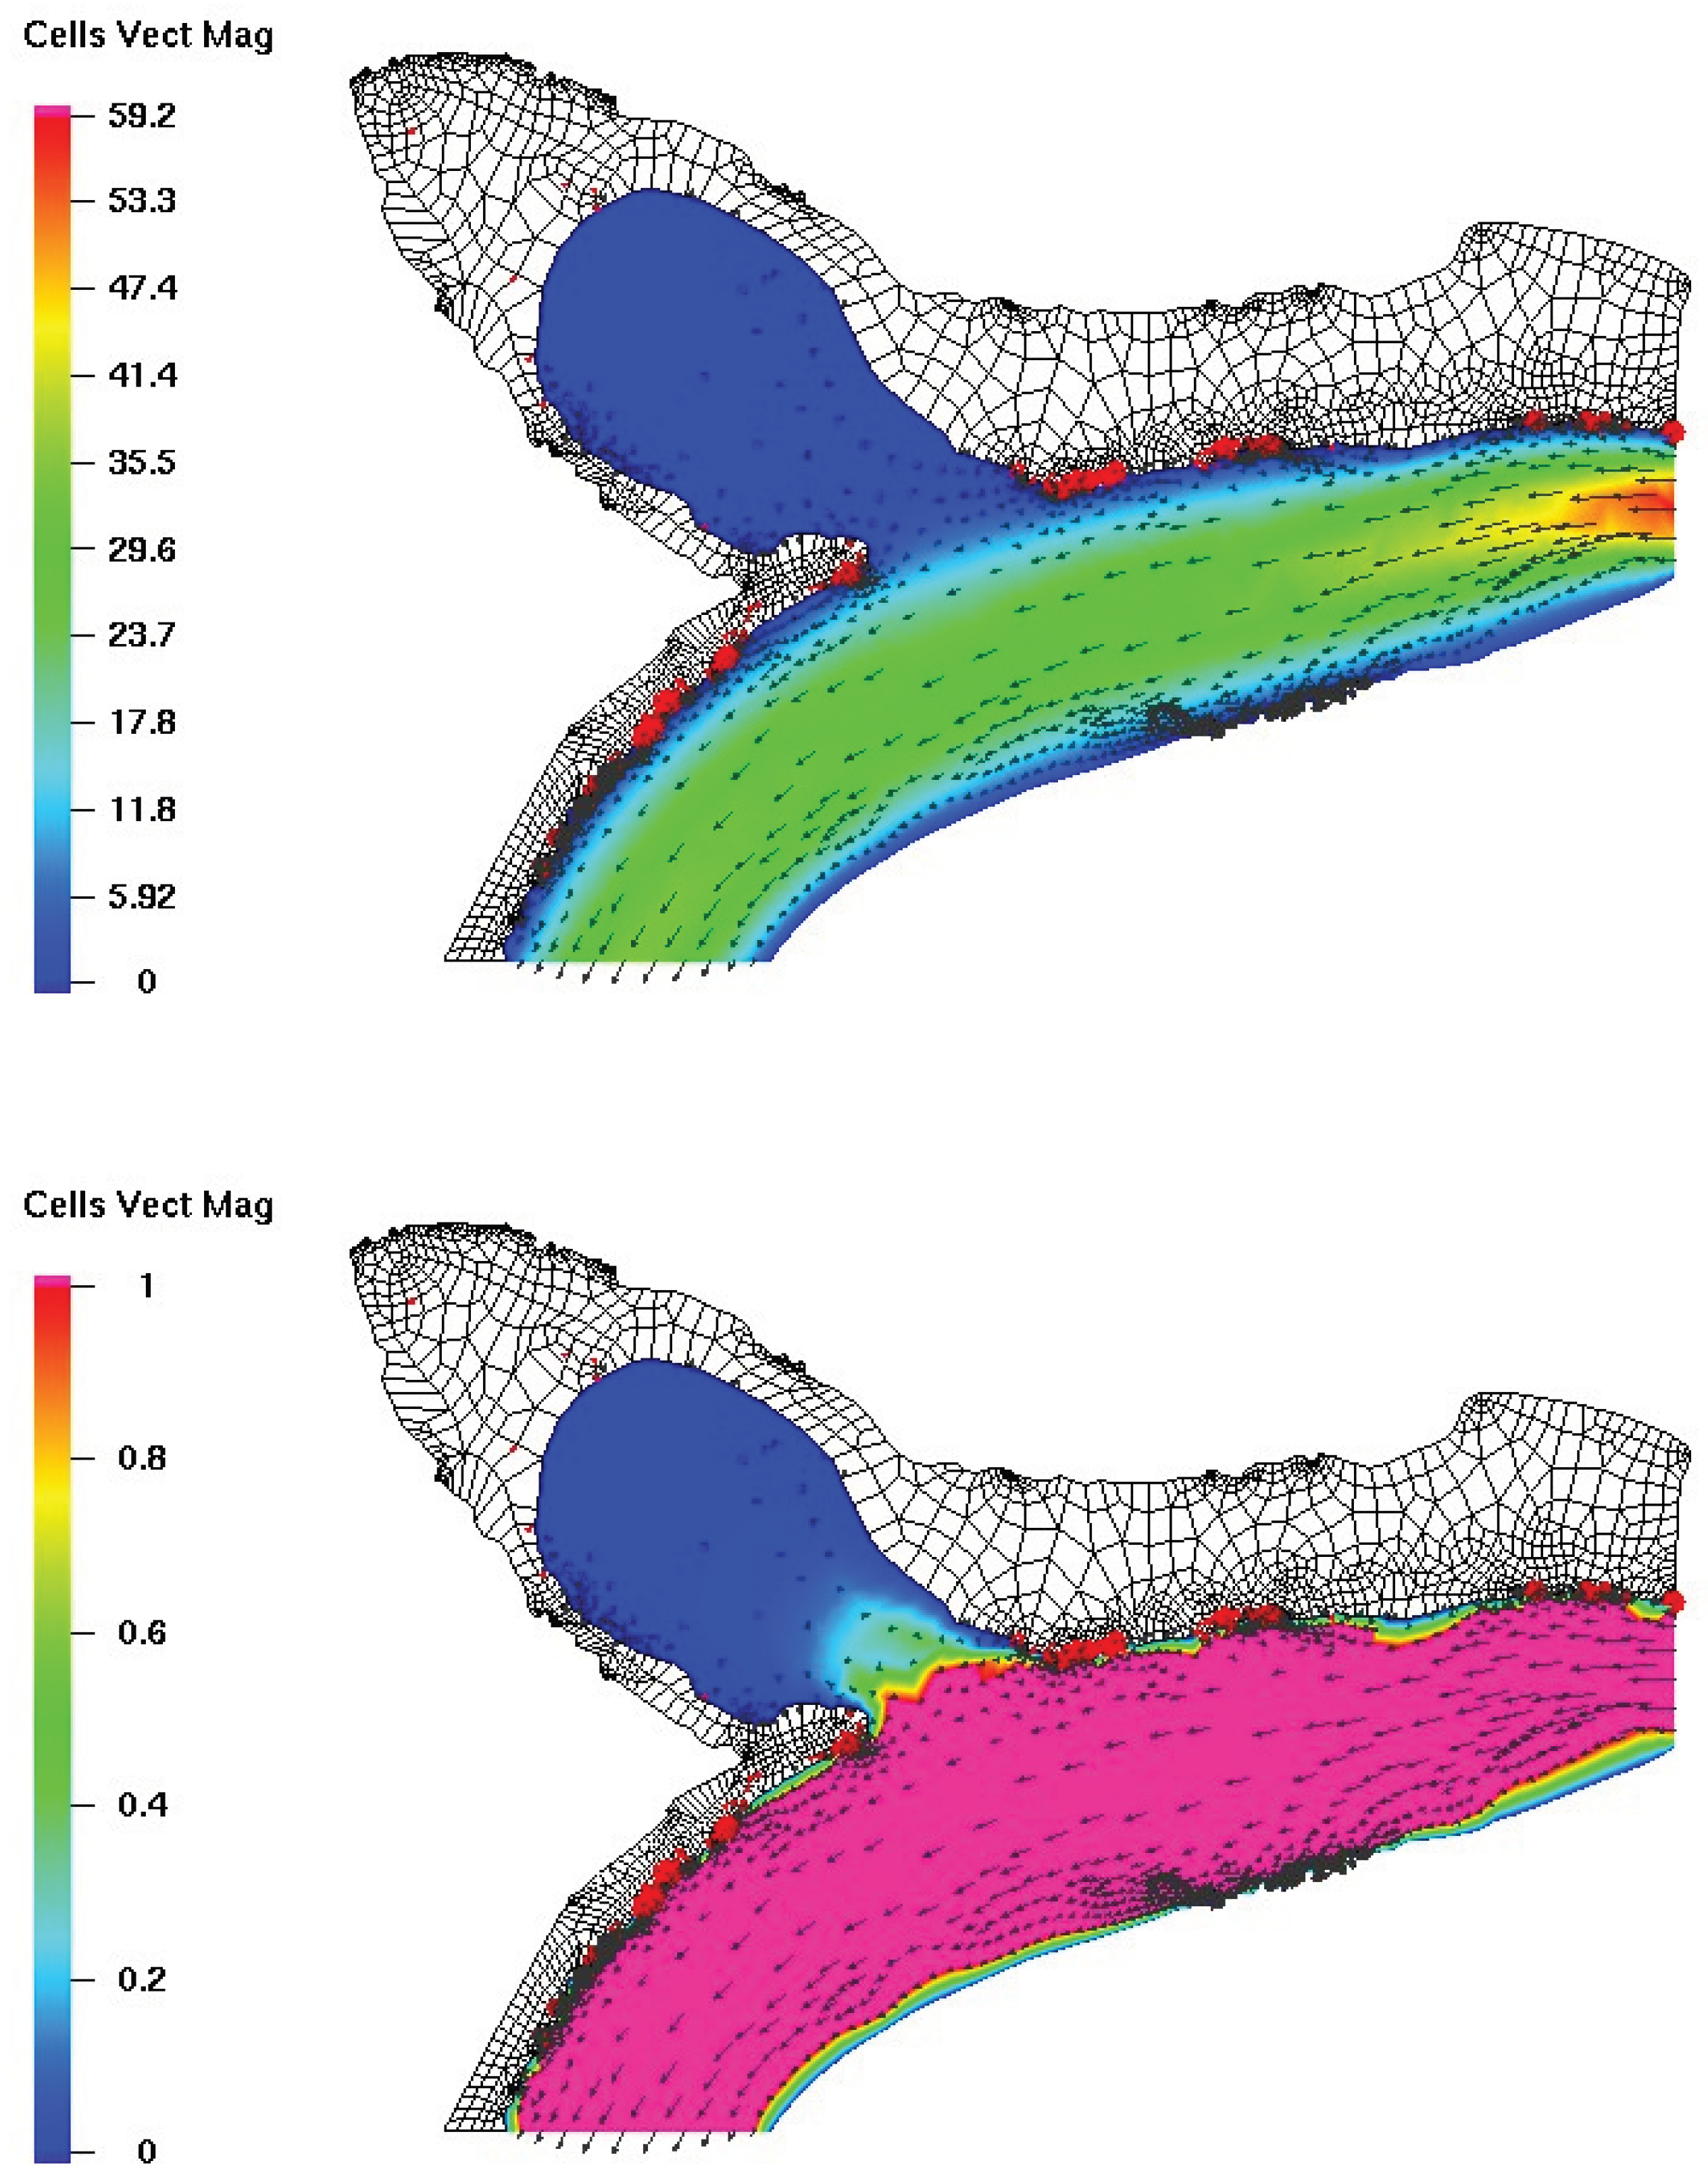
Figure 18 illustrates the behavior of blood flow toward the aneurysm, demonstrating both its magnitude and intensity. The top part of the figure displays the velocity magnitude of the entire domain, while the bottom part focuses on a zoomed-in view of the blood flow magnitude inside the aneurysm.
It is evident from the figure that the blood flow intensity is higher near the neck of the aneurysm, which could potentially lead to complications. Additionally, the flow behavior within the aneurysm is affected by the surrounding vessels, resulting in complex flow patterns.
It is worth noting that the accurate prediction of blood flow behavior is crucial for the diagnosis and treatment of aneurysms. With the advancements in computational fluid dynamics, researchers can now simulate and analyze the blood flow within aneurysms, aiding in the development of effective treatment strategies.
6. Conclusions
The coupling of solid mechanics and fluid dynamics is an important area of study in the field of biomechanics, as it allows for a better understanding of the behavior of biological tissues and organs under the influence of external forces. In this regard, the deformation of hyperelastic materials has been widely investigated due to its relevance in many biological applications, such as in the design of cardiovascular implants, tissue engineering, and soft robotics.
The findings presented above demonstrate that the deformation of a hyperelastic flap is strongly influenced by the velocity of the fluid that interacts with it. This is due to the fact that the fluid exerts forces on the surface of the flap, causing it to deform in a certain way. In addition, the study highlights the importance of the material properties of the hyperelastic flap in determining its behavior under fluid flow. Specifically, the hyperelastic properties of the material are defined by material constants such as Lame parameters and and , which determine the material’s ability to resist deformation.
Understanding the behavior of hyperelastic materials under fluid flow is important for designing effective biomedical devices, such as prosthetic heart valves, stents, and arterial grafts. In these applications, the fluid flow and the deformation of the materials are intimately linked, and the design of the devices must take into account the complex interplay between the two. The findings presented above provide useful insights into this complex behavior and may help in the development of more effective biomedical devices that can withstand the complex and dynamic forces exerted by the fluid environment.
In the first case (
Section 5.1), only the SVK material model was considered. The results indicate that the displacement of the flap increases with the increase in the value of the flow velocity. If the values of the Lame parameters are different, it would affect the observed displacement of the flap. This highlights the significance of material properties of the solid and fluid parameters such as velocity and media in determining the nature of the interaction between the fluid and structure. Hence, designers should carefully choose materials and adjust fluid parameters to achieve the desired outcomes for specific applications. The optimization of material properties and fluid parameters could lead to enhanced performance and efficiency in fluid-structure interaction systems.
Case (
Section 5.2) introduces a more complex scenario where the fluid interacts with two hyperelastic materials. The deformation of the roof in this case is intricately linked to the deformation of the flap, resulting in a coupled response. Specifically, if the flap remains relatively undeformed as presented in the study, the flow diverts towards the roof, leading to its deformation. However, if the flap undergoes significant deformation, the diversion of flow towards the top roof is reduced, resulting in less deformation of the roof. It is worth noting that the placement of the flap also plays a significant role in determining the deformation of the roof in this scenario.
In Case (
Section 5.3), two hyperelastic material models were examined in terms of their interaction with a fluid. The material properties were carefully chosen to produce minimal deformation of the flap, with most of the flow’s effects being directed towards the top roof. The displacement of the vertical flap in the y-direction was found to be significantly less than that in the x-direction. Furthermore, the velocity plot displayed the diversion of the flow. To examine the impact of velocity change on material deformation, the step size of the mean inlet velocity was decreased for Cases 2 and 3. The values of the material constants, such as
and
, were found to play a crucial role in determining the behavior of the hyperelastic material.
The investigation presented in this study holds immense significance in the field of fluid-structure interaction, particularly concerning hyperelastic materials. The numerical approach employed in this study provides insightful information regarding the behavior of the fluid and structural variables during the interaction. Although experimentation provides accurate results, it is often challenging to conduct studies in wind tunnels to obtain deformation and displacement values of the materials due to the high cost of data acquisition and arrangement.
It is noteworthy to mention that the estimation and validation of wall shear stress (WSS) on arteries under the influence of pulsatile blood flow is of critical importance, especially in reviewing the coronary arteries for the rupture of atherosclerosis plaques. However, the lack of standard reference, inherent limitations of methodologies, and measurements call for significant improvements in accurate simulation and estimation to advance clinical research for life-saving purposes.
Acknowledgments
The authors received no financial support for the research, authorship, or publication of this article.
Conflicts of Interest
The authors declared that there was no conflict of interest in this study.
References
- Razzaq, M. Finite Element Simulation Techniques for Incompressible Fluid Structure Interaction With Applications to Bioengineering and Optimization. PhD thesis, Universitätsbibliothek Dortmund, 2011.
- Holzapfel, G.A. Nonlinear solid mechanics: a continuum approach for engineering science. Meccanica 2002, 37, 489–490. [Google Scholar] [CrossRef]
- Pei, J.; Yuan, S.; Yuan, J. Fluid-structure coupling effects on periodically transient flow of a single-blade sewage centrifugal pump. Journal of Mechanical Science and Technology 2013, 27, 2015–2023. [Google Scholar] [CrossRef]
- Frandsen, J. Numerical bridge deck studies using finite elements. Part I: flutter. Journal of fluids and structures 2004, 19, 171–191. [Google Scholar] [CrossRef]
- Bessert, N.; Frederich, O. Nonlinear airship aeroelasticity. Journal of fluids and structures 2005, 21, 731–742. [Google Scholar] [CrossRef]
- Rifai, S.M.; Johan, Z.; Wang, W.P.; Grisval, J.P.; Hughes, T.J.; Ferencz, R.M. Multiphysics simulation of flow-induced vibrations and aeroelasticity on parallel computing platforms. Computer methods in applied mechanics and engineering 1999, 174, 393–417. [Google Scholar] [CrossRef]
- Cui, P.; Han, J. Prediction of flutter characteristics for a transport wing with wingtip devices. Aerospace Science and Technology 2012, 23, 461–468. [Google Scholar] [CrossRef]
- Stein, K.; Benney, R.; Kalro, V.; Johnson, A.; Tezduyar, T.; Stein, K.; Benney, R.; Kalro, V.; Johnson, A.; Tezduyar, T. Parallel computation of parachute fluid-structure interactions. 14th Aerodynamic Decelerator Systems Technology Conference, 1997, p. 1505.
- Chen, H.Y.; Zhu, L.; Huo, Y.; Liu, Y.; Kassab, G.S. Fluid–structure interaction (FSI) modeling in the cardiovascular system. In Computational Cardiovascular Mechanics; Springer, 2010; pp. 141–157. [Google Scholar]
- Figueroa, C.A.; Vignon-Clementel, I.E.; Jansen, K.E.; Hughes, T.J.; Taylor, C.A. A coupled momentum method for modeling blood flow in three-dimensional deformable arteries. Computer methods in applied mechanics and engineering 2006, 195, 5685–5706. [Google Scholar] [CrossRef]
- Nobile, F.; Vergara, C. An effective fluid-structure interaction formulation for vascular dynamics by generalized Robin conditions. SIAM Journal on Scientific Computing 2008, 30, 731–763. [Google Scholar] [CrossRef]
- Razzaq, M.; Damanik, H.; Hron, J.; Ouazzi, A.; Turek, S. FEM multigrid techniques for fluid–structure interaction with application to hemodynamics. Applied Numerical Mathematics 2012, 62, 1156–1170. [Google Scholar] [CrossRef]
- Piperno, S.; Farhat, C. Partitioned procedures for the transient solution of coupled aeroelastic problems–Part II: energy transfer analysis and three-dimensional applications. Computer methods in applied mechanics and engineering 2001, 190, 3147–3170. [Google Scholar] [CrossRef]
- Multiphysics, C. Introduction to COMSOL multiphysics®. COMSOL Multiphysics, Burlington, MA, accessed Feb 1998, 9, 2018. [Google Scholar]
- Hecht, F. New development in FreeFem++. J. Numer. Math. 2012, 20, 251–265. [Google Scholar] [CrossRef]
- Turek, S.; Becker, C. FEATFLOW Finite element software for the incompressible Navier-Stokes equations, User Manual Release 1.1. Preprint, Heidelberg 1998, 4. [Google Scholar]
- Basting, S.; Quaini, A.; Čanić, S.; Glowinski, R. Extended ALE Method for fluid–structure interaction problems with large structural displacements. Journal of Computational Physics 2017, 331, 312–336. [Google Scholar] [CrossRef]
- Wick, T. Fluid-structure interactions using different mesh motion techniques. Computers & Structures 2011, 89, 1456–1467. [Google Scholar]
- Hron, J.; Turek, S. A monolithic FEM solver for an ALE formulation of fluid-structure interaction with configuration for numerical benchmarking 2006.
- Ramegowda, P.C.; Ishihara, D.; Takata, R.; Niho, T.; Horie, T. Fluid–structure and electric interaction analysis of piezoelectric flap in a channel using a strongly coupled fem scheme. Proceeding of the 6th European Conference on Computational Mechanics (ECCM 6 2018), Glasgow, 2018, Vol. 12.
- Ciarlet, P.G. Three-dimensional elasticity; Vol. 20, Elsevier, 1988.
-
COMSOL Multiphysics; Stockholm, Sweden, 2018.
- Sackinger, P.A.; Schunk, P.R.; Rao, R.R. A Newton–Raphson pseudo-solid domain mapping technique for free and moving boundary problems: a finite element implementation. Journal of Computational Physics 1996, 125, 83–103. [Google Scholar] [CrossRef]
- Ervin, V.; Jenkins, E. The LBB condition for the Taylor-Hood P2-P1 and Scott-Vogelius P2-discP1 element pairs in 2-D. Technical report, Technical Report TR2011 04 EJ, Clemson University, 2011.
- Chaskalovic, J. Finite-Element Method. In Mathematical and Numerical Methods for Partial Differential Equations; Springer, 2014; pp. 63–109.
- Turek, S.; Hron, J.; Razzaq, M.; Wobker, H.; Schäfer, M. Numerical Benchmarking of Fluid-Structure Interaction: A comparison of different discretization and solution approaches. In Fluid-Structure Interaction II: Modelling, Simulation, Optimisation; Bungartz, H.J.; Mehl, M.; Schäfer, M., Eds.; Springer, 2010; Vol. 73, Lecture Notes in Computational Science and Engineering, pp. 413–424. [CrossRef]
- Kelley, C. Iterative Methods for Optimization; SIAM: Philadelphia, 1999. [Google Scholar]
- Turek, S. Efficient Solvers for Incompressible Flow Problems: An Algorithmic and Computational Approach; Springer-Verlag, 1999.
- Amestoy, P.R.; Duff, I.S.; Koster, J.; L’Excellent, J.Y. A Fully Asynchronous Multifrontal Solver Using Distributed Dynamic Scheduling. SIAM Journal on Matrix Analysis and Applications 2001, 23, 15–41. [Google Scholar] [CrossRef]
- Razzaq, M.; Turek, S.; Hron, J.; Acker, J.F.; Weichert, F.; Grunwald, I.Q.; Roth, C.; Wagner, M . Romeike, B.F. Numerical simulation and benchmarking of fluid-structure interaction with application to Hemodynamics. In Fundamental Trends in Fluid-Structure Interaction; Galdi, G.P.; Rannacher, R., Eds.; World Scientific, 2010; Vol. 1, Contemporary Challenges in Mathematical Fluid Dynamics and its applications, pp. 171–199.
- Valencia, A.; Ladermann, D.; Rivera, R.; Bravo, E.; Galvez, M. Blood flow dynamics and fluid–structure interaction in patient -specific bifurcating cerebral aneurysms. International Journal for Numerical Methods in Fluids 2008, 58, 1081–1100. [Google Scholar] [CrossRef]
- Johnston, B.M.; Johnston, P.R.; Corney, S.; Kilpatrik, D. Non-Newtonian blood flow in human right coronary arteries: steady state simulations. Journal of Biomechanics 2004, 37, 709–720. [Google Scholar] [CrossRef] [PubMed]
Figure 1.
The location of the degrees of freedom for the element.
Figure 1.
The location of the degrees of freedom for the element.
Figure 2.
The complete geometry of the channel with a vertical flap, including the coarse mesh, geometrical details, and boundary conditions specification.
Figure 2.
The complete geometry of the channel with a vertical flap, including the coarse mesh, geometrical details, and boundary conditions specification.
Figure 3.
Surface velocity plot along with arrow representation at velocity of .
Figure 3.
Surface velocity plot along with arrow representation at velocity of .
Figure 4.
Pressure Contours at velocity .
Figure 4.
Pressure Contours at velocity .
Figure 5.
Displacement of the Flap.
Figure 5.
Displacement of the Flap.
Figure 6.
Surface velocity plot along with arrow representation at velocity of .
Figure 6.
Surface velocity plot along with arrow representation at velocity of .
Figure 7.
Pressure Contours at velocity .
Figure 7.
Pressure Contours at velocity .
Figure 8.
Displacement of the Flap.
Figure 8.
Displacement of the Flap.
Figure 9.
Surface velocity plot along with arrow representation at velocity of .
Figure 9.
Surface velocity plot along with arrow representation at velocity of .
Figure 10.
Pressure Contours at velocity .
Figure 10.
Pressure Contours at velocity .
Figure 11.
Displacement of the Flap.
Figure 11.
Displacement of the Flap.
Figure 12.
Drag and lift: SVK (vertical flap) and rigid (walls).
Figure 12.
Drag and lift: SVK (vertical flap) and rigid (walls).
Figure 13.
Drag and lift: SVK (Top roof) and Neo-Hookean (Vertical Flap).
Figure 13.
Drag and lift: SVK (Top roof) and Neo-Hookean (Vertical Flap).
Figure 14.
Drag and lift: SVK (Top Roof) and Mooney Rivlin (vertical Flap).
Figure 14.
Drag and lift: SVK (Top Roof) and Mooney Rivlin (vertical Flap).
Figure 15.
Left: A coarse mesh. Right: Microanatomy sketch of aneurysm.
Figure 15.
Left: A coarse mesh. Right: Microanatomy sketch of aneurysm.
Figure 16.
The distributions effective stress.
Figure 16.
The distributions effective stress.
Figure 17.
The pressure distributions.
Figure 17.
The pressure distributions.
Figure 18.
Top: Blood flow velocity vector magnitude in the entire domain. Bottom: blood flow velocity vector magnitude inside aneurysm domain.
Figure 18.
Top: Blood flow velocity vector magnitude in the entire domain. Bottom: blood flow velocity vector magnitude inside aneurysm domain.
Table 1.
Material physical properties.
Table 1.
Material physical properties.
| Case |
Case 1 |
Case 2 |
Case 3 |
Units |
| Density |
1 |
1 |
1 |
|
| Young’s Modulus |
5.6 |
5.6 |
5.6 |
|
| Lame parameter
|
8 |
8 |
8 |
|
| Lame parameter
|
2 |
2 |
2 |
|
| Mean inlet velocity step size |
0.012 |
0.0055 |
0.0055 |
- |
|
- |
- |
75 |
|
|
- |
- |
100 |
|
|
Disclaimer/Publisher’s Note: The statements, opinions and data contained in all publications are solely those of the individual author(s) and contributor(s) and not of MDPI and/or the editor(s). MDPI and/or the editor(s) disclaim responsibility for any injury to people or property resulting from any ideas, methods, instructions or products referred to in the content. |
© 2023 by the authors. Licensee MDPI, Basel, Switzerland. This article is an open access article distributed under the terms and conditions of the Creative Commons Attribution (CC BY) license (http://creativecommons.org/licenses/by/4.0/).

