1. Introduction
The growing use of digital imaging technology and the increasing importance of online data storage and transmission have made research on image encryption both timely and necessary. In turn, this has also lead to increased demands for image encryption algorithms in various aspects of life, including: a) Increased use of digital imaging technology and applications [
1,
2]. With the widespread use of digital cameras, smartphones, and other imaging devices, the amount of sensitive and personal information stored in digital images has increased dramatically. This has made image encryption an important area of research; b) Growth of online data storage and transmission [
3]. The increasing use of online data storage and transmission has made it easier for unauthorized parties to access confidential image data. This has made encryption an essential tool for protecting image data in transit and in storage; c) Threats to privacy and security [
4]. As more sensitive and confidential information is stored in digital images, the risk of unauthorized access, theft, and tampering has increased. Image encryption is needed to protect against these threats; and d) Advancements in computing power [
5]. As computing power continues to increase, attackers are able to use more sophisticated cryptanalysis methods to break encryption algorithms. This has made it important for researchers to continuously research and propose novel security measures for sensitive data.
While some researchers have focused their efforts into advancing cryptographic algorithms [
6,
7,
8,
9], others have dedicated their efforts towards the field of steganography [
10,
11]. Moreover, the literature shows a third group that combines the use of cryptography with steganography for added security [
12,
13,
14]. Such efforts were realized because traditional data encryption algorithms such as DES [
15], 3DES [
16] and AES [
17,
18] were found to be no longer best-suited for image encryption. This is due to a number of reasons such as: a) The large size of image data, which increases the computational cost and time required for encryption and decryption; b) Different properties of image data such as redundancy, pixel-correlation, and structure, which can affect the security of traditional encryption techniques; c) Lack of adaptability, since traditional encryption techniques are not well suited to handle the unique challenges posed by image data, such as the need to preserve image quality and the requirement for real-time encryption in certain applications; and d) Vulnerability to attacks, because some traditional encryption techniques, such as DES, have already been shown to be prone to cryptanalysis [
19]. To that end, scientists and engineers have been making use of various mathematical constructs and ideas inspired by nature to design secure and robust image encryption algorithms. Recent literature shows the employment of cellular automata (CA) [
20,
21,
22], DNA coding [
8,
23,
24,
25], electric circuits [
26,
27], as well as heavy reliance on dynamical functions of chaotic behavior [
6,
28,
29,
30,
31,
32]. The following paragraph highlights the utilization of various such ideas in the development of pseudo-random number generators (PRNGs) to build encryption keys and substitution boxes (S-boxes).
The development and deployment of PRNGs comprise the majority of cryptography research efforts. This is because a randomly distributed bit-stream benefits both key generation and S-box design [
33]. Numerous examples in the literature illustrate the usage of PRNGs in image cryptosystems. The researchers in [
34], for instance, employ the Lucas sequence to construct an S-box for their proposed image cryptosystem. The authors of [
35] produce encryption keys using the Rossler chaotic system and a Recaman’s sequence. Likewise, the authors of [
36] construct PRNGs as encryption keys utilizing the Fibonacci sequence, a chaotic tan function, and a Bessel function. The researchers in [
37] investigate elliptic curves and use them to create a PRNG, which they then combine with the Arnold map to encrypt images. Rule 30 CA generates a PRNG and is utilized as an encryption key in [
20]. In [
38], a Field Programmable Gate Array (FPGA) implementation of a PRNG utilizing a memristive Hopfield neural network with a specific activation gradient is proposed. The Mersenne Twister is deployed by the researchers in [
7] as one of the encryption keys in a multi-stage cryptosystem. An S-box is designed and utilized as the core stage in a 3-stage image cryptosystem in [
8], where the Lorenz system is numerically solved and its solution is used to generate a PRNG, which is then employed to generate the S-box. In another multi-stage image cryptosystem, the authors of [
39] employ a discretized version of the chaotic sine map to create an S-box and the hyperchaotic Lu system as a PRNG. On the other hand, so far the literature on image encryption does not feature image cryptosystems where the PRNGs offered by Intel’s Math Kernel Library (MKL) or OpenSSL are employed. Intel’s MKL is a library of optimized mathematical functions, including a high-quality PRNG [
40]. It is specifically optimized for use on Intel hardware, and can provide faster performance compared to other libraries. While OpenSSL is an open-source cryptography library that provides various cryptographic functions, including a random number generator [
41].
The literature clearly shows that chaos theory has been extensively studied and applied to image cryptosystems. This is due to the diversity of desirable traits exhibited by dynamical functions of chaotic behavior. These traits include periodicity, pseudo-randomness, sensitivity to initial values, and ergodicity [
42]. Broadly, these functions are categorized as either low-dimensional (LD) or high-dimensional (HD), with each class having a set of exclusive advantages [
6]. LD chaotic functions dramatically simplify software and hardware implementations, but their use in image cryptosystems could in some cases be insufficiently secure. In contrast, HD chaotic functions, despite being more complex and needing more computational resources and circuitry, are capable of offering exceptionally high levels of security. Furthermore, upon studying hyperchaotic functions, a wide number of control parameters are readily apparent [
43]. This implies that their use in image cryptosystems results in a significantly wider key space, which reduces the likelihood of brute-force attacks ever succeeding [
8]. Attempting to solve hyperchaotic systems at a fractional-order permits a further expansion of the number of control variables and, consequently, realizing an even wider key space.
Recently, the image processing community has developed an interest in chaotic fractional-order dynamical systems [
44]. Specifically, their applications in image cryptosystems have gained traction due to their superior performance compared to their integer-order counterparts [
45,
46,
47,
48,
49]. The authors of [
45] propose a secure image cryptosystem that employs smoothed sliding modes state observers for fractional-order chaotic systems. In [
46], an image cryptosystem with a very large key space is proposed using a fractional-order four-dimensional (4D) Chen hyperchaotic map in conjunction with a Fibonacci Q-matrix. An efficient image cryptosystem is proposed in [
47], where various fractional-order systems are utilized in an alternating fashion. In [
48], a fractional-order logistic map is proposed by the authors for the implementation of an image cryptosystem, where its performance is then compared to that attained by a conventional logistic map. The authors of [
49] present a technique for image encryption that use the solutions of chaotic fractional-order fuzzy cellular neural networks. However, it is easily observable that the use of fractional-order chaotic and hyperchaotic functions in image encryption makes for a rather new trend in the literature, with only a few articles mentioning such an application.
The previous paragraphs aimed at describing the need for research on image cryptosystems, the reliance of scholars on PRNGs to generate encryption keys and robust S-boxes, as well as the emerging utilization of hyperchaotic functions of fractional-order in this field of research. While the literature shows the prevalence of image cryptosystems that involve the use of multiple stages, in most cases these are limited to only 3 stages that comprise a total of a permutation-substitution-permutation (as in [
7,
8,
9,
20,
34]). In the rare case of employing more stages, execution times are not reported [
46]. This is because of the increases in complexity and the need for longer execution times that result from adding further encryption stages. To make use of multiple permutation-substitution networks (PSNs), while maintaining low complexity and short execution times, this research work proposes and achieves the following:
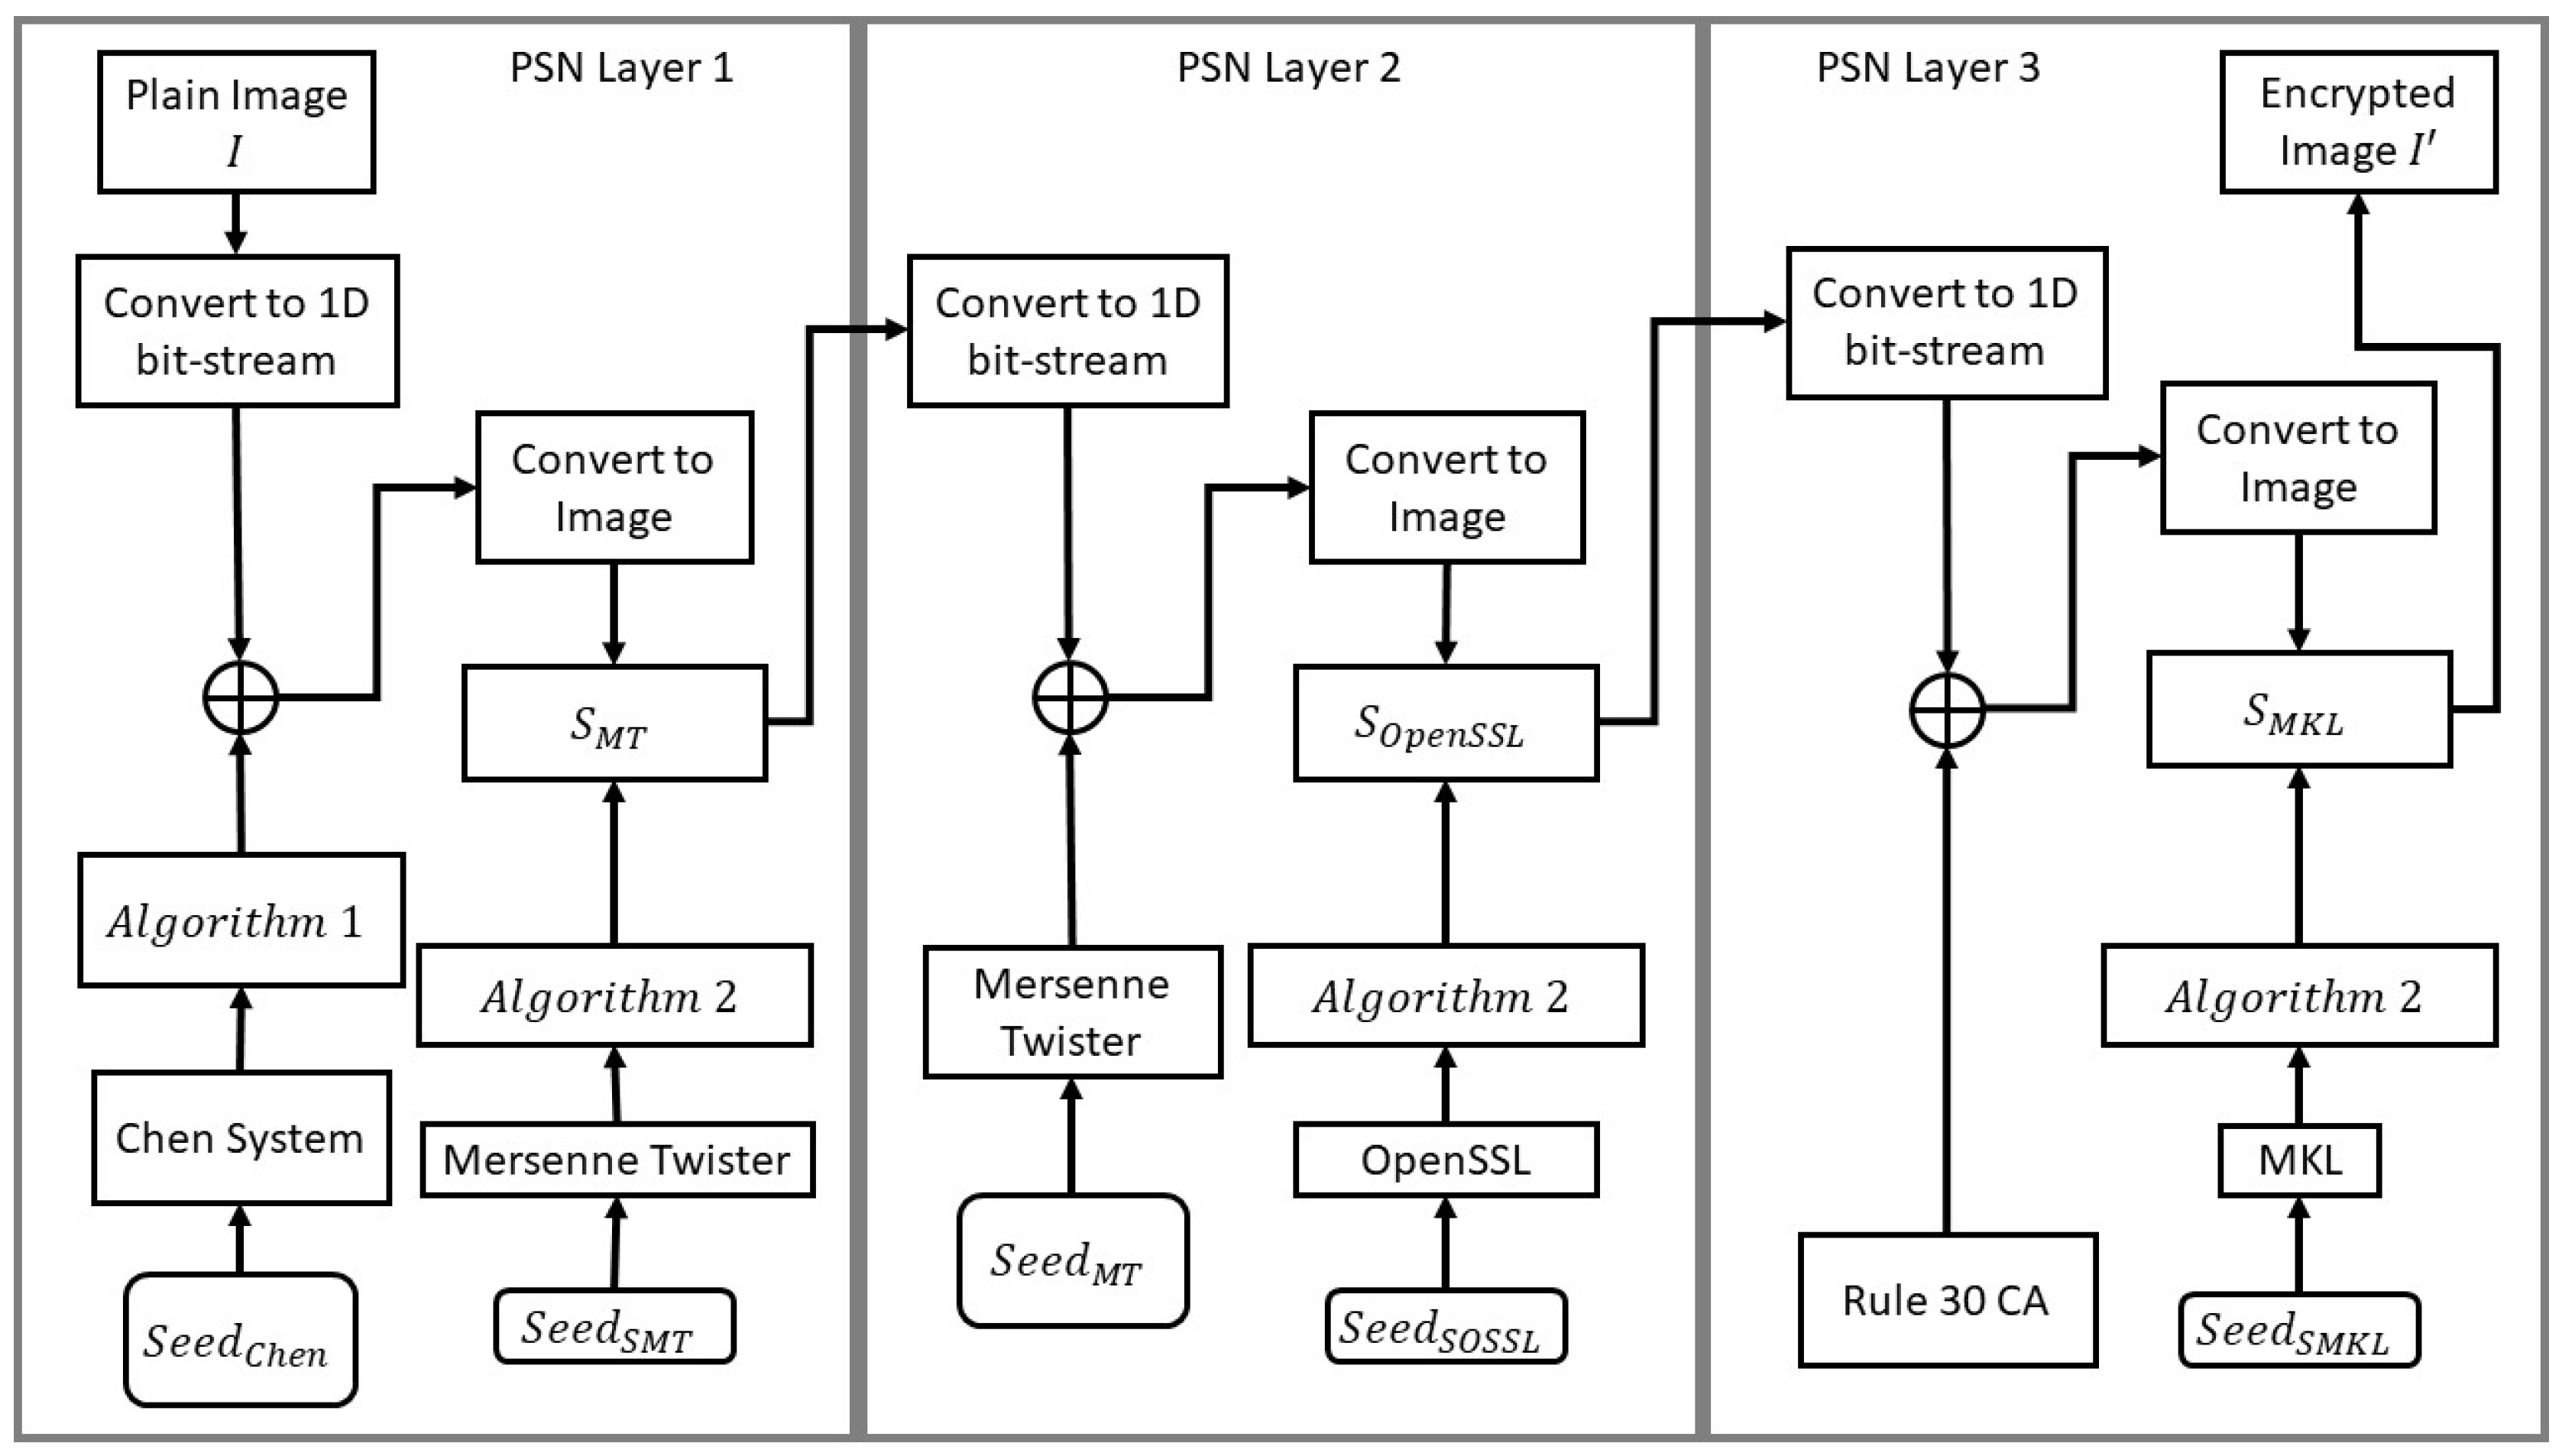
A highly efficient 3-layer PSN, where in each layer an encryption key is generated and utilized by XORing it with the image data, then an S-box is generated and applied to the resulting image. This effectively allows for bit-diffusion and bit-confusion, satisfying Shannon’s theory for secure communications [
50].
In the first layer, a fractional-order hyperchaotic Chen map is employed for key generation, while a Mersenne Twister PRNG is utilized for S-box design and application.
In the second layer, a Mersenne Twister PRNG is employed for key generation, while an OpenSSL PRNG is utilized for S-box design and application.
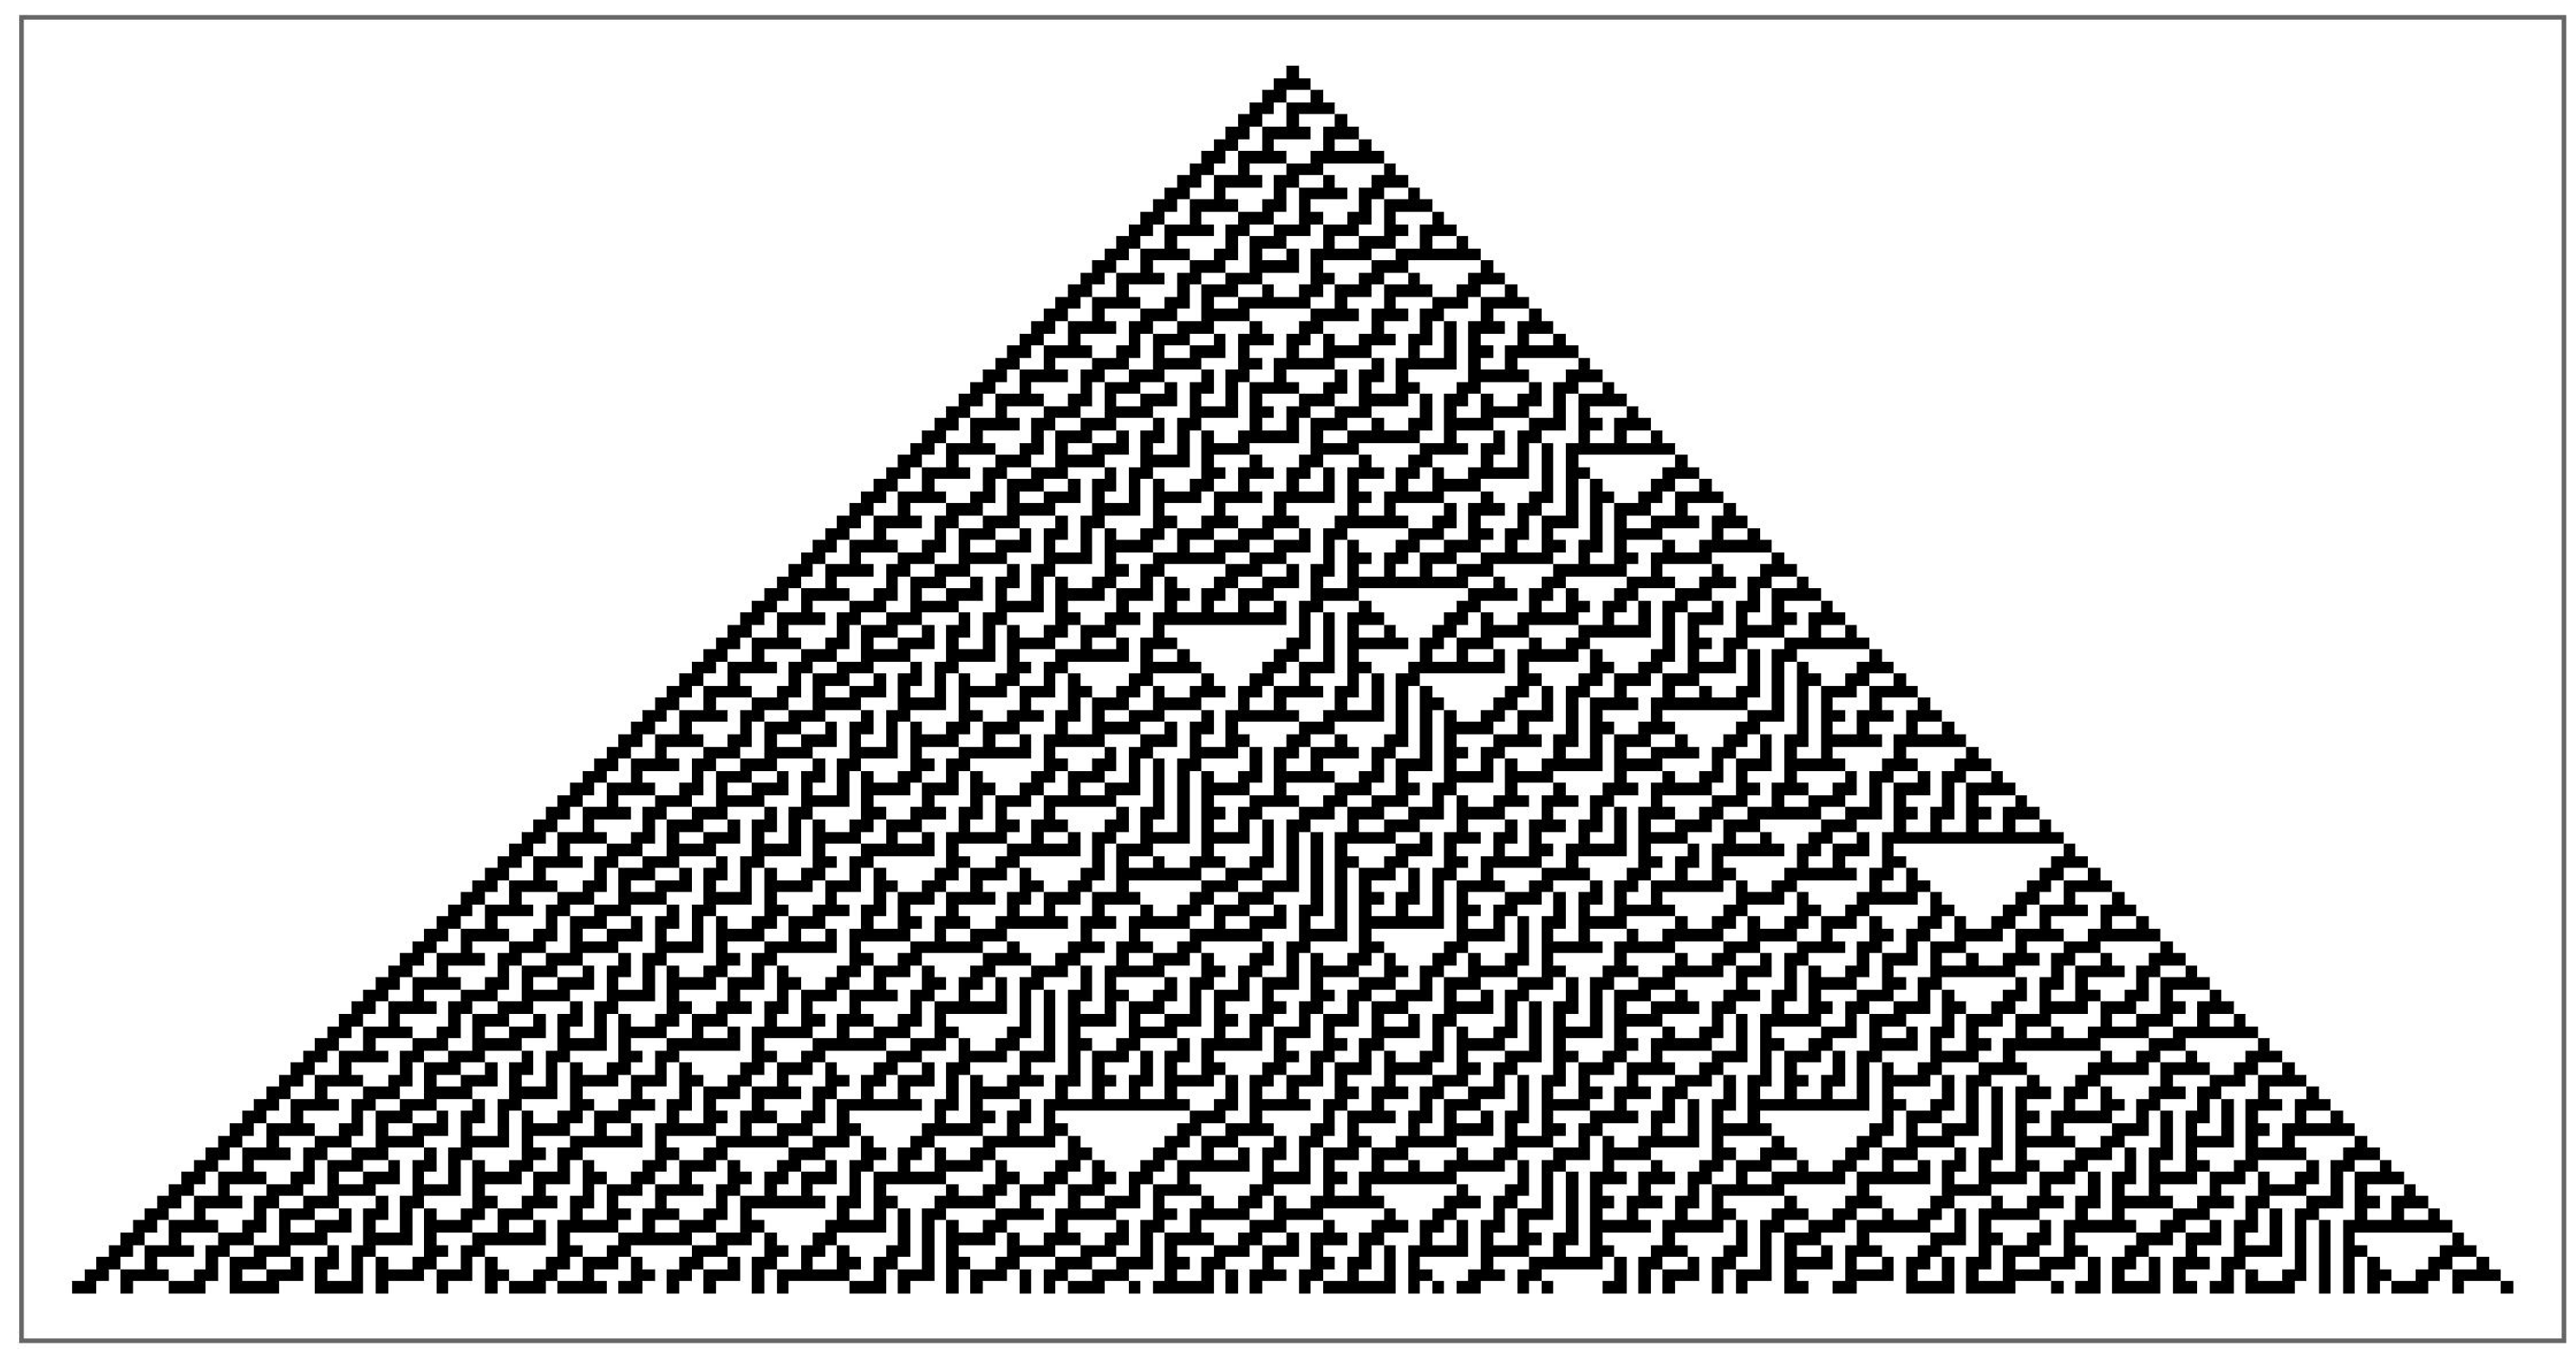
In the third layer, Rule 30 CA is employed for key generation, while an Intel’s MKL PRNG is utilized for S-box design and application.
By utilizing a dynamical system with hyperchaotic behavior, as well as selecting 3 S-boxes with specific criteria, a very large key space of , is achieved. Thus, fending off brute-force attacks.
By optimizing the code efficiency, a superior encryption rate is achieved by the proposed image cryptosystem, with an average encryption rate of Mbps.
This paper is organized as follows.
Section 2 outlines the various mathematical constructs and PRNGs utilized in the proposed image cryptosystem, as well as the design and selection criteria for the S-boxes in use.
Section 3 describes the proposed image cryptosystem in detail, along with algorithms and flow charts.
Section 4 reports the attained numerical results, as well as presents a comparative study with counterpart algorithms from the literature. Finally,
Section 5 draws the conclusions of this research work and suggests plausible future research directions that could be further pursued.
4. Numerical Results and Performance Evaluation
This section aims at conducting a full performance evaluation analysis of the proposed image cryptosystem, as well as at carrying out a comparative study with counterpart image encryption algorithms from the literature. The conducted analyses will test the proposed image cryptosystem’s ability at fending off attacks of various natures. Those include visual, statistical, entropy, differential as well as brute-force attacks. It will further measure how wide its key space is, how fast it carries out image encryption and decryption, and whether it can successfully pass all the tests in the National Institute of Standards and Technology (NIST) test suite. The proposed image cryptosystem and its testing are implemented in the Wolfram language, utilizing Wolfram Mathematica® v.13.2. This is carried out on a machine with the following specifications: 2.9 GHz 6-Core Intel® CoreTM i9 and 32 GB of 2400 MHz DDR4 RAM, running on a macOS Catalina v.10.15.7.
A number of commonly utilized images from the image processing community are employed. Those include: Lena, Mandrill, Peppers, Sailboat, House, House2 and Tree, all of dimensions , unless otherwise specified. The conducted tests are:
The National Institute of Standards and Technology Analysis (
Section 4.9).
4.1. Visual and Histogram Analyses
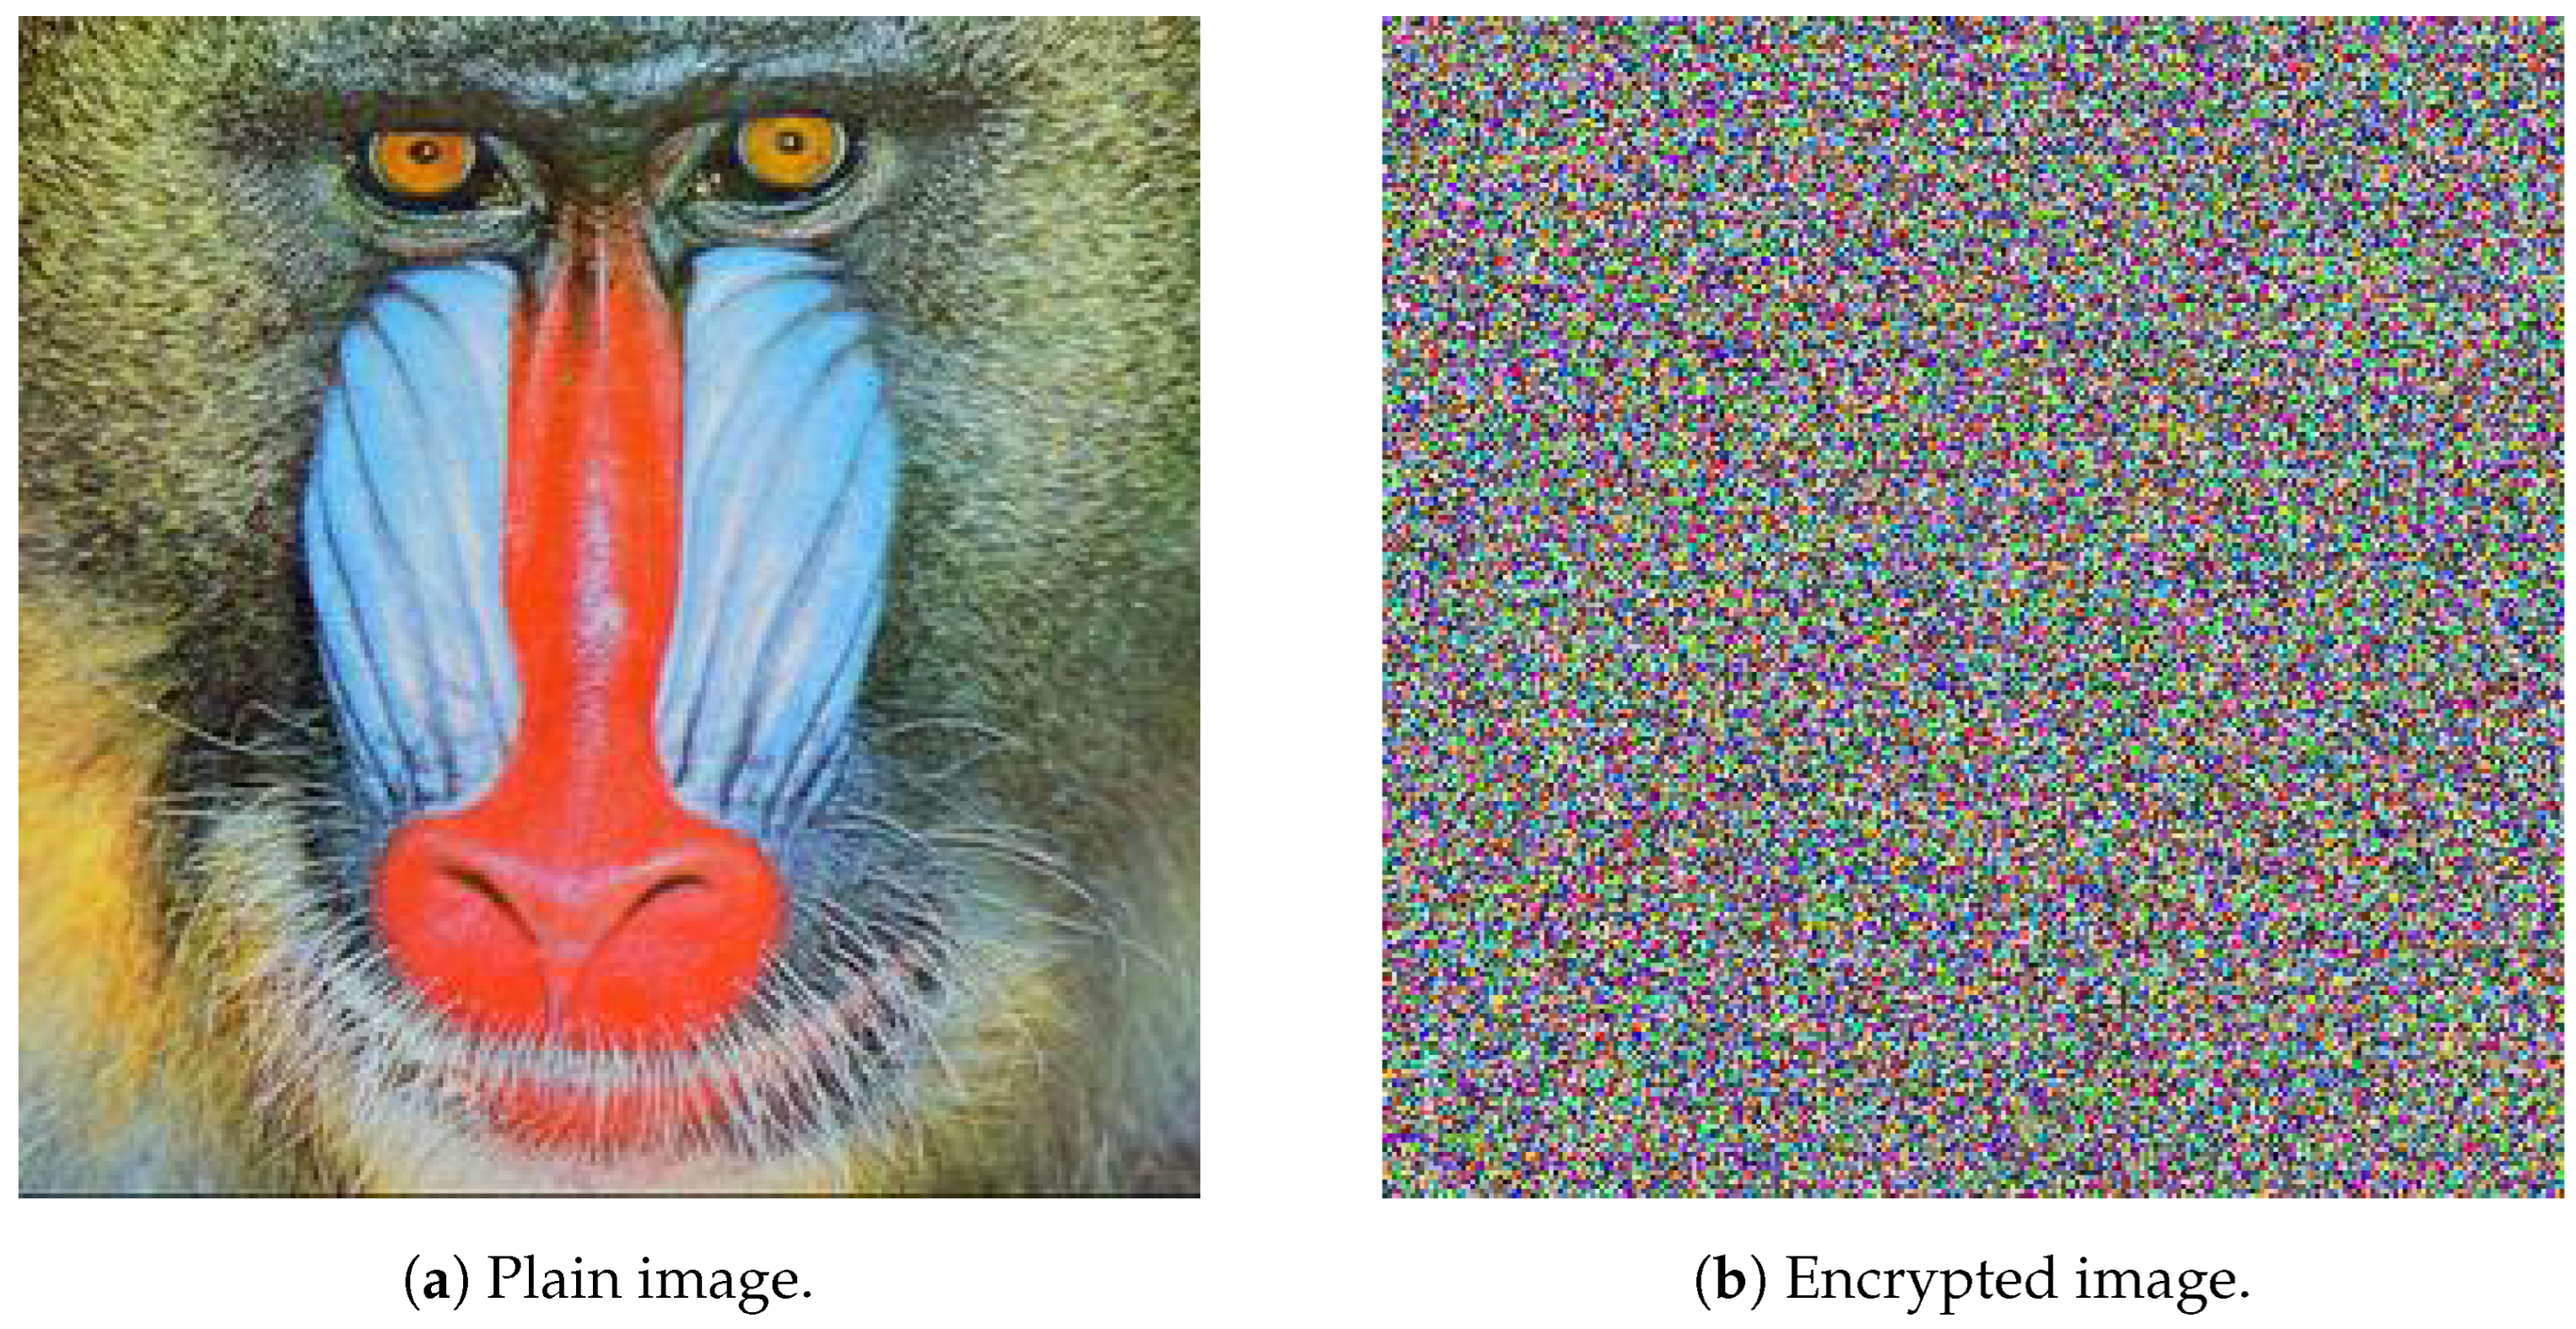
The simplest performance evaluation of an image cryptosystem may be easily conducted by examining a plain image and its encrypted version employing the human visual system (HVS).
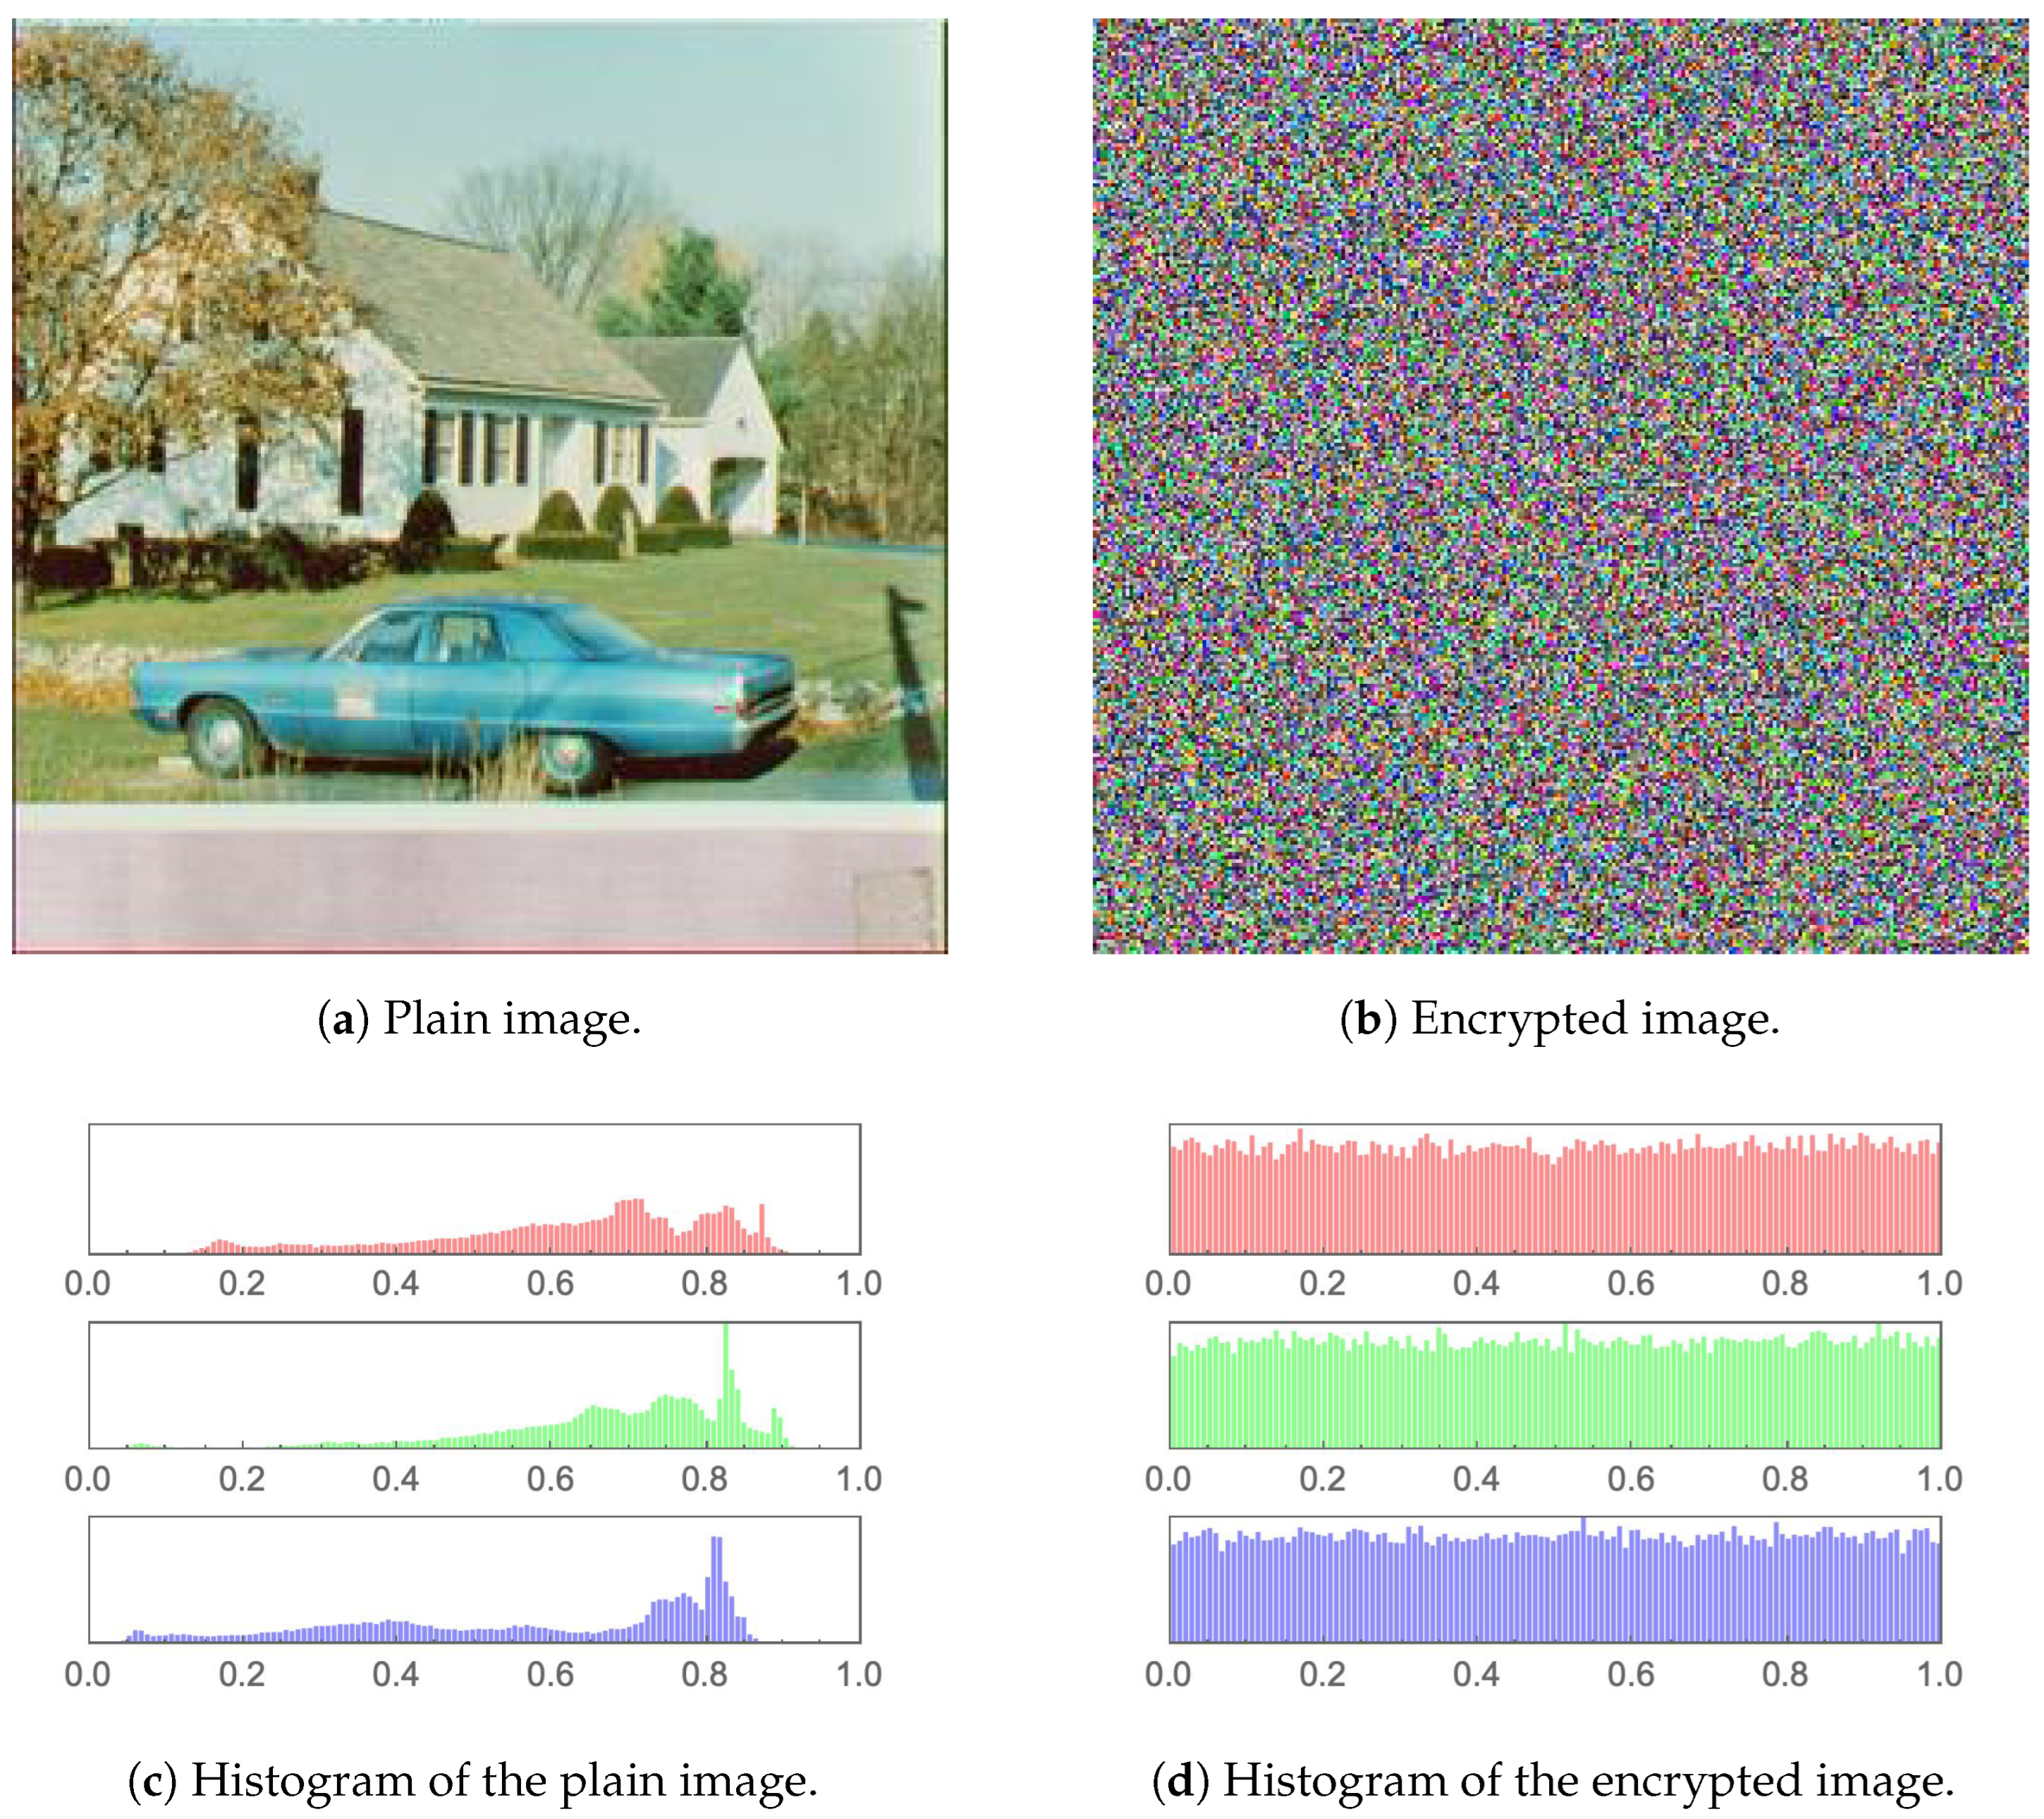
Figure 10,
Figure 11,
Figure 12,
Figure 13,
Figure 14 and
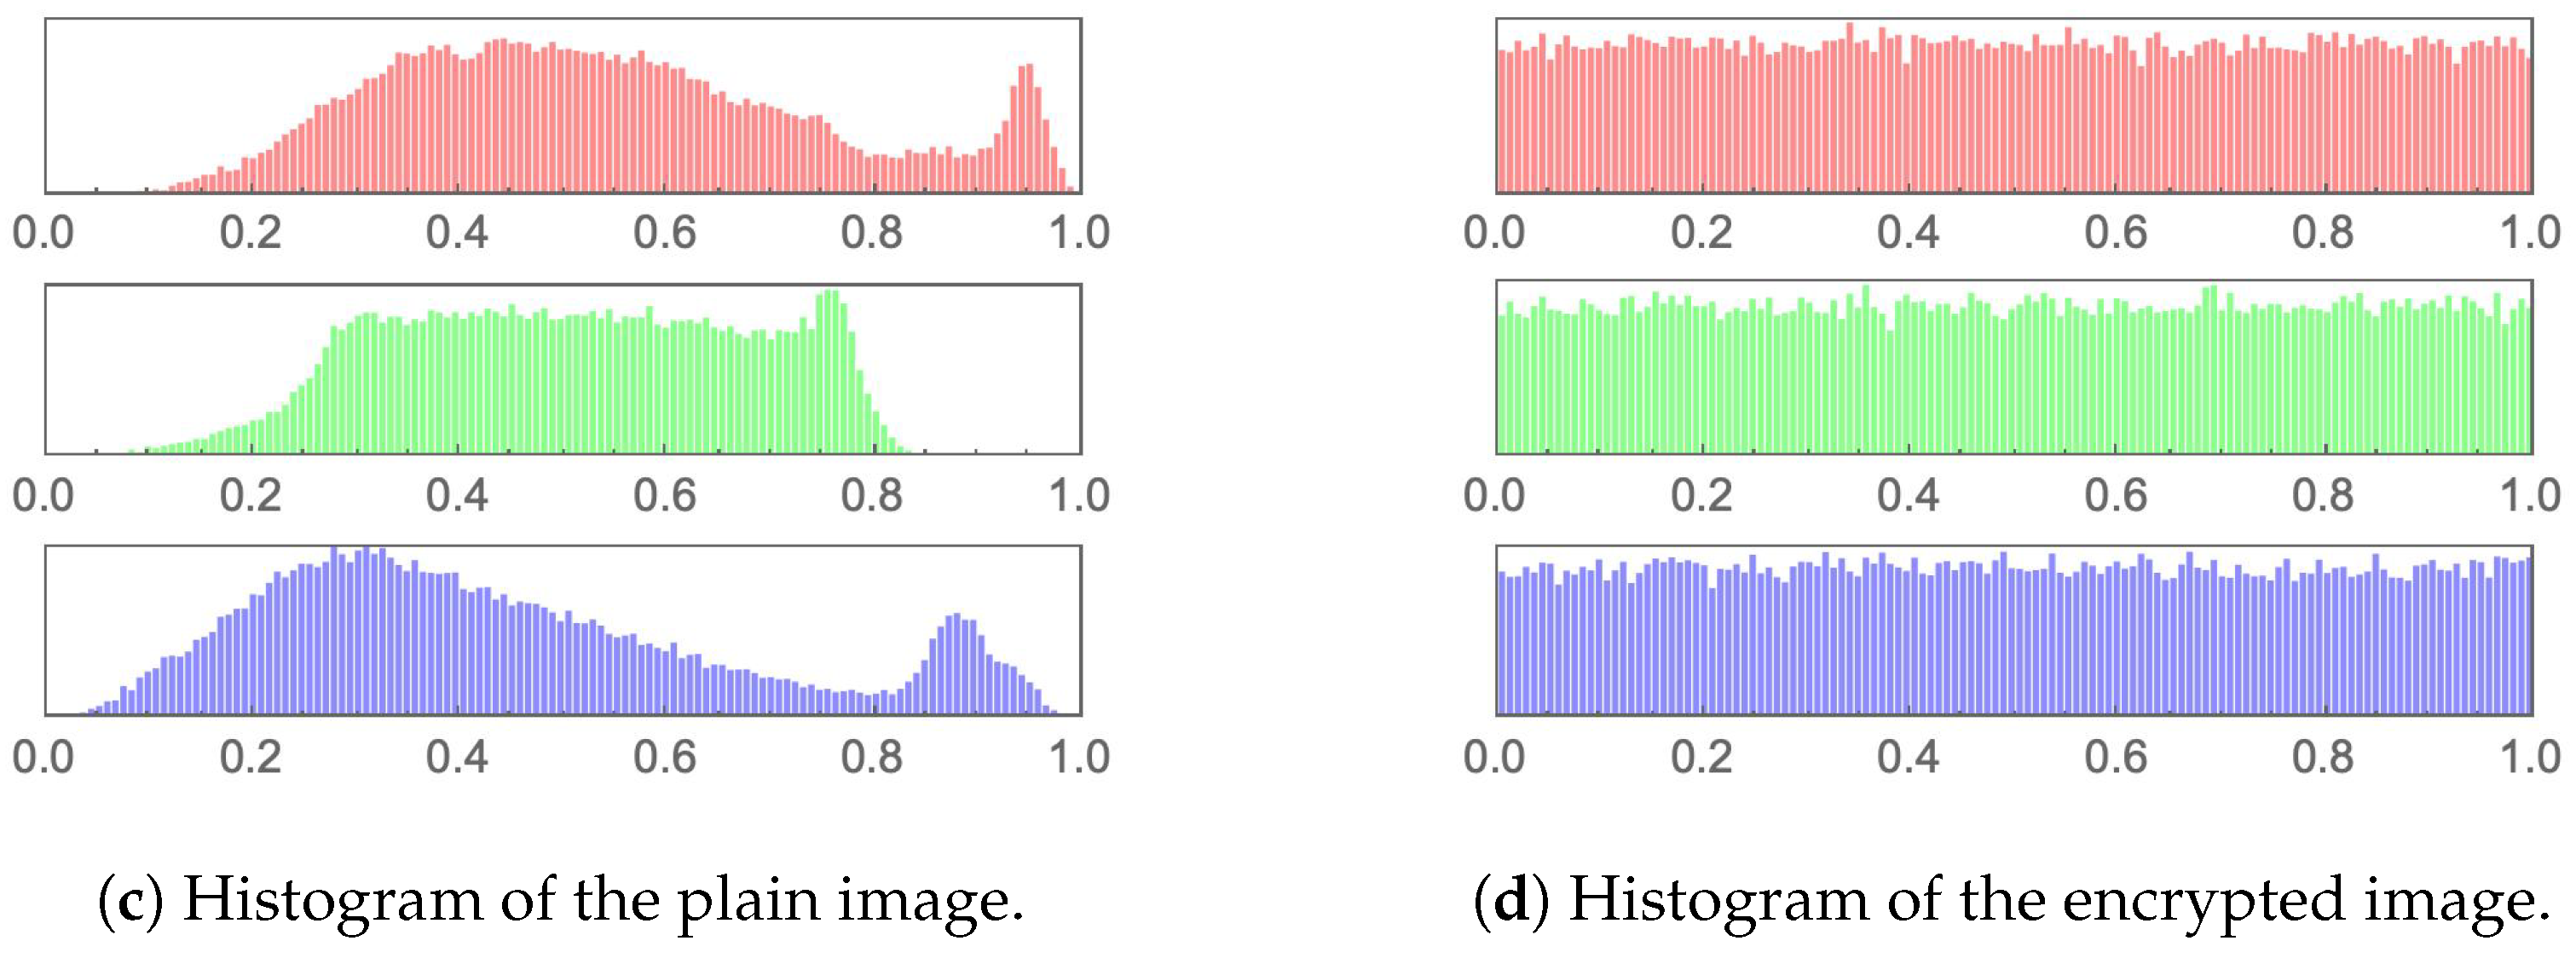
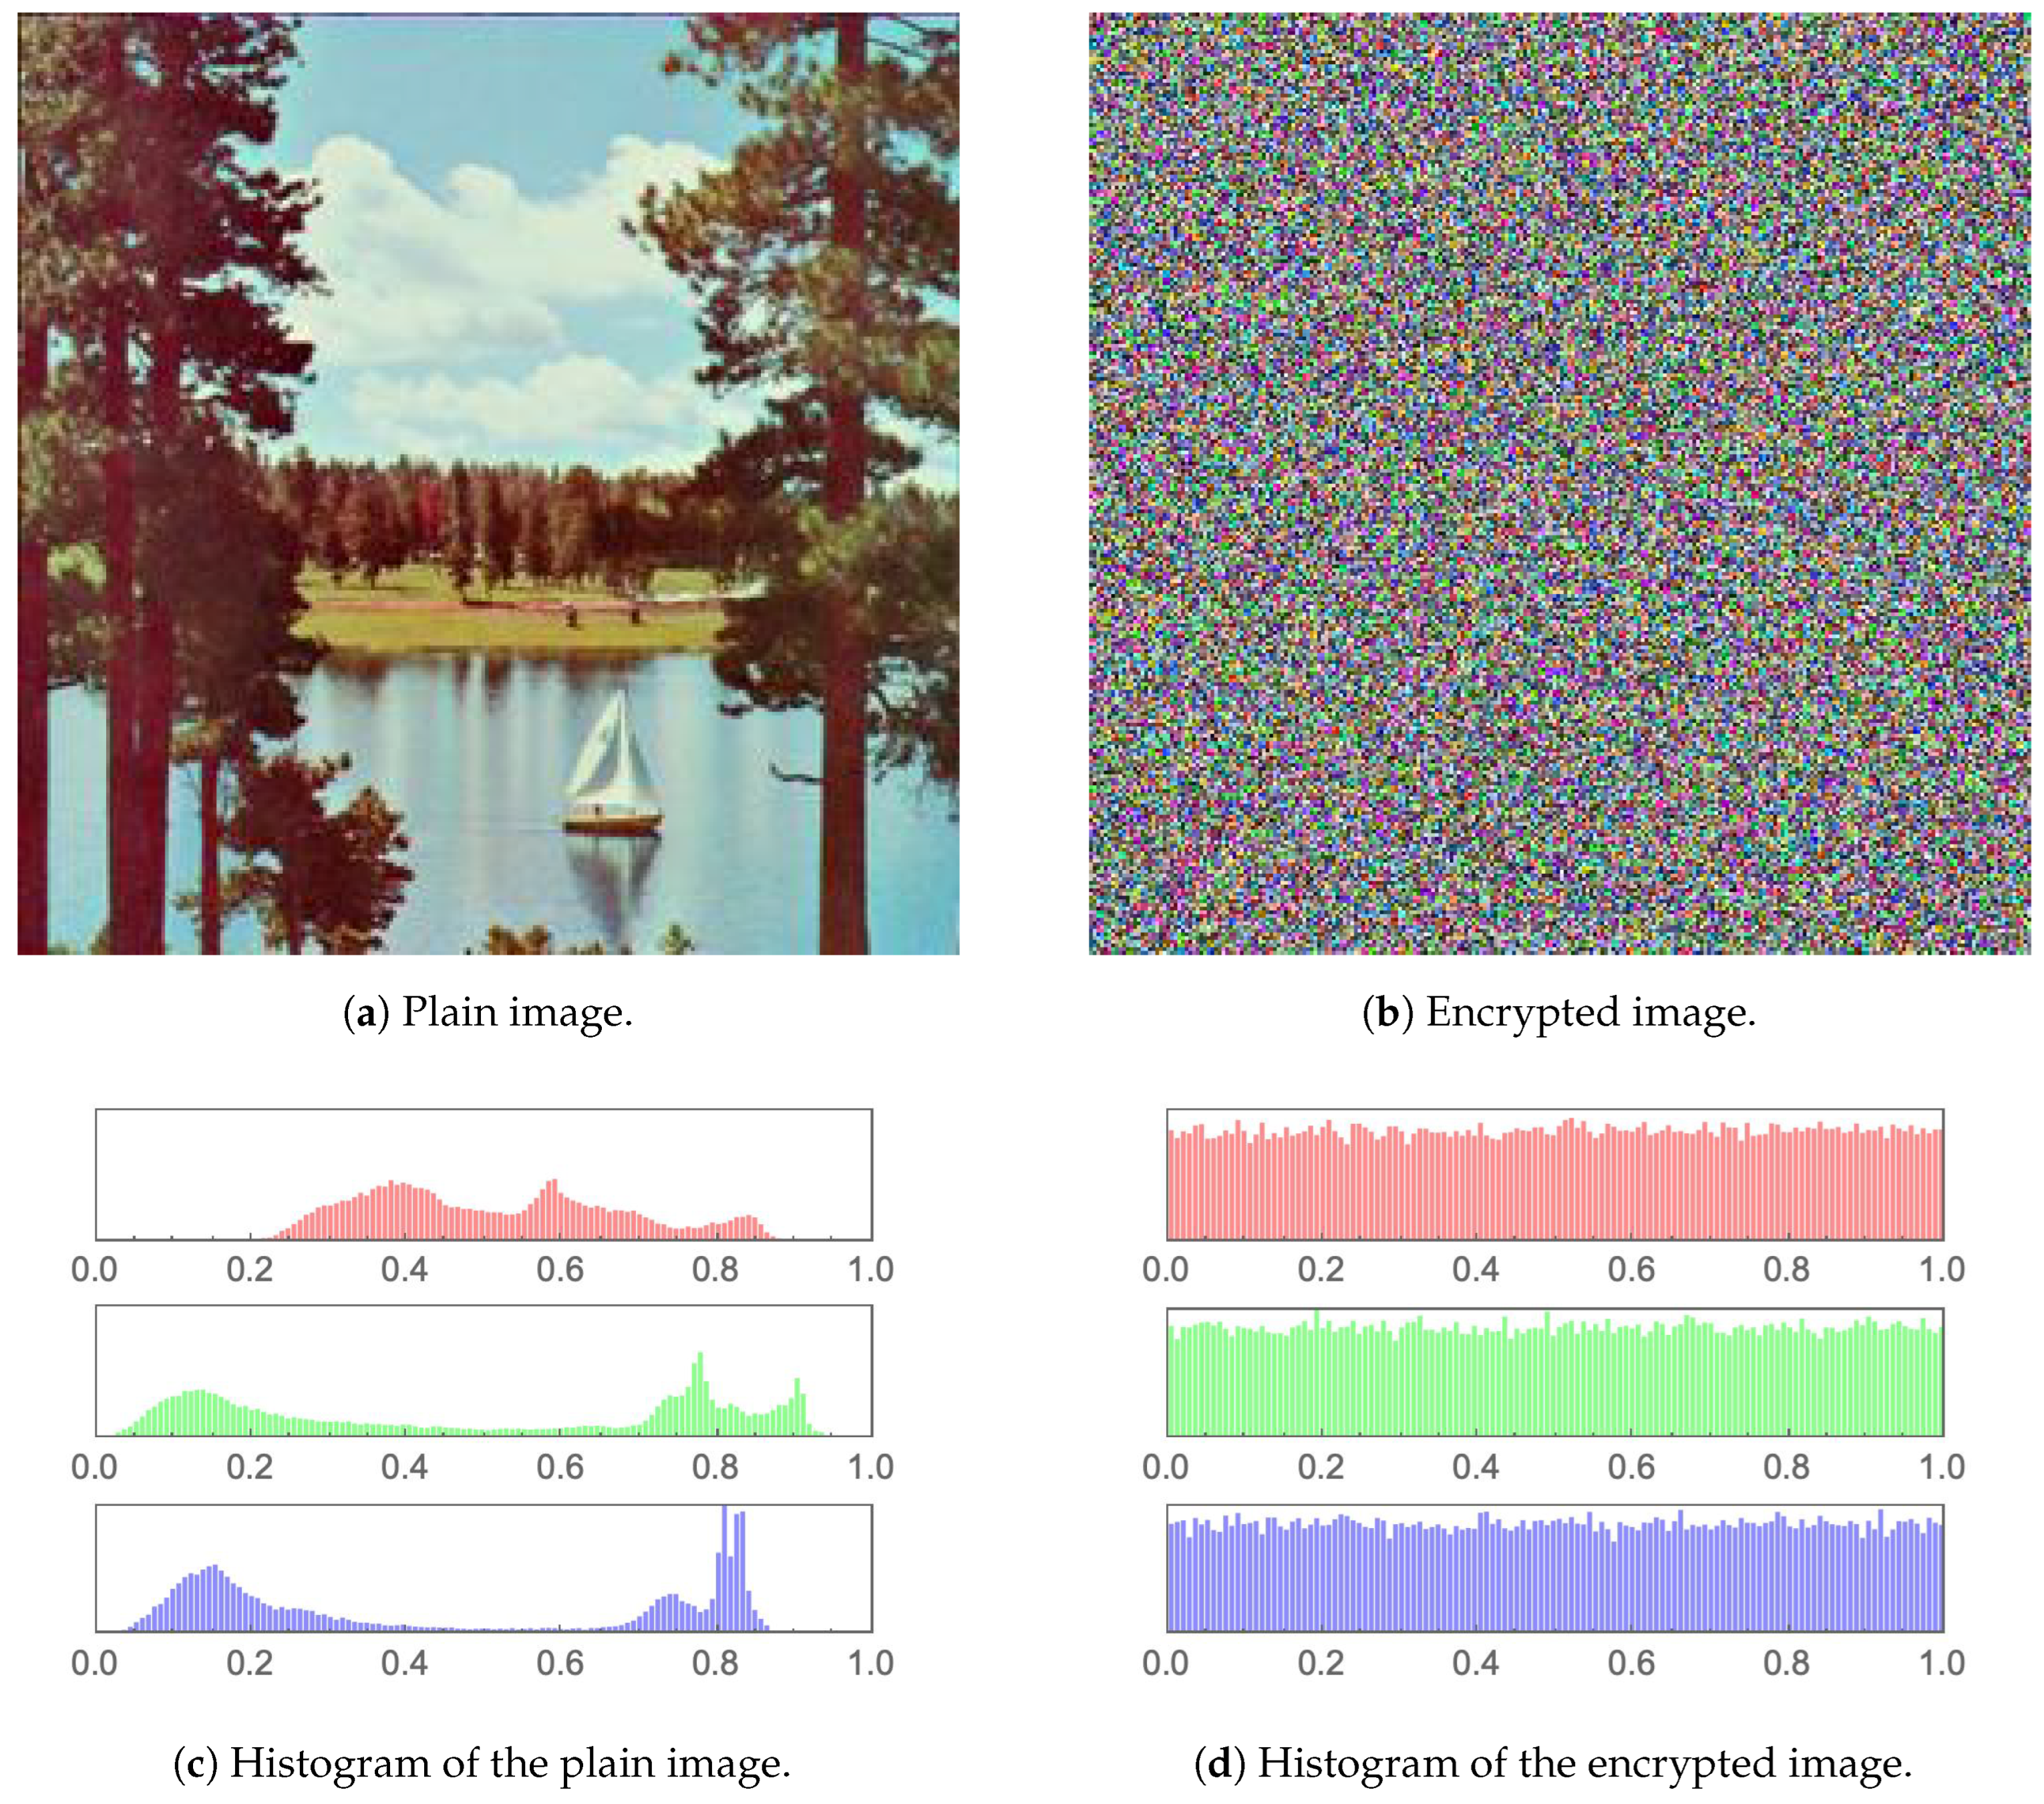
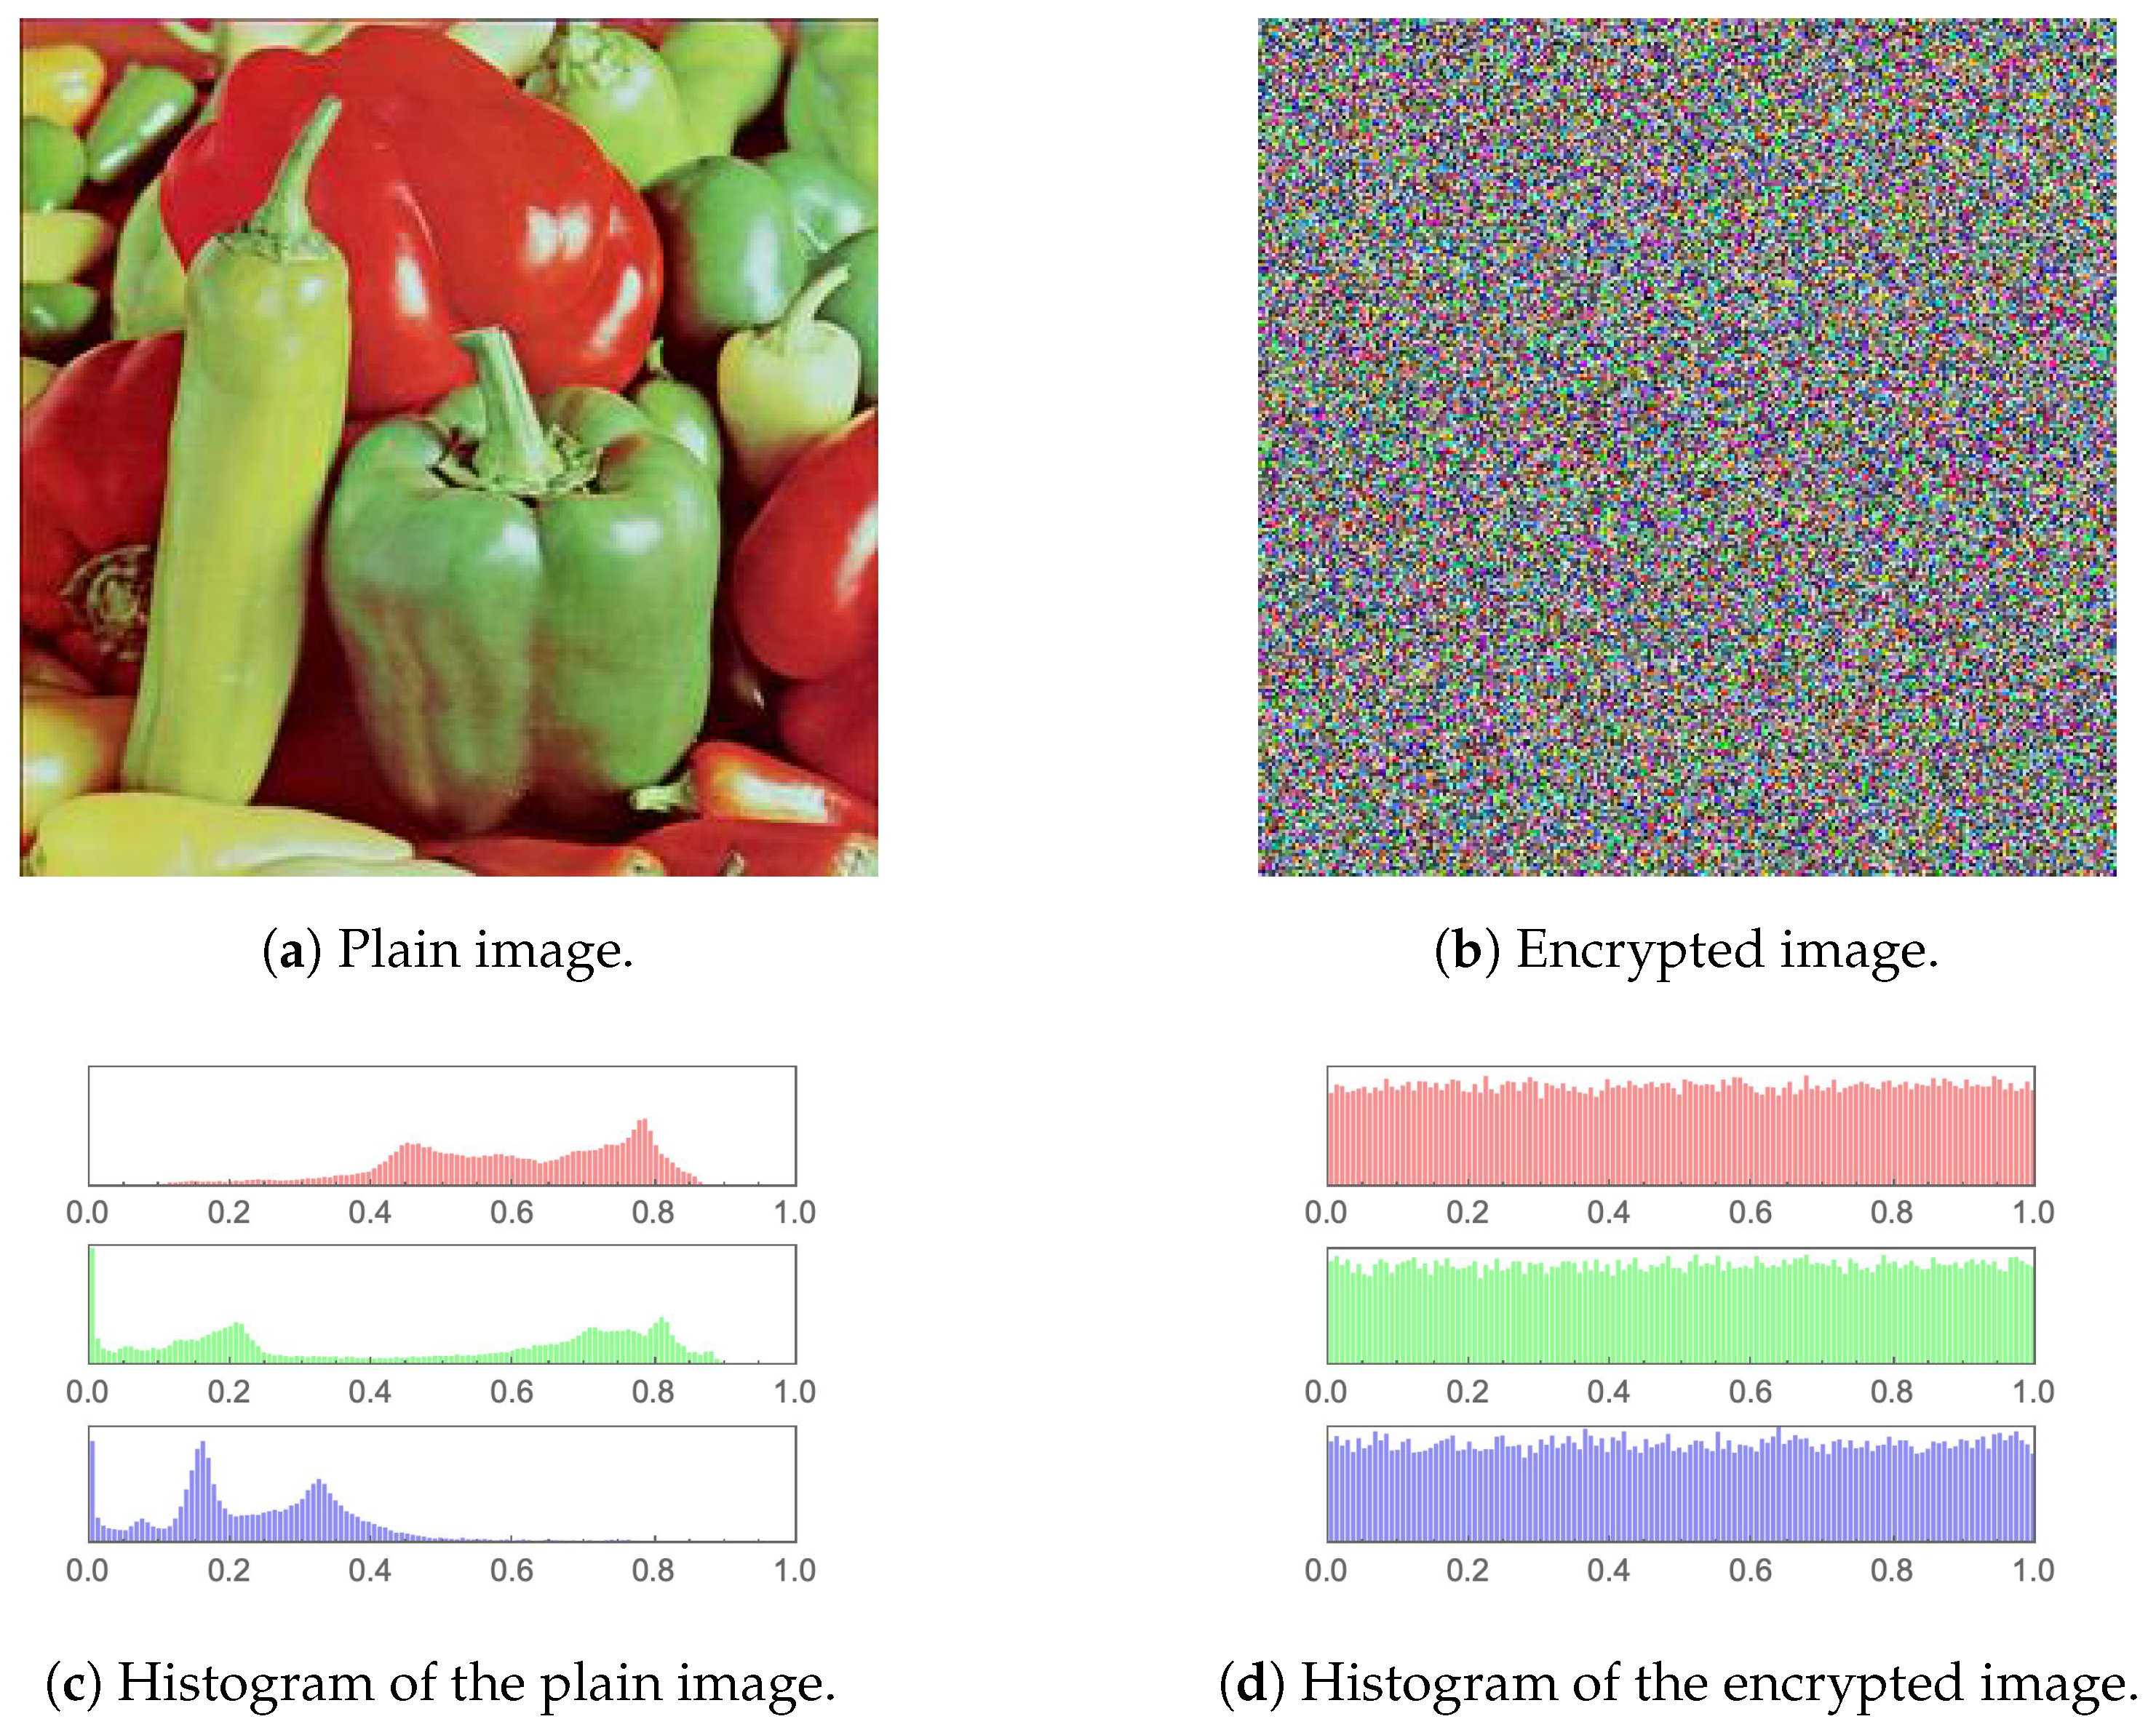
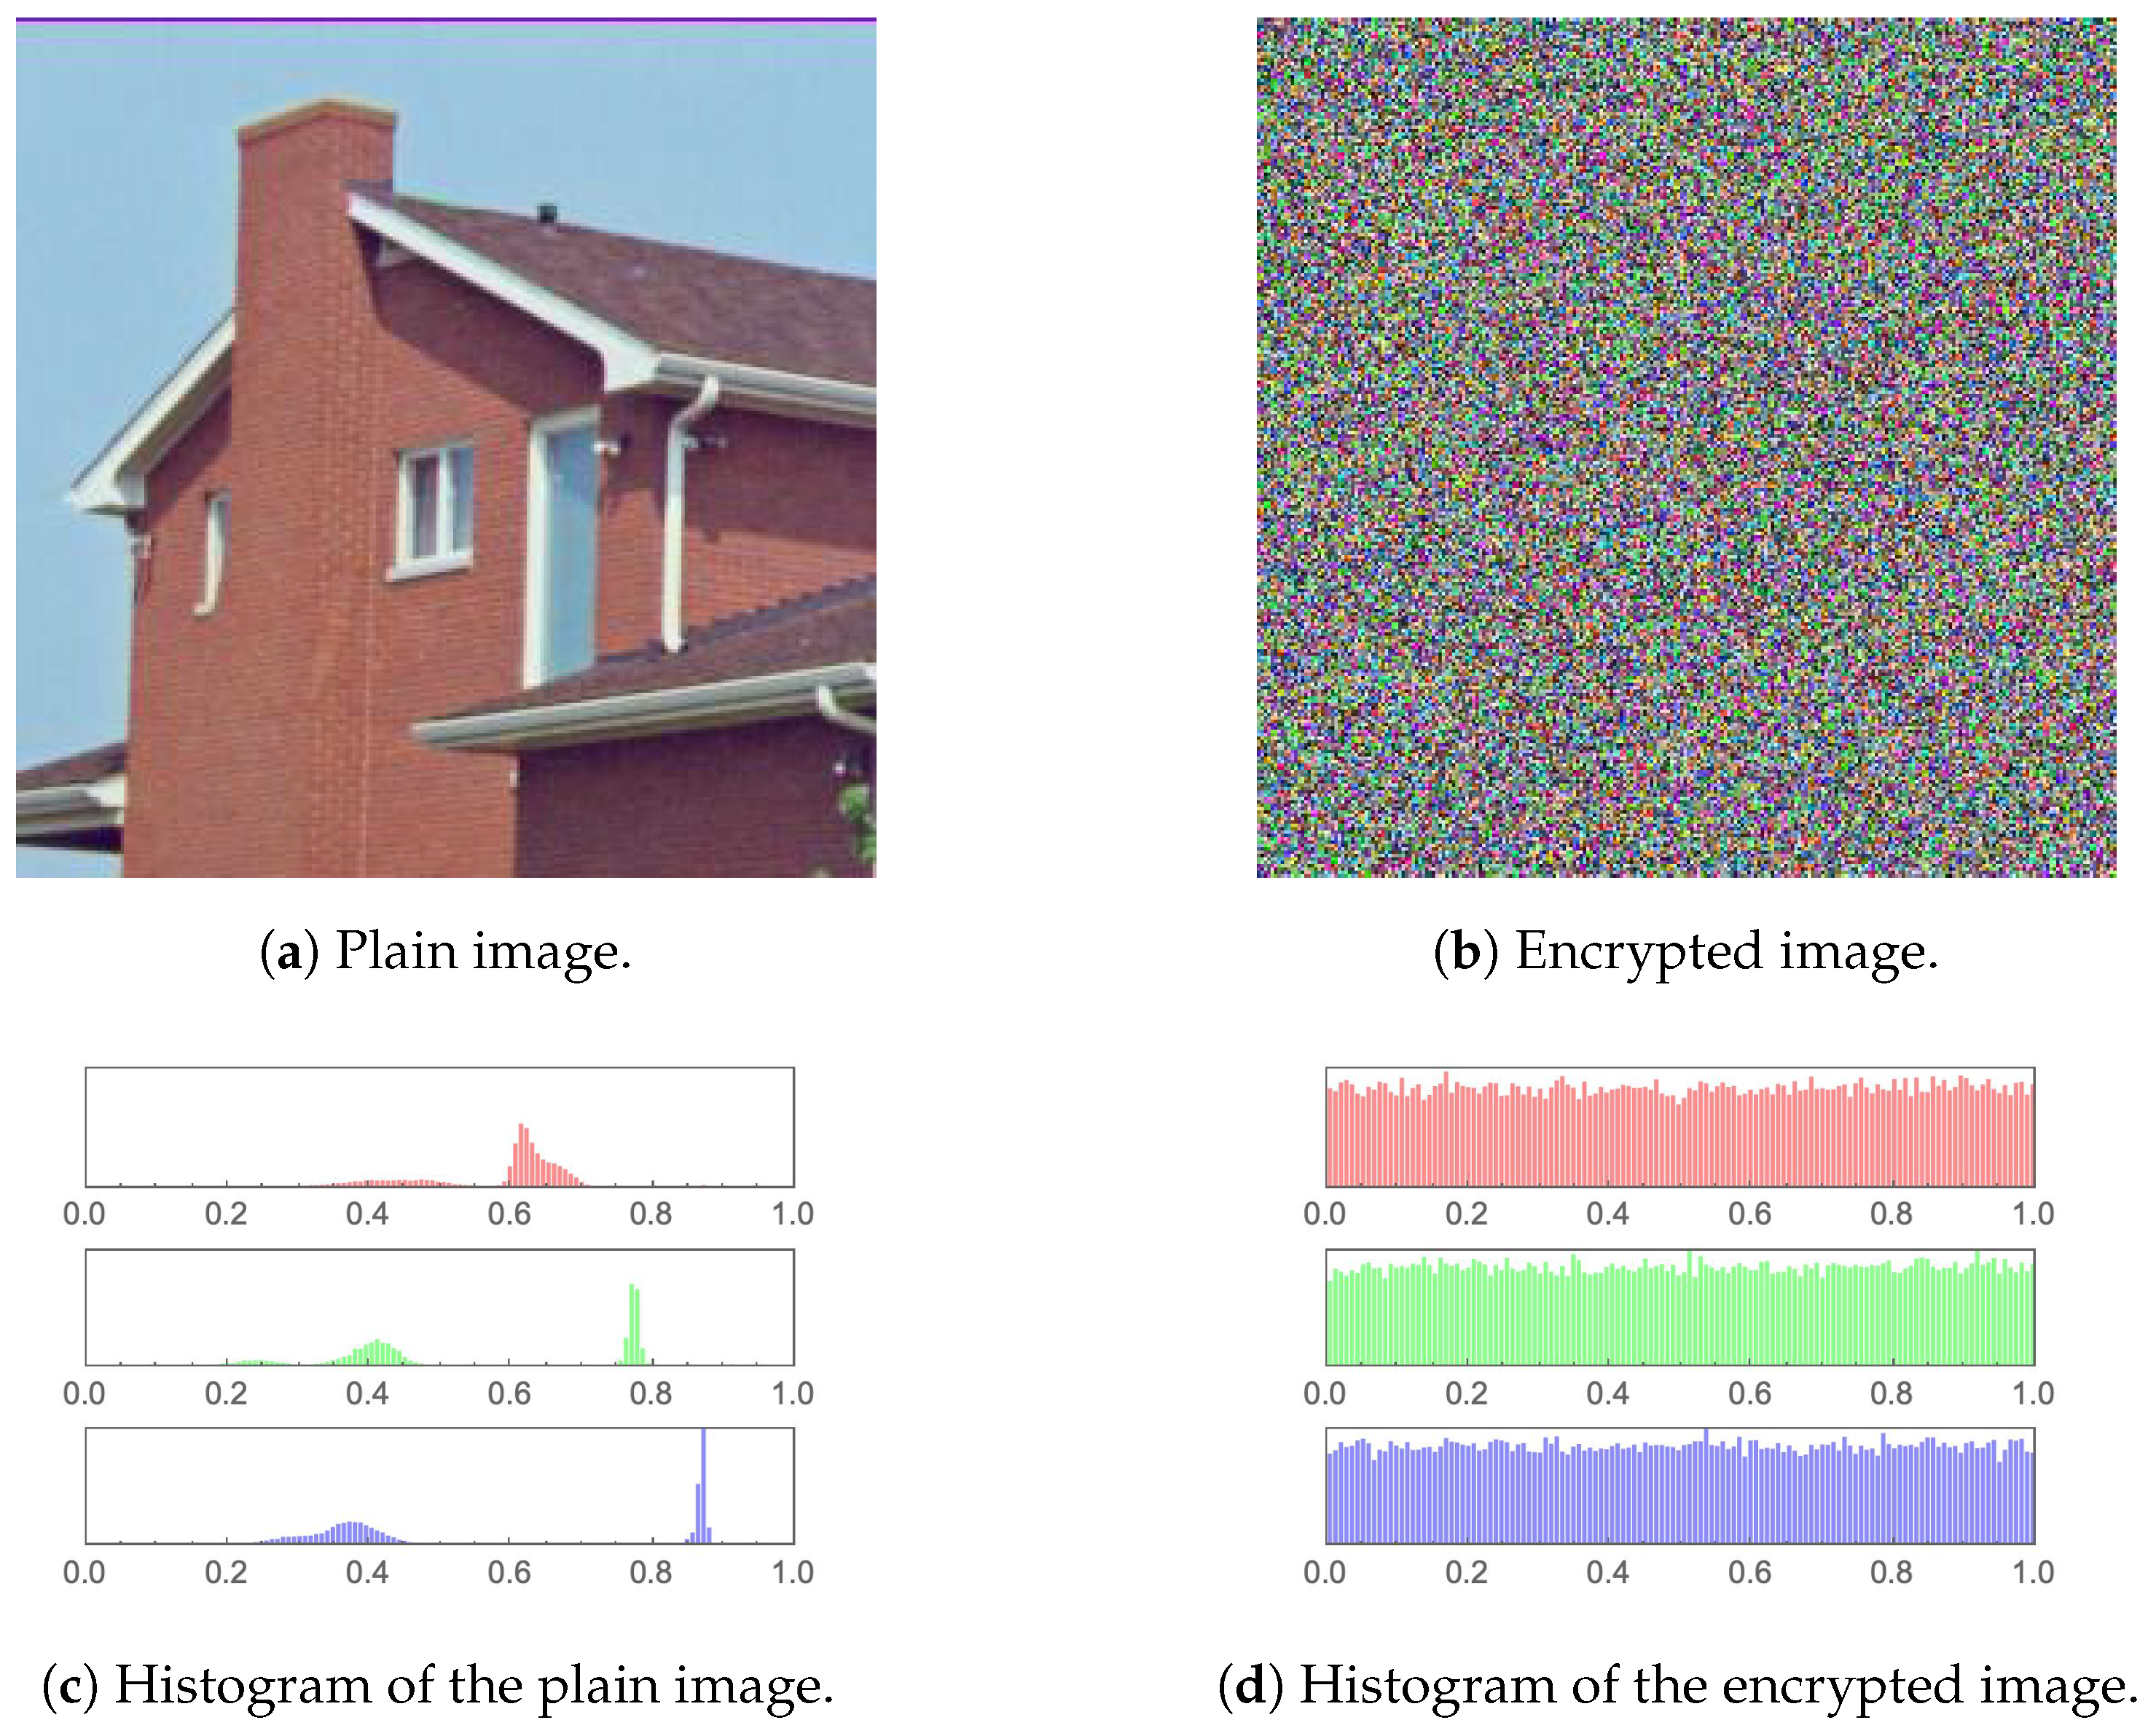
Figure 15 (including sub-figures) showcase a number of plain images and their encrypted versions, as obtained through the application of the proposed image cryptosystem. It is clear that no visual cues can be attained from the encrypted images as to what their plain versions could be. Furthermore, by incorporating a statistical measure, the histograms of the plain images and their encrypted versions, which are provided in the same set of figures, also showcase excellent performance. While the histograms of every plain image clearly depicts unique statistical characteristics, those of encrypted images show an almost uniform distribution, which cannot be traced back to any specific plain image. This signifies the ability of the proposed image cryptosystem to fend off attacks of statistical nature.
4.2. Mean Squared Error
The mean squared error (MSE) between 2 images is a widely used performance evaluation metric for image encryption algorithms. It is a measure of the difference between a plain image and its encrypted version. The purpose of any image cryptosystem is to scramble the image data in such a way that it becomes extremely difficult for an unauthorized third-party to access the original plain image. To evaluate the effectiveness of an image cryptosystem, it is thus necessary to compare the encrypted image with the plain image and measure the difference between them. The MSE is one of the most common methods of achieving this. It is basically a scalar value that measures the average of the squared difference between the pixel values of 2 images. The smaller the MSE value, the more similar the 2 images are. In image encryption, the goal is to encrypt the image in such a way that the encrypted image is as different from the original image as possible, while still being able to decrypt it back to its original form. A high MSE value between a plain image and its encrypted version indicates that the encryption process has been successful. The MSE is calculated as follows: Given 2 images
I and
with the same dimensions
, the MSE is calculated by summing the squared difference between each corresponding pixel in the 2 images, and then dividing by the total number of pixels in the image. Mathematically, it is expressed as:
Table 4 displays the computed MSE values for various images, as well as how these values compare to other image cryptosystems from the literature. It is clear that a comparable performance is attained.
It is typical practice to report MSE and Peak Signal to Noise Ratio (PSNR) values together upon assessing image cryptosystems. This is usually carried out since the computation of PSNR is based on the value of MSE. Nevertheless, the authors of [
61] only provide PSNR values, without reporting MSE values. This is the reason behind
Table 4 showing columns of N/A under the heading of [
61].
4.3. Peak Signal to Noise Ratio
The peak signal-to-noise ratio (PSNR) is based on the MSE discussed in
Section 4.2. It aims to connect the error margin (represented by the MSE) to the peak value of a given signal. In this research work, the peak signal value is determined as the highest pixel intensity in an image
. Therefore, for a given image
I, the PSNR is mathematically expressed as:
As shown in (
20), the PSNR is inversely proportional to the MSE, thus, achieving a minimal value is ideal.
Table 5 displays the computed PSNR values for the proposed image cryptosystem, as well as those reported in the literature by counterpart algorithms. It is clear that the achieved PSNR values are comparable to the state-of-the-art.
4.4. Mean Absolute Error
The mean absolute error (MAE) between a plain image and its encrypted version refers to the average difference between the intensity values of corresponding pixels in the 2 images. It represents the average magnitude of the differences between the original and encrypted pixels, and is a measure of the quality of the encryption process in terms of preserving the visual information of the original image. The higher the MAE, the further different the encrypted image is to the original plain image in terms of pixel intensity values, and the better the image cryptosystem is at distorting the original plain image information. It is represented mathematically as:
where
I and
are 2 images.
Table 6 displays the computed MAE values for the proposed image cryptosystem in comparison to counterpart algorithms from the literature. It is clear that the achieved MAE values are comparable to the state-of-the-art.
4.5. Information Entropy
In the realm of grayscale images, Shannon’s information entropy is used to quantify the randomness of an image’s gray pixel value distribution. According to Shannon’s theory, the formula for calculating information entropy is:
where
is the probability of occurrence of symbol
m while
M is the total number of bits for each symbol. In relation to images, as a grayscale image has 256 distinct values
and
potential permutations, the entropy value of an encrypted image approaches a maximum of 8. Consequently, information entropy can be used to measure the unpredictability of encrypted images. In
Table 7, the entropy values computed for the proposed image cryptosystem, as well as counterpart algorithms from the literature, are displayed. It is clear that the entropy values computed for the various images are extremely close to the ideal value of 8, indicating that the proposed image cryptosystem is resistant to entropy attacks. Moreover, the disparities in the information entropy values for the state-of-the-art are demonstrated to be insignificant.
4.6. Fourier Transformation Analysis
The Discrete Fourier Transform (DFT) is a mathematical technique that transforms a discrete signal into its equivalent frequency representation. In the context of image encryption, DFT can be used as a tool for analyzing the frequency content of an image. In order to transform an image from the spatial domain to the frequency domain, the following expression mathematically describes the application of DFT:
such that
is the spatial domain representation of the image, where the exponential term is the basis function corresponding to each point
in the Fourier space. When applied to a plain image, the DFT separates the image into its constituent frequencies, which can be visualized as peaks in the frequency spectrum. This representation is useful for analyzing the image structure, as certain patterns and features can be identified by the presence of specific frequencies. On the other hand, when applied to an encrypted image, the result is a transformed representation of the encrypted data. However, this transformed representation typically does not provide any useful information about the original image. The encrypted data has been altered in a way that makes it difficult to extract any meaningful information, even after transforming it. The aim of any image cryptosystem is to render an image content unintelligible, and DFT can help confirm this by showing that the transformed representation of the encrypted image is not representative of the original data. Subfigures (b) and (e) of
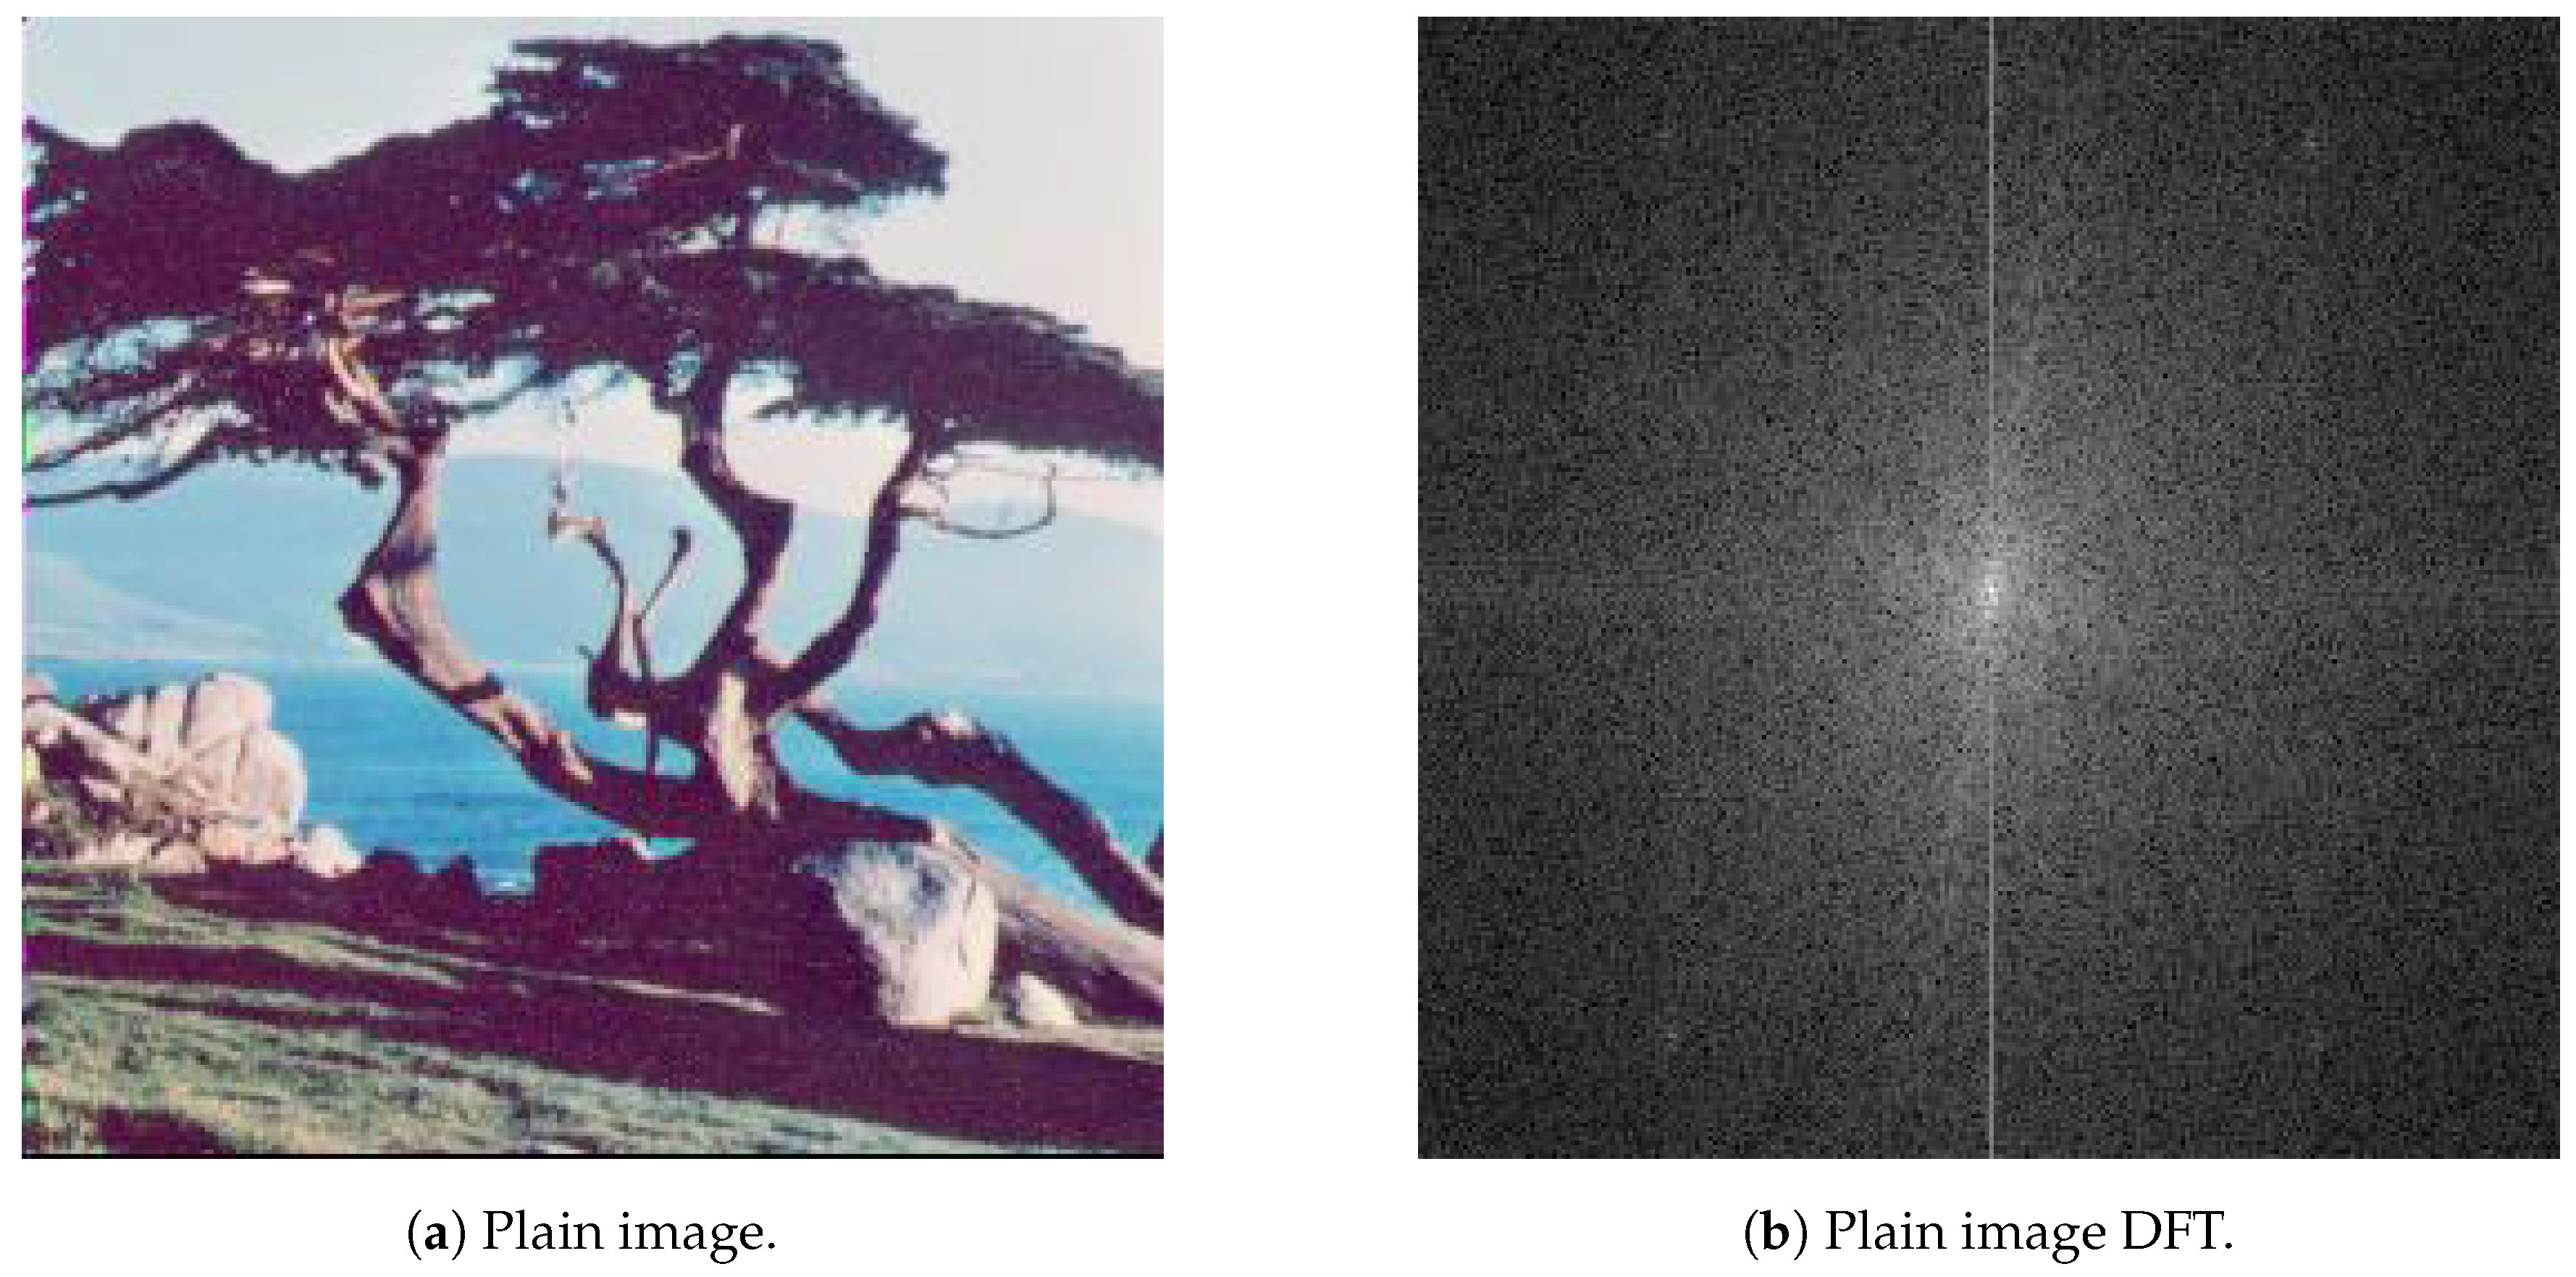
Figure 15 display the DFT as applied to the plain Tree image and its encrypted version, respectively. Unlike the various special features, such as edges and corners which result in the plus-sign-shape of the DFT of the plain image, the DFT of its encrypted version is distorted and lacks any such features.
4.7. Correlation Coefficient Analysis
This assessment approach evaluates the consistency of a single image. The objective of such an evaluation metric is to assess the cohesiveness of pixels in close proximity. This means that the aim here is to calculate the proportion of uniform regions relative to edge transitions. As a result, a rather high correlation coefficient (i.e. co-occurrence) value is anticipated in the case of plain images, which consist of more regions than edges (in terms of pixel count). Alternatively, as substantial distortion is desired in encrypted images, a lower correlation coefficient is anticipated. The following set of equations mathematically describe how the pixel cross-correlation coefficient
is computed:
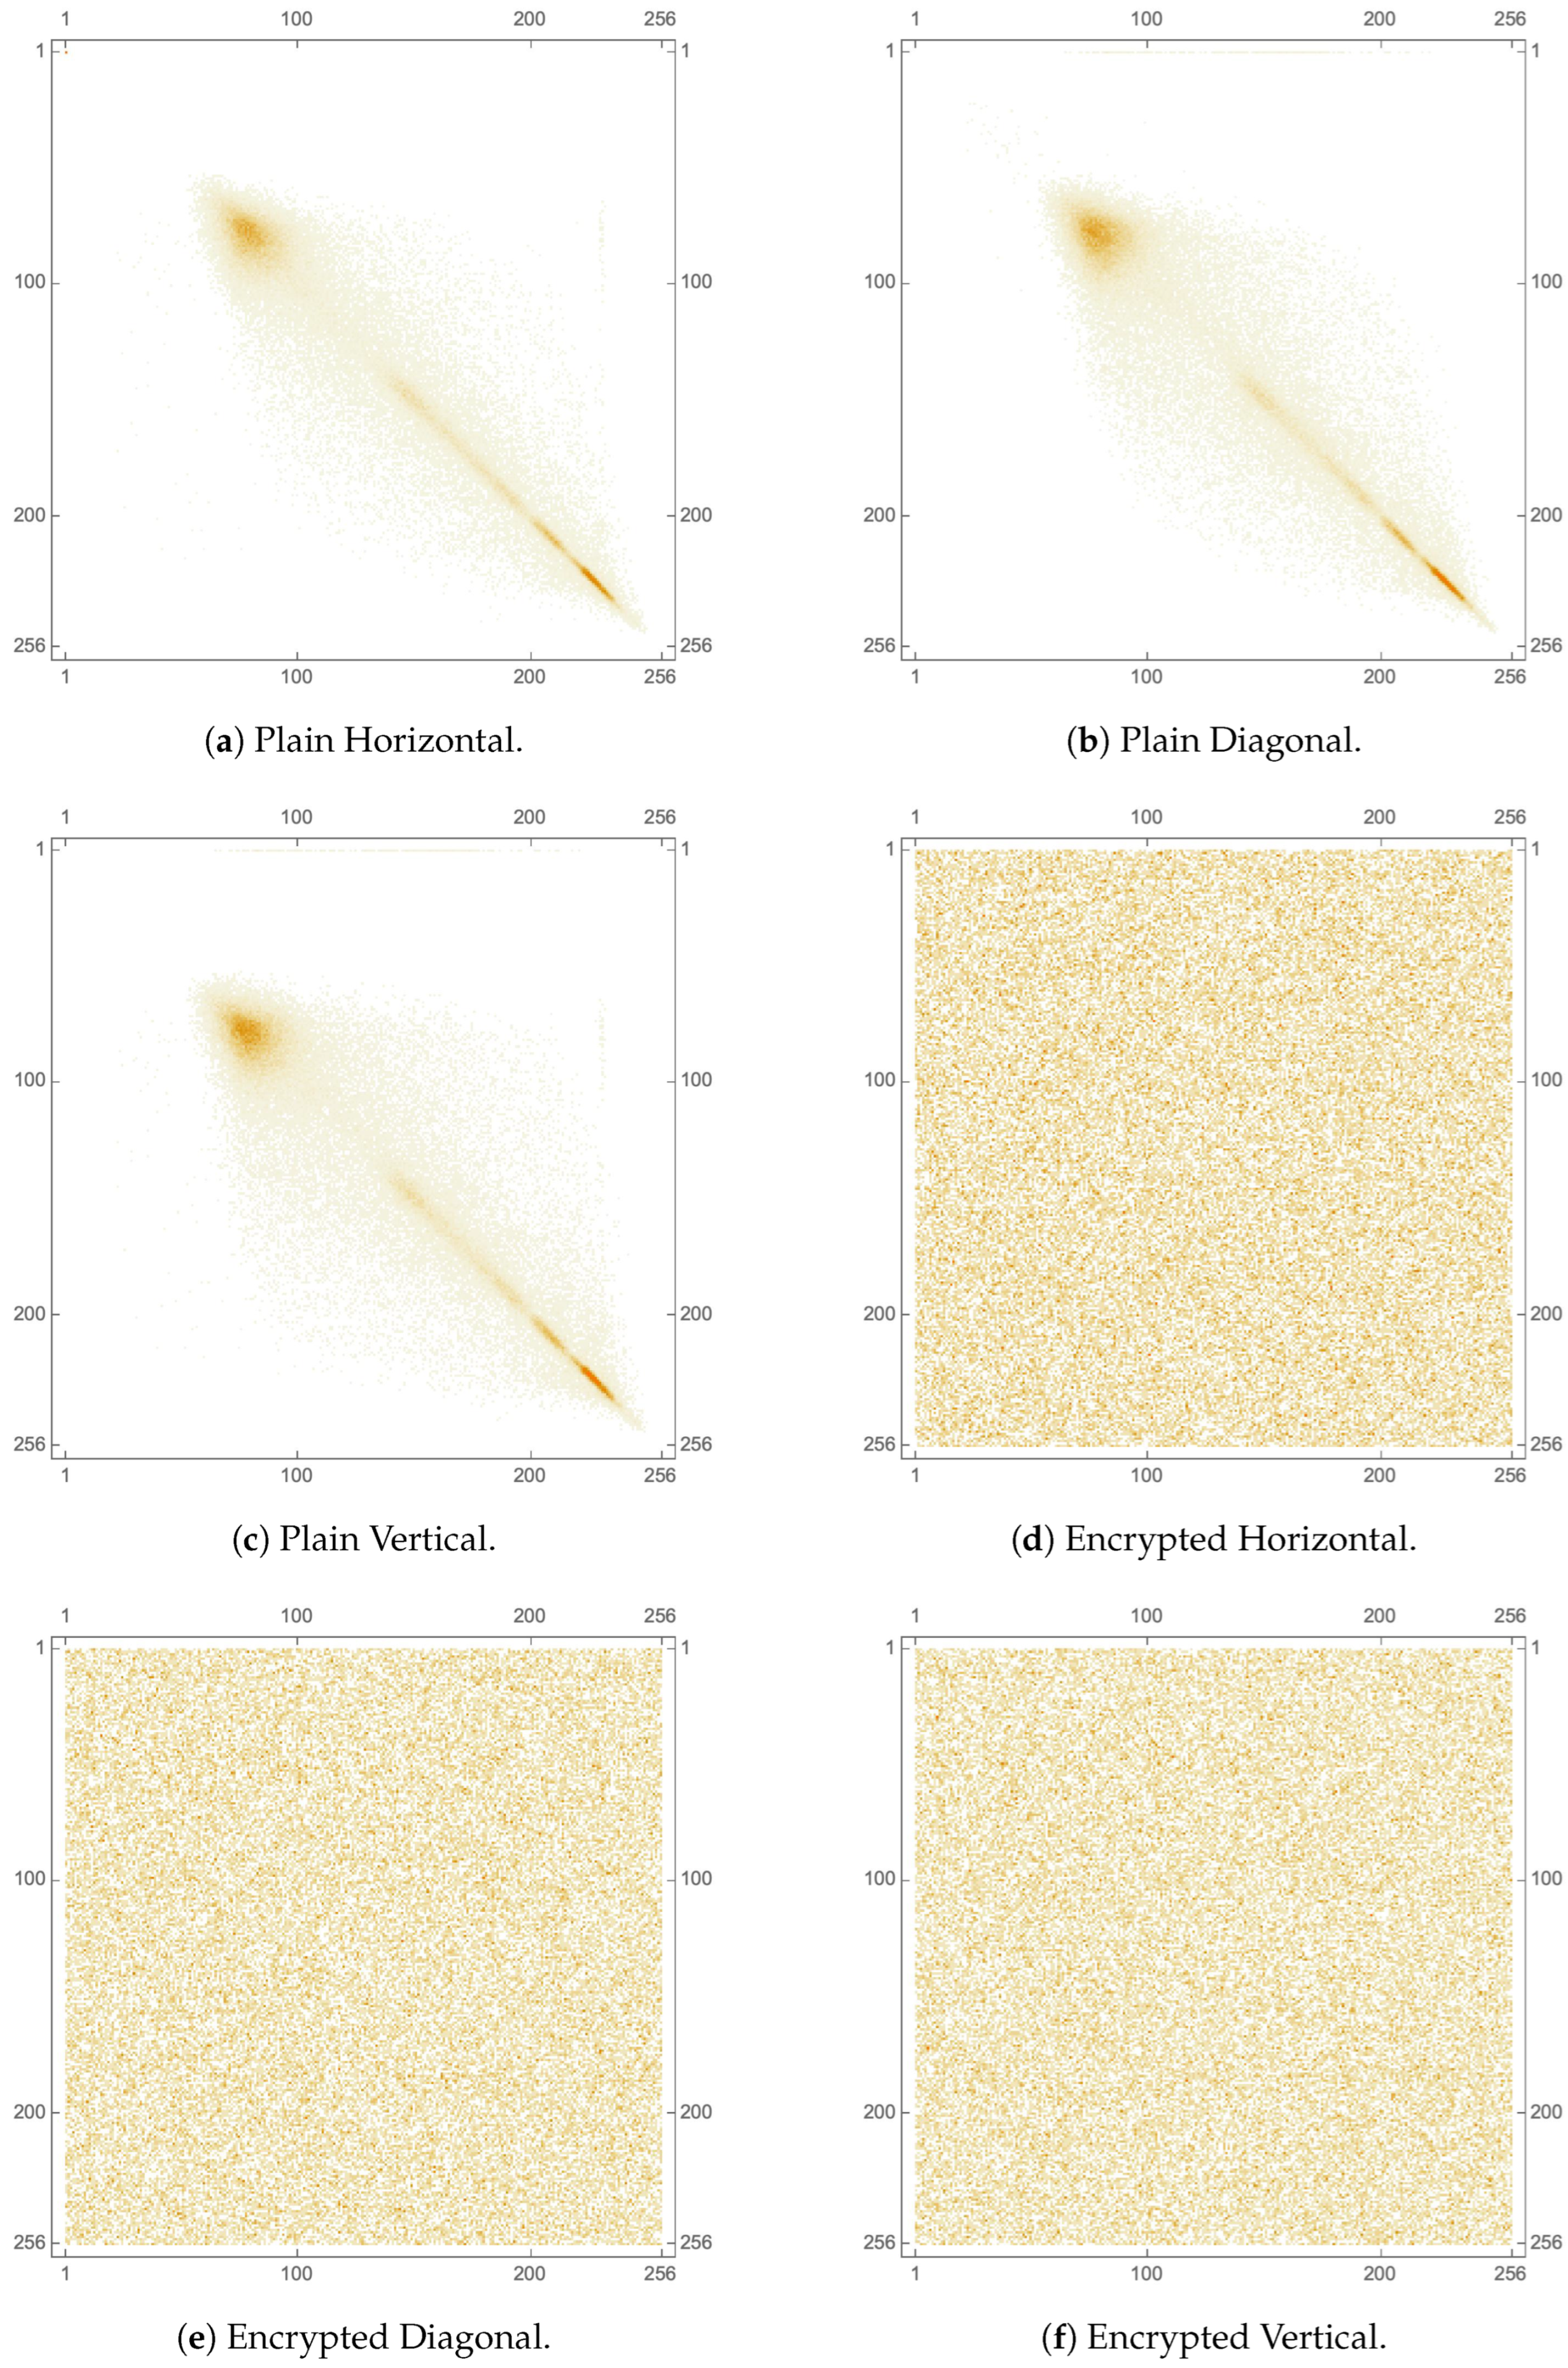
Classically, this metric is computed for 3 directions: horizontal, vertical and diagonal, where an image with a strong pixel cross-correlation would typically yield a value close to 1. On the other hand, for a well-encrypted image, its pixel cross-correlation would typically yield a value close to 0. Such values are well-exemplified in
Table 8, where pixel correlation coefficients are computed and displayed for various plain images and their encrypted versions, each in 3 directions. Moreover,
Table 9 and
Table 10 provide numerical comparisons of pixel correlation coefficients with counterpart algorithms from the literature of the Lena image, both in RGB format and for each of the separate color channels.
In addition to the numerical analysis offered by computing (
24)–(
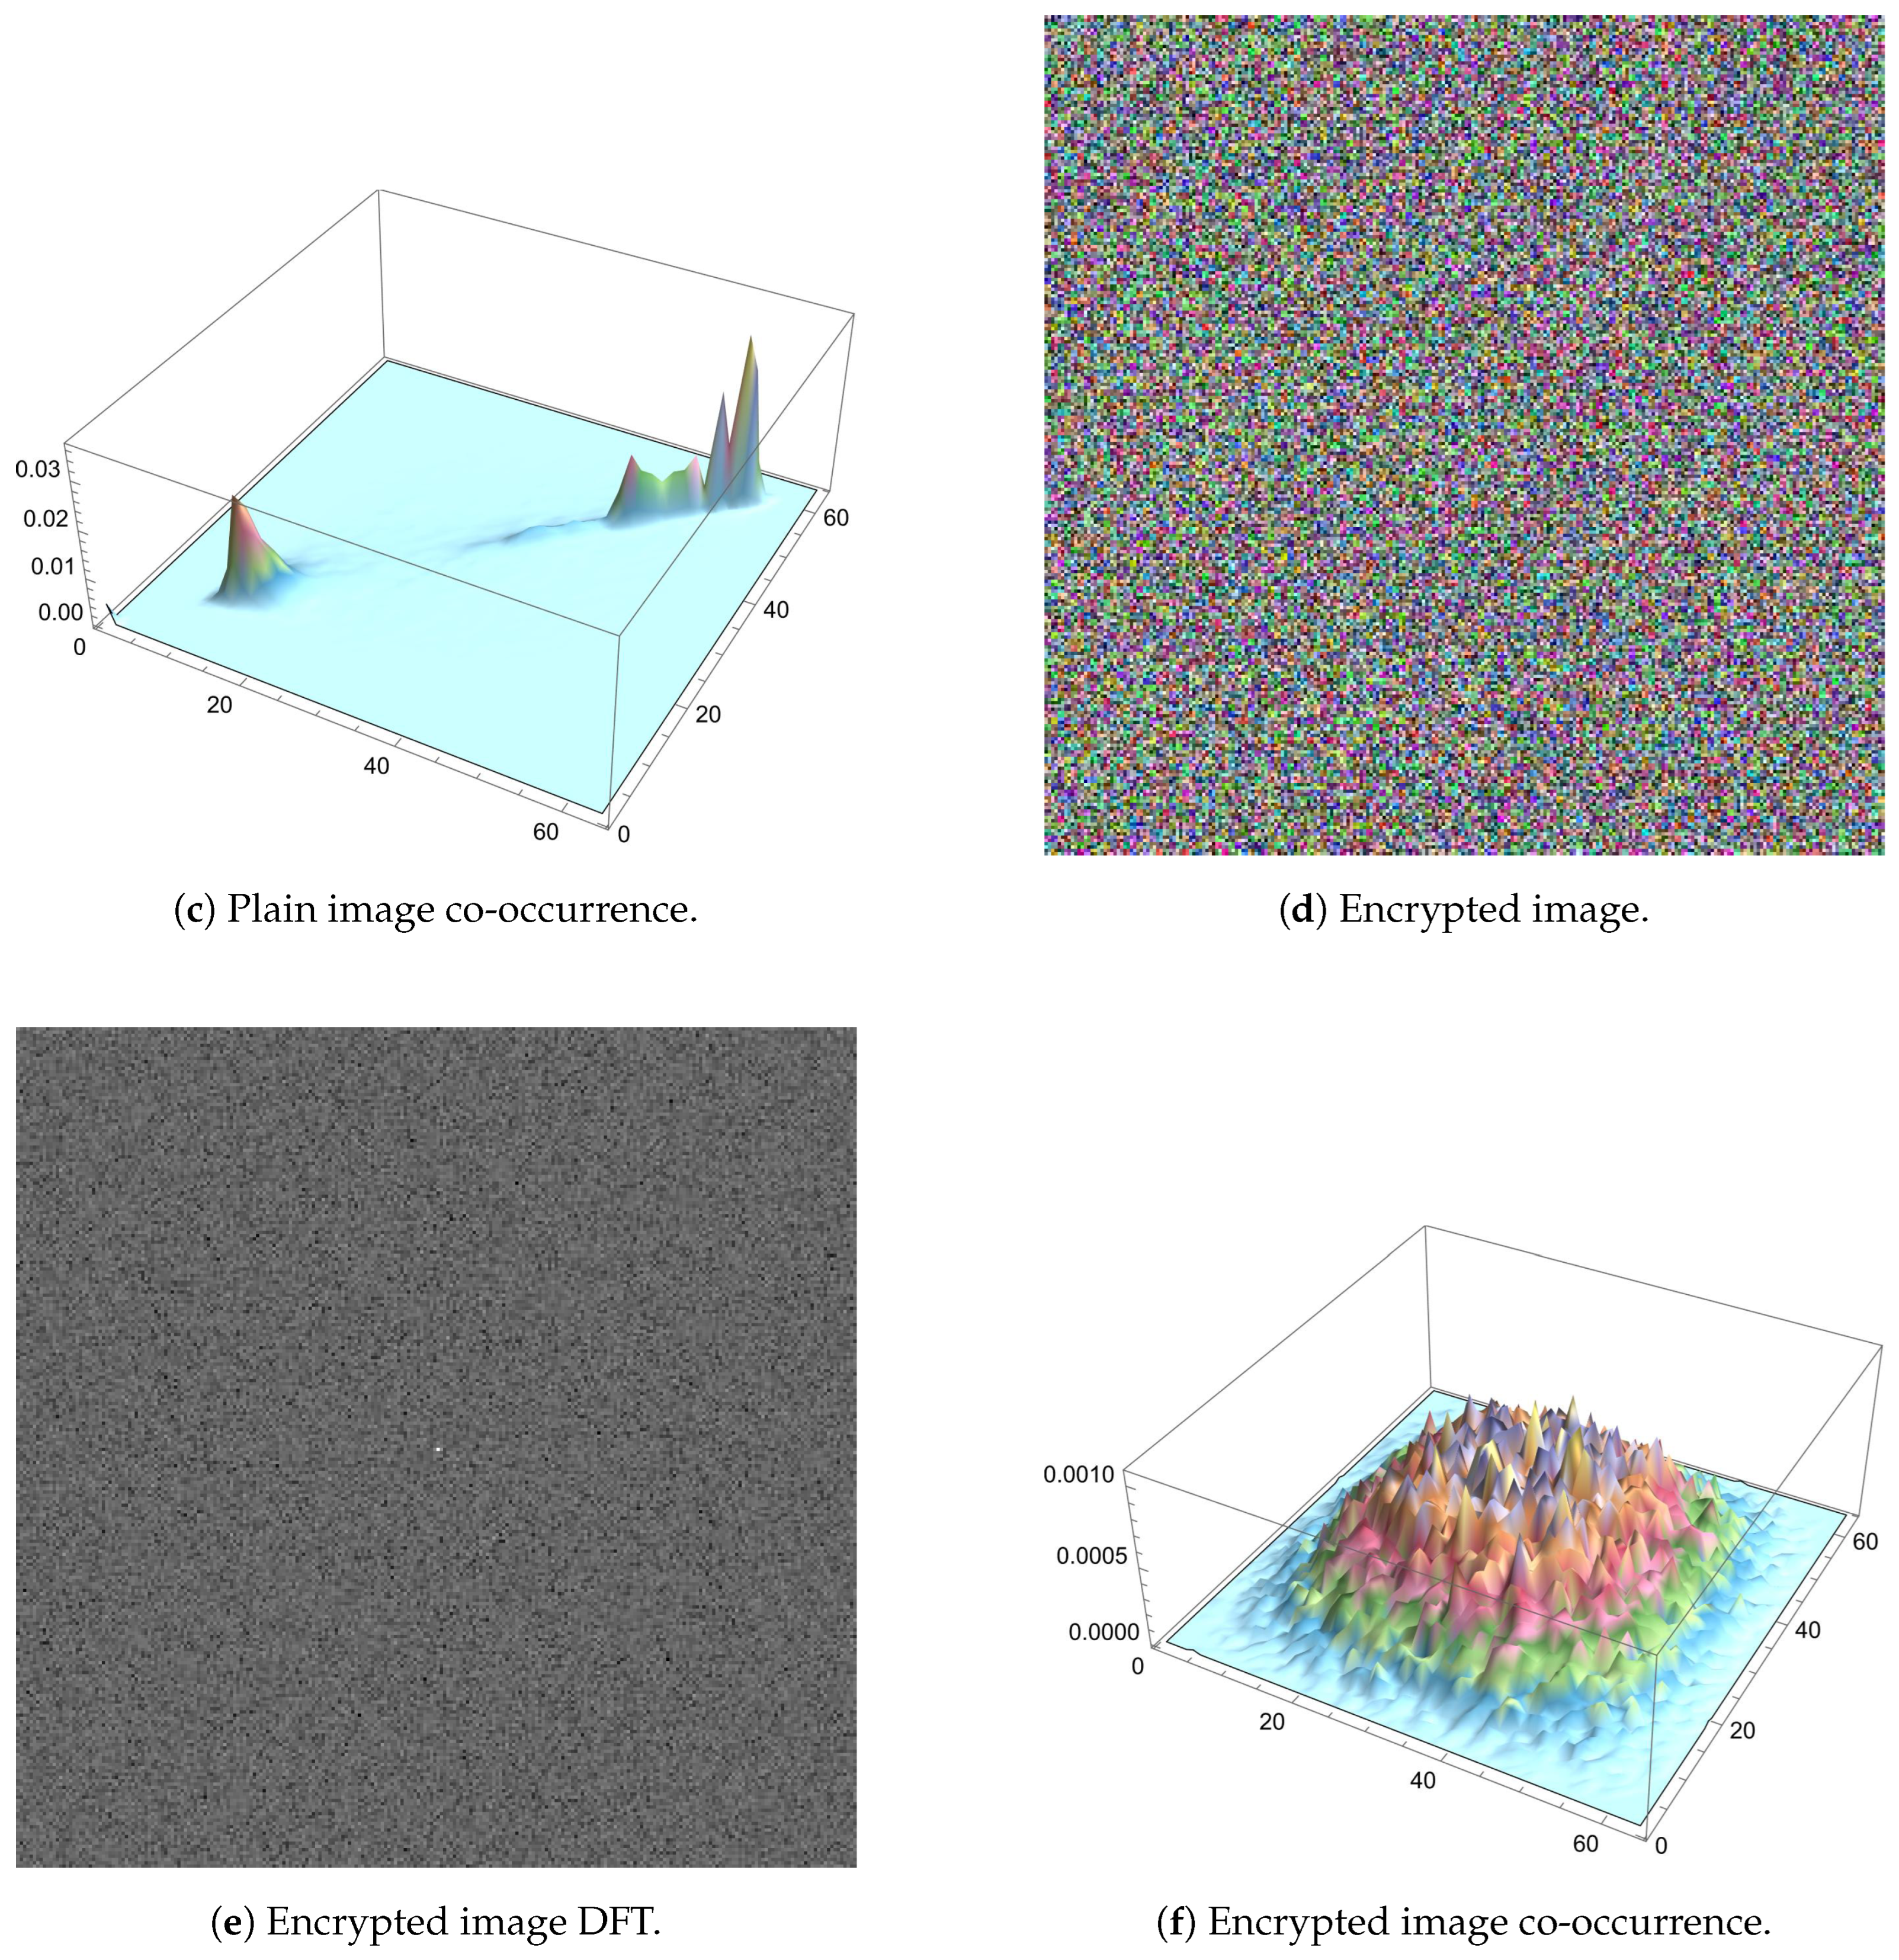
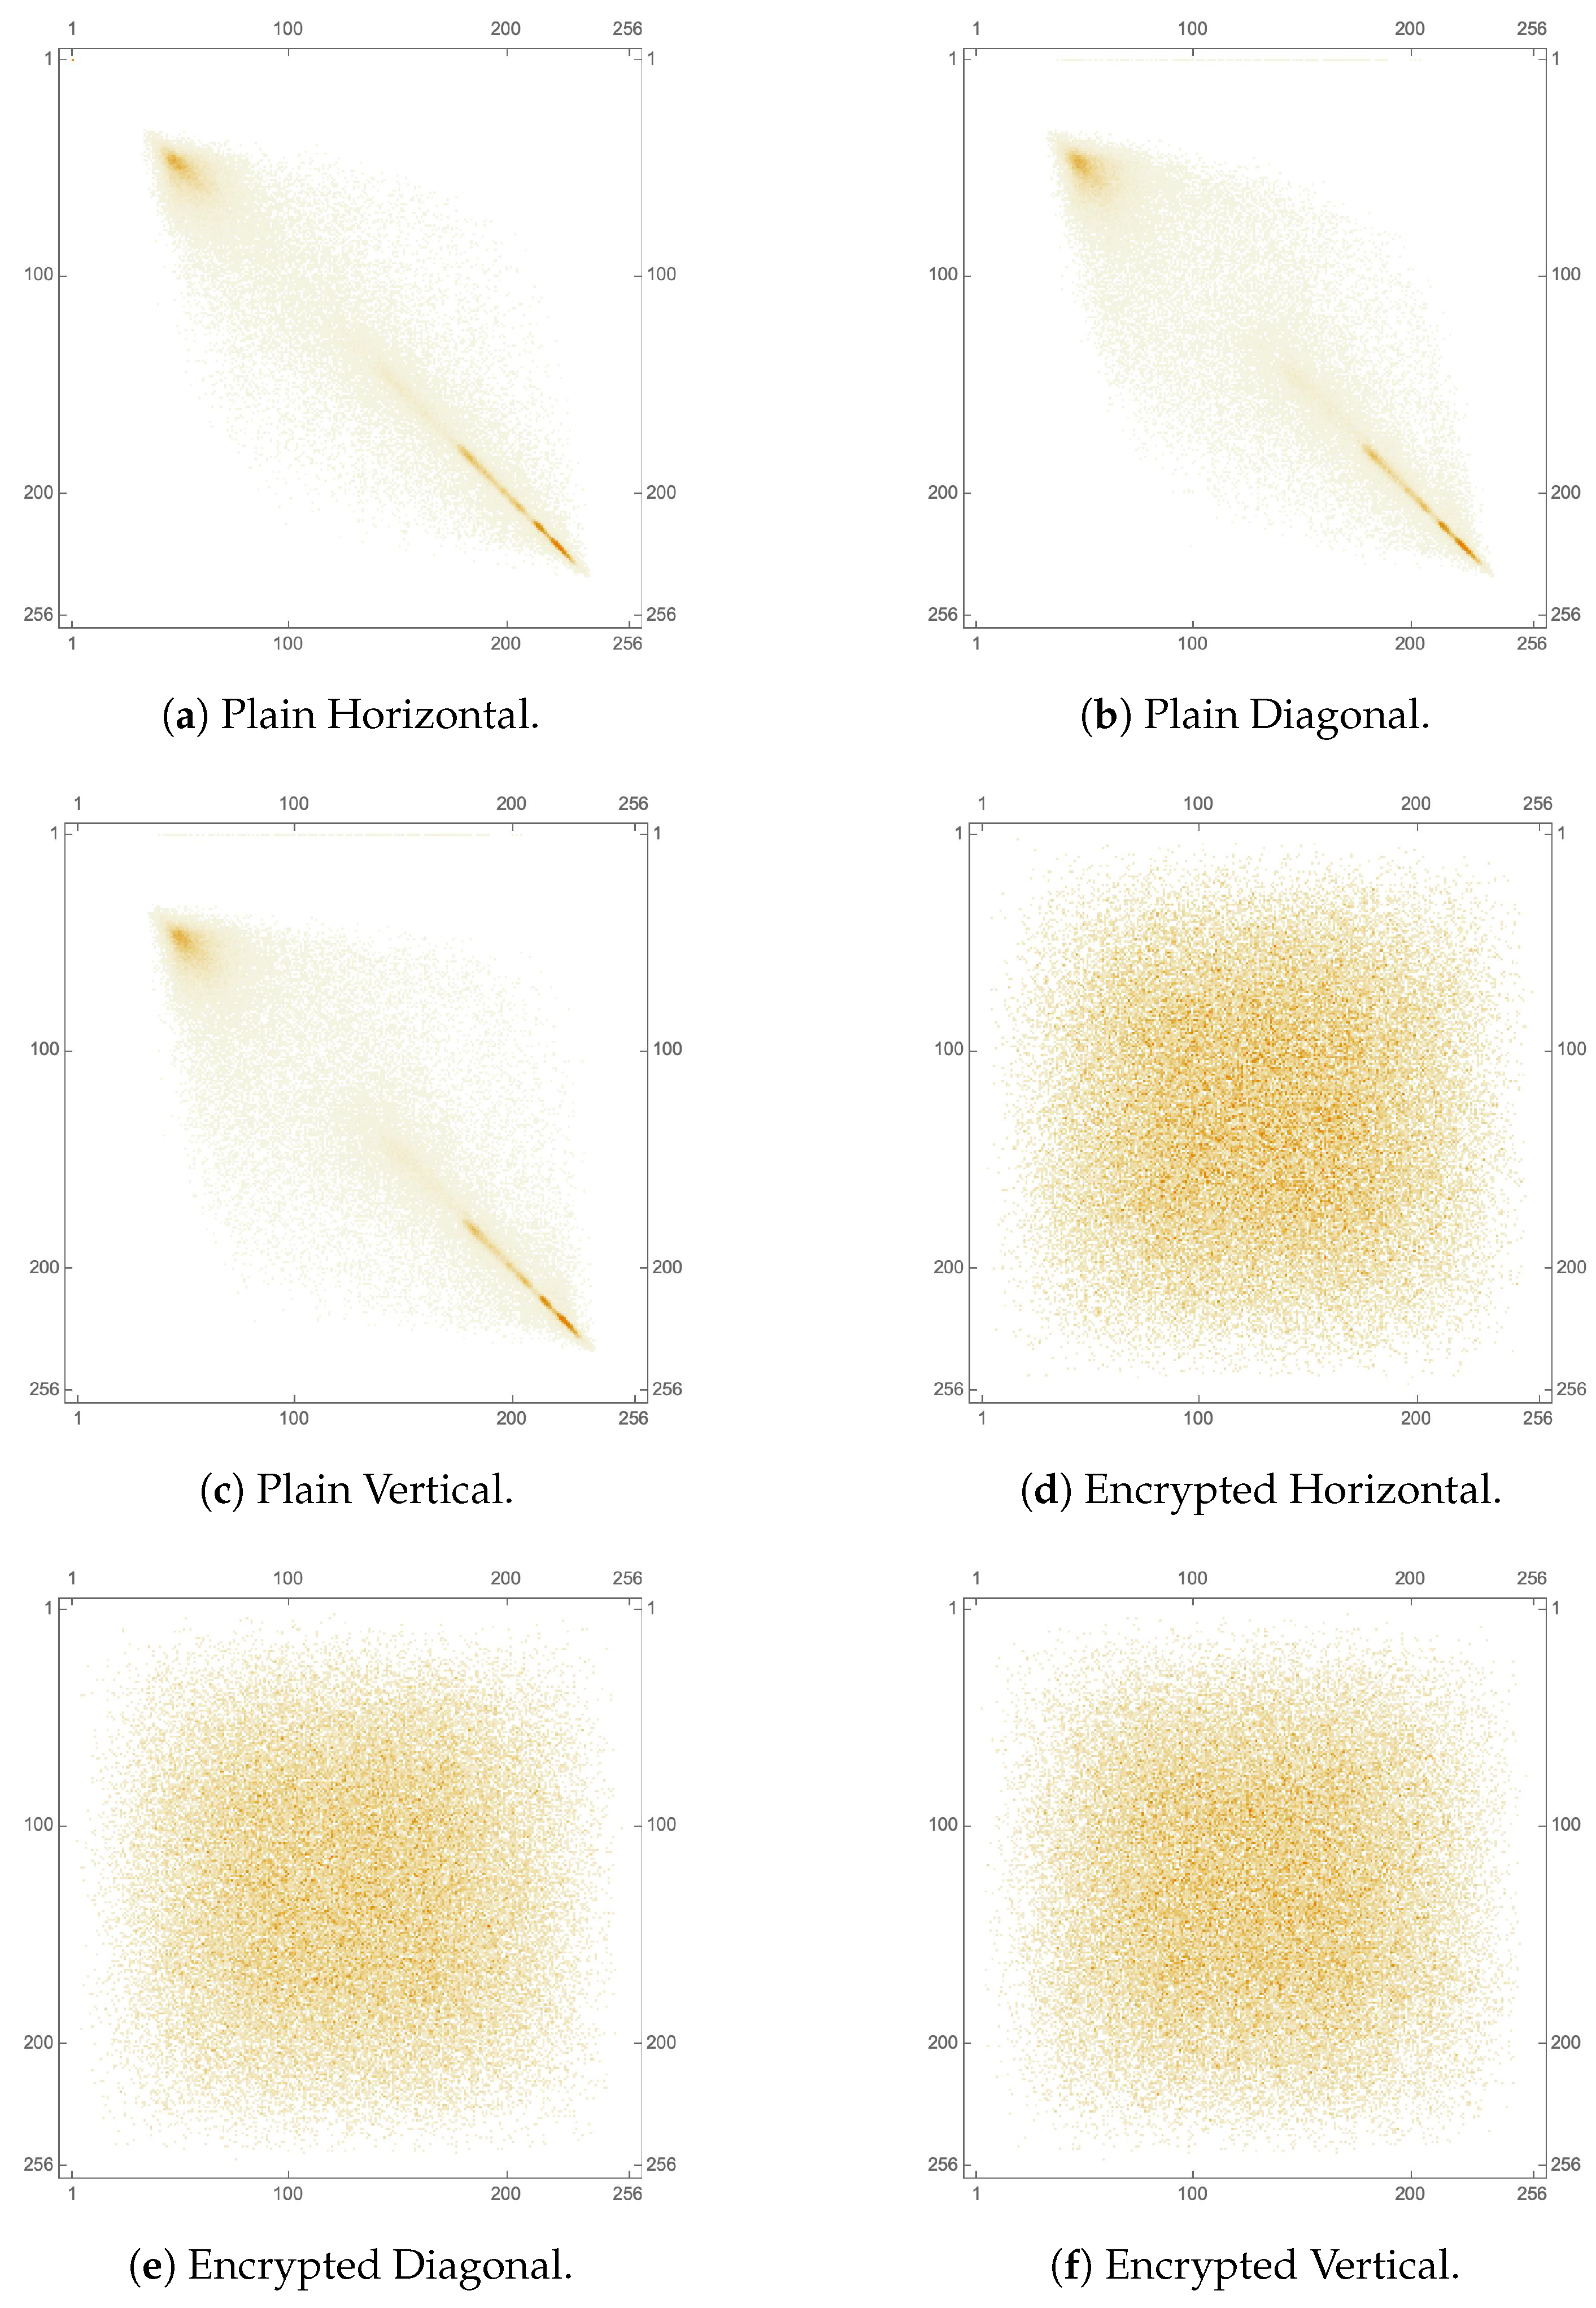
27), the co-occurrence matrix can be shown to visualize directional covariance. In the case of images with natural visual characteristics (more pixels indicating homogeneous regions than transitional borders), values of high similarity tend to coexist with a higher probability, leading to a predominantly linear distribution of magnitudes within the matrix. With contrast, in a heavily deformed (encrypted) image, a more uniform distribution of values is anticipated. To visually illustrate this,
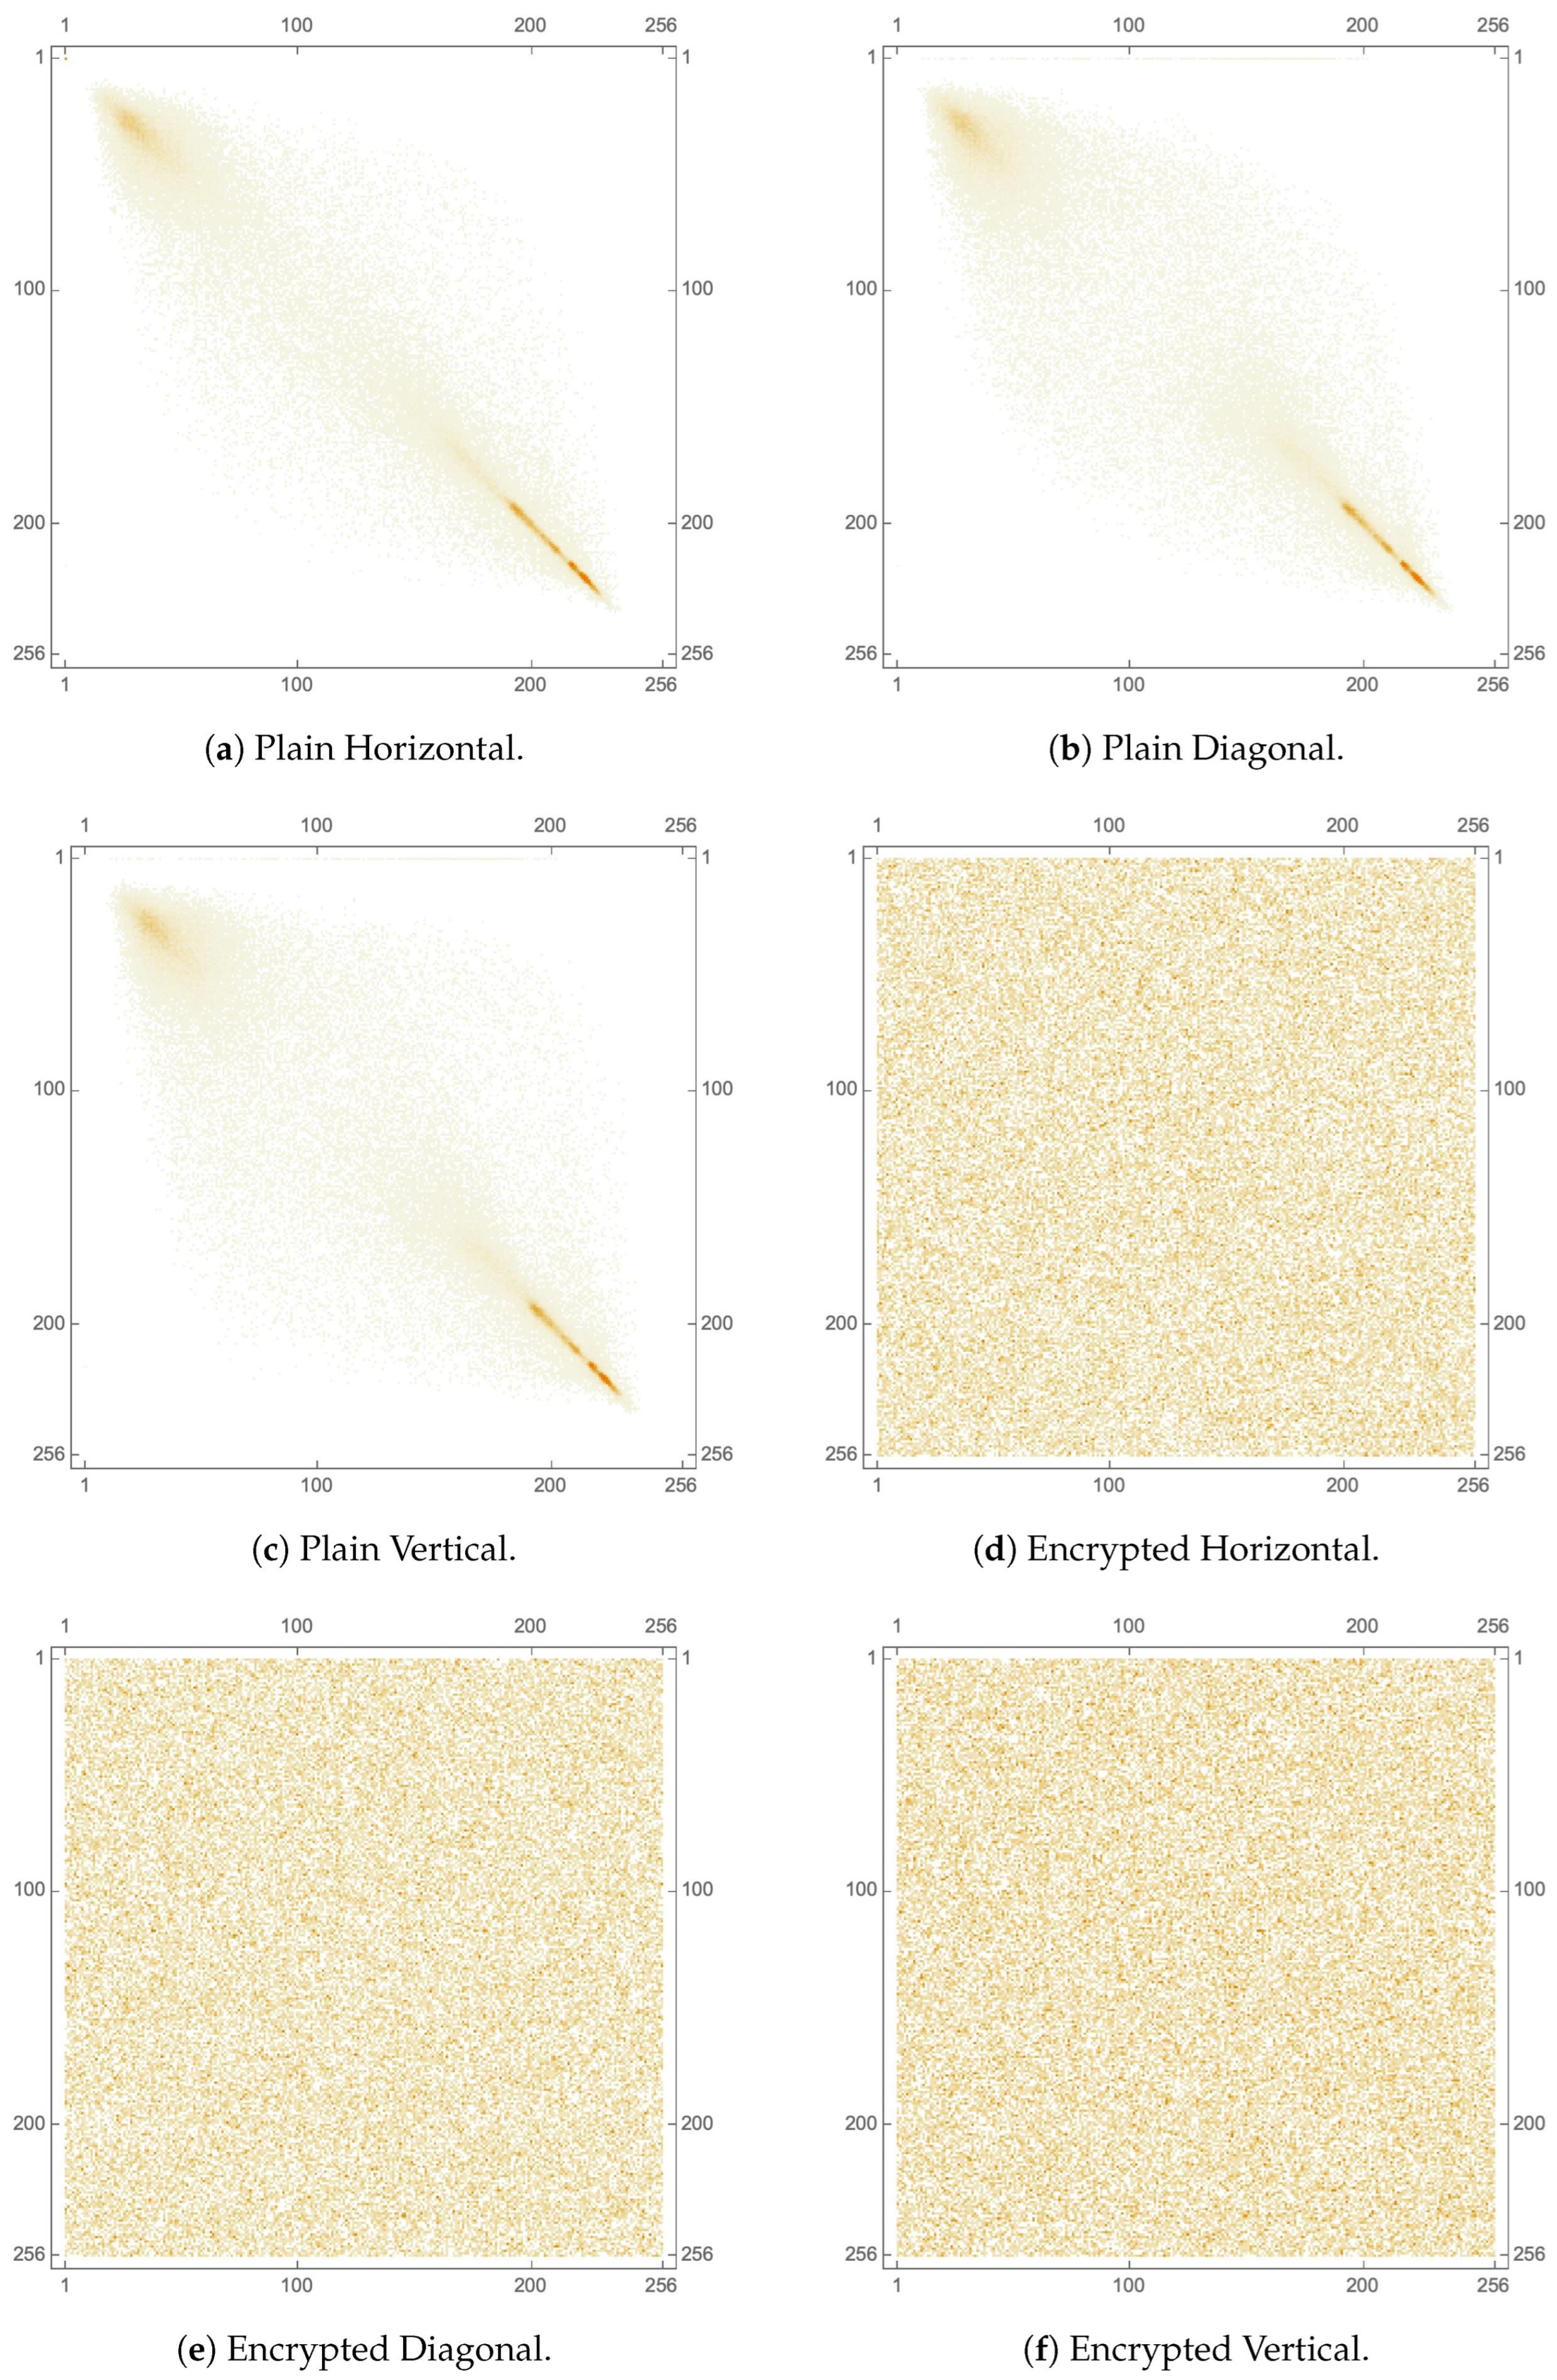
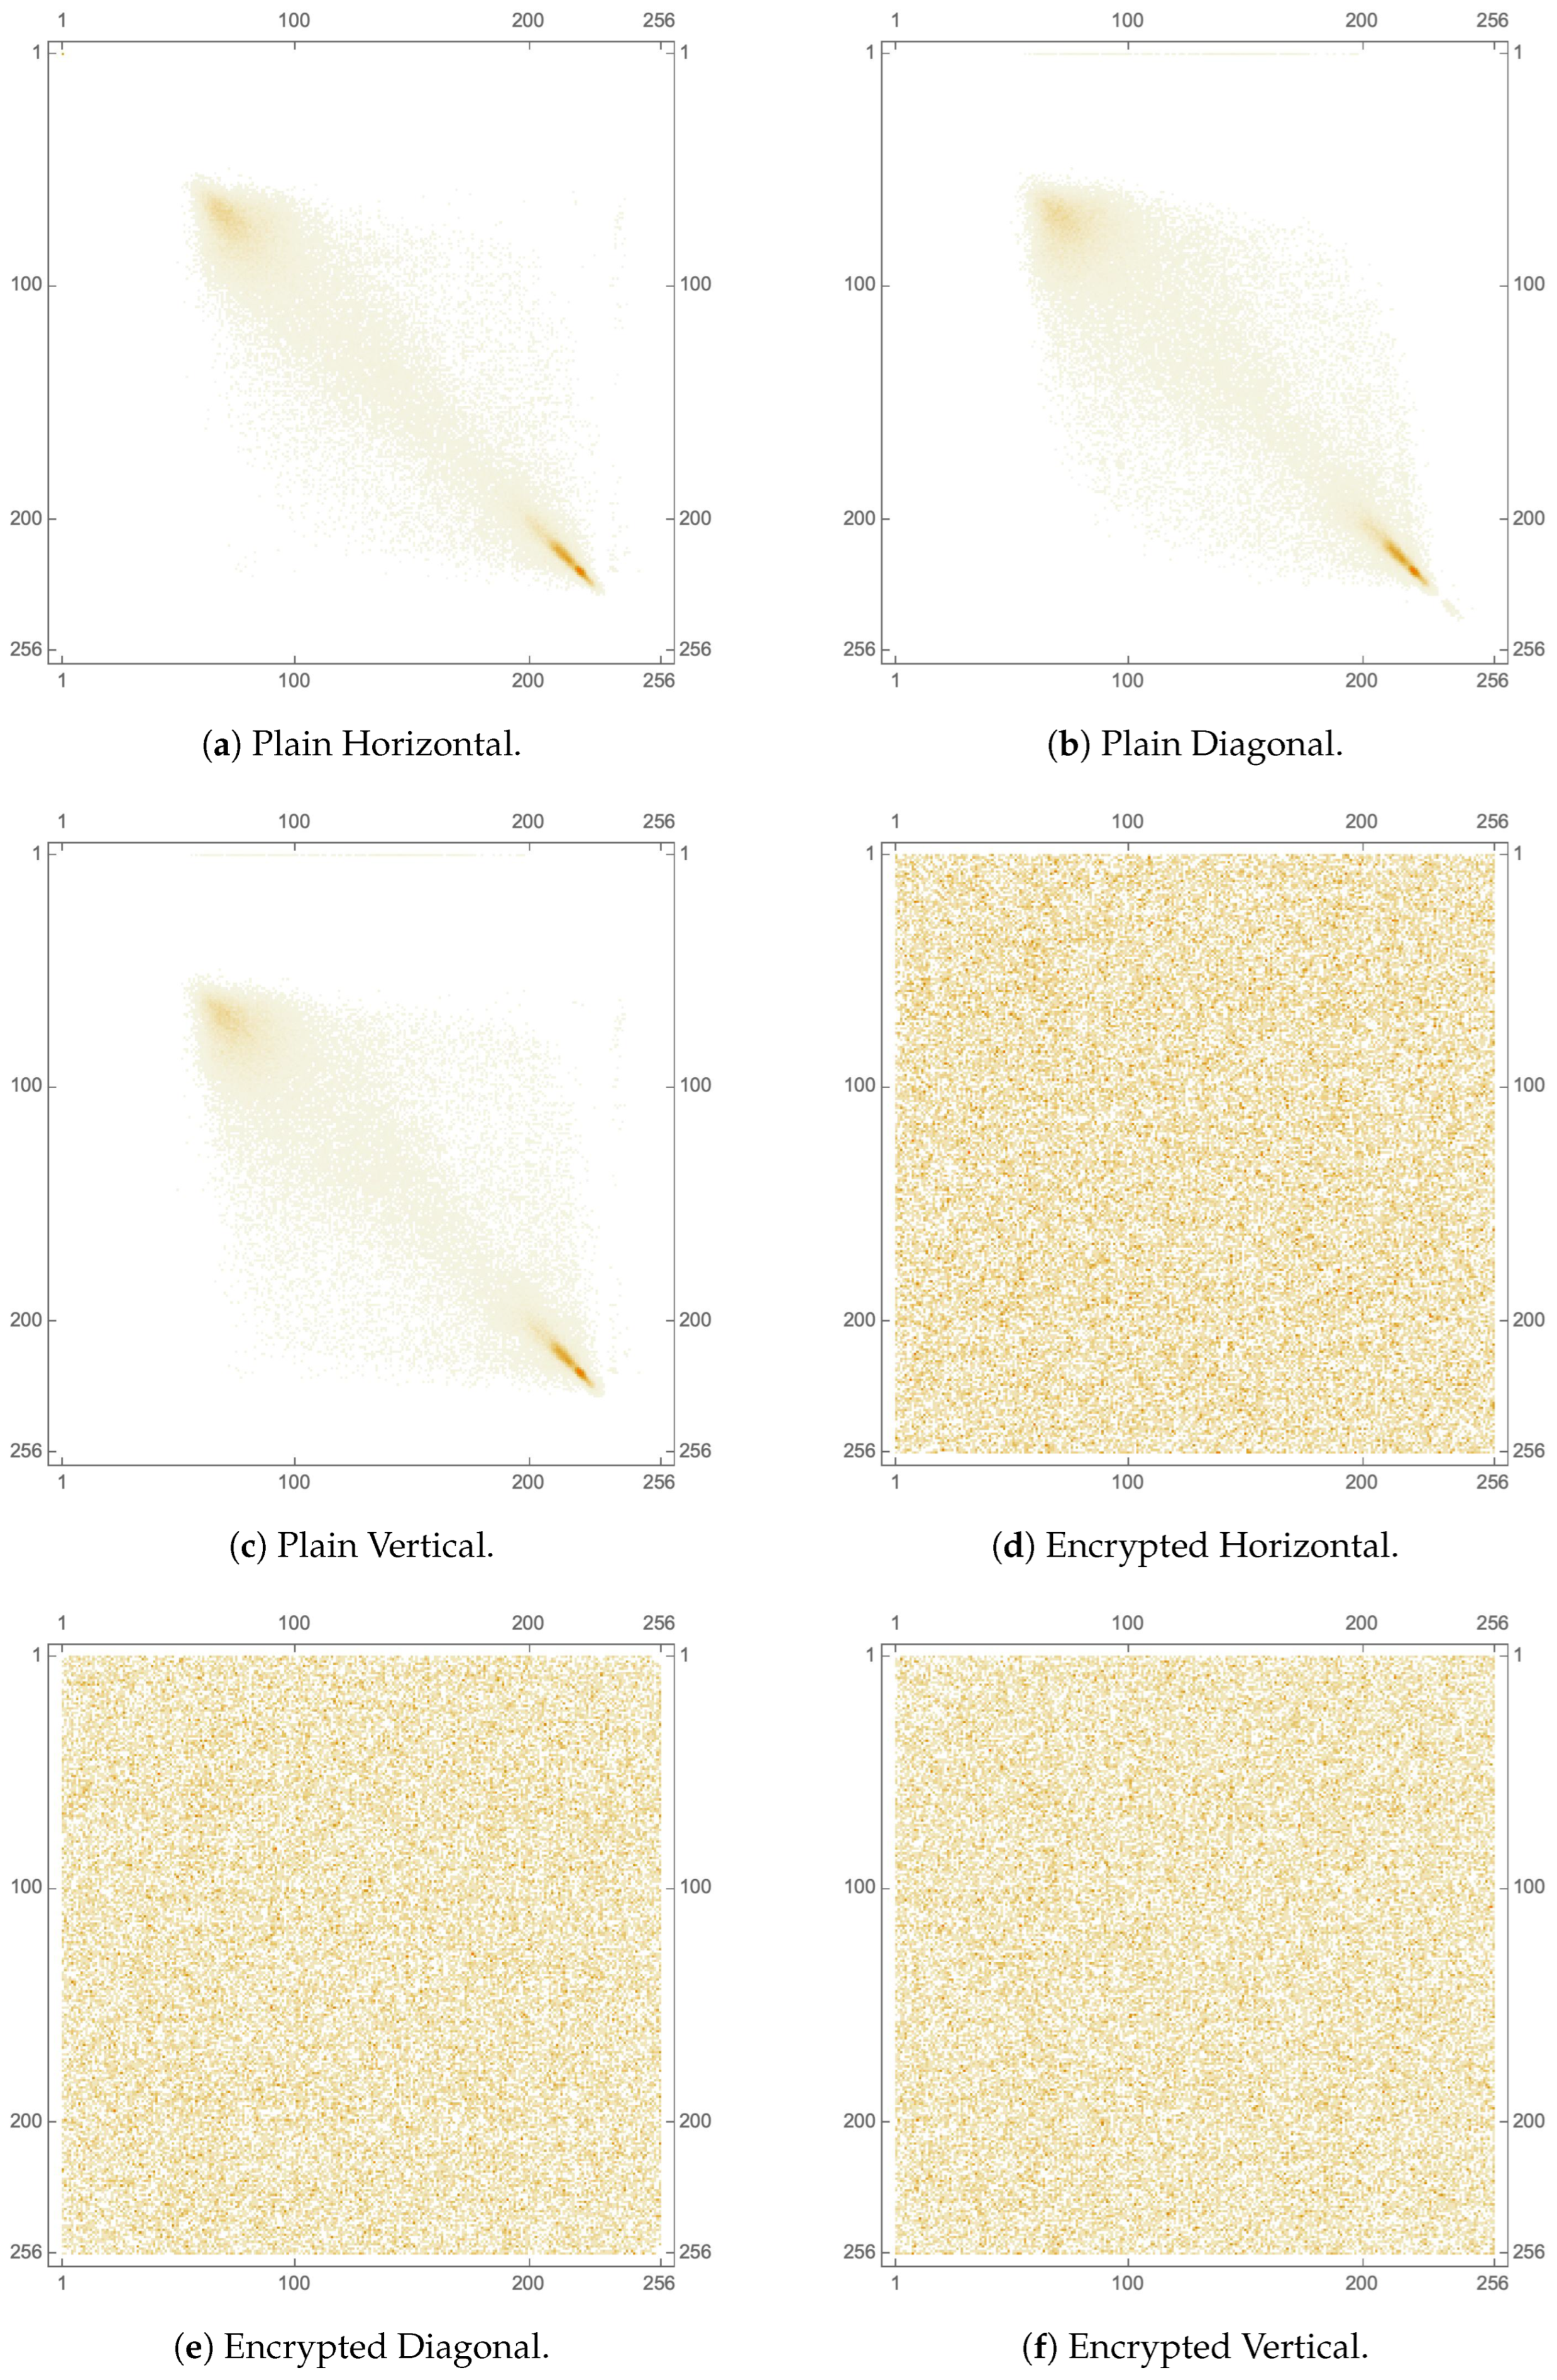
Figure 16 provides 2D plots of the pixel co-occurrence matrices for the plain and encrypted Tree image in 3 directions. Clearly, sub-figures (a), (b) and (c) are diagonal in nature, reflecting strong pixel correlation in the plain image, unlike sub-figures (d), (e) and (f) which reflect a rather uniform distribution, signifying random pixel values. Not surprisingly, the same pixel correlation behavior is noticed for each of the separate color channels of the Tree image, which are illustrated in
Figure 17,
Figure 18 and
Figure 19. Moreover, a similar 3D plot of the same metric is illustrated in
Figure 15, where sub-figures (c) and (f) provide pixel correlation for the plain and encrypted Tree images, respectively.
4.8. Differential Attack Analysis
This section evaluates the quality of image cryptosystems based on the direct difference between plain and encrypted images. In other words, the input plain image is compared directly with the encrypted image on a pixel-by-pixel or mean-average basis. This evaluation is performed in order to generate a percentage indicating the change in color intensities (per pixel or as a mean average) resulting from the encryption procedure. Due to the fact that the absence of resemblance between comparable pixels in both images is promoted, this evaluation must be performed pixel-by-pixel. In addition, a more global perspective of the cumulative pixel change rates between images (given as mean averages) is analyzed, indicating the existence of general color intensity similarities between these images. The literature suggests 2 tests to satisfy these requirements, the number of pixel change ratio (NPCR) for pixel-by-pixel comparison and the unified averaged change intensity (UACI) for the evaluation of the mean average difference.
The NPCR represents the percentage evaluation of the number of changed pixels. Such a difference among pixels is carried out with a strict equality perspective. Given 2 images
and
(of dimensions
), the difference per pixel
(where
x and
y are the coordinates of the pixel) is calculated as:
Thus, the NPCR is mathematically expressed as:
This means that a higher percentage reflects a larger difference between the 2 images. As a large difference is sought, the literature suggests that is the target NPCR value for a well-encrypted image.
Utilizing a different assessment lens, the UACI attempts to assess the difference between 2 images in terms of their mean averages. The UACI is mathematically expressed as:
The literature considers a target percentage of about to reflect a well-encrypted image (with respect to the color range , is approximated to 85 steps of difference in intensity.)
For the proposed image cryptosystem,
Table 11 displays the computed NPCR and UACI values for various images, with average values corresponding to
and
, respectively, indicating very good NPCR and UACI performance. Furthermore,
Table 12 presents a comparison with the literature, for the 3 separate color channels, for various images. A comparable performance is shown. Finally,
Table 13, provides another comparison with the literature, for the RGB Lena image. Also here, a comparable performance is attained.
4.9. The National Institute of Standards and Technology Analysis
The National Institute of Standards and Technology (NIST) Special Publication (SP) 800 series provides guidelines, standards, and best practices for various aspects of information security, including image encryption [
70]. The NIST SP 800 series is widely recognized as a leading source of information security guidance and is widely used by organizations in the public and private sectors. In relation to image encryption, NIST SP 800-60 provides guidelines for the selection and use of image encryption algorithms. The publication provides a framework for evaluating and comparing different encryption algorithms based on factors such as security, performance, and implementation complexity. The guidelines in SP 800-60 are intended to help organizations choose the most appropriate encryption algorithm for their specific needs, and to ensure the security and privacy of encrypted images. Moreover, the NIST SP 800-63-3 provides guidelines for the secure use of biometric images, such as fingerprints, iris scans, and facial recognition data. These guidelines cover various aspects of biometric image security, including the secure storage, transmission, and use of biometric images. Furthermore, those specific guidelines in SP 800-63-3 are intended to help organizations protect the confidentiality, integrity, and availability of biometric images, while also addressing privacy concerns. This make it of paramount importance to include a NIST analysis as part of the performance evaluation of any image cryptosystem. The NIST analysis suite of tests assesses a bit-stream for randomness through various tests. For such a bit-stream to successfully pass all the tests, it needs to score a
value of at least
in all of them. Upon carrying out a NIST analysis on encrypted bit-streams resultant from the proposed image cryptosystem, we realize that it does indeed pass all NIST tests successfully. An example illustrates this in
Table 14, where all values do indeed pass the
threshold for randomness.
4.10. Key Space Analysis
A key space analysis is performed to determine the number of distinct keys that can be employed during the encryption process. In the proposed image cryptosystem, it is assumed that the transmitter and receiver pre-share the secret keys via a secure channel. Moreover, the literature provides useful key-establishment protocols, as in [
71]. For the proposed image cryptosystem, the Chen hyperchaotic map provides 13 variables, while each of the encryption keys provides a single variable as a seed, as well as the variables related to the S-box evaluation metrics, which are
. This means that there is a total of
variables affecting the key space. With the largest machine precision being
, the key space is calculated to be
. It is clear that the achieved key space is much larger than the previously considered safe threshold of
[
72]. This signifies that the proposed image cryptosystem is fully resistant against brute-force attacks.
Table 15 carries out a comparison of key spaces of various image cryptosystems from the literature and displays how the proposed one fares amongst them, showcasing its superior performance in that regard.
4.11. Histogram Dependency Tests
In this testing category, the histograms of the plain and encrypted images are compared. Given 2 histograms, the comparisons performed are targeted at evaluating the level of the linear dependency between both of them. For the 5 evaluations carried out [
77], the better the encryption performed, the less the correlation between the 2 histograms, and thus, the lower the dependency value computed. Accordingly, computing the dependency coefficient as a value in the range
, it is favored to be as close to 0 as possible, since 1 and
both reflect a strong dependency in magnitude (aside form the direction presented by the sign). Out of many dependency evaluation techniques, in this research work, there are 5 tests carried out: Blomqvist
, Goodman-Kruskal
, Kendall
, Spearman
, and Pearson correlation
r [
78].
-
Blomqvist
evaluates the correlation between 2 histograms
X and
Y, with their medians
and
respectively. It is mathematically expressed as:
With respect to the median as a reference point, pairs of elements across the 2 histograms are either on the same side of the median (creating a linear correlation), or not (breaking the linear correlation).
Goodman-Kruskal
measure of monotonic association is computed in a pairwise manner, which demands converting the 2 histograms into one set of pairs. Comparing 2 pairs, they are either in line with the correlation (
), or opposing it (
). Goodman-Kruskal correlation is mathematically expressed as:
Kendall
evaluates correlation based on sample sizes,
,
and
n. It is mathematically expressed as:
Spearman rank correlation
test relates the position of an element in its sorted histogram, with respect to the mean rank value. It is mathematically expressed as:
where
x and
y are the 2 evaluated variables,
is the rank of element
i in list
l, and
is the mean of ranks of
l.
Pearson correlation
r relates elements in the histograms directly to their mean averages. It is mathematically expressed as:
where
and
are the means of the histograms
X and
Y, respectively.
Table 16 presents the results of the 5 tests on various images. As all scores are close to 0, dependency is shown to be minimal, showcasing the excellent pixel dispersion quality of the proposed image cryptosystem.
4.12. Execution Time Analysis
An image cryptosystem’s execution time, in terms of encryption and decryption times, is a crucial performance evaluation metric. This is because: a) It reflects the efficiency of running an algorithm and its ability to handle large-scale image encryption and decryption; b) It reflects how well an image cryptosystems handles resource constraints, where the algorithm is expected to run on mobile and hand-held devices with low processing power; c) It reflects the possibility (or its lack) of scalability, which is important as some algorithms exhibit superior performance for small images, but weaken as the image size grows; and d) It allows for a comparison with state-of-the-art algorithms, as part of the trade-off between security performance and implementation complexity.
Table 17 displays the execution times for various square dimensions of the House image. For an image of dimensions
, a very short time of less than half a second is reported. It is also clear that there is a linear increase in time with increases in image dimensions. Moreover,
Table 18 carries out an execution time comparison with counterpart algorithms from the literature. It is clear that the proposed cryptosystem exhibits superior performance in that regard. It is worth mentioning here that execution times are not solely dependent on the complexity of an image cryptosystem. Other factors that directly influence execution times include the available processing power and random access memory (RAM), as well as the programming language or software of choice, and finally, the operating system. Traditionally, whenever execution times are reported in the literature, information is provided regarding the machine’s processor, RAM and the software upon which the image cryptosystem is implemented. Absence of such information, as in [
76] is rather unusual. The proposed image cryptosystem, as well as the algorithms provided in [
8,
20,
32] are implemented in the Wolfram language, utilizing Wolfram Mathematica
®, while the algorithms provided in [
61,
76,
79,
80] adopt Mathworks Matlab
®. The average encryption rate of the proposed image cryptosystem is
Mbps.
4.13. S-Box Performance Analysis
With practically infinite possibilities to choose from when selecting an S-box for an image cryptosystem, performance evaluation metrics must be employed to gauge their performance and make an informed decision on which S-box would exhibit the best confusion properties. The literature offers 5 tests to achieve that. These metrics are as follows:
Nonlinearity [
81] represents the measure of the effect of changing 1 bit in the input on the output (optimal value of 120, with most commonly achieved of 112).
Linear approximation probability (LAP) [
82] calculates the bias for a given S-box (optimal value of 0.0625).
Differential approximation probability (DAP) [
83] is a technique that examines the impact of specific variations (other than the bit level) in inputs and their effect on the confused output (optimal value of 0.0156).
Bit independence criterion (BIC) [
84] evaluates repeatability in patterns in the confused output (optimal value of 112).
Strict avalanche criterion (SAC) [
84] calculates the rate of change in the confused output with respect to the change in the input on a bit-by-bit level (optimal value of 0.5).
Table 19 displays the results of computing those 5 metrics for the proposed S-boxes (displayed earlier in
Table 1,
Table 2 and
Table 3), alongside the ideal value for each metric. It is clear that the OpenSLL S-box provides the best performance, with closest proximity to the set of ideal values. Furthermore,
Table 20 displays a comparison among the proposed S-boxes and a number of S-boxes utilized as part of counterpart algorithms from the literature. It is clear that a comparable performance is indeed achieved. It is worth noting here that the main advantage of opting to use those 3 proposed S-boxes is the increase in the number of variables of the key space by 15, as explained earlier in
Section 2.3.4. While near-optimal S-box performance evaluation metrics were indeed pursued, other important S-box design criteria (e.g. aiming to avoid short ring cycles and fixed points [
85,
86]) were not considered in this research work.
4.14. Various Cryptanalyses and Noise Attacks
Table 21 provides a brief description of various forms of cryptanalyses that could be utilized to attack an image cryptosystem. However, due to the proposed image cryptosystem making use of a 3-layered SPN, none of the attacks in
Table 21 would be effective against it.
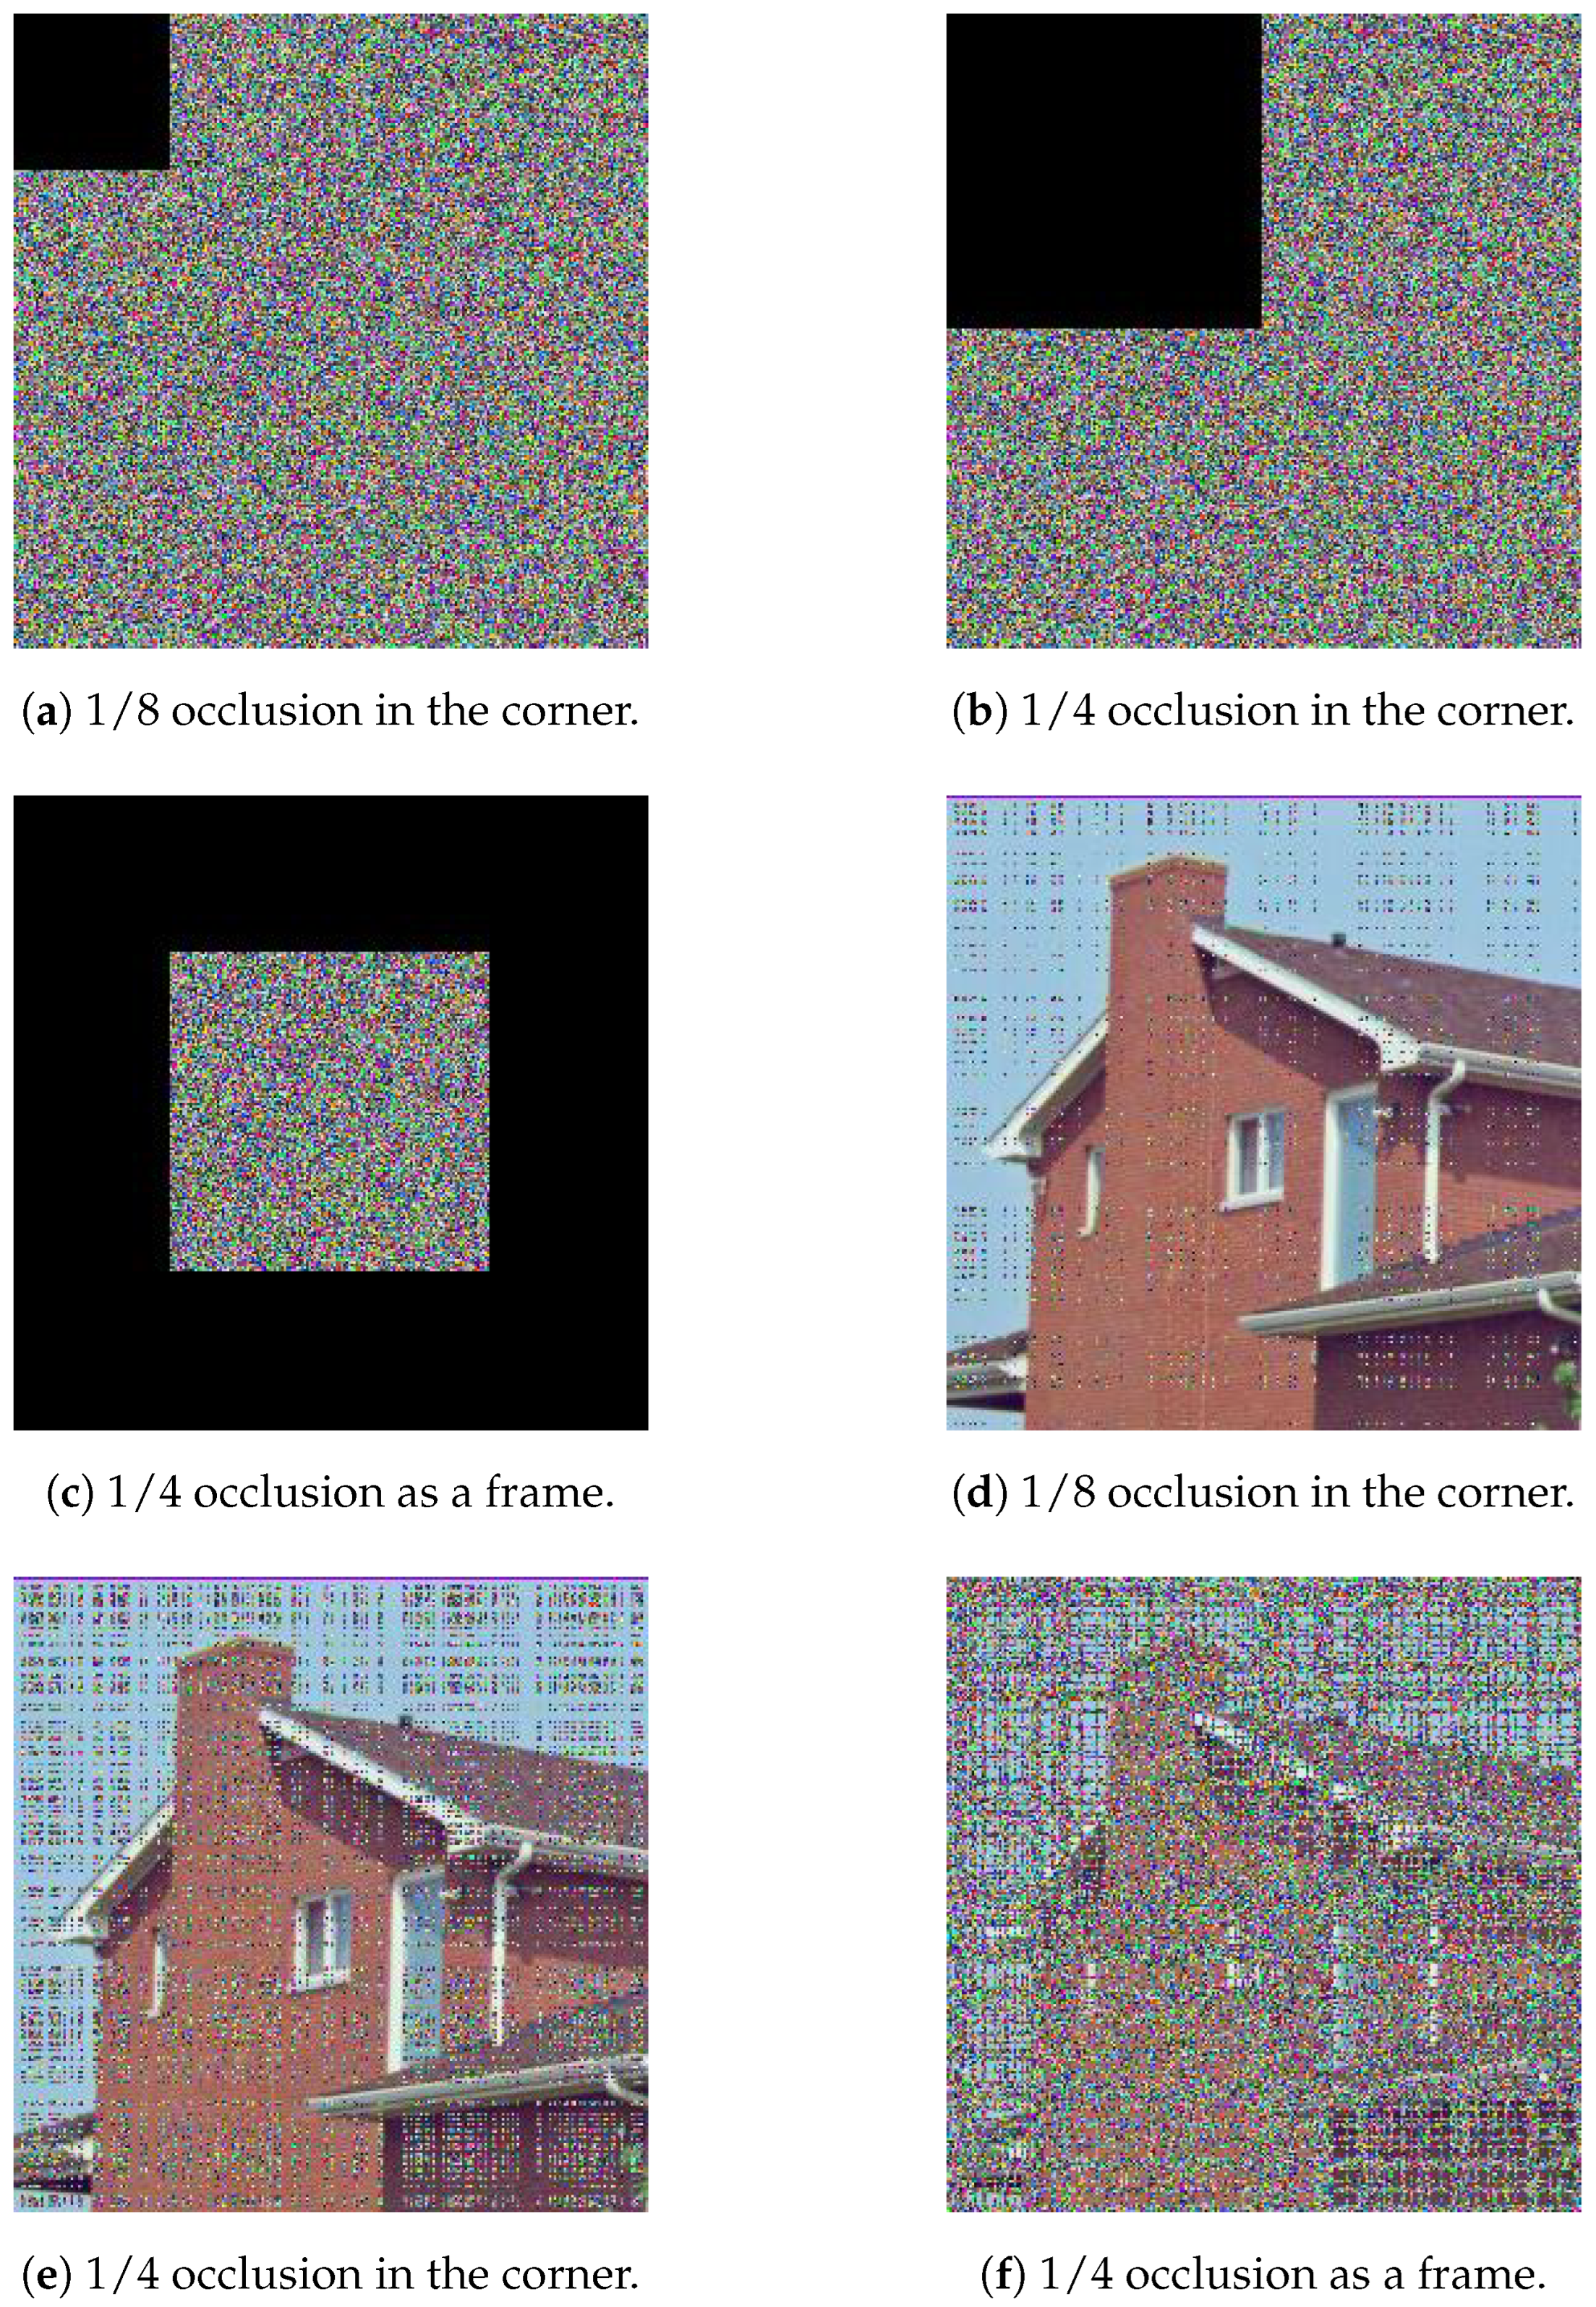
A considerable portion of an encrypted image is lost during transmission in an occlusion attack. Using the same set of keys, the decryption process attempts to retrieve the original plain image from the encrypted image. Thus, some of the restored image’s information may be lost. Nonetheless, it may maintain the majority of visual information necessary to reconstruct the original image. The effect of an occlusion attack on the encrypted image created by the proposed image cryptosystem is depicted in
Figure 20. Transmission causes the loss of one-fourth of the cipher picture. Yet, the decryption technique can recover some of the visual information from the image, which is sufficient to comprehend the visual content of the original plain image and identify it as the House image. As would be expected, in
Figure 20, it is clear that increasing the fraction of the occlusion results in a decrypted image of a worse condition.
In a noise attack, portions of the pixel values of the encrypted images are altered during transmission owing to channel deteriorating effects.
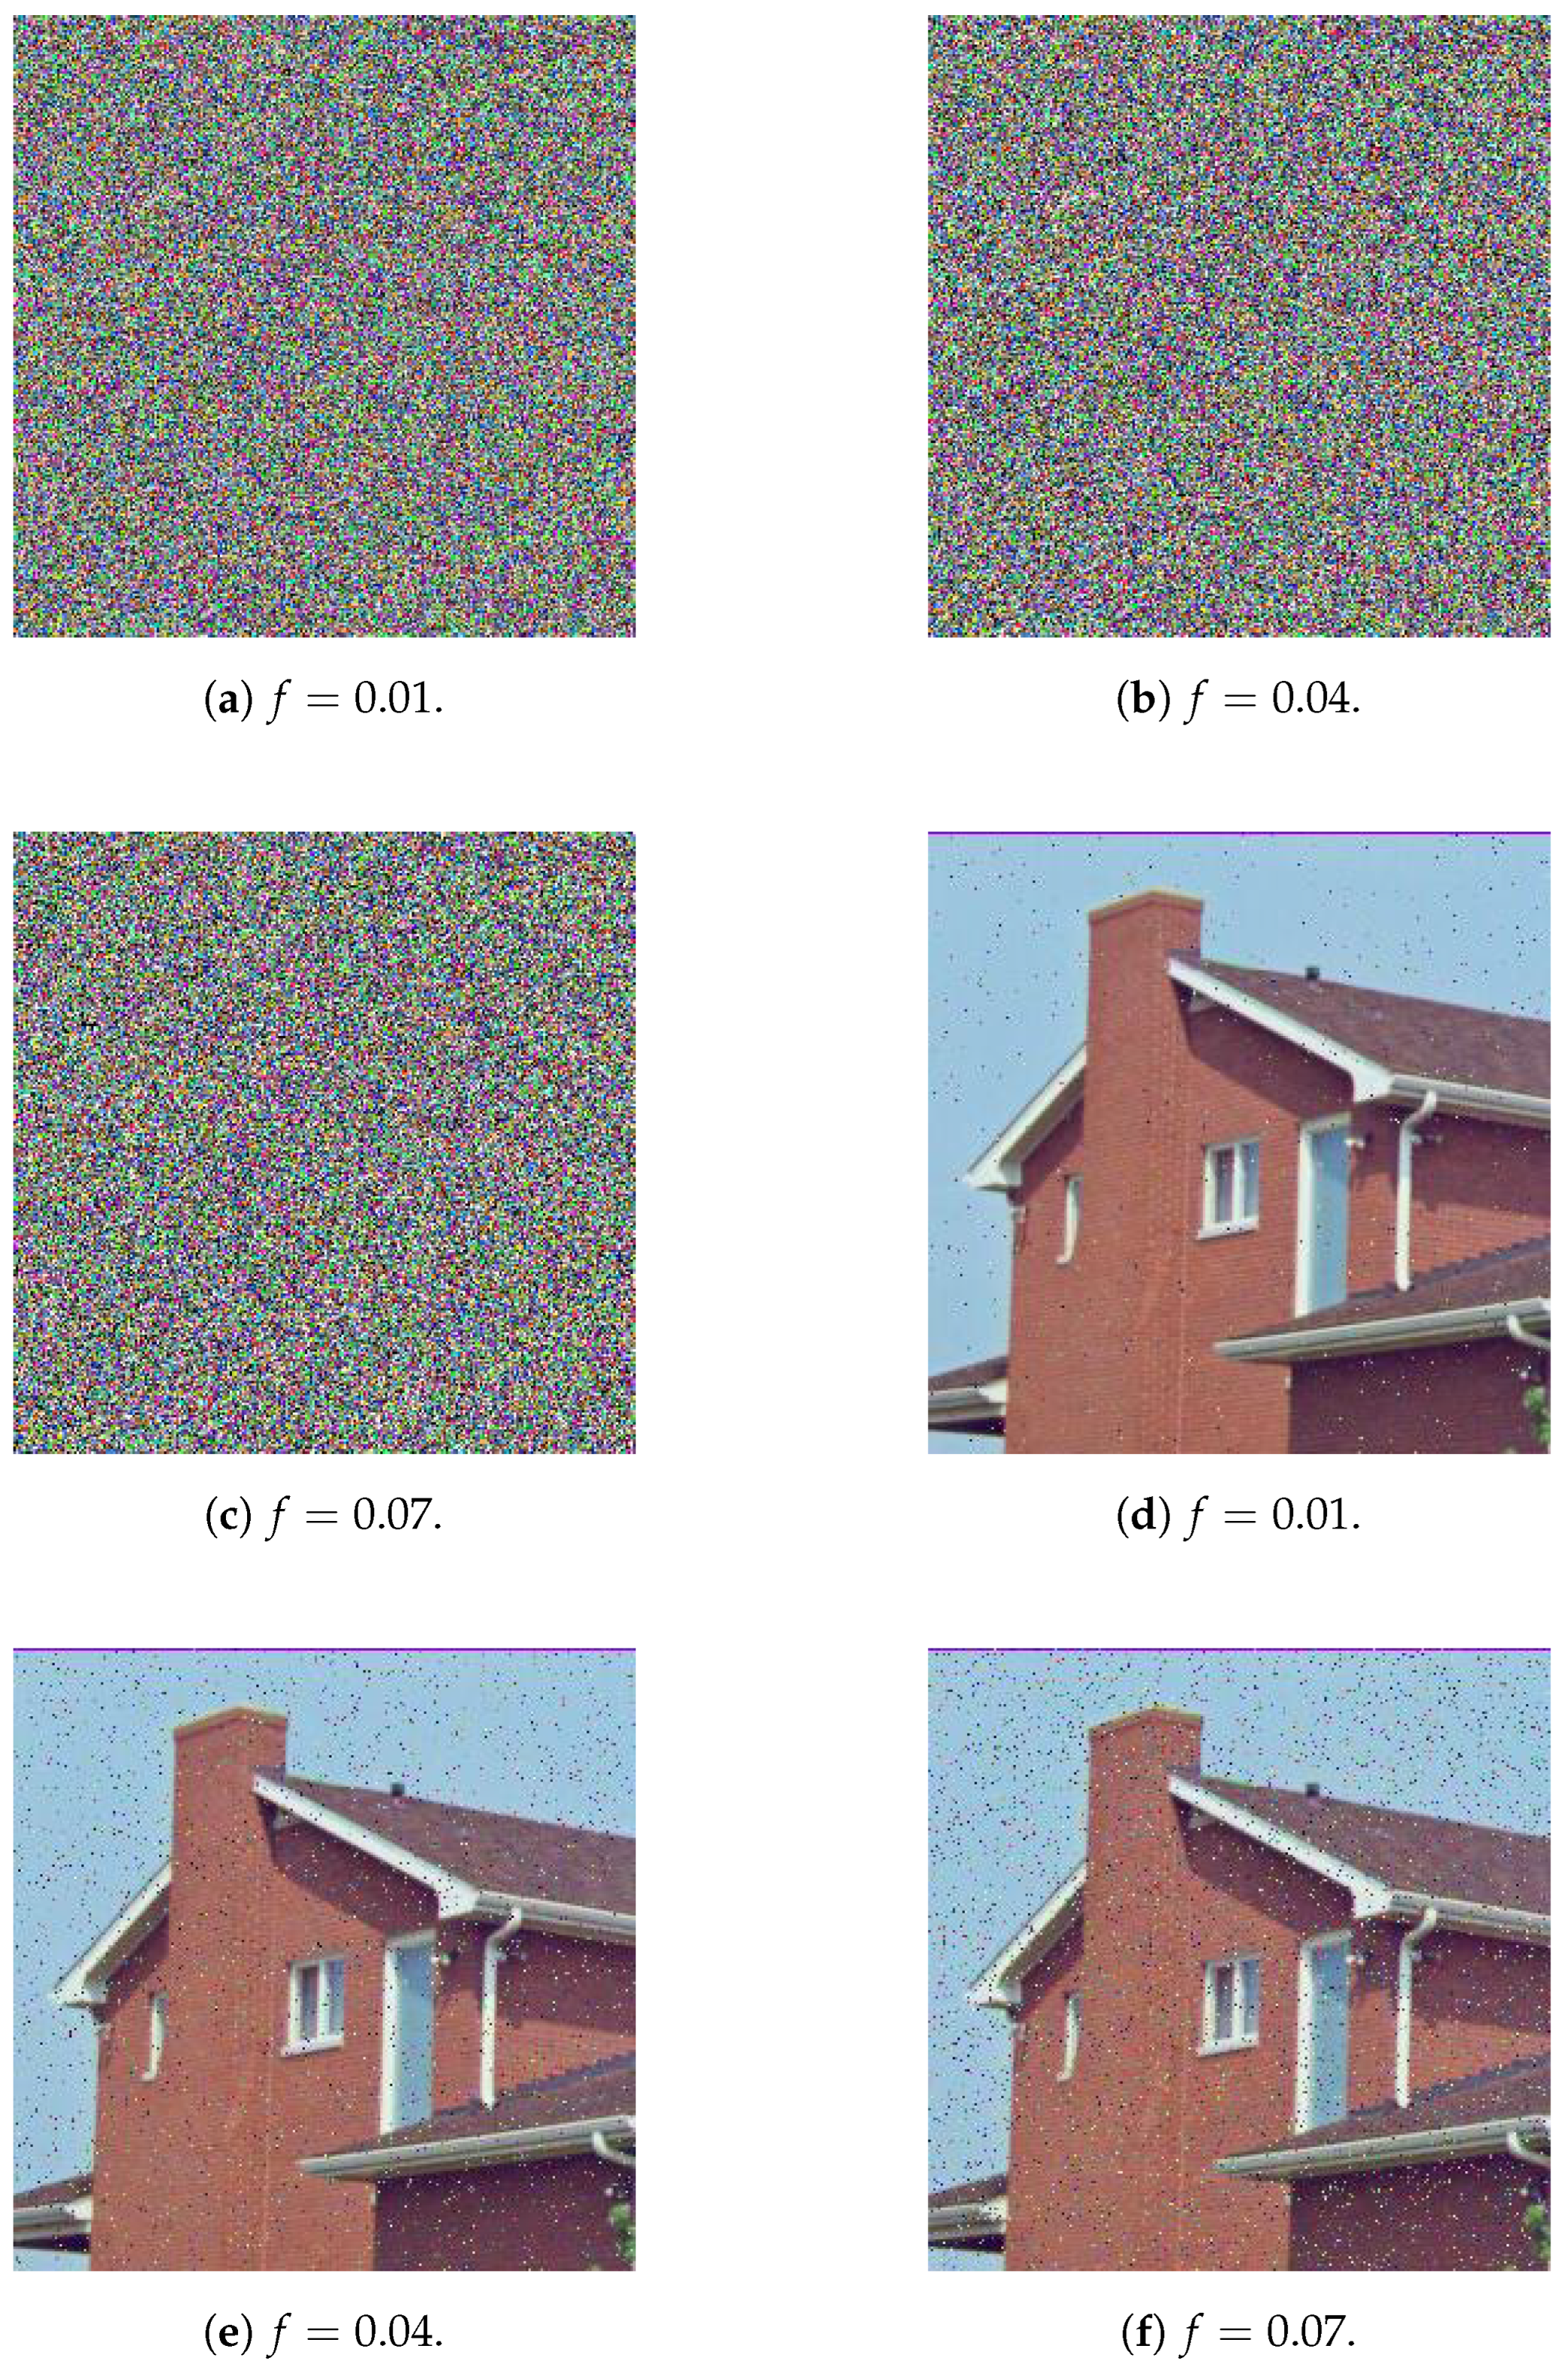
Figure 21 depicts the effect of a noise attack in which a salt-and-pepper noise is applied to encrypted images resulting from the proposed cryptosystem. When the noisy encrypted images are decrypted, the resulting images seem to retain the visual information of the original image. Thus, the cryptosystem is resistant to salt-and-pepper noise attacks.
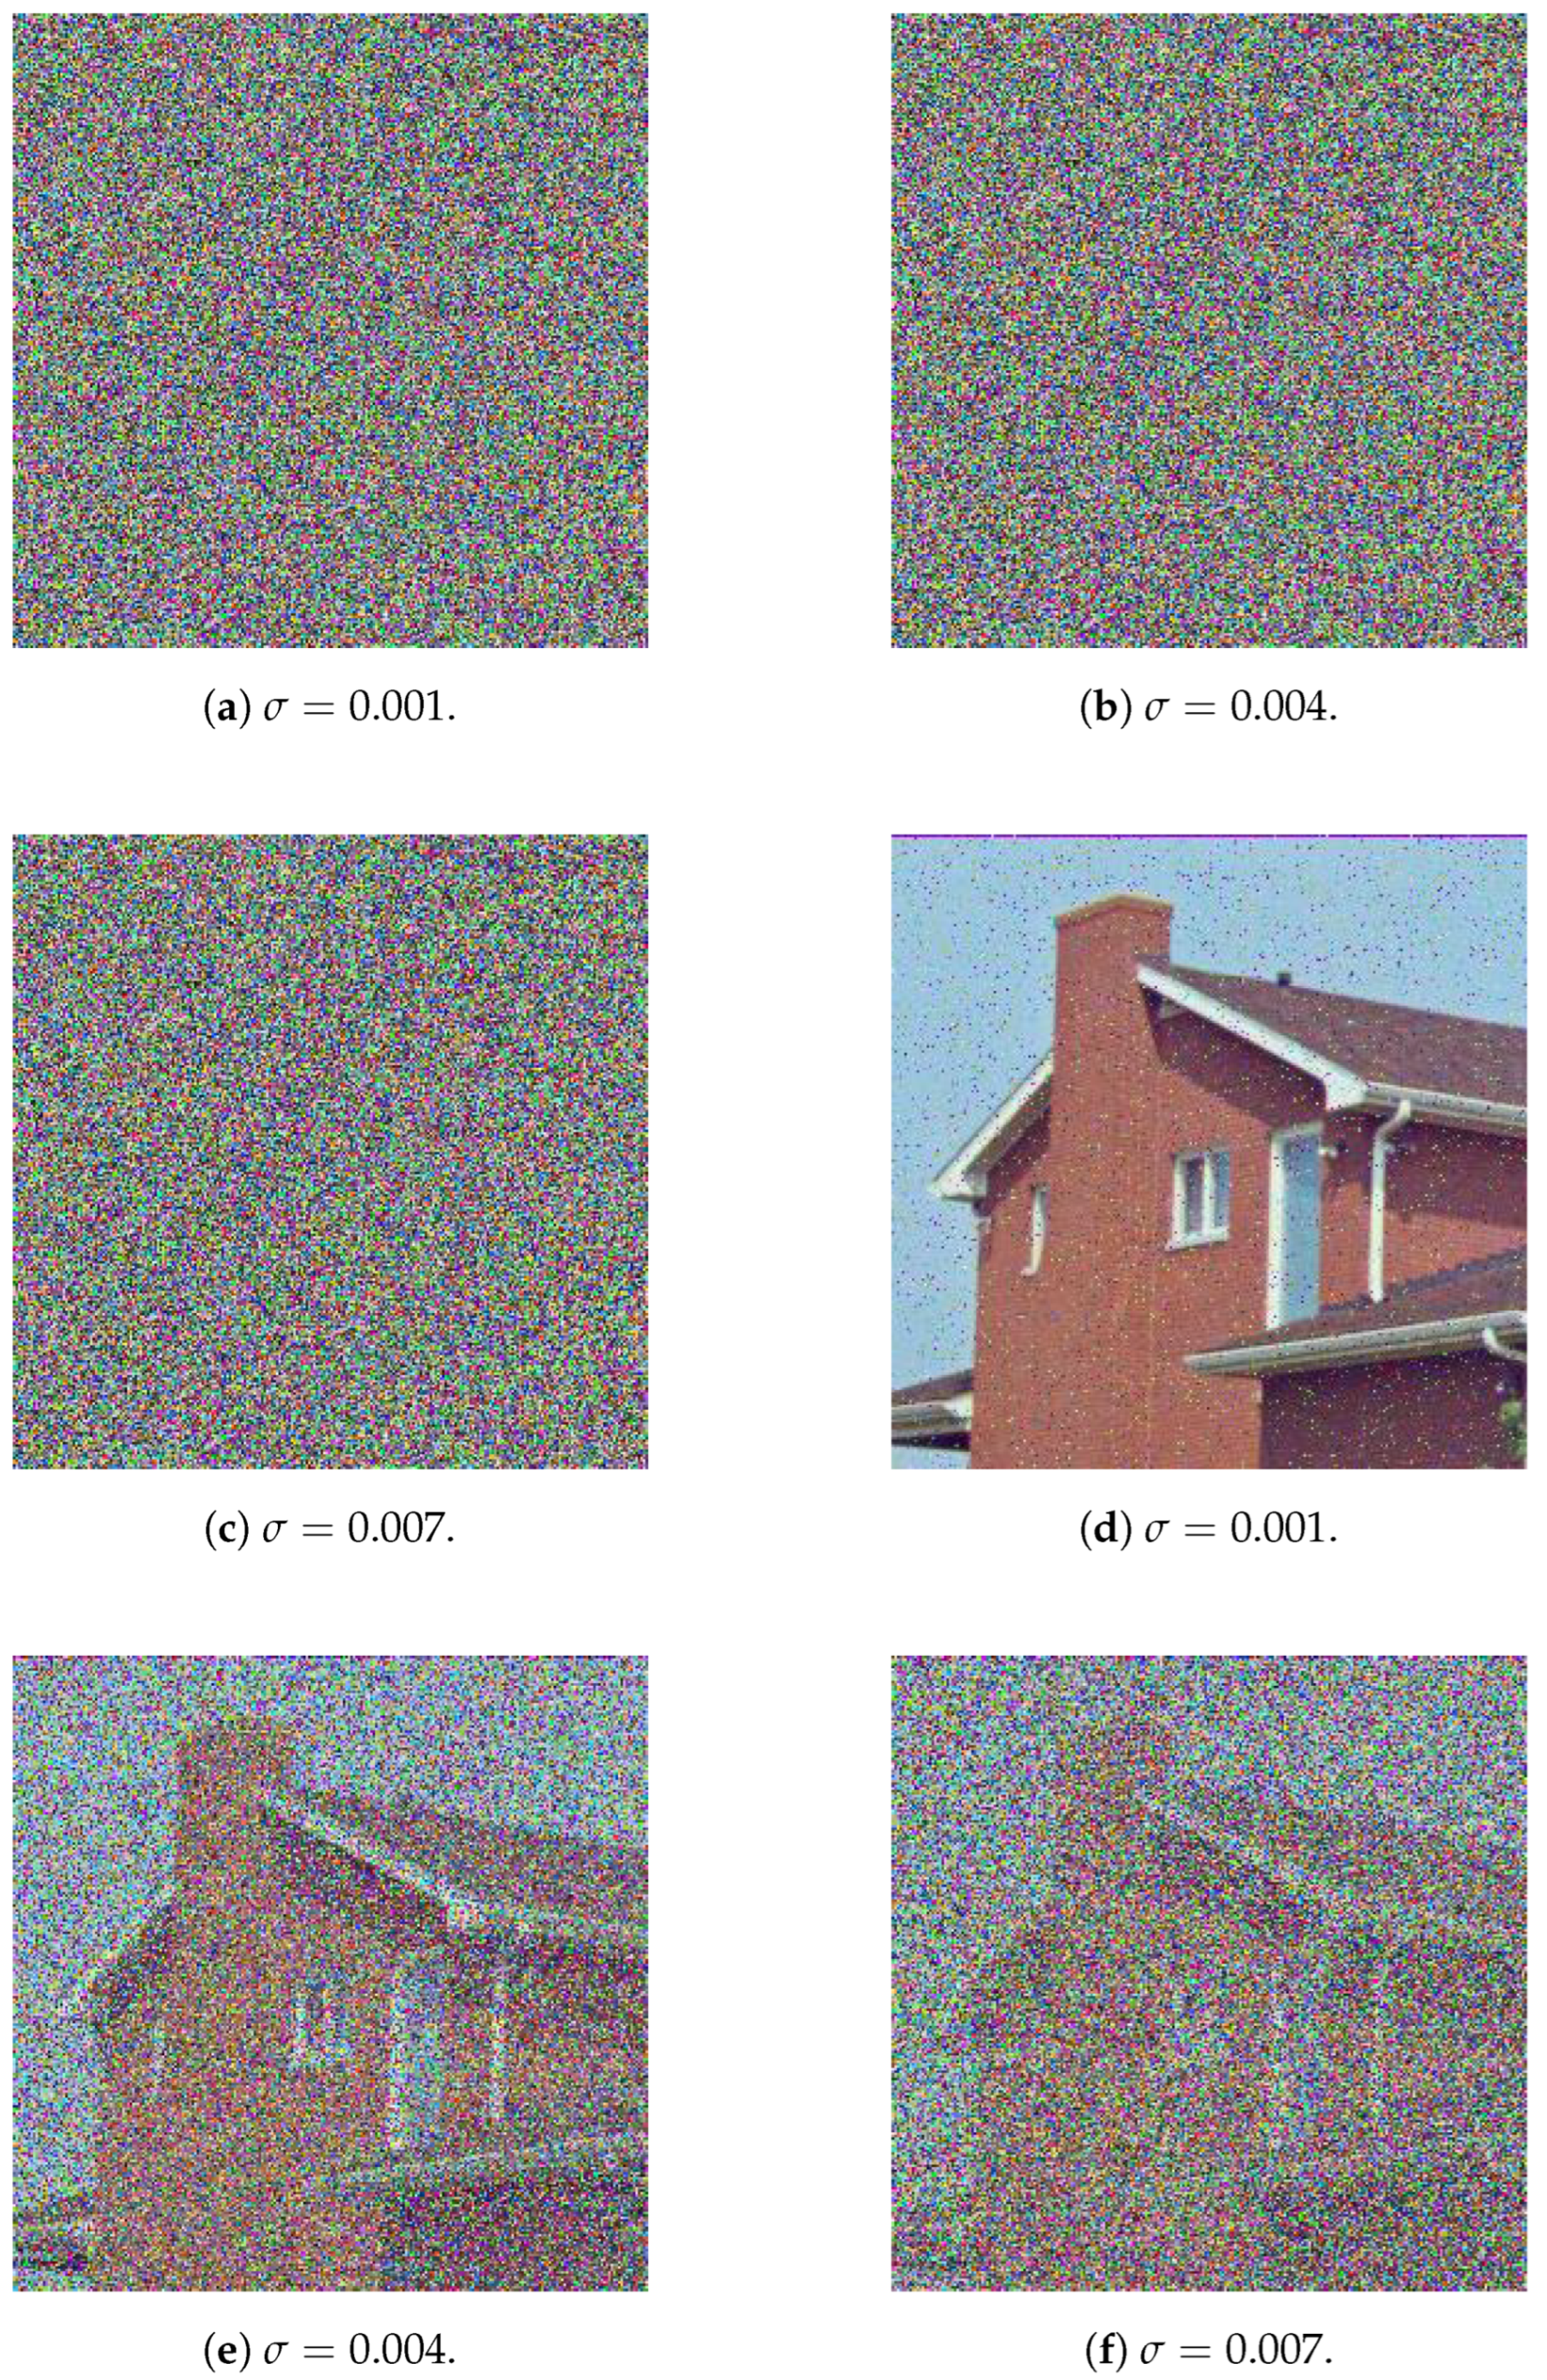
Figure 22 represents the same scenario recreated for the case of a Gaussian noise attack. In both of
Figure 21 and
Figure 22, it is observed that for the salt-and-pepper noise attack, with increased fraction of the image, as well as for the Gaussian noise attack, with increased standard deviation, the decrypted image, while still identifiable as the House image, is in a worse condition.
5. Conclusions and Future Works
This research work aimed at proposing a novel image cryptosystem that makes use of a 3-layer permutation-substitution network (PSN). For every layer, an encryption key and an S-box were generated and utilized. Design ideas for the encryption keys and S-boxes were pooled from the 4D dynamical Chen system of a fractional-order, the Mersenne Twister, OpenSLL, Rule 30 Cellular Automata and finally, Intel’s MKL. The employment of the hyperchaotic Chen map and the 3 PRNGs allowed for the introduction of a large number of variables, which have lead to the vast expansion of the key space to . This is indeed one of the differentiating advantages of the proposed image cryptosystem over its counterpart algorithms from the literature. Another such advantage is its superior efficiency, encrypting images at an average rate of Mbps. Moreover, the attained security level of the proposed image cryptosystem is shown to be rather high, not only in quantitative terms, as exhibited by the comparable and sometimes superior performance evaluation metrics in relation to the state-of-the-art, but also from a qualitative aspect. Quantitatively, the proposed image cryptosystem showcases average computed values for some key performance metrics as follows. MSE of , PSNR of dB, MAE of , information entropy of , NPCR of , and UACI of . Qualitatively, upon examining many of the counterpart algorithms from the literature, it is easy to realize that they implement a one-and-a-half PSN (i.e a permutation, a substitution, and a final permutation), unlike the proposed image cryptosystem which implements 3 times a permutation-substitution sequence, while maintaining excellent code efficiency. Furthermore, inspection of the encrypted images by the HVS provides no information as to what the original plain image could be. Various cryptanalyses and noise attacks were also shown to be futile in breaking the proposed cryptosystem.
Future research could take on more than one direction. First, while the adopted idea of incorporating the S-box performance evaluation metrics as part of the encryption key itself has much improved the key space, this has inadvertently lead to the utilization of sub-optimal S-boxes. Nevertheless, the performance of the proposed image cryptosystem was not affected by this, due to the application of the 3-layer PSN. Still, further improvements could have been attained, had better-performing S-boxes been chosen. Second, some instances in the literature have indicated that while the Mersenne Twister provides an excellent PRNG performance in general, however, in strict relation to cryptography applications, other PRNGs could potentially offer improved performance [
91]. Once again, this might not have affected the performance of the proposed image cryptosystem due to the application of the 3-layer PSN. In that regard, future works could attempt to replace the Mersenne Twister with other PRNGs of higher cryptographic performance and check for any noticeable overall improvement in the image cryptosystem.
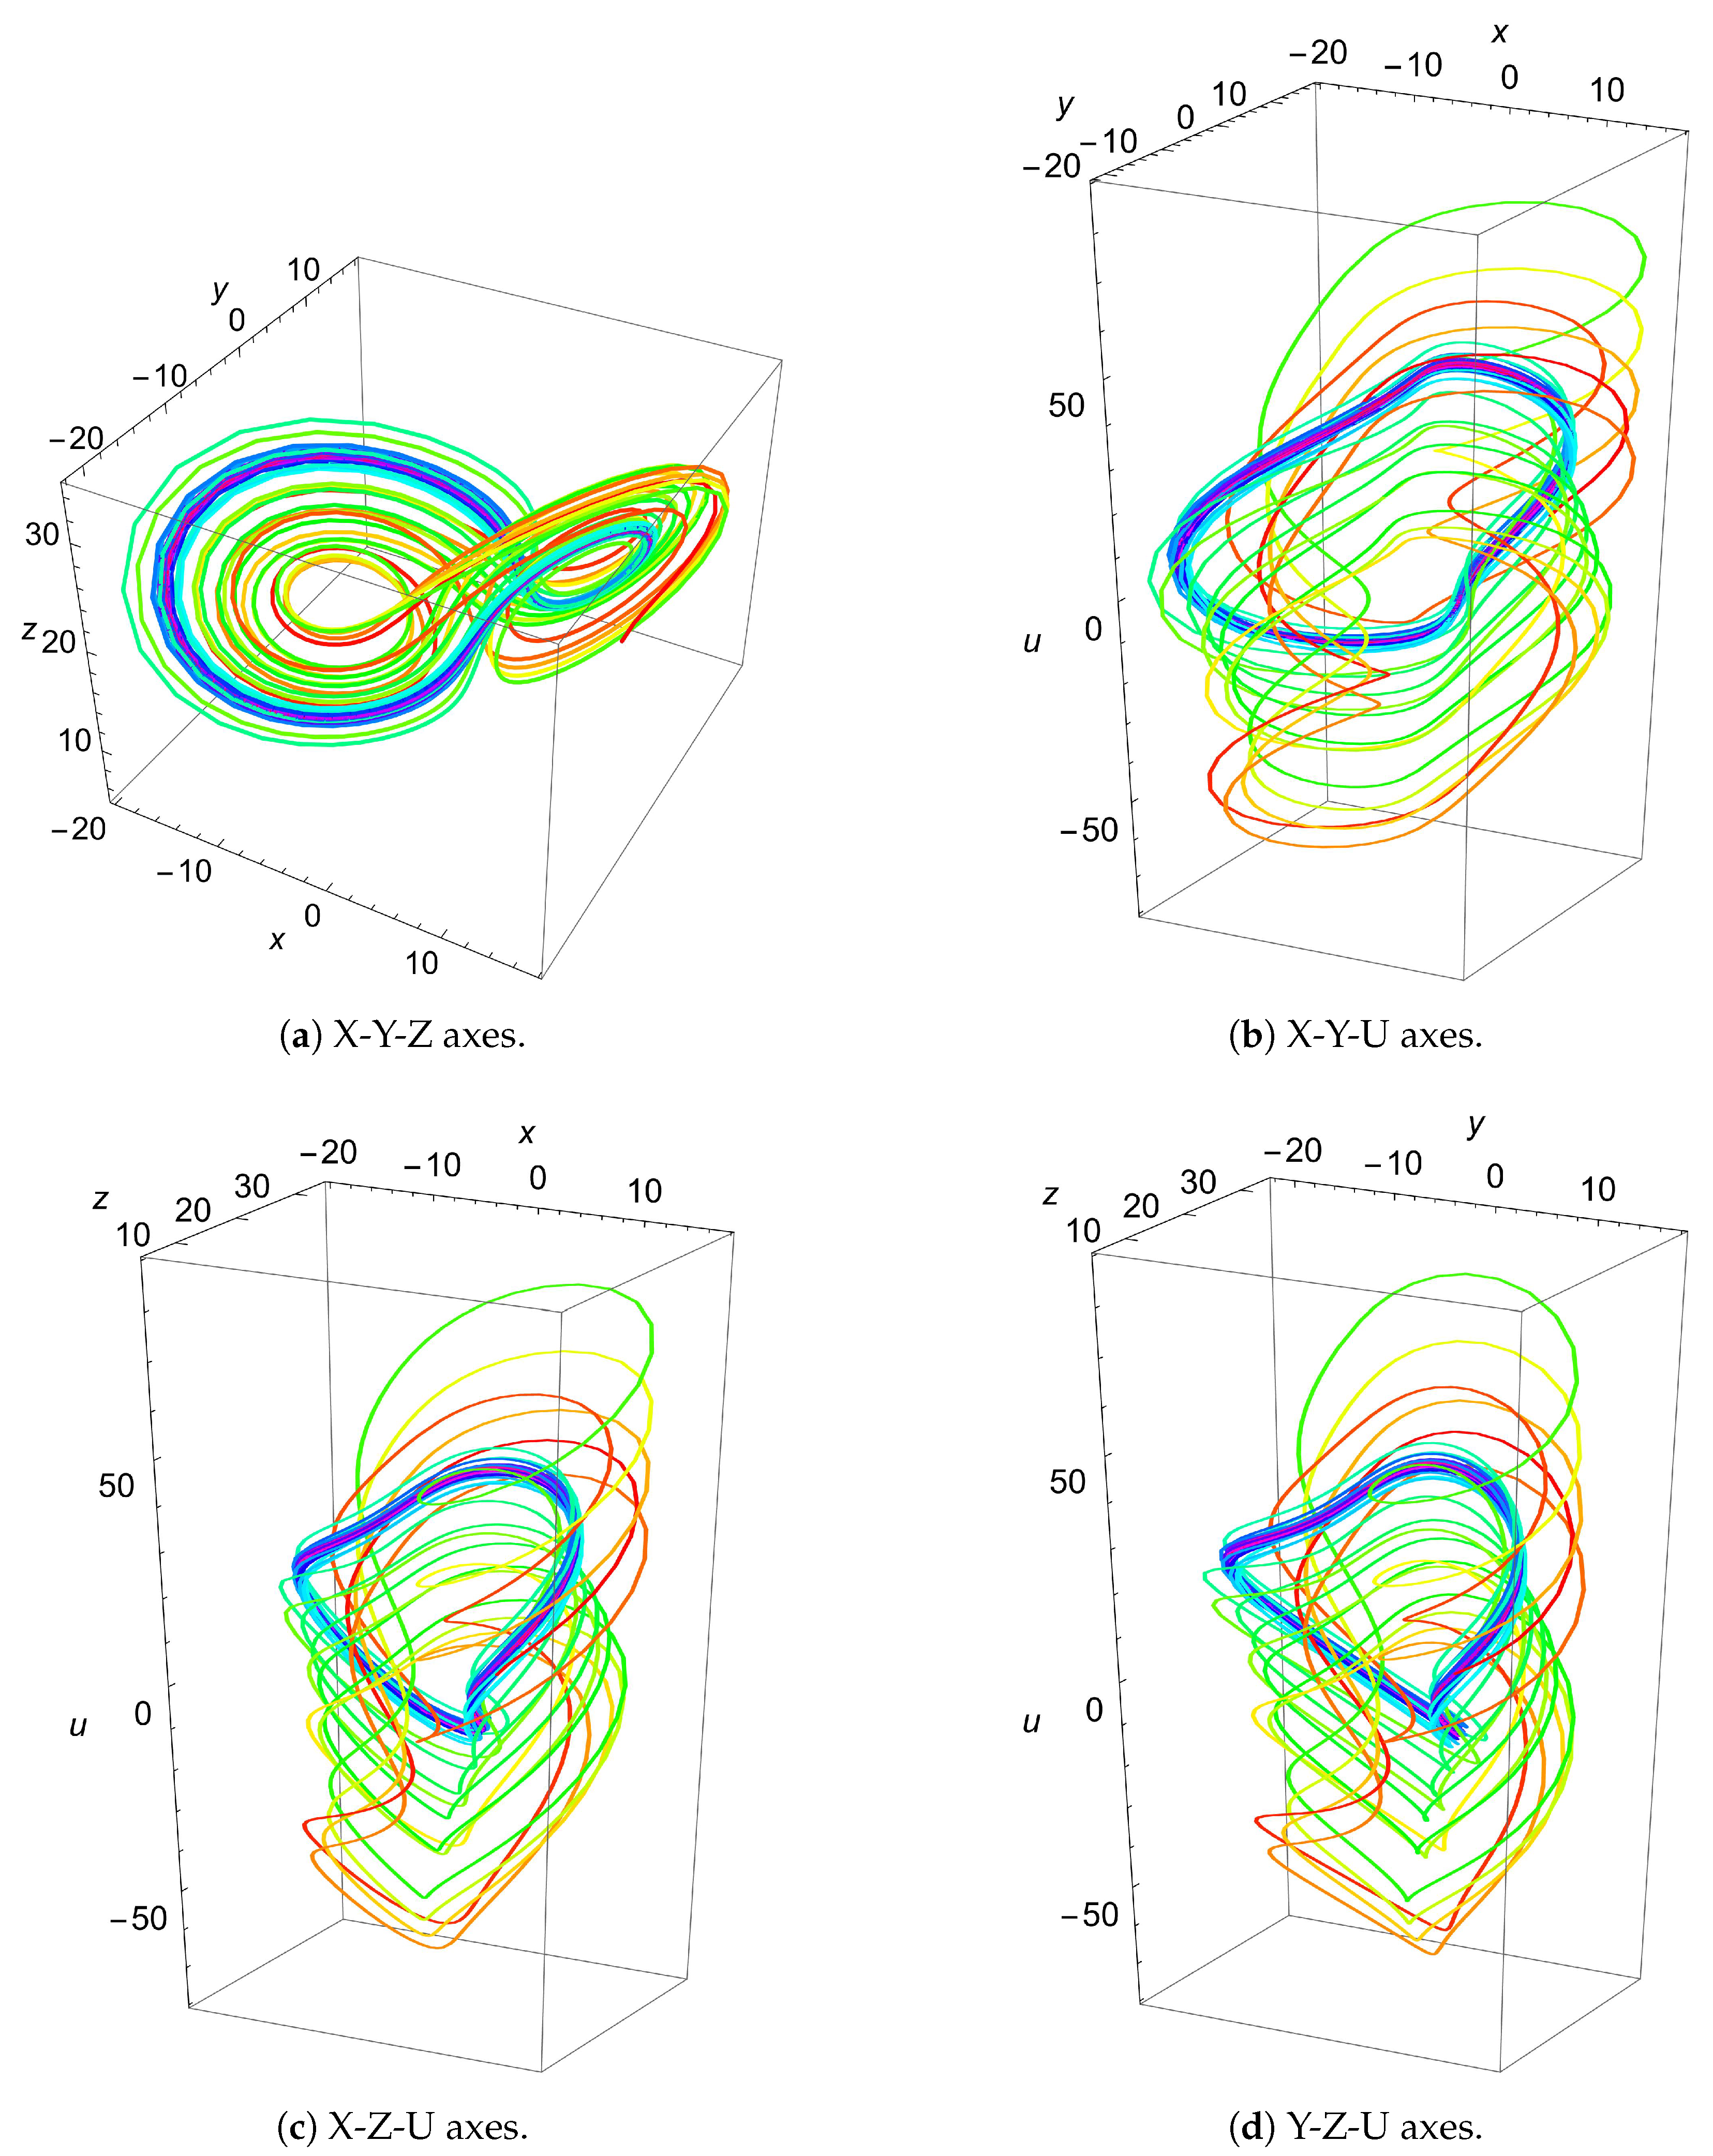
Figure 1.
3D plots utilizing various axes for the fractional order 4D Chen system. Values used are , , , , , , and (since the system is calculated in the 4D space, initial values are needed for the 4 axes. But for visualization purposes, a single axis is ignored in each plot).
Figure 1.
3D plots utilizing various axes for the fractional order 4D Chen system. Values used are , , , , , , and (since the system is calculated in the 4D space, initial values are needed for the 4 axes. But for visualization purposes, a single axis is ignored in each plot).
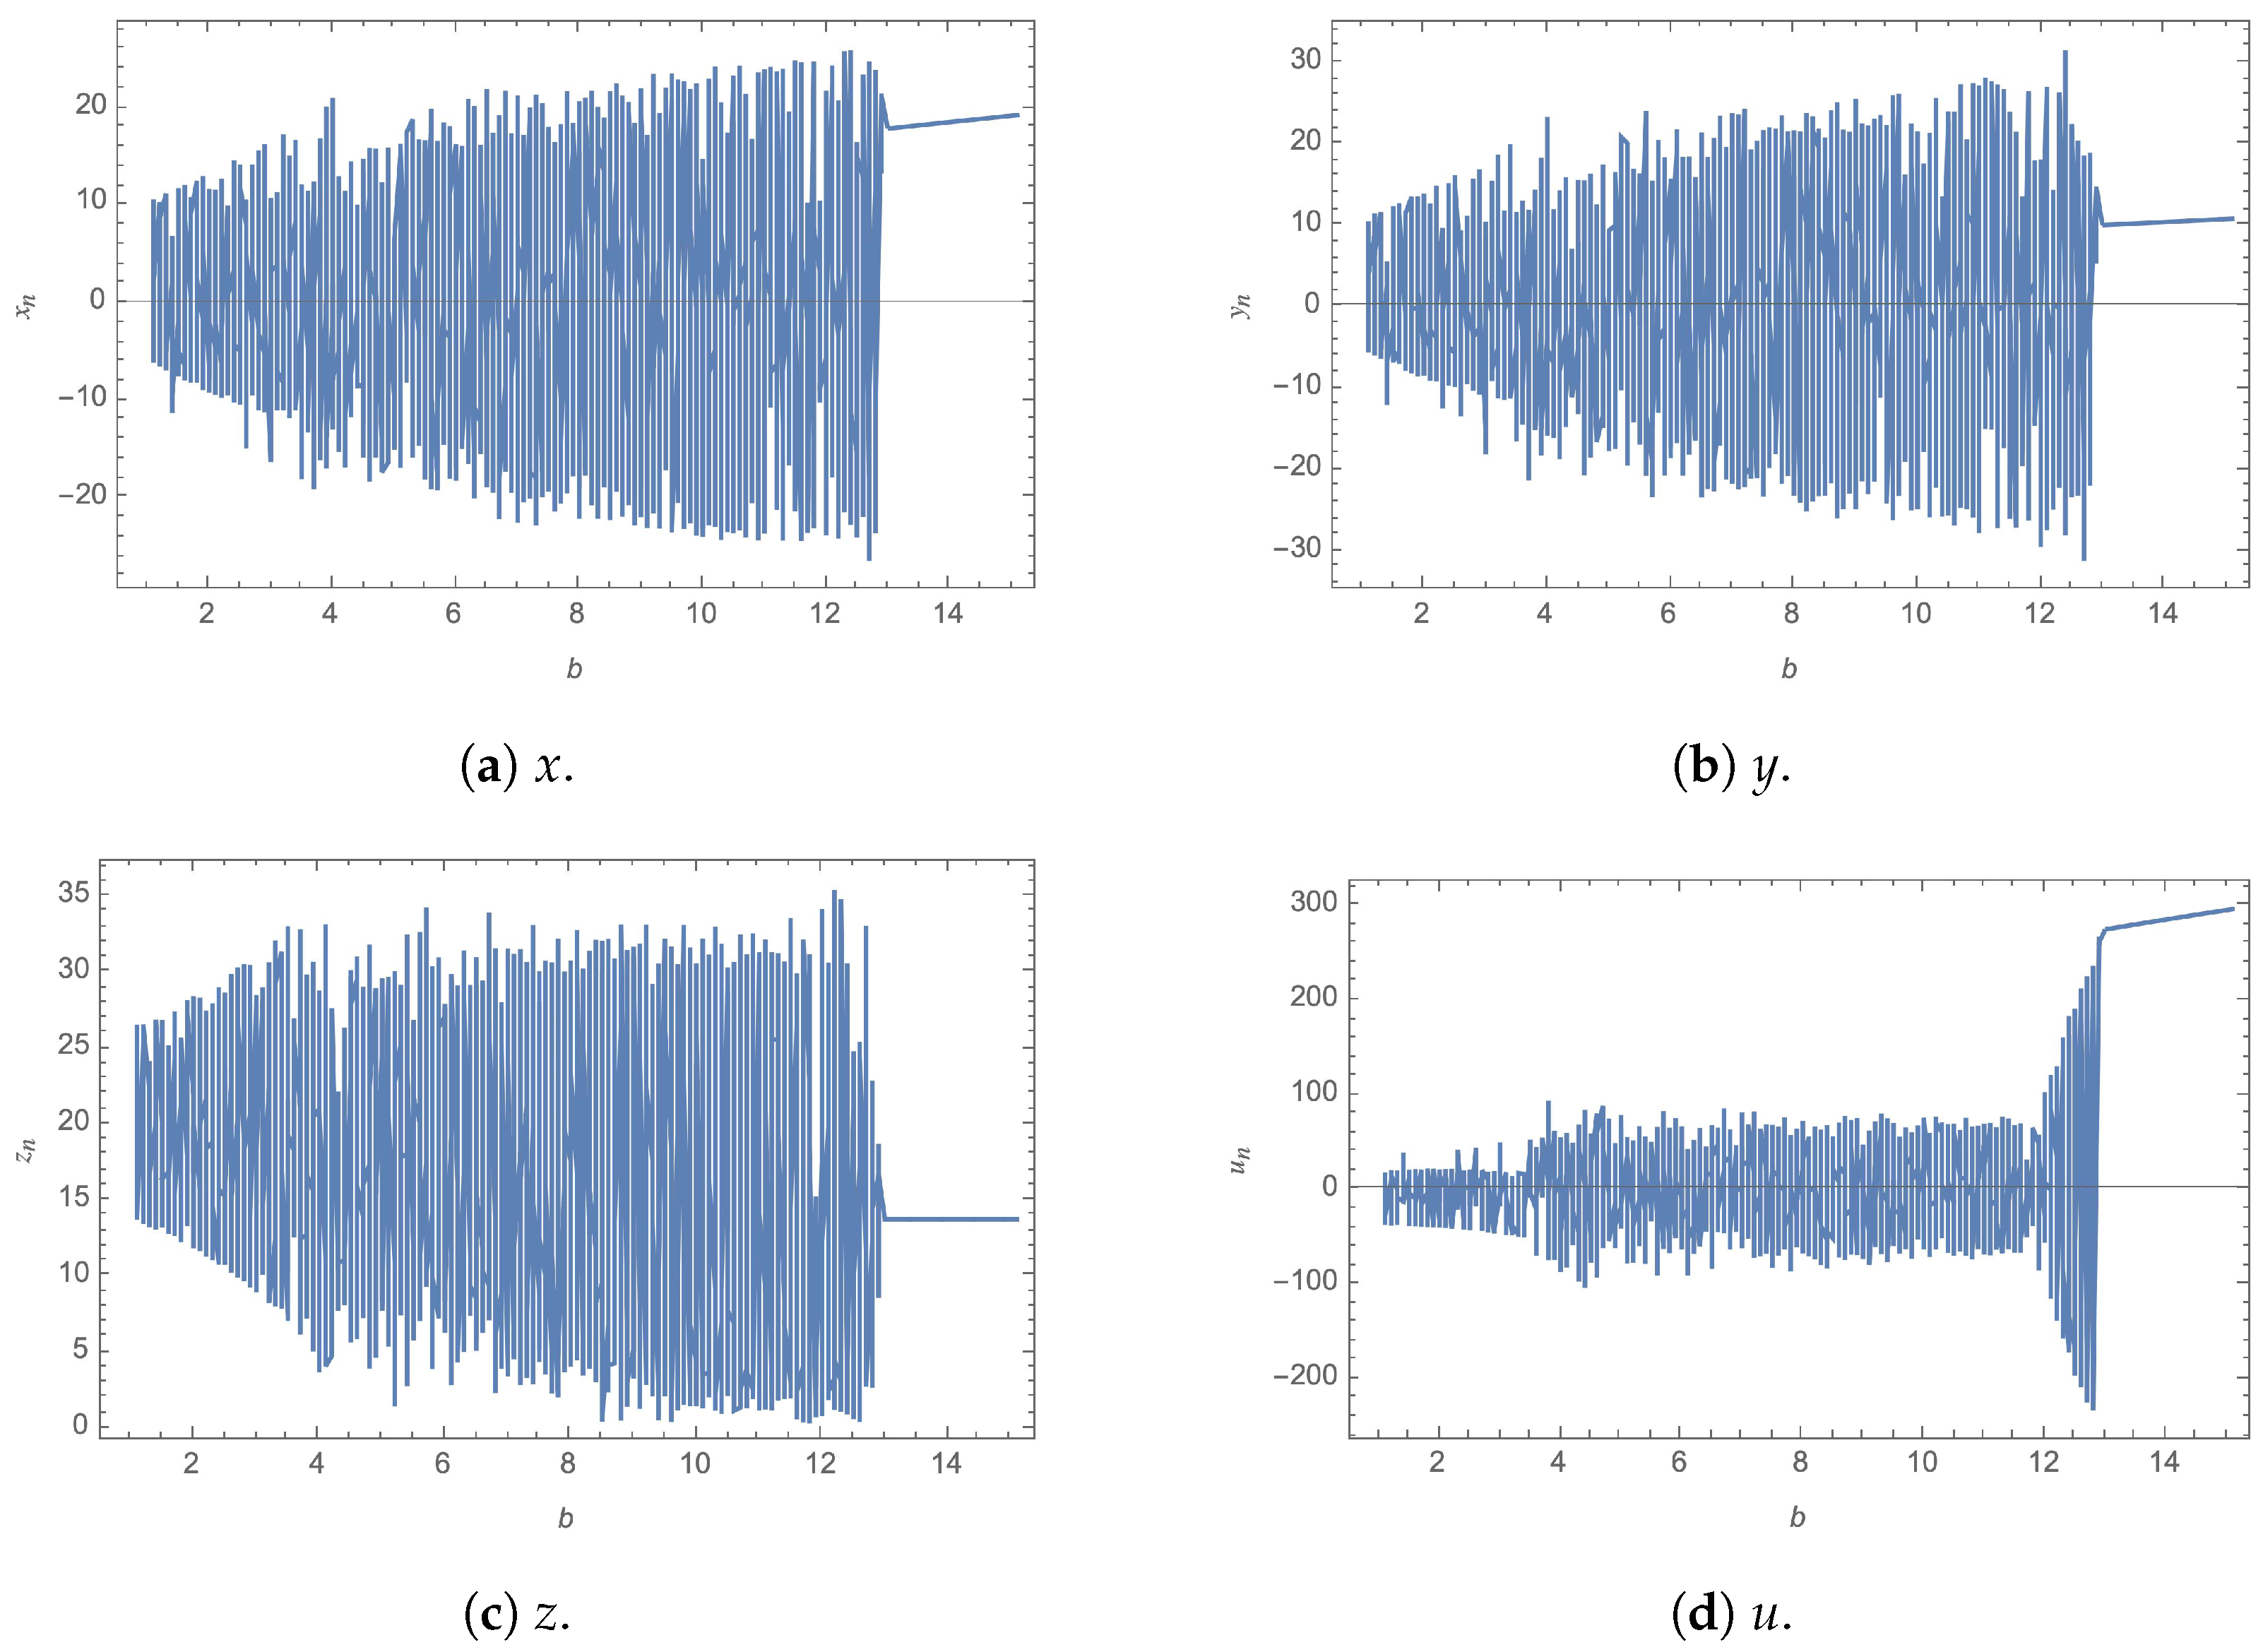
Figure 2.
Bifurcation plots of the fractional order 4D Chen system for and u against b.
Figure 2.
Bifurcation plots of the fractional order 4D Chen system for and u against b.
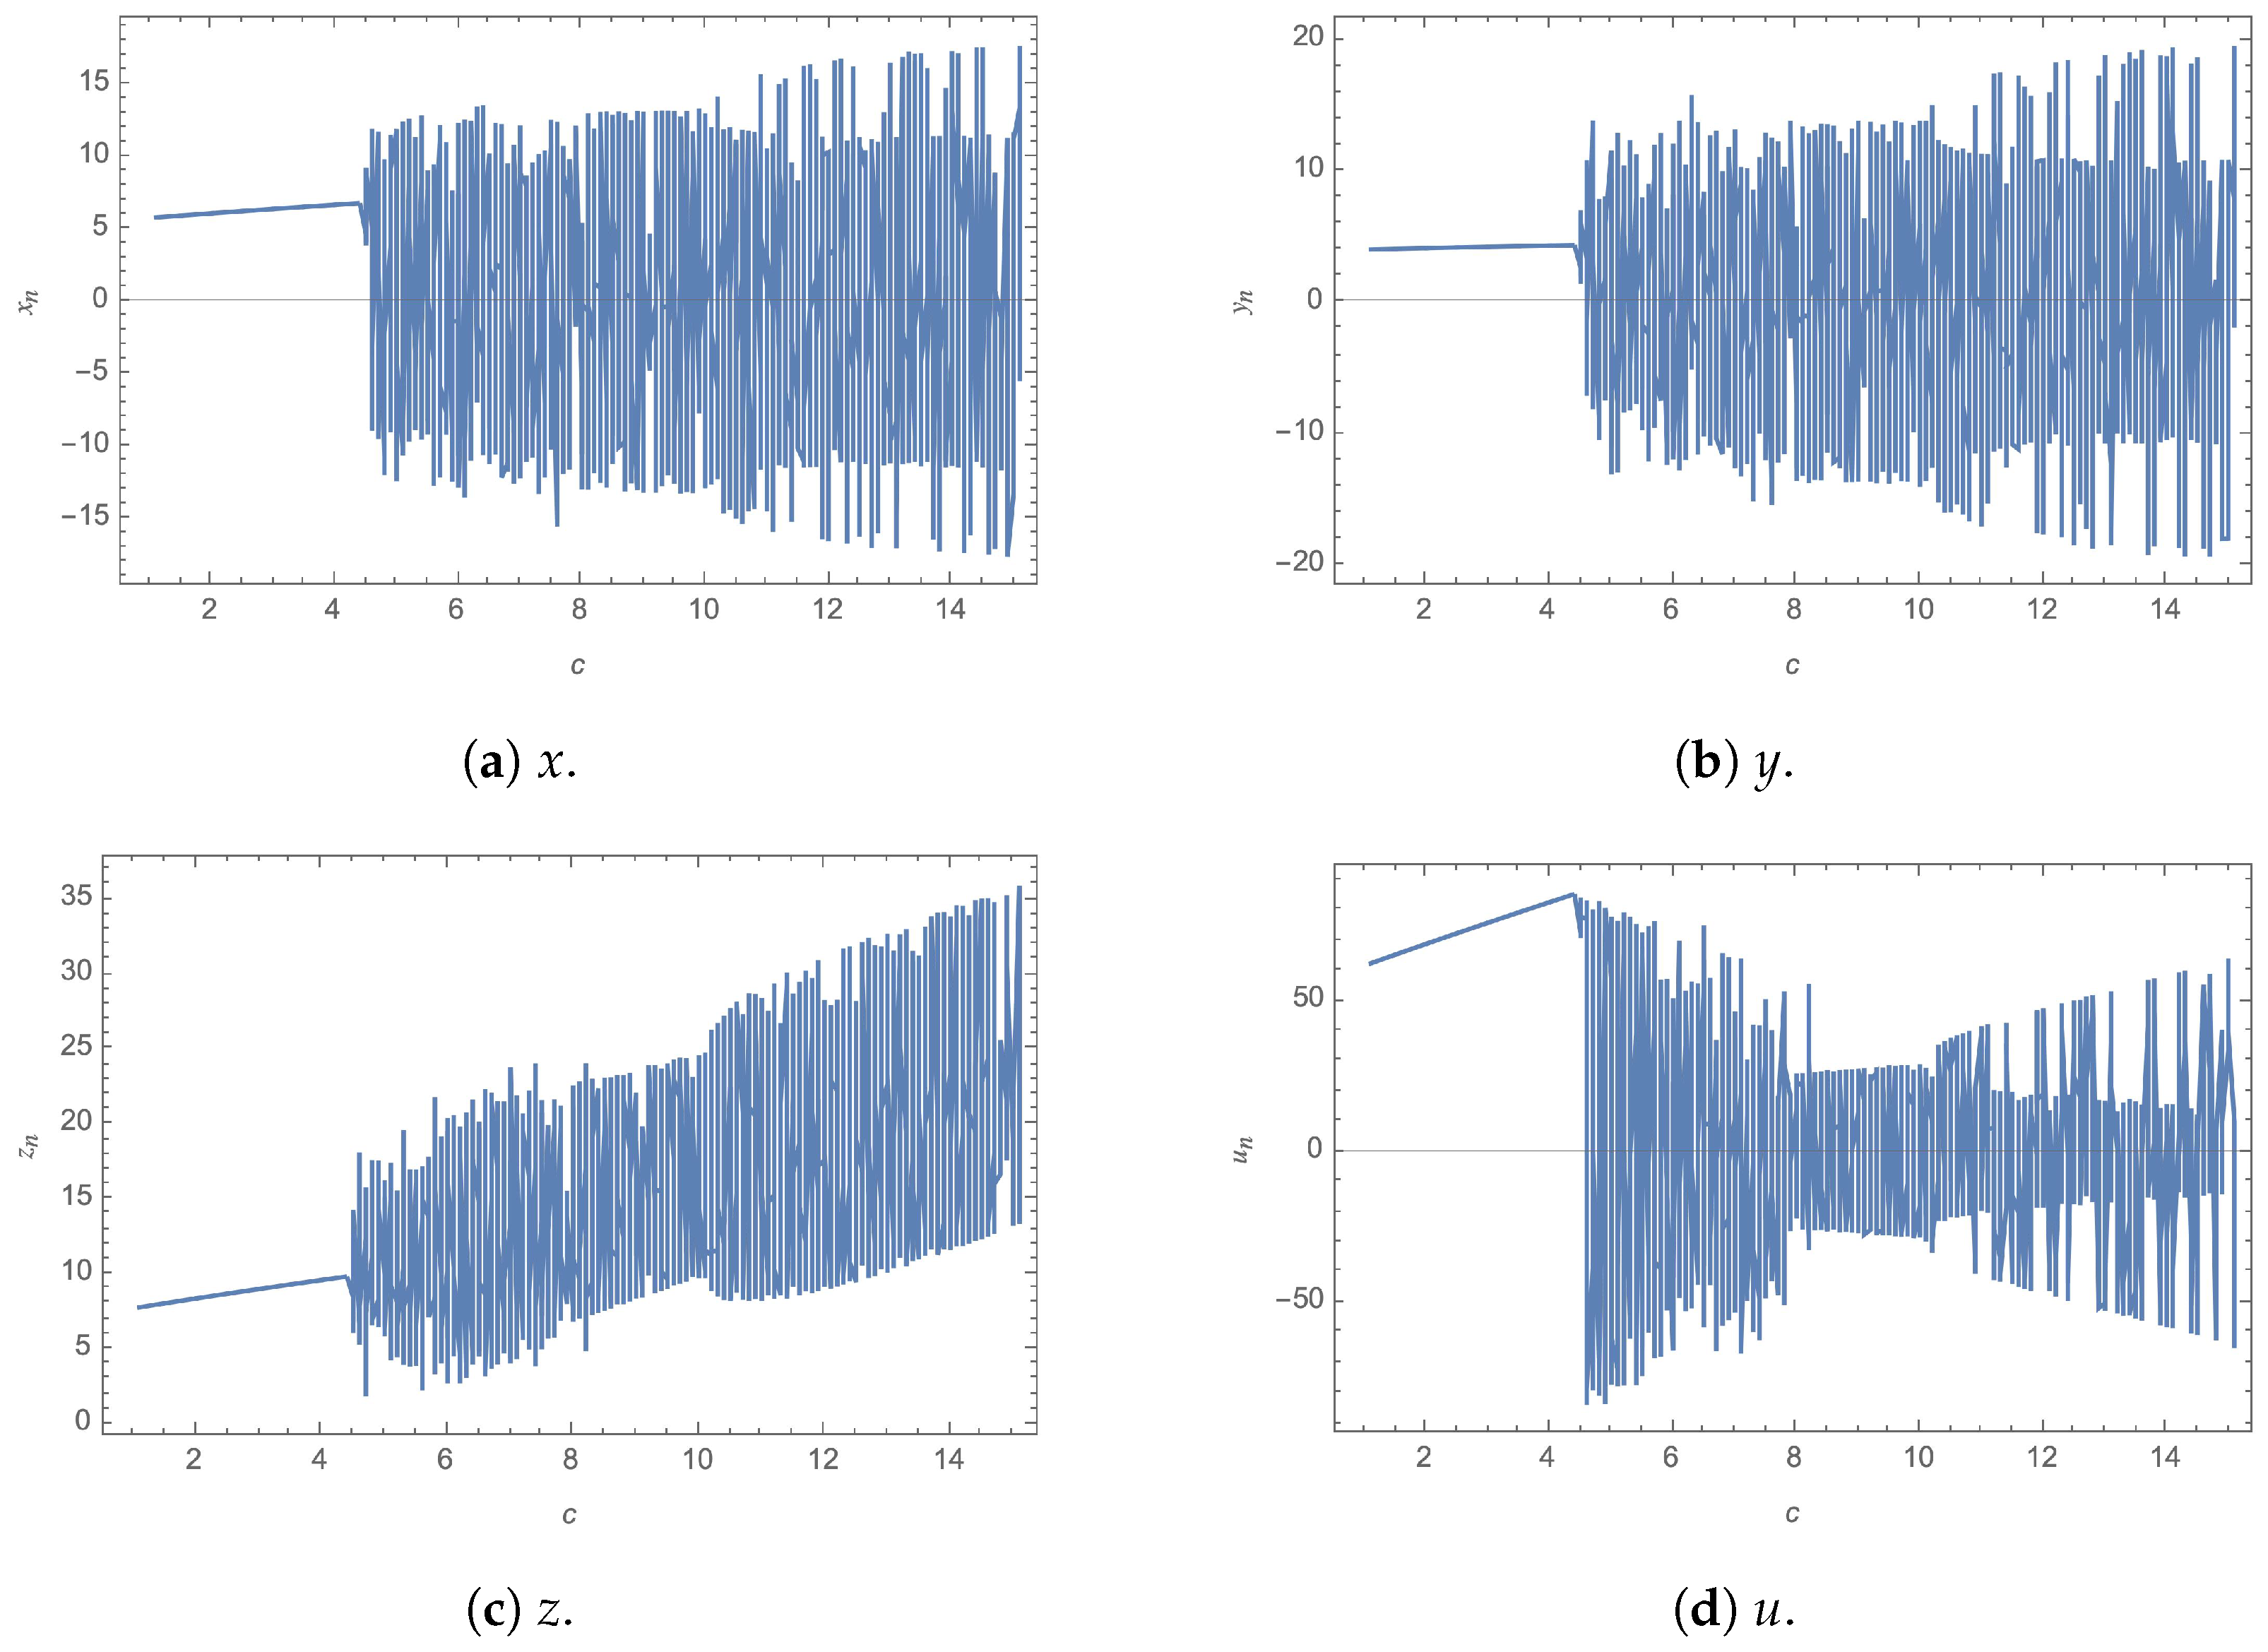
Figure 3.
Bifurcation plots of the fractional order 4D Chen system for and u against c.
Figure 3.
Bifurcation plots of the fractional order 4D Chen system for and u against c.
Figure 4.
A plot of the 4 Lyapunov characteristic exponents of the fractional order 4D Chen system.
Figure 4.
A plot of the 4 Lyapunov characteristic exponents of the fractional order 4D Chen system.
Figure 5.
Present state and next state for center cell of Rule 30 CA.
Figure 5.
Present state and next state for center cell of Rule 30 CA.
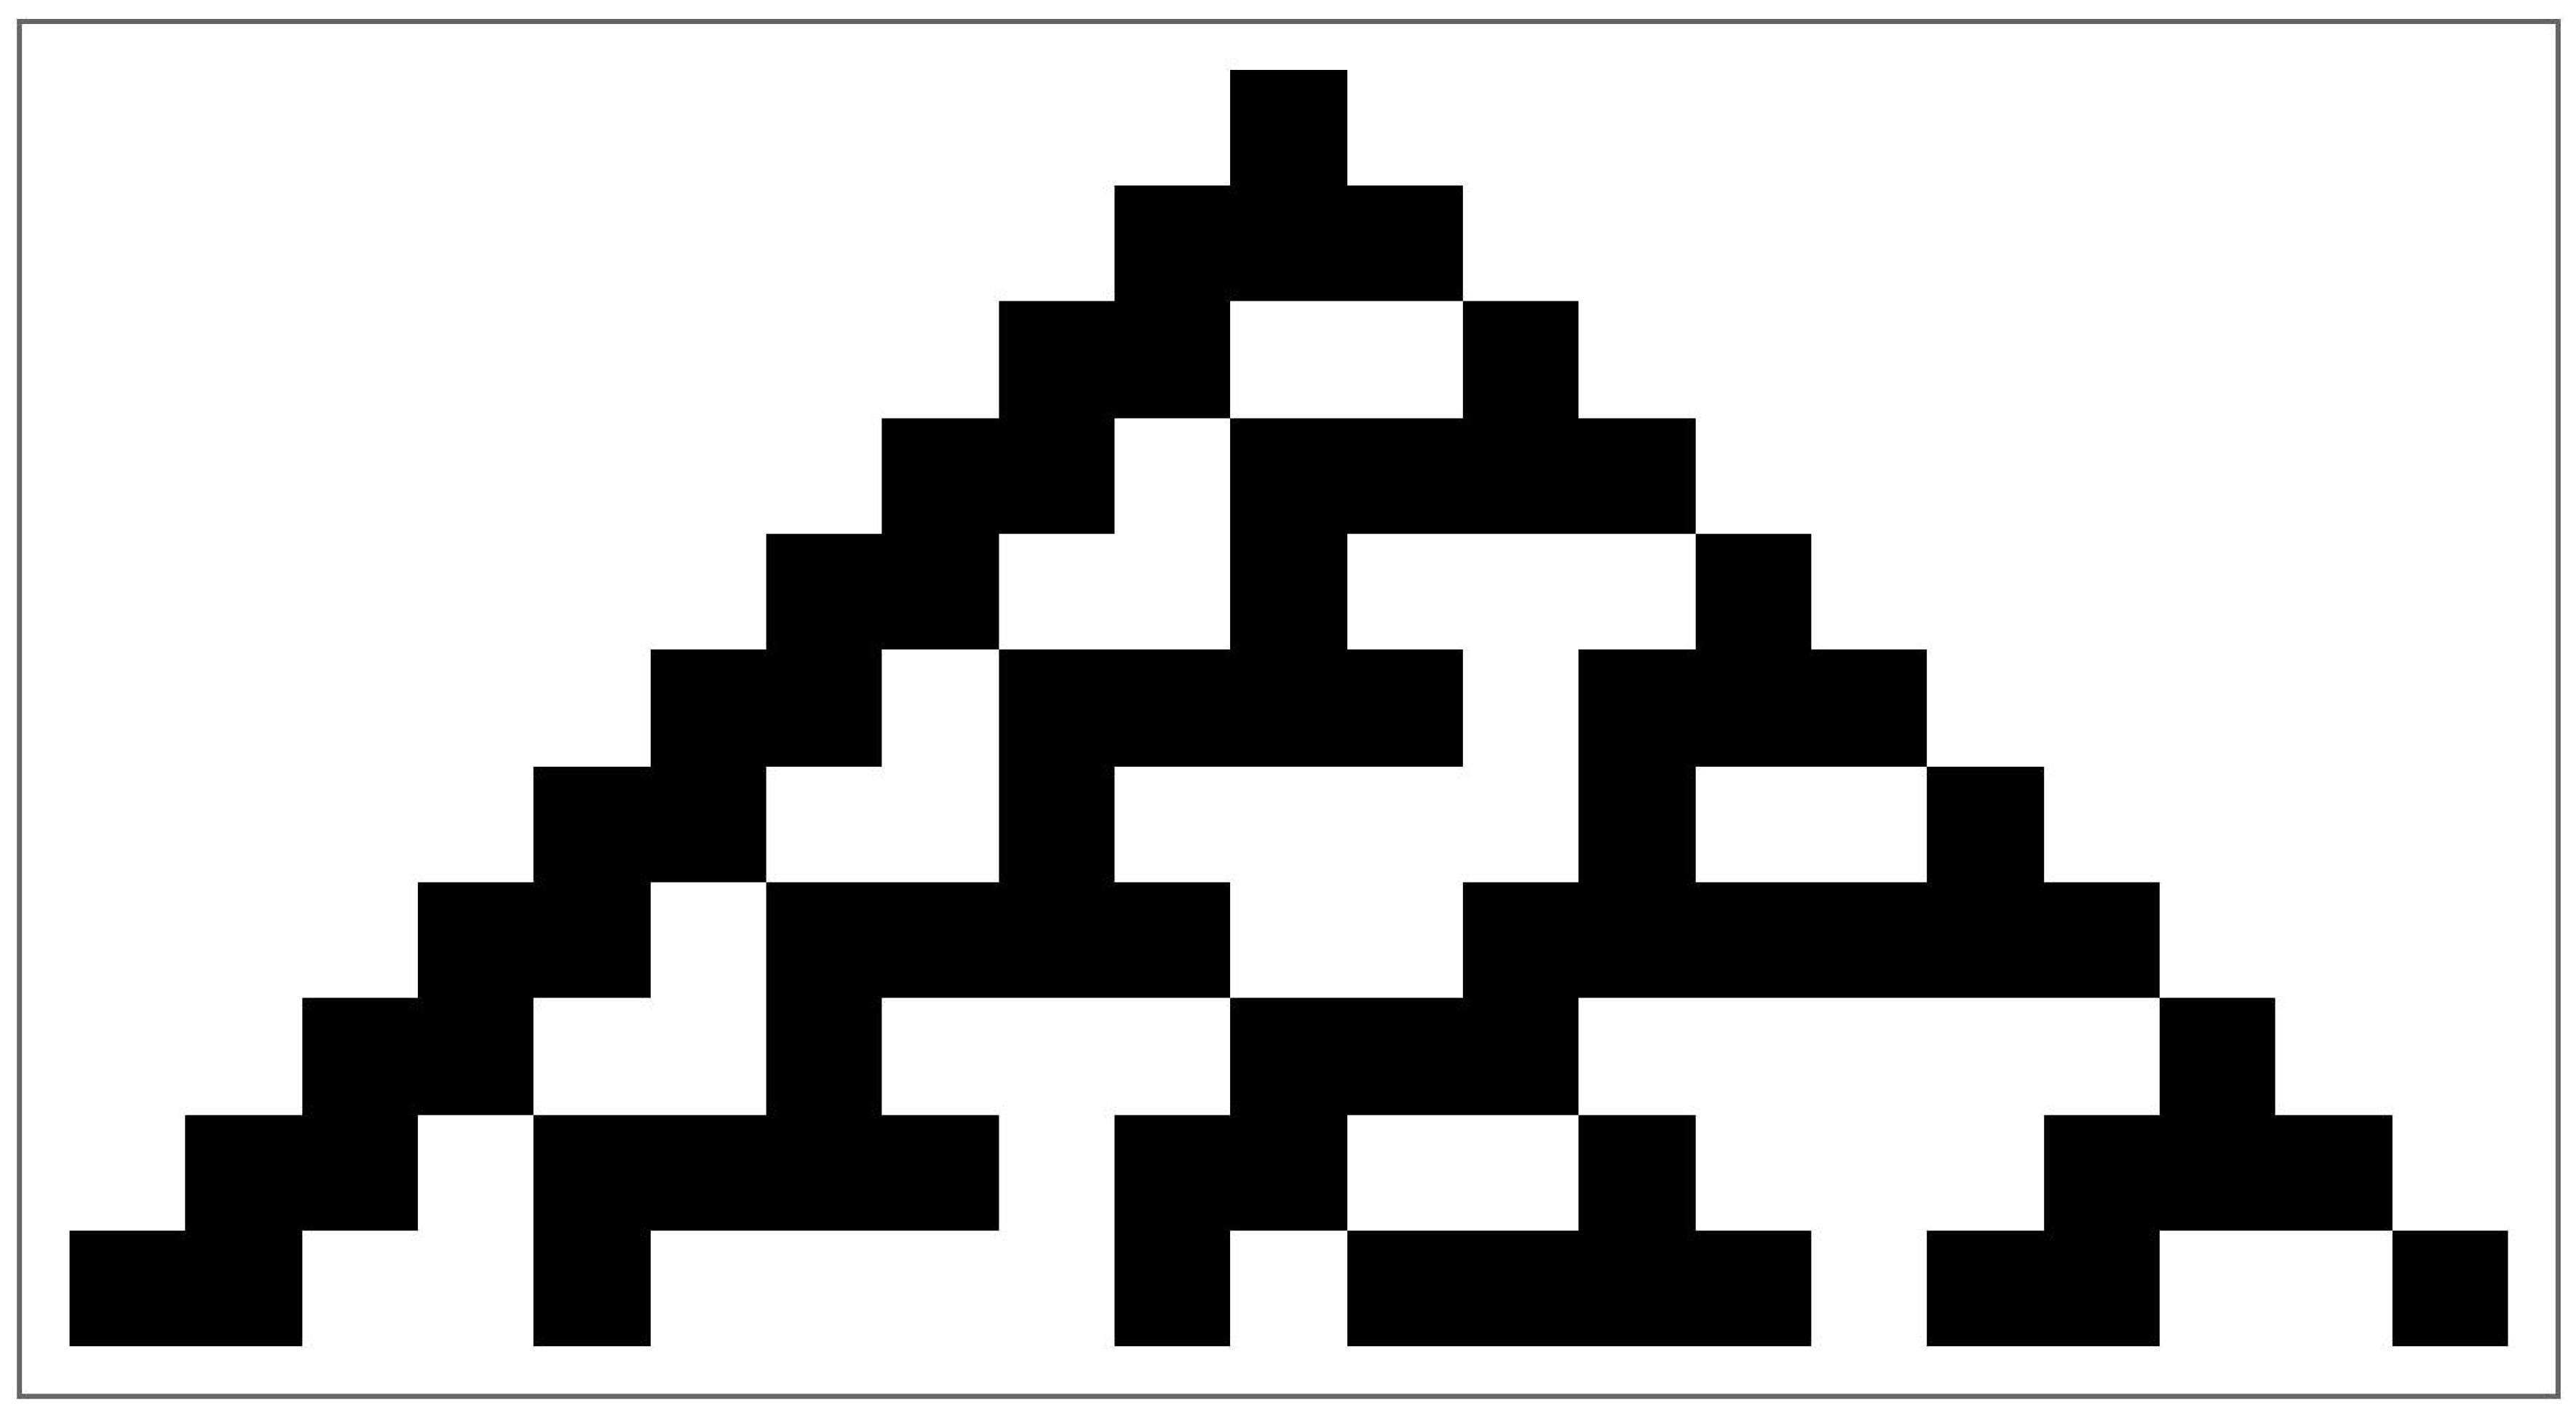
Figure 6.
A plot of the first 10 steps of Rule 30 CA.
Figure 6.
A plot of the first 10 steps of Rule 30 CA.
Figure 7.
A plot of the first 100 steps of Rule 30 CA.
Figure 7.
A plot of the first 100 steps of Rule 30 CA.
Figure 8.
Flow chart of the encryption process of the proposed image cryptosystem.
Figure 8.
Flow chart of the encryption process of the proposed image cryptosystem.
Figure 9.
Flow chart of the decryption process of the proposed image cryptosystem.
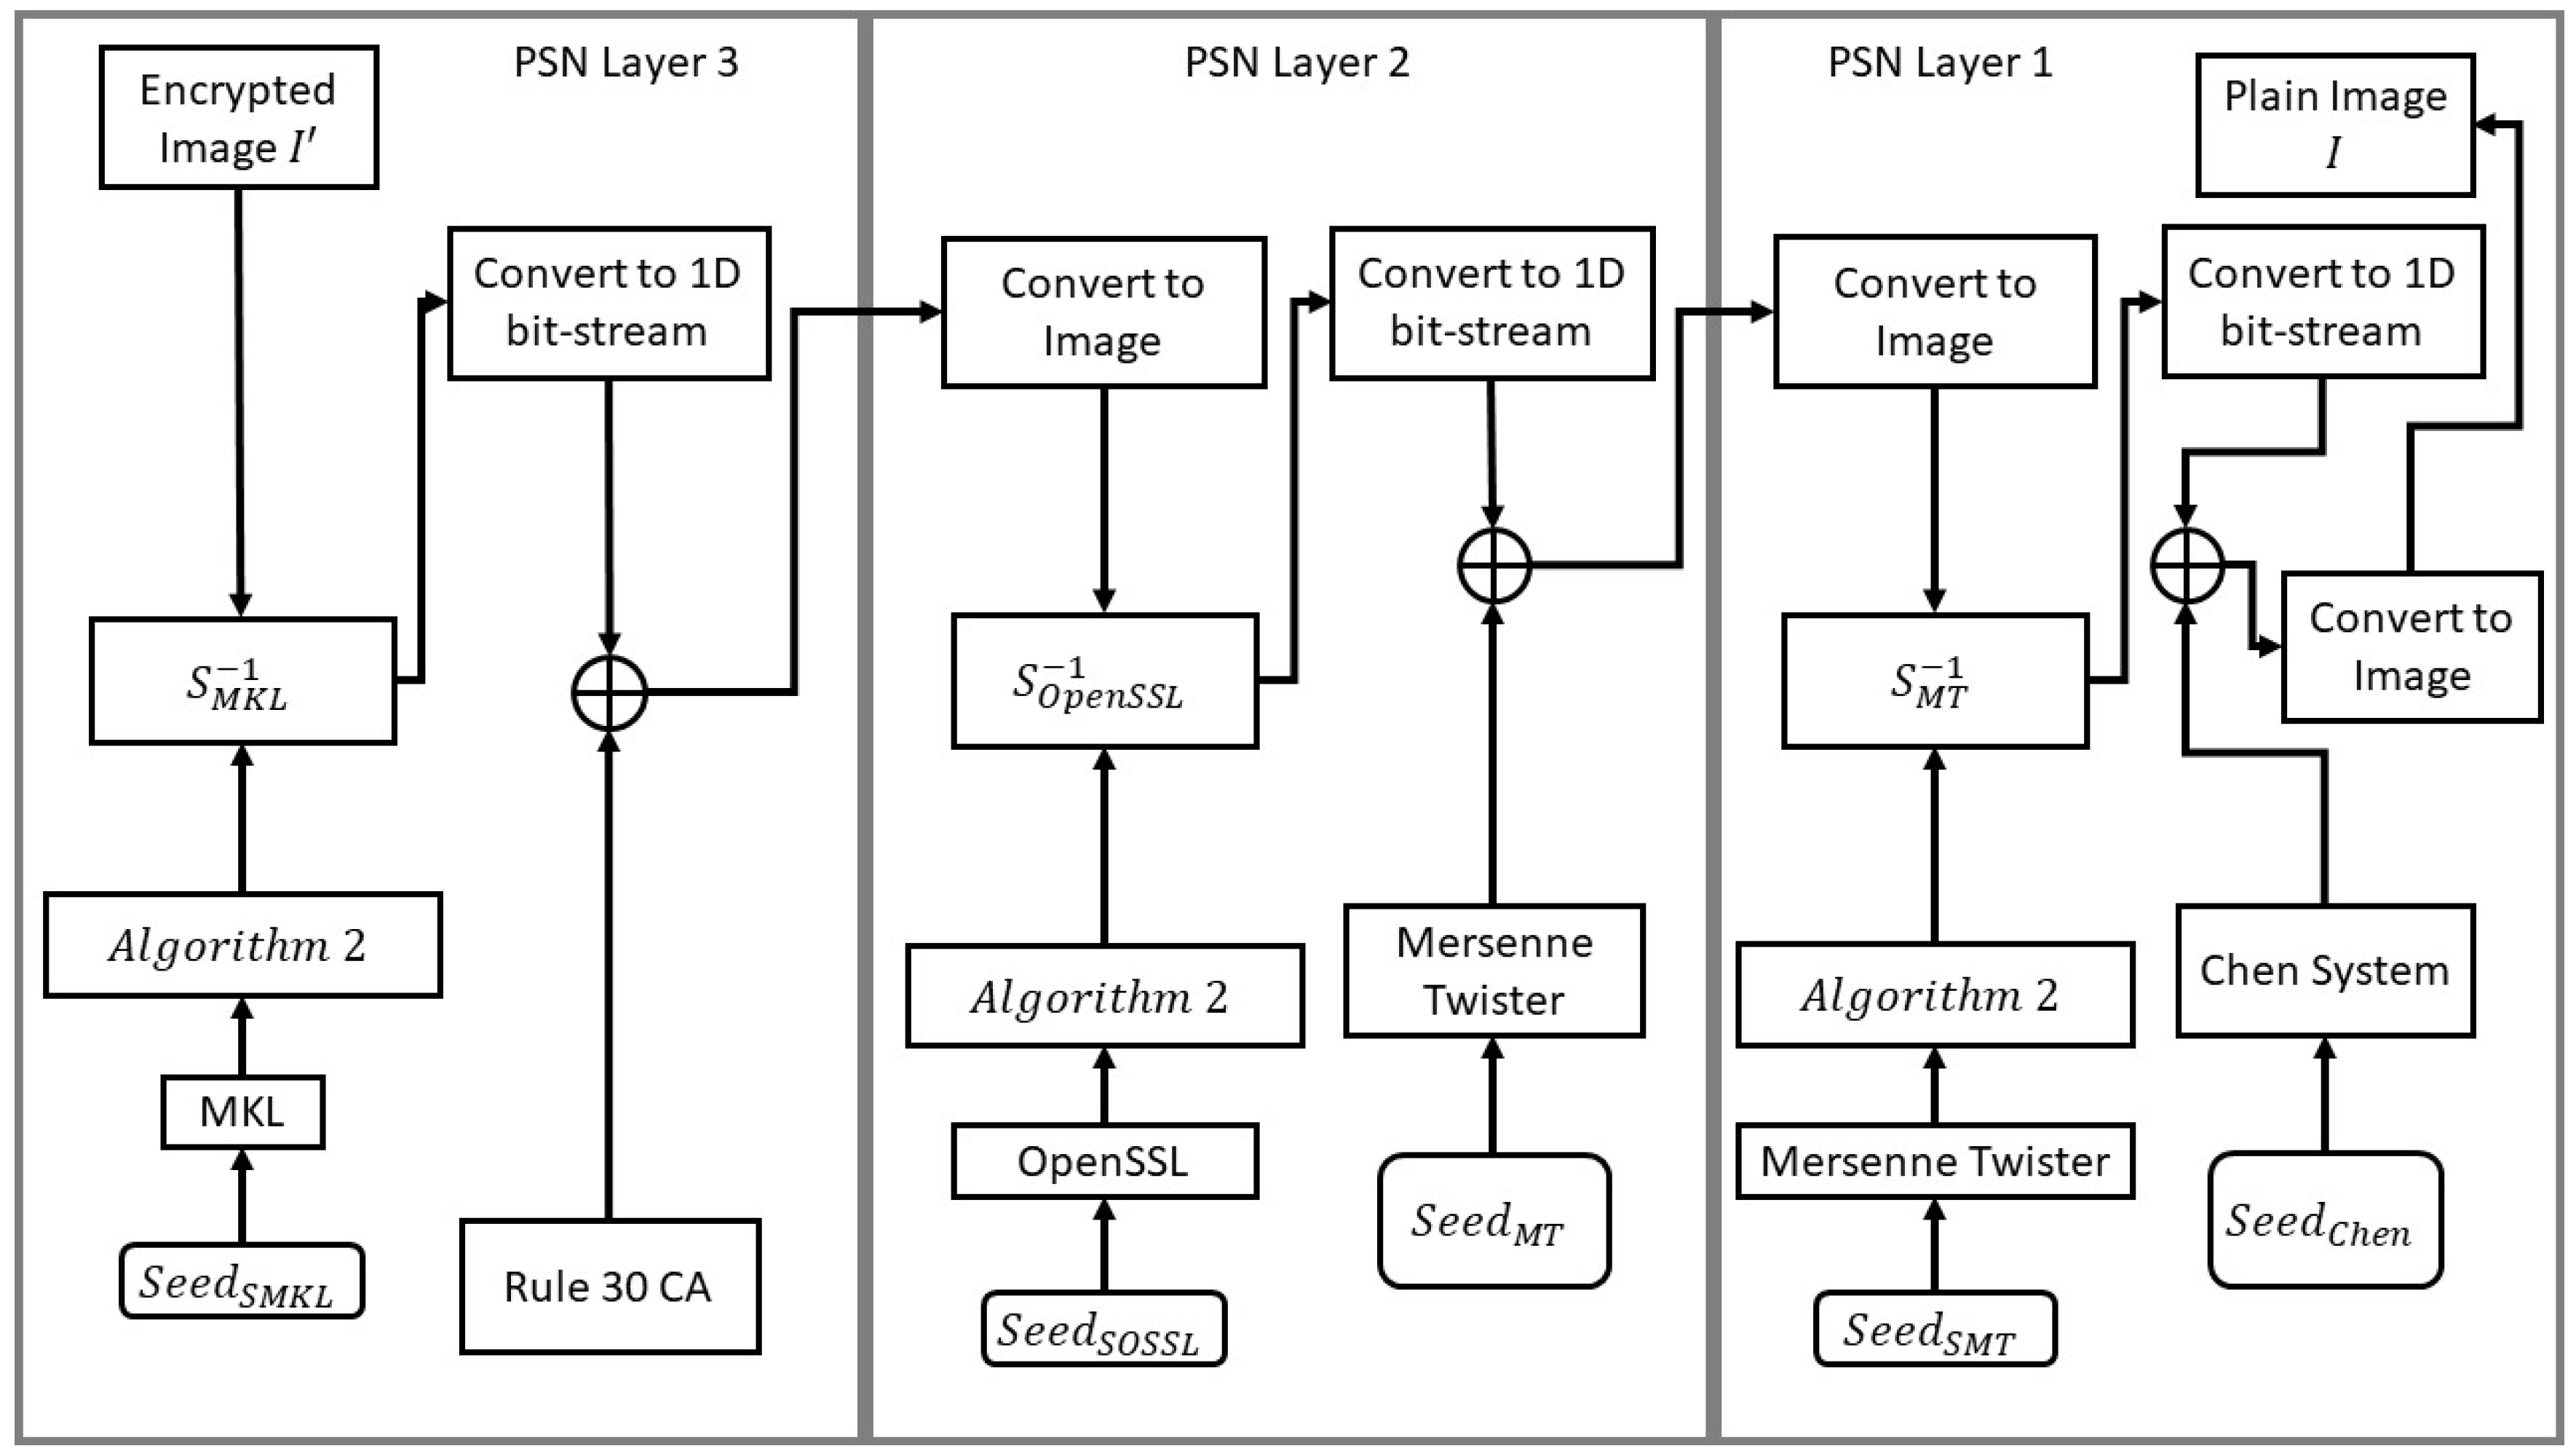
Figure 9.
Flow chart of the decryption process of the proposed image cryptosystem.
Figure 10.
Mandrill image and histogram comparison pre- and post-encryption.
Figure 10.
Mandrill image and histogram comparison pre- and post-encryption.
Figure 11.
Sailboat image and histogram comparison pre- and post-encryption.
Figure 11.
Sailboat image and histogram comparison pre- and post-encryption.
Figure 12.
Peppers image and histogram comparison pre- and post-encryption.
Figure 12.
Peppers image and histogram comparison pre- and post-encryption.
Figure 13.
House image and histogram comparison pre- and post-encryption.
Figure 13.
House image and histogram comparison pre- and post-encryption.
Figure 14.
House2 image and histogram comparison pre- and post-encryption.
Figure 14.
House2 image and histogram comparison pre- and post-encryption.
Figure 15.
Tree image alongside its Fourier transformation and 3D plot of its co-occurrence matrix pre- and post-encryption.
Figure 15.
Tree image alongside its Fourier transformation and 3D plot of its co-occurrence matrix pre- and post-encryption.
Figure 16.
2D plot of co-occurrence matrices of the Tree image pre- and post-encryption.
Figure 16.
2D plot of co-occurrence matrices of the Tree image pre- and post-encryption.
Figure 17.
2D plot of co-occurrence matrices of the red channel of the Tree image pre- and post-encryption.
Figure 17.
2D plot of co-occurrence matrices of the red channel of the Tree image pre- and post-encryption.
Figure 18.
2D plot of co-occurrence matrices of the green channel of the Tree image pre- and post-encryption.
Figure 18.
2D plot of co-occurrence matrices of the green channel of the Tree image pre- and post-encryption.
Figure 19.
2D plot of co-occurrence matrices of the blue channel of the Tree image pre- and post-encryption.
Figure 19.
2D plot of co-occurrence matrices of the blue channel of the Tree image pre- and post-encryption.
Figure 20.
Various occlusion attacks on encrypted images {(a),(b),(c)}, and their corresponding decrypted versions {(d),(e),(f)}.
Figure 20.
Various occlusion attacks on encrypted images {(a),(b),(c)}, and their corresponding decrypted versions {(d),(e),(f)}.
Figure 21.
Various salt-and-pepper noise attacks to a fraction f of the encrypted images {(a),(b),(c)}, and their corresponding decrypted versions {(d),(e),(f)}.
Figure 21.
Various salt-and-pepper noise attacks to a fraction f of the encrypted images {(a),(b),(c)}, and their corresponding decrypted versions {(d),(e),(f)}.
Figure 22.
Various zero-mean Gaussian noise attacks with standard deviation on the encrypted images {(a),(b),(c)}, and their corresponding decrypted versions {(d),(e),(f)}.
Figure 22.
Various zero-mean Gaussian noise attacks with standard deviation on the encrypted images {(a),(b),(c)}, and their corresponding decrypted versions {(d),(e),(f)}.
Table 4.
Comparison of MSE values with the literature.
Table 4.
Comparison of MSE values with the literature.
| Image |
Proposed |
[8] |
[29] |
[30] |
[31] |
[33] |
[61] |
| Lena |
|
|
|
|
|
|
N/A |
| Mandrill |
|
|
|
|
|
|
N/A |
| Peppers |
|
|
|
N/A |
|
|
N/A |
| House |
|
|
|
N/A |
N/A |
N/A |
N/A |
| House2 |
|
|
N/A |
N/A |
N/A |
N/A |
N/A |
| Girl |
|
|
N/A |
N/A |
N/A |
N/A |
N/A |
| Sailboat |
|
N/A |
N/A |
N/A |
N/A |
N/A |
N/A |
| Tree |
|
N/A |
N/A |
N/A |
N/A |
N/A |
N/A |
| Average |
|
|
|
10900 |
|
|
N/A |
Table 5.
Comparison of PSNR values, in dB, with the literature.
Table 5.
Comparison of PSNR values, in dB, with the literature.
| Image |
Proposed |
[8] |
[29] |
[30] |
[31] |
[33] |
[61] |
| Lena |
|
|
|
|
|
|
|
| Mandrill |
|
|
|
|
|
|
|
| Peppers |
|
|
|
N/A |
|
N/A |
N/A |
| House |
|
|
|
N/A |
N/A |
N/A |
N/A |
| House2 |
|
|
N/A |
N/A |
N/A |
N/A |
N/A |
| Girl |
|
|
N/A |
N/A |
N/A |
N/A |
N/A |
| Sailboat |
|
N/A |
N/A |
N/A |
N/A |
N/A |
N/A |
| Tree |
|
N/A |
N/A |
N/A |
N/A |
N/A |
N/A |
| Average |
|
|
|
|
|
|
|
Table 6.
Comparison of MAE values with the literature.
Table 6.
Comparison of MAE values with the literature.
| Image |
Proposed |
[8] |
[33] |
[30] |
[62] |
[61] |
| Lena |
|
|
|
87 |
|
|
| Peppers |
|
|
|
N/A |
|
N/A |
| Mandrill |
|
|
|
92 |
|
|
| House |
|
N/A |
N/A |
N/A |
N/A |
N/A |
| House 2 |
|
N/A |
N/A |
N/A |
N/A |
N/A |
| Girl |
|
N/A |
N/A |
N/A |
N/A |
N/A |
| Sailboat |
|
N/A |
N/A |
N/A |
N/A |
N/A |
| Tree |
|
N/A |
N/A |
N/A |
N/A |
N/A |
| Average |
|
|
|
|
|
|
Table 7.
Comparison of information entropy values with the literature.
Table 7.
Comparison of information entropy values with the literature.
| Image |
Proposed |
[8] |
[29] |
[30] |
[63] |
[31] |
[33] |
[61] |
| Lena |
|
|
|
|
|
|
|
|
| Mandrill |
|
|
|
|
|
N/A |
|
|
| Peppers |
|
|
|
|
N/A |
|
|
N/A |
| House |
|
|
|
N/A |
N/A |
N/A |
N/A |
N/A |
| House2 |
|
|
N/A |
N/A |
N/A |
N/A |
N/A |
N/A |
| Girl |
|
|
N/A |
N/A |
N/A |
N/A |
N/A |
N/A |
| Sailboat |
|
N/A |
N/A |
N/A |
N/A |
N/A |
N/A |
N/A |
| Tree |
|
N/A |
N/A |
N/A |
N/A |
N/A |
N/A |
N/A |
| Average |
|
|
|
|
|
|
|
|
Table 8.
Correlation coefficients of plain and encrypted images.
Table 8.
Correlation coefficients of plain and encrypted images.
| Plain image |
Encrypted image |
| Correlation coefficient |
Correlation coefficient |
| Image |
Horizontal |
Diagonal |
Vertical |
Horizontal |
Diagonal |
Vertical |
| Lena |
|
|
|
|
|
|
| Peppers |
|
|
|
|
|
|
| Mandrill |
|
|
|
|
|
|
Table 9.
Comparison of correlation coefficient values with the literature, for plain and encrypted Lena images.
Table 9.
Comparison of correlation coefficient values with the literature, for plain and encrypted Lena images.
| Scheme |
Horizontal |
Diagonal |
Vertical |
| Proposed |
|
|
|
| [8] |
|
|
|
| [30] |
|
|
|
| [33] |
|
|
|
| [61] |
|
|
|
| [64] |
|
|
|
Table 10.
Comparison of correlation coefficient values with the literature, in 3 directions, for plain and encrypted Lena images, computed for each color channel separately.
Table 10.
Comparison of correlation coefficient values with the literature, in 3 directions, for plain and encrypted Lena images, computed for each color channel separately.
| Channel |
Direction |
Plain image |
Encrypted image |
[65] |
[66] |
[67] |
[33] |
| Red |
Horizontal |
|
|
|
|
|
|
| |
Diagonal |
|
|
|
|
|
|
| |
Vertical |
|
|
|
|
|
|
| Green |
Horizontal |
|
|
|
|
|
|
| |
Diagonal |
|
|
|
|
|
|
| |
Vertical |
|
|
|
|
|
|
| Blue |
Horizontal |
|
|
|
|
|
|
| |
Diagonal |
|
|
|
|
|
|
| |
Vertical |
|
|
|
|
|
|
Table 11.
NPCR and UACI of various images.
Table 11.
NPCR and UACI of various images.
| Metric |
Image |
Result |
| NPCR |
Lena |
|
| Peppers |
|
| Mandrill |
|
| House |
|
| House2 |
|
| Girl |
|
| Sailboat |
|
| Tree |
|
| |
Average |
|
| UACI |
Lena |
|
| Peppers |
|
| Mandrill |
|
| House |
2 |
| House2 |
|
| Girl |
|
| Sailboat |
|
| Tree |
|
| |
Average |
|
Table 12.
Comparison of NPCR and UACI values computed for various images’ color channels.
Table 12.
Comparison of NPCR and UACI values computed for various images’ color channels.
| Metric |
Image |
Color Channel |
Proposed |
[33] |
[68] |
| NPCR |
Lena |
Red |
|
|
|
| Green |
|
|
|
| Blue |
|
|
|
| Peppers |
Red |
|
|
|
| Green |
|
|
|
| Blue |
|
|
|
| Mandrill |
Red |
|
|
|
| Green |
|
|
|
| Blue |
|
|
|
| UACI |
Lena |
Red |
|
|
|
| Green |
|
|
|
| Blue |
|
|
|
| Peppers |
Red |
|
|
|
| Green |
|
|
|
| Blue |
|
|
|
| Mandrill |
Red |
|
|
|
| Green |
|
|
|
| Blue |
|
|
|
Table 13.
Comparison of NPCR and UACI values of the Lena image.
Table 13.
Comparison of NPCR and UACI values of the Lena image.
| Scheme |
NPCR |
UACI |
| Proposed |
99.5855 |
30.3873 |
| [30] |
|
|
| [33] |
|
|
| [32] |
|
|
| [61] |
|
|
| [69] |
|
|
Table 14.
NIST analysis on Lena encrypted image.
Table 14.
NIST analysis on Lena encrypted image.
| Test name |
Value |
Remarks |
| Frequency |
|
Success |
| Block Frequency |
|
Success |
| Run |
|
Success |
| Longest run of ones |
|
Success |
| Rank |
|
Success |
| Spectral FFT |
|
Success |
| Non overlapping |
|
Success |
| Overlapping |
|
Success |
| Universal |
|
Success |
| Linear complexity |
|
Success |
| Serial |
|
Success |
| Approximate Entropy |
|
Success |
| Cumulative sum (forward) |
|
Success |
| Cumulative sum (reverse) |
|
Success |
Table 15.
Key space values comparison.
Table 15.
Key space values comparison.
| Algorithm |
Key space |
| Proposed |
|
| [8] |
|
| [32] |
|
| [61] |
|
| [64] |
|
| [71] |
|
| [73] |
|
| [74] |
|
| [75] |
|
| [76] |
|
Table 16.
Histogram dependency tests for various images.
Table 16.
Histogram dependency tests for various images.
| Image |
Color |
(31) |
(32) |
(33) |
(34) |
r (35) |
| Lena |
Red |
|
|
|
|
|
| Green |
|
|
|
|
|
| Blue |
|
|
|
|
|
| Combined |
|
|
|
|
|
| Peppers |
Red |
|
|
|
|
|
| Green |
|
|
|
|
|
| Blue |
|
|
|
|
|
| Combined |
|
|
|
|
|
| Mandrill |
Red |
|
|
|
|
|
| Green |
|
|
|
|
|
| Blue |
|
|
|
|
|
| Combined |
|
|
|
|
|
| House |
Red |
|
|
|
|
|
| Green |
|
|
|
|
|
| Blue |
|
|
|
|
|
| Combined |
|
|
|
|
|
| House2 |
Red |
|
|
|
|
|
| Green |
|
|
|
|
|
| Blue |
|
|
|
|
|
| Combined |
|
|
|
|
|
| Girl |
Red |
|
|
|
|
|
| Green |
|
|
|
|
|
| Blue |
|
|
|
|
|
| Combined |
|
|
|
|
|
| Sailboat |
Red |
|
|
|
|
|
| Green |
|
|
|
|
|
| Blue |
|
|
|
|
|
| Combined |
|
|
|
|
|
| Tree |
Red |
|
|
|
|
|
| Green |
|
|
|
|
|
| Blue |
|
|
|
|
|
| Combined |
0 |
|
|
|
|
Table 17.
Encryption time, decryption time, and their added values for the proposed image cryptosystem, for the House image at various dimensions.
Table 17.
Encryption time, decryption time, and their added values for the proposed image cryptosystem, for the House image at various dimensions.
| Image Dimensions |
[s]
|
[s]
|
[s]
|
|
|
|
|
|
|
|
|
|
|
|
|
|
|
|
|
|
|
|
|
Table 18.
A comparison of the encryption time for various algorithms from the literature for a Lena image with dimensions .
Table 18.
A comparison of the encryption time for various algorithms from the literature for a Lena image with dimensions .
| Algorithm |
[s]
|
Machine specifications (CPU and RAM) |
| Proposed |
|
2.9 GHz Intel® CoreTM i9, 32 GB |
| [8] |
|
2.9 GHz Intel® CoreTM i9, 32 GB |
| [20] |
|
2.9 GHz Intel® CoreTM i9, 32 GB |
| [32] |
|
3.4 GHz Intel®
|
| [61] |
|
2.7 GHz Intel® CoreTM i7, 8 GB |
| [76] |
|
N/A |
| [79] |
|
3.4 GHz Intel® CoreTM i7, 8 GB |
| [80] |
|
3.4 GHz Intel® CoreTM i3, 4 GB |
| Metric |
Optimal |
MT |
OpenSSL |
Intel’s MKL |
| Nonlinearity |
112 |
108 |
108 |
108 |
| SAC |
|
|
|
|
| BIC |
112 |
92 |
112 |
104 |
| LAP |
|
|
|
|
| DAP |
|
|
|
|
Table 20.
Comparison among the proposed S-boxes and those provided in the literature.
Table 20.
Comparison among the proposed S-boxes and those provided in the literature.
| S-box |
NL |
SAC |
BIC |
LAP |
DAP |
| Proposed, MT |
108 |
|
92 |
|
|
| Proposed, OpenSSL |
108 |
|
112 |
|
|
| Proposed, Intel’s MKL |
108 |
|
104 |
|
|
| AES [17] |
112 |
|
112 |
|
|
| Khan et al. [30] |
111 |
|
110 |
|
|
| Zahid et al. [87] |
107 |
|
|
|
|
| Aboytes et al. [88] |
112 |
|
112 |
|
|
| Hayat et al. [89] |
100 |
|
|
|
|
| Nasir et al. (S4) [90] |
112 |
|
112 |
|
|
Table 21.
Description of various types of attacks.
Table 21.
Description of various types of attacks.
| Attack |
Needed information by cryptanalyst |
| Ciphertext only |
1. Cryptosystem |
| 2. Encrypted image to be decoded |
| Known plaintext |
1. Cryptosystem |
| 2. Encrypted image to be decoded |
| 3. Plain image and corresponding encrypted image with the encryption key |
| Chosen ciphertext |
1. Cryptosystem |
| 2. Encrypted image to be decoded |
| 3. Reported encrypted image chosen by cryptanalyst alongside its corresponding plain image generated with the cryptosystem and decryption key |
| Chosen plaintext |
1. Cryptosystem |
| 2. Encrypted image to be decoded |
| 3. Reported plain image chosen by cryptanalyst alongside its corresponding encrypted image generated with the cryptosystem and encryption key |
