Submitted:
16 March 2023
Posted:
16 March 2023
You are already at the latest version
Abstract
Keywords:
1. INTRODUCTION
2. EXPERIMENTAL
2.1. Raw Materials
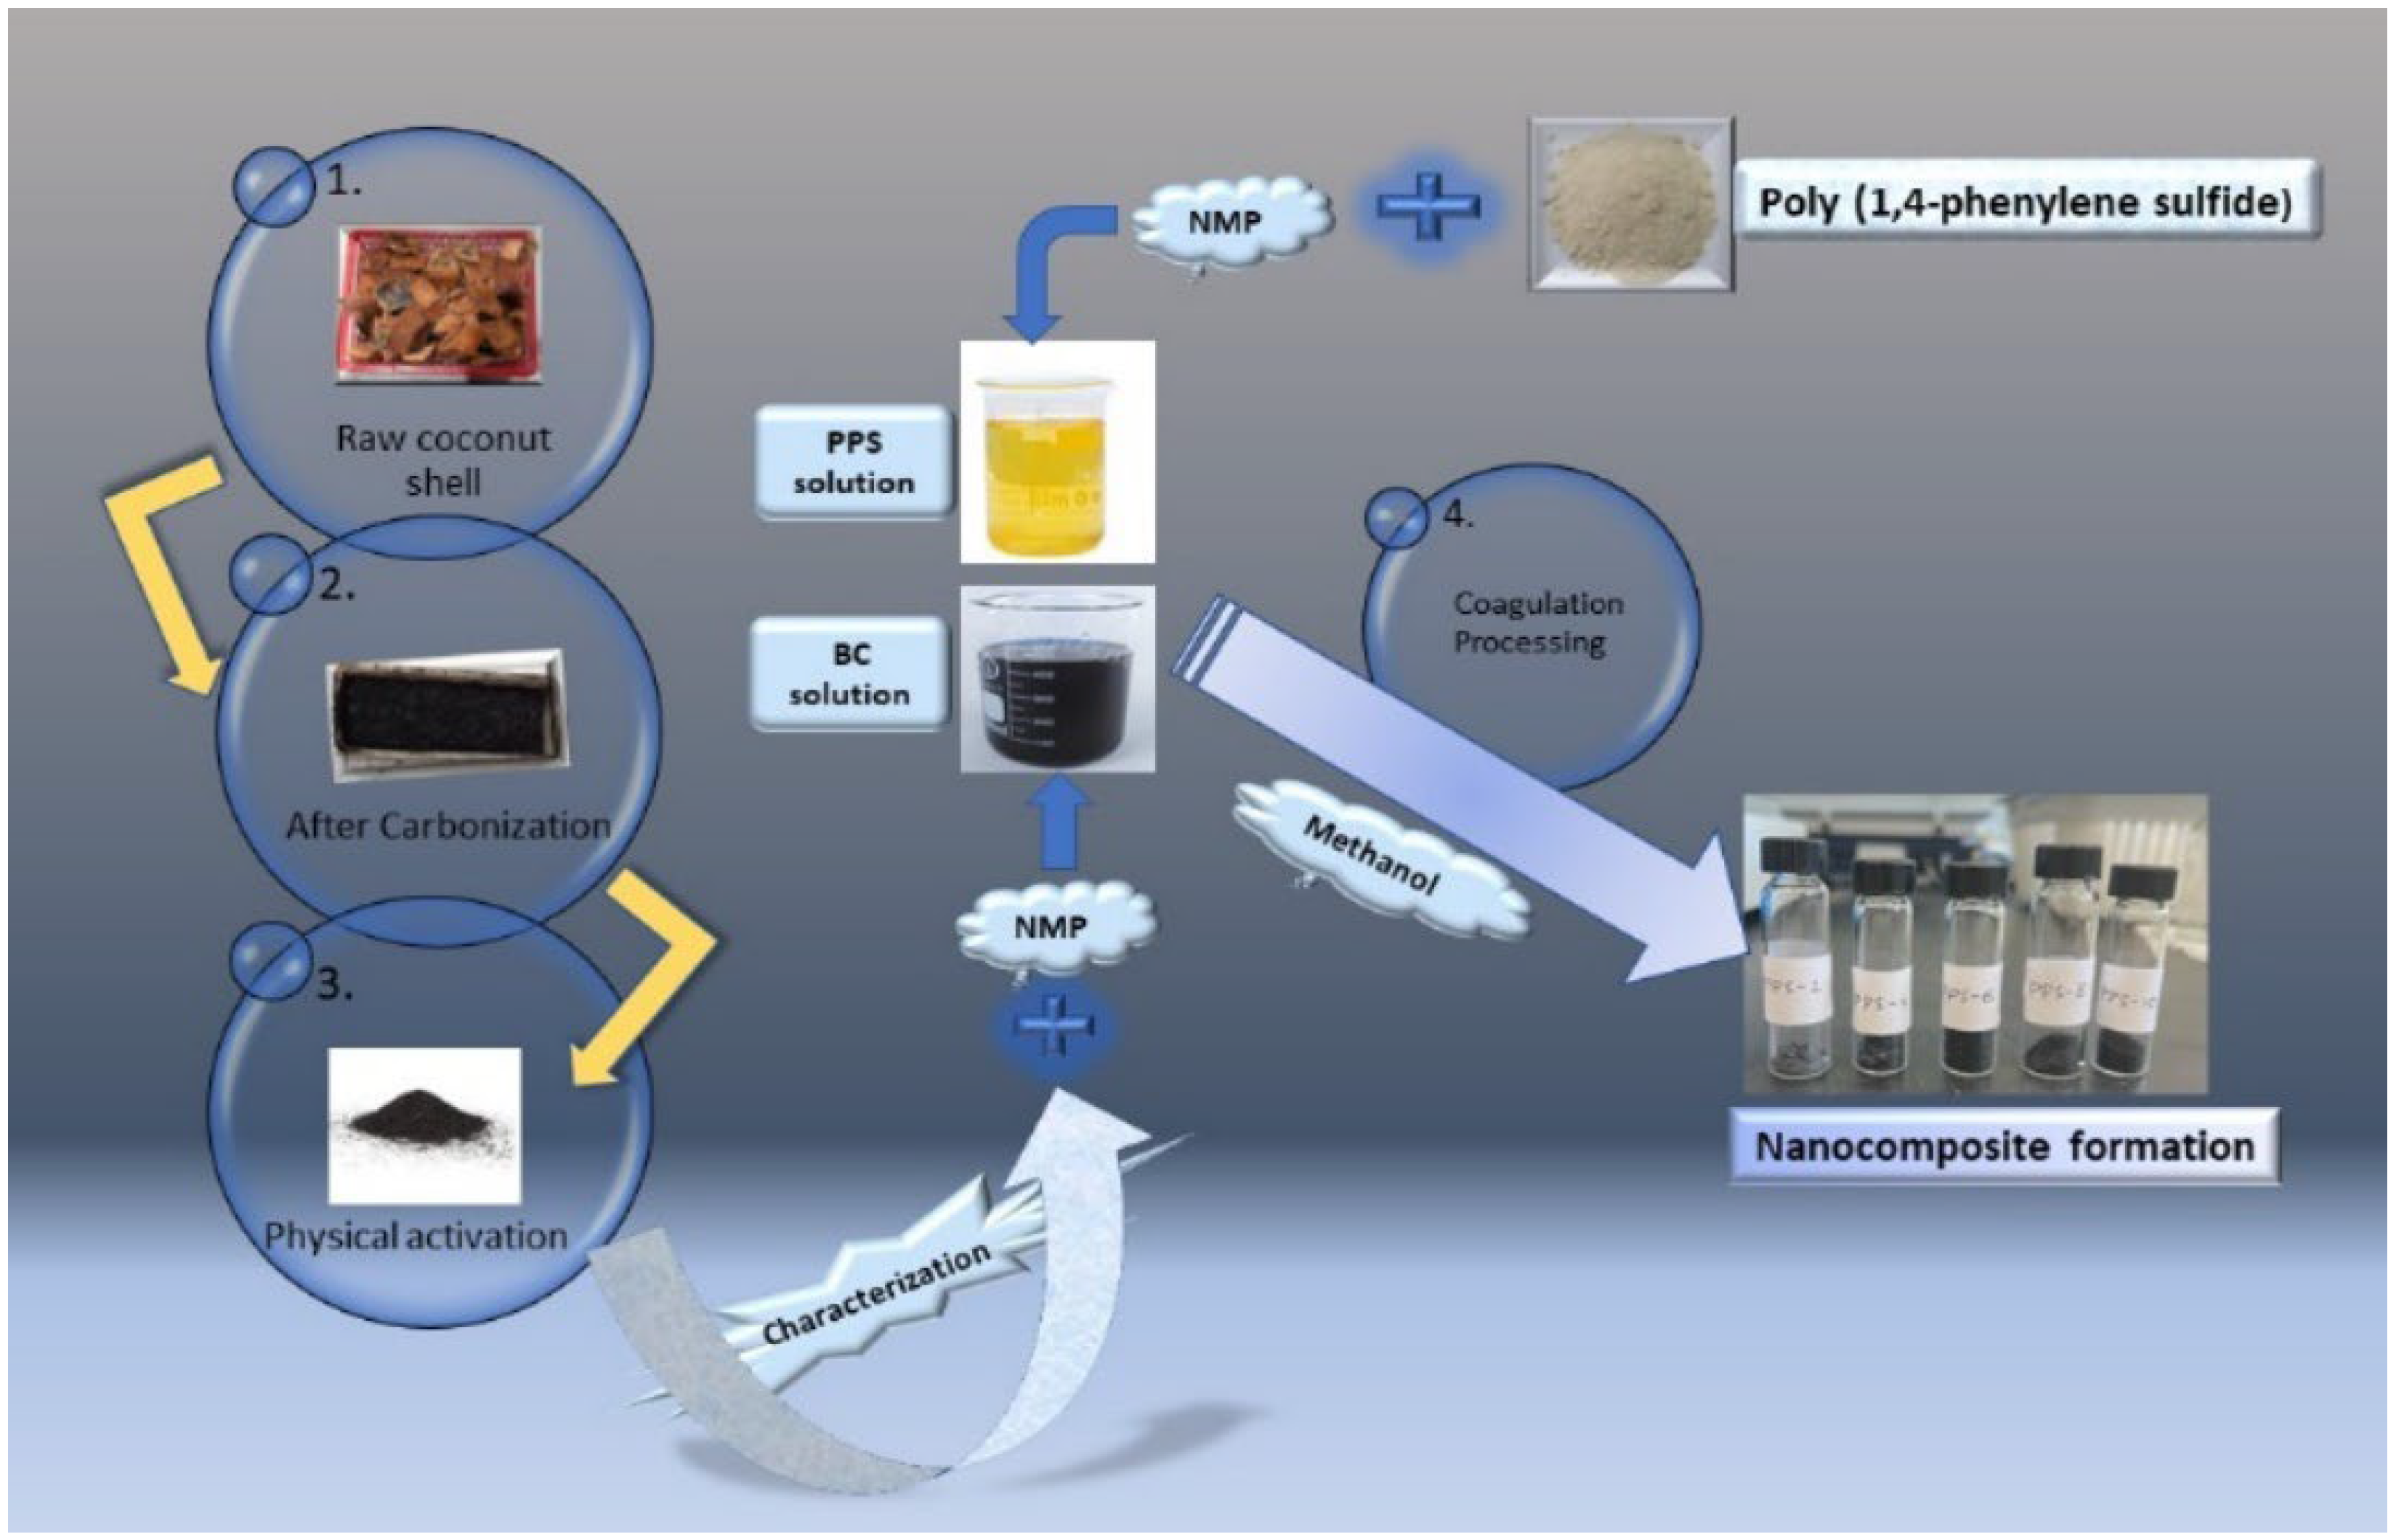
2.2. Synthesis of biochar BC
2.3. Physical activation of BC
2.4. Synthesis of PPS@BC nanocomposites using the coagulation method
3. CHARACTERIZATION TECHNIQUES
3.1. Characterization of BC
3.2. Characterization of PPS@BC composites
4. RESULTS AND DISCUSSION
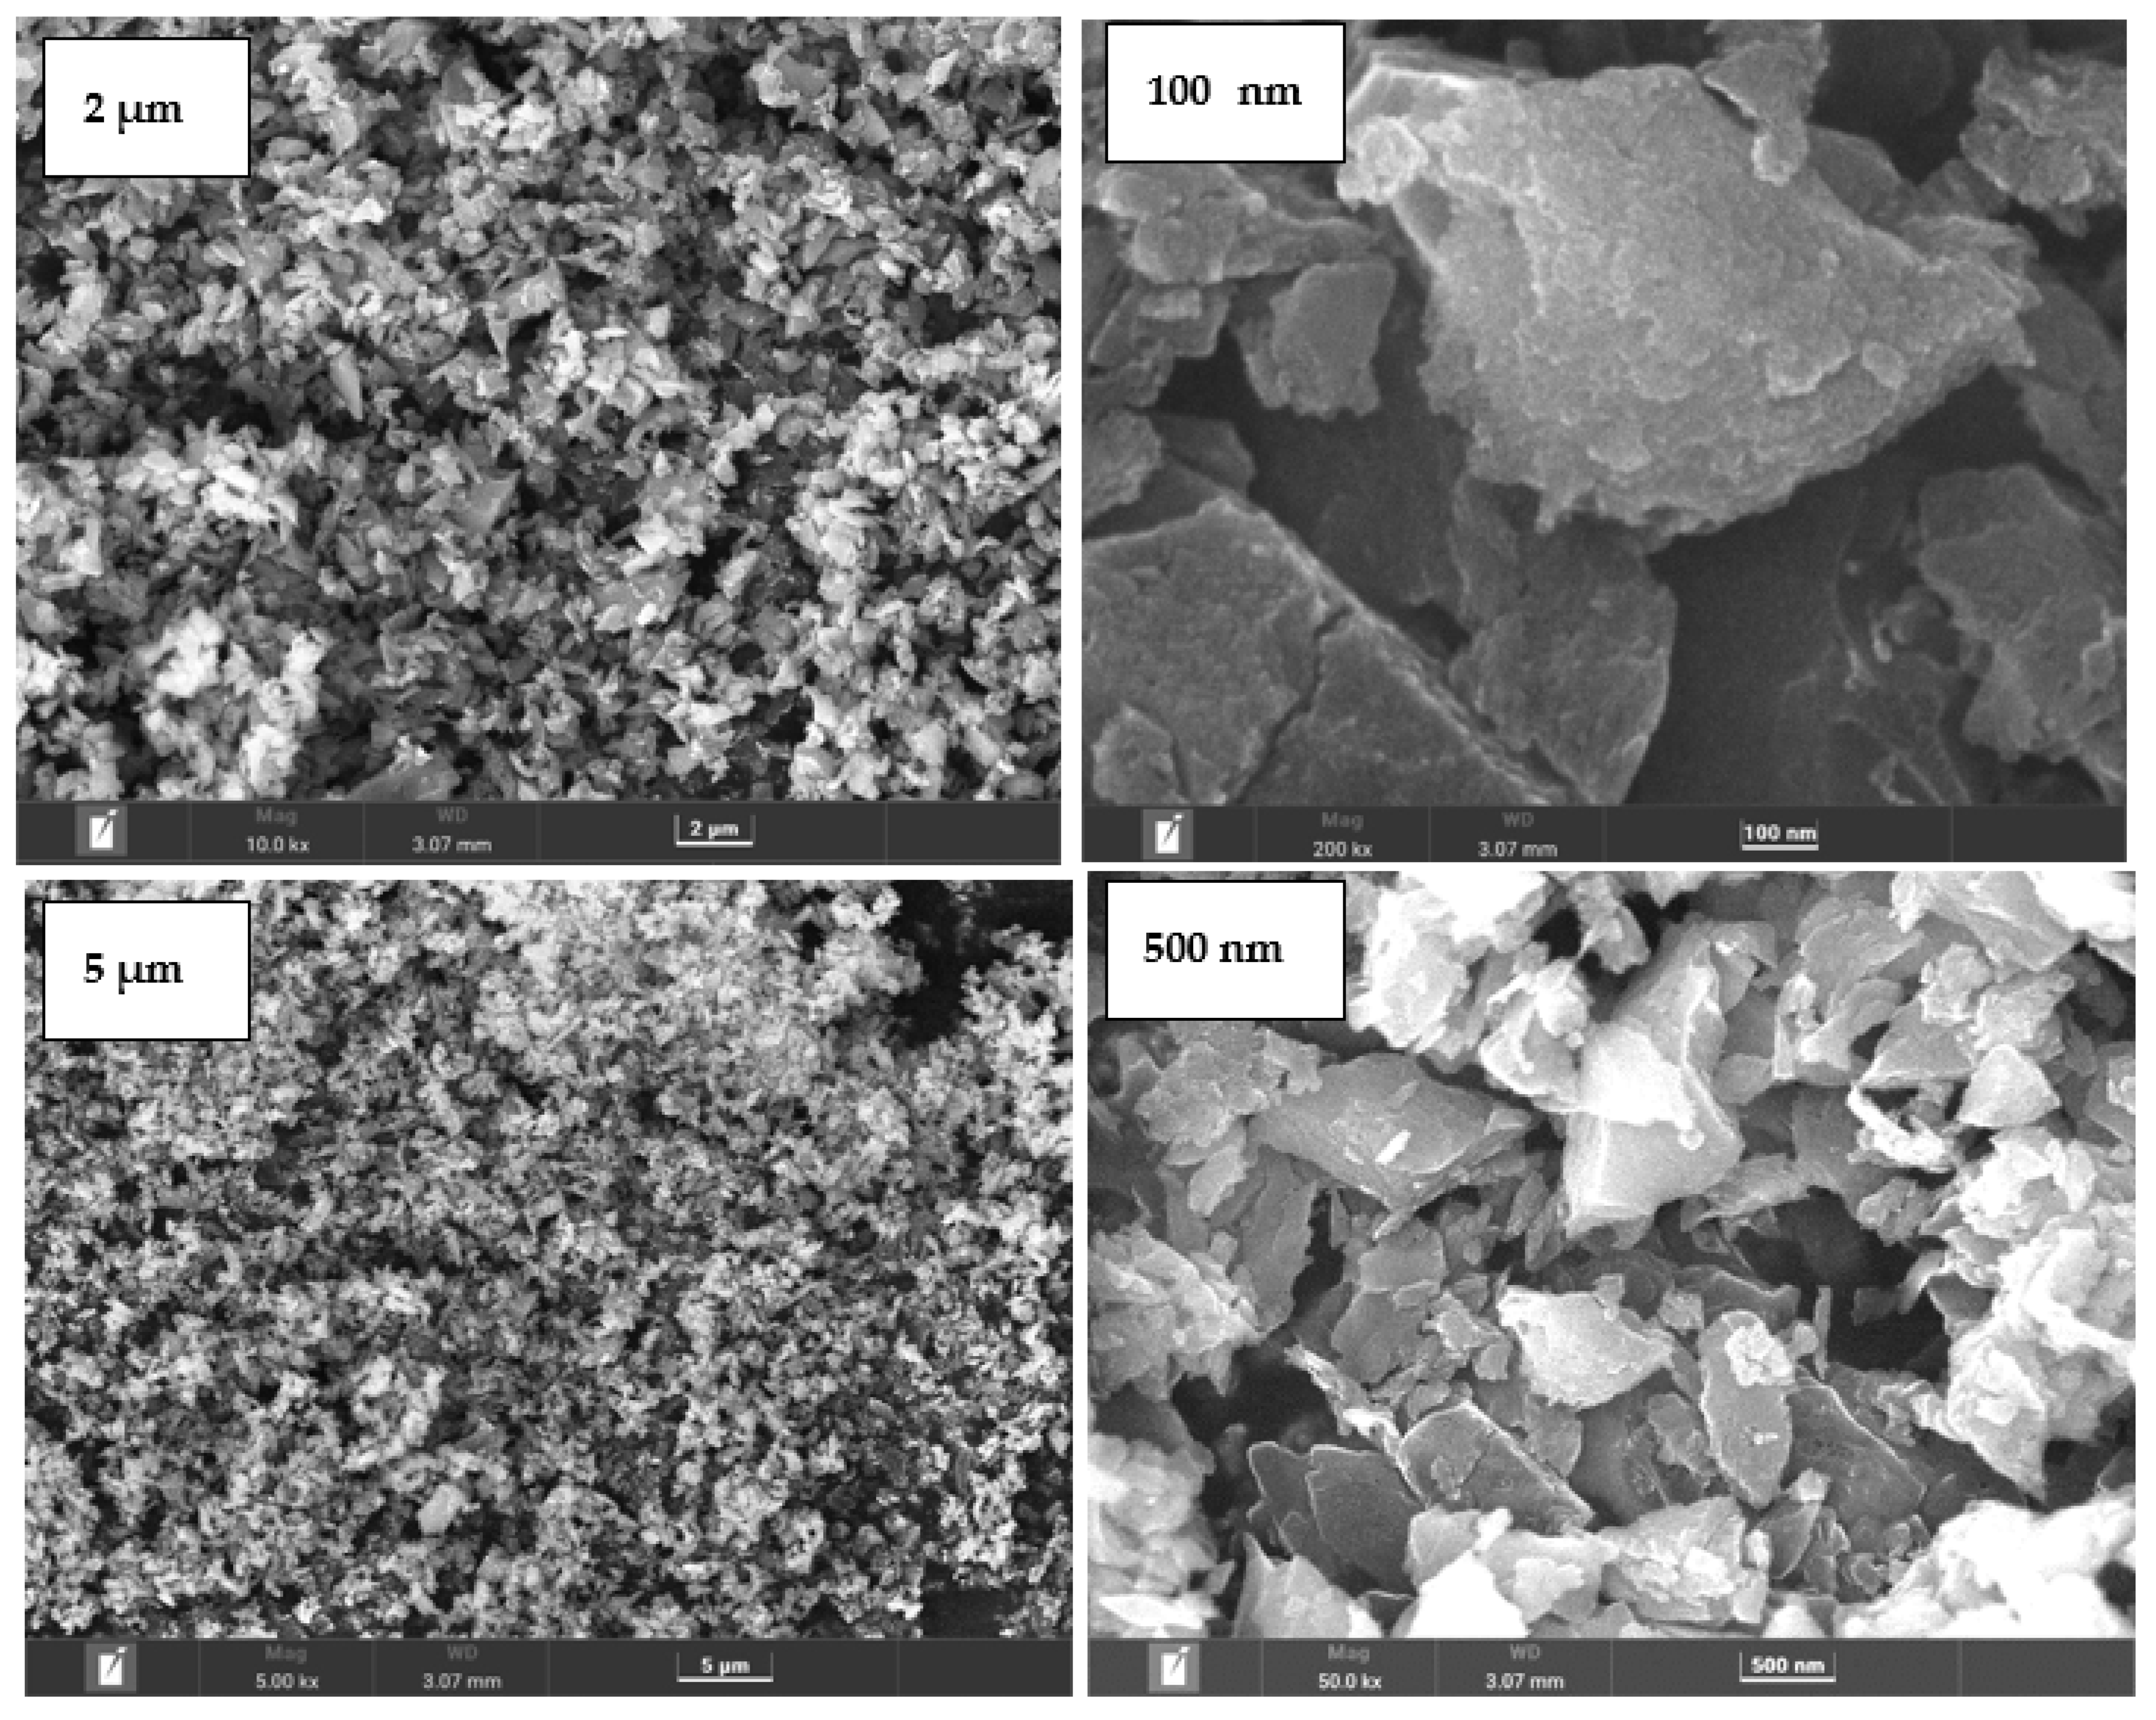
4.1. Surface morphology and composition of BC
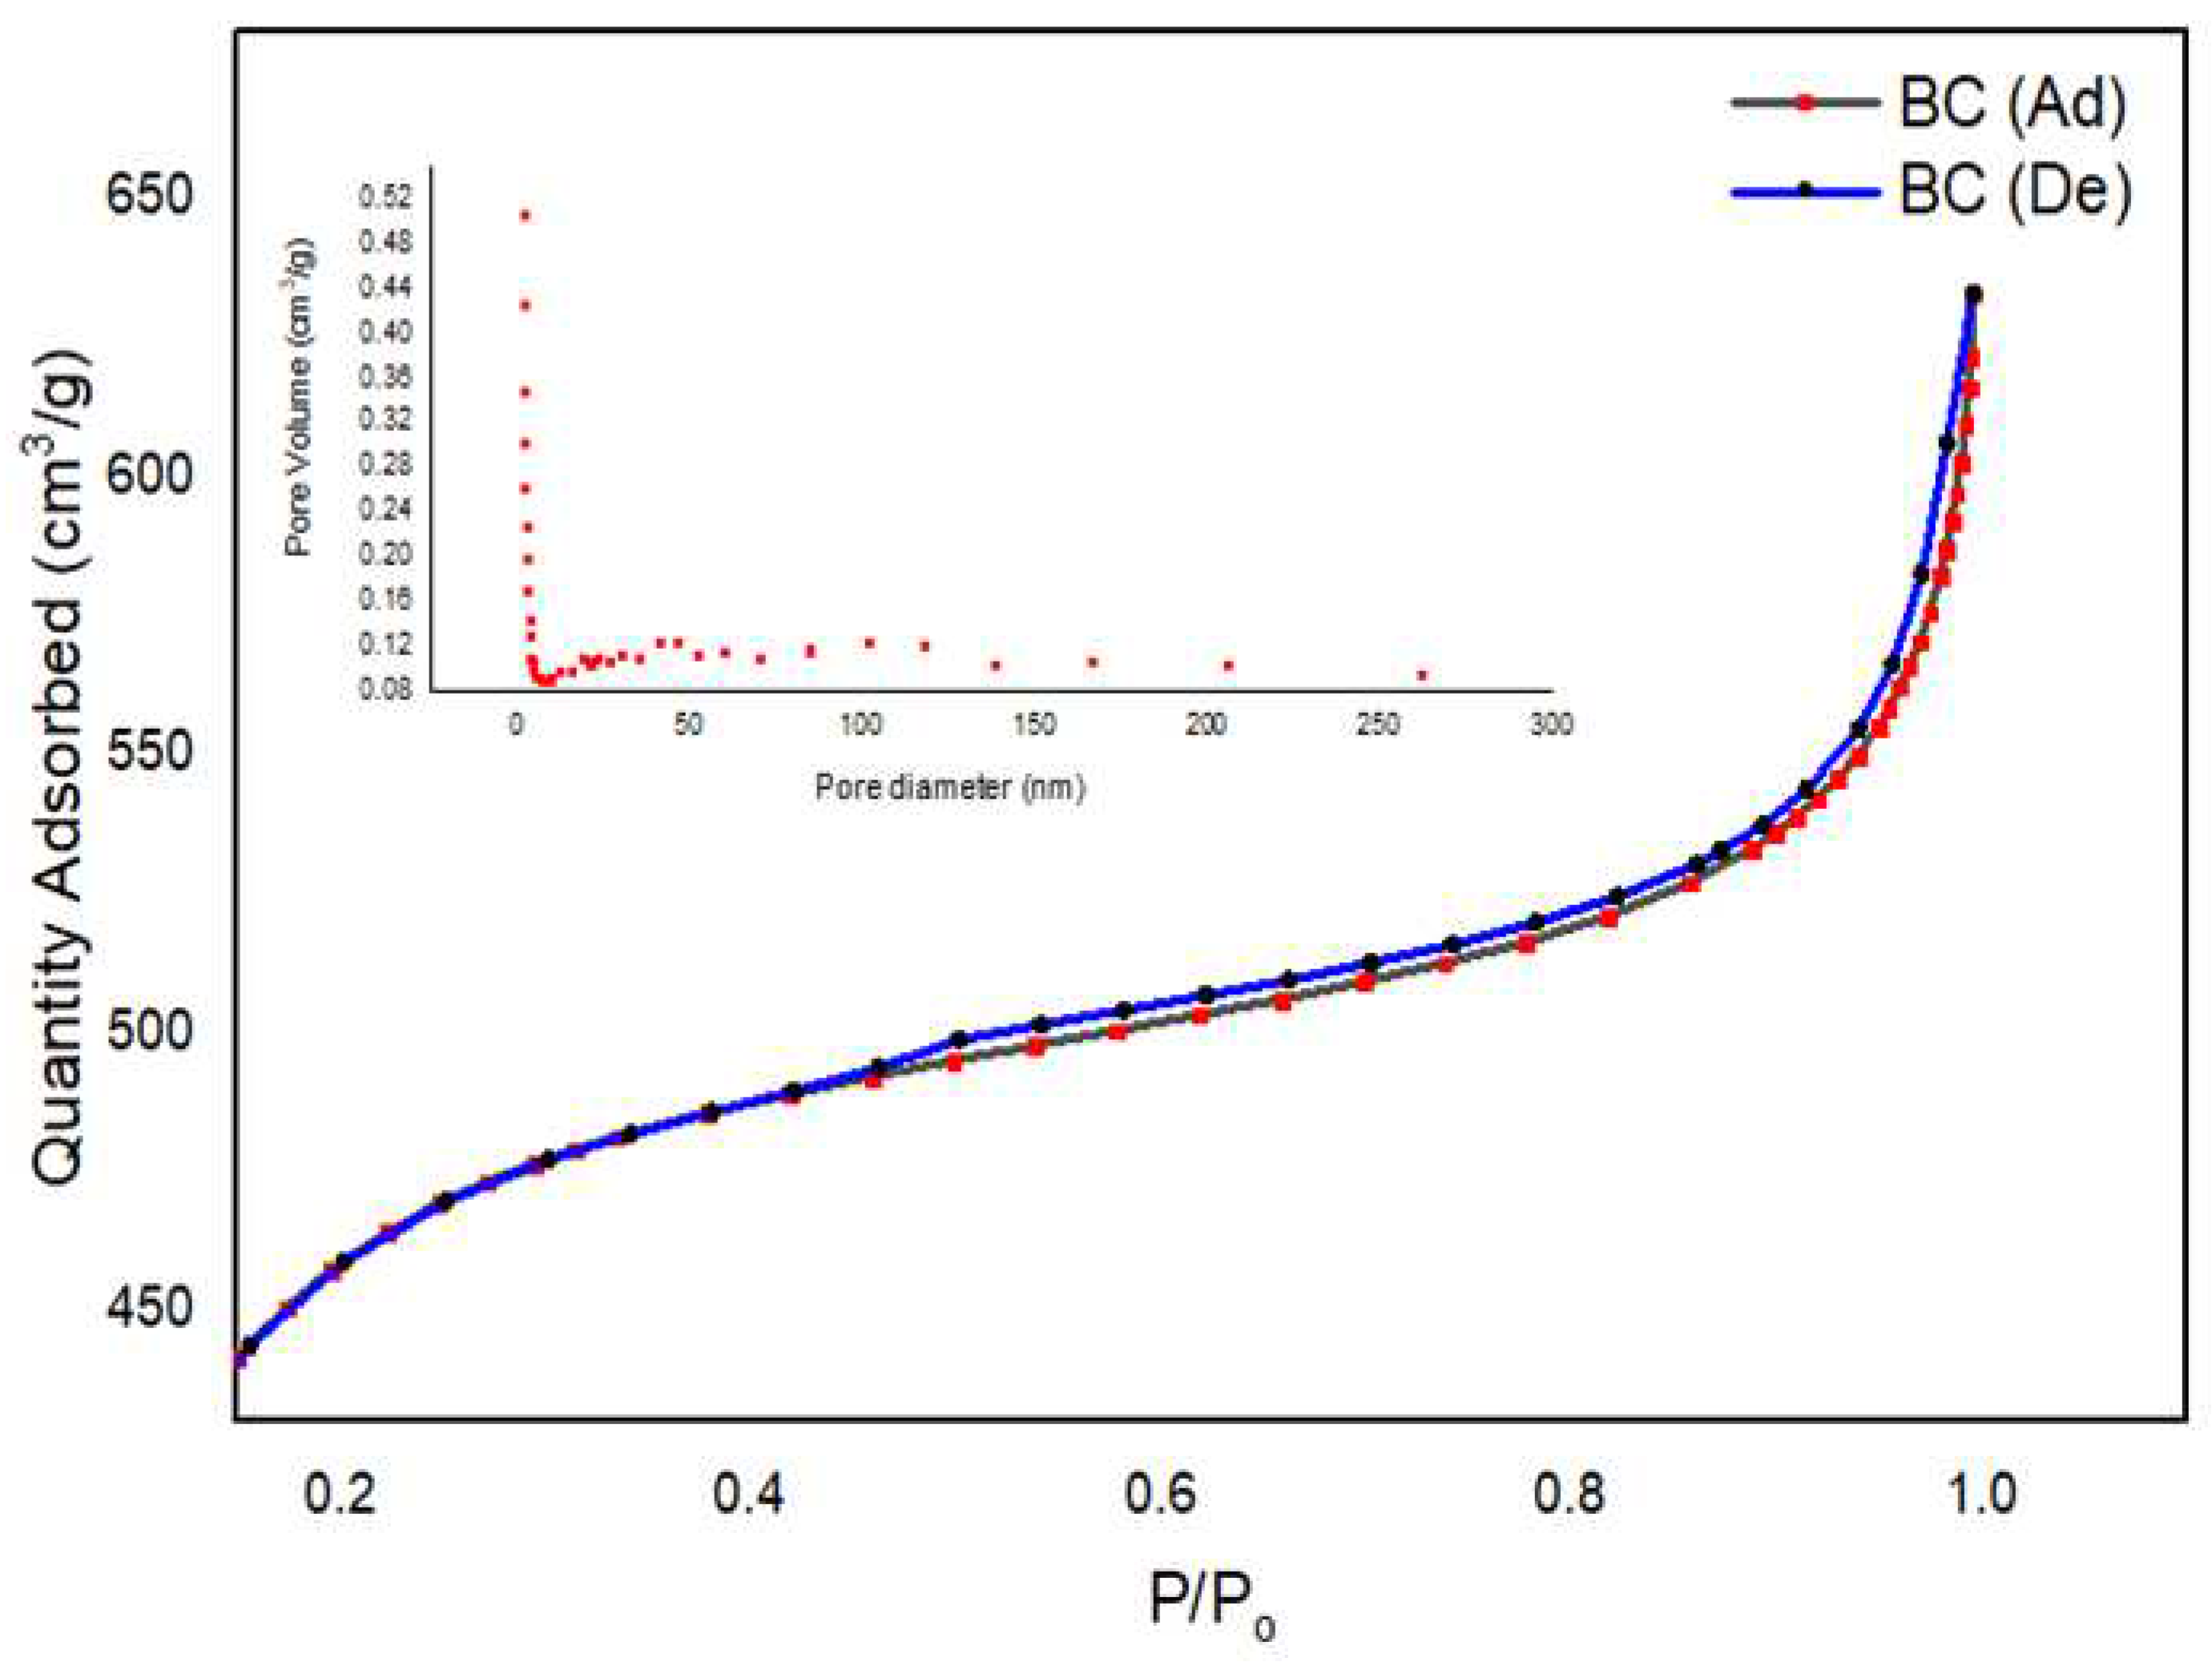
4.2. SAP analysis of BC
4.3. X-ray diffraction analysis of BC
4.4. FTIR interpretation of PPS@BC nanocomposite
4.5. Thermogravimetric analysis of PPS@BC nanocomposite
4.6. Differential scanning calorimetric investigation of PPS@BC nanocomposite
- ∆Hc = heat of crystallization
- ∆Hf = heat of crystallization of a 100% crystalline PPS, 112 J/g [52].
- Wf = weight fraction of BC content in the nanocomposite.
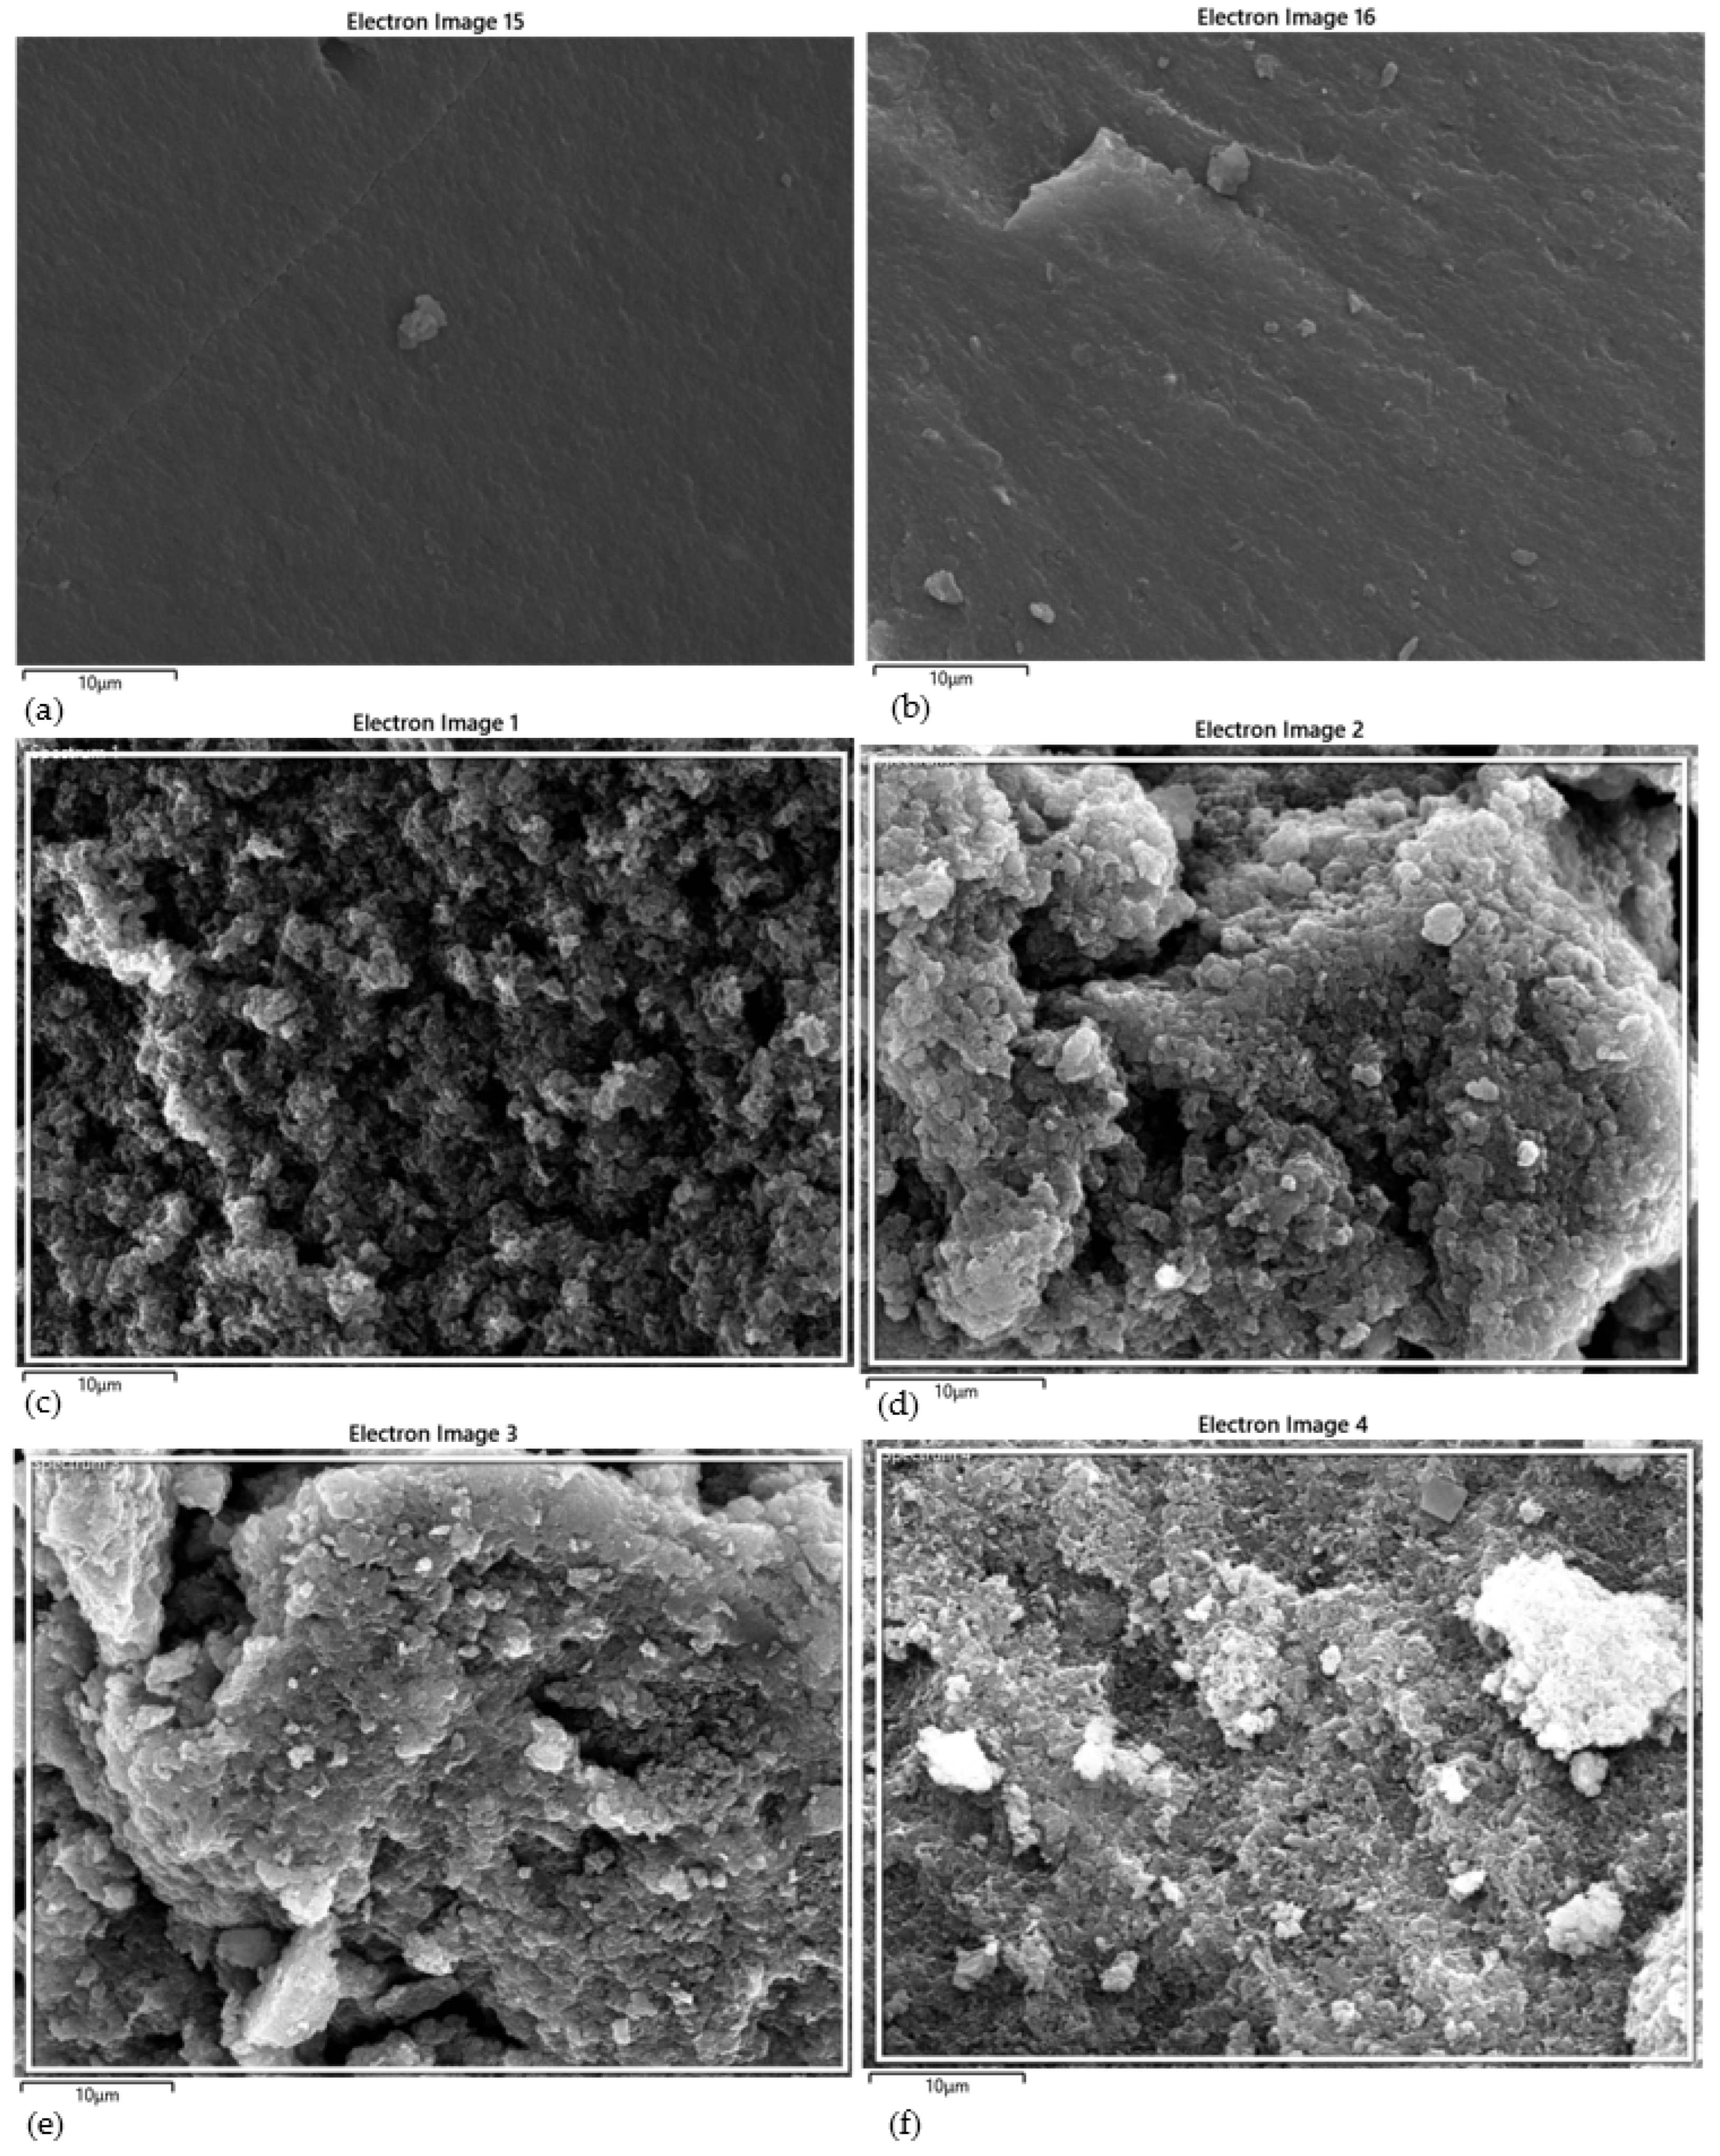
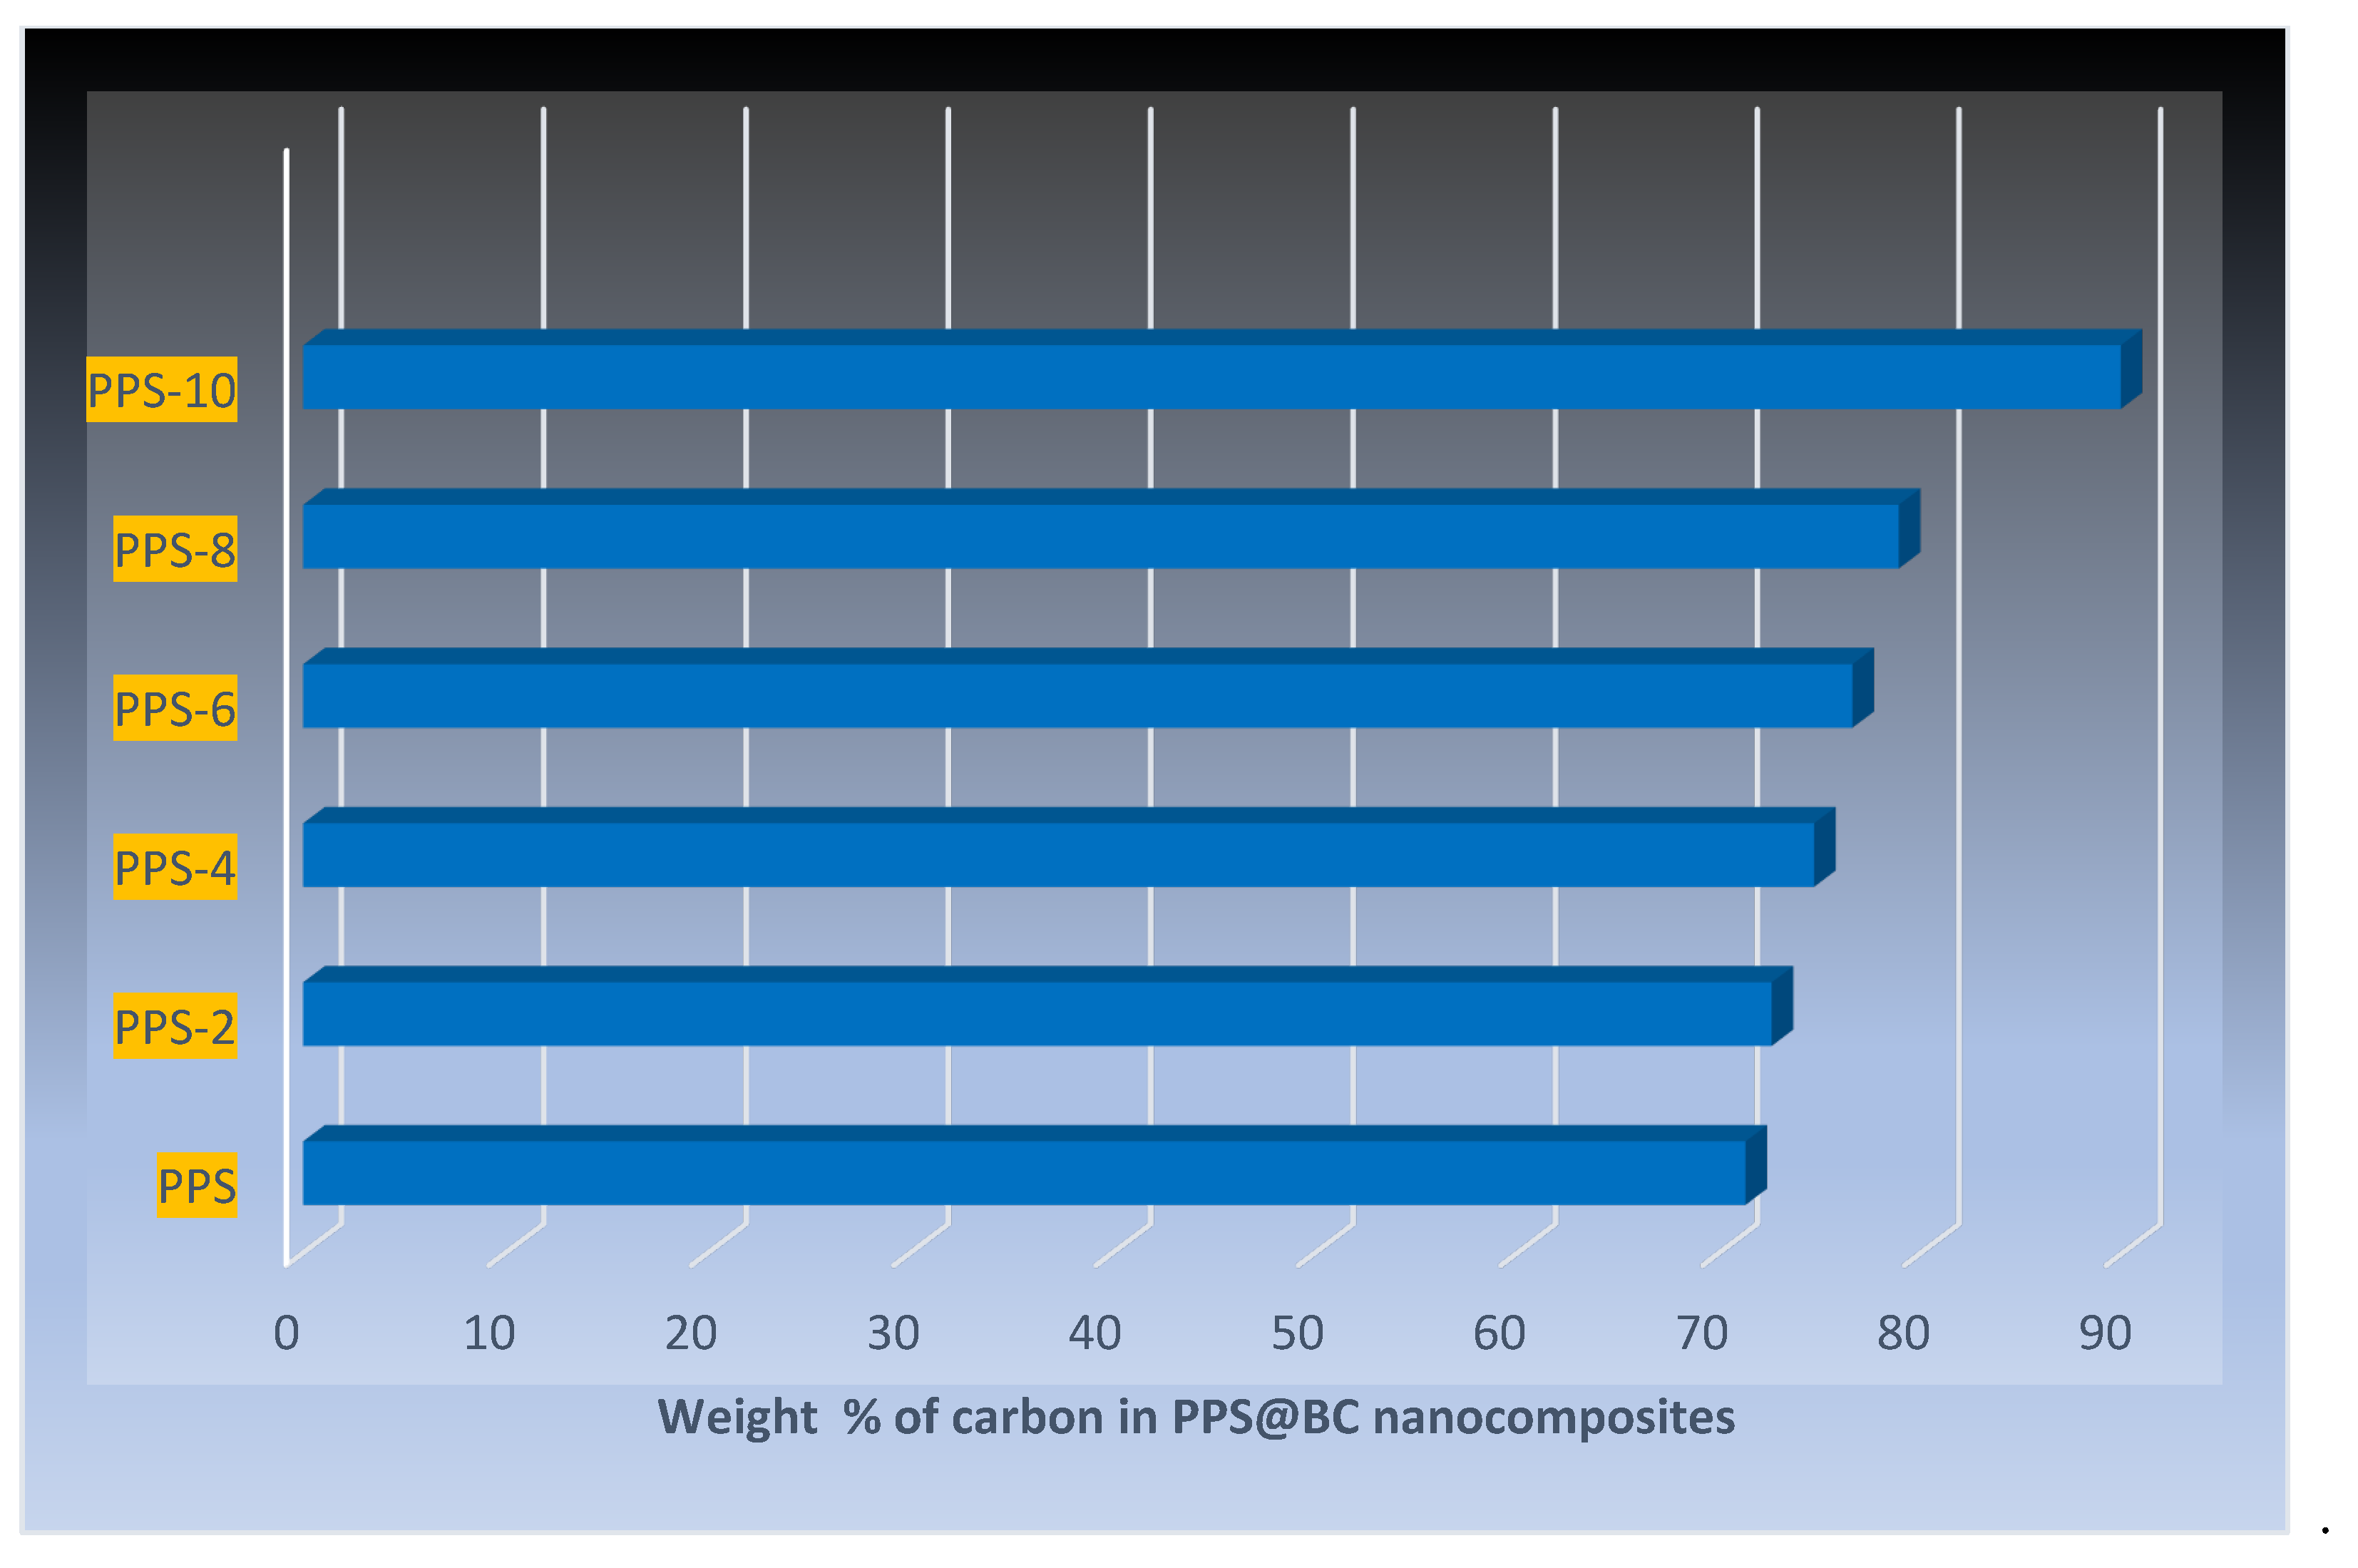
4.7. Surface morphology and composition of PPS@BC
5. Conclusions
Acknowledgments
CONFLICTS OF INTEREST
References
- Wilke, L.A.; Robertson, C.G.; Karsten, D.A.; Hardman, N.J. Detailed understanding of the carbon black–polymer interface in filled rubber composites. Carbon 2023, 201, 520–528. [Google Scholar] [CrossRef]
- Ayub, S.; Guan, B.H.; Ahmad, F. Graphene and Iron based composites as EMI shielding: A Systematic Review. in 2020 Second International Sustainability and Resilience Conference: Technology and Innovation in Building Designs (51154), 2020: IEEE, pp. 1–5.
- Ayub, S.; et al. Graphene and iron reinforced polymer composite electromagnetic shielding applications: A review. Polymers 2021, 13, 2580. [Google Scholar] [CrossRef]
- Nezili, Y.; Mdarhri, A.; El Aboudi, I.; Brosseau, C.; Zaghrioui, M.; Ghorbal, A.; He, D.; Bai, J. Solvent polarity impacts the sorption kinetics and tensile properties of carbon black filled elastomers. Polymer 2023, 264, 125563. [Google Scholar] [CrossRef]
- Zadafiya, K.; Bandhu, D.; Kumari, S.; Chatterjee, S.; Abhishek, K. Recent trends in drilling of carbon fiber reinforced polymers (CFRPs): A state-of-the-art review. Journal of Manufacturing Processes 2021, 69, 47–68. [Google Scholar] [CrossRef]
- Ayub, S.; Guan, B.H.; Ahmad, F.; Javed, M.F.; Mosavi, A.; Felde, I. Preparation Methods for Graphene Metal and Polymer Based Composites for EMI Shielding Materials: State of the Art Review of the Conventional and Machine Learning Methods. Metals 2021, 11, 1164. [Google Scholar] [CrossRef]
- Kumar, S.; Satapathy, B.K.; Patnaik, A.J.C.m.s. Thermo-mechanical correlations to erosion performance of short glass/carbon fiber reinforced vinyl ester resin hybrid composites. 2012, 60, 250–260. [CrossRef]
- Ayub, S.; Guan, B.H.; Ahmad, F.; Nisa, Z.U. A Shear Mixing approach in Polymer Composite Formation. In Proceedings of 2021 Third International Sustainability and Resilience Conference: Climate Change; pp. 205–210.
- Ayub, S.; Soleimani, H.; Guan, B.H.; Nisa, Z.U.; Ahmad, F. Graphene, Copper and Nickel based composites in EMI applications: A brief review. In Proceedings of 2022 International Conference on Data Analytics for Business and Industry (ICDABI); pp. 525–527.
- Boostani, A.F.; Yazdani, S.; Mousavian, R.T.; Tahamtan, S.; Khosroshahi, R.A.; Wei, D.; Brabazon, D.; Xu, J.; Zhang, X.; Jiang, Z. Strengthening mechanisms of graphene sheets in aluminium matrix nanocomposites. Materials & Design 2015, 88, 983–989. [Google Scholar]
- Greil, P.J.A.E.M. Perspectives of nano-carbon based engineering materials. 2015, 17, 124–137. [CrossRef]
- Martinez, C.L.M.; Sermyagina, E.; Saari, J.; de Jesus, M.S.; Cardoso, M.; de Almeida, G.M.; Vakkilainen, E.J.B. ; Bioenergy. Hydrothermal carbonization of lignocellulosic agro-forest based biomass residues. 2021, 147, 106004. [Google Scholar]
- un Nisa, Z.; Chuan, L.K.; Ayub, S.; Guan, B.H.; Ahmad, F. Thermal and Morphological Characterization of Coagulation-Processed Nanocomposite of Polypropylene and Bio-nanocarbon obtained from Bamboo. In Proceedings of 2021 Third International Sustainability and Resilience Conference: Climate Change; pp. 436–439.
- Ayub, S.; Guan, B.H.; Ahmad, F.; Soleimani, H.; You, K.Y.; Nisa, Z.U.; Yusuf, J.Y.; Hamid, M.A.B. Optimization of magnetite with modified graphene for microwave absorption properties. Journal of Alloys and Compounds 2023, 936, 168182. [Google Scholar] [CrossRef]
- McDougall, G.J.J.o.t.S.A.I.o.M.; Metallurgy. The physical nature and manufacture of activated carbon. Journal of the Southern African Institute of Mining and Metallurgy 1991, 91, 109–120.
- Daud, W.M.A.W.; Ali, W.S.W.J.B.t. Comparison on pore development of activated carbon produced from palm shell and coconut shell. 2004, 93, 63–69. [CrossRef]
- Khalil, L.B.J.A.S. Khalil, L.B.J.A.S.; Technology. Porosity characteristics of chars derived from different lignocellulosic materials. 1999, 17, 729–739. [CrossRef]
- Ayub, S.; Guan, B.H.; Soleimani, H.; Ahmad, F.; Nisa, Z.U.; Yusuf, J.Y.; Hamid, M.A.B.; Hassan, Y.M. Magnetite deposit on graphene nanoplatelets Surface: An assessment of grafting parameters. Ain Shams Engineering Journal 2023, 14, 101996. [Google Scholar] [CrossRef]
- Rampur, V.V.; Banagar, A.R.; Ganesh, U.; Srinivas, C.; Reur, S. Mechanical characterization of wood apple and coconut shell reinforced hybrid composites. In Proceedings of AIP Conference Proceedings; p. 040001.
- Dong, M.; Li, Q.; Liu, H.; Liu, C.; Wujcik, E.K.; Shao, Q.; Ding, T.; Mai, X.; Shen, C.; Guo, Z.J.P. Thermoplastic polyurethane-carbon black nanocomposite coating: Fabrication and solid particle erosion resistance. 2018, 158, 381–390. [CrossRef]
- Diez-Pascual, A.M.; Naffakh, M.J.P. Tuning the properties of carbon fiber-reinforced poly (phenylene sulphide) laminates via incorporation of inorganic nanoparticles. 2012, 53, 2369–2378. [CrossRef]
- Zhai, H.; Zhou, X.; Fang, L.; Lu, A.J.J.o.a.p.s. Study on mechanical properties of powder impregnated glass fiber reinforced poly (phenylene sulphide) by injection molding at various temperatures. 2010, 115, 2019–2027. [CrossRef]
- Rahate, A.S.; Nemade, K.R.; Waghuley, S.A. Polyphenylene sulfide (PPS): state of the art and applications. Reviews in Chemical Engineering 2013, 29, 471–489. [Google Scholar] [CrossRef]
- Nisa, Z.U.; Chuan, L.K.; Guan, B.H.; Ayub, S.; Ahmad, F. Anti-Wear and Anti-Erosive Properties of Polymers and Their Hybrid Composites: A Critical Review of Findings and Needs. Nanomaterials 2022, 12, 2194. [Google Scholar] [CrossRef] [PubMed]
- Vieille, B.; Aucher, J.; Taleb, L.J.A.i.P.T. Carbon fiber fabric reinforced PPS laminates: Influence of temperature on mechanical properties and behavior. 2011, 30, 80–95. [CrossRef]
- Batista, N.L.; Olivier, P.; Bernhart, G.; Rezende, M.C.; Botelho, E.C. Correlation between degree of crystallinity, morphology and mechanical properties of PPS/carbon fiber laminates. Materials Research 2016, 19, 195–201. [Google Scholar] [CrossRef]
- Jain, A.; Somberg, J.; Emami, N. Development and characterization of multi-scale carbon reinforced PPS composites for tribological applications. Lubricants 2019, 7, 34. [Google Scholar] [CrossRef]
- Alo, O.A.; Otunniyi, I.O.; Sadiku, E.R. Processing methods for conductive polymer composite bipolar plates: Effect on plate quality and performance. Fuel Cells 2023. [Google Scholar] [CrossRef]
- Jog, J.; Shingankuli, V.; Nadkarni, V.J.P. Crystallization of poly (phenylene sulfide) in blends with high density polyethylene and poly (ethylene terephthalate). 1993, 34, 1966–1969. [CrossRef]
- Irfan, M.; Martin, S.; Obeidi, M.A.; Miller, S.; Kuster, F.; Brabazon, D.; Naydenova, I. A Magnetic Nanoparticle-Doped Photopolymer for Holographic Recording. Polymers 2022, 14, 1858. [Google Scholar] [CrossRef]
- Donohue, M.; Aranovich, G.J.A.i.c.; science, i. Classification of Gibbs adsorption isotherms. 1998, 76, 137–152. [CrossRef]
- Fallah, R.; Hosseinabadi, S.; Pourtaghi, G. Influence of Fe3O4 and carbon black on the enhanced electromagnetic interference (EMI) shielding effectiveness in the epoxy resin matrix. Journal of Environmental Health Science and Engineering 2022, 20, 113–122. [Google Scholar] [CrossRef]
- Meyer, C.; Weyhe, M.; Haselrieder, W.; Kwade, A. Heated calendering of cathodes for lithium-ion batteries with varied carbon black and binder contents. Energy Technology 2020, 8, 1900175. [Google Scholar] [CrossRef]
- Veeman, D.; Shree, M.V.; Sureshkumar, P.; Jagadeesha, T.; Natrayan, L.; Ravichandran, M.; Paramasivam, P. Sustainable development of carbon nanocomposites: synthesis and classification for environmental remediation. Journal of Nanomaterials 2021, 2021, 1–21. [Google Scholar] [CrossRef]
- Khodabakhshi, S.; Fulvio, P.F.; Andreoli, E. Carbon black reborn: Structure and chemistry for renewable energy harnessing. Carbon 2020, 162, 604–649. [Google Scholar] [CrossRef]
- Sing, K.S.; Rouquerol, F.; Rouquerol, J. Adsorption By Powders and Porous Solids: Principles, Methodology, and Applications; Academic Press: 1999.
- Cao, J.; Chen, L.J.P.c. Effect of thermal cycling on carbon fiber-reinforced PPS composites. 2005, 26, 713–716. [CrossRef]
- Shingankuli, V.; Jog, J.; Nadkarni, V.J.J.o.a.p.s. Thermal and crystallization behavior of engineering polyblends. I. Glass reinforced polyphenylene sulfide with polyethylene terephthalate. 1988, 36, 335–351. [CrossRef]
- Li, W.; Yang, K.; Peng, J.; Zhang, L.; Guo, S.; Xia, H. Effects of carbonization temperatures on characteristics of porosity in coconut shell chars and activated carbons derived from carbonized coconut shell chars. Industrial crops and products 2008, 28, 190–198. [Google Scholar] [CrossRef]
- Maciá-Agulló, J.; Moore, B.; Cazorla-Amorós, D.; Linares-Solano, A. Activation of coal tar pitch carbon fibres: Physical activation vs. chemical activation. Carbon 2004, 42, 1367–1370. [Google Scholar] [CrossRef]
- Daud, W.M.A.W.; Ali, W.S.W.; Sulaiman, M.Z.J.C. The effects of carbonization temperature on pore development in palm-shell-based activated carbon. 2000, 38, 1925–1932. [CrossRef]
- Rodriguez-Reinoso, F.J.C.; carbon, p.o. Microporous structure of activated carbons as revealed adsorption methods. 1989, 21, 1.
- Rodriguez-Reinoso, F. Controlled gasification of carbon and pore structure development. In Fundamental issues in control of carbon gasification reactivity, Springer: 1991; pp. 533–571.
- Chauhan, A.; Chauhan, P. Powder XRD technique and its applications in science and technology. J Anal Bioanal Tech 2014, 5, 1–5. [Google Scholar] [CrossRef]
- Skoog, D.; Holler, F.; Crouch, S. Principles of instrumental analysis, 6th edn. Brooks. Cole, Cengage Learning, USA 2007, 338-373.
- Barnakov, C.N.; Khokhlova, G.; Malysheva, V.Y.; Popova, A.; Ismagilov, Z.J.S.F.C. X-ray diffraction analysis of the crystal structures of different graphites. 2015, 49, 25–29. [CrossRef]
- Oh, S.Y.; Yoo, D.I.; Shin, Y.; Kim, H.C.; Kim, H.Y.; Chung, Y.S.; Park, W.H.; Youk, J.H.J.C.r. Crystalline structure analysis of cellulose treated with sodium hydroxide and carbon dioxide by means of X-ray diffraction and FTIR spectroscopy. 2005, 340, 2376–2391. [CrossRef]
- Quan, Y.; Liu, Q.; Zhang, S.; Zhang, S. Comparison of the morphology, chemical composition and microstructure of cryptocrystalline graphite and carbon black. Applied Surface Science 2018, 445, 335–341. [Google Scholar] [CrossRef]
- Lee, S.-M.; Lee, S.-H.; Roh, J.-S. Analysis of activation process of carbon black based on structural parameters obtained by XRD analysis. Crystals 2021, 11, 153. [Google Scholar] [CrossRef]
- Zhao, Y.; Xiao, M.; Wang, S.; Ge, X.; Meng, Y. Preparation and properties of electrically conductive PPS/expanded graphite nanocomposites. Composites science and technology 2007, 67, 2528–2534. [Google Scholar] [CrossRef]
- Bai, J. Advanced fibre-reinforced polymer (FRP) composites for structural applications: 1. Introduction; Elsevier Inc. Chapters: 2013.
- Stoeffler, K.; Andjelic, S.; Legros, N.; Roberge, J.; Schougaard, S.B. Polyphenylene sulfide (PPS) composites reinforced with recycled carbon fiber. Composites Science and Technology 2013, 84, 65–71. [Google Scholar] [CrossRef]


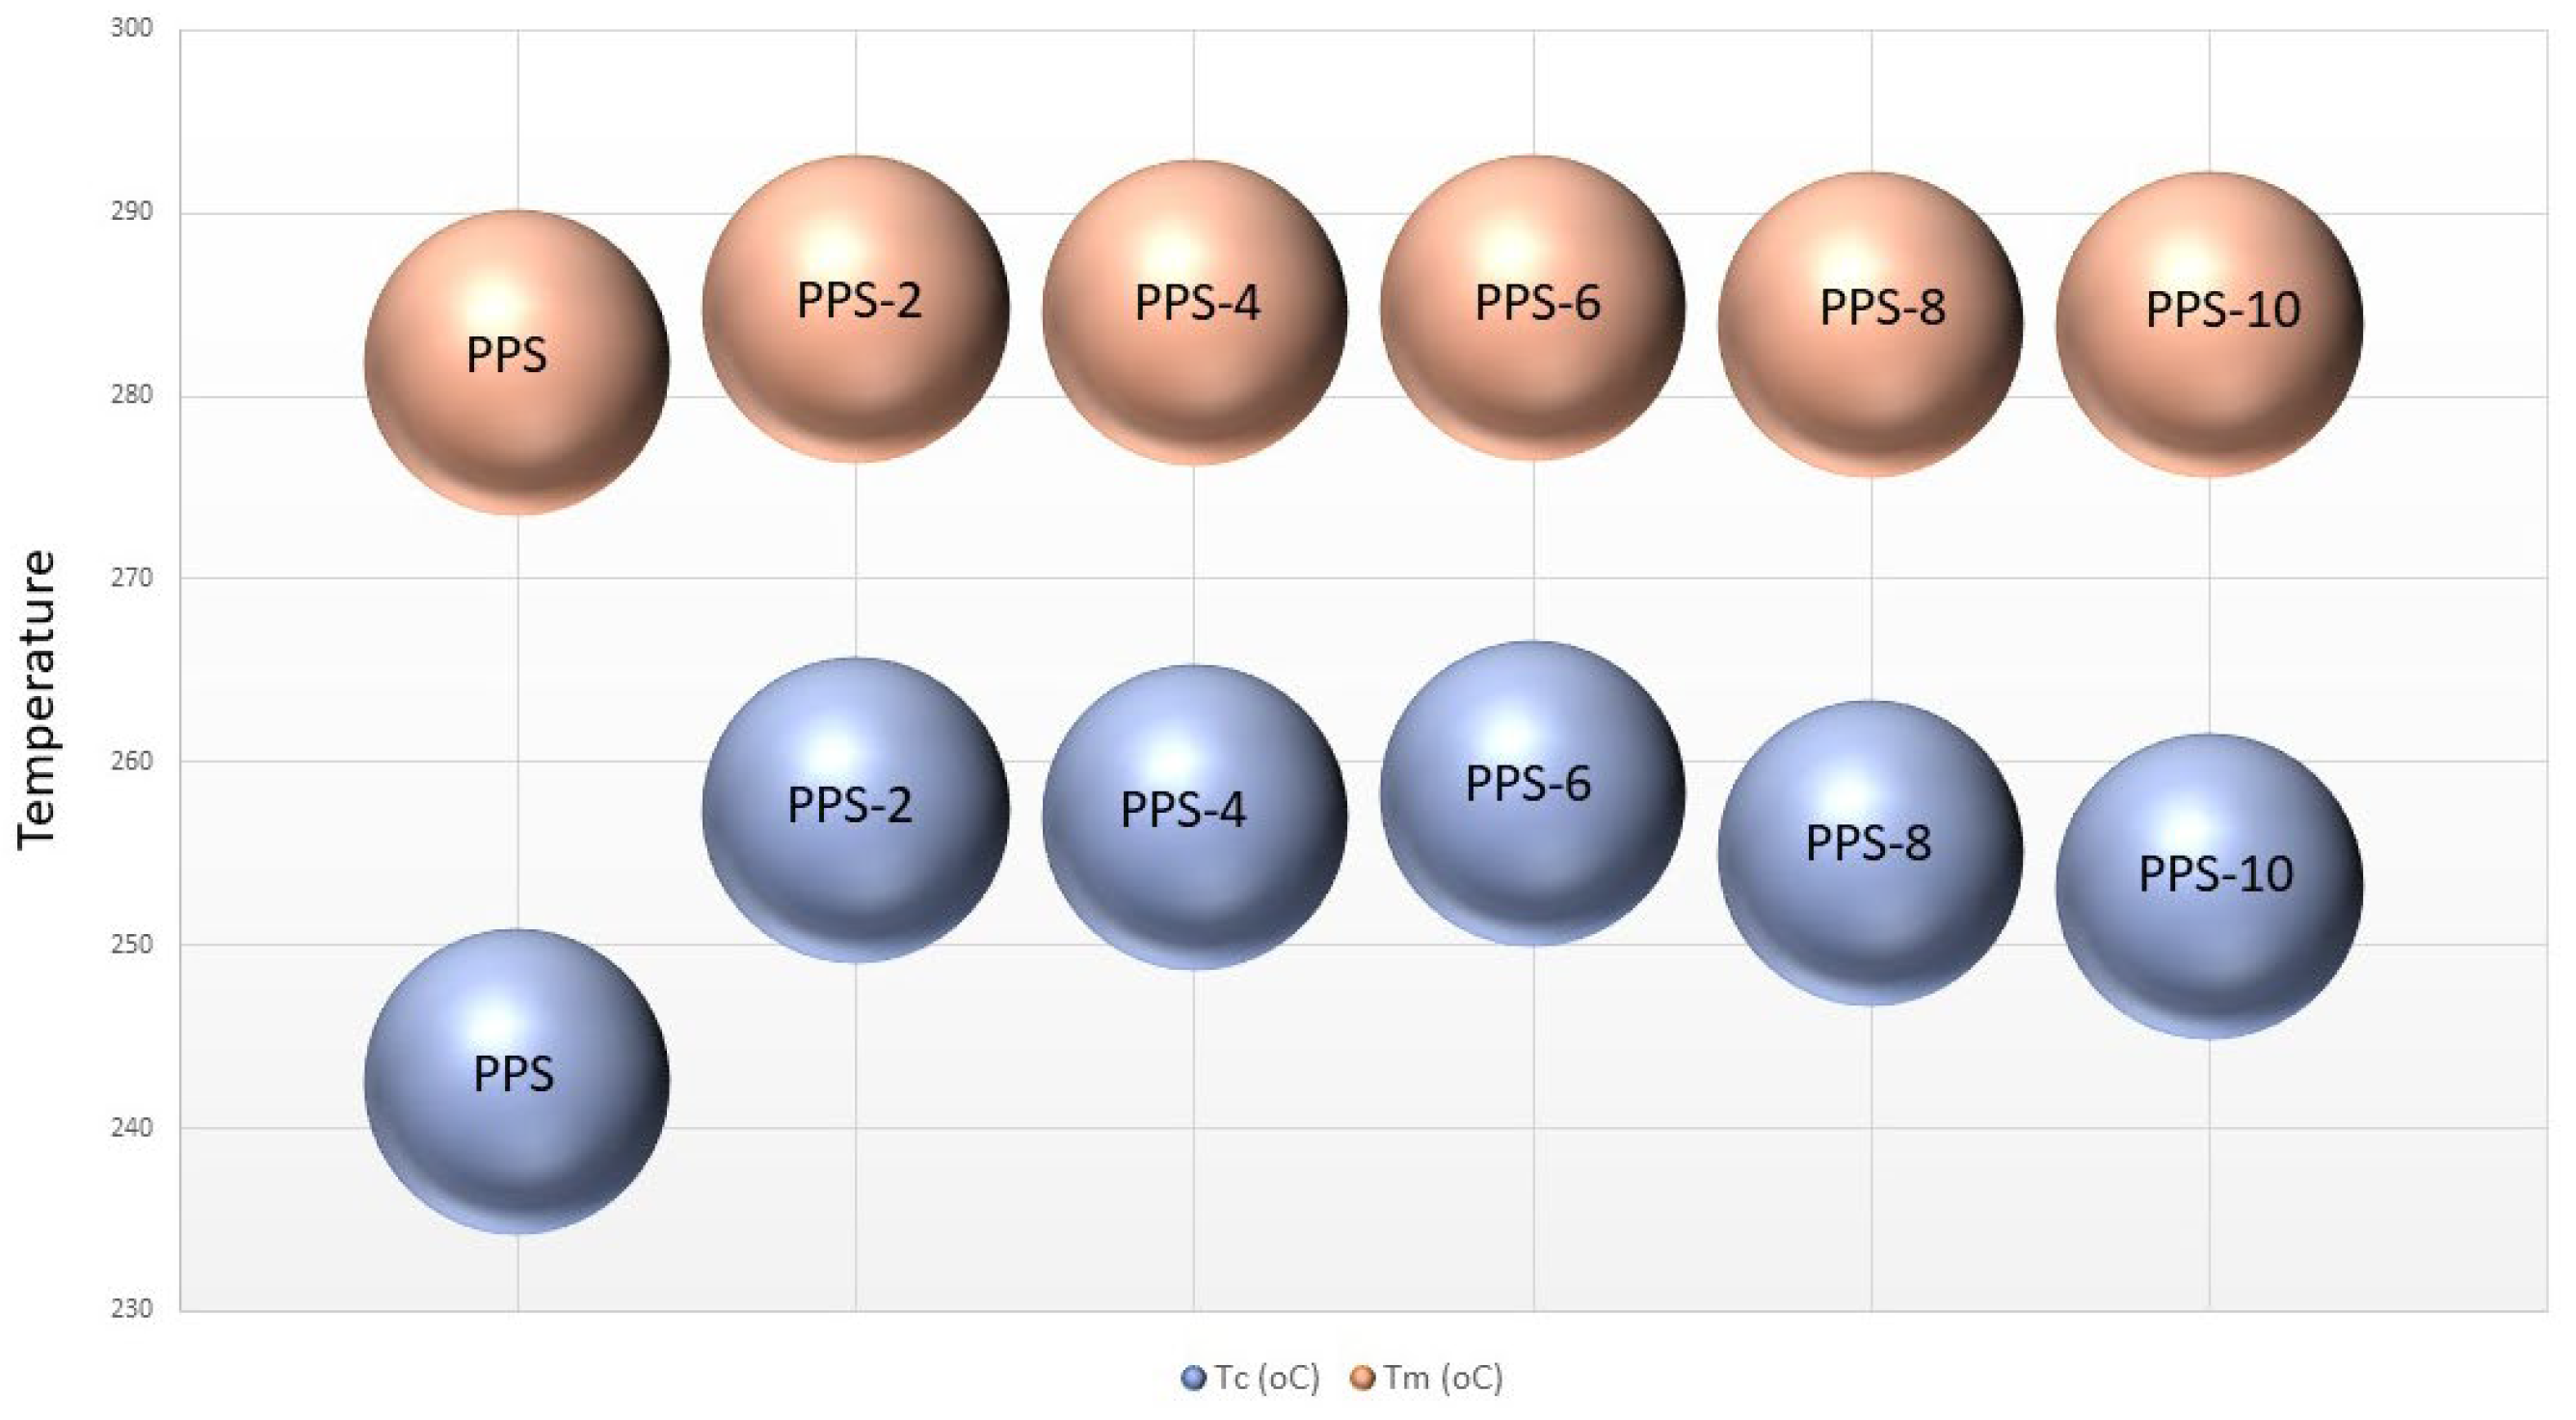

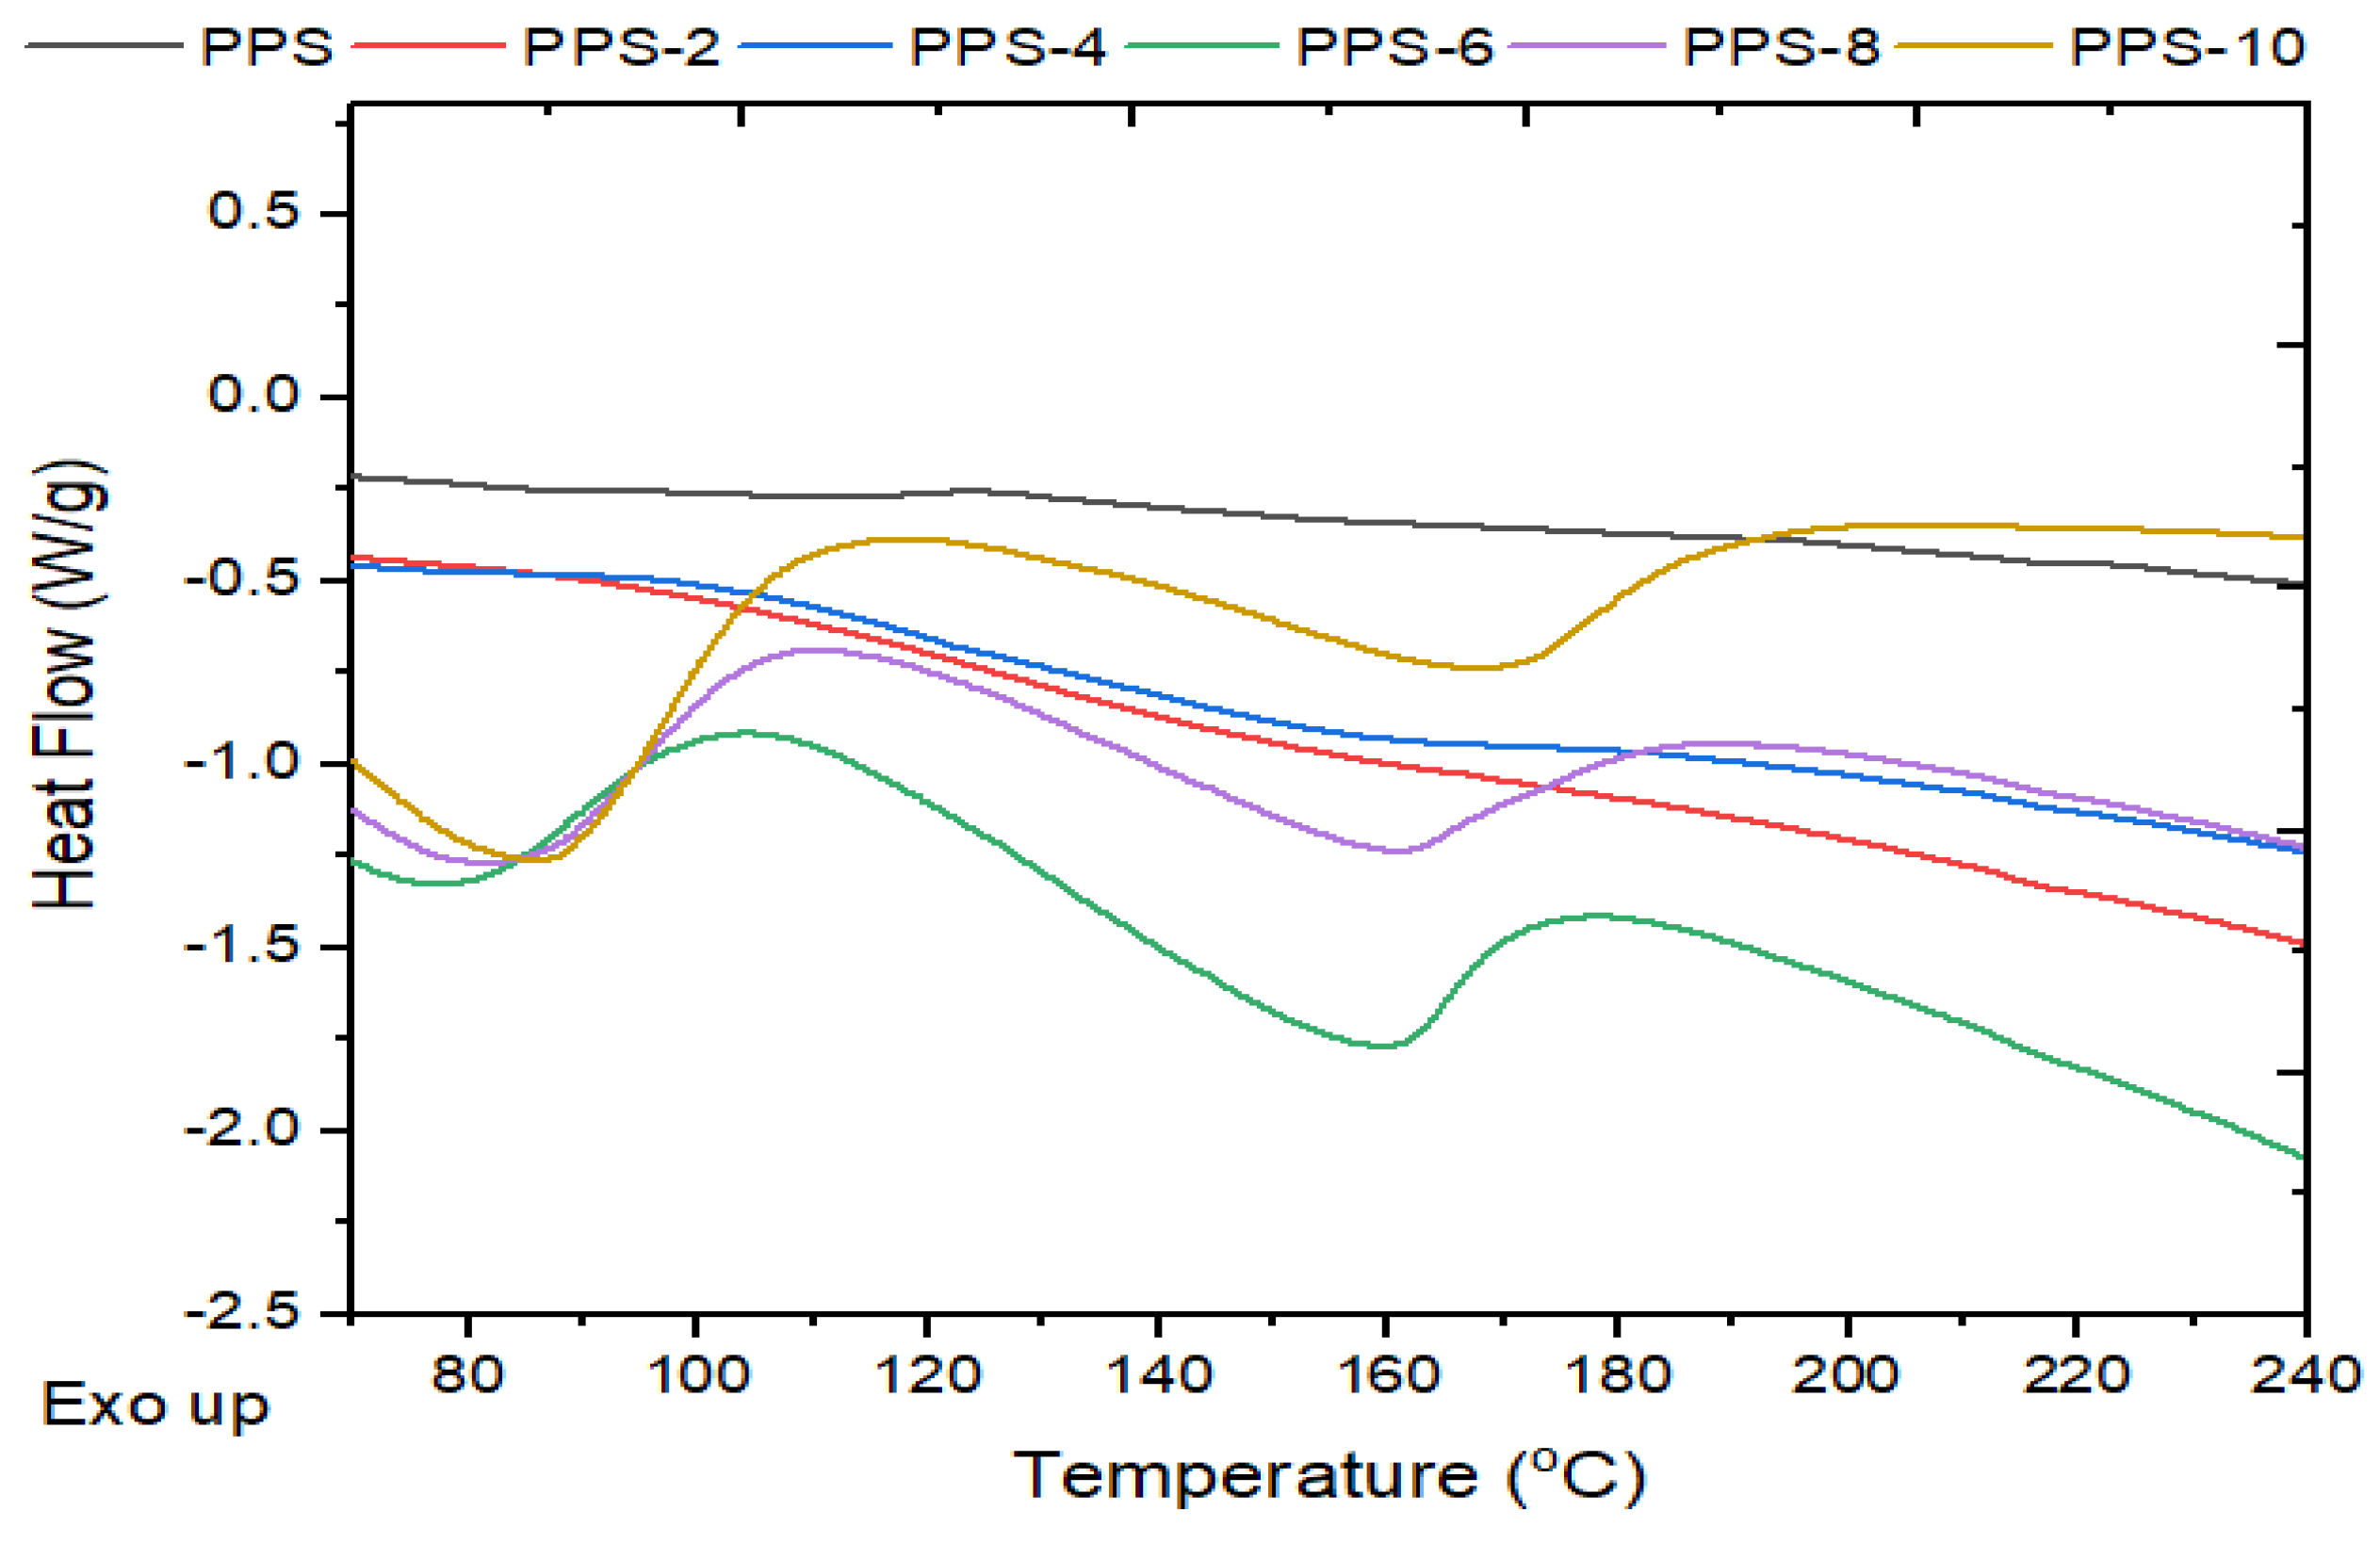
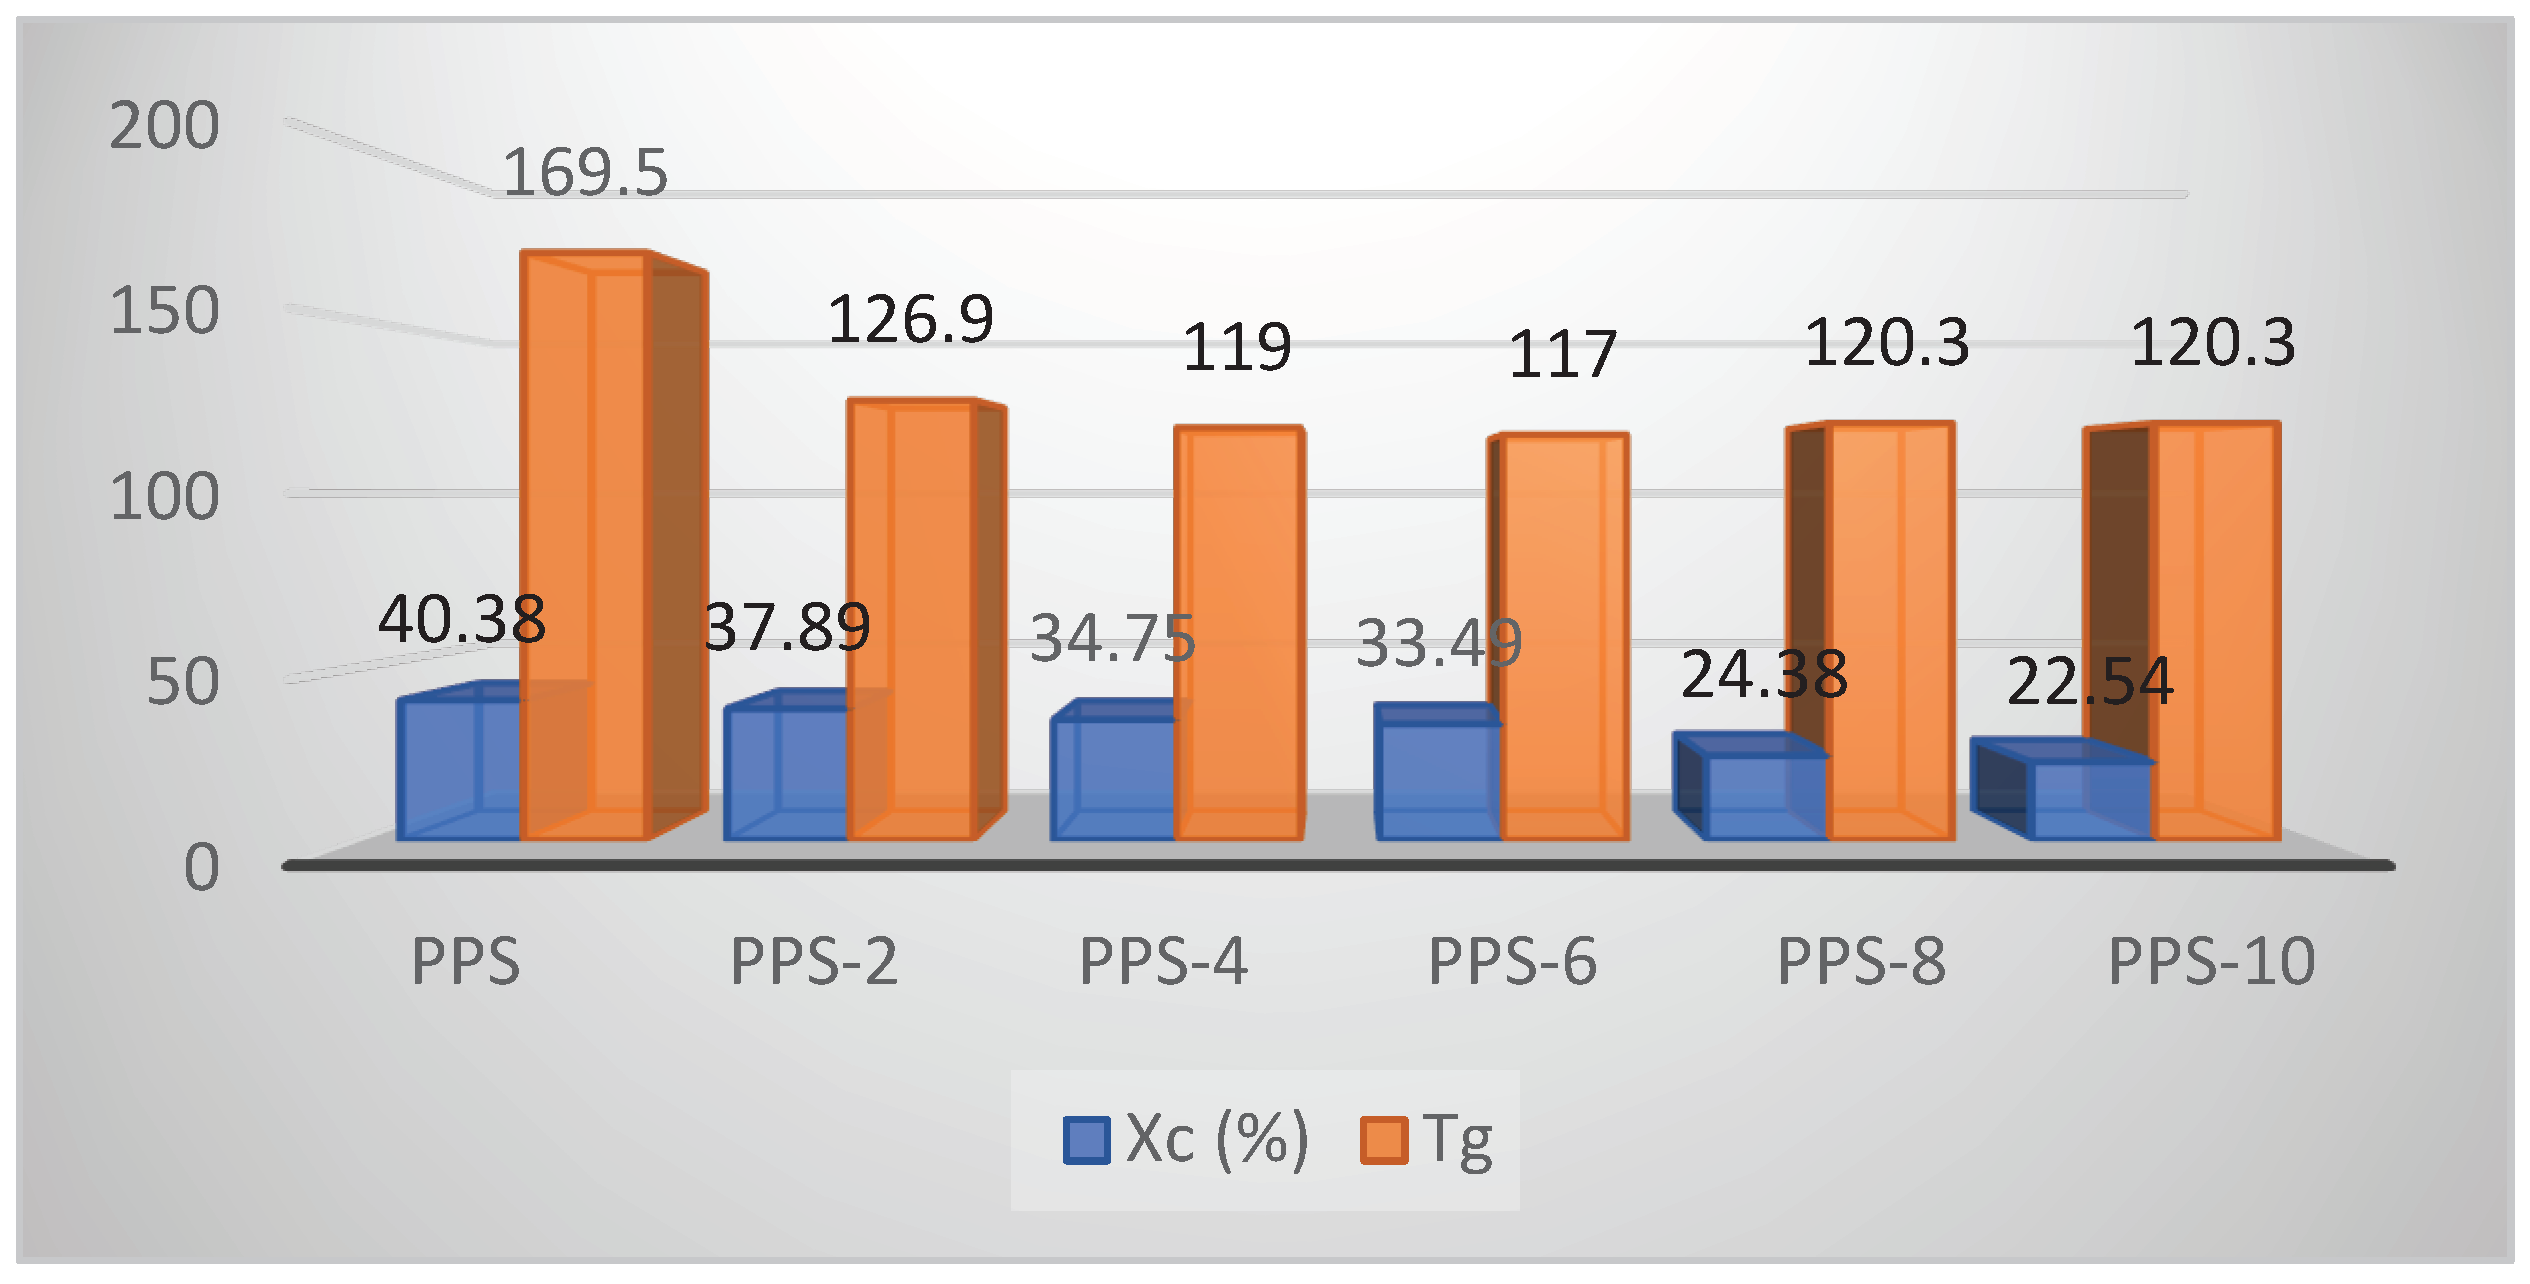
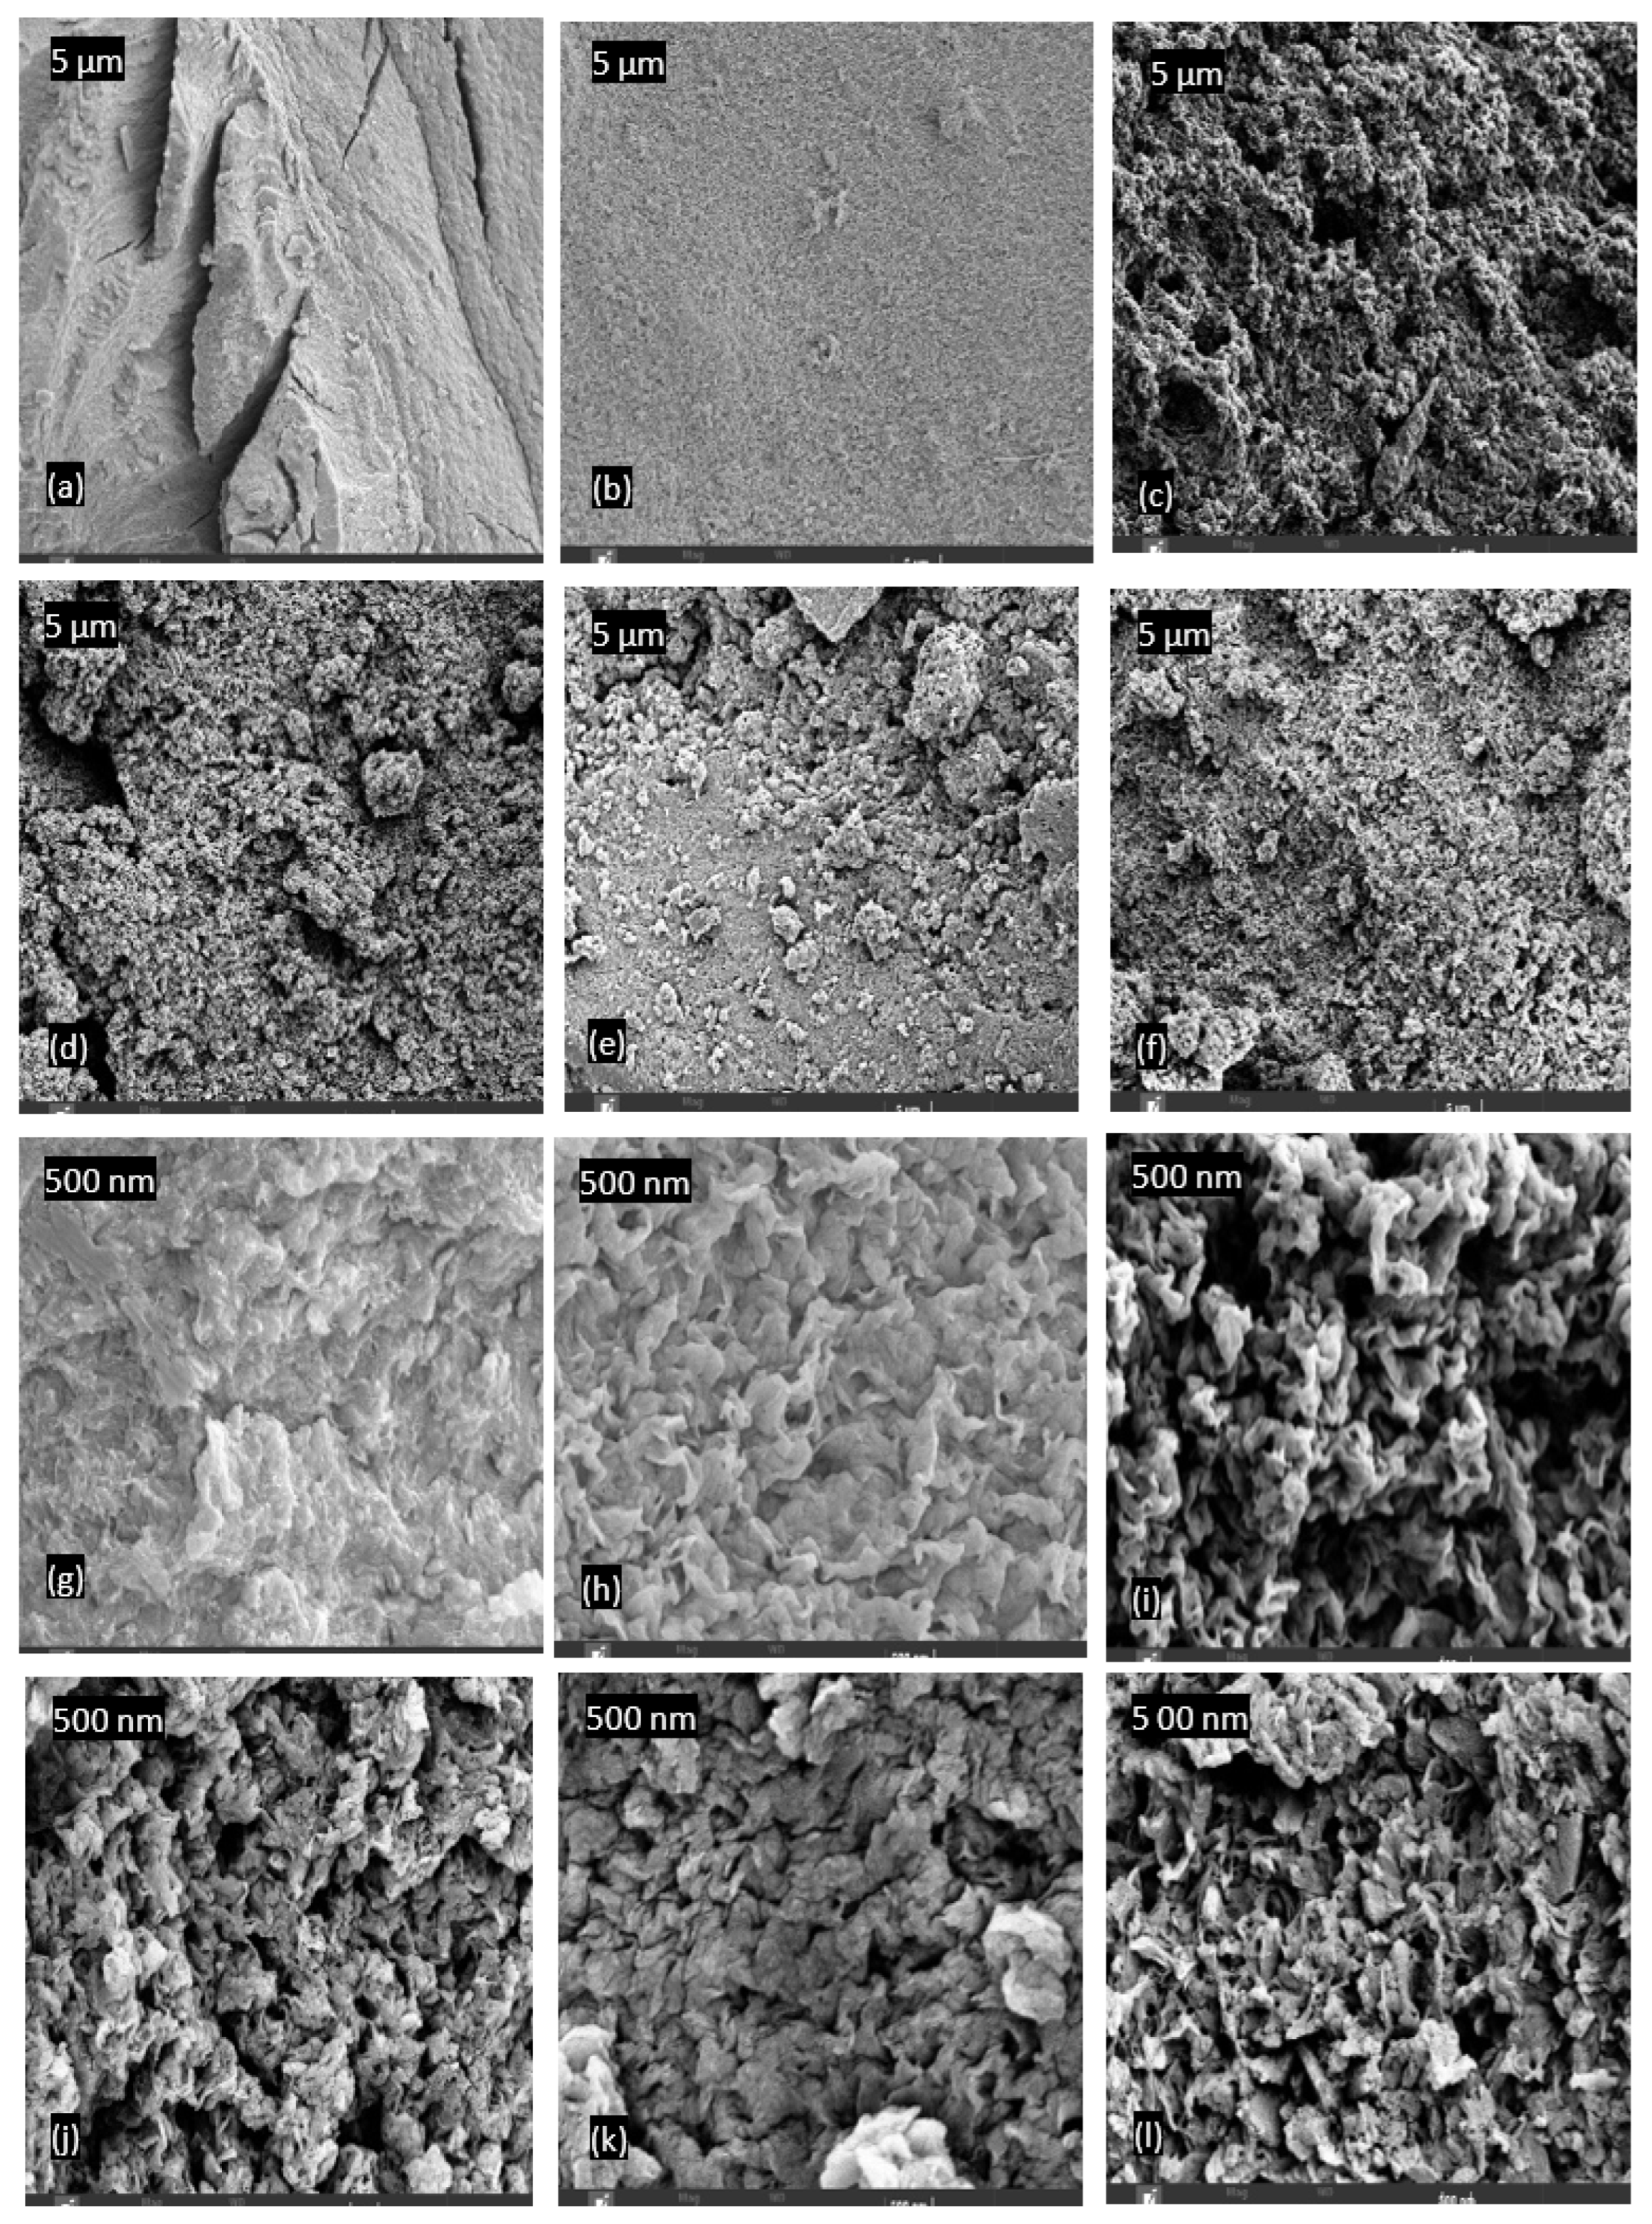
| Sample | Carbon (wt %) | Oxygen (wt %) | Potassium (wt %) |
|---|---|---|---|
| BC | 90.2 | 9.5 | 0.3 |
| Sample | Specific surface area (SBET) | Langmuir surface area (SL) | Average pore diameter (D) | |
|---|---|---|---|---|
| BC | 1517 m²/g | 2175 m²/g | 2.51 nm |
| Sample | Plane (002) | Plane (10) |
|---|---|---|
| BC | 28.4 | 40.7 |
| Sample | d002 (Å) | FWHM | Lc (nm) | La (nm) | N (Items) | δ (nm-2) | ε (x 10 -3) | ρ (g/cm3) | Crystallinity Index (%) |
|---|---|---|---|---|---|---|---|---|---|
| BC | 3.140 | 0.195 | 42.024 | 90.585 | 13.383 | 0.566 | 3.362 | 0.243 | 53.077 |
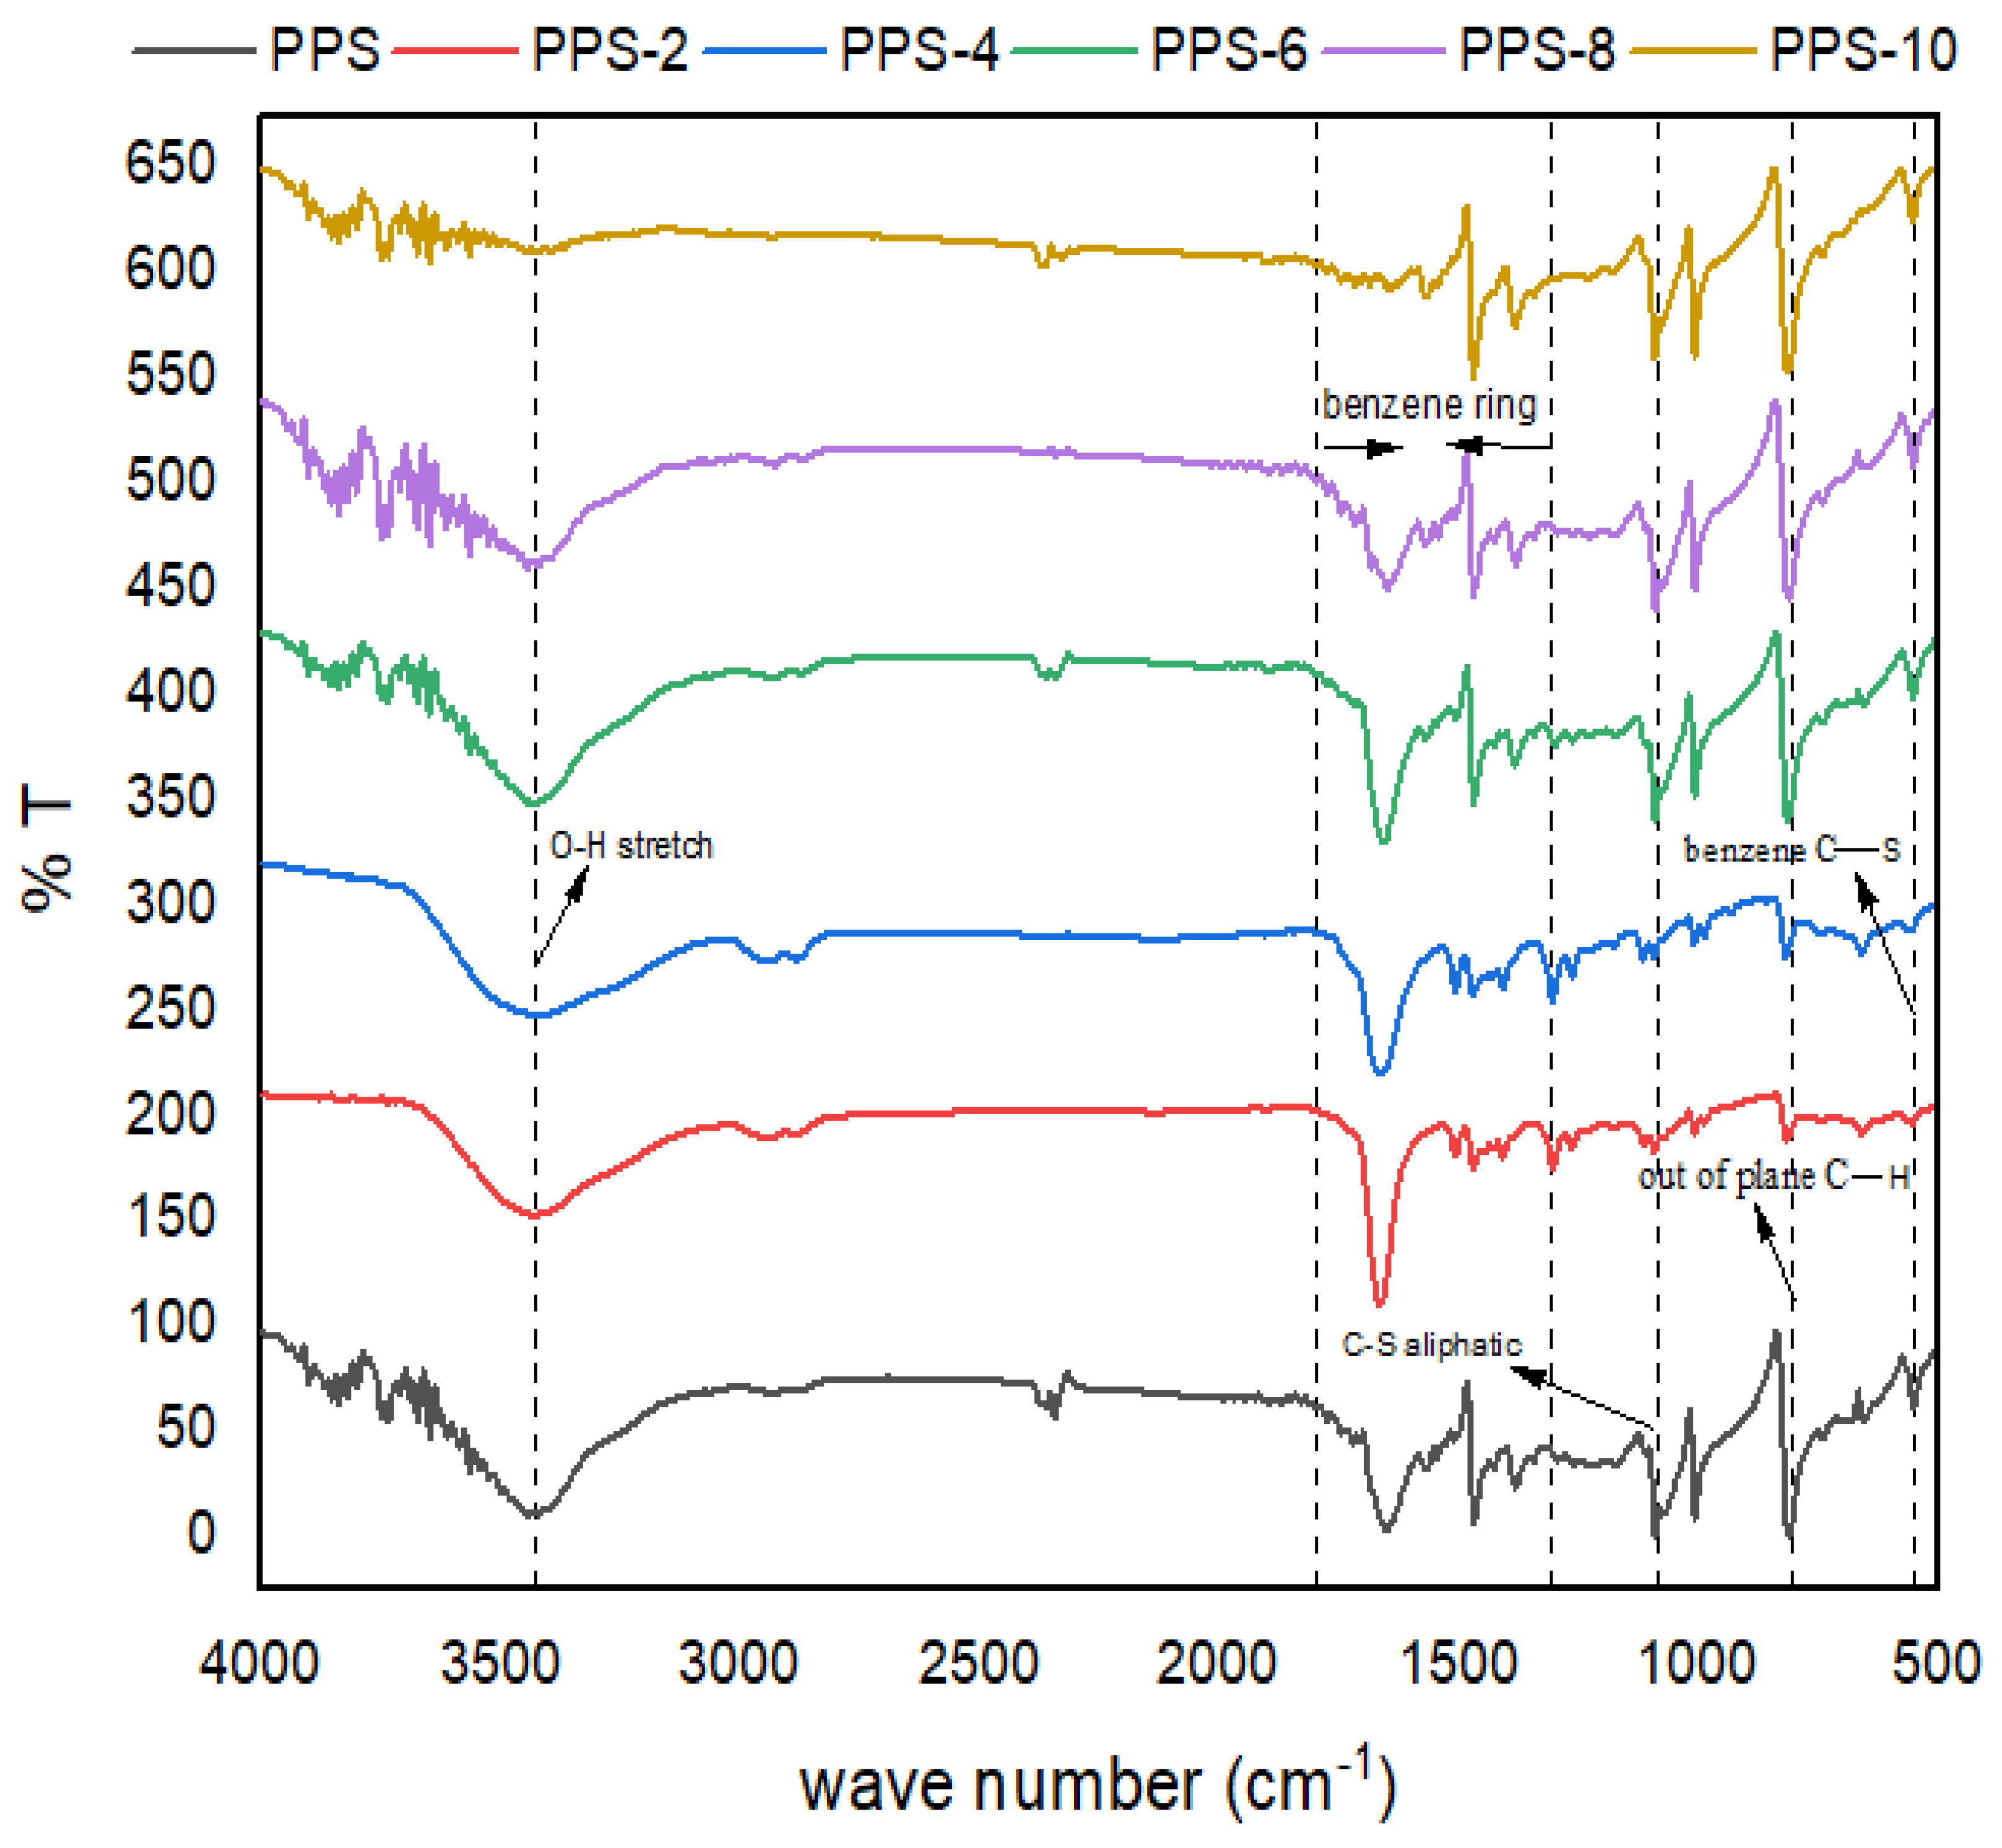
| Samples | Wavenumber (cm-1) | ||||||
|---|---|---|---|---|---|---|---|
|
O-H (stret) |
C-H (stret) |
Benz ring (sym stretch) |
Benz ring (asym stret) |
C-S (aliph stret) |
C-H (out of plane) | Benz ring (sym ring-S stretch) |
|
| PPS | - | 2373 (w) |
1454 (s) |
1382 (w) |
1087 (w) |
807 (m) |
476 (m) |
| PPS-2 | 3433 (w) |
2333 (w) |
1647 | 1462 (w) |
1082 (w) |
811 (m) |
469 (m) |
| PPS-4 | 3433 (s) |
2365 (w) |
1652 (s) |
1468 (w) |
1087 (w) |
817 (m) |
475 (m) |
| PPS-6 | 3433 (s) |
2341 (w) |
1657 (s) |
1468 (w) |
1089 (w) |
817 (m) |
480 (m) |
| PPS-8 | 3433 (s) |
2398 (w) |
1657 (s) |
1468 (w) |
1089 (w) |
811 (m) |
478 (m) |
| PPS-10 | 3433 (s) |
2364 (w) |
1652 (s) |
1468 (w) |
1084 (w) |
811 (m) |
475 (m) |
| aliph= aliphatic, stret = stretching, sym= symmetric, asym= asymmetric, Benz = Benzene, w = Weak, s = Sharp, m = Medium | |||||||
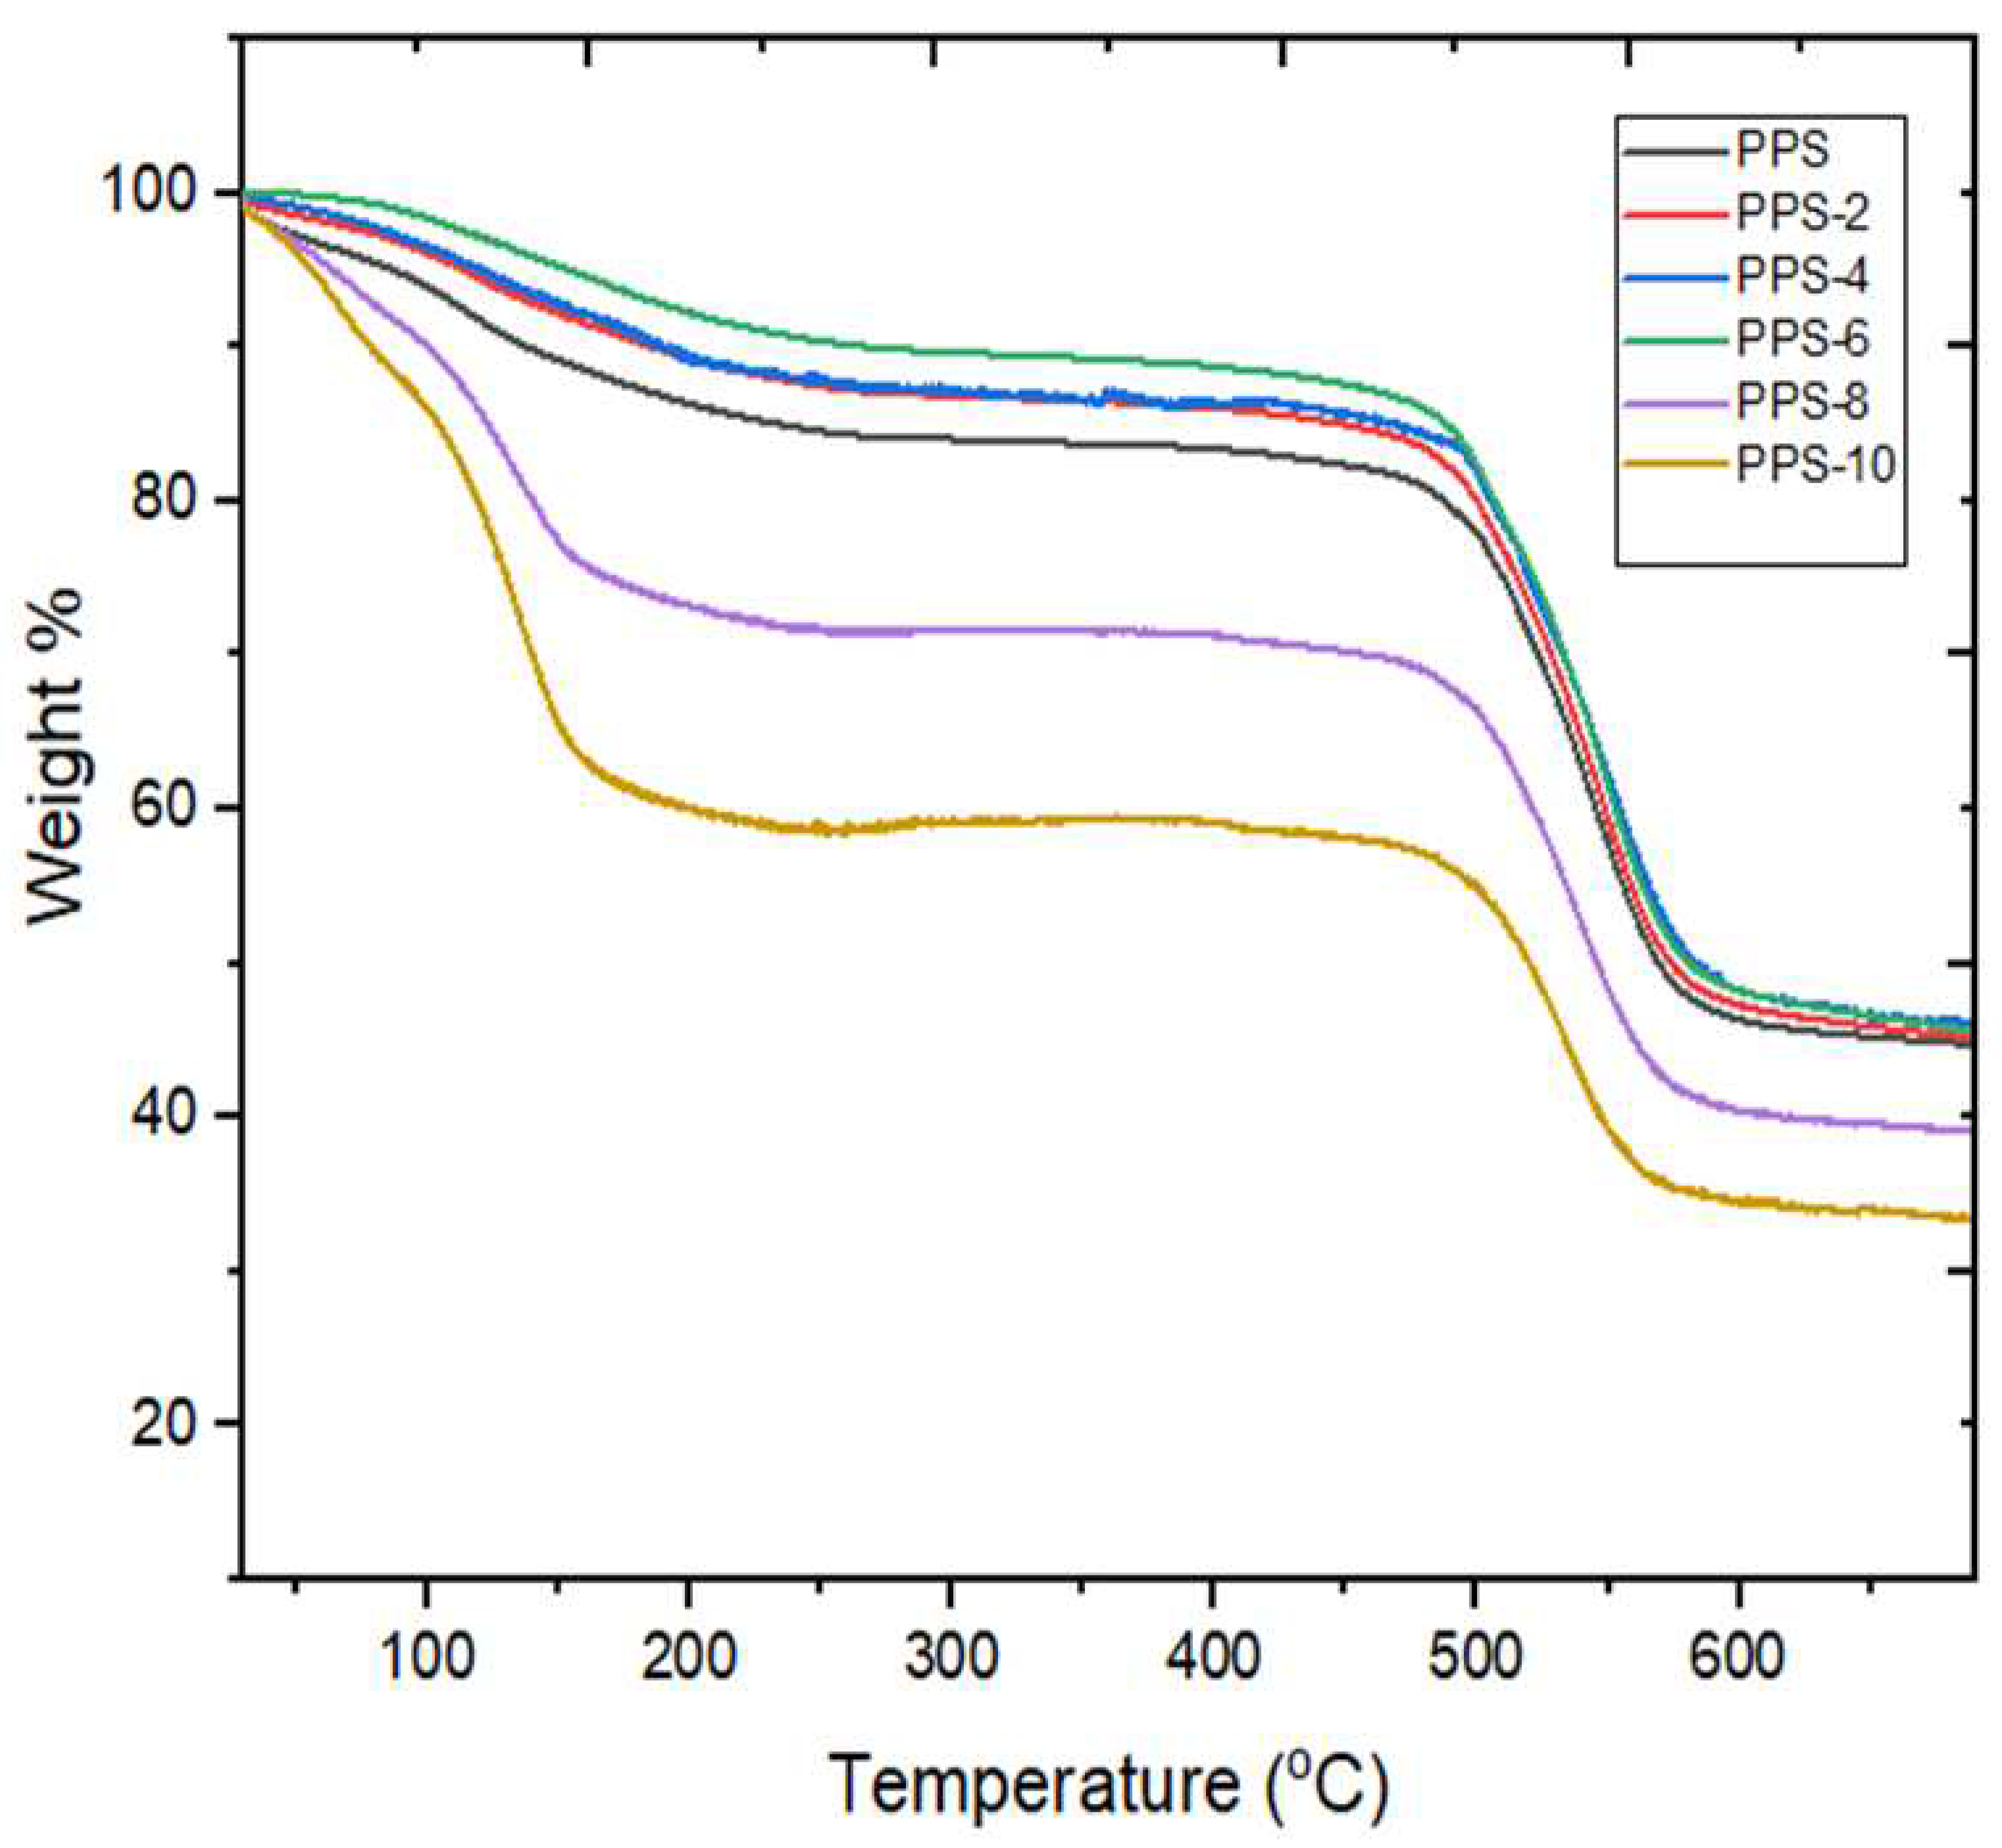
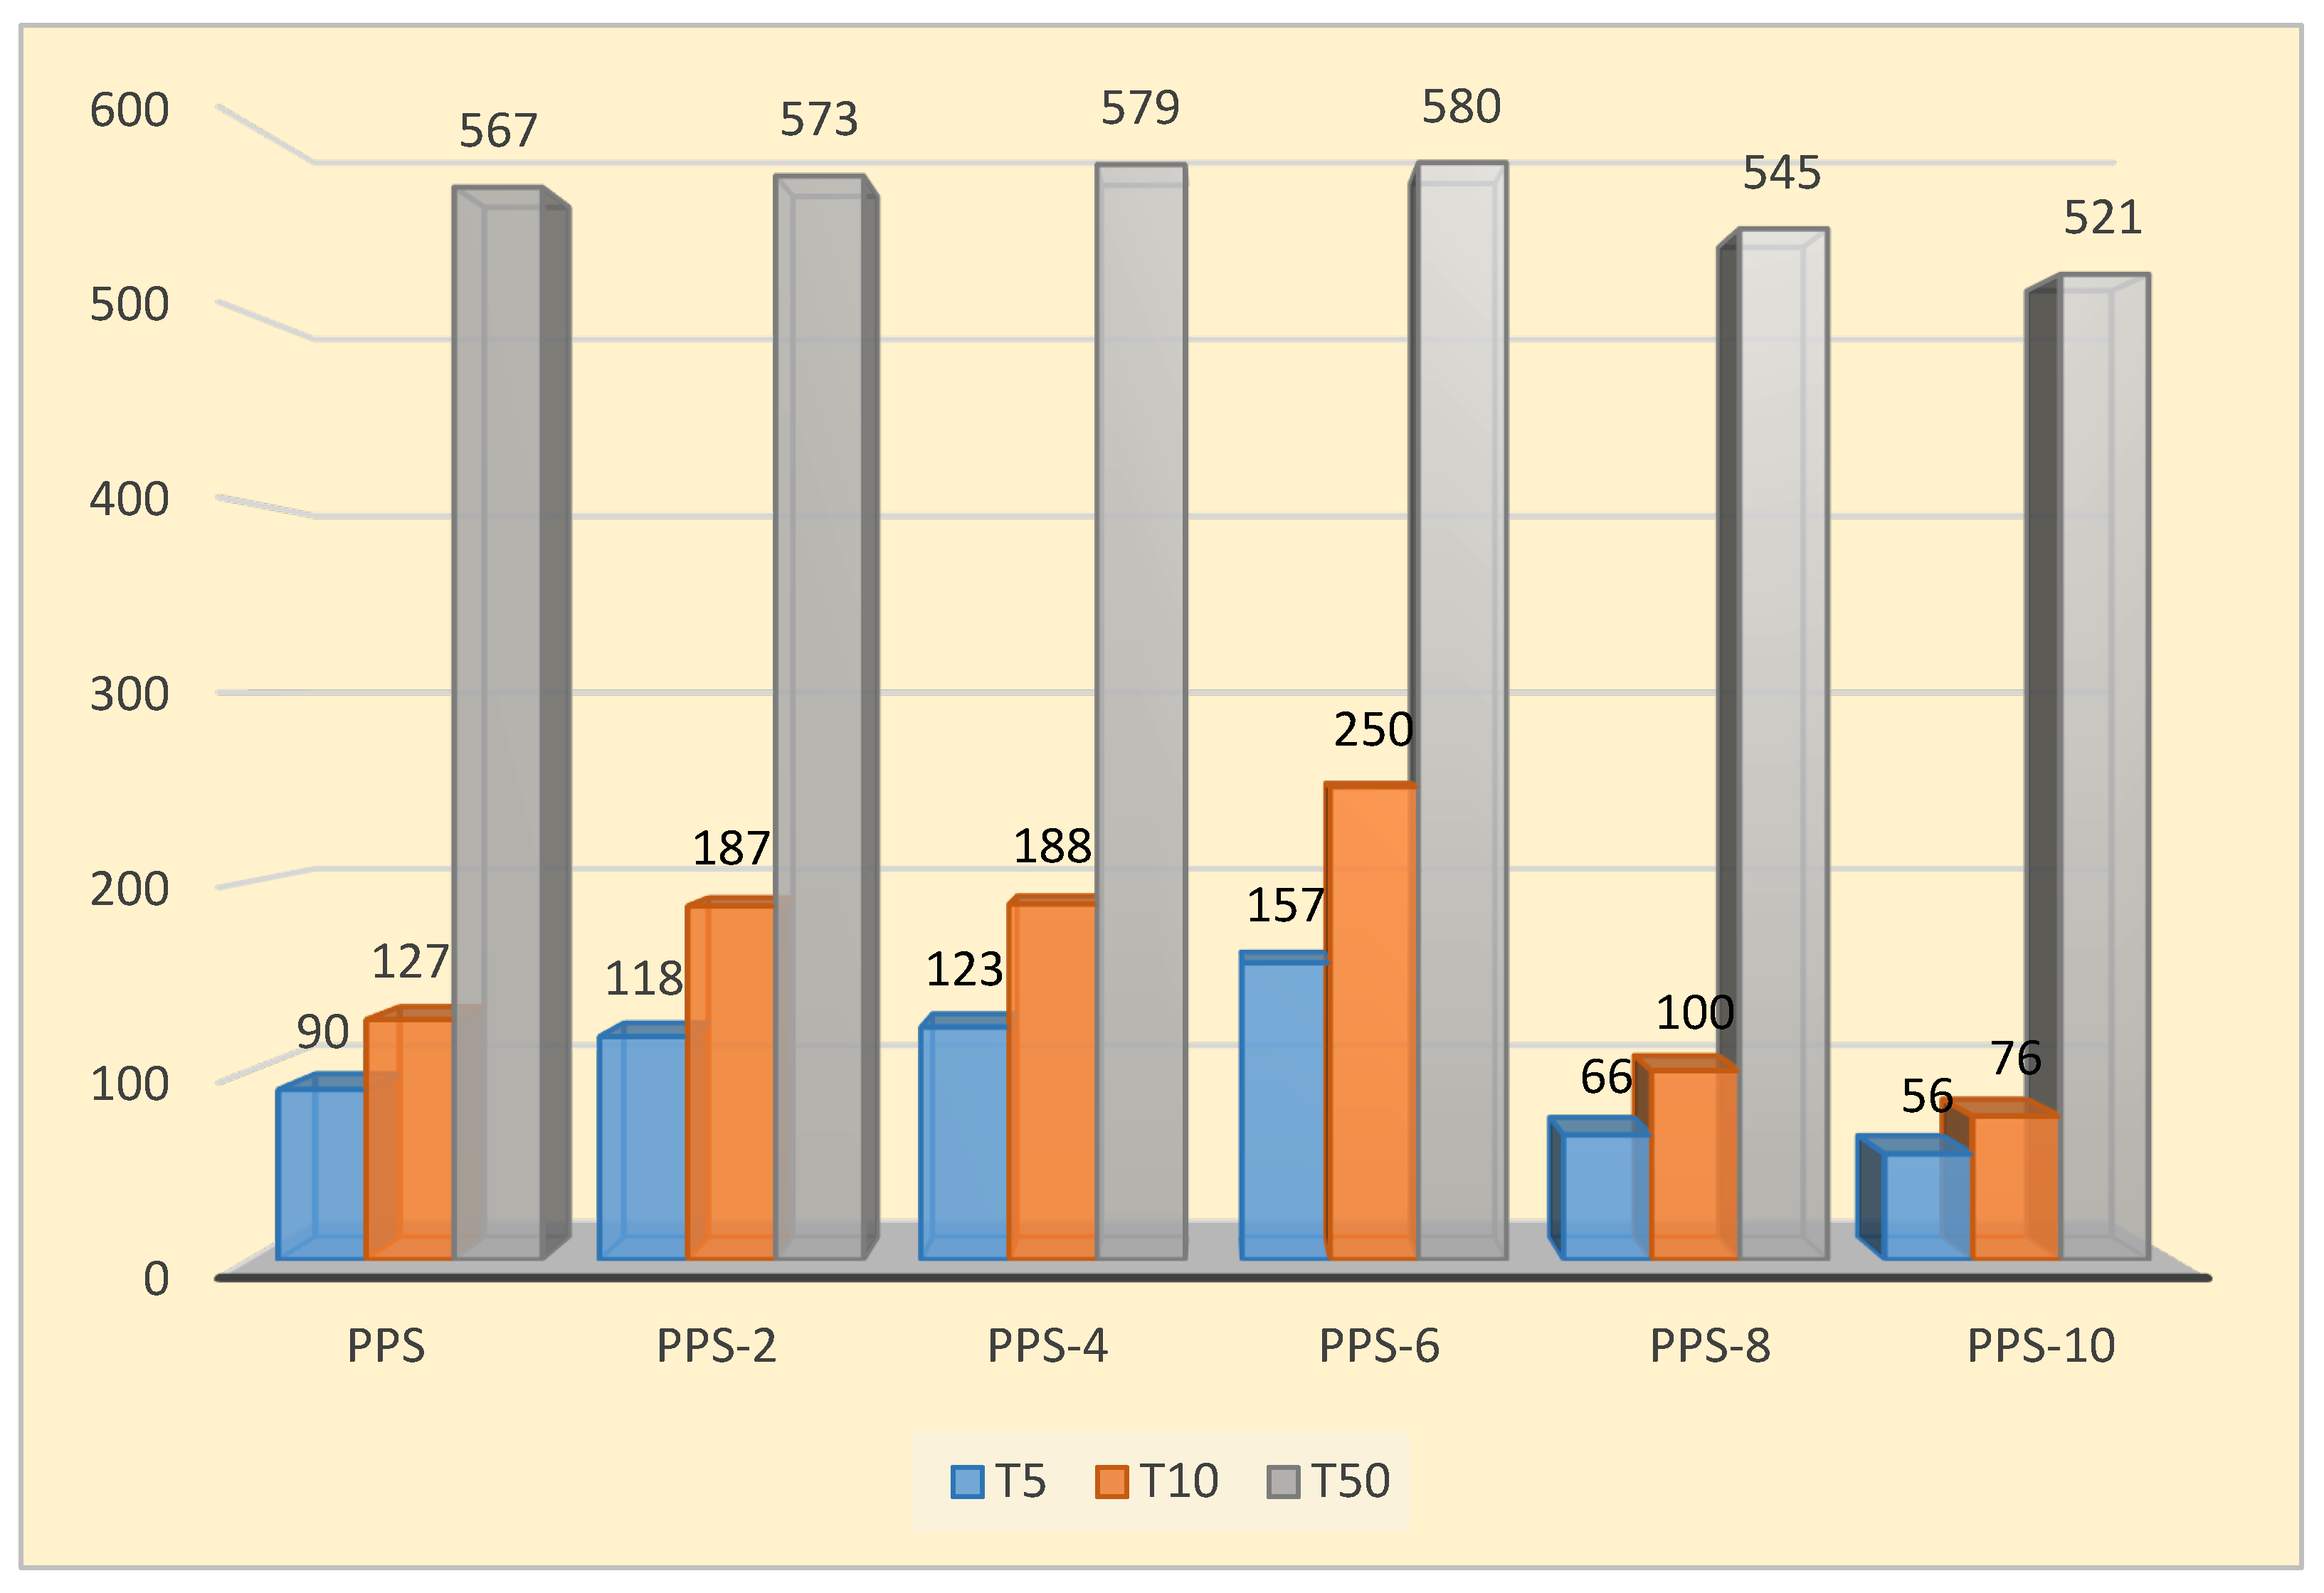
| Compounds | T5 (oC ) | T10 (oC ) | T50 (oC ) | Tf (oC ) | Rf (%) |
|---|---|---|---|---|---|
| PPS | 90 | 127 | 567 | 646 | 45 |
| PPS-2 | 118 | 187 | 573 | 654 | 46 |
| PPS-4 | 123 | 188 | 579 | 656 | 46 |
| PPS-6 | 157 | 250 | 580 | 659 | 46 |
| PPS-8 | 66 | 100 | 545 | 645 | 39 |
| PPS-10 | 56 | 76 | 521 | 606 | 34 |
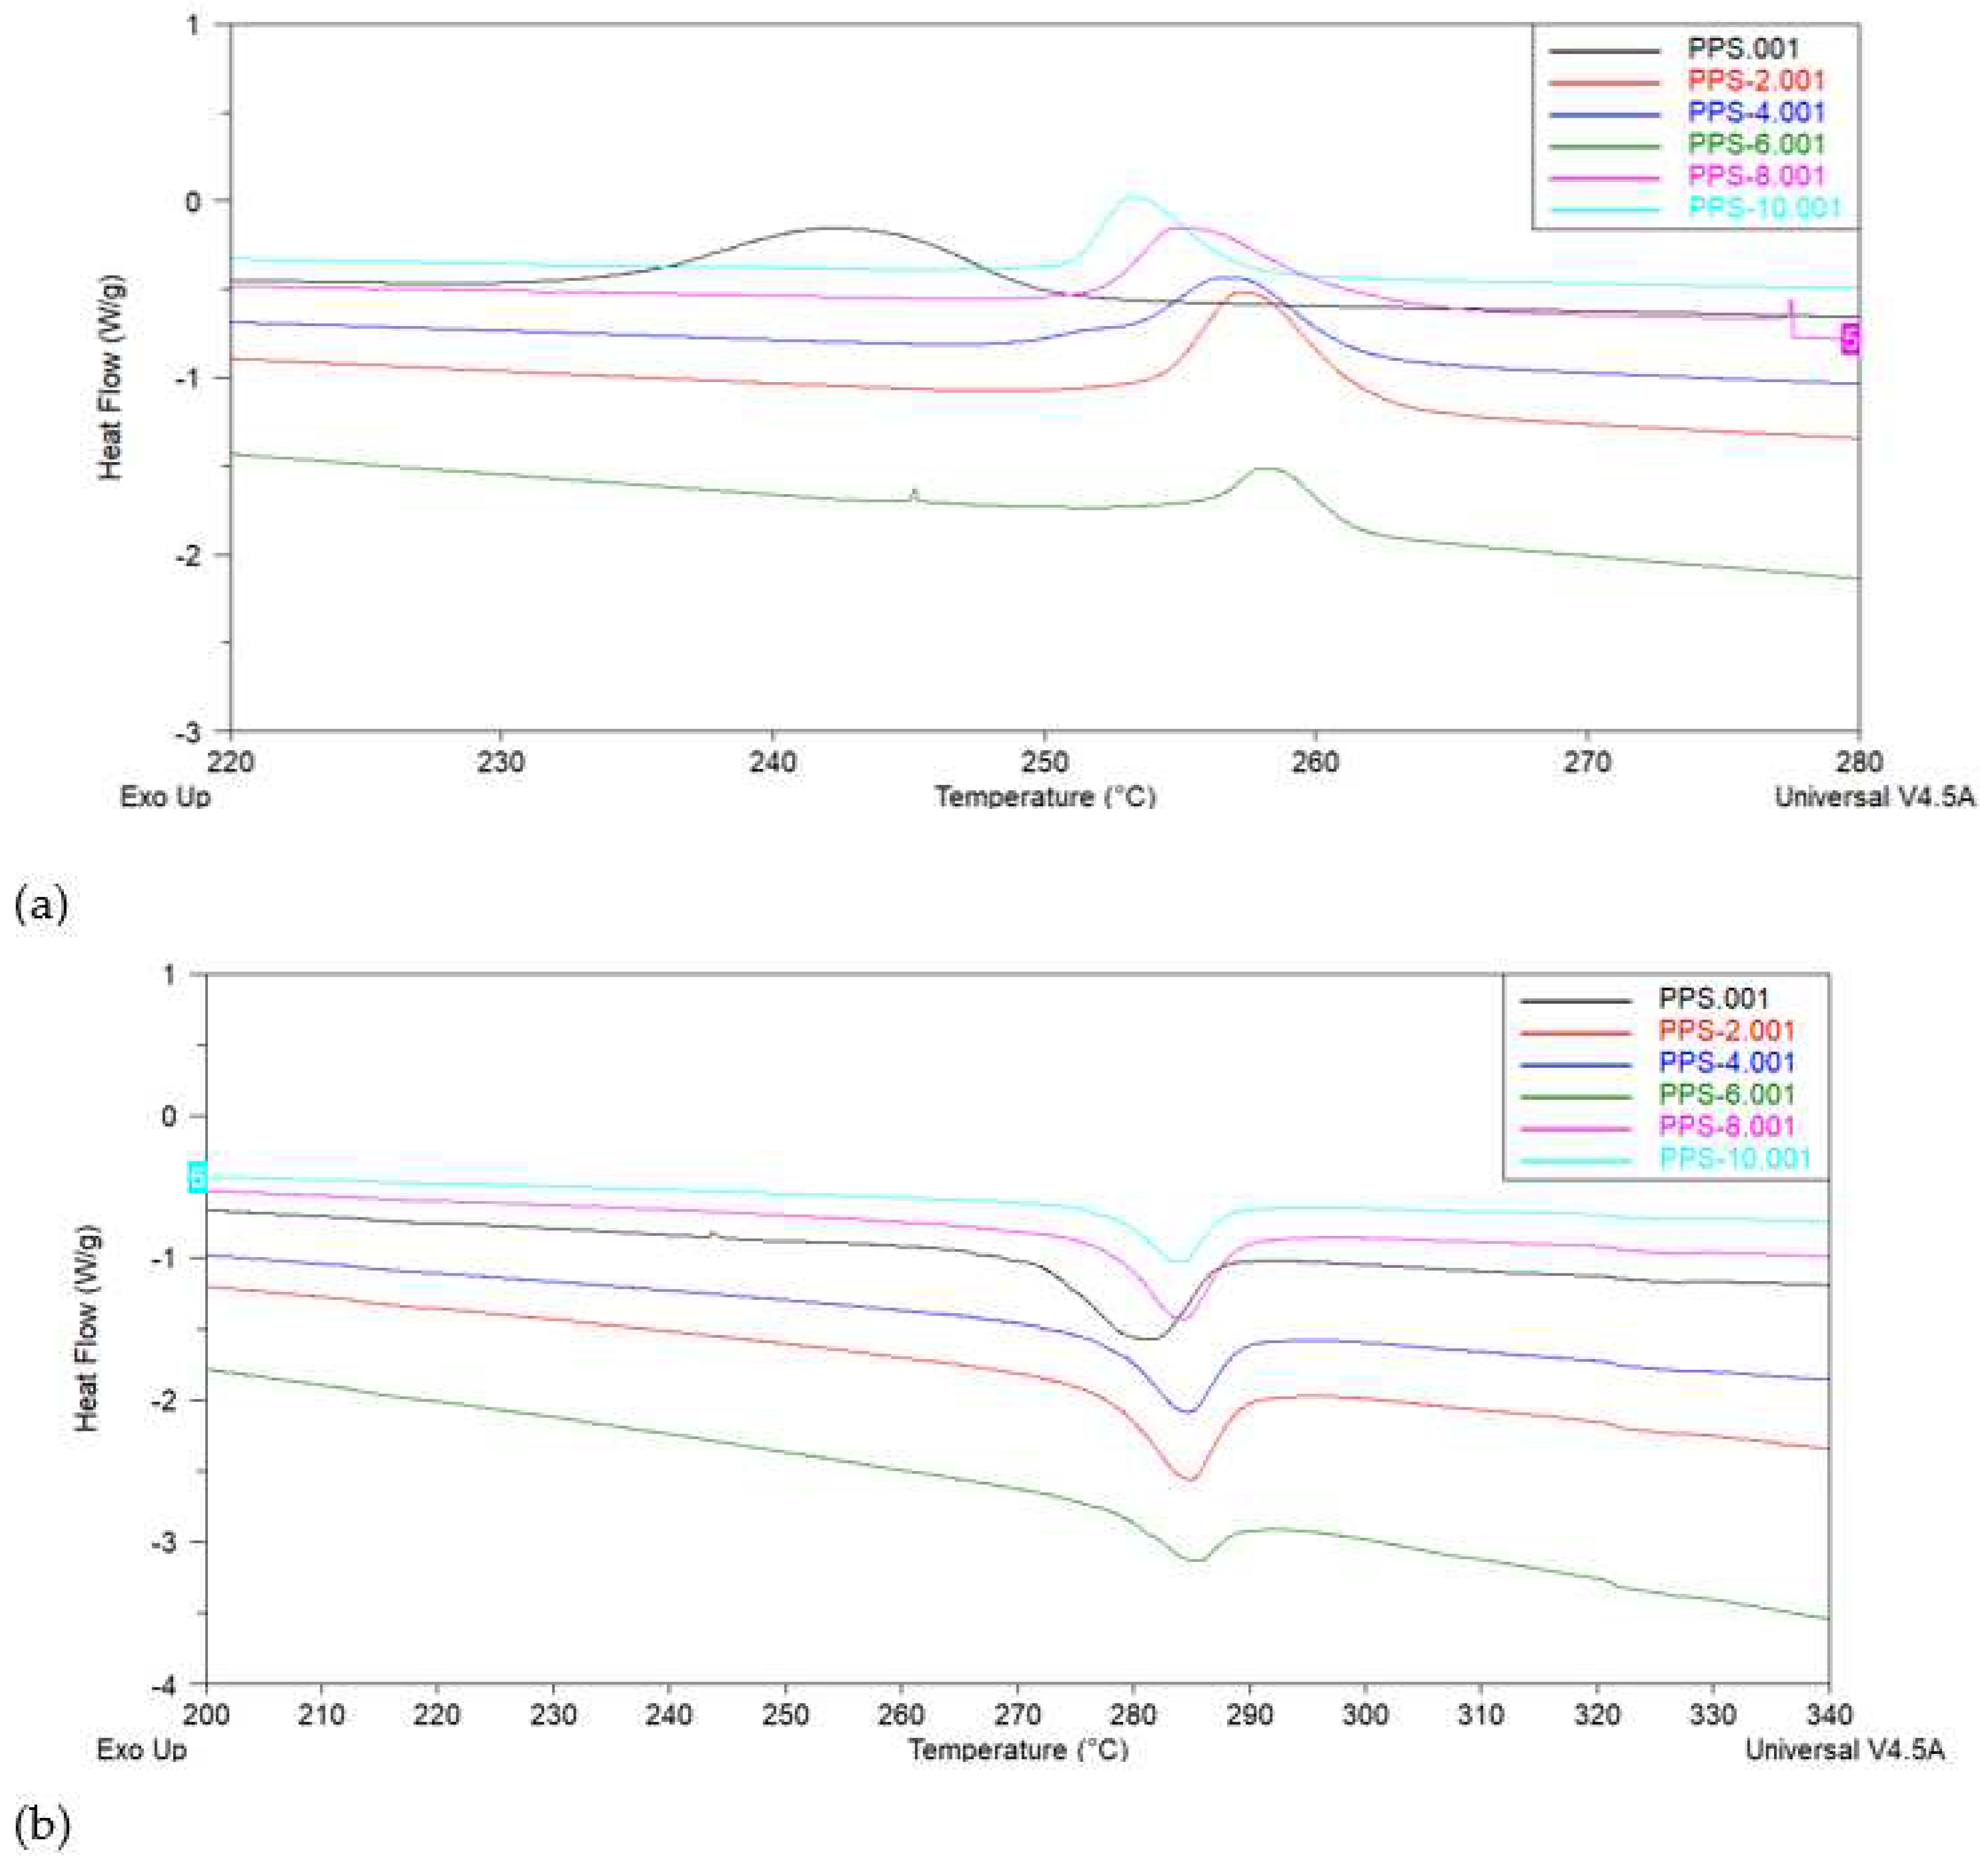
| Compounds | Toc (°C) | Tc (°C) | ∆Hc (J/g) | Tom (°C) | Tm (°C) | ∆Hm (J/g) | ∆T (°C) |
Xc (%) | Tg (°C) |
|---|---|---|---|---|---|---|---|---|---|
| PPS | 252.1 | 242.5 | 45.2 | 261.7 | 281.8 | 35.9 | 38.5 | 40.4 | 134.7 |
| PPS-2 | 265.2 | 257.4 | 41.6 | 271.6 | 284.8 | 29.2 | 27.4 | 37.89 | 129.6 |
| PPS-4 | 264.8 | 256.9 | 35.8 | 263.4 | 284.5 | 28.6 | 27.5 | 34.7 | 119.4 |
| PPS-6 | 269.5 | 258.3 | 36.0 | 274.5 | 284.8 | 12.0 | 26.5 | 33.5 | 117.5 |
| PPS-8 | 268.4 | 255.1 | 25.7 | 265.6 | 283.9 | 28.6 | 28.8 | 24.4 | 135.4 |
| PPS-10 | 269.5 | 253.2 | 22.7 | 268.8 | 283.9 | 16.7 | 30.6 | 22.5 | 149.8 |
Disclaimer/Publisher’s Note: The statements, opinions and data contained in all publications are solely those of the individual author(s) and contributor(s) and not of MDPI and/or the editor(s). MDPI and/or the editor(s) disclaim responsibility for any injury to people or property resulting from any ideas, methods, instructions or products referred to in the content. |
© 2023 by the authors. Licensee MDPI, Basel, Switzerland. This article is an open access article distributed under the terms and conditions of the Creative Commons Attribution (CC BY) license (http://creativecommons.org/licenses/by/4.0/).


