Submitted:
20 March 2023
Posted:
20 March 2023
You are already at the latest version
Abstract
Keywords:
1. Introduction
2. Materials and Methods
2.1. Material Preparation
2.2. Analysis
2.3. Calculation of the Energy Diagram of UV Induced Processes
3. Results
3.1. Ethylene Bridged PMO [39,40]
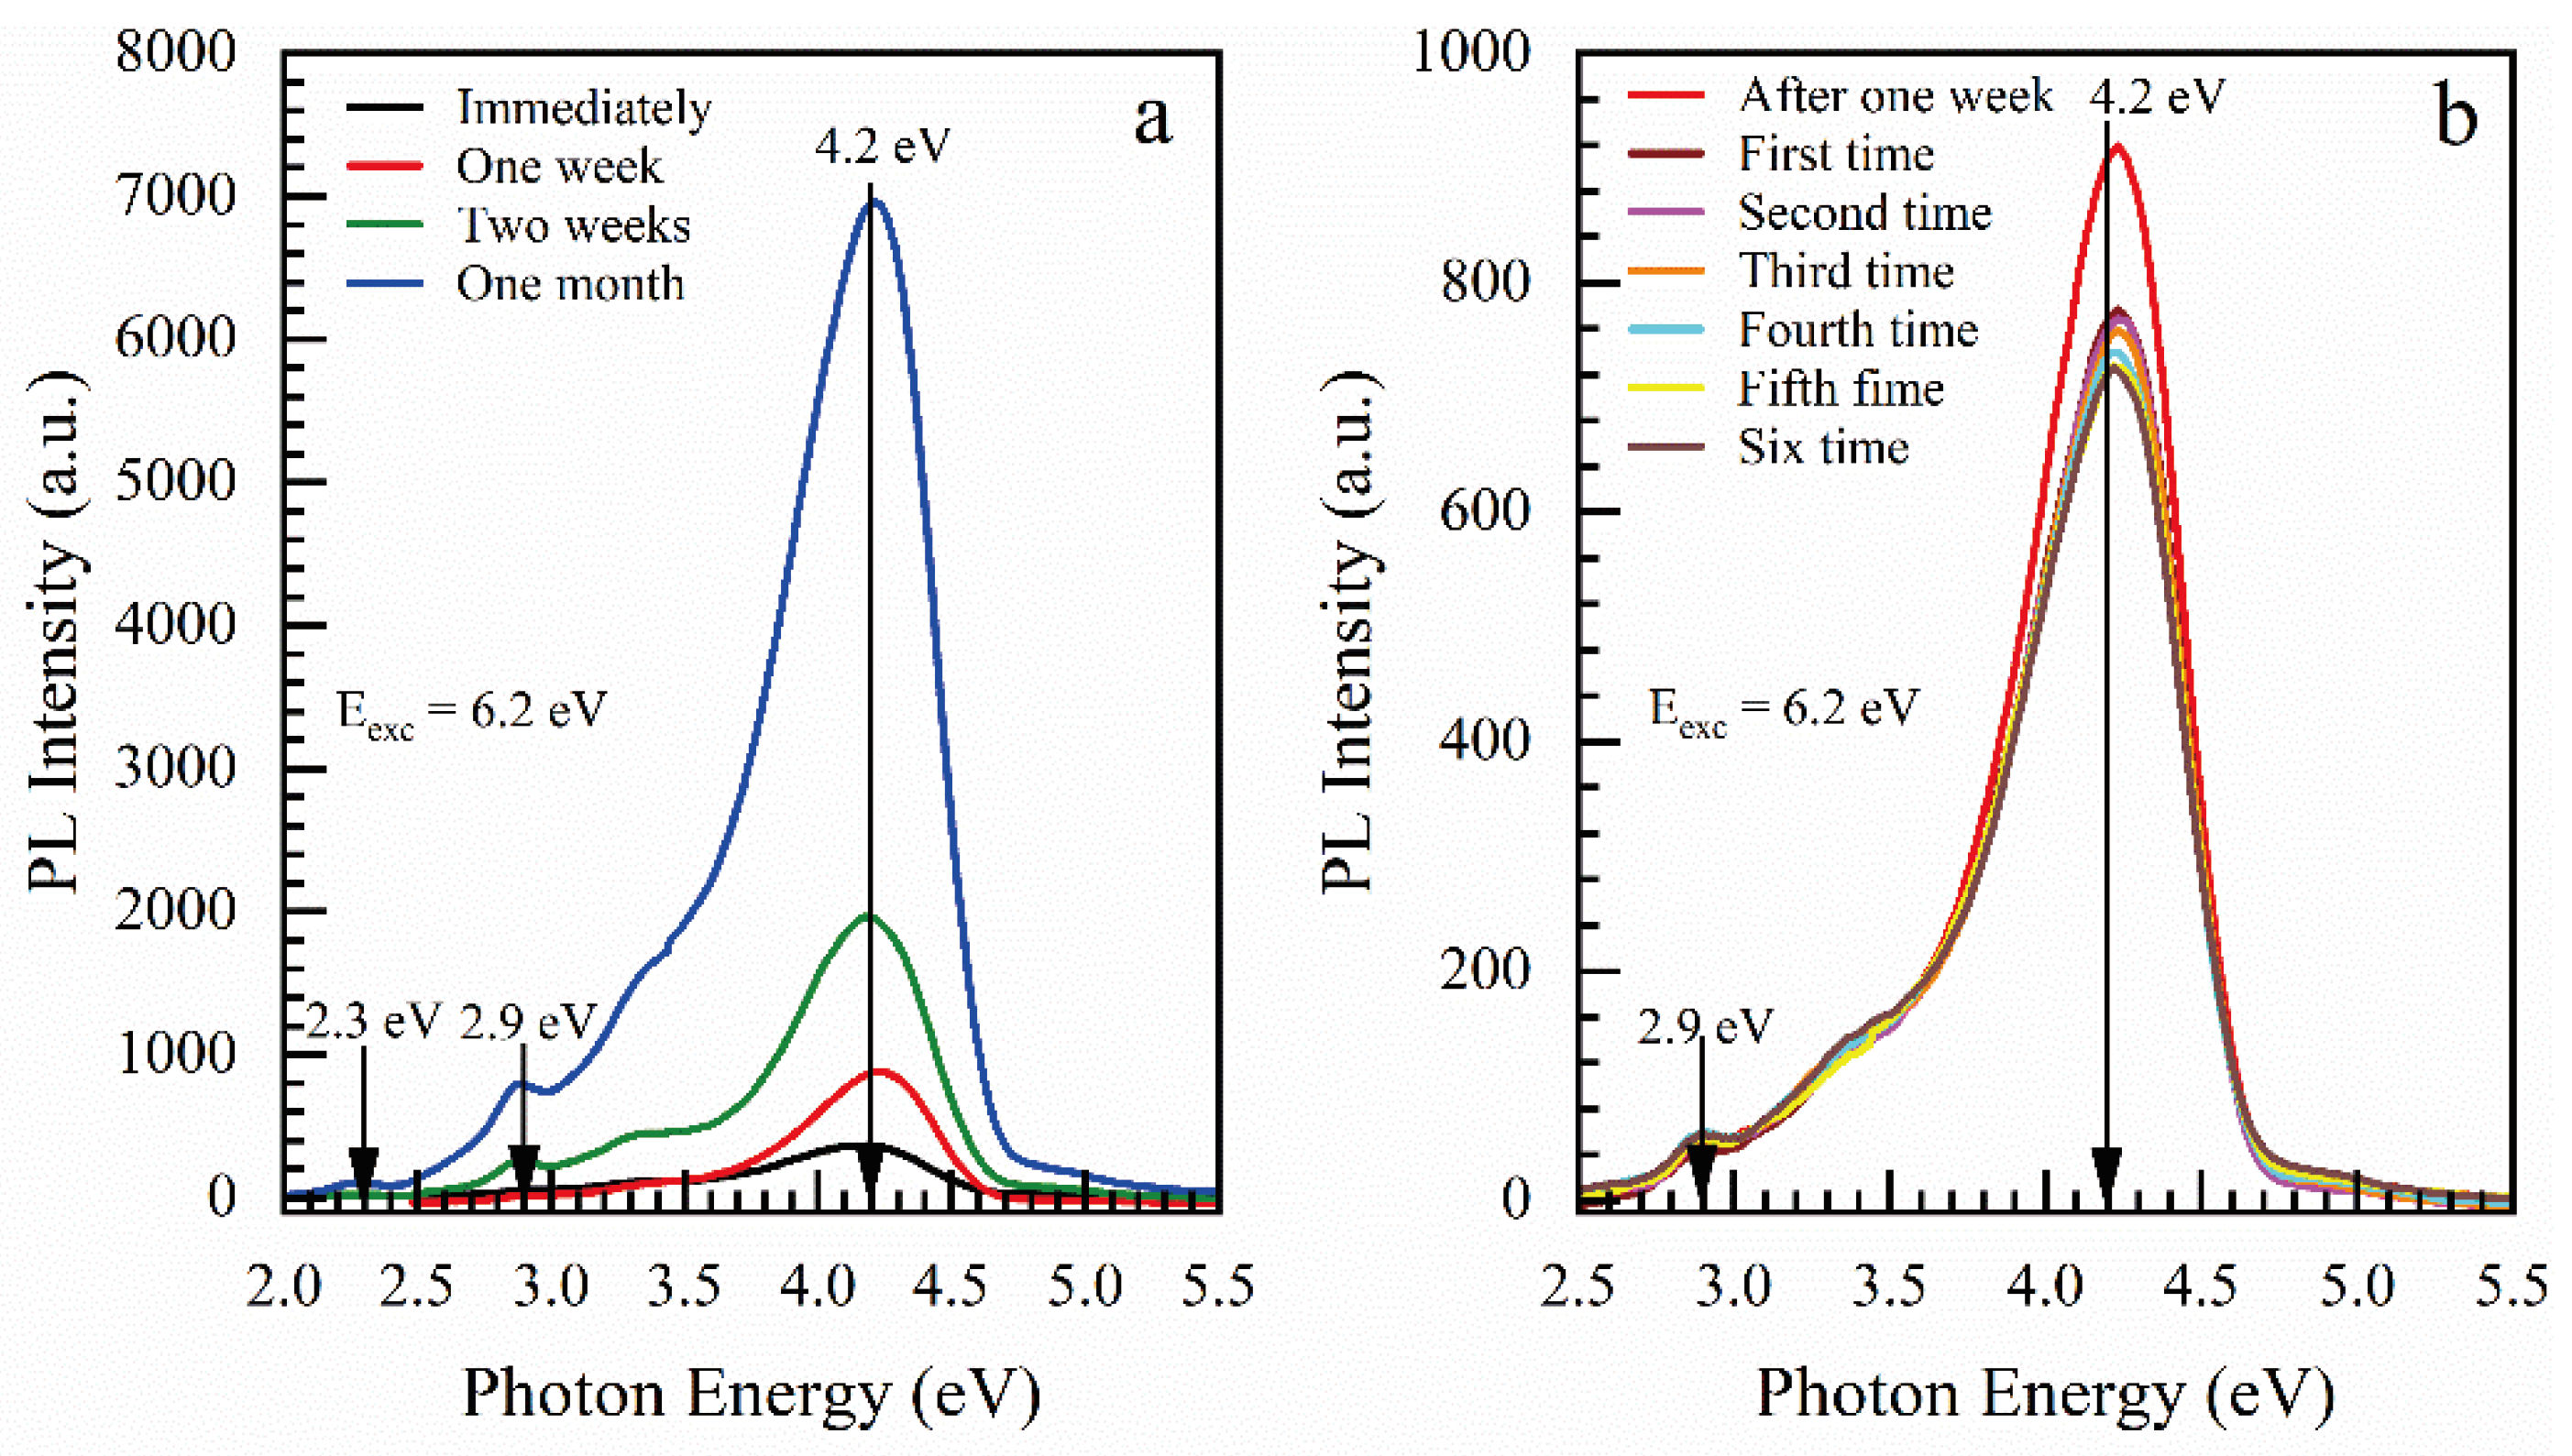
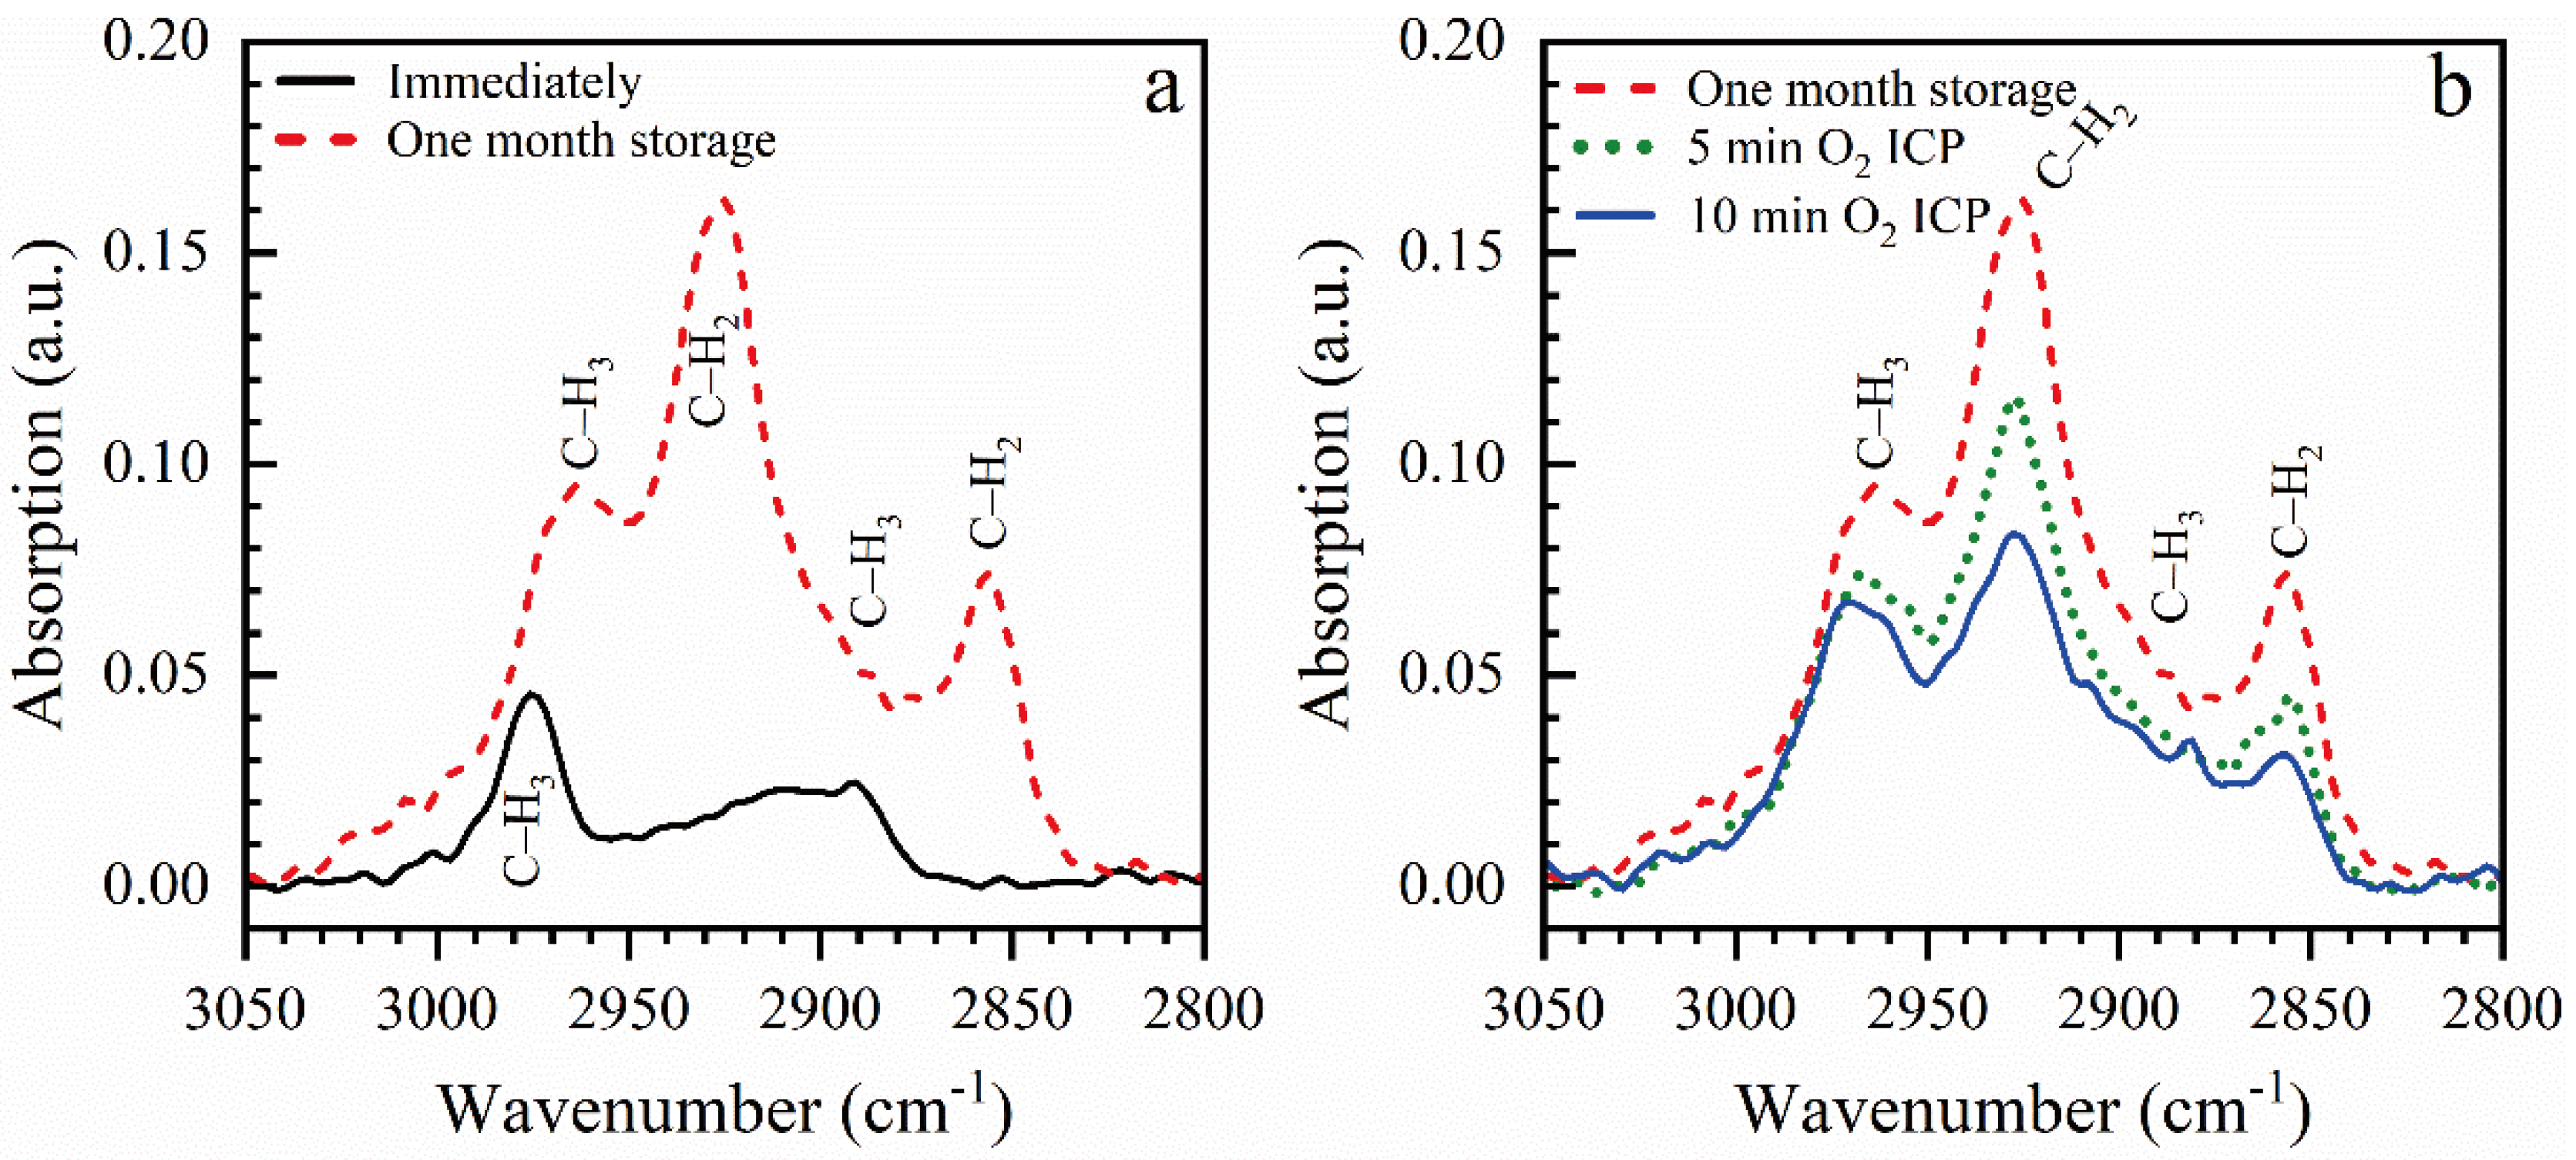
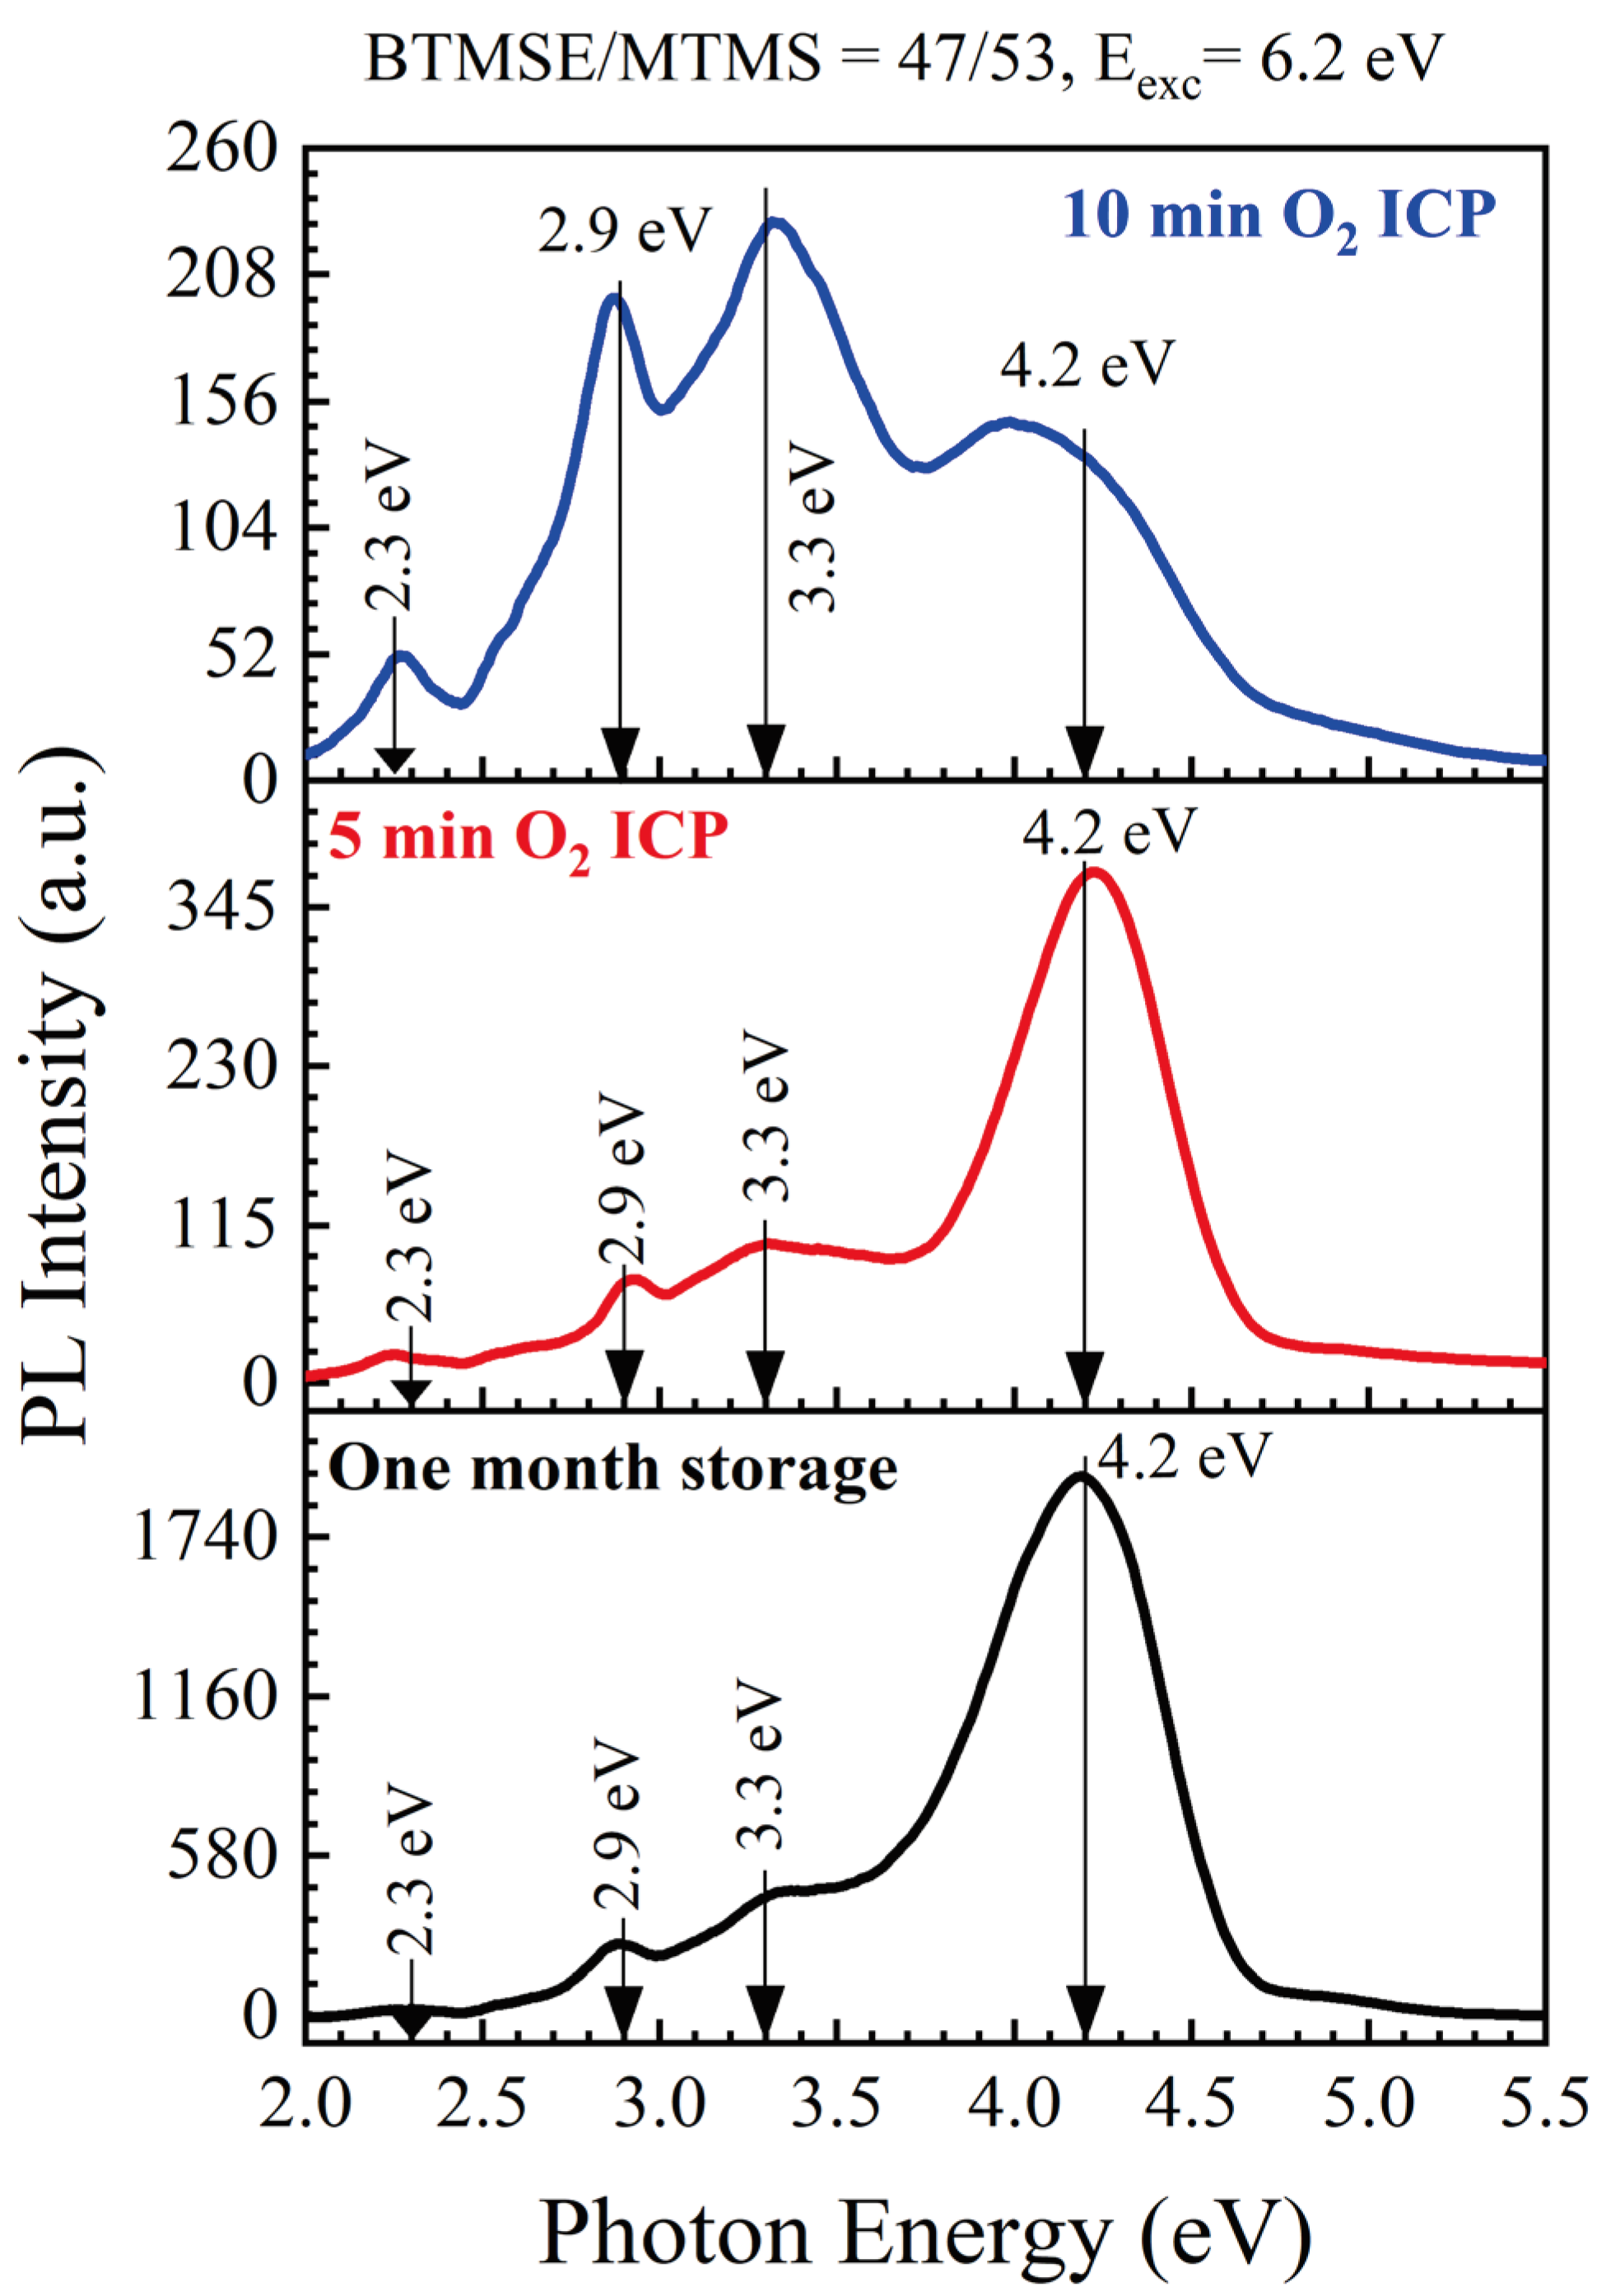
3.1.1. Effect of Storage and ICP Oxygen Plasma
3.2. Benzene Bridged Organosilica Films
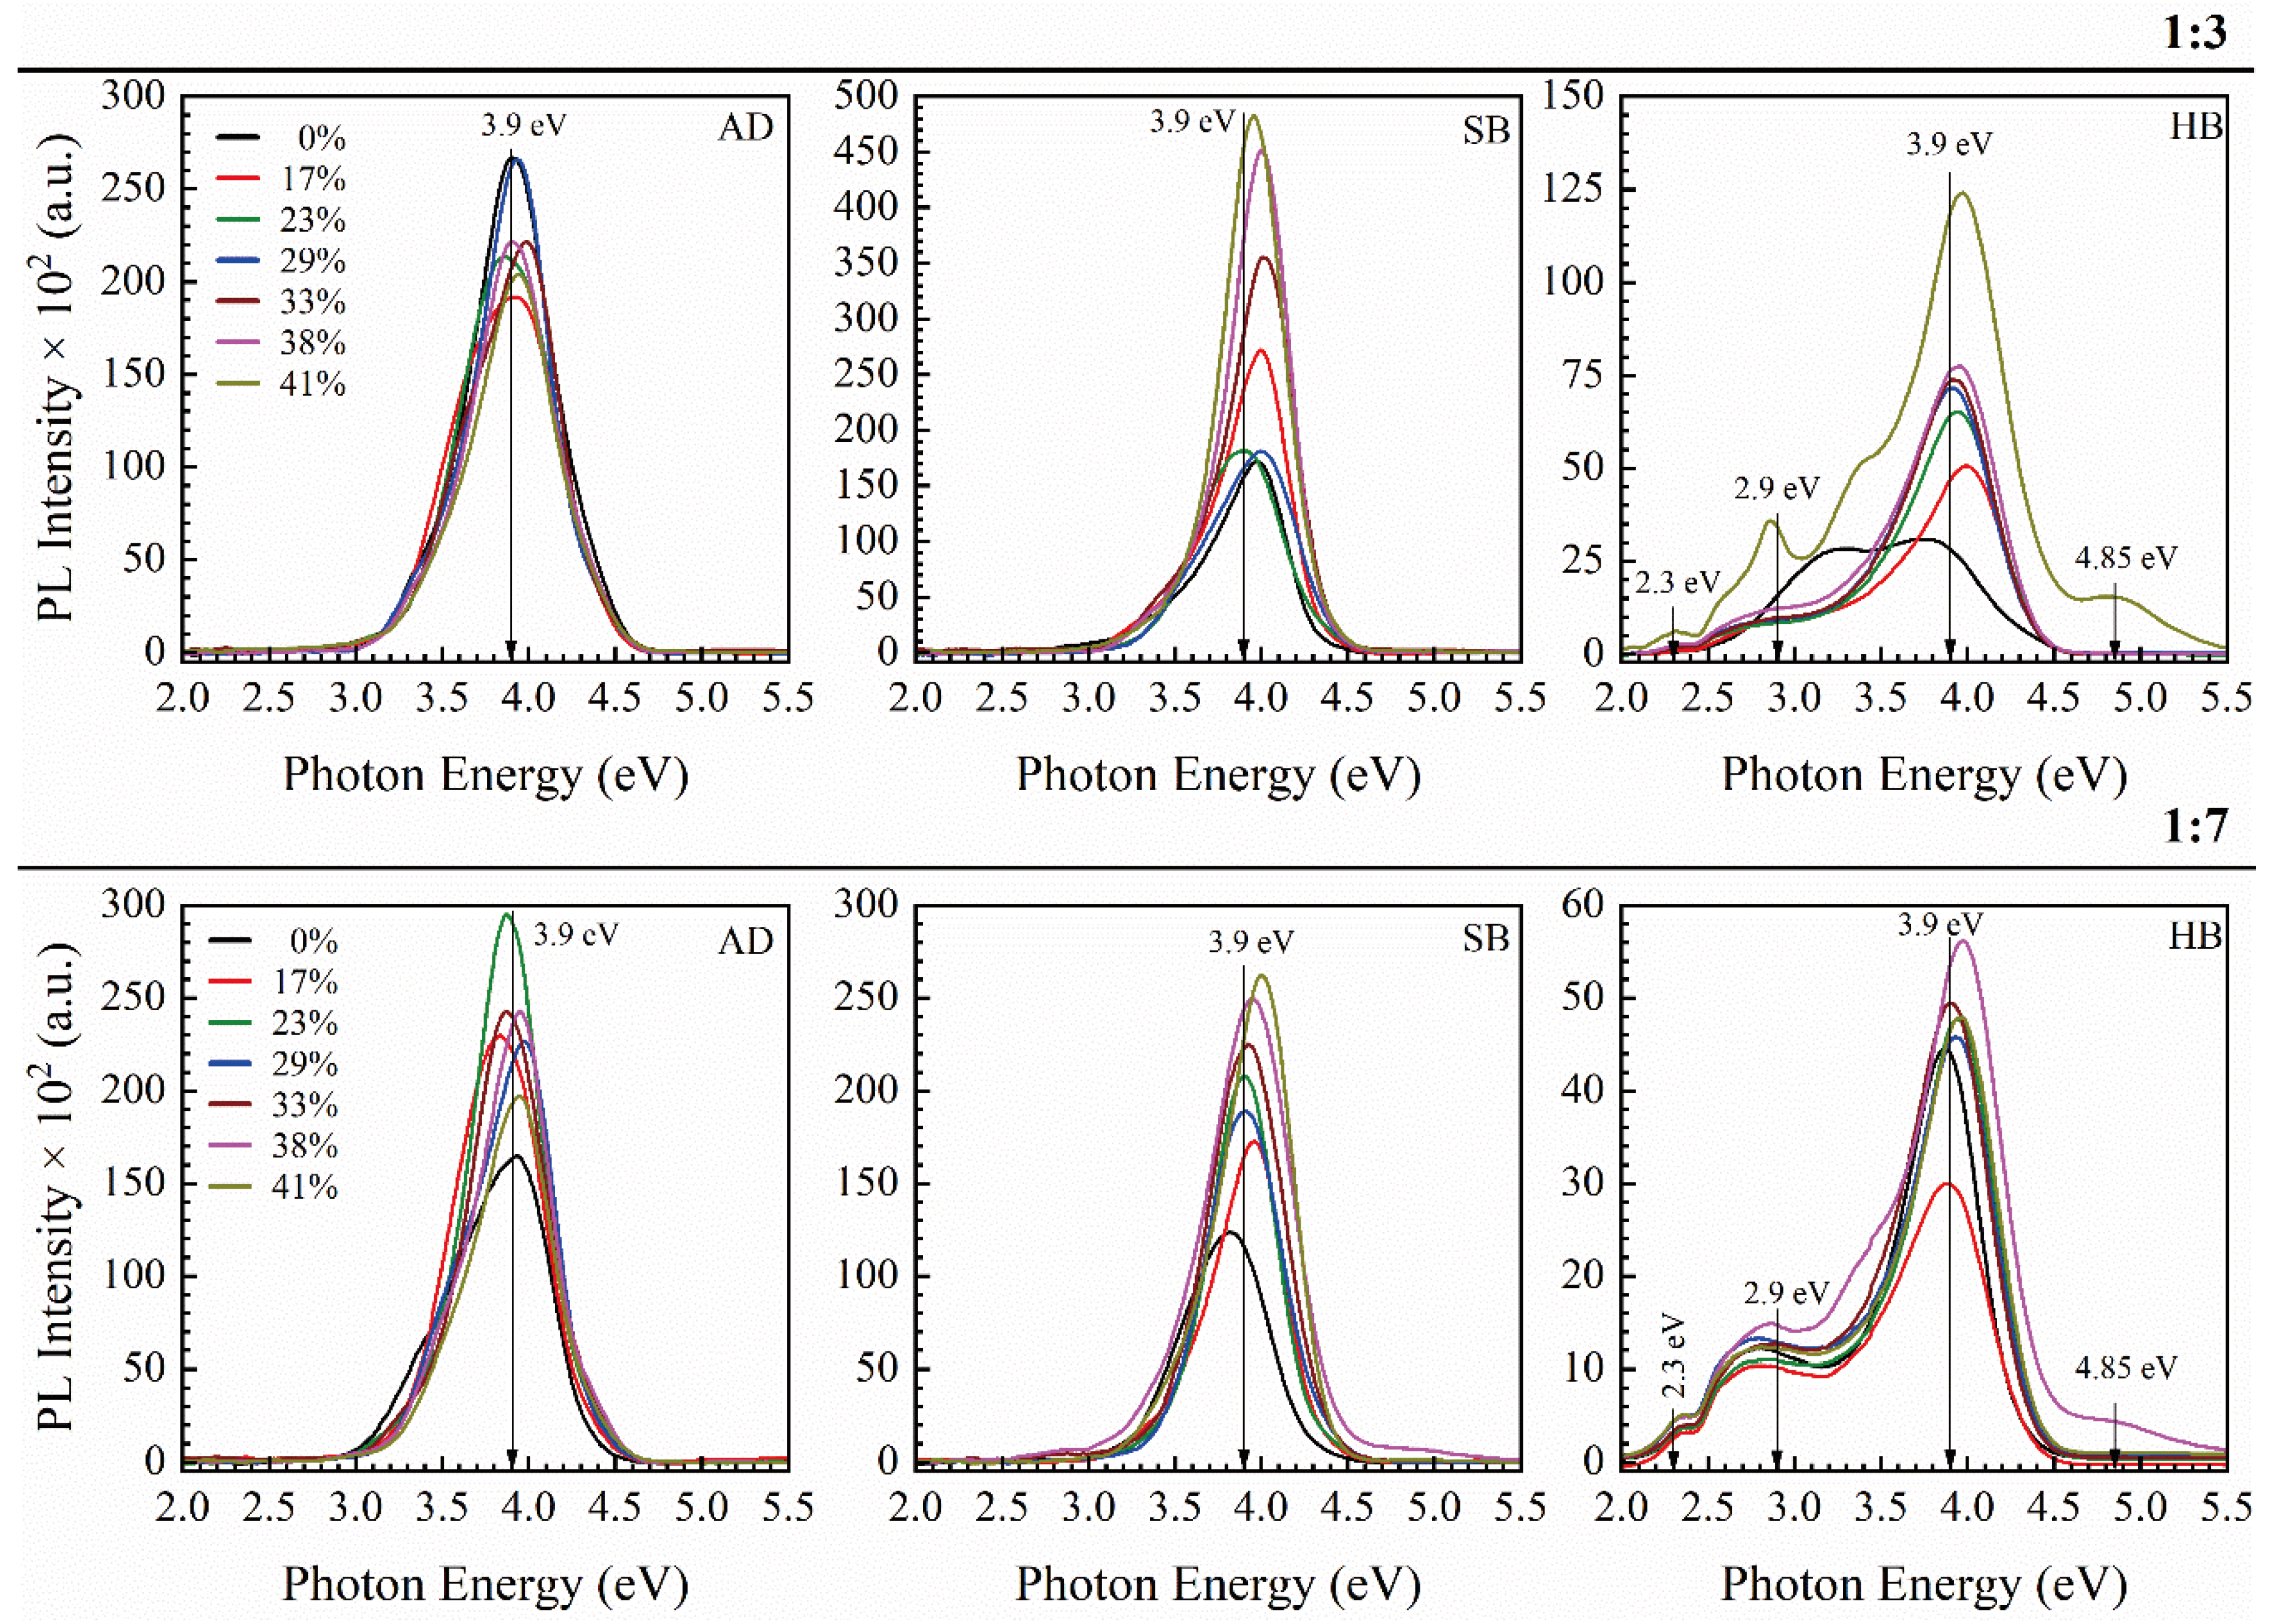
3.2.1. 1,3,5- and 1,3-benzene Bridged Films [33,43,44]
3.2.2. 1,4 benzene Bridged Films [42]
3.3. Methyl-Terminated Organosilica Films [65]
4. Discussion
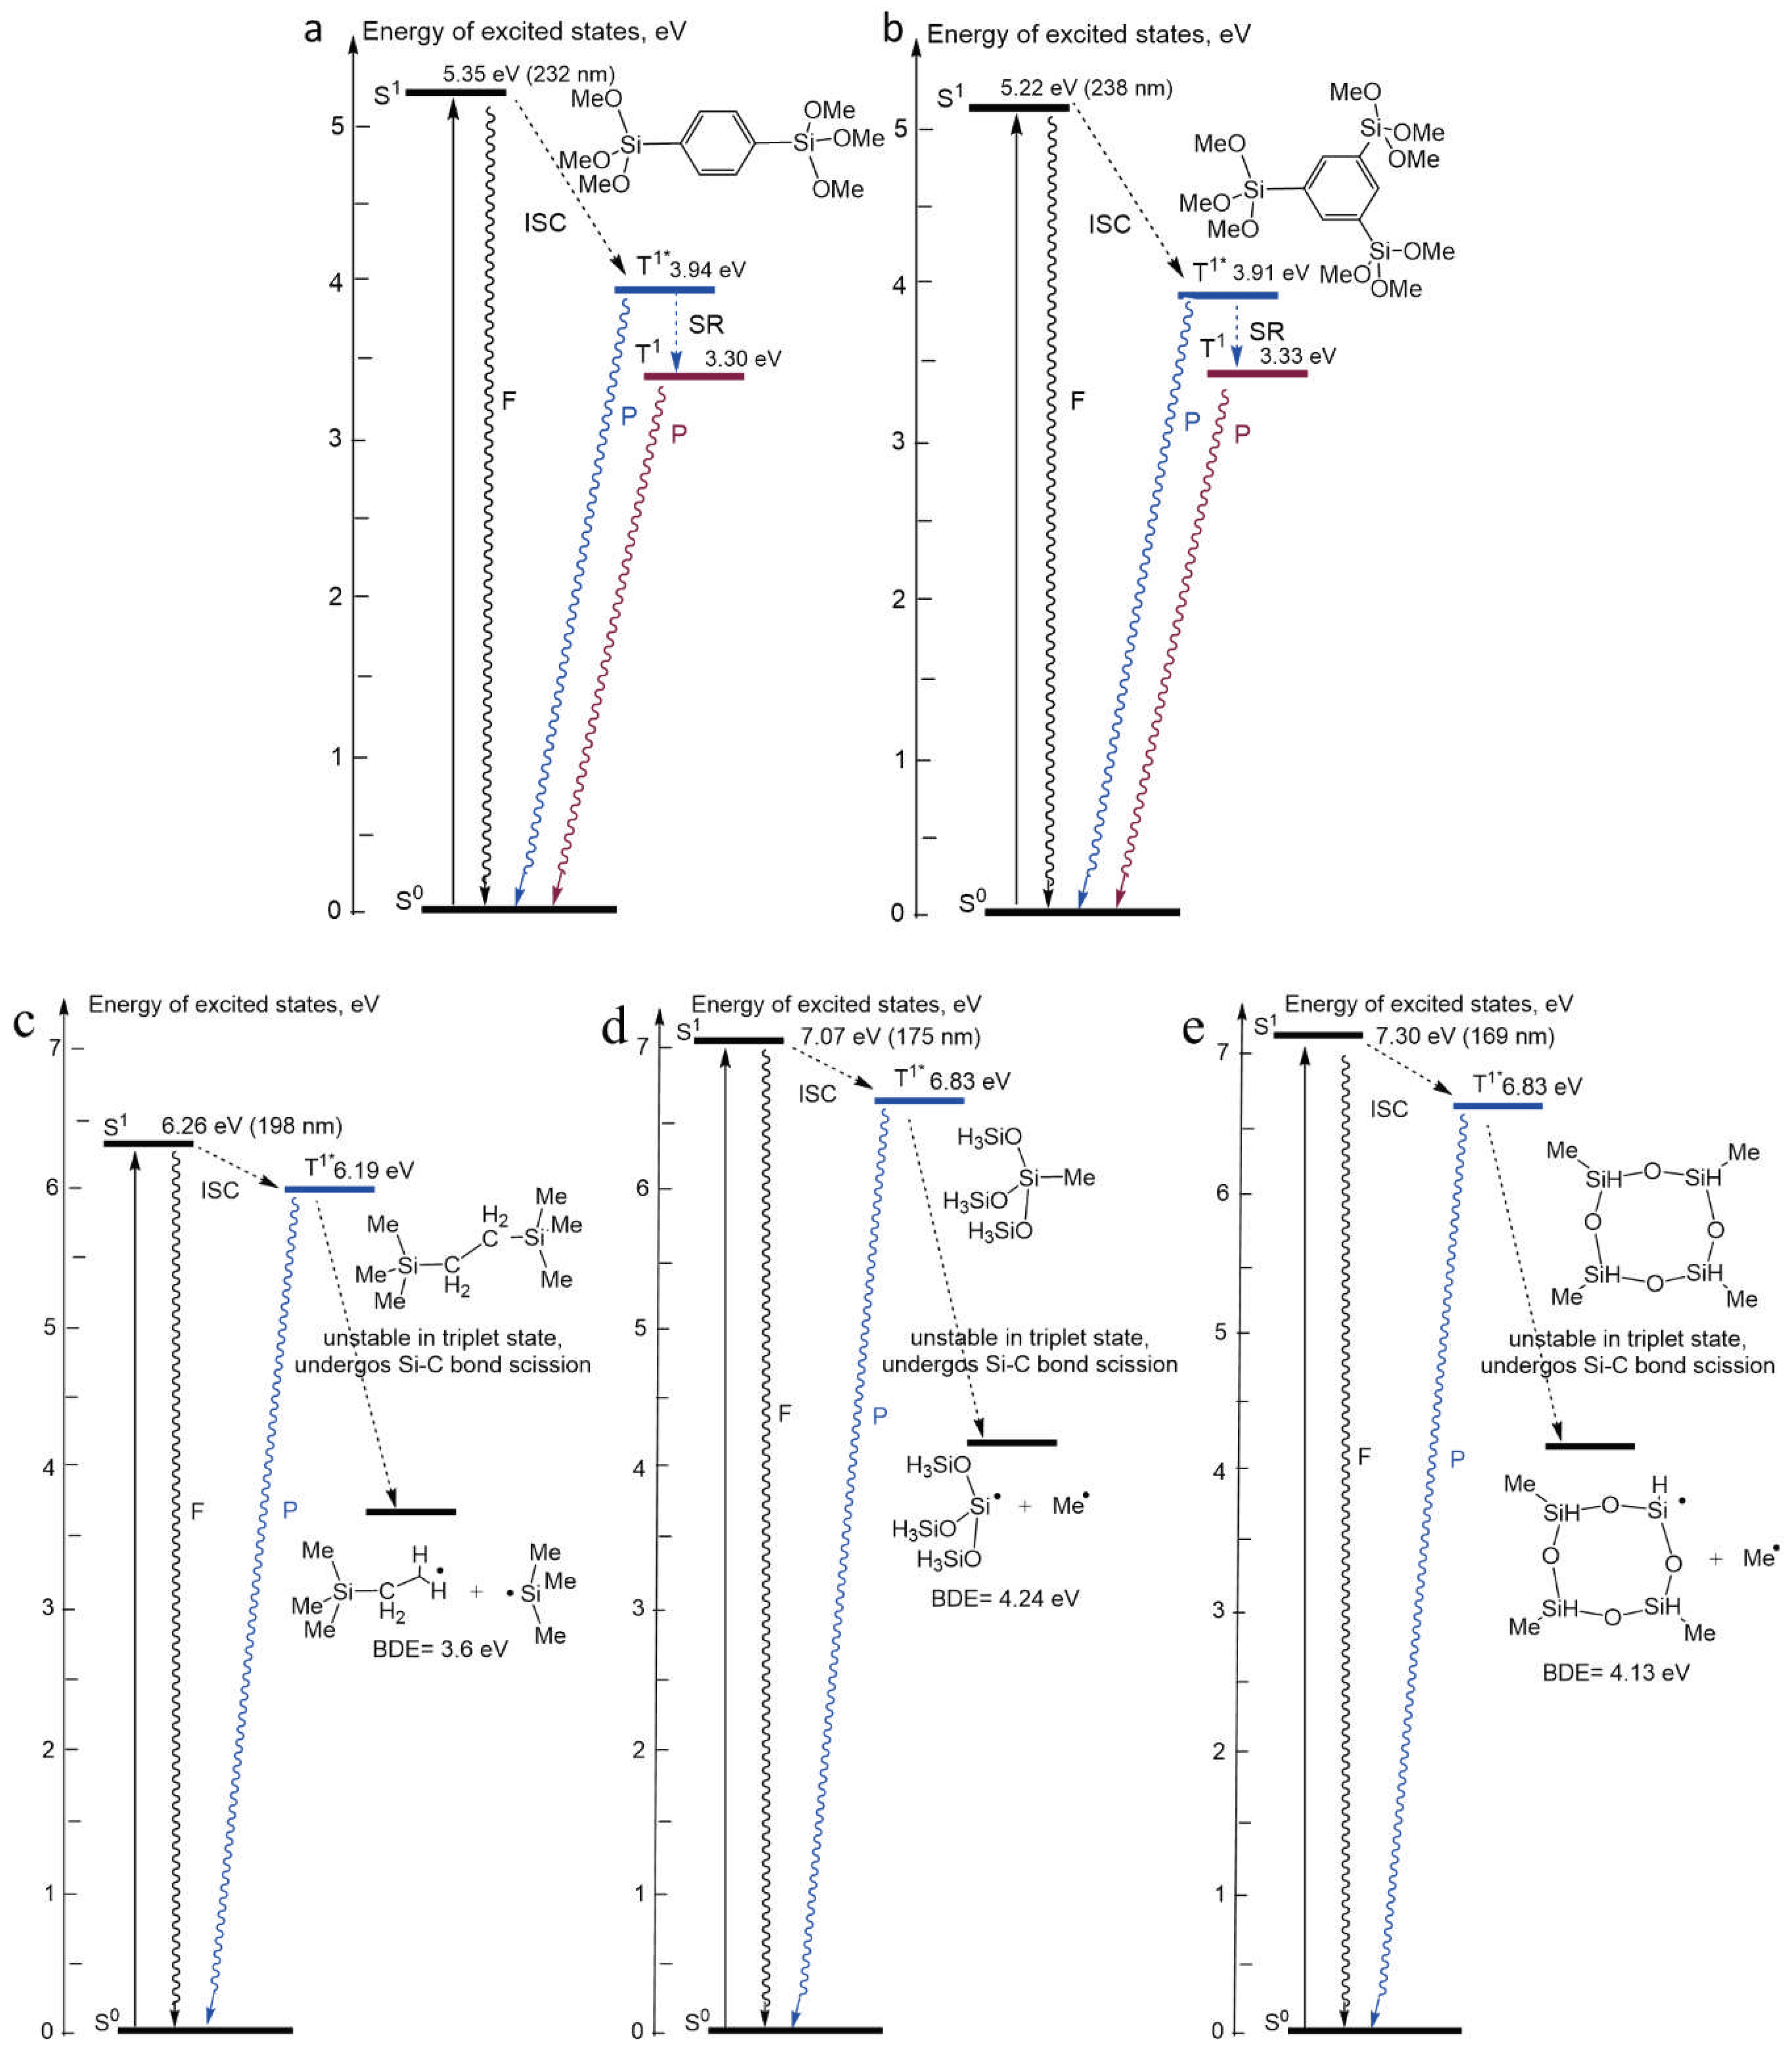
4.1. Diagrams of the Energy Levels Calculated by Using Density Functional Theory
5. Conclusions
Supplementary Materials
Author Contributions
Funding
Data Availability Statement
Acknowledgments
Conflicts of Interest
References
- Van Der Voort, P.; Esquivel, D.; De Canck, E.; Goethals, F.; Van Driessche, I.; Romero-Salguero, F.J. Periodic Mesoporous Organosilicas: from simple to complex bridges; a comprehensive overview of functions, morphologies and applications. Chem. Soc. Rev. 2013, 42, 3913–3955. [Google Scholar] [CrossRef]
- Baklanov, M.R.; Ho, P.S.; Zschech, E. Advanced Interconnects for ULSI Technology; Baklanov, M.R., Ho, P.S., Zschech, E., Eds.; John Wiley & Sons, Ltd: Chichester, UK, 2012; ISBN 9781119963677. [Google Scholar]
- Kondoh, E. Structural Change in Porous Silica Thin Film after Plasma Treatment. Electrochem. Solid-State Lett. 1999, 1, 224. [Google Scholar] [CrossRef]
- Devine, R.A.B.; Ball, D.; Rowe, J.D.; Tringe, J.W. Irradiation and Humidity Effects on the Leakage Current in SiOx(CH3)y-Based Intermetal Dielectric Films. J. Electrochem. Soc. 2003, 150, F151. [Google Scholar] [CrossRef]
- Marsik, P.; Verdonck, P.; De Roest, D.; Baklanov, M.R. Porogen residues detection in optical properties of low-k dielectrics cured by ultraviolet radiation. Thin Solid Films 2010, 518, 4266–4272. [Google Scholar] [CrossRef]
- Baklanov, M.R.; Zhao, L.; Besien, E. Van; Pantouvaki, M. Effect of porogen residue on electrical characteristics of ultra low-k materials. Microelectron. Eng. 2011, 88, 990–993. [Google Scholar] [CrossRef]
- Van Besien, E.; Pantouvaki, M.; Zhao, L.; De Roest, D.; Baklanov, M.R.; Tőkei, Z.; Beyer, G. Influence of porosity on electrical properties of low-k dielectrics. Microelectron. Eng. 2012, 92, 59–61. [Google Scholar] [CrossRef]
- Kikkawa, T.; Kuroki, S.; Sakamoto, S.; Kohmura, K.; Tanaka, H.; Hata, N. Influence of Humidity on Electrical Characteristics of Self-Assembled Porous Silica Low-k Films. J. Electrochem. Soc. 2005, 152, G560. [Google Scholar] [CrossRef]
- Li, Y.; Ciofi, I.; Carbonell, L.; Heylen, N.; Van Aelst, J.; Baklanov, M.R.; Groeseneken, G.; Maex, K.; Tkei, Z. Influence of absorbed water components on SiOCH low- k reliability. J. Appl. Phys. 2008, 104, 034113. [Google Scholar] [CrossRef]
- Biswas, N.; Lubguban, J.A.; Gangopadhyay, S. Electric field and temperature-induced removal of moisture in nanoporous organosilicate films. Appl. Phys. Lett. 2004, 84, 4254–4256. [Google Scholar] [CrossRef]
- Ogawa, E.T.; Aubel, O. Electrical Breakdown in Advanced Interconnect Dielectrics. In Advanced Interconnects for ULSI Technology; John Wiley & Sons, Ltd: Chichester, UK, 2012; pp. 369–434. ISBN 9780470662540. [Google Scholar]
- Wu, C.; Li, Y.; Baklanov, M.R.; Croes, K. Electrical Reliability Challenges of Advanced Low-k Dielectrics. ECS J. Solid State Sci. Technol. 2015, 4, N3065–N3070. [Google Scholar] [CrossRef]
- Jousseaume, V.; Zenasni, A.; Favennec, L.; Gerbaud, G.; Bardet, M.; Simon, J.P.; Humbert, A. Comparison Between E-beam and Ultraviolet Curing to Perform Porous a-SiOC:H. J. Electrochem. Soc. 2007, 154, G103. [Google Scholar] [CrossRef]
- Gates, S.M.; Neumayer, D.A.; Sherwood, M.H.; Grill, A.; Wang, X.; Sankarapandian, M. Preparation and structure of porous dielectrics by plasma enhanced chemical vapor deposition. J. Appl. Phys. 2007, 101, 094103. [Google Scholar] [CrossRef]
- Gerbaud, G.; Hediger, S.; Bardet, M.; Favennec, L.; Zenasni, A.; Beynet, J.; Gourhant, O.; Jousseaume, V. Spin-coated and PECVD low dielectric constant porous organosilicate films studied by 1D and 2D solid-state NMR. Phys. Chem. Chem. Phys. 2009, 11, 9729. [Google Scholar] [CrossRef] [PubMed]
- Sinha, H.; Ren, H.; Nichols, M.T.; Lauer, J.L.; Tomoyasu, M.; Russell, N.M.; Jiang, G.; Antonelli, G.A.; Fuller, N.C.; Engelmann, S.U.; et al. The effects of vacuum ultraviolet radiation on low- k dielectric films. J. Appl. Phys. 2012, 112, 111101. [Google Scholar] [CrossRef]
- Afanas’ev, V. V.; Nguyen, A.P.D.; Houssa, M.; Stesmans, A.; Tőkei, Z.; Baklanov, M.R. High-resolution electron spin resonance analysis of ion bombardment induced defects in advanced low-κ insulators (κ = 2.0-2.5). Appl. Phys. Lett. 2013, 102, 172908. [Google Scholar] [CrossRef]
- King, S.W.; French, B.; Mays, E. Detection of defect states in low-k dielectrics using reflection electron energy loss spectroscopy. J. Appl. Phys. 2013, 113, 044109. [Google Scholar] [CrossRef]
- Baklanov, M.R.; Jousseaume, V.; Rakhimova, T. V.; Lopaev, D. V.; Mankelevich, Y.A.; Afanas’ev, V. V.; Shohet, J.L.; King, S.W.; Ryan, E.T. Impact of VUV photons on SiO2 and organosilicate low-k dielectrics: General behavior, practical applications, and atomic models. Appl. Phys. Rev. 2019, 6, 011301. [Google Scholar] [CrossRef]
- Mutch, M.J.; Pomorski, T.; Bittel, B.C.; Cochrane, C.J.; Lenahan, P.M.; Liu, X.; Nemanich, R.J.; Brockman, J.; French, M.; Kuhn, M.; et al. Band diagram for low-k/Cu interconnects: The starting point for understanding back-end-of-line (BEOL) electrical reliability. Microelectron. Reliab. 2016, 63, 201–213. [Google Scholar] [CrossRef]
- Pustovarov, V.A.; Zatsepin, A.F.; Biryukov, D.Y.; Aliev, V.S.; Iskhakzay, R.M.K.; Gritsenko, V.A. Synchrotron-Excited Luminescence and Converting of Defects and Quantum Dots in Modified Silica Films. J. Non. Cryst. Solids 2023, 602, 122077. [Google Scholar] [CrossRef]
- Skuja, L. Optically active oxygen-deficiency-related centers in amorphous silicon dioxide. J. Non. Cryst. Solids 1998, 239, 16–48. [Google Scholar] [CrossRef]
- Salh, R. Defect Related Luminescence in Silicon Dioxide Network: A Review. In Crystalline Silicon - Properties and Uses; InTech, 2011; pp. 135–172. [Google Scholar]
- Gismatulin, A.A.; Gritsenko, V.A.; Seregin, D.S.; Vorotilov, K.A.; Baklanov, M.R. Charge transport mechanism in periodic mesoporous organosilica low- k dielectric. Appl. Phys. Lett. 2019, 115, 082904. [Google Scholar] [CrossRef]
- Perevalov, T. V.; Gismatulin, A.A.; Seregin, D.S.; Wang, Y.; Xu, H.; Kruchinin, V.N.; Spesivcev, E. V.; Gritsenko, V.A.; Nasyrov, K.A.; Prosvirin, I.P.; et al. Critical properties and charge transport in ethylene bridged organosilica low-κ dielectrics. J. Appl. Phys. 2020, 127, 195105. [Google Scholar] [CrossRef]
- Grill, A.; Gates, S.M.; Ryan, T.E.; Nguyen, S. V.; Priyadarshini, D. Progress in the development and understanding of advanced low k and ultralow k dielectrics for very large-scale integrated interconnects—State of the art. Appl. Phys. Rev. 2014, 1, 011306. [Google Scholar] [CrossRef]
- Dag, Ö.; Yoshina-Ishii, C.; Asefa, T.; MacLachlan, M.J.; Grondey, H.; Coombs, N.; Ozin, G.A. Oriented Periodic Mesoporous Organosilica (PMO) Film with Organic Functionality Inside the Channel Walls. Adv. Funct. Mater. 2001, 11, 213–217. [Google Scholar] [CrossRef]
- Dubois, G.; Volksen, W.; Magbitang, T.; Sherwood, M.H.; Miller, R.D.; Gage, D.M.; Dauskardt, R.H. Superior mechanical properties of dense and porous organic/inorganic hybrid thin films. J. Sol-Gel Sci. Technol. 2008. [Google Scholar] [CrossRef]
- Hoffmann, F.; Cornelius, M.; Morell, J.; Fröba, M. Silica-Based Mesoporous Organic–Inorganic Hybrid Materials. Angew. Chemie Int. Ed. 2006, 45, 3216–3251. [Google Scholar] [CrossRef]
- Dubois, G.; Volksen, W.; Magbitang, T.; Miller, R.D.; Gage, D.M.; Dauskardt, R.H. Molecular Network Reinforcement of Sol–Gel Glasses. Adv. Mater. 2007, 19, 3989–3994. [Google Scholar] [CrossRef]
- Li, H.; Knaup, J.M.; Kaxiras, E.; Vlassak, J.J. Stiffening of organosilicate glasses by organic cross-linking. Acta Mater. 2011, 59, 44–52. [Google Scholar] [CrossRef]
- Vanstreels, K.; Wu, C.; Baklanov, M.R. Mechanical Stability of Porous Low-k Dielectrics. ECS J. Solid State Sci. Technol. 2015, 4, N3058–N3064. [Google Scholar] [CrossRef]
- Burg, J.A.; Oliver, M.S.; Frot, T.J.; Sherwood, M.; Lee, V.; Dubois, G.; Dauskardt, R.H. Hyperconnected molecular glass network architectures with exceptional elastic properties. Nat. Commun. 2017, 8, 1019. [Google Scholar] [CrossRef]
- Goethals, F.; Ciofi, I.; Madia, O.; Vanstreels, K.; Baklanov, M.R.; Detavernier, C.; Van Der Voort, P.; Van Driessche, I. Ultra-low-k cyclic carbon-bridged PMO films with a high chemical resistance. J. Mater. Chem. 2012, 22, 8281. [Google Scholar] [CrossRef]
- Lu, Y.; Fan, H.; Doke, N.; Loy, D.A.; Assink, R.A.; LaVan, D.A.; Brinker, C.J. Evaporation-Induced Self-Assembly of Hybrid Bridged Silsesquioxane Film and Particulate Mesophases with Integral Organic Functionality. J. Am. Chem. Soc. 2000, 122, 5258–5261. [Google Scholar] [CrossRef]
- Redzheb, M.; Prager, L.; Naumov, S.; Krishtab, M.; Armini, S.; Van Der Voort, P.; Baklanov, M.R. Effect of the C-bridge length on the ultraviolet-resistance of oxycarbosilane low-k films. Appl. Phys. Lett. 2016, 108, 012902. [Google Scholar] [CrossRef]
- Seregin, D.S.; Naumov, S.; Chang, W.-Y.; Wu, Y.-H.; Wang, Y.; Kotova, N.M.; Vishnevskiy, A.S.; Wei, S.; Zhang, J.; Vorotilov, K.A.; et al. Effect of the C-bridge on UV properties of organosilicate films. Thin Solid Films 2019, 685, 329–334. [Google Scholar] [CrossRef]
- Vishnevskiy, A.S.; Naumov, S.; Seregin, D.S.; Wu, Y.H.; Chuang, W.T.; Rasadujjaman, M.; Zhang, J.; Leu, J.; Vorotilov, K.A.; Baklanov, M.R. Effects of methyl terminal and carbon bridging groups ratio on critical properties of porous organosilicate-glass films. Materials (Basel). 2020, 13, 1–21. [Google Scholar] [CrossRef]
- Rasadujjaman, M.; Wang, Y.; Zhang, L.; Naumov, S.; Attallah, A.G.; Liedke, M.O.; Koehler, N.; Redzheb, M.; Vishnevskiy, A.S.; Seregin, D.S.; et al. A detailed ellipsometric porosimetry and positron annihilation spectroscopy study of porous organosilicate-glass films with various ratios of methyl terminal and ethylene bridging groups. Microporous Mesoporous Mater. 2020, 306. [Google Scholar] [CrossRef]
- Rasadujjaman, M.; Zhang, J.; Mogilnikov, K.P.; Vishnevskiy, A.S.; Zhang, J.; Baklanov, M.R. Effect of methyl terminal and ethylene bridging groups on porous organosilicate glass films: FTIR, ellipsometric porosimetry, luminescence dataset. Data Br. 2021, 35, 106895. [Google Scholar] [CrossRef] [PubMed]
- Iacopi, F.; Travaly, Y.; Eyckens, B.; Waldfried, C.; Abell, T.; Guyer, E.P.; Gage, D.M.; Dauskardt, R.H.; Sajavaara, T.; Houthoofd, K.; et al. Short-ranged structural rearrangement and enhancement of mechanical properties of organosilicate glasses induced by ultraviolet radiation. J. Appl. Phys. 2006, 99, 053511. [Google Scholar] [CrossRef]
- Rezvanov, A.A.; Vishnevskiy, A.S.; Seregin, D.S.; Schneider, D.; Lomov, A.A.; Vorotilov, K.A.; Baklanov, M.R. Benzene bridged hybrid organosilicate films with improved stiffness and small pore size. Mater. Chem. Phys. 2022, 290, 126571. [Google Scholar] [CrossRef]
- Liu, C.; Lv, C.; Kohler, N.; Wang, X.; Lin, H.; He, Z.; Wu, Y.-H.; Leu, J.; Wei, S.; Zhang, J.; et al. Properties of organosilicate low- k films with 1,3- and 1,3,5-benzene bridges between Si atoms. Jpn. J. Appl. Phys. 2020, 59, SLLG01. [Google Scholar] [CrossRef]
- Rasadujjaman, M.; Wang, X.; Wang, Y.; Zhang, J.; Arkhincheev, V.E.; Baklanov, M.R. Analytical Study of Porous Organosilicate Glass Films Prepared from Mixtures of 1,3,5- and 1,3-Alkoxysilylbenzenes. Materials (Basel). 2021, 14, 1881. [Google Scholar] [CrossRef] [PubMed]
- Baklanov, M.R.; Mogilnikov, K.P.; Polovinkin, V.G.; Dultsev, F.N. Determination of pore size distribution in thin films by ellipsometric porosimetry. J. Vac. Sci. Technol. B Microelectron. Nanom. Struct. 2000, 18, 1385. [Google Scholar] [CrossRef]
- Haul, R.S.J.; Gregg, K.S.W. Sing: Adsorption, Surface Area and Porosity; Academic Press: London, UK, 1982. [Google Scholar] [CrossRef]
- Chernenko, K.; Kivimäki, A.; Pärna, R.; Wang, W.; Sankari, R.; Leandersson, M.; Tarawneh, H.; Pankratov, V.; Kook, M.; Kukk, E.; et al. Performance and characterization of the FinEstBeAMS beamline at the MAX IV Laboratory. J. Synchrotron Radiat. 2021, 28, 1620–1630. [Google Scholar] [CrossRef] [PubMed]
- Sandeep, S.; Vishnevskiy, A.S.; Raetz, S.; Naumov, S.; Seregin, D.S.; Husiev, A.; Vorotilov, K.A.; Gusev, V.E.; Baklanov, M.R. In-Situ Imaging of a Light-Induced Modification Process in Organo-Silica Films via Time-Domain Brillouin Scattering. Nanomaterials 2022, 12, 1600. [Google Scholar] [CrossRef] [PubMed]
- Zotovich, A.I.; Zyryanov, S.M.; Lopaev, D. V.; Rezvanov, A.A.; Attallah, A.G.; Liedke, M.O.; Butterling, M.; Bogdanova, M.A.; Vishnevskiy, A.S.; Seregin, D.S.; et al. Modification of Porous Ultralow- k Film by Vacuum Ultraviolet Emission. ACS Appl. Electron. Mater. 2022, 4, 2760–2776. [Google Scholar] [CrossRef]
- Perdew, J.P.; Burke, K.; Ernzerhof, M. Generalized Gradient Approximation Made Simple. Phys. Rev. Lett. 1996, 77, 3865–3868. [Google Scholar] [CrossRef] [PubMed]
- Perdew, J.P.; Burke, K.; Ernzerhof, M. Generalized Gradient Approximation Made Simple. Phys. Rev. Lett. 1997, 78, 1396–1396. [Google Scholar] [CrossRef]
- Adamo, C.; Barone, V. Toward reliable density functional methods without adjustable parameters: The PBE0 model. J. Chem. Phys. 1999, 110, 6158–6170. [Google Scholar] [CrossRef]
- Jaguar,version 9.6,Schrodinger,Inc. 2017.
- Naumov, S.; Herzog, B.; Abel, B. Spectra and Photorelaxation of Hydroxyphenyl-benzotriazole-Type UV Absorbers: From Monomers to Nanoparticles. J. Phys. Chem. A 2020, 124, 625–632. [Google Scholar] [CrossRef]
- Weilbeer, C.; Sickert, M.; Naumov, S.; Schneider, C. The Brønsted Acid-Catalyzed, Enantioselective Aza-Diels-Alder Reaction for the Direct Synthesis of Chiral Piperidones. Chem. - A Eur. J. 2017, 23, 513–518. [Google Scholar] [CrossRef]
- Bauernschmitt, R.; Ahlrichs, R. Treatment of electronic excitations within the adiabatic approximation of time dependent density functional theory. Chem. Phys. Lett. 1996, 256, 454–464. [Google Scholar] [CrossRef]
- Pollard, W.T.; Friesner, R.A. Efficient Fock matrix diagonalization by a Krylov-space method. J. Chem. Phys. 1993, 99, 6742–6750. [Google Scholar] [CrossRef]
- Everett, D.H. Adsorption Hysteresis. In The Solid-Gas Interface; Flood, E.A.: New York, NY, USA, 1967. [Google Scholar]
- Skuja, L.; Leimane, M.; Bite, I.; Millers, D.; Zolotarjovs, A.; Vitola, V.; Smits, K. Ultraviolet luminescence of polycyclic aromatic hydrocarbons in partially consolidated sol-gel silica glasses. J. Non. Cryst. Solids 2022, 577, 121325. [Google Scholar] [CrossRef]
- Zhao, J.; Mao, D.S.; Lin, Z.X.; Jiang, B.Y.; Yu, Y.H.; Liu, X.H.; Wang, H.Z.; Yang, G.Q. Intense short-wavelength photoluminescence from thermal SiO2 films co-implanted with Si and C ions. Appl. Phys. Lett. 1998, 73, 1838–1840. [Google Scholar] [CrossRef]
- Tabassum, N.; Nikas, V.; Ford, B.; Huang, M.; Kaloyeros, A.E.; Gallis, S. Time-resolved analysis of the white photoluminescence from chemically synthesized SiCxOy thin films and nanowires. Appl. Phys. Lett. 2016, 109, 043104. [Google Scholar] [CrossRef]
- Nikas, V.; Tabassum, N.; Ford, B.; Smith, L.; Kaloyeros, A.E.; Gallis, S. Strong visible light emission from silicon-oxycarbide nanowire arrays prepared by electron beam lithography and reactive ion etching. J. Mater. Res. 2015, 30, 3692–3699. [Google Scholar] [CrossRef]
- Ford, B.; Tabassum, N.; Nikas, V.; Gallis, S. Strong Photoluminescence Enhancement of Silicon Oxycarbide through Defect Engineering. Materials (Basel). 2017, 10, 446. [Google Scholar] [CrossRef] [PubMed]
- Koós, M.; Pócsik, I. Photoluminescence in Hydrogenated Amorphous Carbon. In Physics and Applications of Non-Crystalline Semiconductors in Optoelectronics; Springer Netherlands: Dordrecht, 1997; pp. 361–378. [Google Scholar]
- Liu, C.; Qi, Q.; Seregin, D.S.; Vishnevskiy, A.S.; Wang, Y.; Wei, S.; Zhang, J.; Vorotilov, K.A.; Dultsev, F.N.; Baklanov, M.R. Effect of terminal methyl groups concentration on properties of organosilicate glass low dielectric constant films. Jpn. J. Appl. Phys. 2018, 57, 07MC01. [Google Scholar] [CrossRef]
- Knolle, W.; Feldman, V.I.; Janovský, I.; Naumov, S.; Mehnert, R.; Langguth, H.; Sukhov, F.F.; Orlov, A.Y. EPR study of methyl and ethyl acrylate radical cations and their transformations in low-temperature matrices. J. Chem. Soc. Perkin Trans. 2 2002, 687–699. [Google Scholar] [CrossRef]
- Naumov, S.; Knolle, W.; Naumov, S.; Pöppl, A.; Janovský, I. The Dynamical Behavior of the s-Trioxane Radical Cation—A Low-Temperature EPR and Theoretical Study. Molecules 2014, 19, 17305–17313. [Google Scholar] [CrossRef]
- Afanas’ev, V.V.; Keunen, K.; Nguyen, A.P.D.; Jivanescu, M.; Stesmans, A.; Tokei, Z.; Baklanov, M.R.; Beyer, G.P. in Symposium O—Materials, Processes, and Reliability for Advanced Interconnects for Micro- and Nanoelectronics (Mater. Res. Soc. Proc., 2011). In Proceedings of the (Mater. Res. Soc. Proc., 2011); 2011; p. 1335. [Google Scholar]
- Nikas, V.; Gallis, S.; Huang, M.; Kaloyeros, A.E.; Nguyen, A.P.D.; Stesmans, A.; Afanas’ev, V. V. The origin of white luminescence from silicon oxycarbide thin films. Appl. Phys. Lett. 2014, 104, 061906. [Google Scholar] [CrossRef]
- Krishtab, M.; Afanas’ev, V.; Stesmans, A.; De Gendt, S. Leakage current induced by surfactant residues in self-assembly based ultralow-k dielectric materials. Appl. Phys. Lett. 2017, 111, 032908. [Google Scholar] [CrossRef]

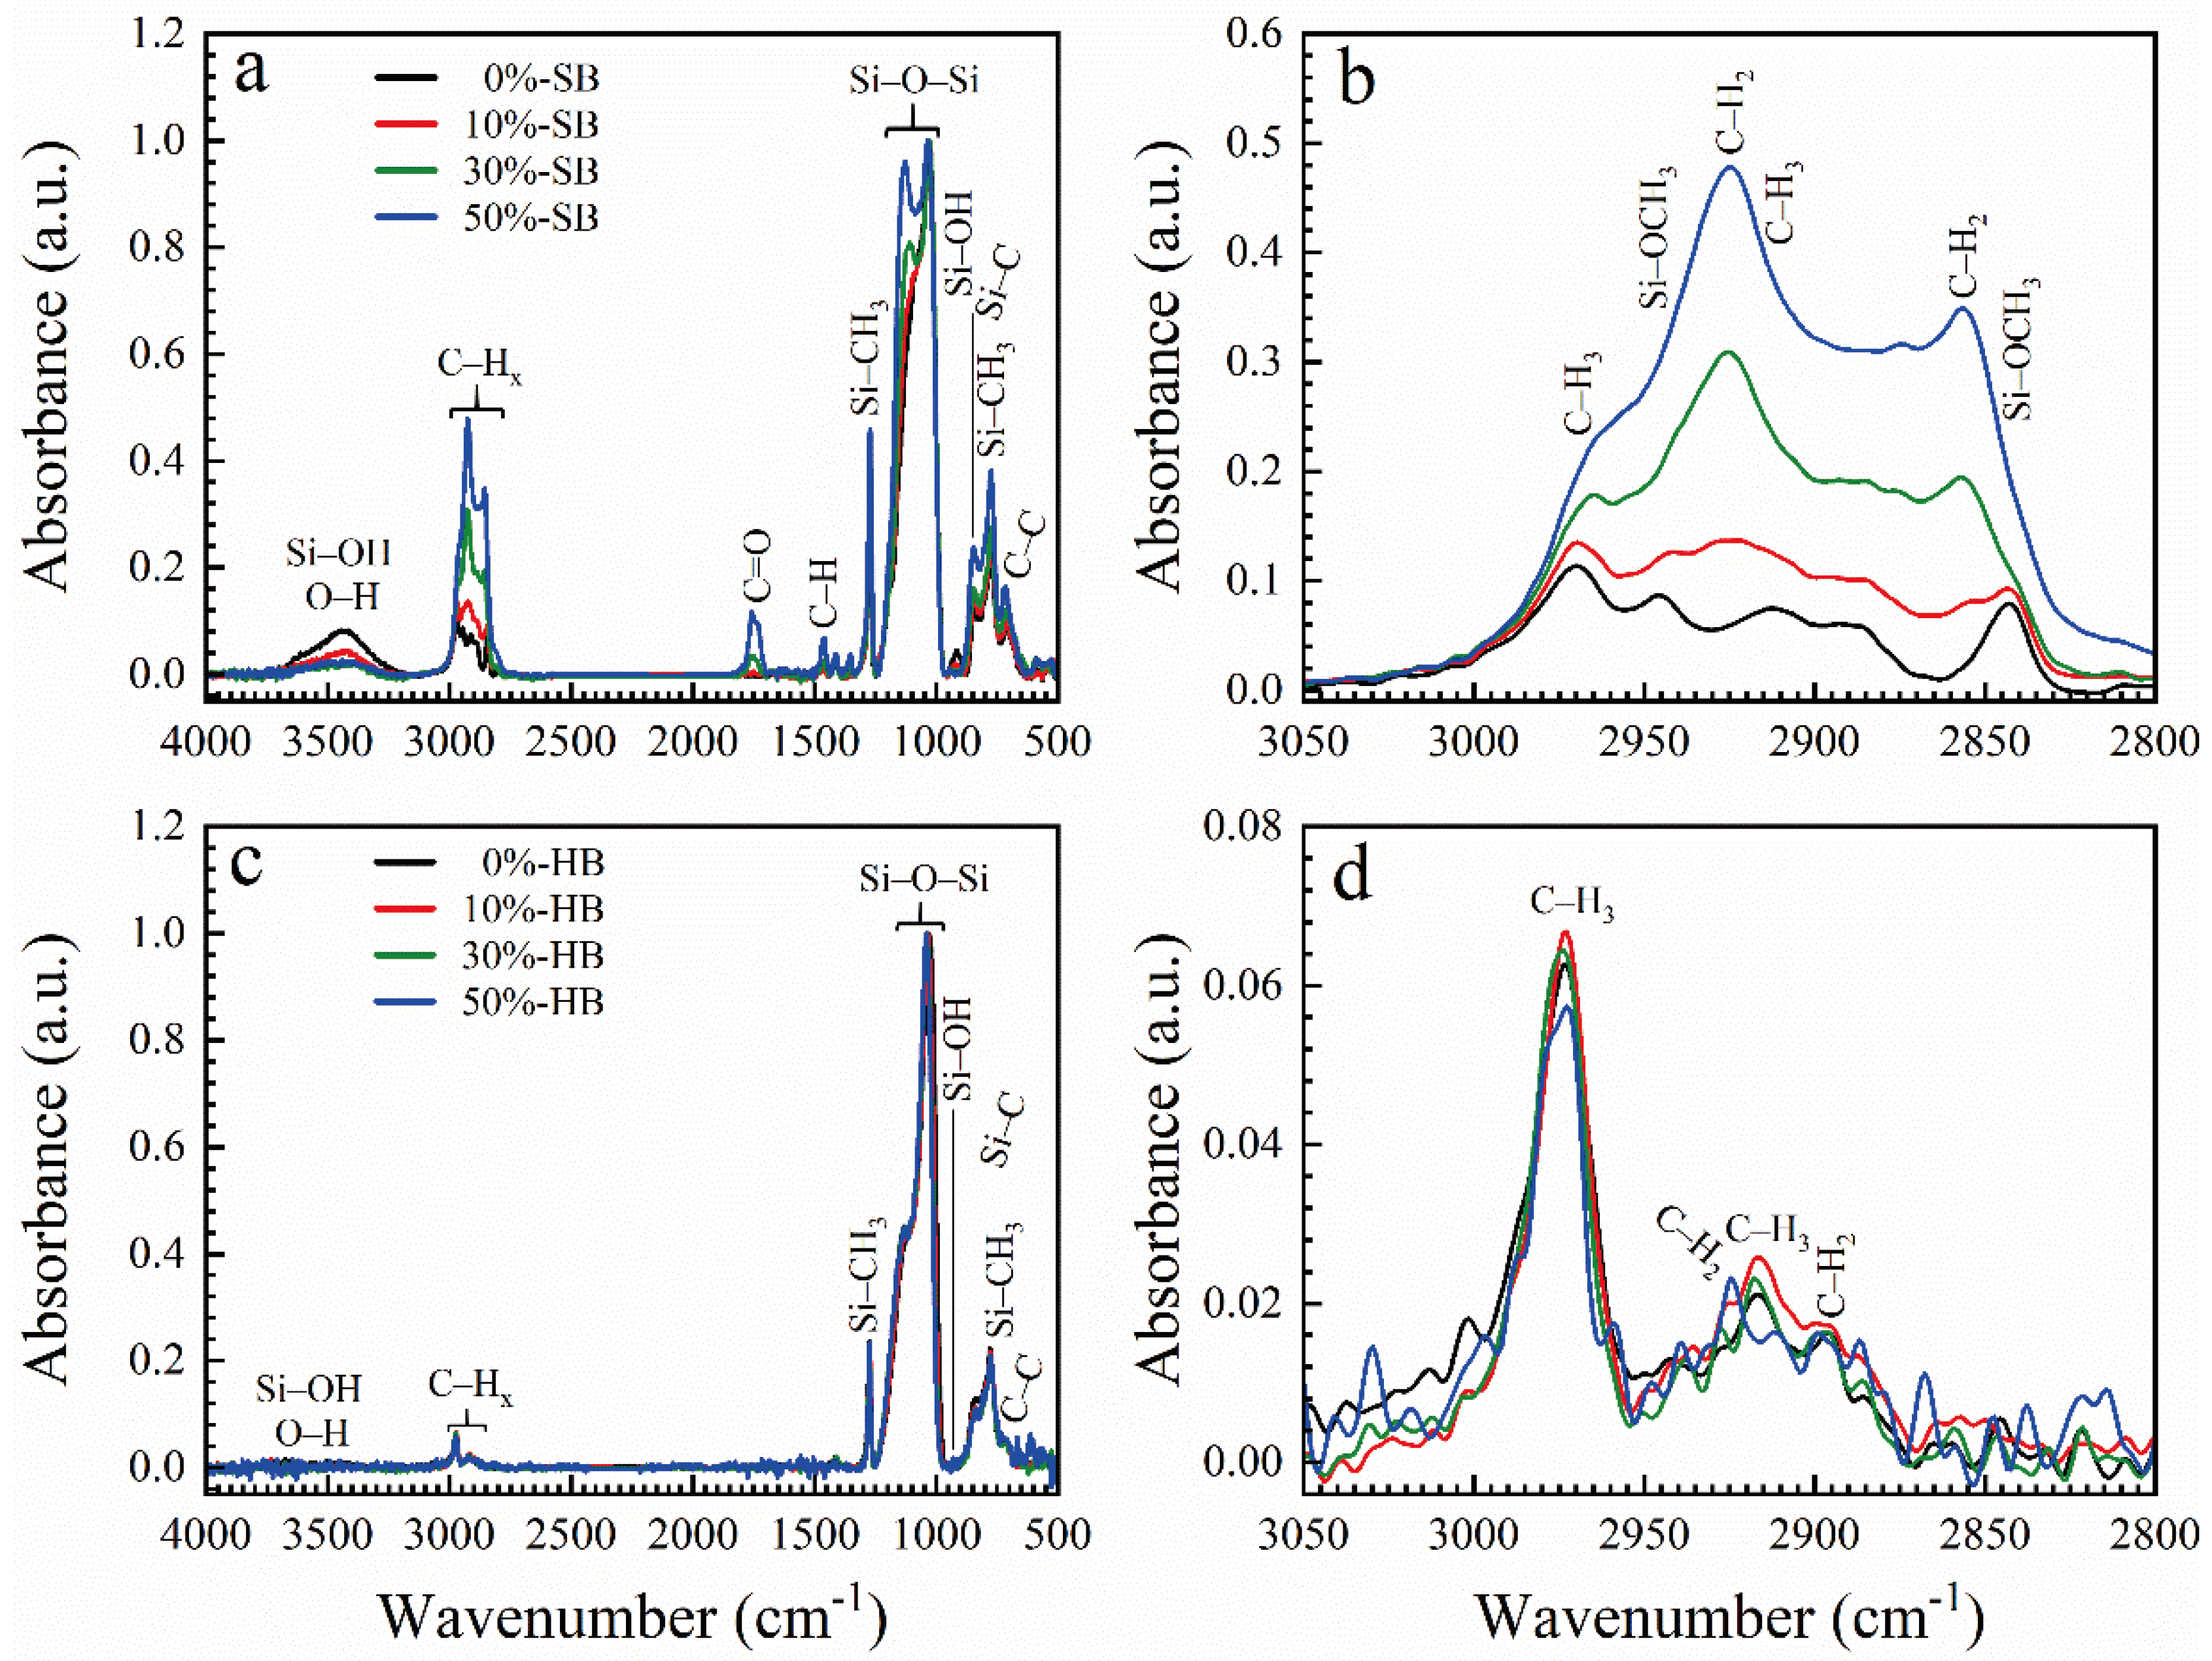
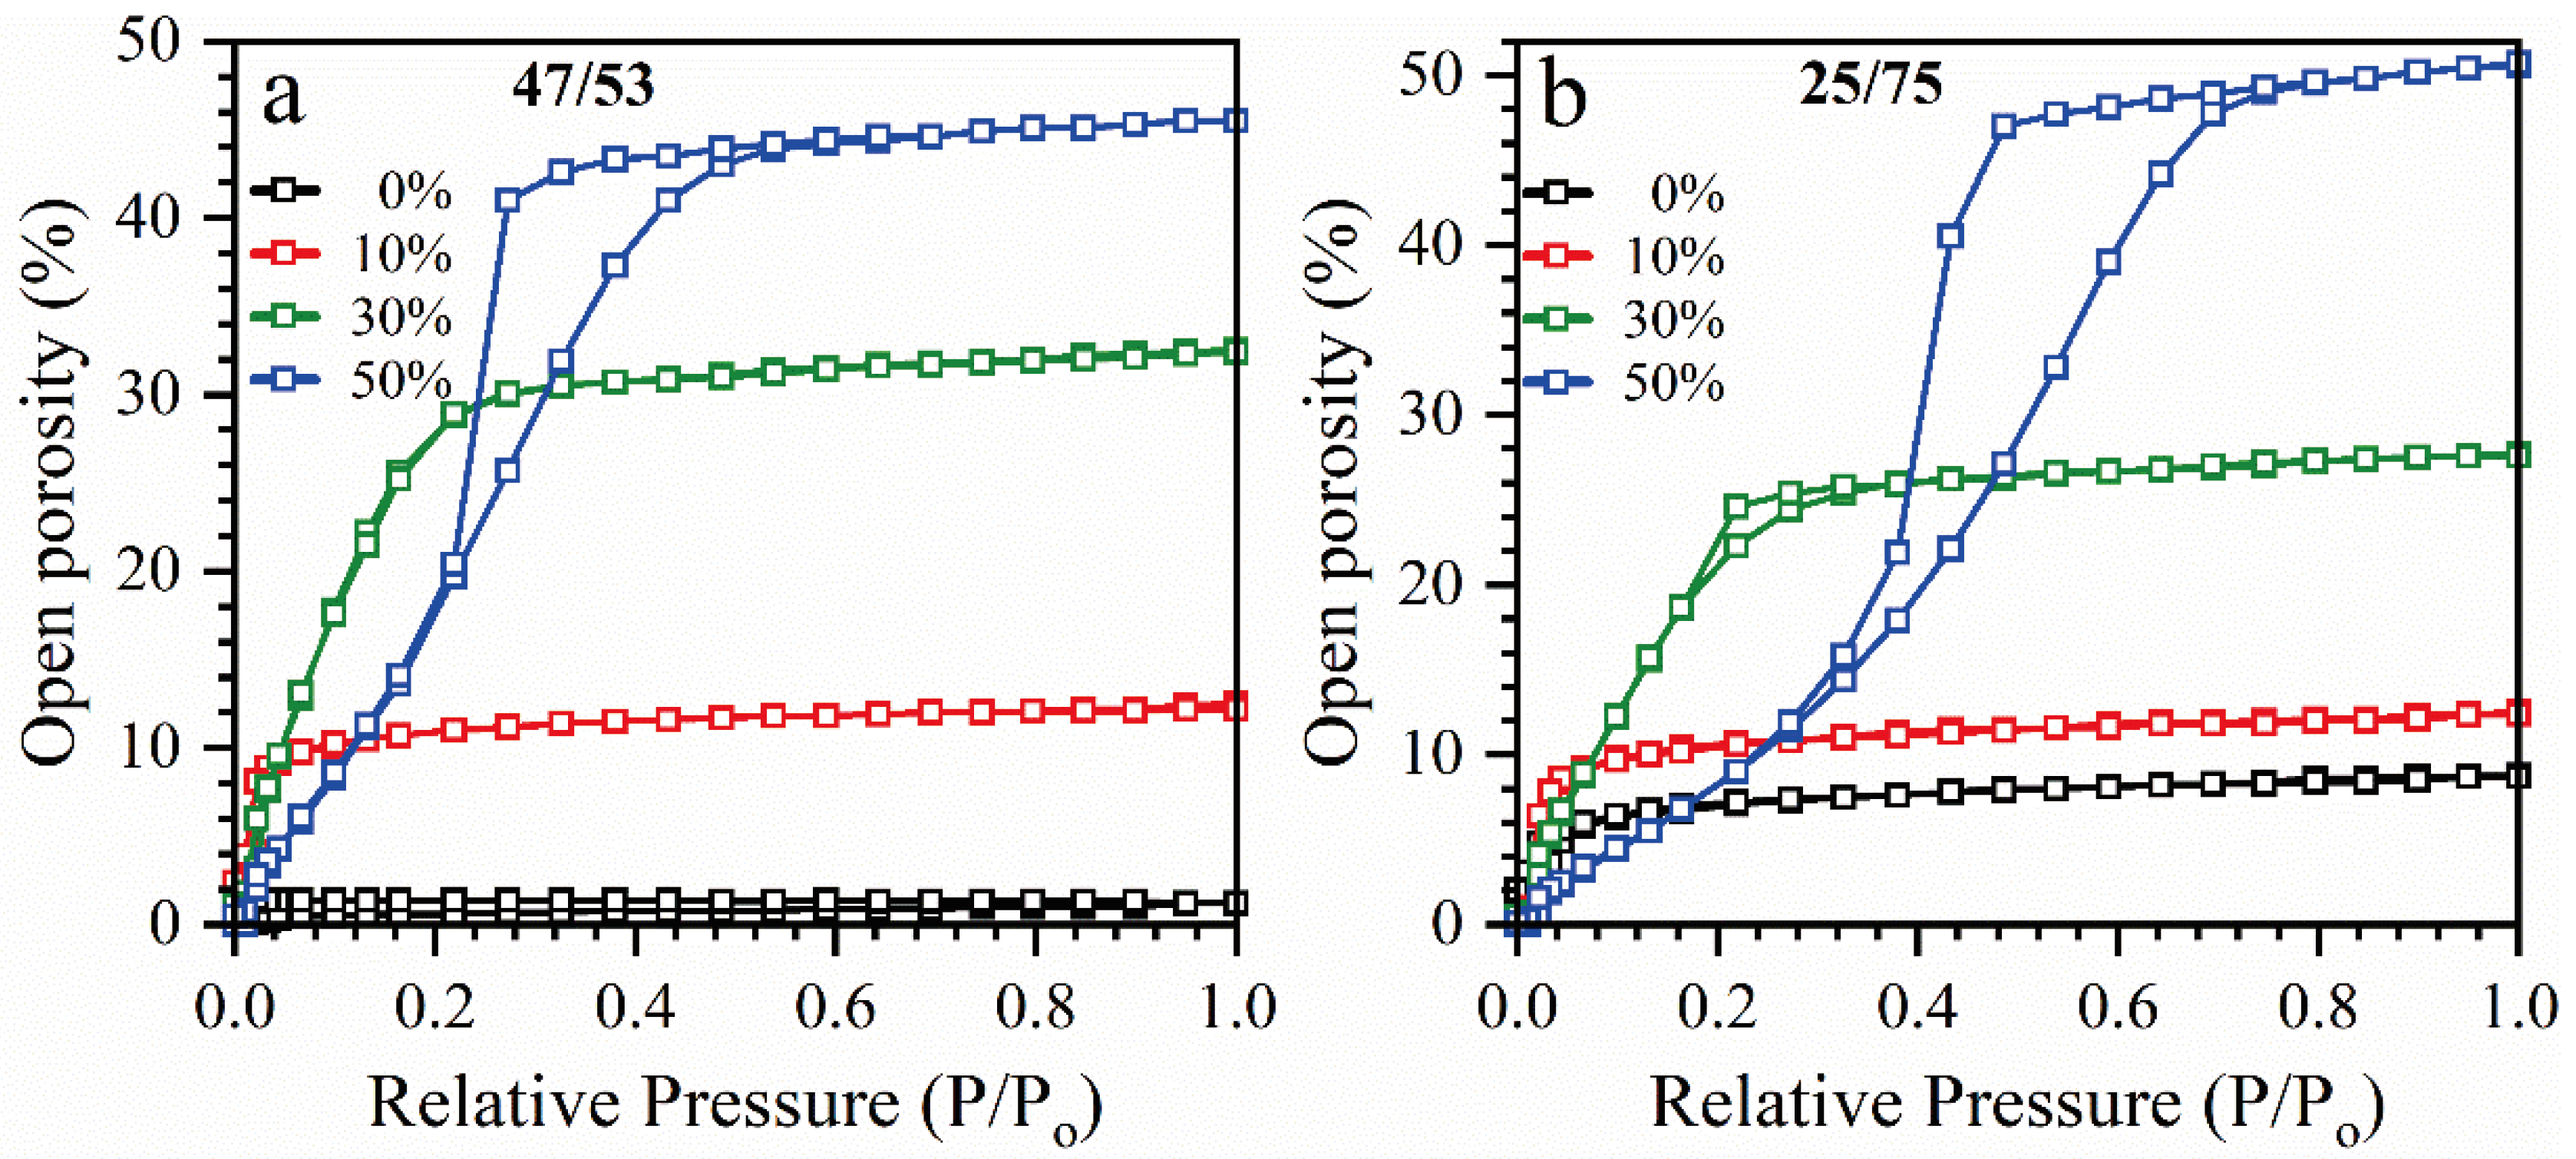
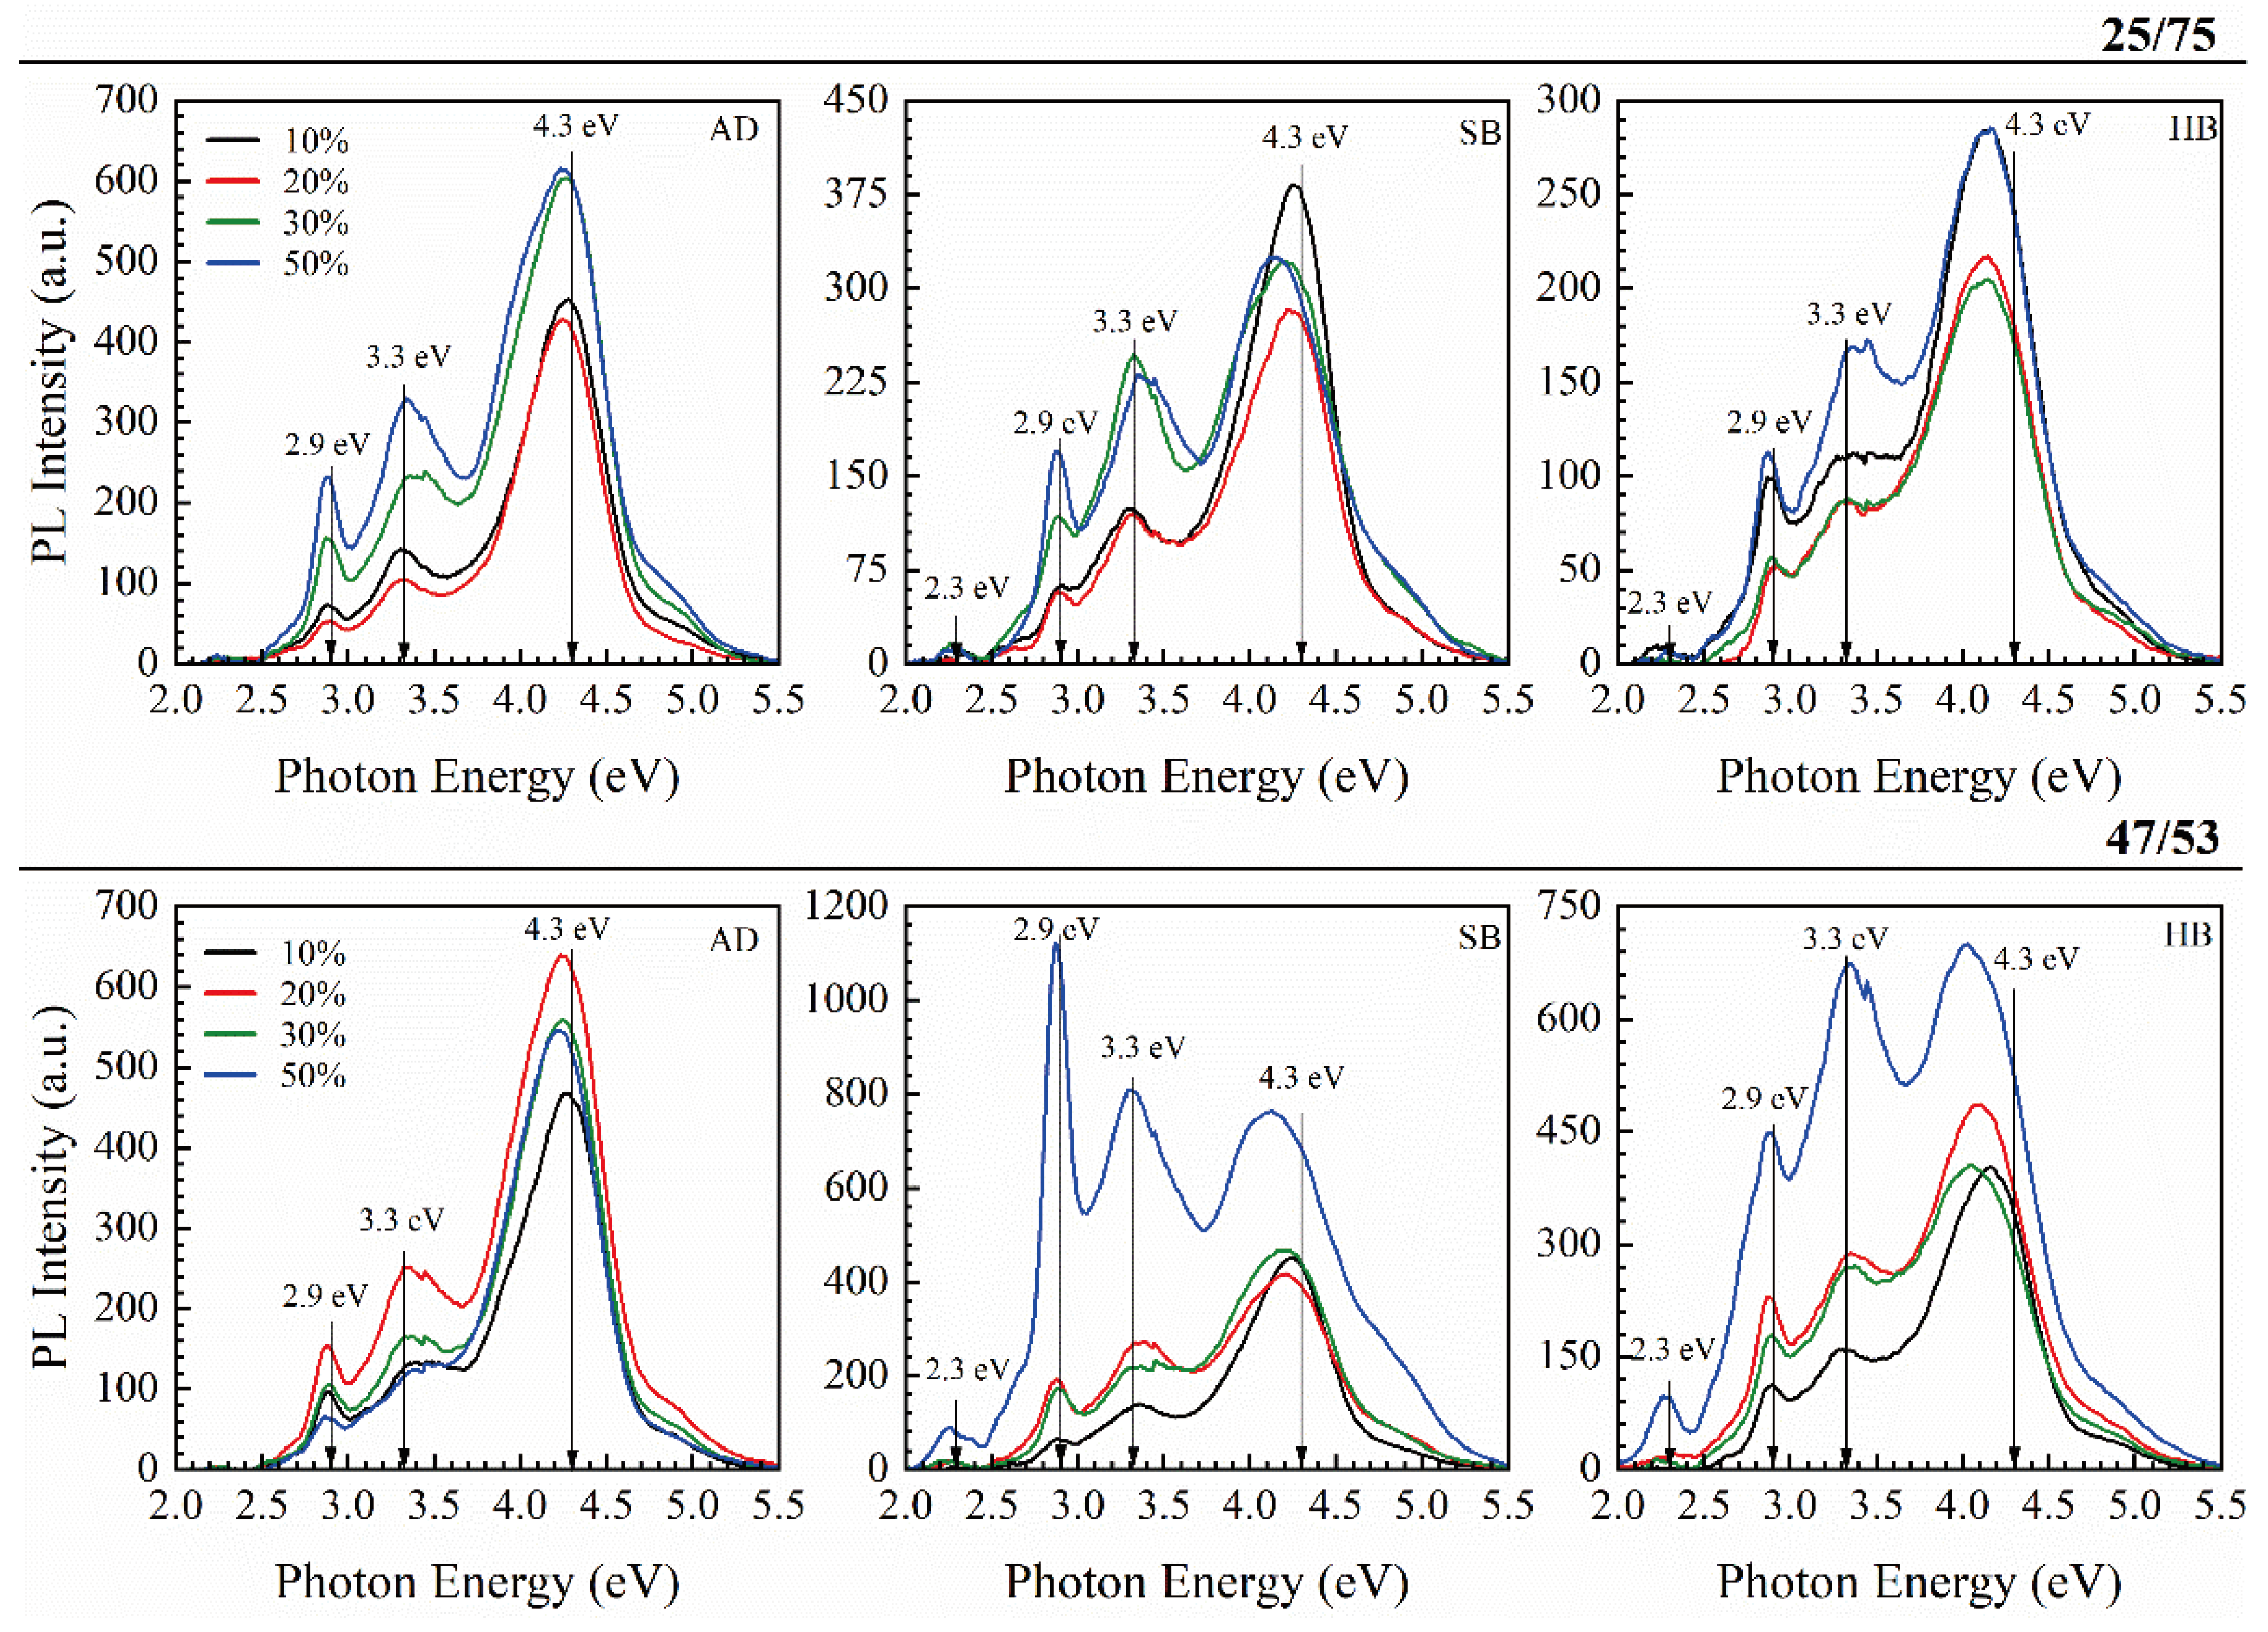
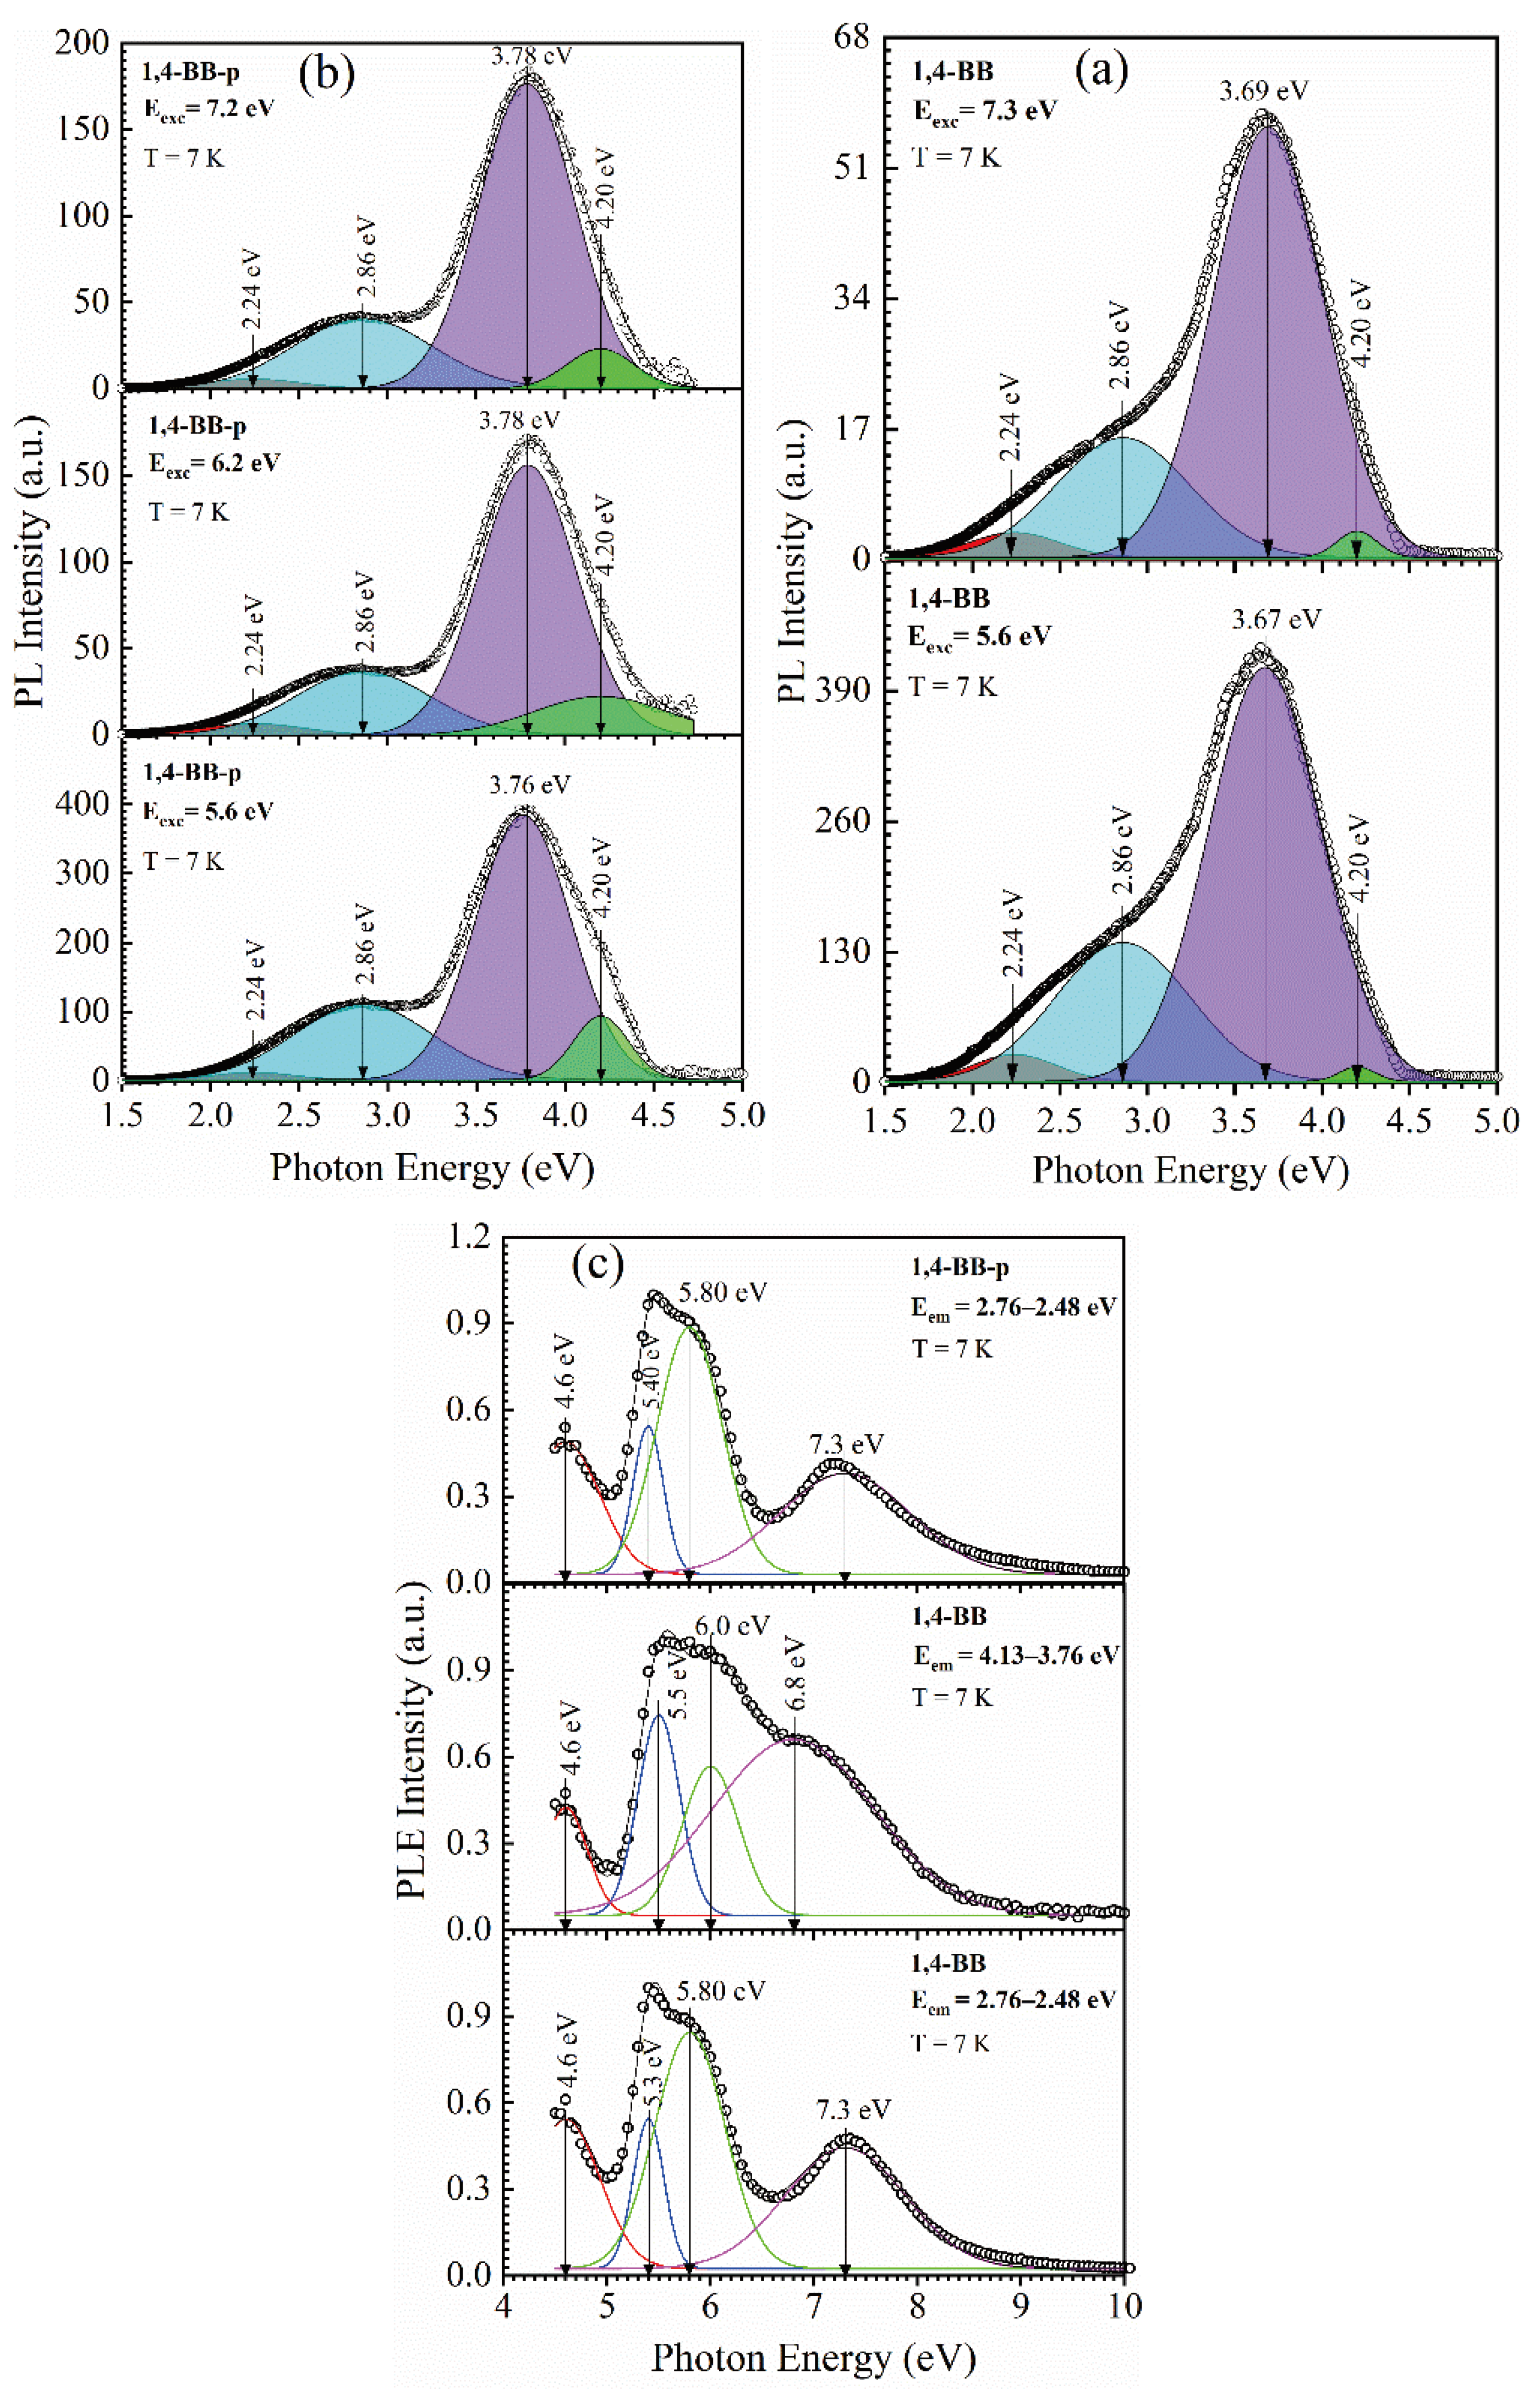
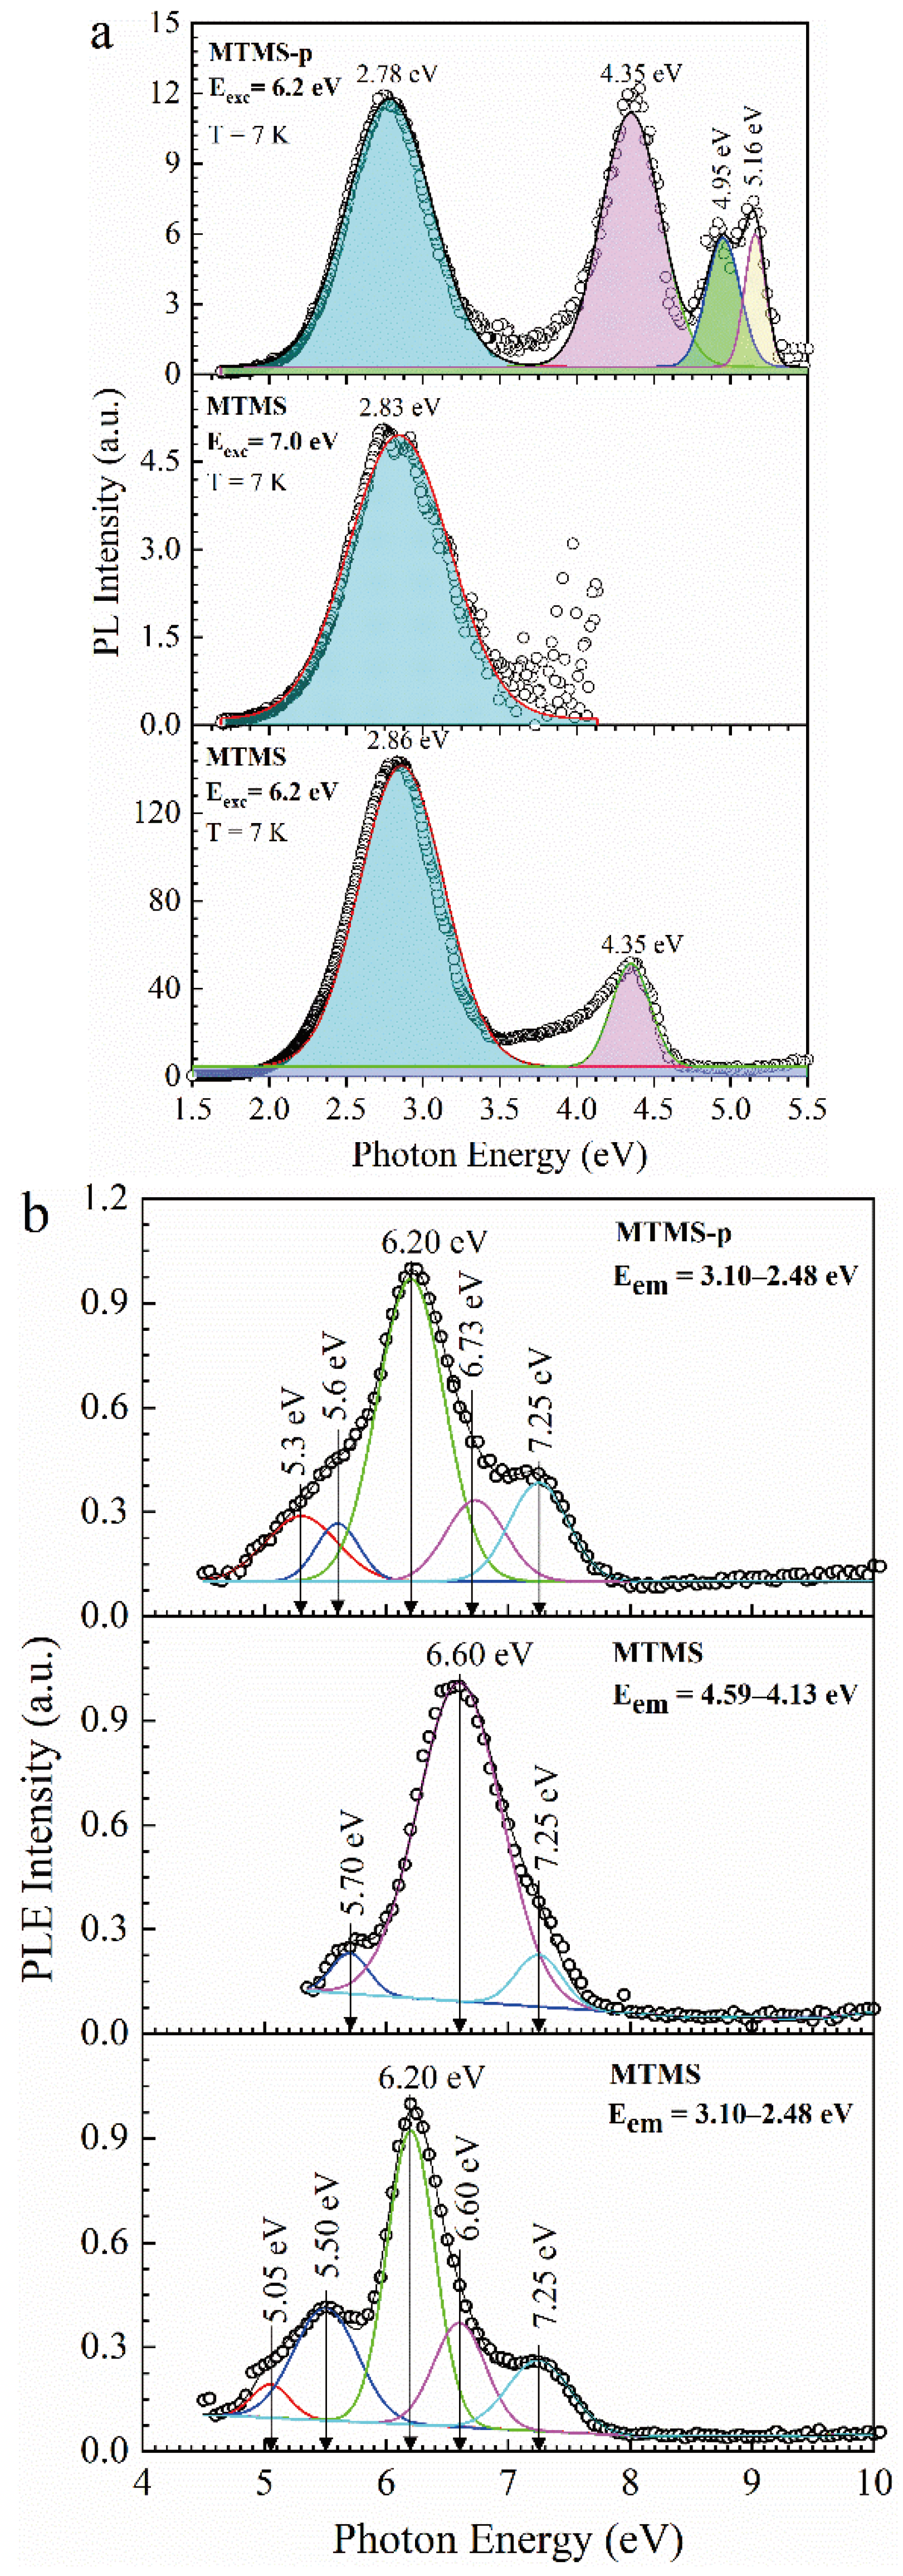
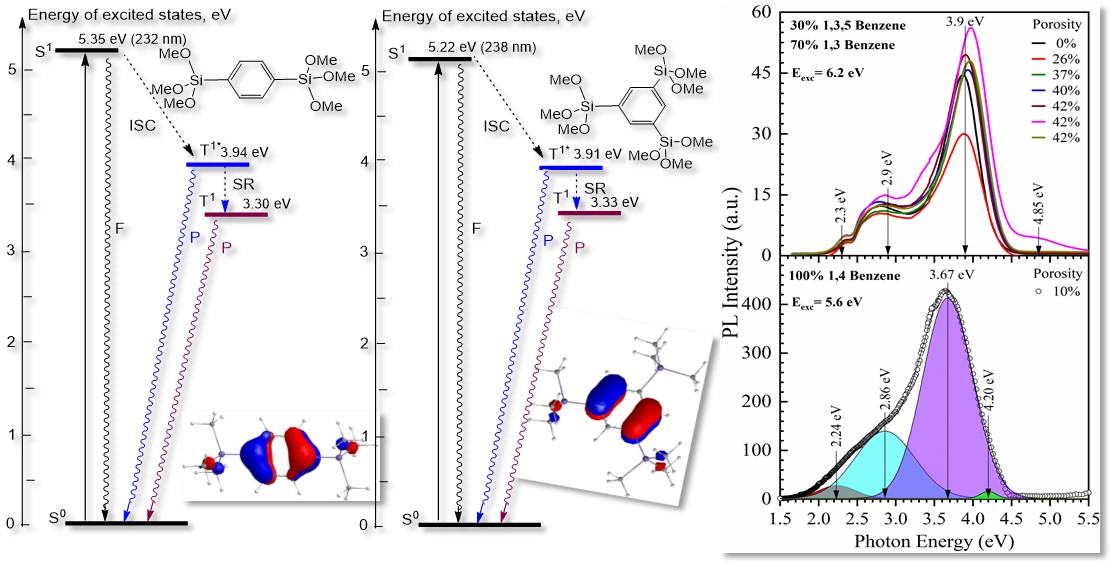
| Sample number | Sample ID | Terminal group(‒CH3) | Bridging group | Porogen | Characteristics PL peaks (eV) | |||
|---|---|---|---|---|---|---|---|---|
| 1-1 | BTMSE/MTMS=47/53 | YES | Ethylene | YES | - | 3.3 | 2.9 | 4.2 |
| 1-2 | BTMSE/MTMS=25/75 | YES | Ethylene | YES | - | 3.3 | 2.9 | 4.2 |
| 2-1 | 1,3,5/1,3-BB | NO | Benzene | YES | 3.9 | - | (2.90) | (4.85) |
| 2-2 | 1,4-BB | NO | Benzene | NO | 3.68 | - | (2.86) | - |
| 2-3 | 1,4-BB-p | NO | Benzene | YES | 3.78 | - | (2.86) | 4.2 |
| 3-1 | MTMS | YES | NO | NO | - | - | 2.85 | (4.35) |
| 3-2 | MTMS-p | YES | NO | YES | - | - | 2.78 | 4.35 |
| Assignment of PL peaks | Benzene bridge | Ethylene bridge | ‒CH3 terminal | C‒Hx | ||||
Disclaimer/Publisher’s Note: The statements, opinions and data contained in all publications are solely those of the individual author(s) and contributor(s) and not of MDPI and/or the editor(s). MDPI and/or the editor(s) disclaim responsibility for any injury to people or property resulting from any ideas, methods, instructions or products referred to in the content. |
© 2023 by the authors. Licensee MDPI, Basel, Switzerland. This article is an open access article distributed under the terms and conditions of the Creative Commons Attribution (CC BY) license (http://creativecommons.org/licenses/by/4.0/).


