1. Introduction
The coronavirus SARS CoV-2 that caused the COVID-19 (hereafter referred to as COVID) pandemic started in Wuhan China in December 2019 and spread throughout the US in late January 2020. The first case was diagnosed in New Orleans LA (NOLA) on March 9th, 2020, following massive spread during the preceding Mardi Gras festivities of late February 2020, where thousands of people gathered in packed crowds to watch multiple parades over a period of weeks. The infection spread quickly from what appears to be a superspreader event, with a unique feature as only one strain appears to have disseminated quickly instead of multiple strains as observed in other US cities. New infections climbed at the fastest speed ever seen in the US with a strain [
1] resembling that detected early February on the cruise ship Princess Diamond [
2]. After the first case of COVID, NOLA confirmed cases rose to nearly 600 over the next two weeks, then doubled afterward every three days, one of the highest rates observed in the US. Urban NOLA area was declared an early U.S. epicenter of COVID by the last week of March 2020, a situation reflected in the early observational study of Price-Haywood [
3]. By the end of July 2020, 116,280 total cases and 3,835 deaths from COVID were reported according to the Louisiana Department of Health.
Variants of SARS CoV-2 will likely develop and circulate for months to years to come and generate large numbers of critically ill patients for short periods of time, underscoring a critical need for simple clinical predictors that can be indicative of outcome, available immediately on admission and adapted in the management of health care resources when healthcare workers are overwhelmed. We initiated the ClinSeqSer acute COVID observational study in two medical centers in NOLA, recruiting from March 21th 2020 at the very beginning of the regional outbreak.
The population in greater urban NOLA, by US Census 2017 report, is comprised of 60% non-Hispanic Black and 30% White residents. NOLA’s population is plagued with high prevalence of advanced long-term health conditions including multiple risks for cardiovascular (CV) disease and stroke. CV diseases are observed in LA with some of the highest prevalence in the US and at relatively young age [
4,
5] a situation pictured by the percent and age of limb amputated in type two diabetes mellitus (T2DM) in LA [
6]. The Bogalusa Heart Cohort study in LA has documented CV risks in rural LA since the 1970s and discovered that Black LA residents have very high CV risk, with obesity and hypertension developing in childhood [
7,
8,
9] and consistent with the National Health and Nutrition Examination Survey. LA residents have been found to have low observance to anti-hypertensive therapy [
10,
11] and likely high daily sodium intake. LA daily salt intake is not documented in CDC nationwide studies; however, it can be presumed to be within the highest based on map gradient increases going to Southern states and per its neighbor state Mississippi [
12]. This assumption is indirectly corroborated by recent data from the Bogalusa Heart Study in LA [
13]. In addition, a 2018-2022 report shows the LA population ranks among U.S. states with the highest proportion of the population enrolled in Medicaid (~37%), and at the poverty level (~24%) [
14]. It is in this background of poor health and poverty that NOLA became a COVID epicenter in 2020.
2. Methods
2.1. Study Design
Study type. The ClinSeqSer cohort was designed as an observational, longitudinal, single region focused, study initiated in March 2020, titled Collection of SARS CoV-2 Serum and Secretions for Countermeasure Development, aimed to define correlates of acute COVID outcomes with any of the following: pre -COVID Long Term Conditions (LTC) and medications, presenting vitals, clinical evolution during admission, and clinical laboratory results. The sampling method of ClinSeqSer was as follows: patients were approached based upon admission SARS CoV-2 PCR result, followed by informed consent. Enrollment occurred from the day of hospital presentation and, for most, within two weeks of admission, and only in person (not remote) visits for consent and sample collection were performed. Recruitment: 89 patients were recruited from March through August 2020, followed by over 700 subjects through until September 2022, which will be presented in a later manuscript prepared with the CDC as part of a CDC contract.
Ethics approval. The study was conducted with approval from the Tulane and University Medical Centers (TMC and UMC) New Orleans Institutional Review Board (IRB) approvals under the protocol entitled “Collection of SARS CoV-2 Serum and Secretions for Countermeasure Development” [IRB 2020-396, approved 3/20/2020].
2.2. Participants: Study Group Selection, Inclusion Criteria, Definitions, and Methodology
Study group selection, and inclusion criteria. Adult patients ≥18 years old were enrolled in person during admission for acute COVID with inclusion criteria of confirmed detection of SARS CoV-2 by nasopharyngeal swab/EUA PCR test and willingness to provide consent. The recruitment period is March to August 2020.
Data source and collection. Clinical data, demographics, pre-COVID LTC, medications, on admission clinical data and laboratory tests results were collected from electronic medical records, MEDITECH EHR (TMC) and Epic EMR Systems (UMC). Data were stored in the Tulane REDCap database.
Definitions and methodology.
Surrogate of income. Zipcode (5 digits) and primary payer are used to determine socio-economic status of patients. Greater urban NOLA is geographically divided with income gradients generally demarcated by zipcode according to US census report 2017 [
15]. US Geological Survey (USGS) elevation data reports, described by the map of Katrina Flooding [
16], report the average home is at 0-2 feet flooding depth for higher income predominantly White parishes, and 4-8 feet flooding depth in areas matching zipcodes where most residents are Black. Parishes are geographical regions referred to as counties within most of the U.S.
Body Mass Index (BMI). Collected from admission or medical visits within the six months preceding COVID admission, calculated as kilogram weight/square meter height (kg/m2).
Obesity. Defined, by WHO criteria, as BMI ≥30kg/m2.
Co-morbidity scoring and mortality prediction during acute COVID admission. 1. Charlson Comorbidity Index (CCI) score. To estimate the comorbidity burden and predict survival in the setting of acute hospital admission we used the CCI in two versions: first, the most common, adapted from the original Charlson publication [
17,
18] is available as an online calculator based upon 12 comorbidities [
19]. Second, the age adjusted CCI [
20], which identifies 17 comorbidities including age, associated with mortality and appropriately assigns weights to each of them, ranging from 1 to 6 points [
21]. The total score in the CCI is derived by summing the assigned weights of all comorbid conditions from 0 (no disease burden) to 29 (maximal disease burden), and the total of the age adjusted CCI score 37 points. 2. Elixhauser score. The score is based upon 30 criteria including those of the CCI and in addition conditions such as HTN, obesity, hypothyroidism, anemia, and psychiatric conditions (depression, psychosis and drug/alcohol abuse). The van Walraven algorithm for the Elixhauser Comorbidity Index, ranging from 19 [less likely for in-hospital death] to 89 [more likely for in-hospital death] is presented as 0 to 82.4% of possible points [
22] and can be calculated with an online calculator [
19].
Essential Hypertension (HTN). Presence as a diagnosis in pre-COVID outpatient, inpatient, or emergency visit clinical notes and/or medications listed in the EMR, all confirmed by admission history and physical note.
Polypharmacy (PP). Concurrent use of two to four drugs (minor PP) and five or more drugs (major PP) [
23].
Blood pressure (BP) on admission. Systolic and diastolic BP were collected from the first vitals registered either by emergency medical services or in the emergency department. We excluded values when patients were noted to be in cardiogenic shock on admission (SBP ~90 +/-2 mmHg, MAP < 70mmHg, and confirmed in the clinical note; n= 4 excluded).
Blood oxygen saturation (SatO2). Admission SatO2 was measured by fingertip pulse oximeter, collected from initial vitals, on room air, only prior to initiation of any oxygen supplementation. Hypoxemia was defined as SatO2 < 92%.
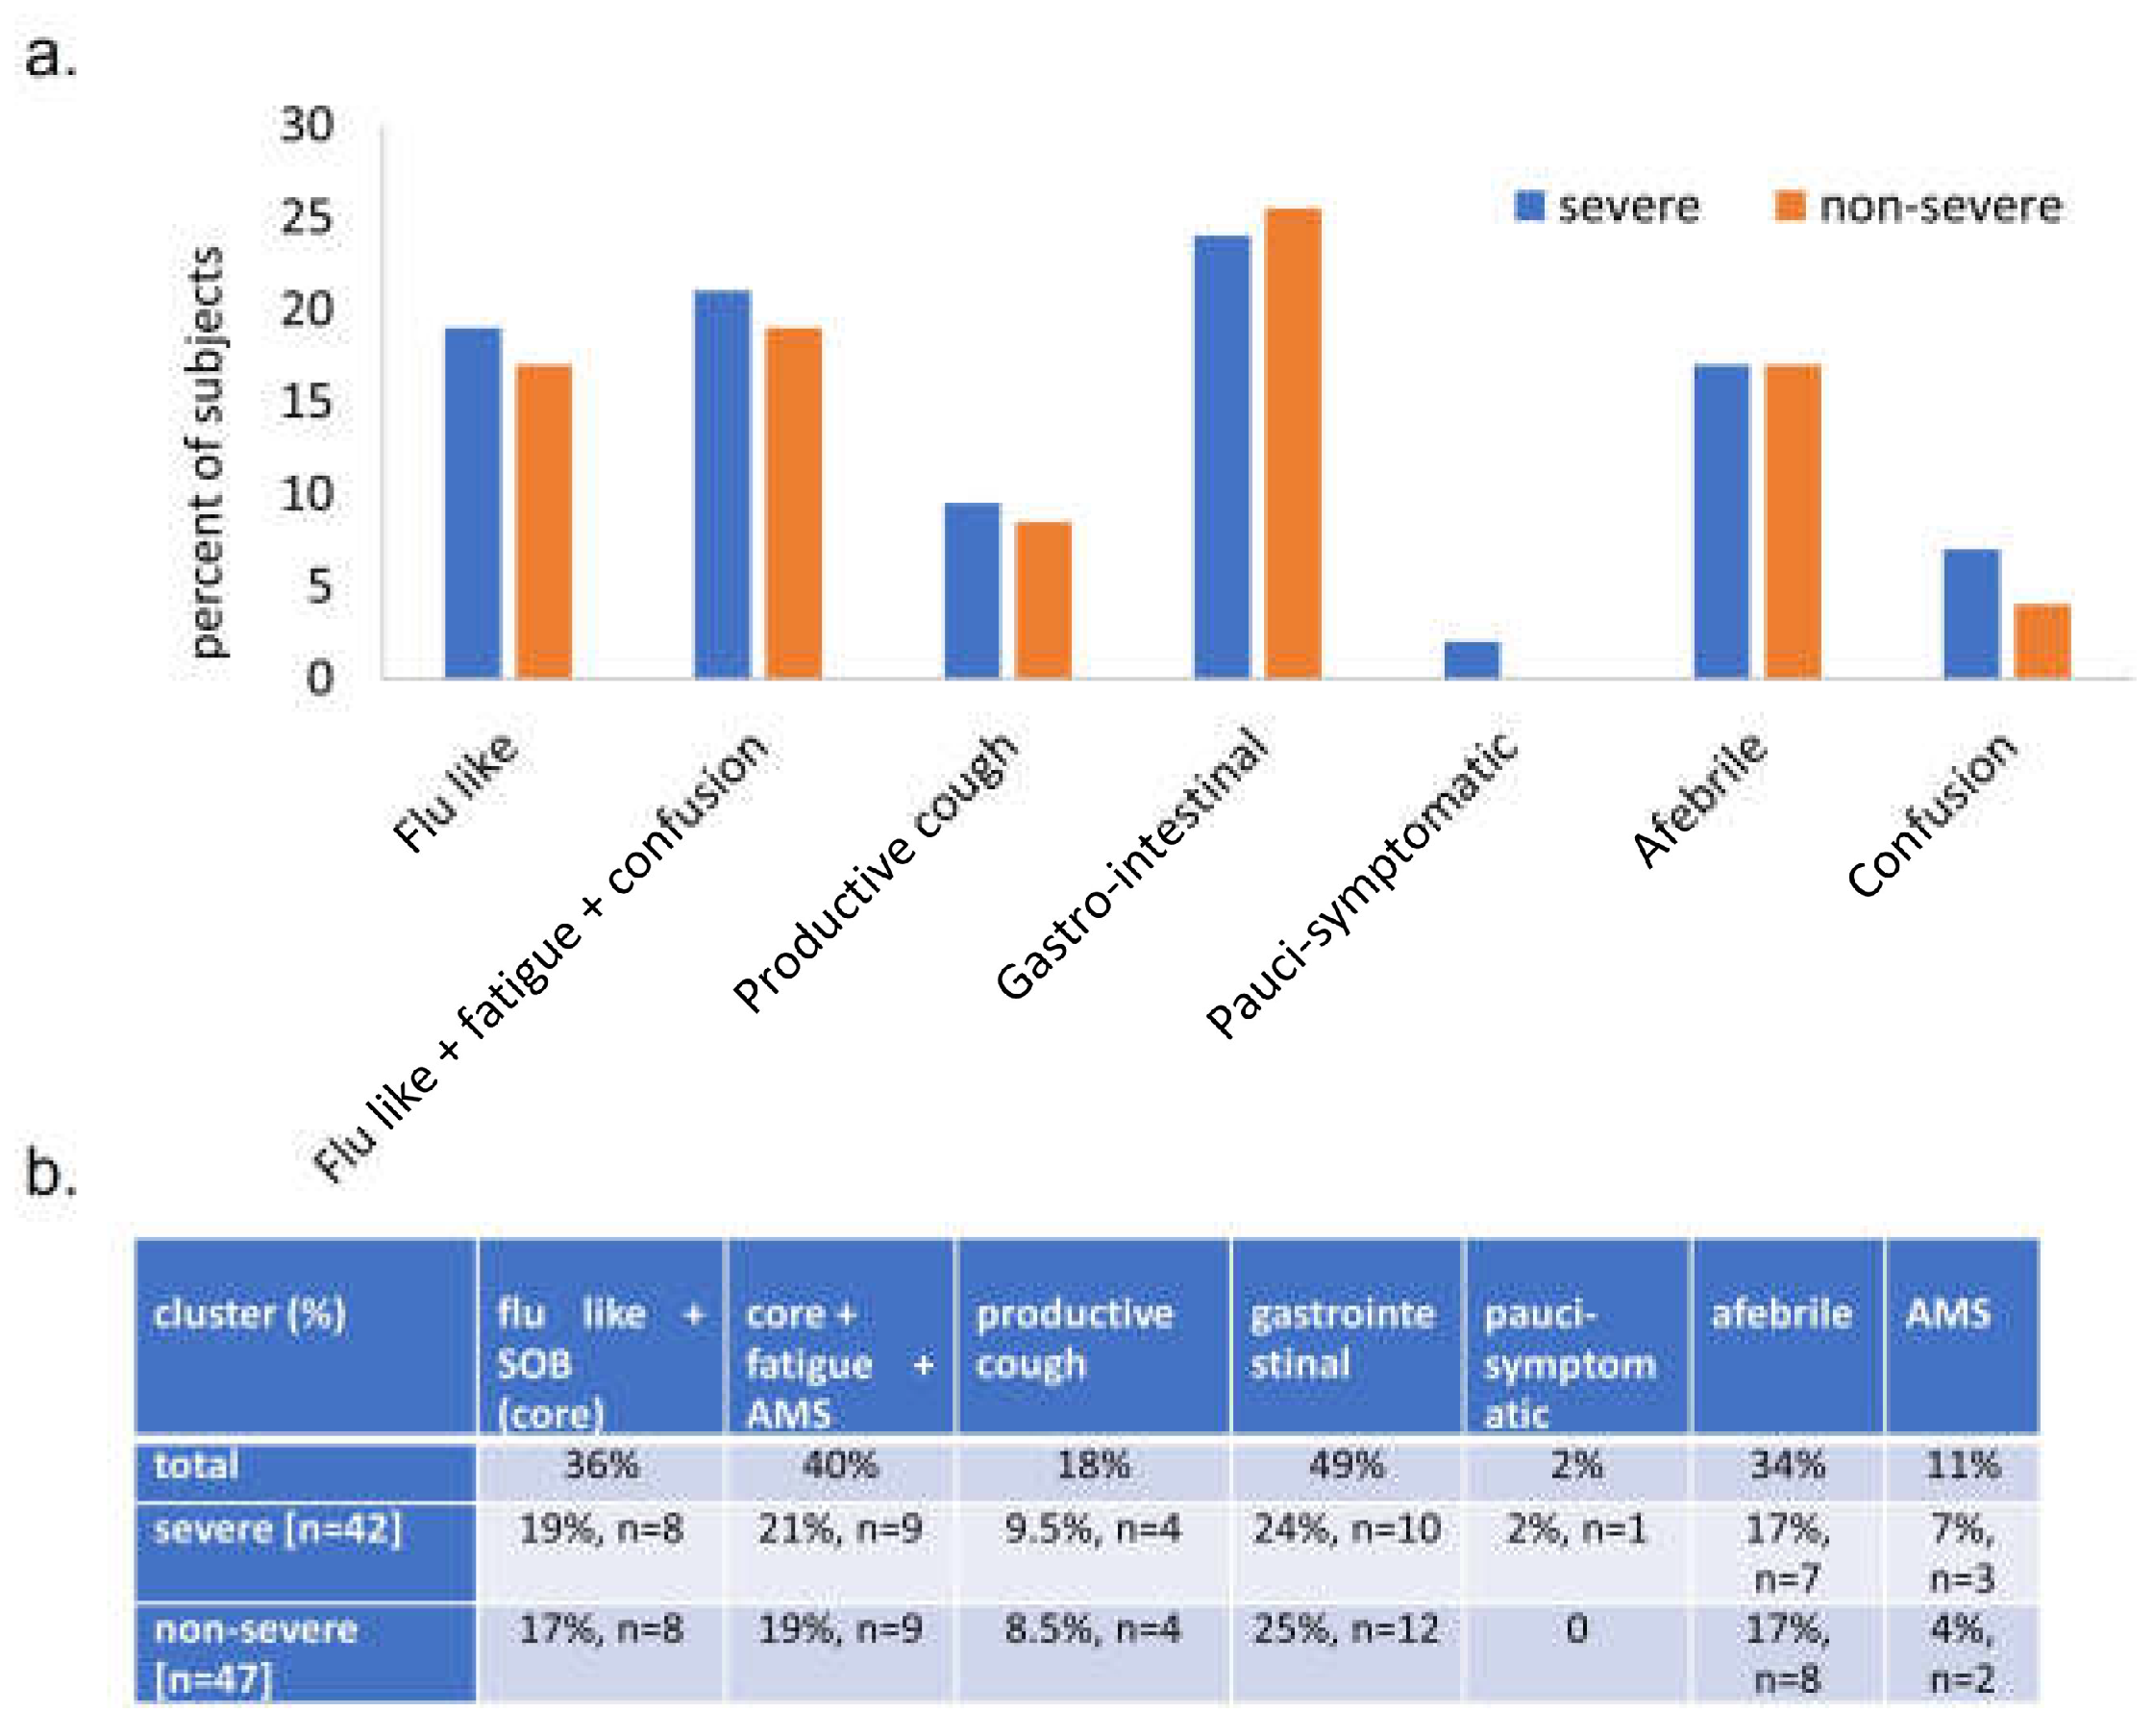
Symptom clusters described on admission. We grouped symptoms over onset period by clusters adapted from Millar [
24] as follows: core symptoms (flu-like and shortness of breath), core with fatigue and altered mental status/confusion, productive cough, gastrointestinal symptoms (nausea, vomiting, diarrhea), pauci-symptomatic, afebrile, and altered mental status/confusion alone.
Clinical scores were stratified per WHO Clinical score evaluation on a seven point ordinal scale as follows: 1-death within 28 days or within initial COVID admission; 2- mechanical ventilation/ECMO (note no subjects received ECMO at our center), 3- non-invasive ventilation / high flow oxygen > 6 L/min.; 4- required only low flow oxygen ≤ 6 L/min.; 5- admitted / did not require oxygen supplementation but medical care; 6- admitted did not require oxygen supplementation or medical care and 7- not admitted (emergency department visit only).
Fatal outcomes. Any death that occurred during acute COVID admission with a confirmed diagnosis of COVID made by nasopharyngeal PCR, with symptoms of acute respiratory illness or death attributed to any clinically compatible illness.
Groups of patients by severity. Patients with clinical score 1 to 3 are included in “severe” and 4 to 7 in “nonsevere” ultimate COVID outcome groups.
Biological markers.
C reactive protein (CRP mg/mL) results were issued by local clinical laboratory, with normal values being <0.3 mg/mL. Only CRP values from blood draw within the first 48 hours of admission were assessed.
Glomerular Filtration Rate (eGFR mL/min) estimate provided in clinical laboratory results is calculated from serum creatinine using the MDRD equation (2006). Interpretation of values: 0-15mL/min, kidney failure; 15-90mL/min, kidney disease; > 90ml/min, normal kidney function.
Natriuretic peptide tests, NT-proBNP (pg/mL). Age adjusted cut-off used to predict likelihood of heart failure according to the clinical laboratory results sheet are available in
Table S5 [
25]. Tests were run either on Roche, Elecsys or Abbott, Architect platforms. Both display close correlation, with similar upper range of 30,000 and 35,000 pg/mL, with Roche allowing issue of results up to 70,000 pg/mL after 2-fold dilution.
2.3. Statistics
We report categorical variables as percentage and continuous variables as mean/SD if normally distributed or median and IQR if non-normally distributed. The data were analyzed using Chi-squared, Mann Whitney U test or t-test methods as appropriate. Statistics applied for normal distribution assessment, average/median/IQR were performed in Excel and basic statistics when available in Excel data analysis, stat tests (t-test, Mann Whitney) using calculators available on-line [Statology] and ROC curve analysis in Excel according to tutorial provided by Statology. Biological test results such as BNP values were collected as worst value during acute COVID admission. Based on lack of normal distribution for values of BMI and BNP, the median and interquartile range were reported, and Wilcoxon rank-sum (Mann-Whitney) test was used to compare the two outcome subgroups, severe and non-severe.
4. Discussion
The CDC and others have acknowledged that “The COVID-19 pandemic has highlighted racial, ethnic, and socioeconomic disparities in COVID-19 illnesses, hospitalizations, and deaths” [
26]. Consistent with the CDC statement, our study reflects on the pandemic impact in NOLA in early 2020, enriched in patients with among the most precarious states of health in the US. This acute COVID, hospitalized, cohort includes a twofold of enrichment for HTN compared to the 41% HTN prevalence reported among LA residents in general in 2017 [
27]. Also consistent with the CDC statement, the LA Dept Health reported, in mid-April 2020, among 21,000 confirmed cases, a prevalence of HTN of 60% within those 884 residents with fatal COVID outcome [
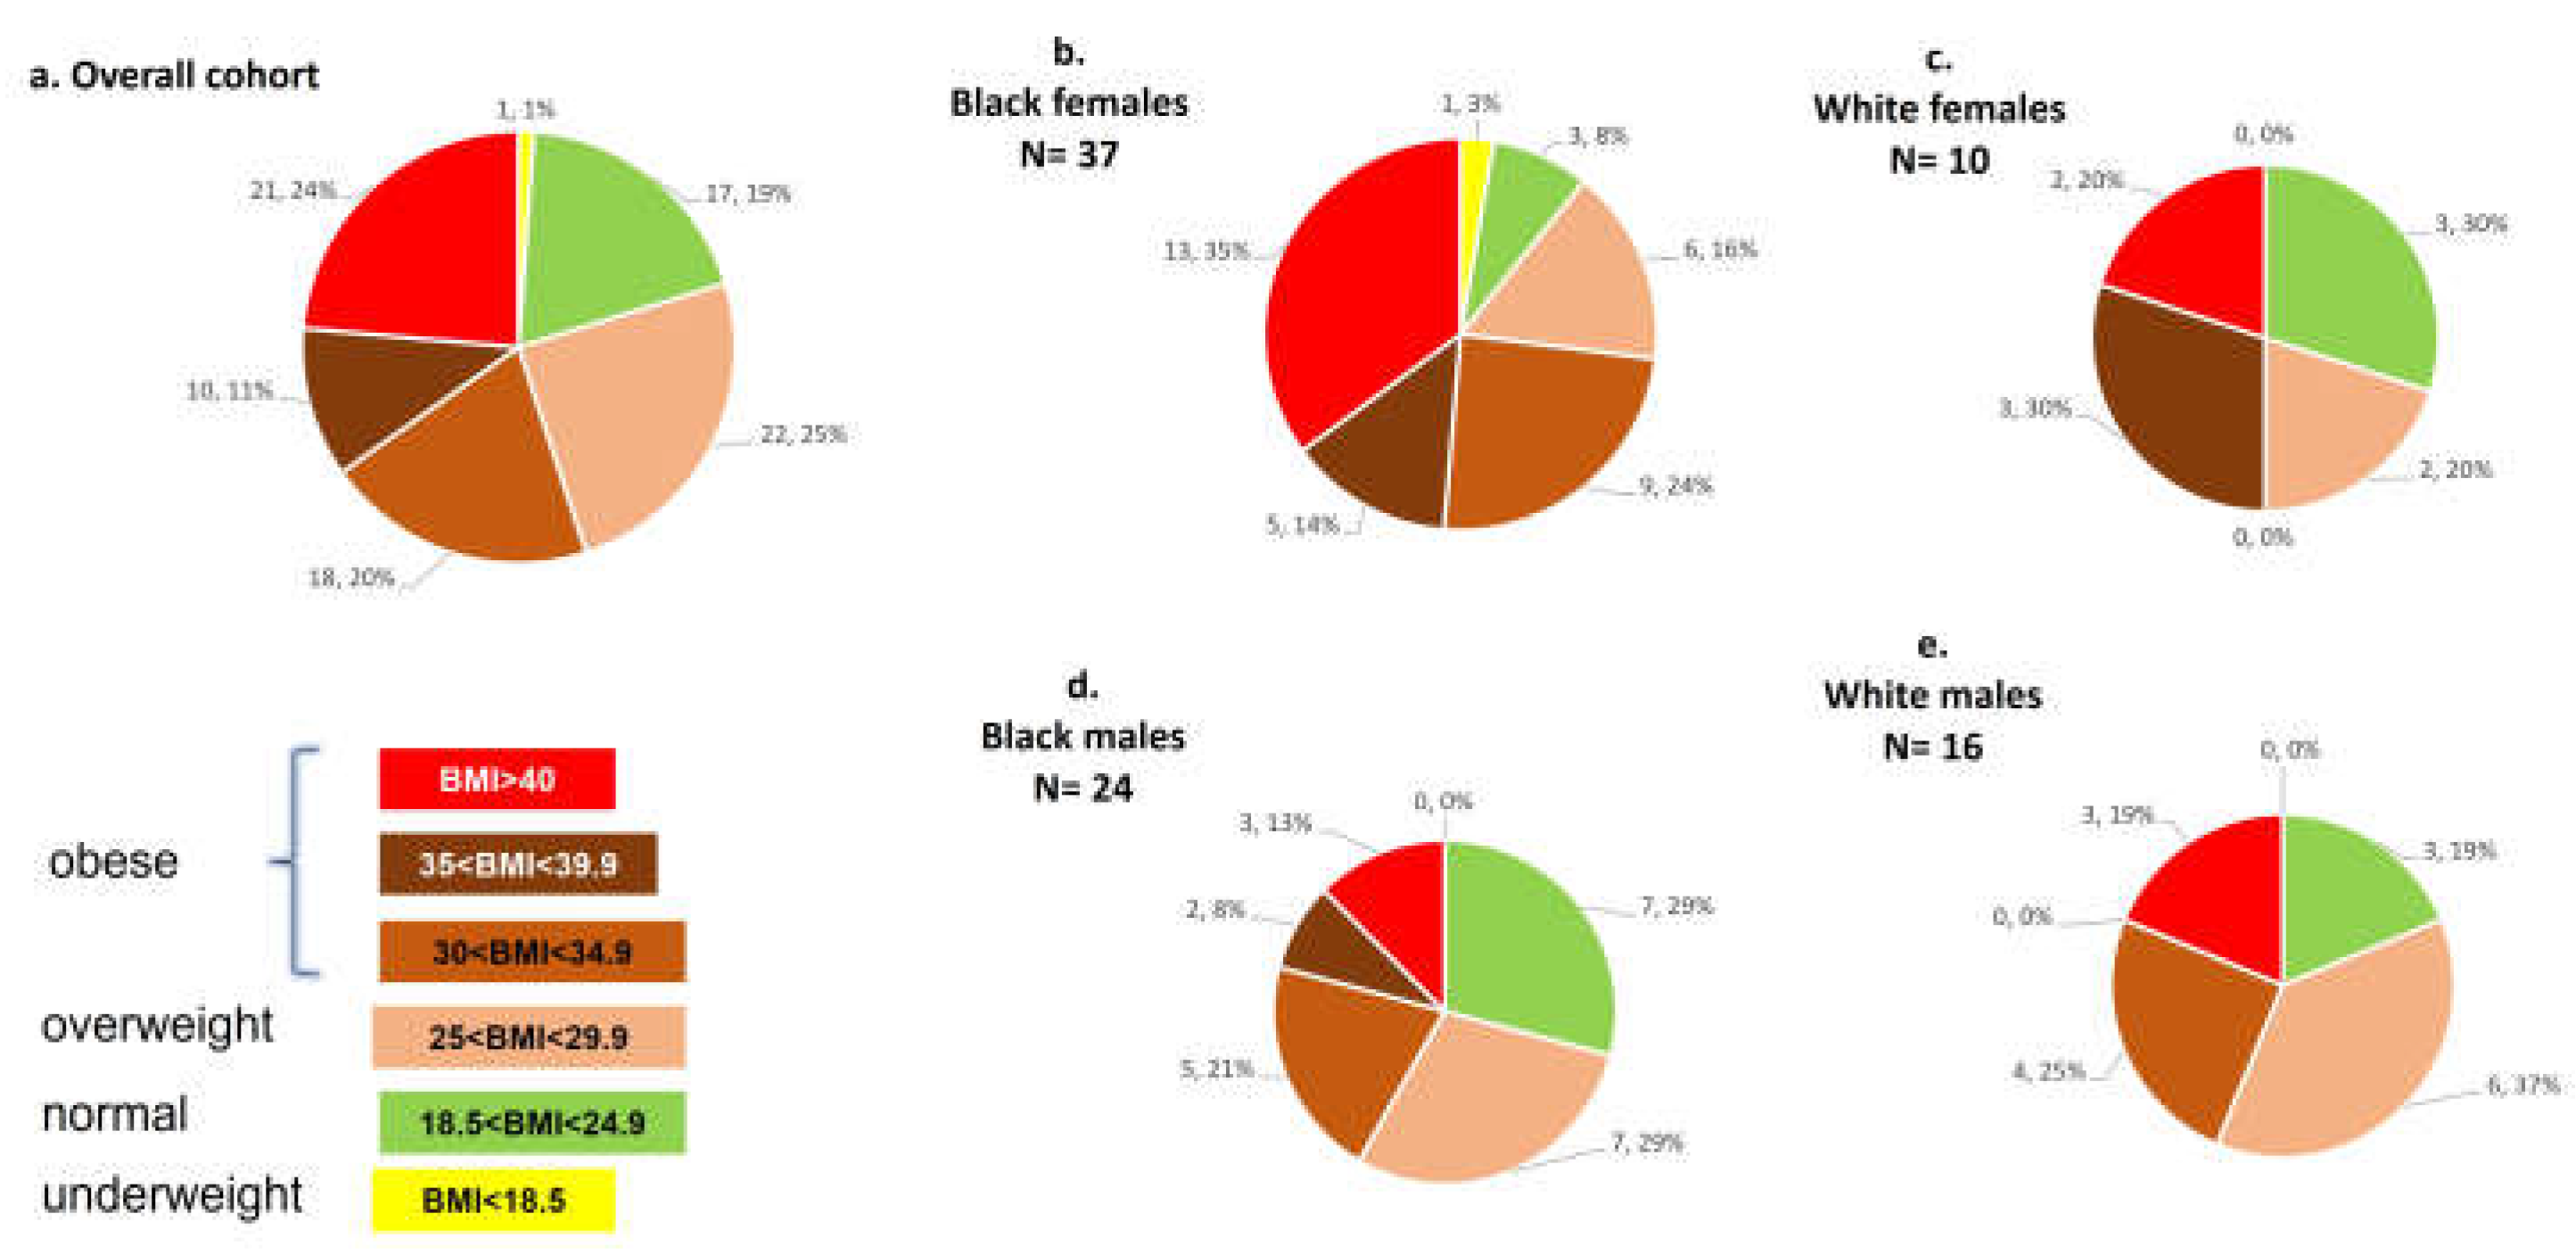
28]. It is worth noting that the prevalence of obesity in our cohort, 55%, resembles the general US population. However, we have a strong enrichment in Black females with severe obesity (73% with obesity, 35% morbidly obese), distinguishing this cohort from others. We describe here the dramatic combination of an immune-naïve, highly co-morbid population with a very high attack rate by a single predominant strain of SARS CoV-2 [
1]. In recent times, the 2009 H1N1 influenza and the COVID-19 pandemic, a massive influx of patients in critical condition have rapidly exhausted the best health care resources, where cutting-edge technology has proven its limitation or even be
en misleading in the triage of patients and debulking of hospital beds. Anticipating new outbreaks of SARS CoV-2 and other emerging pathogens, we propose to identify simple clinical correlates of acute respiratory illness outcome.
In March 2020, evidence-based guidelines for COVID-19 patient triage were not available. Triage is a protocol implemented in the army with grading of injuries and prioritizes care to those that have a reasonable likelihood of being efficiently treated. Taking care of life-threatening injuries at the time of a massive influx of patients in a context of limited health care resources would only divert the resources from patients with higher chances of survival. We therefore sought to identify simple correlate of severity allowing prevention of situations requiring triage. Better prediction of COVID needs could prevent premature discharge of patients likely to worsen and, instead, flag them appropriately for earlier intervention such as steroids. Importantly we opt for correlates of severe versus non-severe outcomes, rather than death versus discharged. Death versus discharged, while helpful, does not identify those patients who will benefit from admission (mechanical ventilation and high flow oxygen). One of the important observations from our study is the overlap of admit symptoms and admit oxygen requirement within the first 24-48 hours of admission, between patients who will experience severe and non-severe outcome.
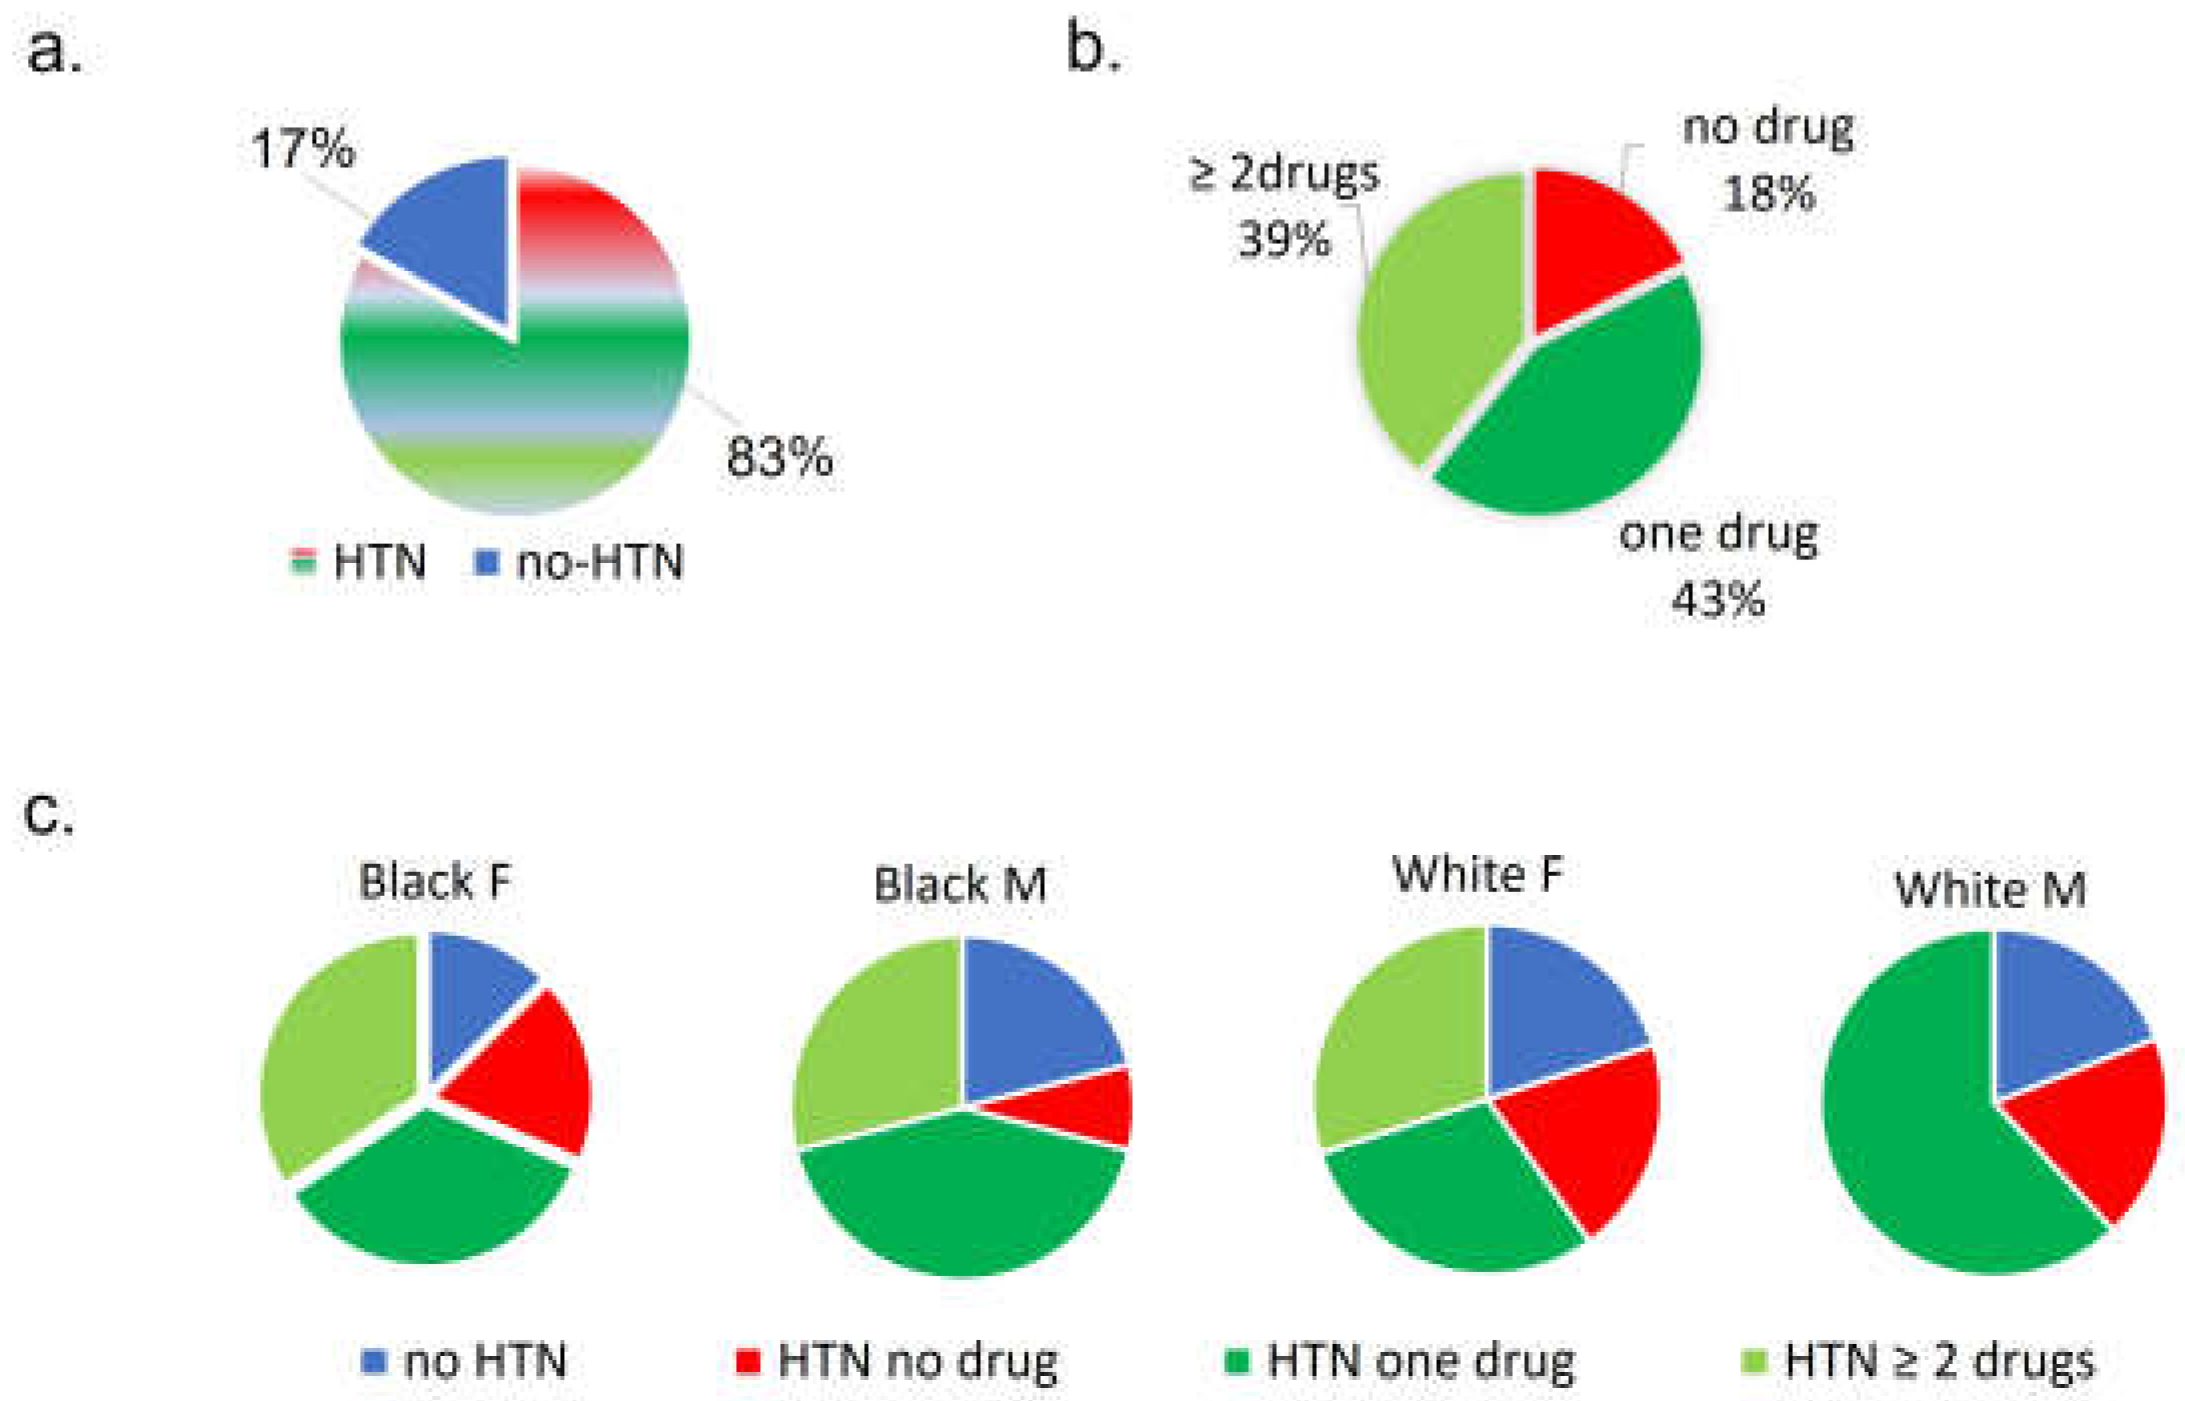
Within this short window from presentation, we sought to determine whether COVID outcome correlated with pre-COVID comorbidities, medications or comorbidity scores, admit vitals or symptoms, early admission oxygen requirements, or frequently ordered biomarkers (BNP, GFR, CRP). It was evident early in our cohort that pre-COVID HTN alone could not predict severe outcome since 83% patients had essential HTN pre-COVID, and roughly half still had a non-severe outcome.
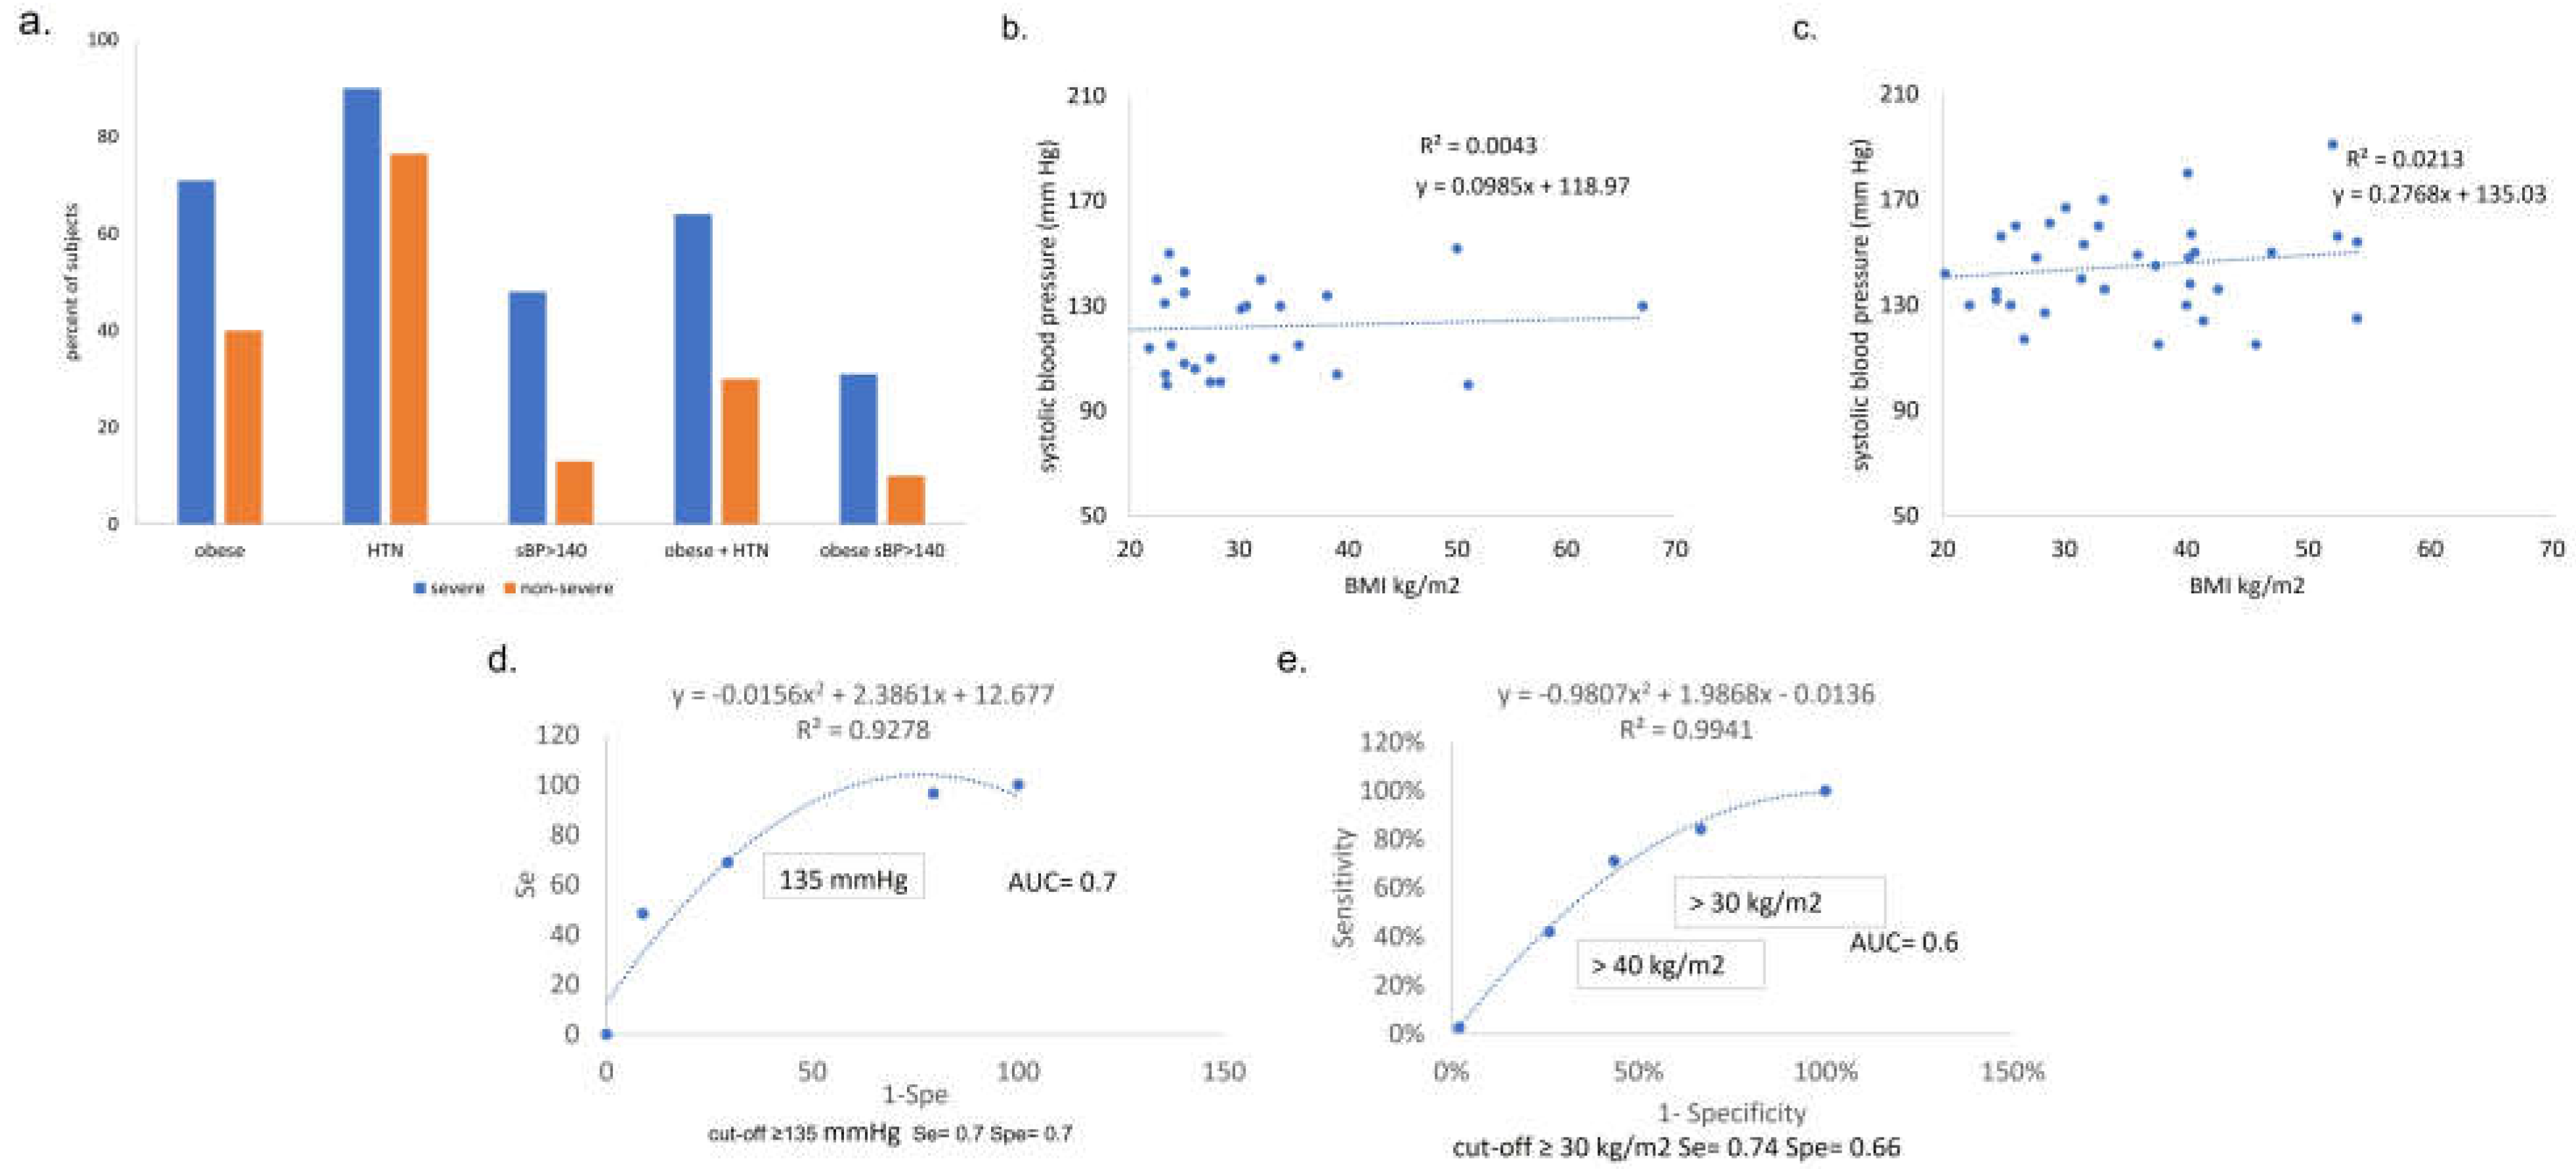
Among comorbidities, in our cohort obesity is a correlate of outcome with 60% accuracy. In contrast to multiple studies reporting correlation between obesity and HTN, obesity did not correlate with HTN or admit SBP in our cohort. This may be related to the cohort’s antihypertensive treatment, where the correlation is less evident [
29]. In this COVID cohort, it is also difficult to assess correlation between obesity and HTN as 83% of patients had pre-COVID HTN. The drop of prevalence of obesity and HTN, respectively 71% and 90% in severe, vs. 40% and 76% in non-severe, suggest that obesity contribution to COVID severity maybe more important. In contrast, BMI is not correlated with SBP. This may be due to the small number of patients in a markedly skewed population for BMI. However, it could also be related to variable management of pre-COVID HTN: the number of anti-HTN drugs and the cluster of pre-COVID comorbidities are overall suggestive of under-management of preventable health conditions and overall consistent with poor anti-HTN treatment compliance, as recently reported in LA [
10]. Better pre-COVID HTN management may have contributed somehow to better COVID outcomes, overriding impact of BMI [
30].
Severity Scores vs CCI. To allow standard comparison across cohorts we calculated comorbidity scores using Charlson’s age adjusted score, the age independent score modified by Deyo, and the Elixhauser score by the van Walraven algorithm. We initially sought to score comorbidities by the Charlson’s comorbidity index score (CCIS) in the Deyo adapted version, and, in addition, used the online calculator developed by Charlson [
20] as an age independent score. By both methods, the CCI is low (3 to 5 points on a maximum of 29) and poorly correlated with COVID outcomes (fatal, severe, and non-severe) in this cohort. Although the cohort’s patients display a high prevalence of comorbidities associated with risk for severe
COVID outcomes, the CCI may not reflect optimally the extent to which relatively young patients have high comorbidity in LA. In our study, the CCI is on average 4 in severe and 3 in non-severe, on a maximum score of 29 or 37 for CCIs/age adjusted CCIs [
20]. Importantly, the low CCI scores we observe are consistent with those reported in the Ochsner cohort in NOLA [
3]. In addition, the comparison from one study to another is difficult as multiple versions of the CCI are used and authors rarely specify the CCI version used [
31]. In our cohort, if the Elixhauser indicates very high risk comorbidity, it does not correlate with mortality or severity. Consistent with our findings, Stanley et al. developed a multi-comorbidity index (the M-3 index) based on more than 50 criteria, and compared the M-3 index with both CCIs and Elixhauser, finding much better predictive performance, but unfortunately to be an impractical tool [
32].
Because we did not find that these existing score systems predicted COVID severity in our cohort, we aimed to find a clinical predictor better adapted to our unique population, highly enriched for pre-COVID hypertension. In the study by Caillon et al. SBP on admit was on average higher in patients (and correlated with) fatal outcomes vs. discharged (137 vs. 125 mmHg). Compared to our cohort, the Caillon patients are similarly immune naïve [
33]. The level of HTN is, however. much lower (~20%), and obesity is not reported.
In this small study, biomarkers BNP, eGFR, and CRP did not conclusively correlate with COVID outcome. By comparing mean/median IQR of raw NT-proBNP values in severe vs non severe of anytime NT-proBNP, we found significant difference between severe and non-severe groups. Using the PRIDE age adjusted algorithm, however, we do not explain why we have similar proportions of likelihood of HF in patients with severe and non-severe outcomes. We note limitations to interpretation of those observations: first, few subjects have NT-proBNP ordered on admission and few had consistent dyspnea leading to marker order. Second, age adjusted BNP cut-offs leave large zones of indecision since we were unable to interpret values measured on/after days into admission, since interpretation requires baseline heart function, evolution of renal function, and differs in the setting of valve dysfunction, a PE, acute coronary syndrome, arrythmia, or volume overload, and with fluid balance, oxygen support and use of cardio-pressors. Multiple studies have reported NT-proBNP levels, independently of HF diagnostic, as strong correlate of severity for acute COVID. Due to multiple origins of NT pro-BNP elevation, and to small numbers, we cannot consistently conclude either a correlation between COVID severity and differences of NT-proBNP levels observed. Overall, our study raises questions on how ordering and interpretation of NT-proBNP can be better standardized for diagnosis of severity and management of acute COVID and viral acute respiratory infections in general. The CRP was rarely ordered within the first 24-48 hours, although the small number of levels obtained in this timeframe seem to correlate with COVID outcomes.
Weaknesses of the study include difficulty determining the role of HTN in COVID severity in this cohort. Multiple studies found correlation between coexistence of obesity and HTN. However in populations with antihypertensive treatment, the correlation is less evident [
29]. In this COVID cohort, it is difficult to assess correlation between obesity and HTN as 83% of patients had pre-COVID HTN. The lower prevalence of obesity and HTN, respectively, in non-severe (40% obesity, 76% HTN) versus severe (71% obesity, 90% HTN), suggests that obesity’s contribution to COVID severity may be more important in this cohort. In contrast, BMI is not correlated with admit SBP. This may be due to the small number of patients in a markedly skewed population for BMI. However, it could be related to better management of prior HTN. Others have shown that multiple anti-HTN therapy prescribed per patients were not indicative of better BP control since in many cases poor compliance can be misinterpreted as anti-HTN drug class resistance leading to the addition of another drug form a difference class. Another source of bias is in assumption that anti-HTN medications are solely used to treat HTN, and instead we acknowledge use of these agents as anxiolytics (beta-blockers), for micro-proteinuria (ACEi), CHF (diuretics), etc that can hardly be avoided without scrutinizing EMRs in extensive detail, which was beyond the scope of this study.
Severe acute COVID outcomes have been associated with cardiovascular risks, specifically obesity [
34] and poorly controlled pre-COVID hypertension (HTN). In a study over the early phase of the COVID pandemic in 189 patients admitted to a hospital in Wuhan, China, higher average SBP measured on admission was observed in patients with fatal outcome, compared to those discharged home [
33]. In this cohort, the death rate was similar to our cohort, however the prevalence of HTN was much lower and no data regarding obesity was presented. In the early NOLA cohort of Ochsner, the pre-COVID HTN prevalence is 22% in White and 33% in Black patients who tested positive for COVID, but not provided in admitted patients [
3]. This is potentially attributed to the population including a more affluent community with greater preventive healthcare access. Because our cohort is unique in its strong enrichment for pre-COVID HTN, we hypothesized that risk factors for severe COVID might be more pronounced than among healthier cohorts. Specifically, we questioned whether pre-COVID HTN could constitute a risk factor for severe COVID-19, as 83% of patients had pre-COVID essential hypertension, with 50% exhibiting non-severe COVID outcome. We found that, in this highly hypertensive cohort, obesity and on-admit systolic blood pressure, but not pre-COVID hypertension, correlated with COVID outcome. We aimed at defining specific cut-off values and calculating sensitivity/specificity by ROC analysis, and outlined the rationale / clinical context where these correlates would be most useful.
It is notable that Black females had remarkably poor health conditions, at a relatively young age of 62 on average on admission: HTN prevalence of 80%, obesity of 73% [median BMI 33kg/m2], a striking 48% proportion of morbid obesity (BMI > 40kg/m2), with high rates also of asthma, T2DM, abdominal surgeries, psychiatric disorders and marked polypharmacy. Polypharmacy and multiple surgery may explain some of the differences of outcomes observed in patients with equivalent scores of co-morbidities. Polypharmacy in our cohort includes many drugs with central respiratory depression (CRD) as a side effect, and, especially for patients with asthma, COPD, CKD, can lead to dramatic CRD, which could influence COVID outcomes. Similarly, abdominal surgeries, at multiple times or major laparotomy, can contribute to muscle dysfunction/deconditioning related to prolonged post-surgery inactivity, and abdominal wall scarring. Abdominal wall/diaphragmatic muscles weakness dysfunction may also contribute to less optimal ability to increase efforts for cough and acceleration of respiratory rate.
The correlates of outcome we identified, obesity and admit SBP > 140 mmHg, may have sufficient sensitivity, specificity and accuracy to be useful for the purposes of screening patients for severe COVID risk. Our findings may be helpful as simple, low cost clinical predictors. Some of the possible hypotheses regarding why high admit SBP could predict worse COVID outcome include: 1) Pre- COVID comorbidities, such as poorly controlled HTN, CKD, obesity, polypharmacy including ACEi, advanced age; or 2) a specific effect / viral load of the SARS CoV-2 upon the renin angiotensin axis such as direct infection/kidney injury (reflected by accumulation of BNP); or 3) specific polymorphisms, frequently encountered in Blacks, of sodium channel (Liddle phenotype), or hypersensitivity to bradykinin (ACEi induced angioedema) [
35,
36], or specific variants of the ACE2 receptor [
37] or 4) Specific strain of SARS CoV-2 spreading at that time responsible for the increased of SBP on admission in a subset of subjects.
Figure 1.
Distribution of pre-COVID HTN and, if HTN, treatment prescribed, for overall cohort then grouped by race, sex. (a) Percent of subjects with HTN, (b) among hypertensive subjects, percent prescribed anti-hypertensive drugs, (c) distributions of hypertensive subjects and anti-hypertensive drugs prescribed, grouped by race, sex. HTN=hypertension, F=female, M=male.
Figure 2.
Distribution of Pre-COVID Obesity in ClinSeqSer Cohort. Distribution of BMIs among entire ClinSeqSer cohort and among cohort race/sex subgroups. BMI (kg/m2) in (a) overall cohort, (b) Black females, (c) White females, (d) Black males, (e) White males. Distributions are indicated next to pie wedges as number of subjects, percent of subjects (n,%).
Figure 3.
Comparison between ultimate COVID outcome and presence of pre-COVID HTN and HTN drugs prescribed, by number and class of drugs. (a) Percentage of patients with pre-COVID HTN and anti-HTN therapy is proportional to COVID severity outcome. 1- death (n=17), 2- mechanical ventilation (n= 14), 3- hi-flow oxygen (n= 11), 4- low-flow oxygen (n=26), 5- admitted, did not require oxygen, required medical care (n= 18), 6- admitted for non-medical reasons (n= 0) and 7- ED visit / not admitted (n= 3). Note y axis starts at 40. (b) Number and proportion of subjects with pre-COVID HTN / anti-HTN drug prescribed, grouped by ultimate COVID outcome. More subjects who experienced severe COVID were prescribed pre-COVID monotherapy for HTN, while subjects with non-severe COVID had anti-HTN multitherapy. (c) Antihypertensives prescribed to ClinSeqSer subjects prior to COVID, grouped by drug class and ultimate COVID severity. Anti-HTN drugs prescribed to ClinSeqSer subjects pre-COVID grouped by by action (y axis), and clinical score (blue: non-severe, CS 4 to 7, and green: severe, CS1 to 3, with percents (top) and absolute numbers (bottom) presented). We observe an enrichment of ACEi use in the group of subjects who experienced severe COVID outcomes but not a statistically significant difference. Proportions presented here represent [all drugs prescribed / all subjects with pre-COVID HTN, with or without anti-HTN therapy]. ACEi= angiotensin converting enzyme inhibitor, ARB= angiotensin receptor antagonists.
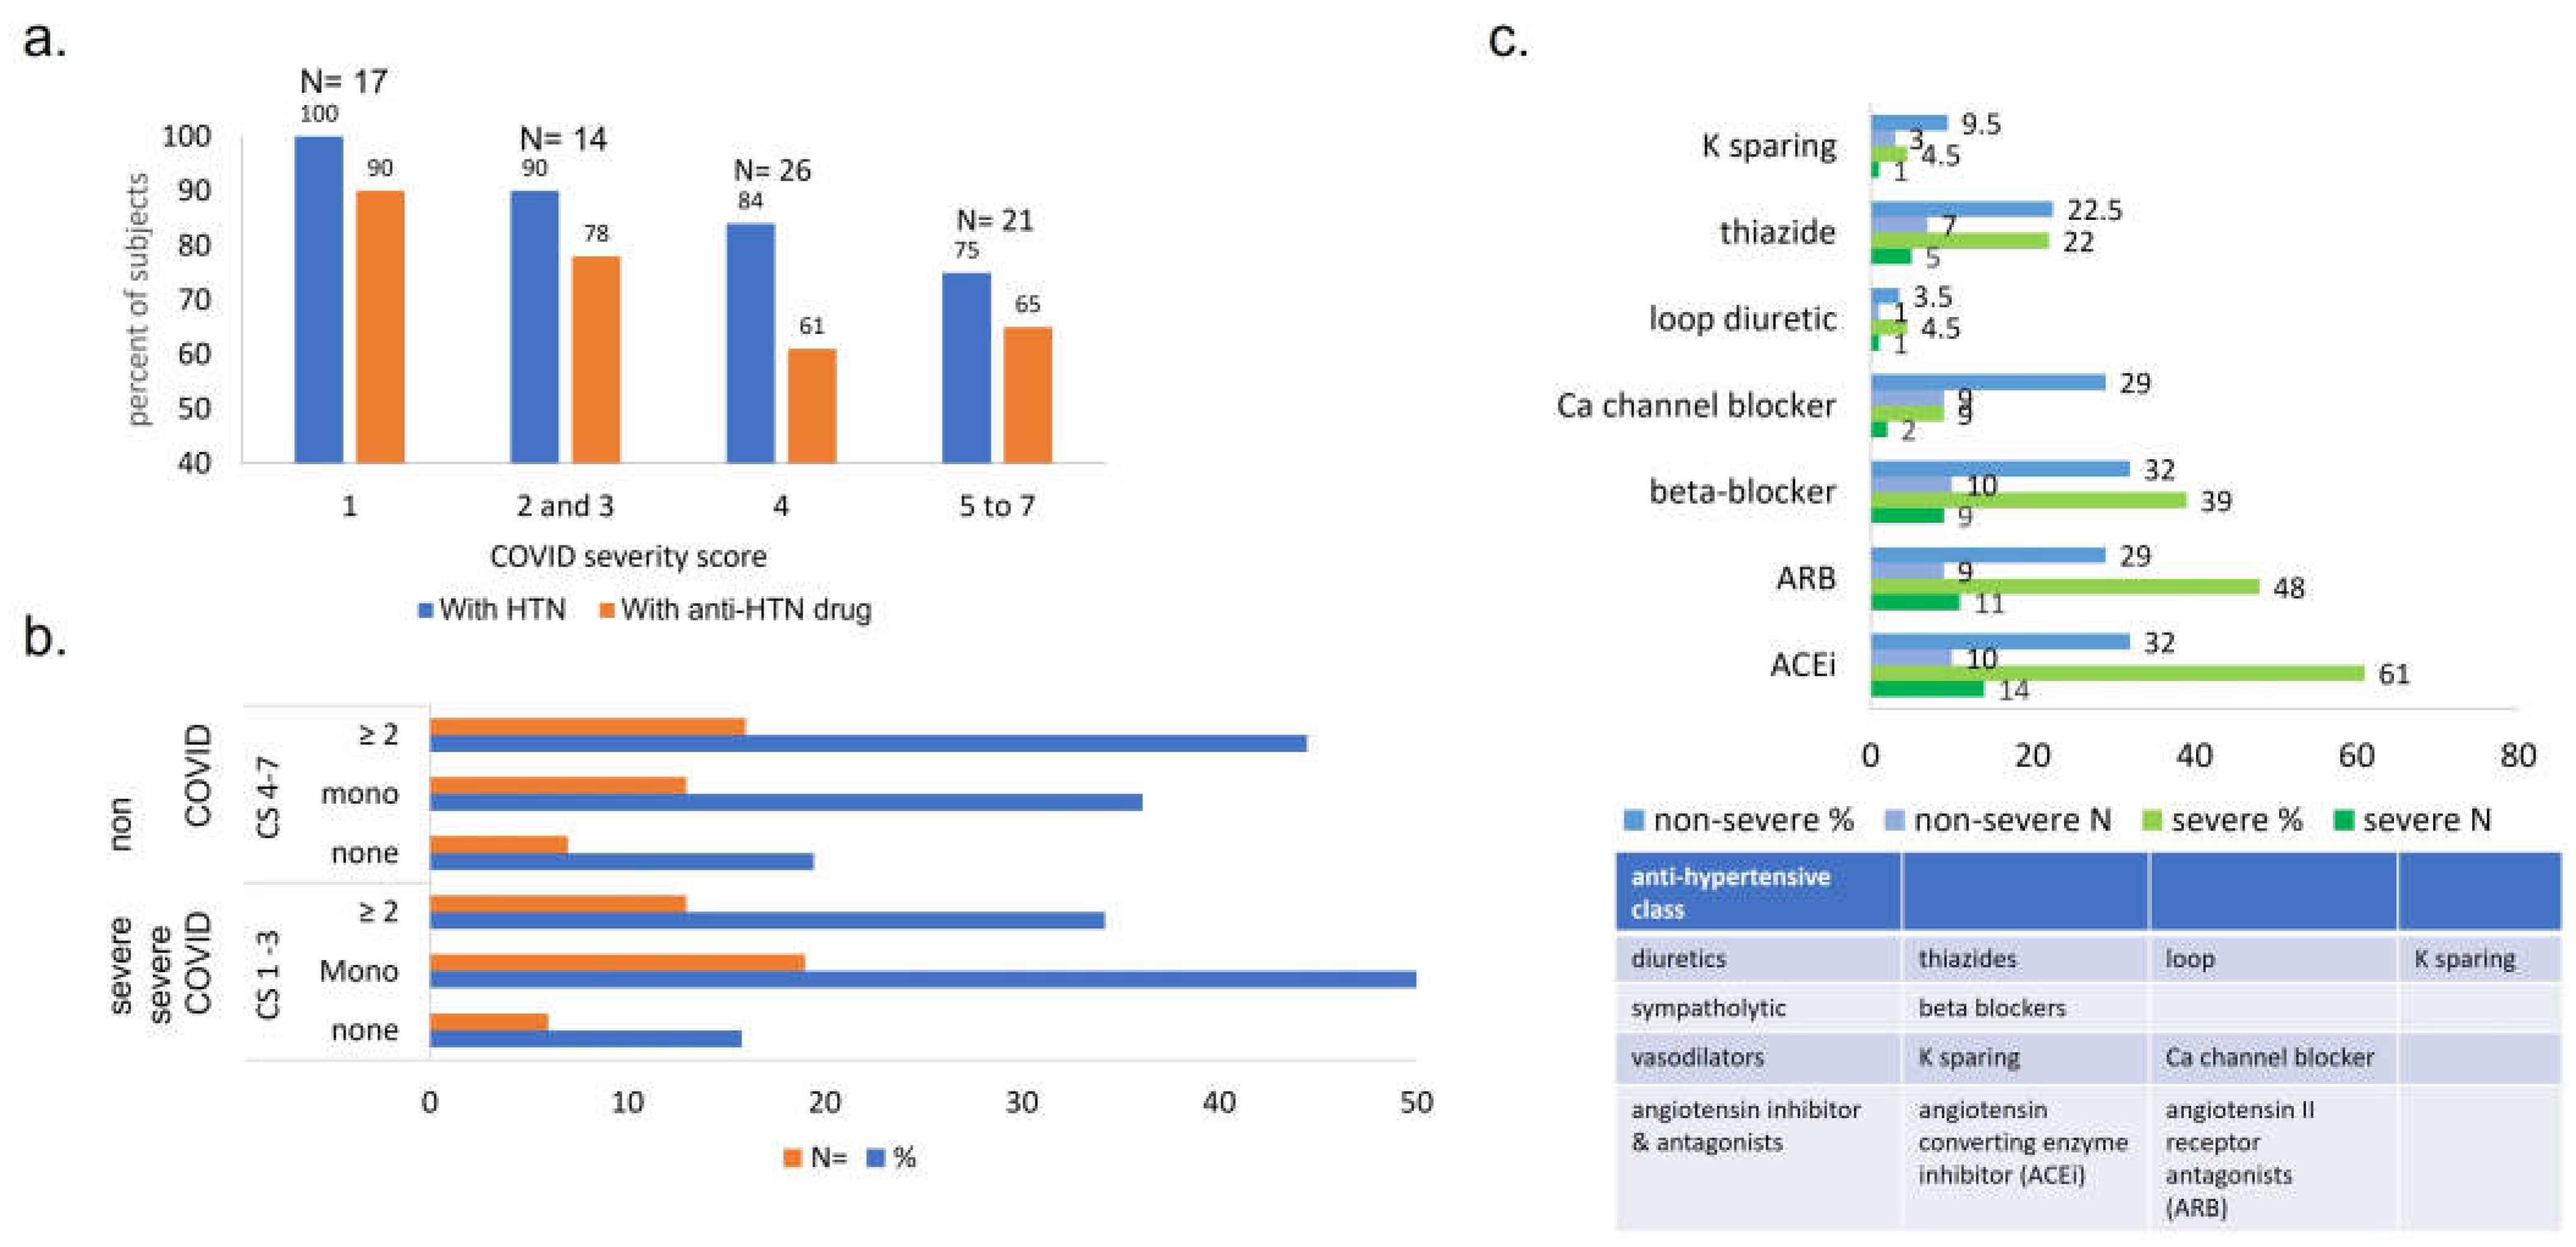
Figure 4.
Symptom clusters of acute COVID presentation, grouped by ultimate COVID outcome. (a) x= symptom cluster, y= percent of subjects complaining of that symptom cluster on initial presentation. (b) Clusters of acute COVID symptoms. Shortness of breath (SOB), altered mental status (AMS). Some subjects appear in multiple clusters, therefore percentages sum to greater than 100.
Figure 5.
Admit systolic (a) and diastolic (b) blood pressure medians versus ultimate COVID severity. SBP median: 144 mmHg in severe vs 118 mmHg non severe COVID. Y axis = median systolic SBP (a) or DBP (b), x axis = COVID severity group. SBP= systolic blood pressure, DBP = diastolic blood pressure. P values calculated using Mann Whitney U test. (c) Distribution of admit systolic blood pressure (SBP) values in each COVID severity group (severe versus non-severe). Number of subjects with high, medium, and low admit SBP, grouped by ultimate COVID severity (severe: death or required mechanical ventilation or high flow oxygen; non severe: admitted and required low flow or no oxygen), x= ultimate COVID severity, y=number of subjects.
Figure 6.
Percentage of subjects with obesity, pre-COVID HTN, SBP>140mmHg on admission, and combinations of each. Y axis = percent of subjects, x axis = pre-COVID condition (obese, HTN) or admit vital (SBP > 140), grouped by ultimate COVID outcome (severe, non-severe). HTN= hypertension. SBP=systolic blood pressure. (b,c) Admit SBP vs BMI among subjects with non-severe (b) and severe (c) acute COVID. No correlation is observed between body mass index (BMI) and systolic blood pressure (SBP) on admission in either COVID outcome group, suggesting that the clinical indicators are independent. (d,e) Receiver operator curve analysis shows that admit SBP of 135mmHg and BMI=30kg/m2 are both predictors of outcome with significant sensitivity and accuracy. d. SBP ROC curve analysis. (e) BMI ROC Curve analysis.
Figure 7.
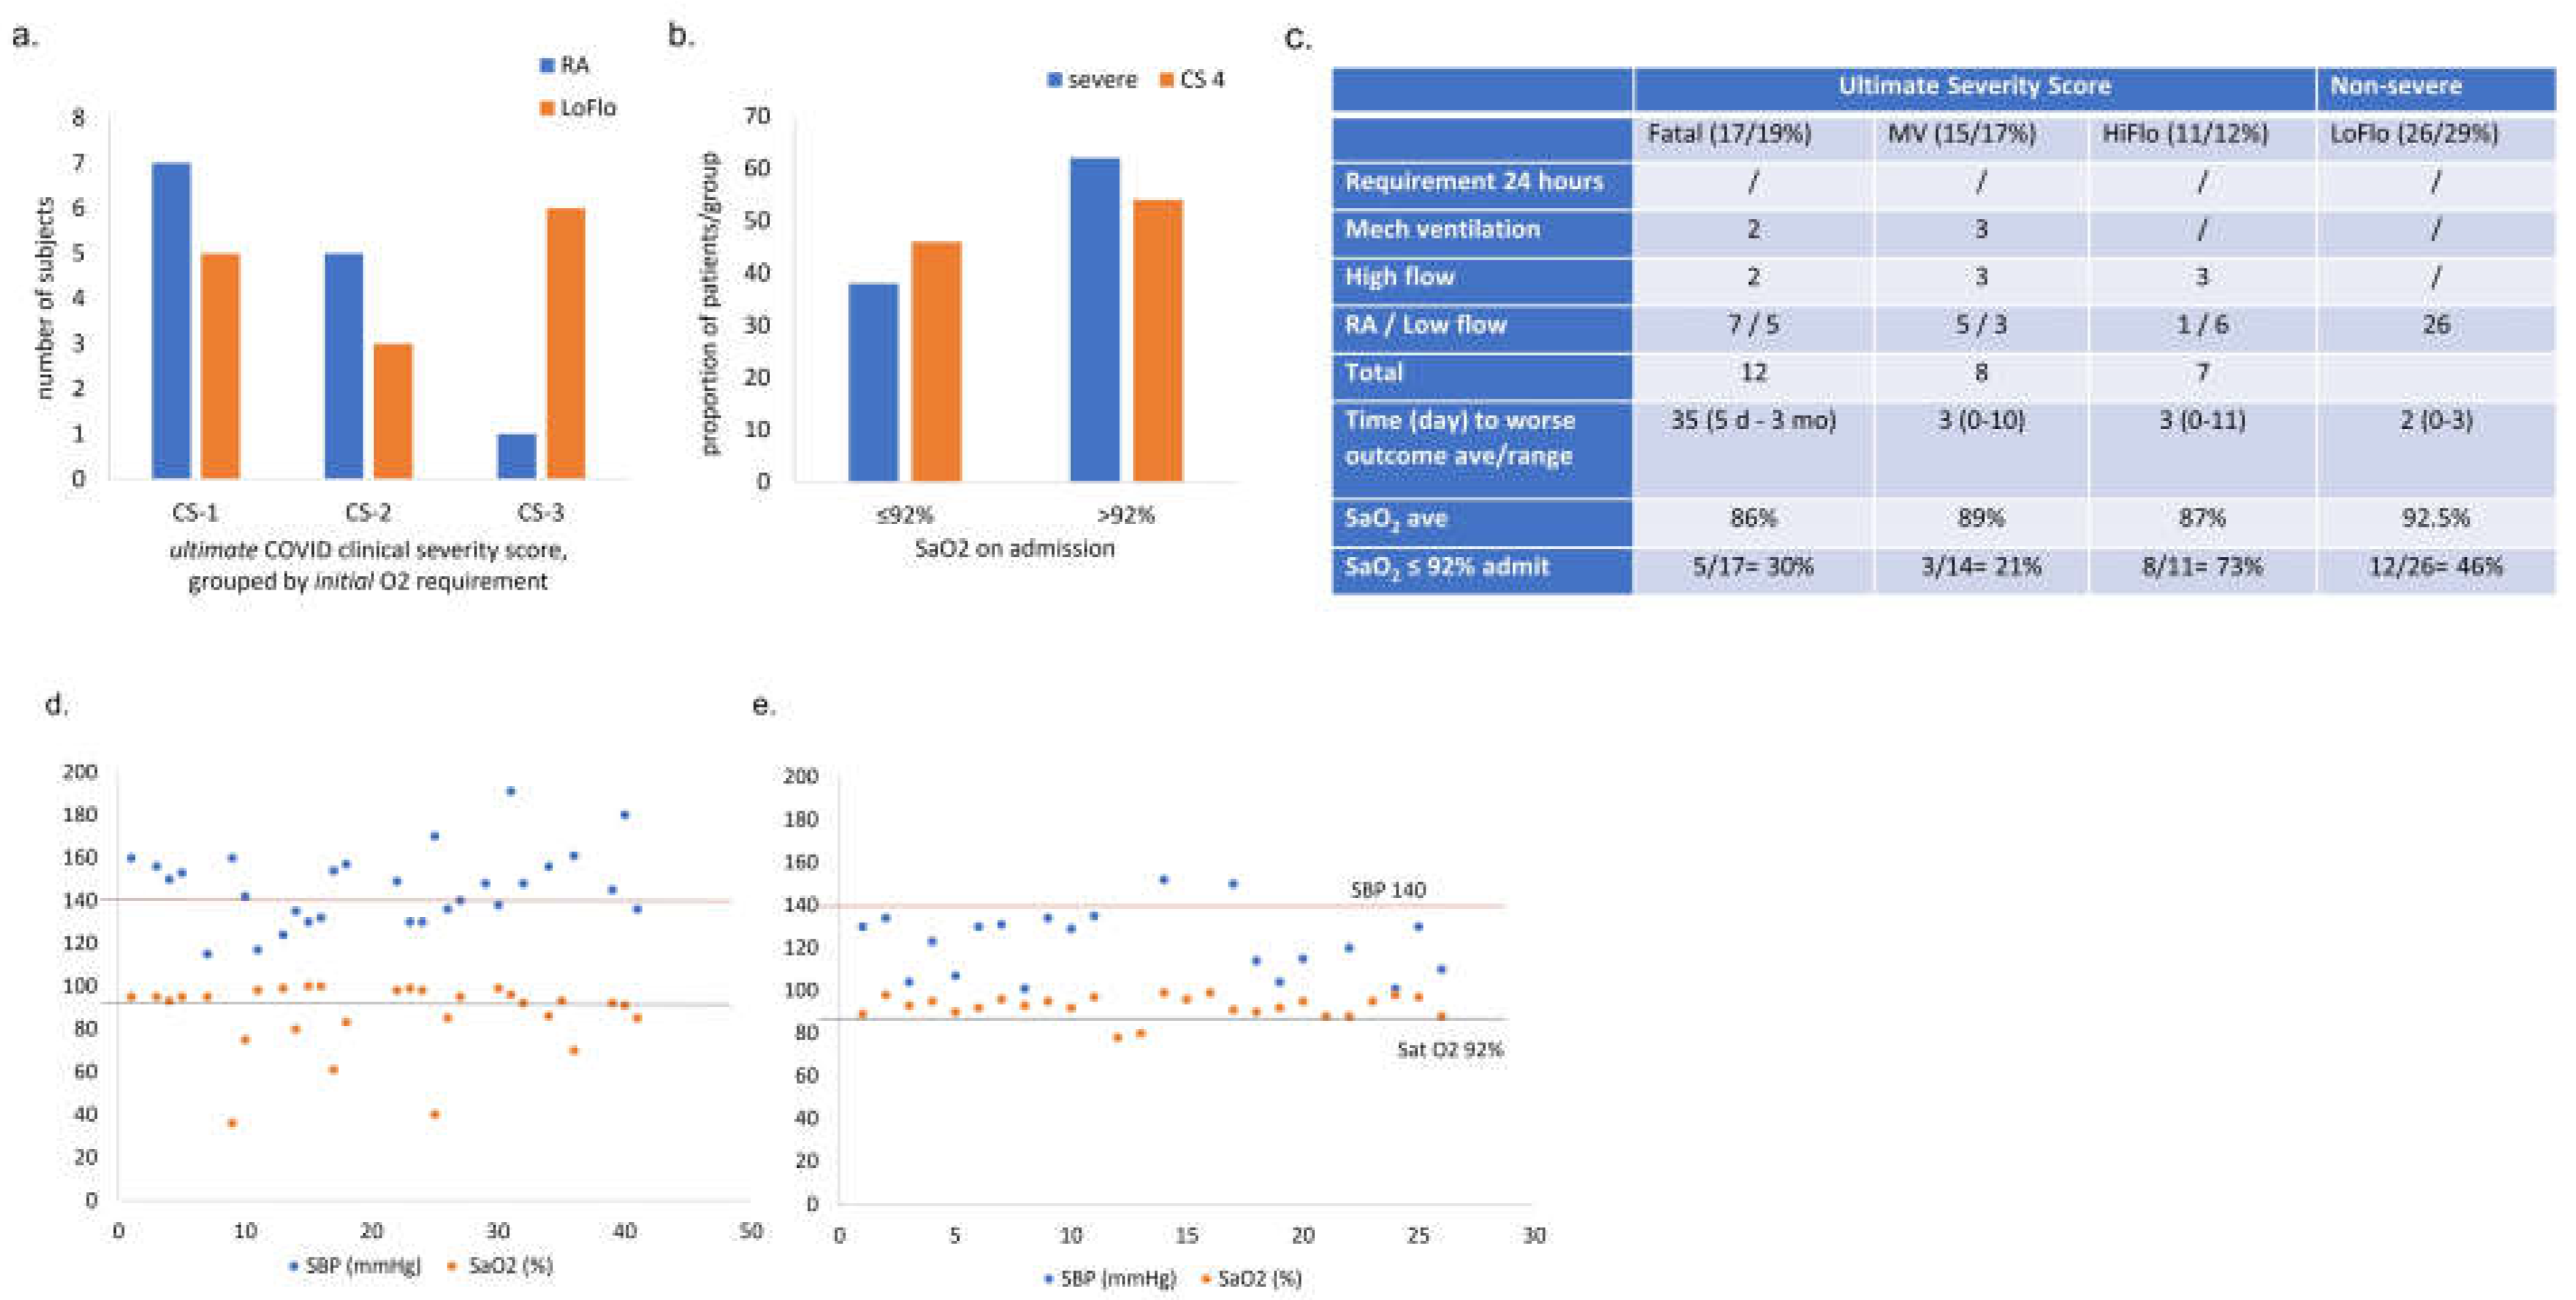
(a) Early oxygen requirement does not predict final COVID outcome. Oxygen requirement over the first 24 – 48 h of admission in subjects with ultimately severe outcomes. y: number of subjects, x: ultimate COVID clinical severity score grouped by initial oxygen requirement (RA, LoFlo). CS1: fatal, CS2: required mechanical ventilation, CS3: required HiFlo oxygen. (b) On-admit oxygen saturation compared to ultimate COVID outcome. Acute COVID outcome according to oxygen saturation on admission (reportable* SaO2 of 34 patients /42 in severe (CS 1-3) and 26/26 non-severe (CS 4). Subjects were classified in groups according to their oxygen saturation (SaO2 ≤92% and >92%) on admission.
Table 1.
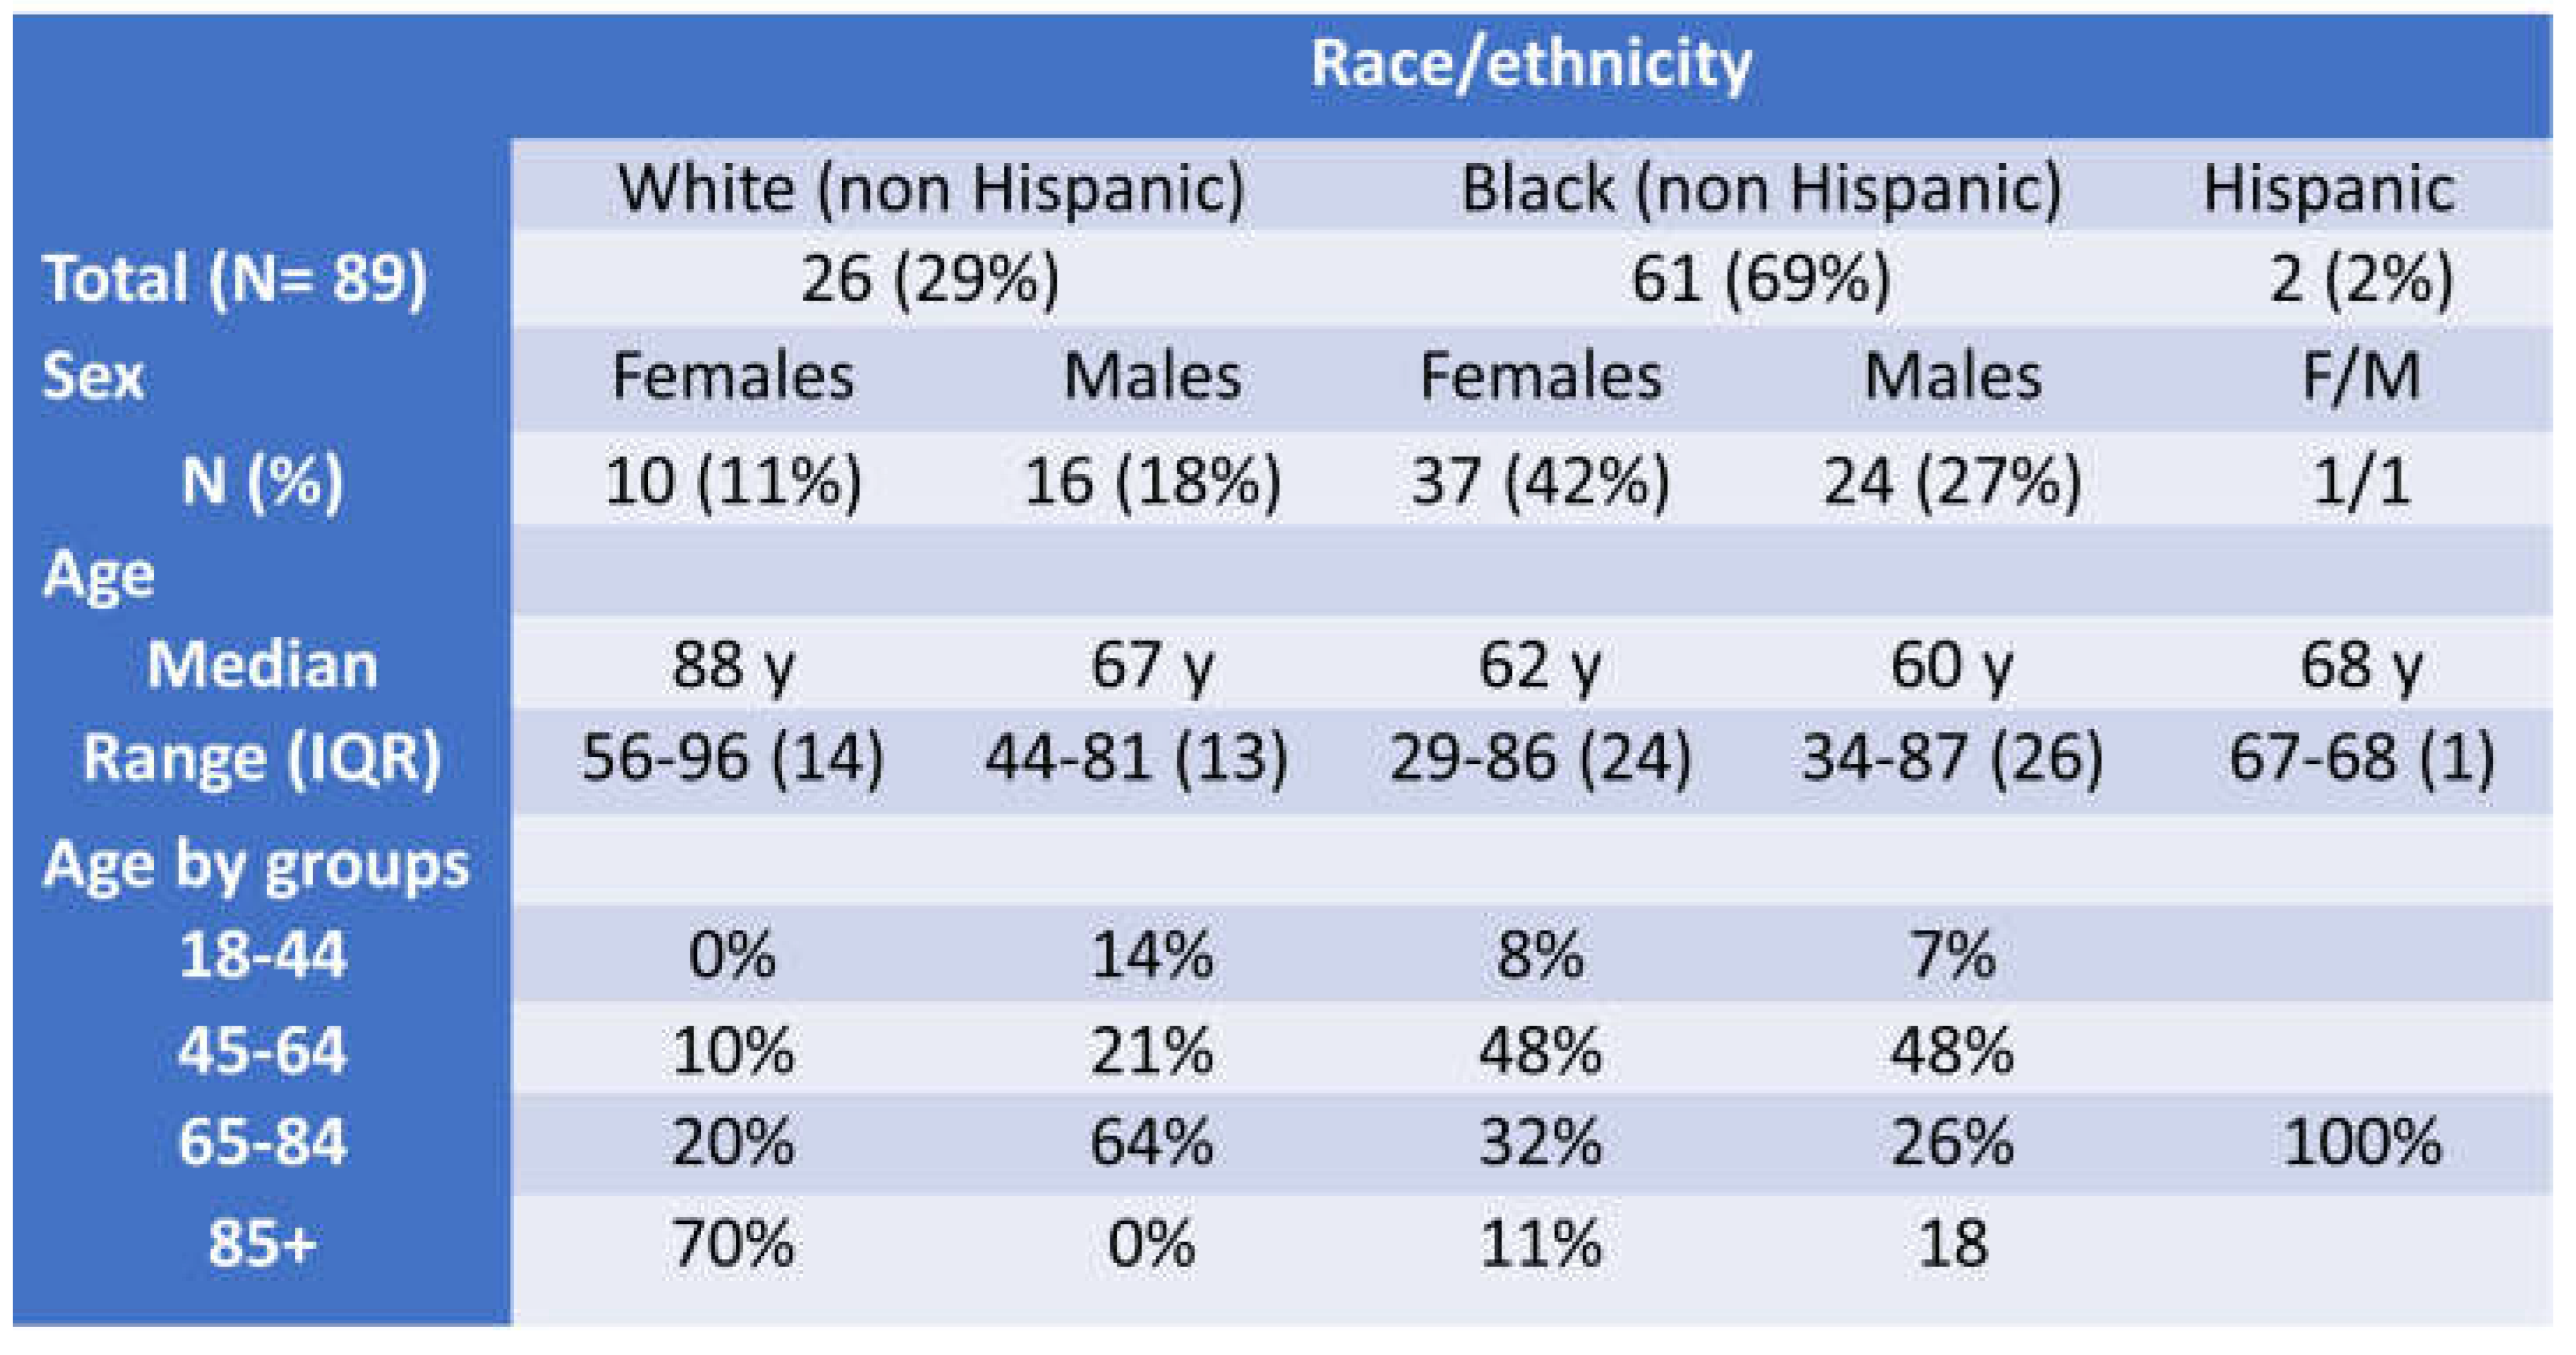
General Demographics of ClinSeqSer cohort, including race, ethnicity, sex, age.
Table 1.
General Demographics of ClinSeqSer cohort, including race, ethnicity, sex, age.
Table 2.
ClinSeqSer subject characteristics grouped by ultimate COVID severity, including demographics (sex, race, age), past medical history (HTN - hypertension, CHF – congestive heart failure, CAD – coronary artery disease, AF- atrial fibrillation, asthma, COPD – chronic obstructive pulmonary disease, T2-DM – type 2 diabetes mellitus, advanced T2-DM, CKD – chronic kidney disease) , BMI – body mass index, admit blood pressure, pre-COVID anti-hypertensives prescribed, presented in groups based on ultimate COVID outcome (severe, or clinical score (CS) 1-3, or non severe, or CS 4-7). CS 1=death, 2=required mechanical ventilation, 3=HiFlo supplemental O2, 4= LoFlo supplemental O2, 5=admitted but did not require O2, 6=admitted for non medical reasons, 7=not admitted. SD- F / M= female / male, ave=average, SD=standard deviation, n/N = number with condition out of total in group, kg=kilogram, m=meter, med=median, IQR=interquartile range, Tx= treated, ACEi = angiotensin converting enzyme inhibitor.
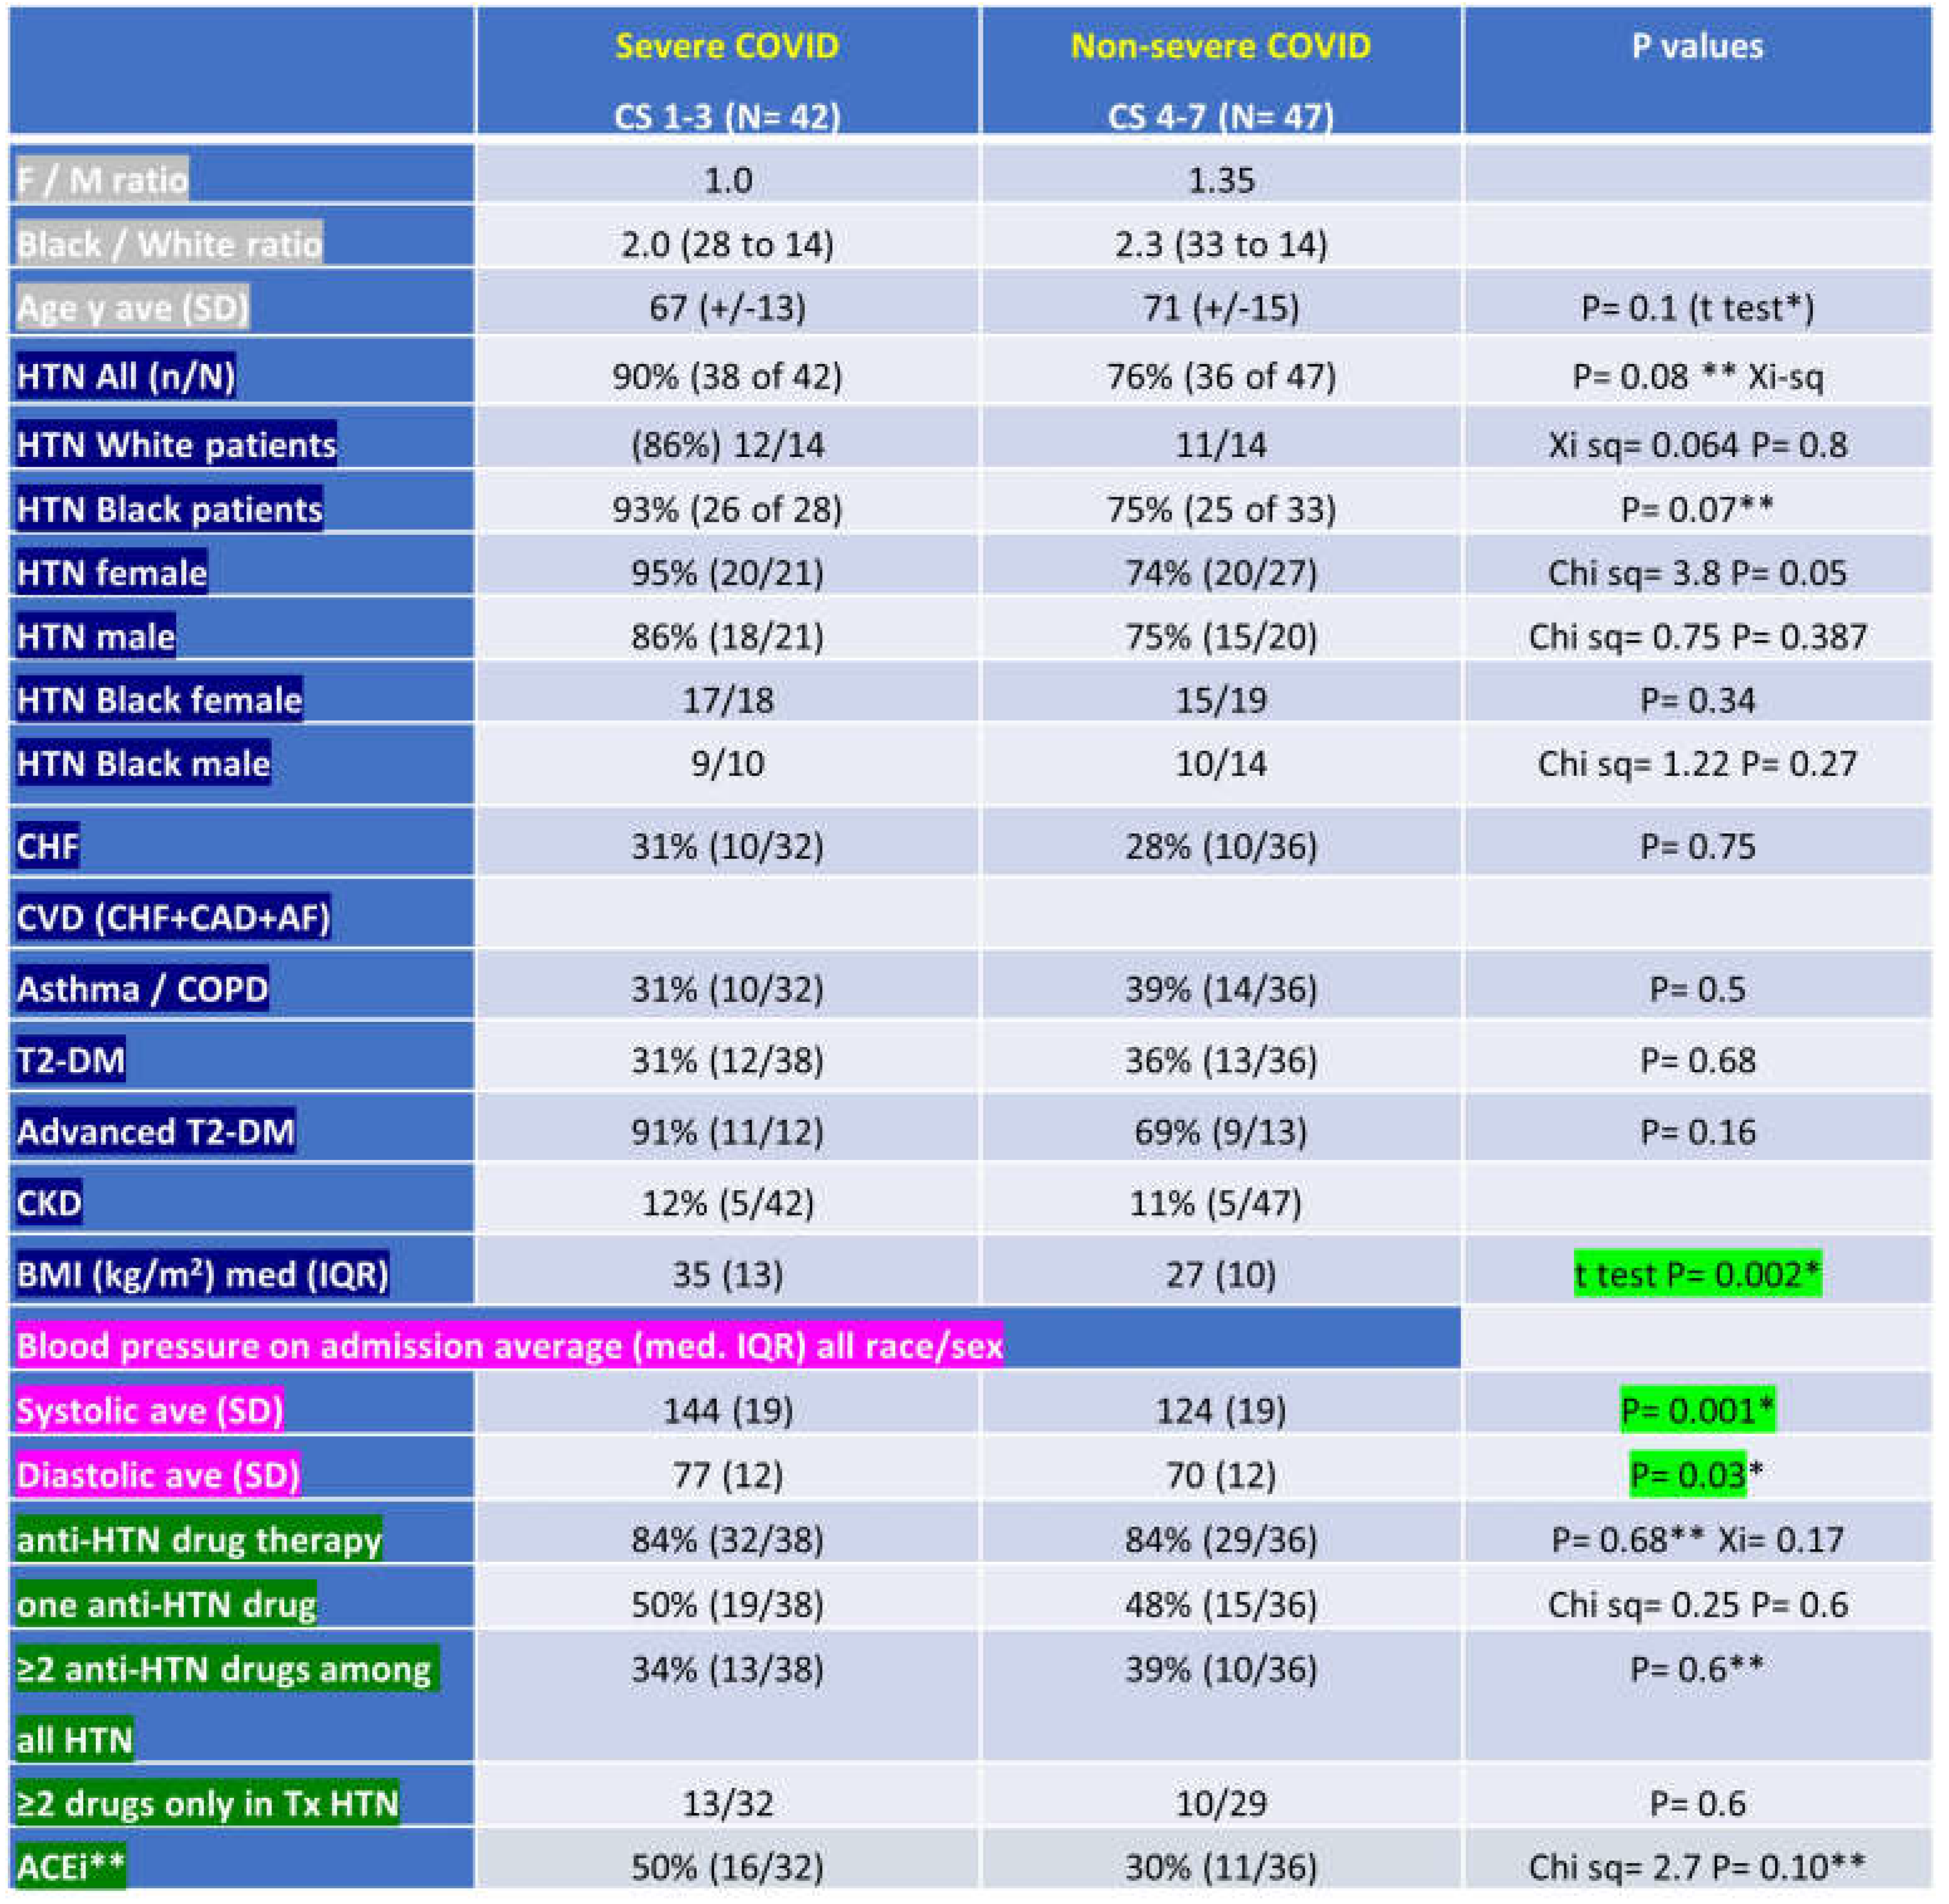 |
Table 3.
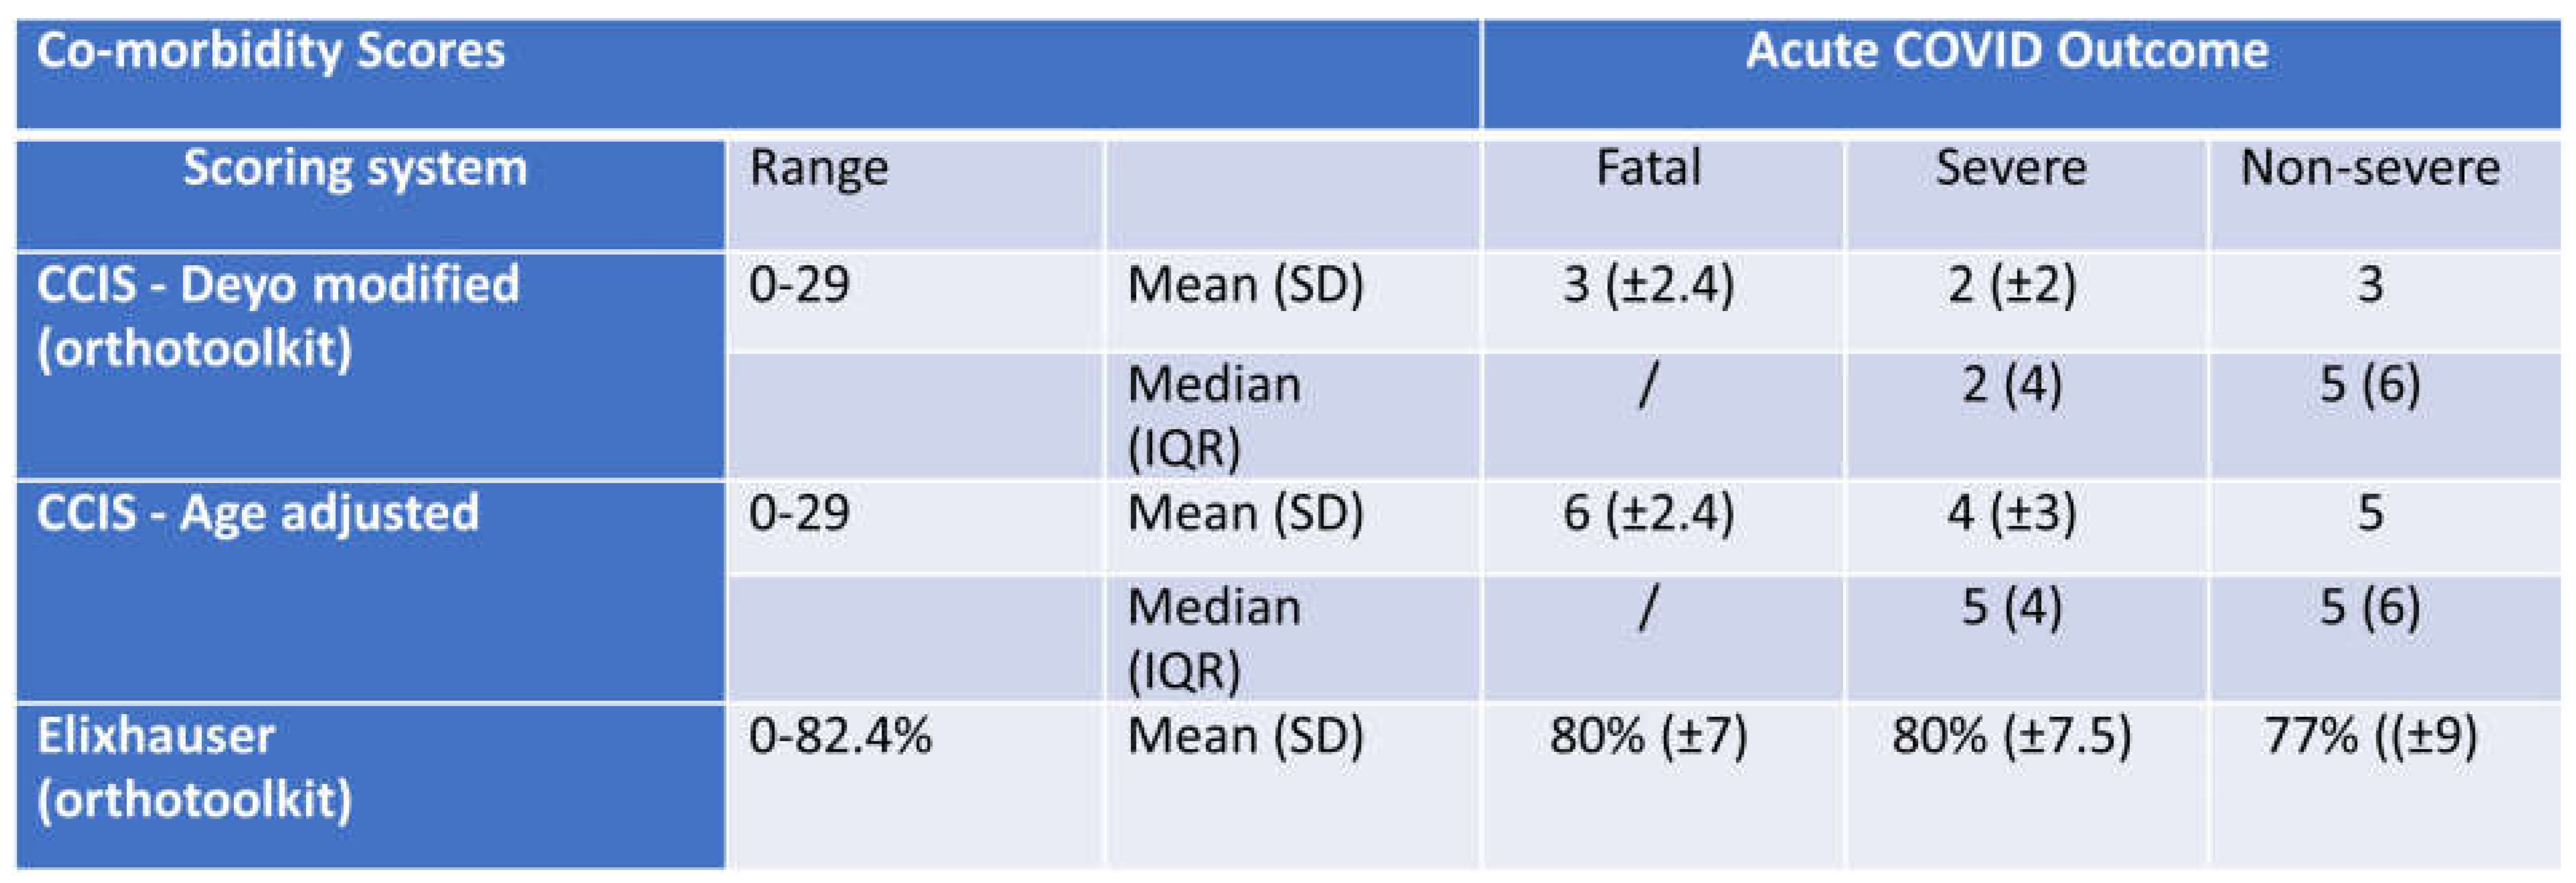
COVID Outcome Predicted by Comorbidity Scores (Charlson’s and Elixhauser) versus Actual Outcome.
Table 3.
COVID Outcome Predicted by Comorbidity Scores (Charlson’s and Elixhauser) versus Actual Outcome.
