Submitted:
18 March 2023
Posted:
20 March 2023
You are already at the latest version
Abstract
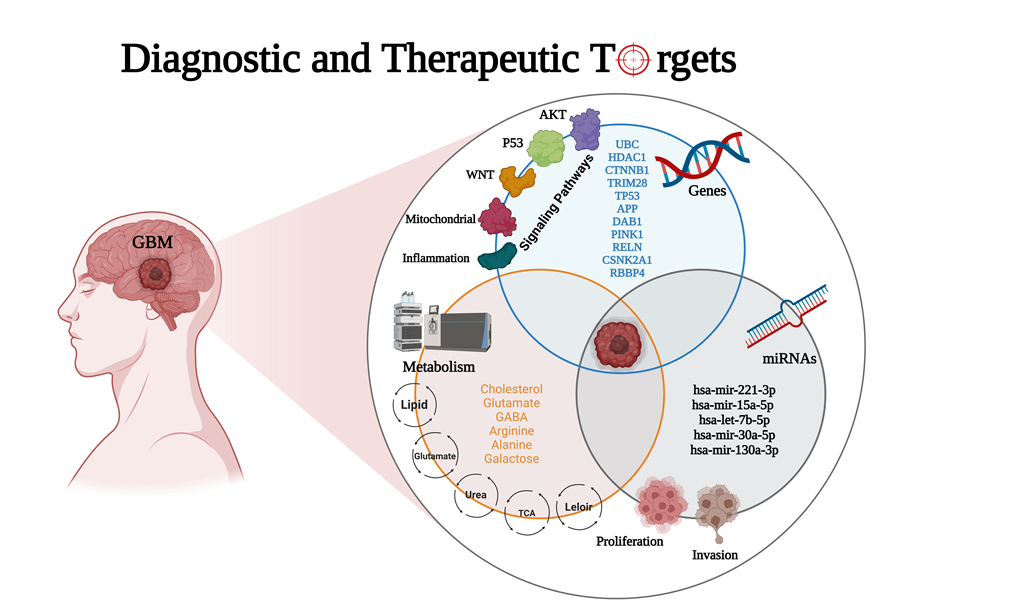
Keywords:
1. Introduction
2. Materials and Methods
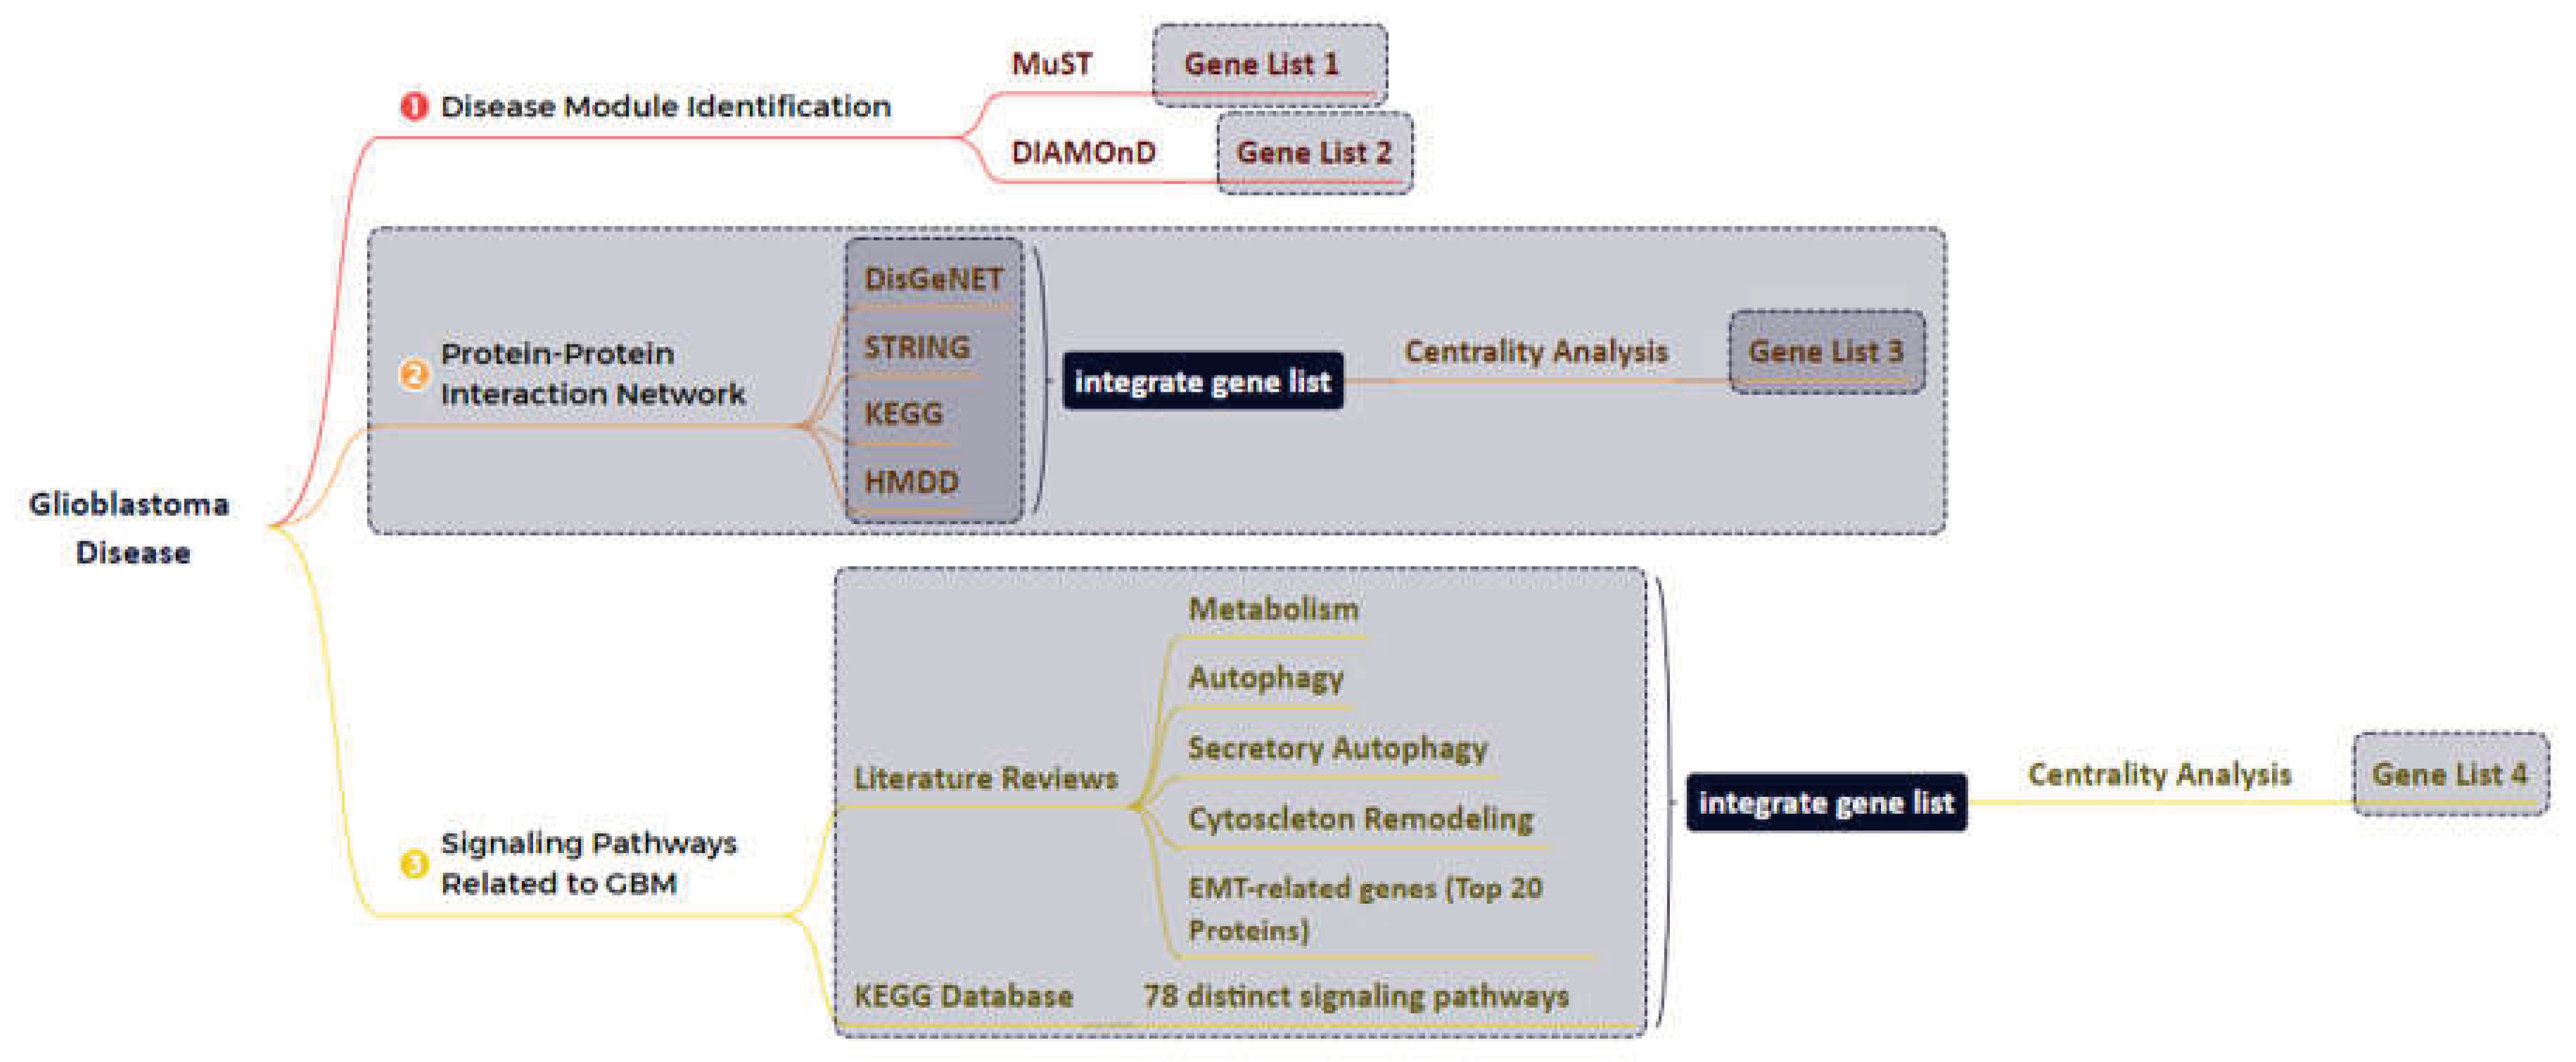
2.1. Disease Module Identification
2.2. GBM-Related Protein-Protein Interaction Network
2.3. Network Reconstruction of GBM-Related Signaling Pathways
2.4. Combining the Findings from the Aforementioned Four Stages of Research and Integrated Database
2.5. Study of Eleven Critical Proteins in Normal Brain and Brain Tumor Expression Datasets
2.6. Identification of Significant Metabolites and Snps That Interact with Eleven Essential Genes
2.7. Enrichment Analysis
3. Results
3.1. The Network Obtained from the NeDRex Plugin to Identify Disease Modules
3.3. Analyzing the Status of Identified Gene Expression in Healthy and Malignant Brain Tissue
3.4. Enrichment Analysis
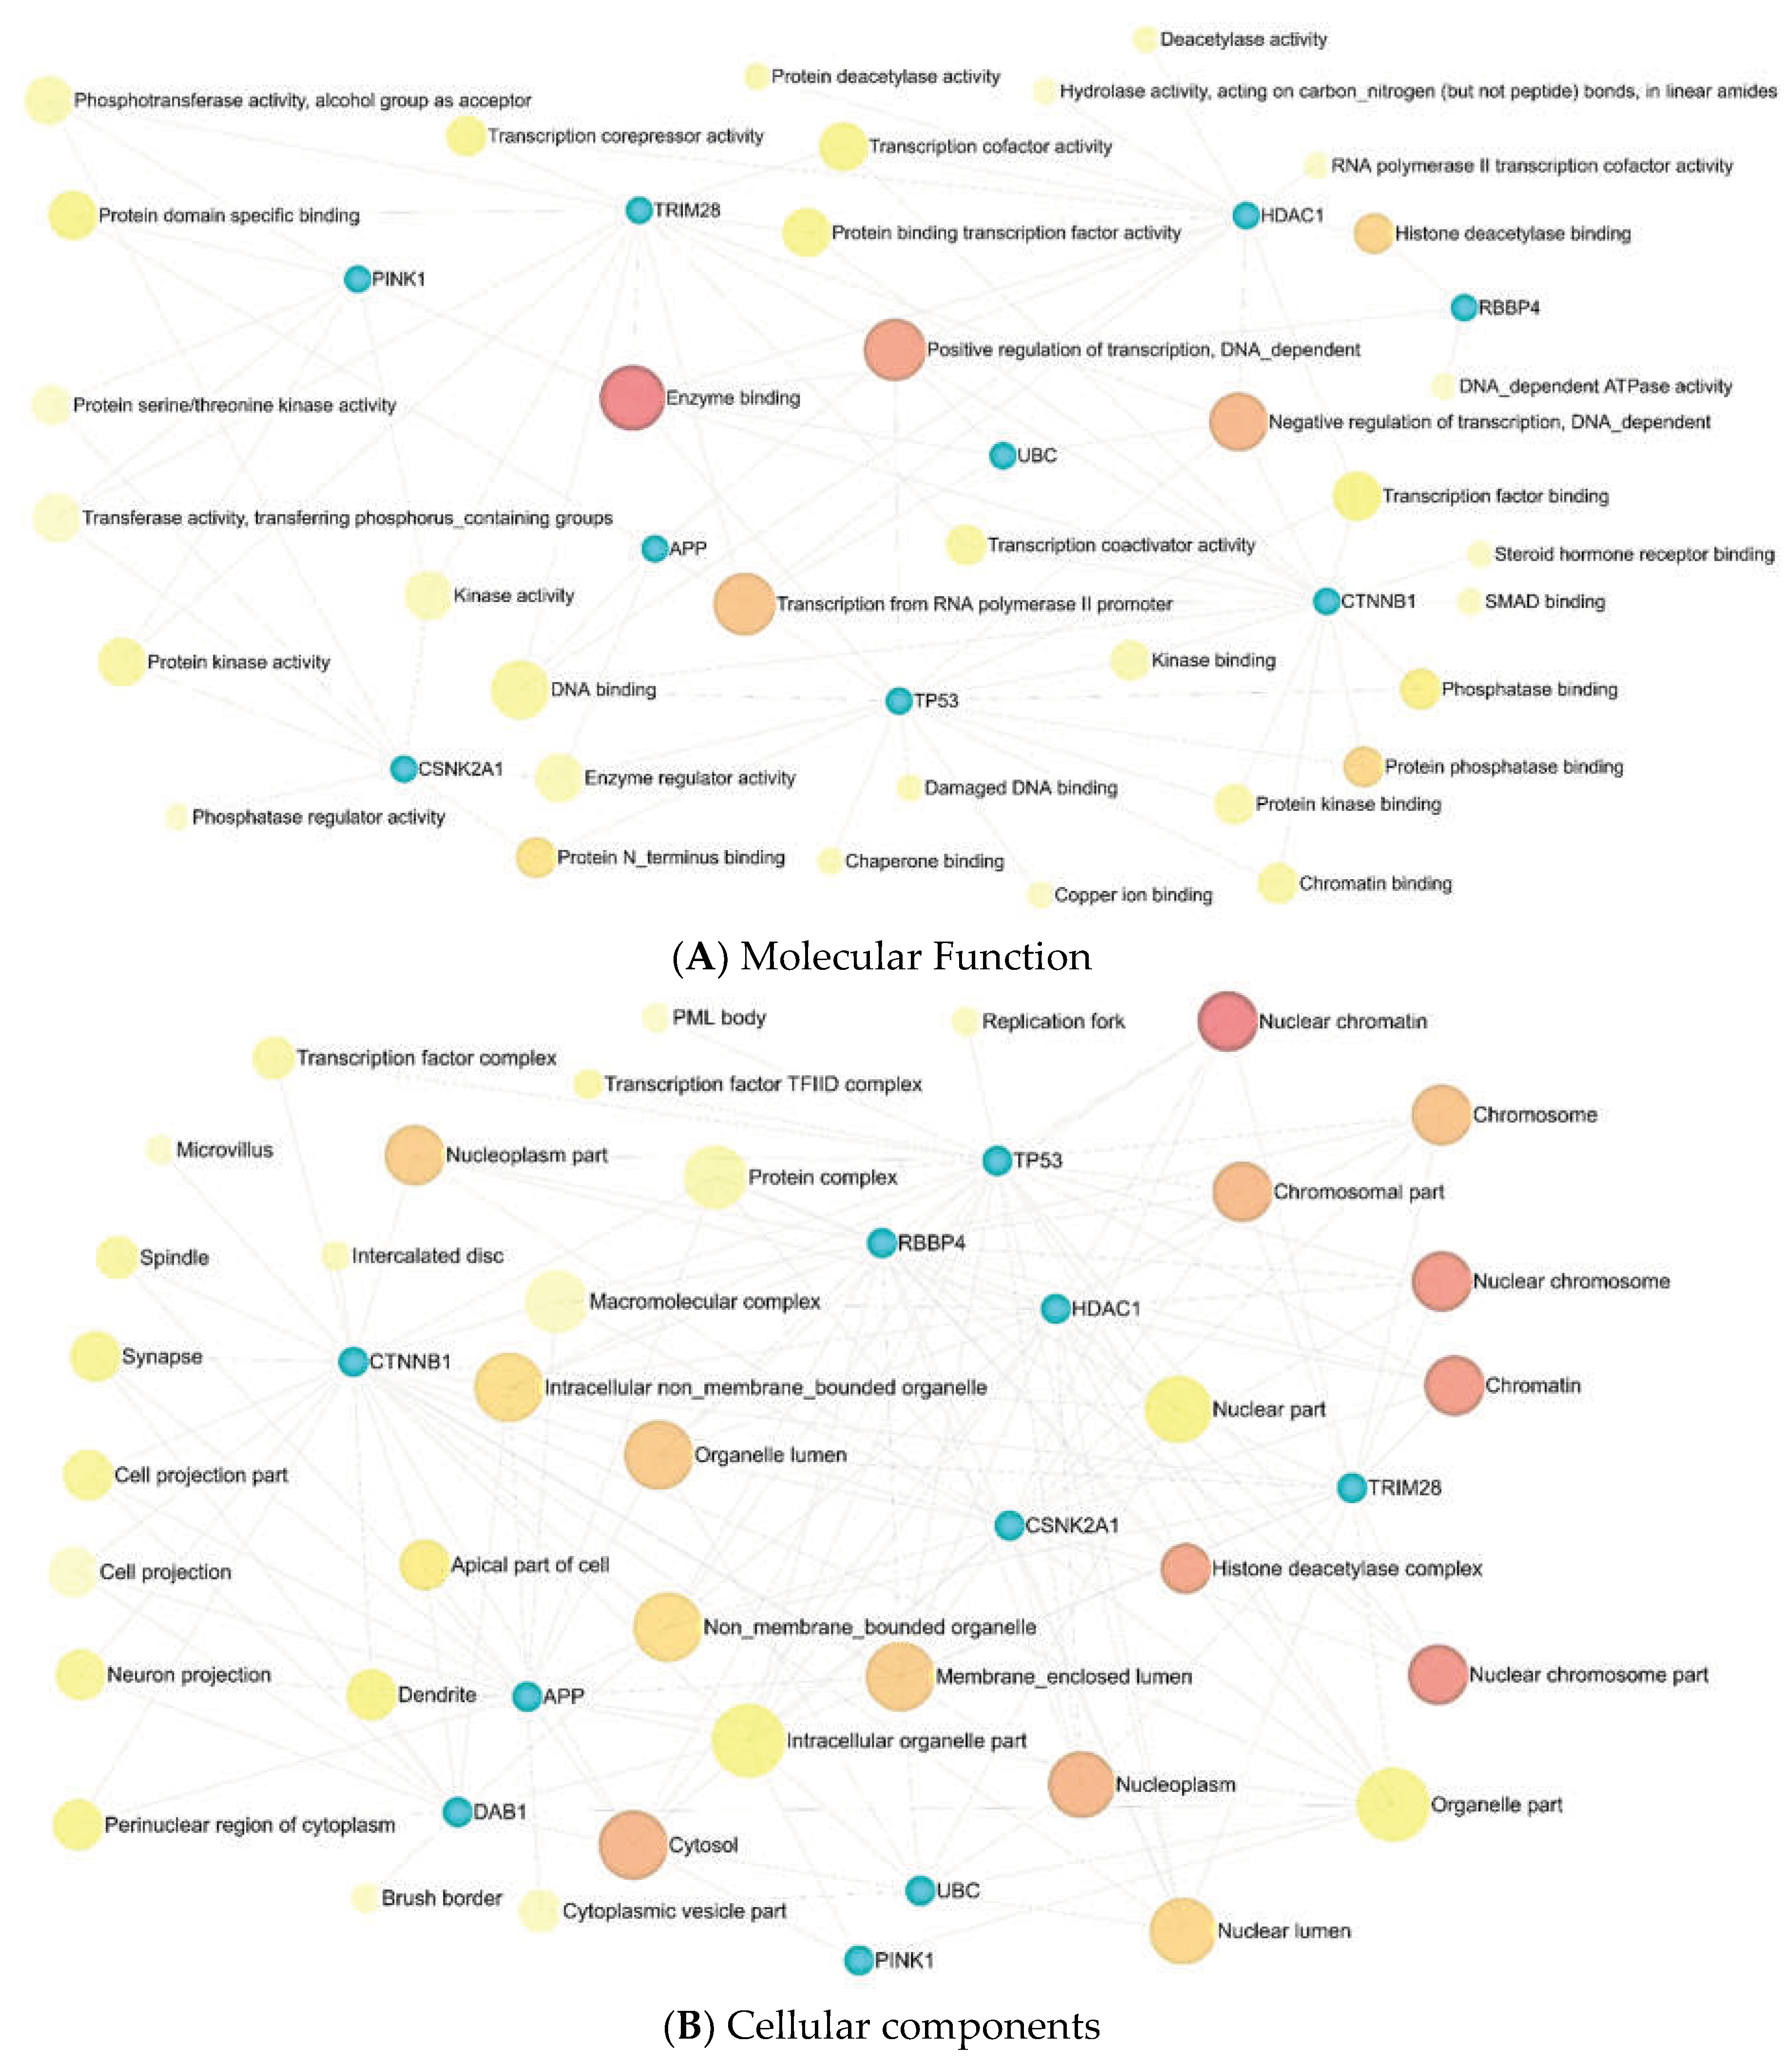
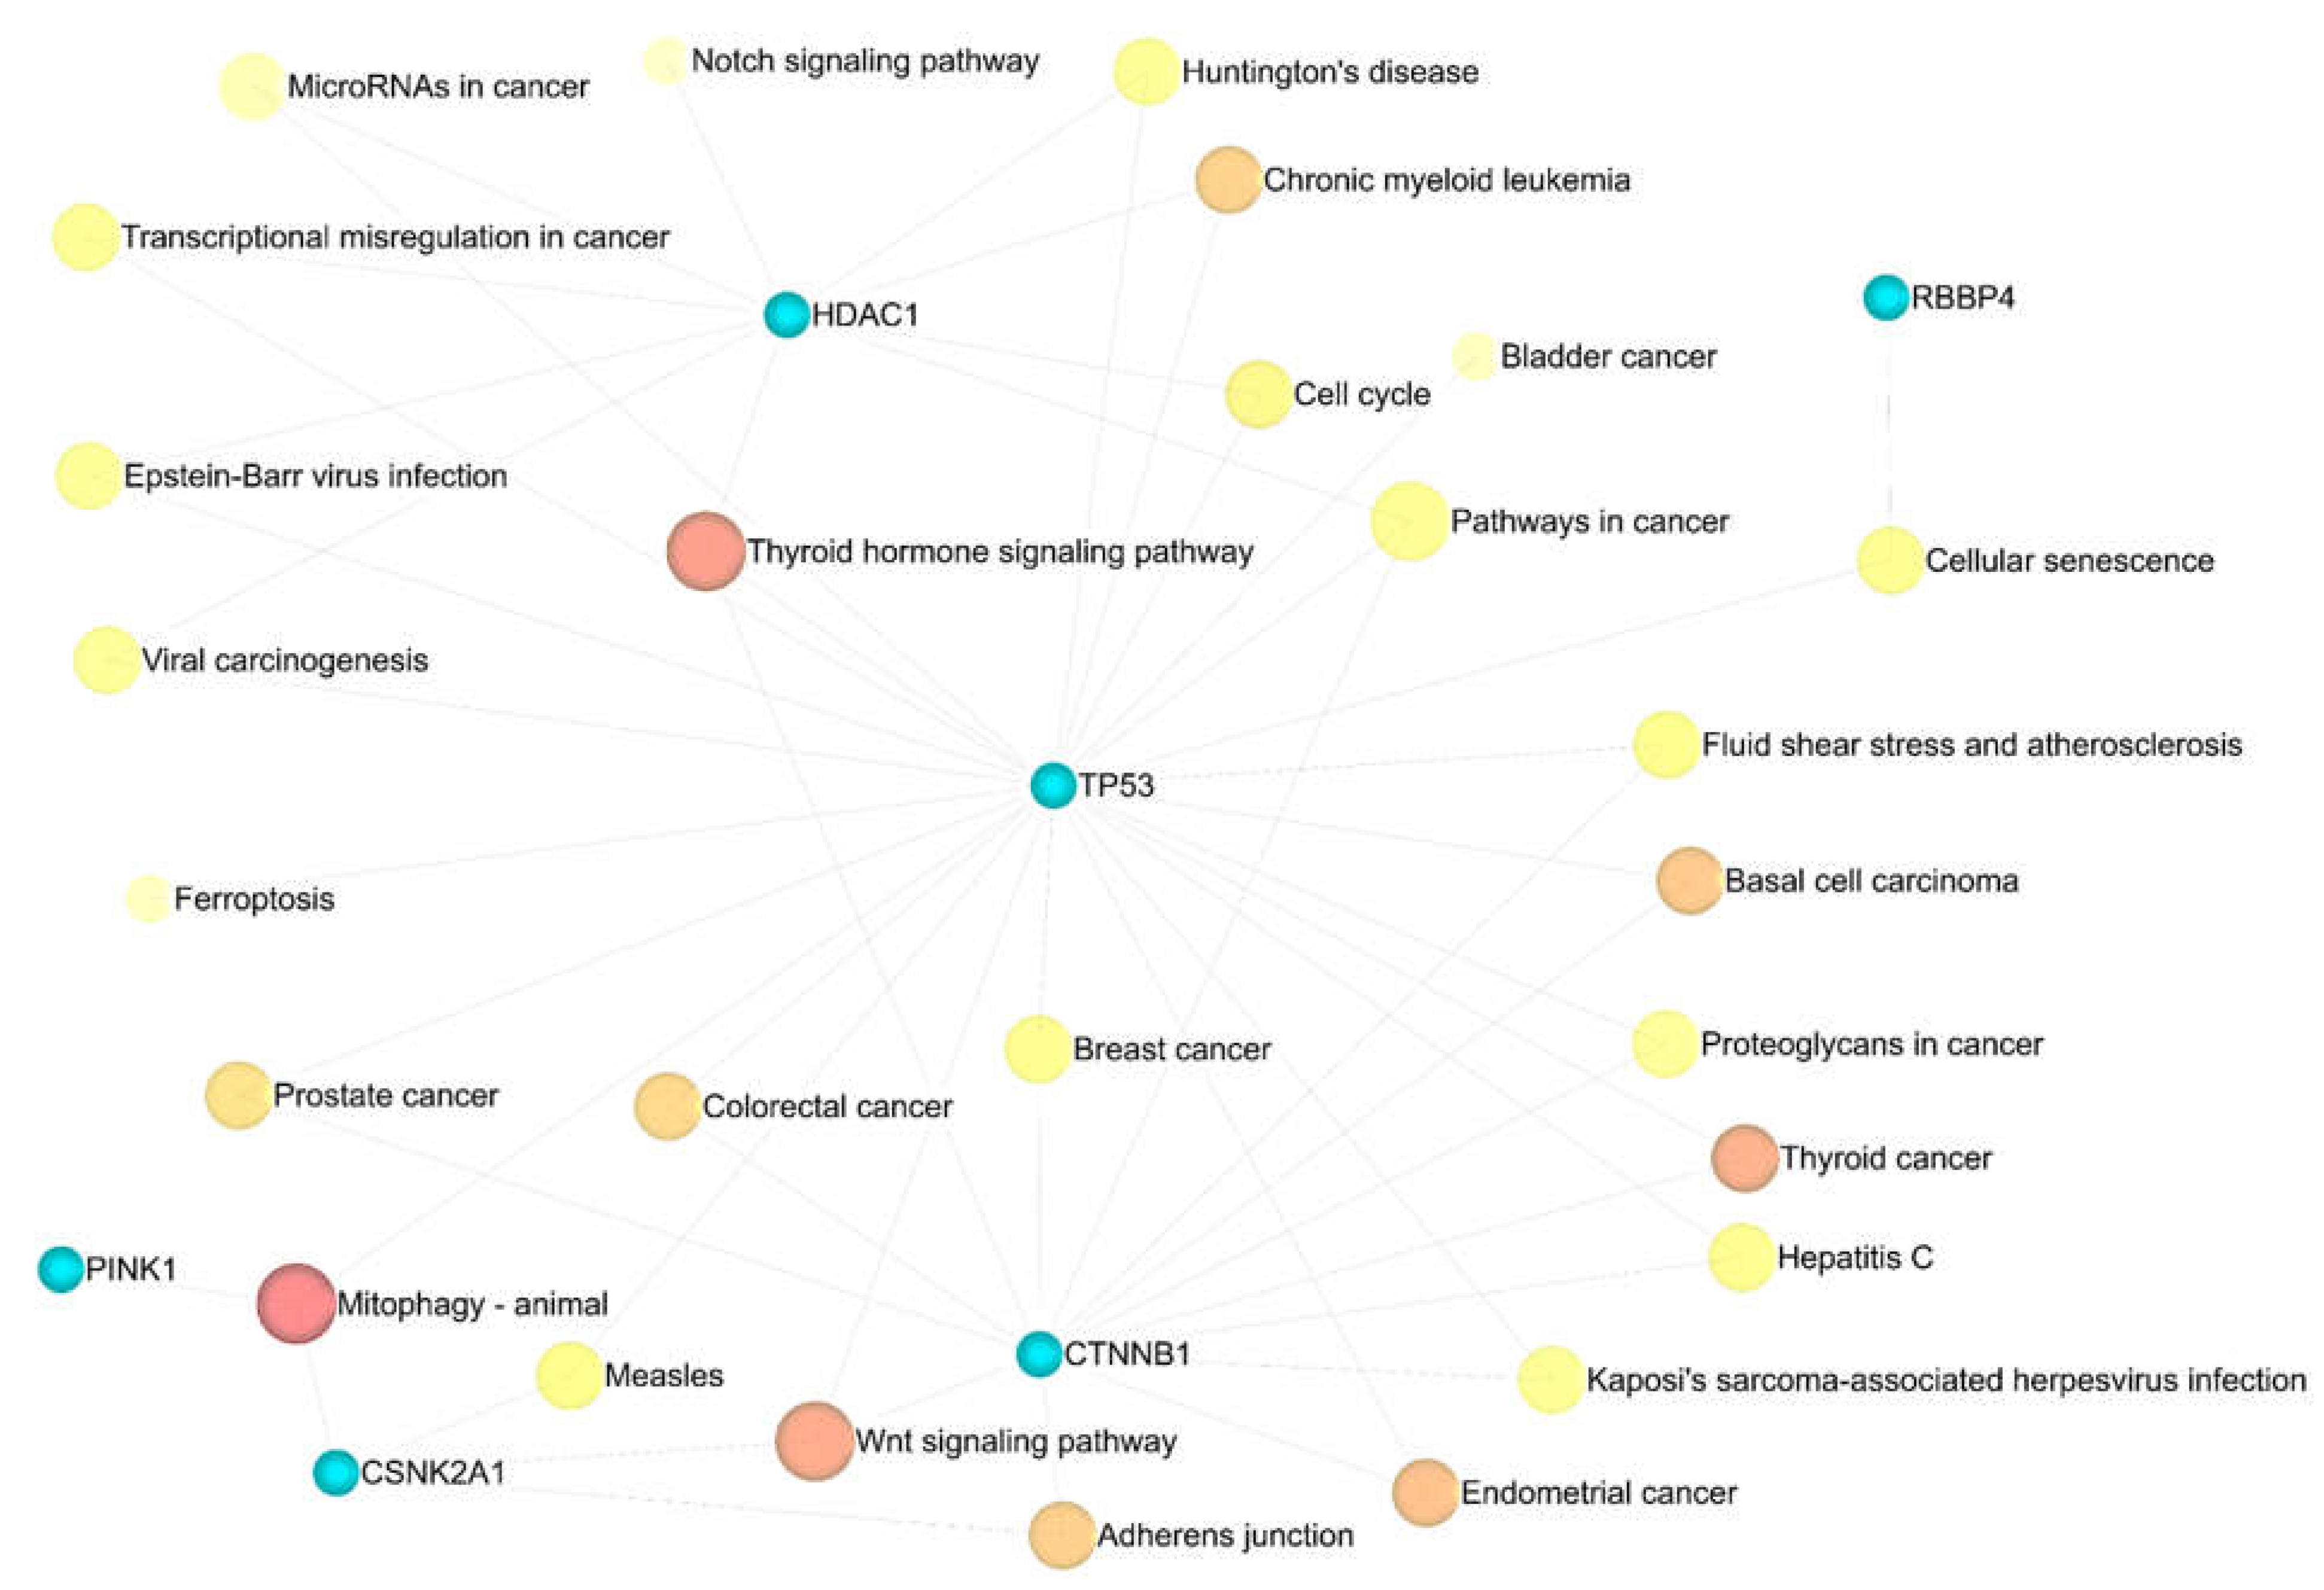
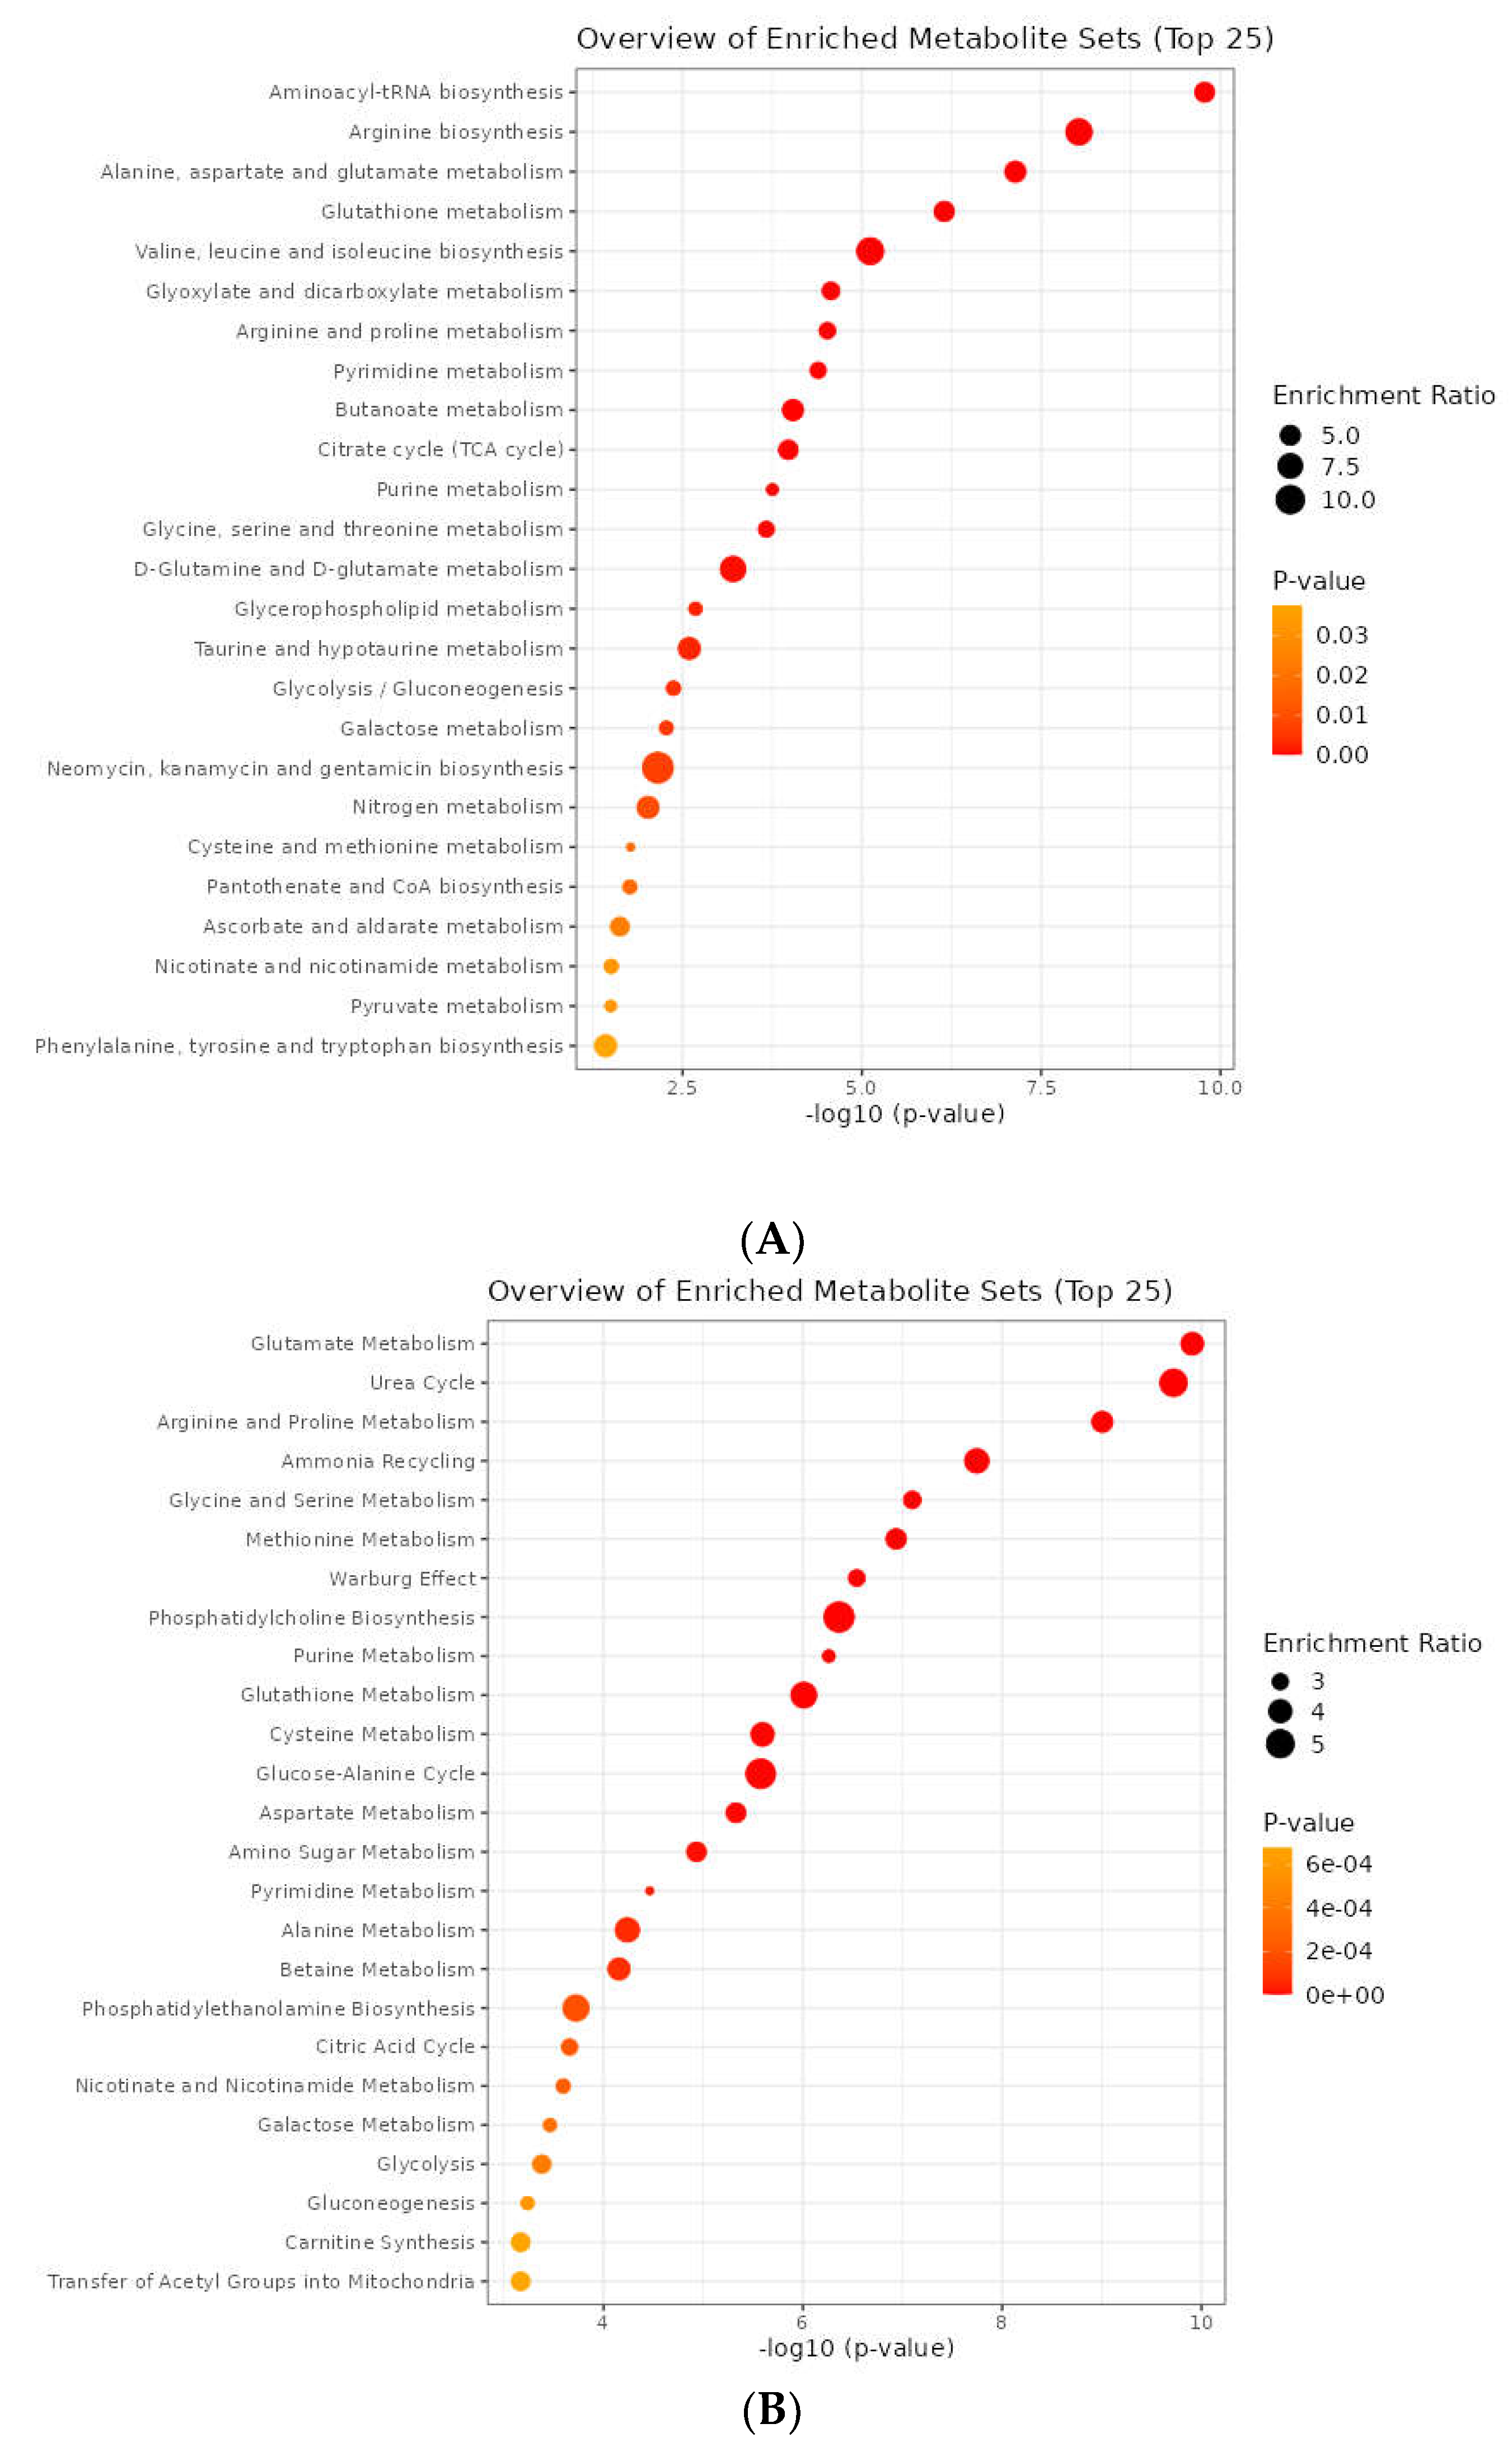
3.5. Metabolic Pathway Analysis
3.6. Joint Pathway Analysis
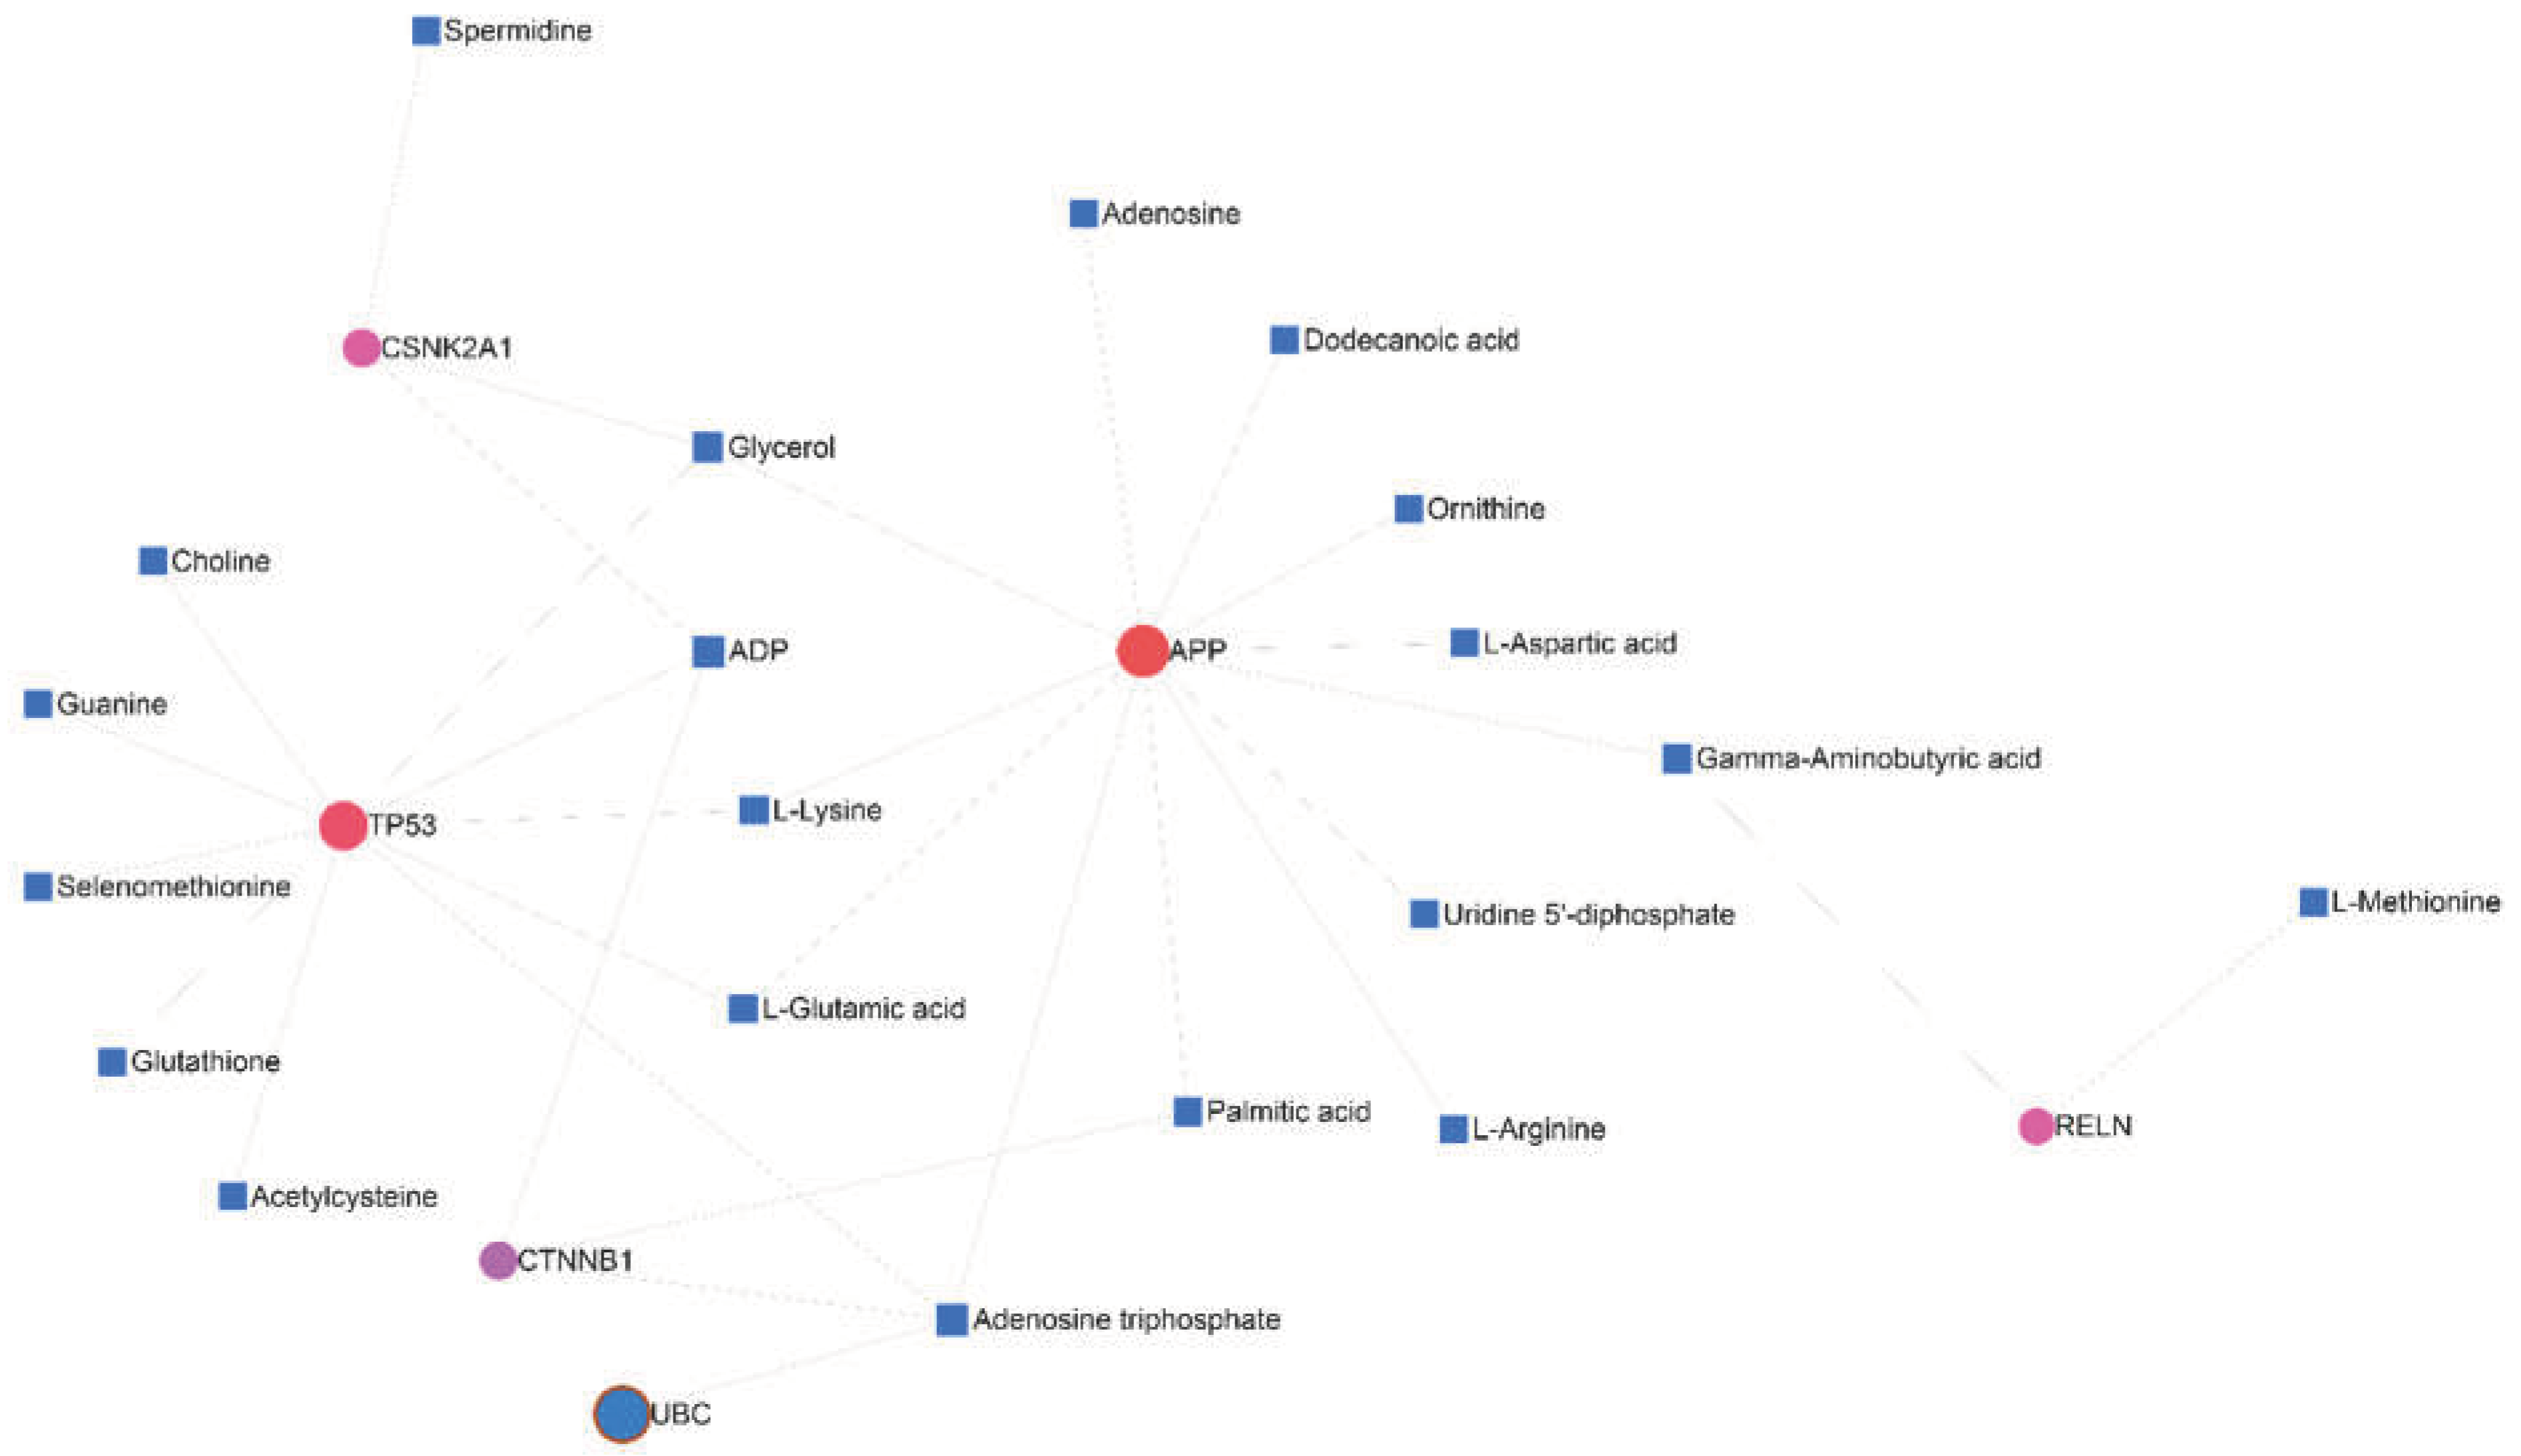
3.7. Gene-Metabolite Interaction Network
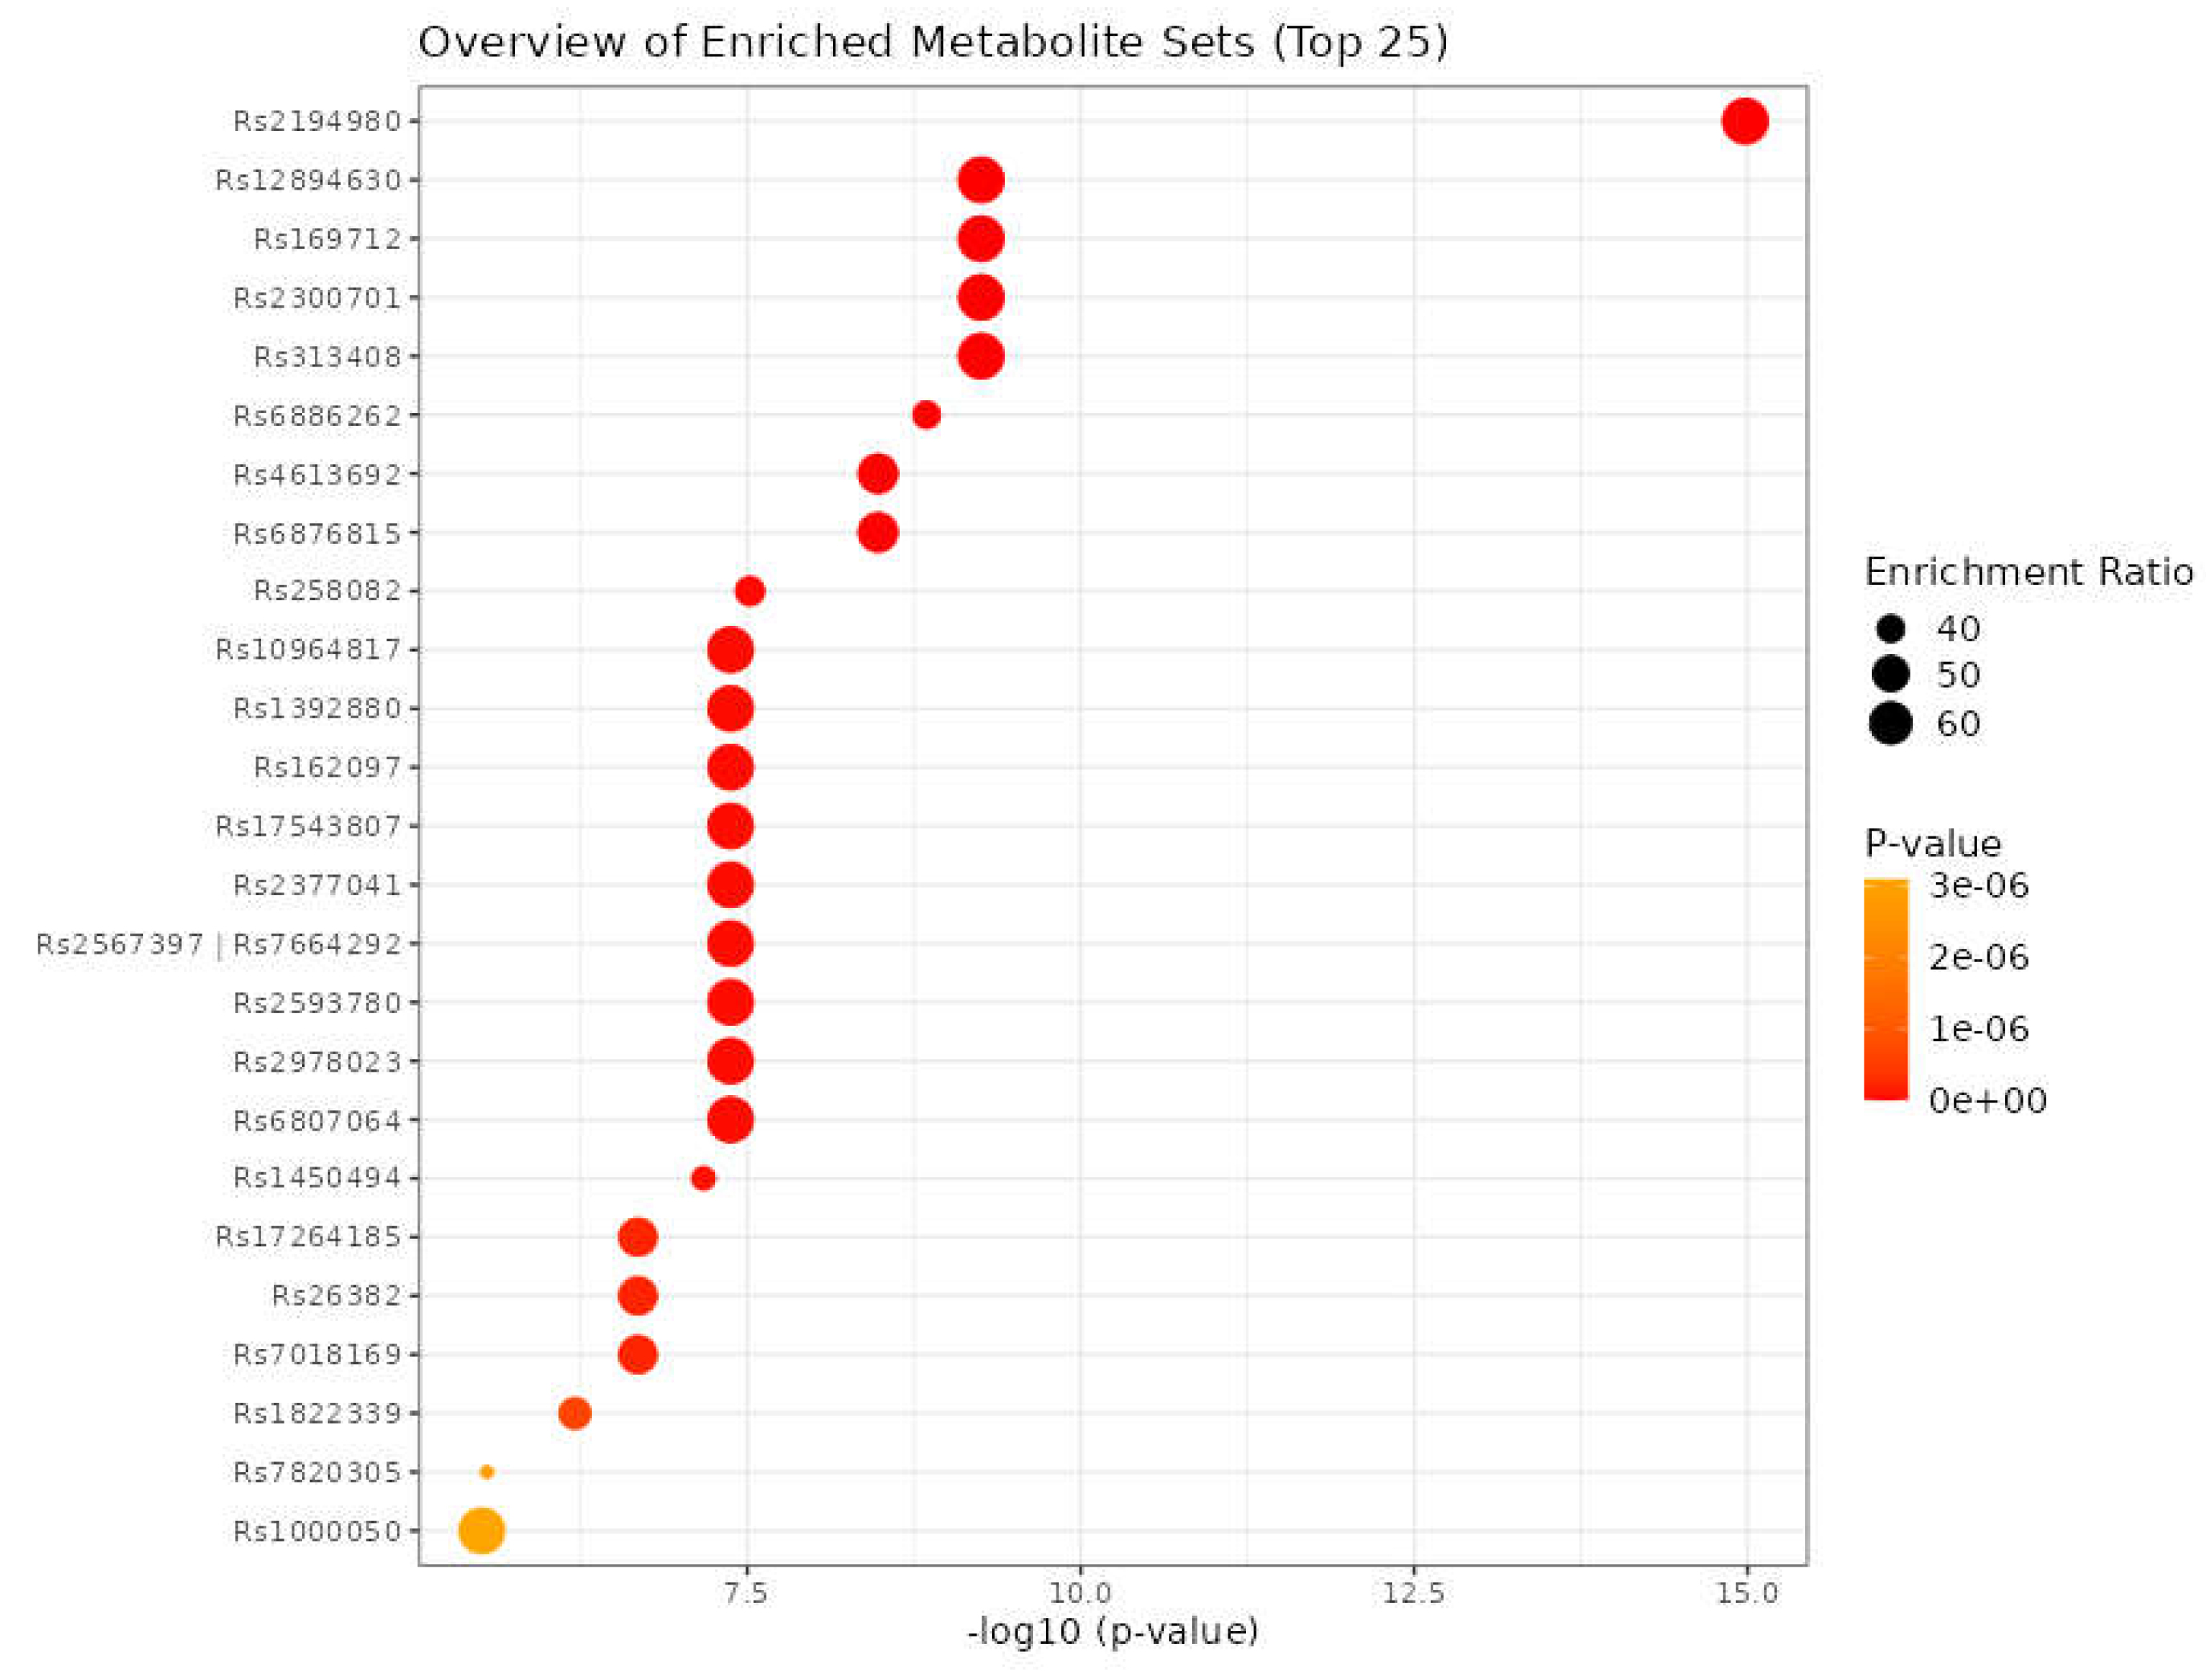
3.8. Identification of SNPs-Related Metabolites and Genes
4. Discussion
5. Conclusions and Future Direction
Supplementary Materials
Author Contributions
Funding
Conflicts of Interest
References
- Fekrirad Z.;Barzegar Behrooz A.;Ghaemi S.;Khosrojerdi A.;Zarepour A.;Zarrabi A.;Arefian E., Ghavami S. Immunology Meets Bioengineering: Improving the Effectiveness of Glioblastoma Immunotherapy. Cancers 2022, 14. [CrossRef]
- Samiei E.;Seyfoori A.;Toyota B.;Ghavami S., Akbari M. Investigating Programmed Cell Death and Tumor Invasion in a Three-Dimensional (3D) Microfluidic Model of Glioblastoma. Int J Mol Sci. 2020, 21. [CrossRef]
- Shojaei S.;Koleini N.;Samiei E.;Aghaei M.;Cole L.K.;Alizadeh J.;Islam M.I.;Vosoughi A.R.;Albokashy M.;Butterfield Y.; et al. Simvastatin increases temozolomide-induced cell death by targeting the fusion of autophagosomes and lysosomes. FEBS J. 2020, 287, 1005–1034. [CrossRef]
- Shojaei S.;Alizadeh J.;Thliveris J.;Koleini N.;Kardami E.;Hatch G.M.;Xu F.;Hombach-Klonisch S.;Klonisch T., Ghavami S. Statins: A new approach to combat temozolomide chemoresistance in glioblastoma. J Investig Med. 2018, 66, 1083–1087. [CrossRef]
- Rong L.;Li N., Zhang Z. Emerging therapies for glioblastoma: Current state and future directions. J. Exp. Clin. Cancer Res. 2022, 41, 1–18.
- Hajiahmadi S.;Lorzadeh S.;Iranpour R.;Karima S.;Rajabibazl M.;Shahsavari Z., Ghavami S. Temozolomide, Simvastatin and Acetylshikonin Combination Induces Mitochondrial-Dependent Apoptosis in GBM Cells, Which Is Regulated by Autophagy. Biology 2023, 12. [CrossRef]
- Sharifzad F.;Ghavami S.;Verdi J.;Mardpour S.;Mollapour Sisakht M.;Azizi Z.;Taghikhani A.;Los M.J.;Fakharian E.;Ebrahimi M.; et al. Glioblastoma cancer stem cell biology: Potential theranostic targets. Drug Resist Update 2019, 42, 35–45. [CrossRef]
- Zhang P.;Xia Q.;Liu L.;Li S., Dong L. Current opinion on molecular characterization for GBM classification in guiding clinical diagnosis, prognosis, and therapy. Front. Mol. Biosci. . 2020, 7, 562798.
- Sharifzad F.;Yasavoli-Sharahi H.;Mardpour S.;Fakharian E.;Nikuinejad H.;Heydari Y.;Mardpour S.;Taghikhani A.;Khellat R.;Vafaei S.; et al. Neuropathological and genomic characterization of glioblastoma-induced rat model: How similar is it to humans for targeted therapy? J Cell Physiol. 2019, 234, 22493–22504.
- Lu C.-H.;Wei S.-T.;Liu J.-J.;Chang Y.-J.;Lin Y.-F.;Yu C.-S., Chang S.L.-Y. Recognition of a Novel Gene Signature for Human Glioblastoma. Int. J. Mol. Sci. 2022, 23, 4157.
- Yabo Y.A.;Niclou S.P., Golebiewska A. Cancer cell heterogeneity and plasticity: A paradigm shift in glioblastoma. Neuro-Oncol. 2022, 24, 669–682. [CrossRef]
- Basso J.;Paggi M.G.;Fortuna A.;Vitorino C., Vitorino R. Deciphering specific miRNAs in brain tumors: A 5-miRNA signature in glioblastoma. Mol. Genet. Genom. 2022, 297, 507–521. [CrossRef]
- Wei X.;Zhang Q.-m.;Liu C.;Wu S.;Nong W.-x.;Ge Y.-y.;Lin L.-n.;Li F.;Xie X.-x., Luo B. Microrna-1224-5p Is a Potential Prognostic and Therapeutic Biomarker in Glioblastoma: Integrating Bioinformatics and Clinical Analyses. Curr. Med. Sci. 2022, 42, 584–596.
- Xi X.;Chu Y.;Liu N.;Wang Q.;Yin Z.;Lu Y., Chen Y. Joint bioinformatics analysis of underlying potential functions of hsa-let-7b-5p and core genes in human glioma. J. Transl. Med. 2019, 17, 1–16.
- Sadegh S.;Skelton J.;Anastasi E.;Bernett J.;Blumenthal D.B.;Galindez G.;Salgado-Albarrán M.;Lazareva O.;Flanagan K., Cockell S. Network medicine for disease module identification and drug repurposing with the NeDRex platform. Nat. Commun. 2021, 12, 1–12. [CrossRef]
- Shannon P.;Markiel A.;Ozier O.;Baliga N.S.;Wang J.T.;Ramage D.;Amin N.;Schwikowski B., Ideker T. Cytoscape: A software environment for integrated models of biomolecular interaction networks. Genome Res. 2003, 13, 2498–2504. [CrossRef]
- Ghiassian S.D.;Menche J., Barabási A.-L. A DIseAse MOdule Detection (DIAMOnD) algorithm derived from a systematic analysis of connectivity patterns of disease proteins in the human interactome. PLoS Comput. Biol. 2015, 11, e1004120. [CrossRef]
- Piñero J.;Bravo À.;Queralt-Rosinach N.;Gutiérrez-Sacristán A.;Deu-Pons J.;Centeno E.;García-García J.;Sanz F., Furlong L.I. DisGeNET: A comprehensive platform integrating information on human disease-associated genes and variants. Nucleic Acids Res. 2016, gkw943. [CrossRef]
- Piñero J.;Ramírez-Anguita J.M.;Saüch-Pitarch J.;Ronzano F.;Centeno E.;Sanz F., Furlong L.I. The DisGeNET knowledge platform for disease genomics: 2019 update. Nucleic Acids Res. 2020, 48, D845–D855. [CrossRef]
- Szklarczyk D.;Gable A.L.;Nastou K.C.;Lyon D.;Kirsch R.;Pyysalo S.;Doncheva N.T.;Legeay M.;Fang T., Bork P. The STRING database in 2021: Customizable protein–protein networks, and functional characterization of user-uploaded gene/measurement sets. Nucleic Acids Res. 2021, 49, D605–D612.
- Kanehisa M.;Furumichi M.;Tanabe M.;Sato Y., Morishima K. KEGG: New perspectives on genomes, pathways, diseases and drugs. Nucleic Acids Res. 2017, 45, D353–D361. [CrossRef]
- Huang Z.;Shi J.;Gao Y.;Cui C.;Zhang S.;Li J.;Zhou Y., Cui Q. HMDD v3. 0: A database for experimentally supported human microRNA–disease associations. Nucleic Acids Res. 2019, 47, D1013–D1017.
- Warde-Farley D.;Donaldson S.L.;Comes O.;Zuberi K.;Badrawi R.;Chao P.;Franz M.;Grouios C.;Kazi F., Lopes C.T. The GeneMANIA prediction server: Biological network integration for gene prioritization and predicting gene function. Nucleic Acids Res. 2010, 38, W214–W220. [CrossRef]
- Latifi-Navid H.;Soheili Z.S.;Samiei S.;Sadeghi M.;Taghizadeh S.;Pirmardan E.R., Ahmadieh H. Network analysis and the impact of Aflibercept on specific mediators of angiogenesis in HUVEC cells. J. Cell. Mol. Med. 2021, 25, 8285–8299. [CrossRef]
- Zhou G.;Soufan O.;Ewald J.;Hancock R.E.;Basu N., Xia J. NetworkAnalyst 3.0: A visual analytics platform for comprehensive gene expression profiling and meta-analysis. Nucleic acids research 2019, 47, W234–W241.
- Xia J.;Gill E.E., Hancock R.E. NetworkAnalyst for statistical, visual and network-based meta-analysis of gene expression data. Nat. Protoc. 2015, 10, 823–844.
- Huang H.-Y.;Lin Y.-C.-D.;Li J.;Huang K.-Y.;Shrestha S.;Hong H.-C.;Tang Y.;Chen Y.-G.;Jin C.-N., Yu Y. miRTarBase 2020: Updates to the experimentally validated microRNA–target interaction database. Nucleic Acids Res. 2020, 48, D148–D154.
- Samaras P.;Schmidt T.;Frejno M.;Gessulat S.;Reinecke M.;Jarzab A.;Zecha J.;Mergner J.;Giansanti P., Ehrlich H.-C. ProteomicsDB: A multi-omics and multi-organism resource for life science research. Nucleic Acids Res. 2020, 48, D1153–D1163. [CrossRef]
- Schmidt T.;Samaras P.;Frejno M.;Gessulat S.;Barnert M.;Kienegger H.;Krcmar H.;Schlegl J.;Ehrlich H.-C., Aiche S. ProteomicsDB. Nucleic Acids Res. 2018, 46, D1271–D1281.
- Bowman R.L.;Wang Q.;Carro A.;Verhaak R.G., Squatrito M. GlioVis data portal for visualization and analysis of brain tumor expression datasets. Neuro-Oncol. 2017, 19, 139–141.
- Thul P.J., Lindskog C. The human protein atlas: A spatial map of the human proteome. Protein Sci. 2018, 27, 233–244.
- Bastian F.B.;Roux J.;Niknejad A.;Comte A.;Fonseca Costa S.S.;De Farias T.M.;Moretti S.;Parmentier G.;De Laval V.R., Rosikiewicz M. The Bgee suite: Integrated curated expression atlas and comparative transcriptomics in animals. Nucleic Acids Res. 2021, 49, D831–D847. [CrossRef]
- Brazma A.;Parkinson H.;Sarkans U.;Shojatalab M.;Vilo J.;Abeygunawardena N.;Holloway E.;Kapushesky M.;Kemmeren P., Lara G.G. ArrayExpress—A public repository for microarray gene expression data at the EBI. Nucleic Acids Res. 2003, 31, 68–71. [CrossRef]
- Edgar R.;Domrachev M., Lash A.E. Gene Expression Omnibus: NCBI gene expression and hybridization array data repository. Nucleic Acids Res. 2002, 30, 207–210. [CrossRef]
- Deng M.;Brägelmann J.;Kryukov I.;Saraiva-Agostinho N., Perner S. FirebrowseR: An R client to the Broad Institute’s Firehose Pipeline. Database 2017, 2017. [CrossRef]
- Chang L.;Zhou G.;Ou H., Xia J. mGWAS-Explorer: Linking SNPs, Genes, Metabolites, and Diseases for Functional Insights. Metabolites 2022 12, 526.
- Deshmukh R.;Allega M.F., Tardito S. A map of the altered glioma metabolism. Trends Mol. Med. 2021, 27, 1045–1059. [CrossRef]
- Jaroch K.;Modrakowska P., Bojko B. Glioblastoma Metabolomics—In Vitro Studies. Metabolites 2021, 11, 315. [CrossRef]
- Pang Z.;Chong J.;Zhou G.;de Lima Morais D.A.;Chang L.;Barrette M.;Gauthier C.;Jacques P.-É.;Li S., Xia J. MetaboAnalyst 5.0: Narrowing the gap between raw spectra and functional insights. Nucleic Acids Res. 2021, 49, W388–W396.
- Pang Z.;Zhou G.;Ewald J.;Chang L.;Hacariz O.;Basu N., Xia J. Using MetaboAnalyst 5.0 for LC–HRMS spectra processing, multi-omics integration and covariate adjustment of global metabolomics data. Nat. Protocols 2022, 17, 1735–1761.
- Backes C.;Khaleeq Q.T.;Meese E., Keller A. miEAA: microRNA enrichment analysis and annotation. Nucleic Acids Res. 2016, 44, W110–W116. [CrossRef]
- Kern F.;Fehlmann T.;Solomon J.;Schwed L.;Grammes N.;Backes C.;Van Keuren-Jensen K.;Craig D.W.;Meese E., Keller A. miEAA 2.0: Integrating multi-species microRNA enrichment analysis and workflow management systems. Nucleic Acids Res. 2020, 48, W521–W528. [CrossRef]
- Jewison T.;Su Y.;Disfany F.M.;Liang Y.;Knox C.;Maciejewski A.;Poelzer J.;Huynh J.;Zhou Y., Arndt D. SMPDB 2.0: Big improvements to the Small Molecule Pathway Database. Nucleic Acids Res. 2014, 42, D478-D484. [CrossRef]
- Ostrom Q.T.;Bauchet L.;Davis F.G.;Deltour I.;Fisher J.L.;Langer C.E.;Pekmezci M.;Schwartzbaum J.A.;Turner M.C., Walsh K.M. The epidemiology of glioma in adults: A “state of the science” review. Neuro-Oncol. 2014, 16, 896–913. [CrossRef]
- Deweerdt S. Below the surface. 2018.
- Zhou Q.;Liu J.;Quan J.;Liu W.;Tan H., Li W. MicroRNAs as potential biomarkers for the diagnosis of glioma: A systematic review and meta-analysis. Cancer Sci. 2018, 109, 2651–2659.
- Barzegar Behrooz A.;Talaie Z.;Jusheghani F.;Łos M.J.;Klonisch T., Ghavami S. Wnt and PI3K/Akt/mTOR survival pathways as therapeutic targets in glioblastoma. Int. J. Mol. Sci. 2022, 23, 1353. [CrossRef]
- Ruiz-Pérez M.V.;Henley A.B., Arsenian-Henriksson M. The MYCN protein in health and disease. Genes 2017, 8, 113. [CrossRef]
- Orian J.;Vasilopoulos K.;Yoshida S.;Kaye A.;Chow C., Gonzales M. Overexpression of multiple oncogenes related to histological grade of astrocytic glioma. Br. J. Cancer 1992, 66, 106–112. [CrossRef]
- Herms J.W.;von Loewenich F.D.;Behnke J.;Markakis E., Kretzschmar H.A. c-Myc oncogene family expression in glioblastoma and survival. Surg. Neurol. 1999, 51, 536–542. [CrossRef]
- Annibali D.;Whitfield J.R.;Favuzzi E.;Jauset T.;Serrano E.;Cuartas I.;Redondo-Campos S.;Folch G.;Gonzàlez-Juncà A., Sodir N.M. Myc inhibition is effective against glioma and reveals a role for Myc in proficient mitosis. Nat. Commun. 2014, 5, 1–11. [CrossRef]
- Alkema M.;Wiegant J.;Raap A.K.;Bems A., van Lohuizen M. Characterization and chromosomal localization of the human proto-oncogene BMI-1. Hum. Mol. Genet. 1993, 2, 1597–1603.
- Bracken A.P.;Dietrich N.;Pasini D.;Hansen K.H., Helin K. Genome-wide mapping of Polycomb target genes unravels their roles in cell fate transitions. Genes Dev. 2006, 20, 1123–1136. [CrossRef]
- Sauvageau M., Sauvageau G. Polycomb group proteins: Multi-faceted regulators of somatic stem cells and cancer. Cell Stem Cell 2010, 7, 299–313. [CrossRef]
- Schuringa J.J., Vellenga E. Role of the polycomb group gene BMI1 in normal and leukemic hematopoietic stem and progenitor cells. Curr. Opin. Hematol. 2010, 17, 294–299. [CrossRef]
- Valk-Lingbeek M.E.;Bruggeman S.W., van Lohuizen M. Stem cells and cancer: The polycomb connection. Cell 2004, 118, 409–418. [CrossRef]
- Haupt Y.;Alexander W.S.;Barri G.;Klinken S.P., Adams J.M. Novel zinc finger gene implicated as myc collaborator by retrovirally accelerated lymphomagenesis in Eμ-myc transgenic mice. Cell 1991, 65, 753–763. [CrossRef]
- Van Lohuizen M.;Verbeek S.;Scheljen B.;Wientjens E.;van der Guidon H., Berns A. Identification of cooperating oncogenes in Eμ-myc transgenic mice by provirus tagging. Cell 1991, 65, 737–752. [CrossRef]
- Vora P.;Seyfrid M.;Venugopal C.;Qazi M.A.;Salim S.;Isserlin R.;Subapanditha M.;O’Farrell E.;Mahendram S., Singh M. Bmi1 regulates human glioblastoma stem cells through activation of differential gene networks in CD133+ brain tumor initiating cells. J. Neuro-Oncol. 2019, 143, 417–428. [CrossRef]
- Jin X.;Kim L.J.;Wu Q.;Wallace L.C.;Prager B.C.;Sanvoranart T.;Gimple R.C.;Wang X.;Mack S.C., Miller T.E. Targeting glioma stem cells through combined BMI1 and EZH2 inhibition. Nat. Med. 2017, 23, 1352–1361.
- Xu H.;Zong H.;Ma C.;Ming X.;Shang M.;Li K.;He X.;Du H., Cao L. Epidermal growth factor receptor in glioblastoma. Oncol. Lett. 2017, 14, 512–516.
- Ding J.;Li X.;Khan S.;Zhang C.;Gao F.;Sen S.;Wasylishen A.R.;Zhao Y.;Lozano G., Koul D. EGFR suppresses p53 function by promoting p53 binding to DNA-PKcs: A noncanonical regulatory axis between EGFR and wild-type p53 in glioblastoma. Neuro-Oncol. 2022, 24, 1712–1725.
- Fang R.;Chen X.;Zhang S.;Shi H.;Ye Y.;Shi H.;Zou Z.;Li P.;Guo Q., Ma L. EGFR/SRC/ERK-stabilized YTHDF2 promotes cholesterol dysregulation and invasive growth of glioblastoma. Nat. Commun. 2021, 12, 1–17.
- Tanaka S.;Batchelor T.T.;Iafrate A.J.;Dias-Santagata D.;Borger D.R.;Ellisen L.W.;Yang D.;Louis D.N.;Cahill D.P., Chi A.S. PIK3CA activating mutations are associated with more disseminated disease at presentation and earlier recurrence in glioblastoma. Acta Neuropathol. Commun. 2019, 7, 1–8. [CrossRef]
- Abbi S., Guan J. Focal adhesion kinase: Protein interactions and cellular functions. Histol. Histopathol. 2002.
- Parsons J.T.;Martin K.H.;Slack J.K.;Taylor J.M., Weed S.A. Focal adhesion kinase: A regulator of focal adhesion dynamics and cell movement. Oncogene 2000, 19, 5606–5613. [CrossRef]
- Tamura M.;Gu J.;Matsumoto K.;Aota S.-i.;Parsons R., Yamada K.M. Inhibition of cell migration, spreading, and focal adhesions by tumor suppressor PTEN. Science 1998, 280, 1614–1617. [CrossRef]
- Jones G.;Machado Jr J.;Tolnay M., Merlo A. PTEN-independent induction of caspase-mediated cell death and reduced invasion by the focal adhesion targeting domain (FAT) in human astrocytic brain tumors which highly express focal adhesion kinase (FAK). Cancer Res. 2001, 61, 5688–5691.
- Knobbe C.B., Reifenberger G. Genetic alterations and aberrant expression of genes related to the phosphatidyl-lnositol-3′-kinase/protein kinase B (Akt) signal transduction pathway in glioblastomas. Brain Pathol. 2003, 13, 507–518.
- Scholz N.;Kurian K.M.;Siebzehnrubl F.A., Licchesi J.D. Targeting the ubiquitin system in glioblastoma. Front. Oncol. 2020, 10, 574011. [CrossRef]
- Delle Donne R.;Iannucci R.;Rinaldi L.;Roberto L.;Oliva M.A.;Senatore E.;Borzacchiello D.;Lignitto L.;Giurato G., Rizzo F. Targeted inhibition of ubiquitin signaling reverses metabolic reprogramming and suppresses glioblastoma growth. Commun. Biol. 2022, 5, 1–14. [CrossRef]
- Li J.;Sun Y.;Ma Y.;Zhao X.;Sun X.;Wang Y., Zhang X. Comprehensive Pan-Cancer Analysis of IRAK Family Genes Identifies IRAK1 as a Novel Oncogene in Low-Grade Glioma. J. Oncol. 2022, 2022.
- Lee H.N.;Jeong M.S., Jang S.B. Molecular Characteristics of Amyloid Precursor Protein (APP) and Its Effects in Cancer. Int. J. Mol. Sci. 2021, 22, 4999.
- Culicchia F.;Cui J.-G.;Li Y.Y., Lukiw W.J. Upregulation of β-amyloid precursor protein expression in glioblastoma multiforme. Neuroreport 2008, 19, 981–985.
- Lehrer S. Glioblastoma and dementia may share a common cause. Med. Hypotheses 2010, 75, 67–68. [CrossRef]
- Kucheryavykh L.Y.;Ortiz-Rivera J.;Kucheryavykh Y.V.;Zayas-Santiago A.;Diaz-Garcia A., Inyushin M.Y. Accumulation of innate amyloid beta peptide in glioblastoma tumors. Int. J. Mol. Sci. 2019, 20, 2482. [CrossRef]
- Li S.;Chen X.;Mao L.;Zahid K.R.;Wen J.;Zhang L.;Zhang M.;Duan J.;Duan J., Yin X. Histone deacetylase 1 promotes glioblastoma cell proliferation and invasion via activation of PI3K/AKT and MEK/ERK signaling pathways. Brain Res. 2018, 1692, 154–162.
- Zhang Z.;Wang Y.;Chen J.;Tan Q.;Xie C.;Li C.;Zhan W., Wang M. Silencing of histone deacetylase 2 suppresses malignancy for proliferation, migration, and invasion of glioblastoma cells and enhances temozolomide sensitivity. Cancer Chemother. Pharmacol. 2016, 78, 1289–1296.
- Zhong S.;Fan Y.;Wu B.;Wang Y.;Jiang S.;Ge J.;Hua C.;Zhao G.;Chen Y., Xu H. HDAC3 expression correlates with the prognosis and grade of patients with glioma: A diversification analysis based on transcriptome and clinical evidence. World Neurosurg. 2018, 119, e145–e158.
- Chang H.H.;Chang Y.-Y.;Tsai B.-C.;Chen L.-J.;Chang A.-C.;Chuang J.-Y.;Gean P.-W., Hsueh Y.-S. A Selective Histone Deacetylase Inhibitor Induces Autophagy and Cell Death via SCNN1A Downregulation in Glioblastoma Cells. Cancers 2022, 14, 4537. [CrossRef]
- Fan Y.;Peng X.;Wang Y.;Li B., Zhao G. Comprehensive analysis of HDAC family Identifies HDAC1 as A Prognostic and Immune Infiltration Indicator and HDAC1-related Signature for Prognosis Estimation in Glioma. Front. Mol. Biosci. 2021, 737.
- Zhang Y.;Dube C.;Gibert Jr M.;Cruickshanks N.;Wang B.;Coughlan M.;Yang Y.;Setiady I.;Deveau C., Saoud K. The p53 pathway in glioblastoma. Cancers 2018, 10, 297.
- Sukumar U.K.;Massoud T.F., Paulmurugan R. p53 supplementation as a targeted cancer gene therapy for glioblastoma. Glioblastoma Resistance to Chemotherapy: Molecular Mechanisms and Innovative Reversal Strategies: Elsevier; 2021. p. 773-86.
- Qi Z.-X.;Cai J.-J.;Chen L.-C.;Yue Q.;Gong Y.;Yao Y., Mao Y. TRIM28 as an independent prognostic marker plays critical roles in glioma progression. J. Neuro-Oncol. 2016, 126, 19–26.
- Peng Y.;Zhang M.;Jiang Z., Jiang Y. TRIM28 activates autophagy and promotes cell proliferation in glioblastoma. OncoTargets Ther. 2019, 12, 397. [CrossRef]
- Clevers H., Nusse R. Wnt/β-catenin signaling and disease. Cell 2012, 149, 1192–1205.
- Nàger M.;Sallán M.C.;Visa A.;Pushparaj C.;Santacana M.;Macià A.;Yeramian A.;Cantí C., Herreros J. Inhibition of WNT-CTNNB1 signaling upregulates SQSTM1 and sensitizes glioblastoma cells to autophagy blockers. Autophagy 2018, 14, 619–636. [CrossRef]
- Schulze M.;Violonchi C.;Swoboda S.;Welz T.;Kerkhoff E.;Hoja S.;Brüggemann S.;Simbürger J.;Reinders J., Riemenschneider M.J. RELN signaling modulates glioblastoma growth and substrate-dependent migration. Brain Pathol. 2018, 28, 695–709. [CrossRef]
- Biamonte F.;Sica G.;Filippini A., D’Alessio A. Evidence of Reelin Signaling in GBM and Its Derived Cancer Stem Cells. Brain Sci. 2021, 11, 745. [CrossRef]
- Agnihotri S.;Golbourn B.;Huang X.;Remke M.;Younger S.;Cairns R.A.;Chalil A.;Smith C.A.;Krumholtz S.-L., Mackenzie D. PINK1 Is a Negative Regulator of Growth and the Warburg Effect in GlioblastomaPINK1 Inhibits Glioblastoma Growth. Cancer Res. 2016, 76, 4708–4719.
- Lee K.-S., Lu B. Targeting PINK1 and MQC in brain tumors. Oncotarget 2014, 5, 2864.
- Wang Y.;Liu H.-H.;Cao Y.-T.;Zhang L.-L.;Huang F., Yi C. The role of mitochondrial dynamics and mitophagy in carcinogenesis, metastasis and therapy. Front. Cell Dev. Biol. 2020, 8, 413.
- Lenzi P.;Ferese R.;Biagioni F.;Fulceri F.;Busceti C.L.;Falleni A.;Gambardella S.;Frati A., Fornai F. Rapamycin ameliorates defects in mitochondrial fission and mitophagy in glioblastoma cells. Int. J. Mol. Sci. 2021, 22, 5379. [CrossRef]
- Lv D.;Gimple R.C.;Zhong C.;Wu Q.;Yang K.;Prager B.C.;Godugu B.;Qiu Z.;Zhao L., Zhang G. PDGF signaling inhibits mitophagy in glioblastoma stem cells through N6-methyladenosine. Dev. Cell 2022.
- Zhang C.-Z.;Zhang J.-X.;Zhang A.-L.;Shi Z.-D.;Han L.;Jia Z.-F.;Yang W.-D.;Wang G.-X.;Jiang T., You Y.-P. MiR-221 and miR-222 target PUMA to induce cell survival in glioblastoma. Mol. Cancer 2010, 9, 1–9.
- Quintavalle C.;Mangani D.;Roscigno G.;Romano G.;Diaz-Lagares A.;Iaboni M.;Donnarumma E.;Fiore D.;De Marinis P., Soini Y. MiR-221/222 target the DNA methyltransferase MGMT in glioma cells. PLoS ONE 2013, 8, e74466.
- Areeb Z.;Stuart S.F.;West A.J.;Gomez J.;Nguyen H.;Paradiso L.;Zulkifli A.;Jones J.;Kaye A.H., Morokoff A.P. Reduced EGFR and increased miR-221 is associated with increased resistance to temozolomide and radiotherapy in glioblastoma. Sci. Rep. 2020, 10, 1–12. [CrossRef]
- Wang K.;Jia Z.;Zou J.;Zhang A.;Wang G.;Hao J.;Wang Y.;Yang S., Pu P. Analysis of hsa-miR-30a-5p expression in human gliomas. Pathol. Oncol. Res. 2013, 19, 405–411.
- Zhao P.;Wang M.;An J.;Sun H.;Li T., Li D. A positive feedback loop of miR-30a-5p-WWP1-NF-κB in the regulation of glioma development. Int. J. Biochem. Cell Biol. 2019, 112, 39–49.
- Wang Z.;Dai X.;Chen Y.;Sun C.;Zhu Q.;Zhao H.;Liu G.;Huang Q., Lan Q. MiR-30a-5p is induced by Wnt/β-catenin pathway and promotes glioma cell invasion by repressing NCAM. Biochem. Biophys. Res. Commun. 2015, 465, 374–380.
- Isobe T.;Hisamori S.;Hogan D.J.;Zabala M.;Hendrickson D.G.;Dalerba P.;Cai S.;Scheeren F.;Kuo A.H., Sikandar S.S. miR-142 regulates the tumorigenicity of human breast cancer stem cells through the canonical WNT signaling pathway. Elife 2014, 3, e01977.
- Zhang X.;Li W.;Kang Y.;Zhang J., Yuan H. SynCAM, a novel putative tumor suppressor, suppresses growth and invasiveness of glioblastoma. Mol. Biol. Rep. 2013, 40, 5469–5475.
- Kong F.;Li X.;Li S.;Sheng D.;Li W., Song M. MicroRNA-15a-5p promotes the proliferation and invasion of T98G glioblastoma cells via targeting cell adhesion molecule 1. Oncol. Lett. 2021, 21, 1.
- Wang Z.;Li Z.;Fu Y.;Han L., Tian Y. MiRNA-130a-3p inhibits cell proliferation, migration, and TMZ resistance in glioblastoma by targeting Sp1. Am. J. Transl. Res. 2019, 11, 7272.
- Xi X.;Chu Y.;Liu N.;Wang Q.;Yin Z.;Lu Y., Chen Y. Joint bioinformatics analysis of underlying potential functions of hsa-let-7b-5p and core genes in human glioma. J. Transl. Med. 2019, 17, 1–16.
- McManus E.J.;Frampton C.;Tan A., Phillips M.C. Metabolics risk factors in a New Zealand glioblastoma cohort. Neuro-Oncol. Pract. 2022, 9, 43–49. [CrossRef]
- Liang R.;Zhang G.;Xu W.;Liu W., Tang Y. ApoC1 promotes glioma metastasis by enhancing epithelial-mesenchymal transition and activating the STAT3 pathway. Neurol. Res. 2022, 1-8.
- Liang R.;Li J.;Li M.;Yang Y.;Wang X.;Mao Q., Liu Y. Clinical significance of pre-surgical serum lipid levels in patients with glioblastoma. Oncotarget 2017, 8, 85940.
- Guo X.;Zhou S.;Yang Z.;Li Z.-A.;Hu W.;Dai L.;Liang W., Wang X. Cholesterol metabolism and its implication in glioblastoma therapy. J. Cancer 2022, 13, 1745.
- Villa G.R.;Hulce J.J.;Zanca C.;Bi J.;Ikegami S.;Cahill G.L.;Gu Y.;Lum K.M.;Masui K., Yang H. An LXR-cholesterol axis creates a metabolic co-dependency for brain cancers. Cancer Cell 2016, 30, 683–693. [CrossRef]
- Ng Y.-W., Say Y.-H. Palmitic acid induces neurotoxicity and gliatoxicity in SH-SY5Y human neuroblastoma and T98G human glioblastoma cells. PeerJ. 2018, 6, e4696.
- Taïb B.;Aboussalah A.M.;Moniruzzaman M.;Chen S.;Haughey N.J.;Kim S.F., Ahima R.S. Lipid accumulation and oxidation in glioblastoma multiforme. Sci. Rep. 2019, 9, 1–14.
- Sperry J.;Condro M.C.;Guo L.;Braas D.;Vanderveer-Harris N.;Kim K.K.;Pope W.B.;Divakaruni A.S.;Lai A., Christofk H. Glioblastoma utilizes fatty acids and ketone bodies for growth allowing progression during ketogenic diet therapy. Iscience 2020, 23, 101453. [CrossRef]
- So J.-S.;Kim H., Han K.-S. Mechanisms of Invasion in Glioblastoma: Extracellular Matrix, Ca2+ Signaling, and Glutamate. Front. Cell. Neurosci. 2021, 190.
- Corbetta C.;Di Ianni N.;Bruzzone M.G.;Patanè M.;Pollo B.;Cantini G.;Cominelli M.;Zucca I.;Pisati F., Poliani P.L. Altered function of the glutamate–aspartate transporter GLAST, a potential therapeutic target in glioblastoma. Int. J. Cancer 2019, 144, 2539–2554.
- Wang C.;Chen H.;Zhang M.;Zhang J.;Wei X., Ying W. Malate-aspartate shuttle inhibitor aminooxyacetic acid leads to decreased intracellular ATP levels and altered cell cycle of C6 glioma cells by inhibiting glycolysis. Cancer Lett. 2016, 378, 1–7.
- Cappelletti P.;Tallarita E.;Rabattoni V.;Campomenosi P.;Sacchi S., Pollegioni L. Proline oxidase controls proline, glutamate, and glutamine cellular concentrations in a U87 glioblastoma cell line. PLoS ONE 2018, 13, e0196283. [CrossRef]
- Tanaka K.;Sasayama T.;Nagashima H.;Irino Y.;Takahashi M.;Izumi Y.;Uno T.;Satoh N.;Kitta A., Kyotani K. Glioma cells require one-carbon metabolism to survive glutamine starvation. Acta Neuropathol. Commun. 2021, 9, 1–14. [CrossRef]
- Yang S.;Zhao J.;Cui X.;Zhan Q.;Yi K.;Wang Q.;Xiao M.;Tan Y.;Hong B., Fang C. TCA-phospholipid-glycolysis targeted triple therapy effectively suppresses ATP production and tumor growth in glioblastoma. Theranostics 2022, 12, 7032.
- Jung E.;Alfonso J.;Osswald M.;Monyer H.;Wick W., Winkler F. Emerging intersections between neuroscience and glioma biology. Nat. Neurosci. 2019, 22, 1951–1960. [CrossRef]
- Smits A.;Jin Z.;Elsir T.;Pedder H.;Nistér M.;Alafuzoff I.;Dimberg A.;Edqvist P.-H.;Pontén F., Aronica E. GABA-A channel subunit expression in human glioma correlates with tumor histology and clinical outcome. PLoS ONE 2012, 7, e37041. [CrossRef]
- Babateen O.;Jin Z.;Bhandage A.;Korol S.V.;Westermark B.;Nilsson K.F.;Uhrbom L.;Smits A., Birnir B. Etomidate, propofol and diazepam potentiate GABA-evoked GABAA currents in a cell line derived from human glioblastoma. Eur. J. Pharmacol. 2015, 748, 101–107. [CrossRef]
- Huang Q.;Chen L.;Liang J.;Huang Q., Sun H. Neurotransmitters: Potential Targets in Glioblastoma. Cancers 2022, 14, 3970.
- D'Urso P.I.;D'Urso O.F.;Storelli C.;Mallardo M.;Gianfreda C.D.;Montinaro A.;Cimmino A.;Pietro C., Marsigliante S. miR-155 is up-regulated in primary and secondary glioblastoma and promotes tumour growth by inhibiting GABA receptors. Int. J. Oncol. 2012, 41, 228–234. [CrossRef]
- Hujber Z.;Horváth G.;Petővári G.;Krencz I.;Dankó T.;Mészáros K.;Rajnai H.;Szoboszlai N.;Leenders W.P., Jeney A. GABA, glutamine, glutamate oxidation and succinic semialdehyde dehydrogenase expression in human gliomas. J. Exp. Clin. Cancer Res. 2018, 37, 1–12. [CrossRef]
- Stanke K.M.;Wilson C., Kidambi S. High Expression of Glycolytic Genes in Clinical Glioblastoma Patients Correlates with Lower Survival. Front. Mol. Biosci. 2021, 8. [CrossRef]
- Firdous S.;Abid R.;Nawaz Z.;Bukhari F.;Anwer A.;Cheng L.L., Sadaf S. Dysregulated alanine as a potential predictive marker of glioma—An insight from untargeted HRMAS-NMR and machine learning data. Metabolites 2021, 11, 507. [CrossRef]
- Ijare O.;Baskin D., Pichumani K. Cbmt-01. Alanine Fuels Energy Metabolism of Glioblastoma Cells. Neuro-Oncology 2019, 21, vi32. [CrossRef]
- Gupta T.;Malkin M., Huang S. tRNA function and dysregulation in cancer. Front. Cell Dev. Biol. 2022, 1128. [CrossRef]
- Li L.;Yang Y.;Wang Z.;Xu C.;Huang J., Li G. Prognostic role of METTL1 in glioma. Cancer Cell Int. 2021, 21, 1–20.
- Kofuji S.;Hirayama A.;Eberhardt A.O.;Kawaguchi R.;Sugiura Y.;Sampetrean O.;Ikeda Y.;Warren M.;Sakamoto N., Kitahara S. IMP dehydrogenase-2 drives aberrant nucleolar activity and promotes tumorigenesis in glioblastoma. Nat. Cell Biol. 2019, 21, 1003–1014. [CrossRef]
- Mohan A.A.;Tomaszewski W.H.;Haskell-Mendoza A.P.;Hotchkiss K.M.;Singh K.;Reedy J.L.;Fecci P.E.;Sampson J.H., Khasraw M. Targeting Immunometabolism in Glioblastoma. Front. Oncol. 2021, 11, 2260. [CrossRef]
- Rath M.;Müller I.;Kropf P.;Closs E.I., Munder M. Metabolism via arginase or nitric oxide synthase: Two competing arginine pathways in macrophages. Front. Immunol. 2014, 5, 532. [CrossRef]
- Kobayashi K.;Ohnishi A.;Promsuk J.;Shimizu S.;Kanai Y.;Shiokawa Y., Nagane M. Enhanced tumor growth elicited by L-type amino acid transporter 1 in human malignant glioma cells. Neurosurgery 2008, 62, 493–504. [CrossRef]
- Chinnaiyan P.;Kensicki E.;Bloom G.;Prabhu A.;Sarcar B.;Kahali S.;Eschrich S.;Qu X.;Forsyth P., Gillies R. The metabolomic signature of malignant glioma reflects accelerated anabolic metabolism. Cancer Res. 2012, 72, 5878–5888. [CrossRef]
- Khoury O.;Ghazale N.;Stone E.;El-Sibai M.;Frankel A.E., Abi-Habib R.J. Human recombinant arginase I (Co)-PEG5000 [HuArgI (Co)-PEG5000]-induced arginine depletion is selectively cytotoxic to human glioblastoma cells. J. Neuro-Oncol. 2015, 122, 75–85. [CrossRef]
- Hajji N.;Garcia-Revilla J.;Soto M.S.;Perryman R.;Symington J.;Quarles C.C.;Healey D.R.;Guo Y.;Orta-Vázquez M.L., Mateos-Cordero S. Arginine deprivation alters microglial polarity and synergizes with radiation to eradicate non-arginine-auxotrophic glioblastoma tumors. J. Clin. Investig. 2022, 132. [CrossRef]
- Sharpe M.A.;Ijare O.B.;Baskin D.S.;Baskin A.M.;Baskin B.N., Pichumani K. The leloir cycle in glioblastoma: Galactose scavenging and metabolic remodeling. Cancers 2021, 13, 1815. [CrossRef]
- Xu X.;Shen X.;Feng W.;Yang D.;Jin L.;Wang J.;Wang M.;Ting Z.;Xue F., Zhang J. D-galactose induces senescence of glioblastoma cells through YAP-CDK6 pathway. Aging 2020, 12, 18501.
- Sharpe M.;Baskin A.;Baskin B.;Baskin D., Raghavan S., editors. Targeting Glioblastoma's Galactose Scavenging Pathway. Neuro-Oncology; 2021: Oxford Univ Press Inc Journals Dept, 2001 Evans Rd, Cary, NC 27513 USA.
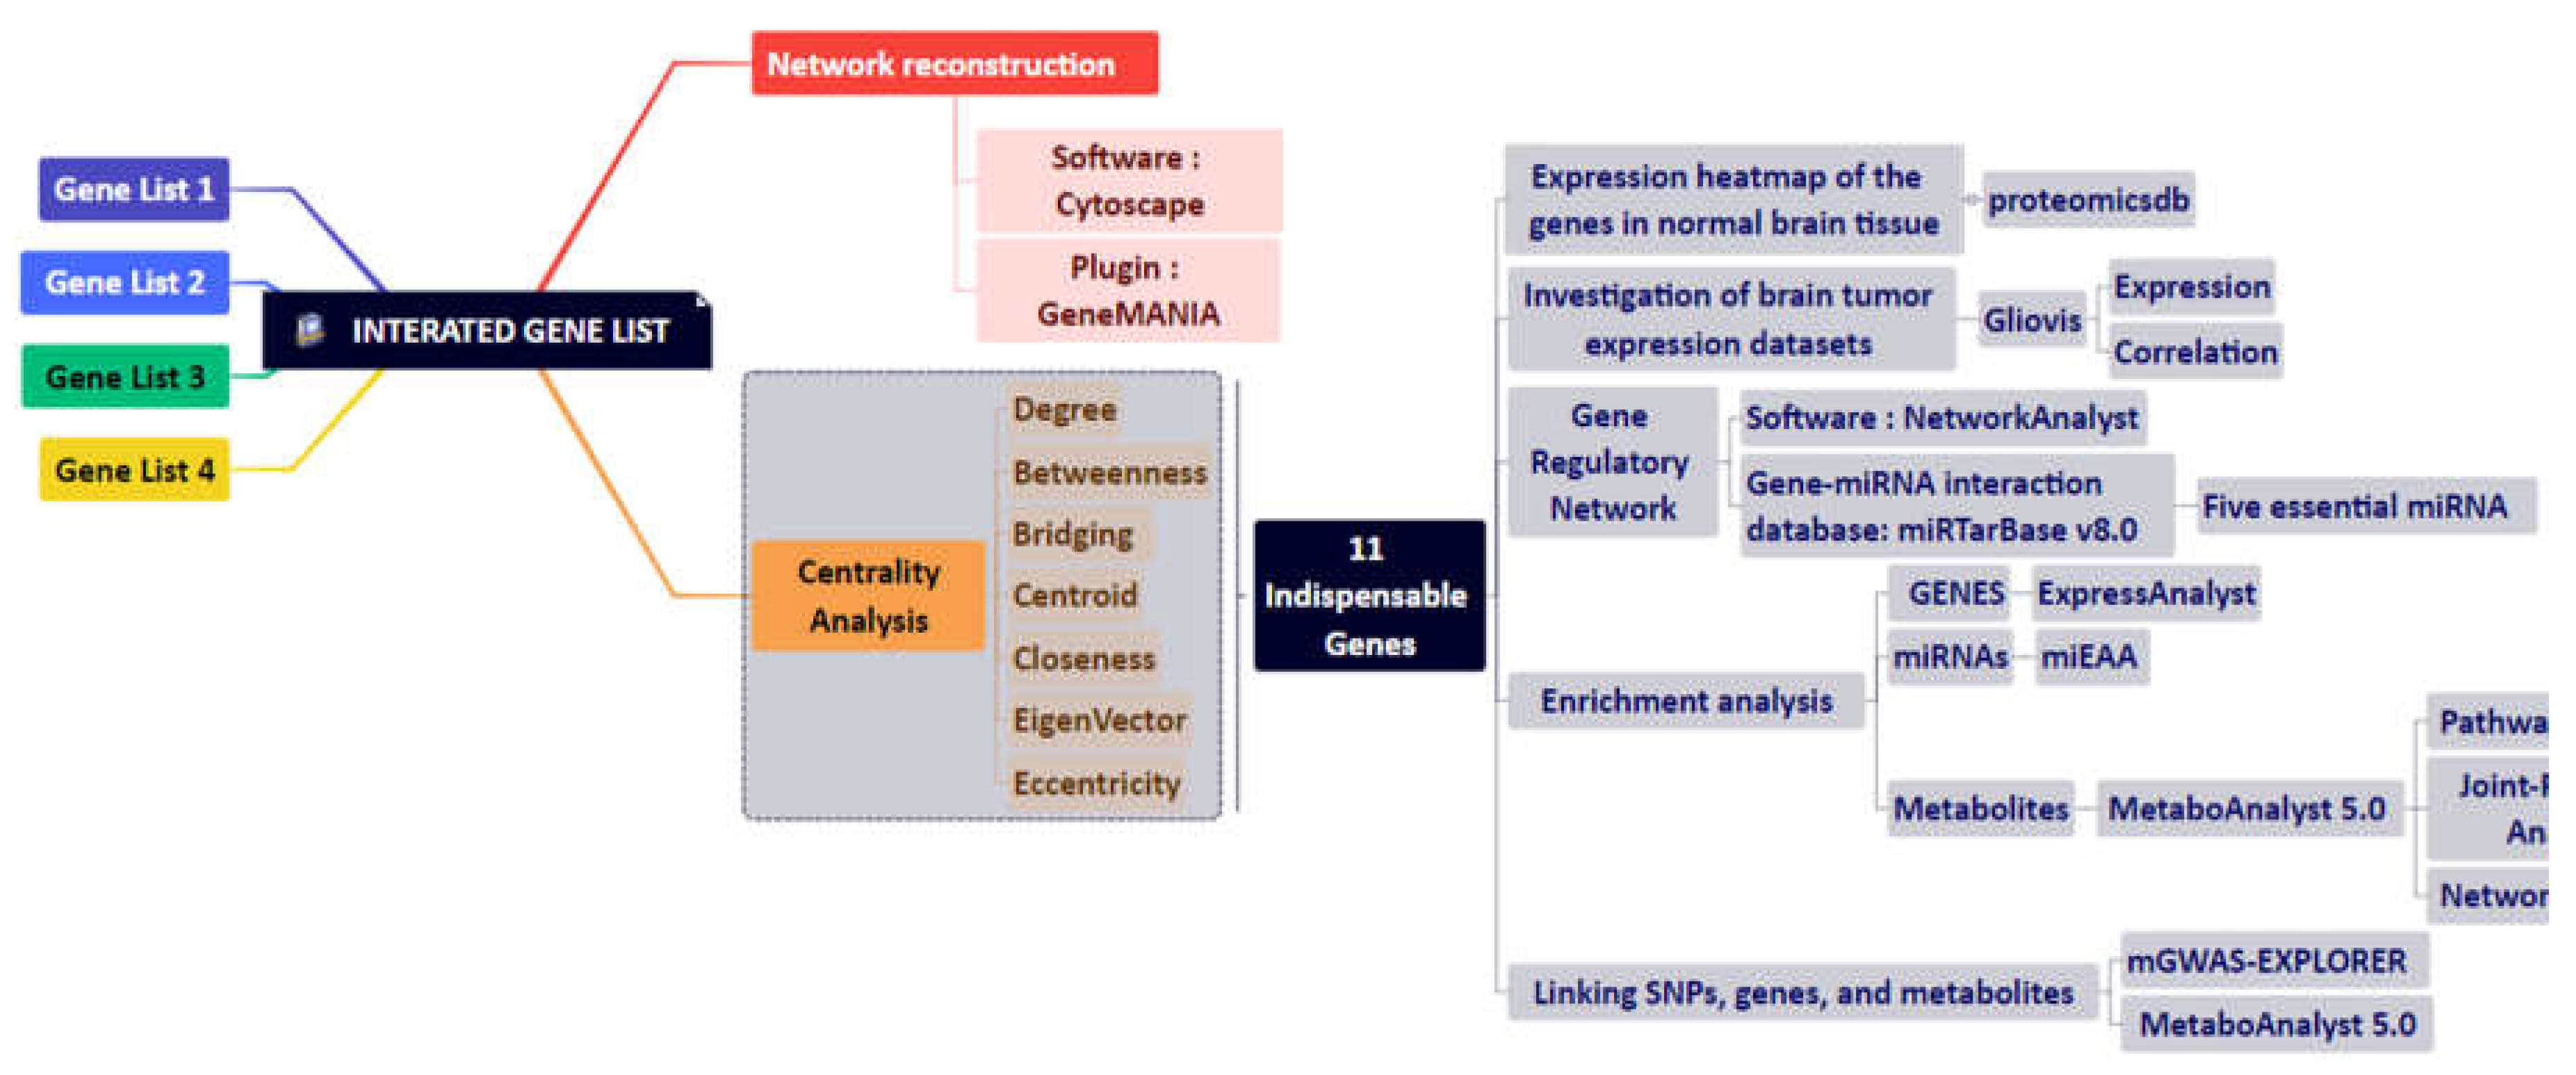
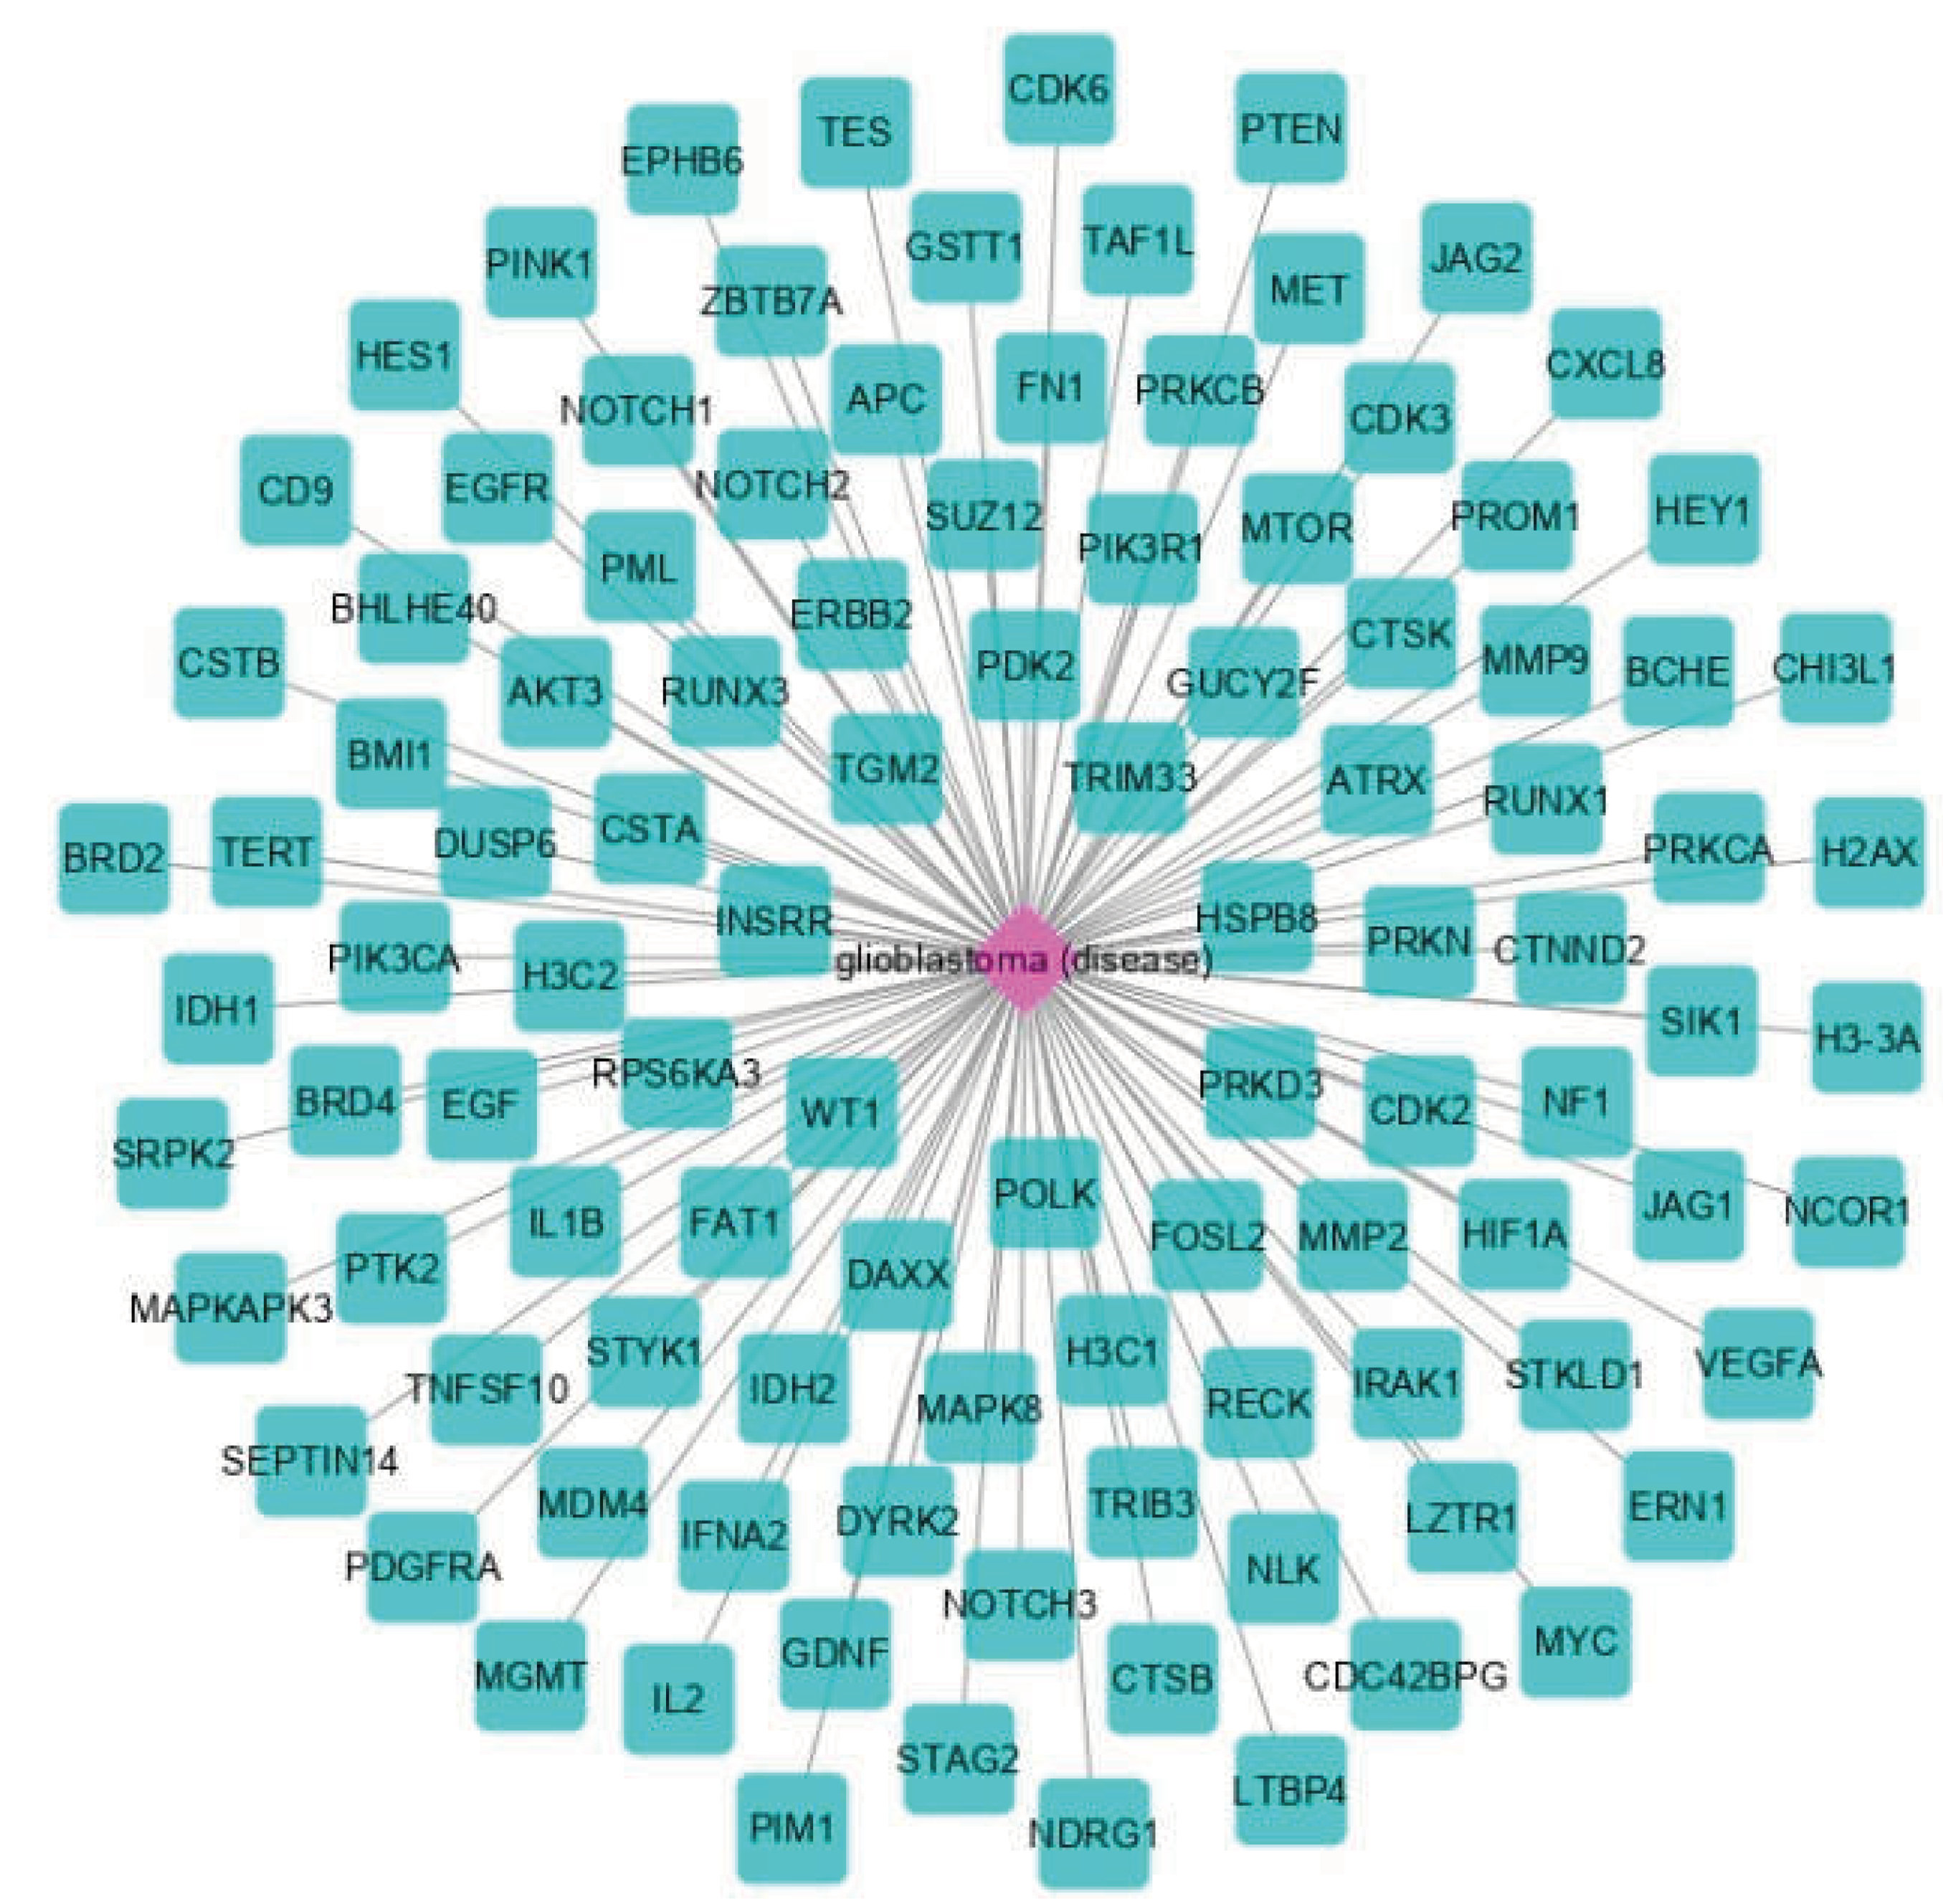
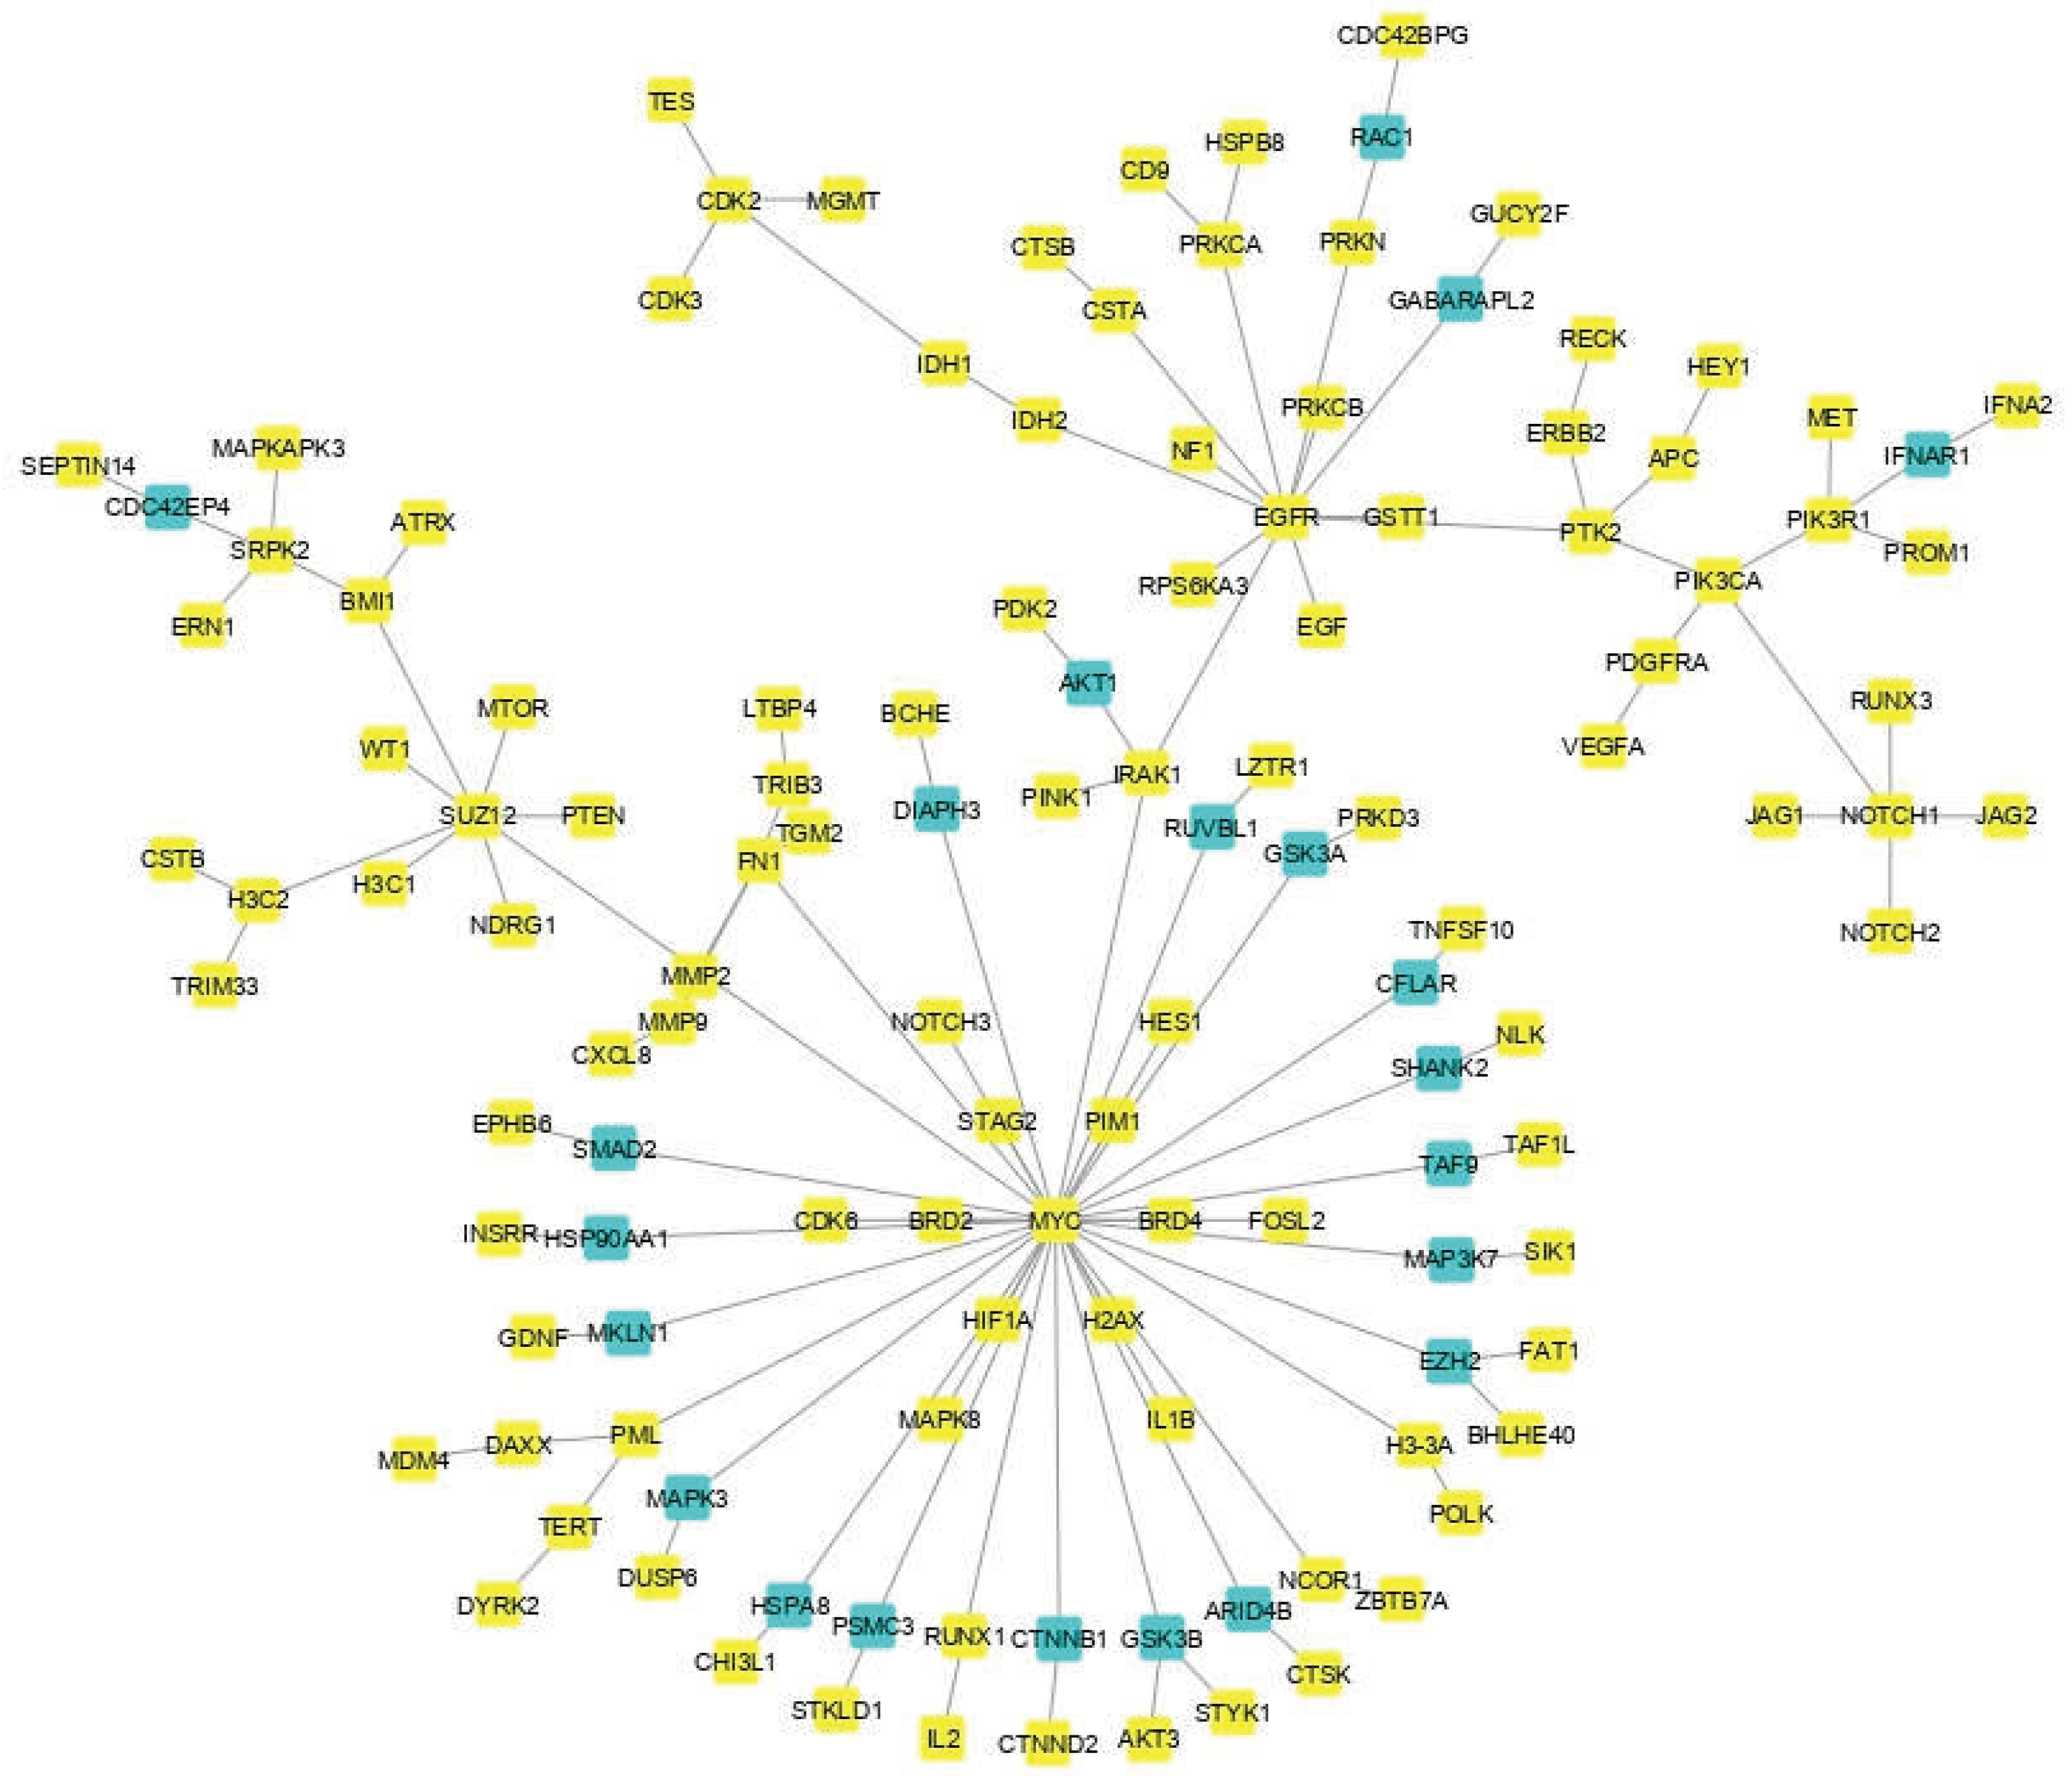

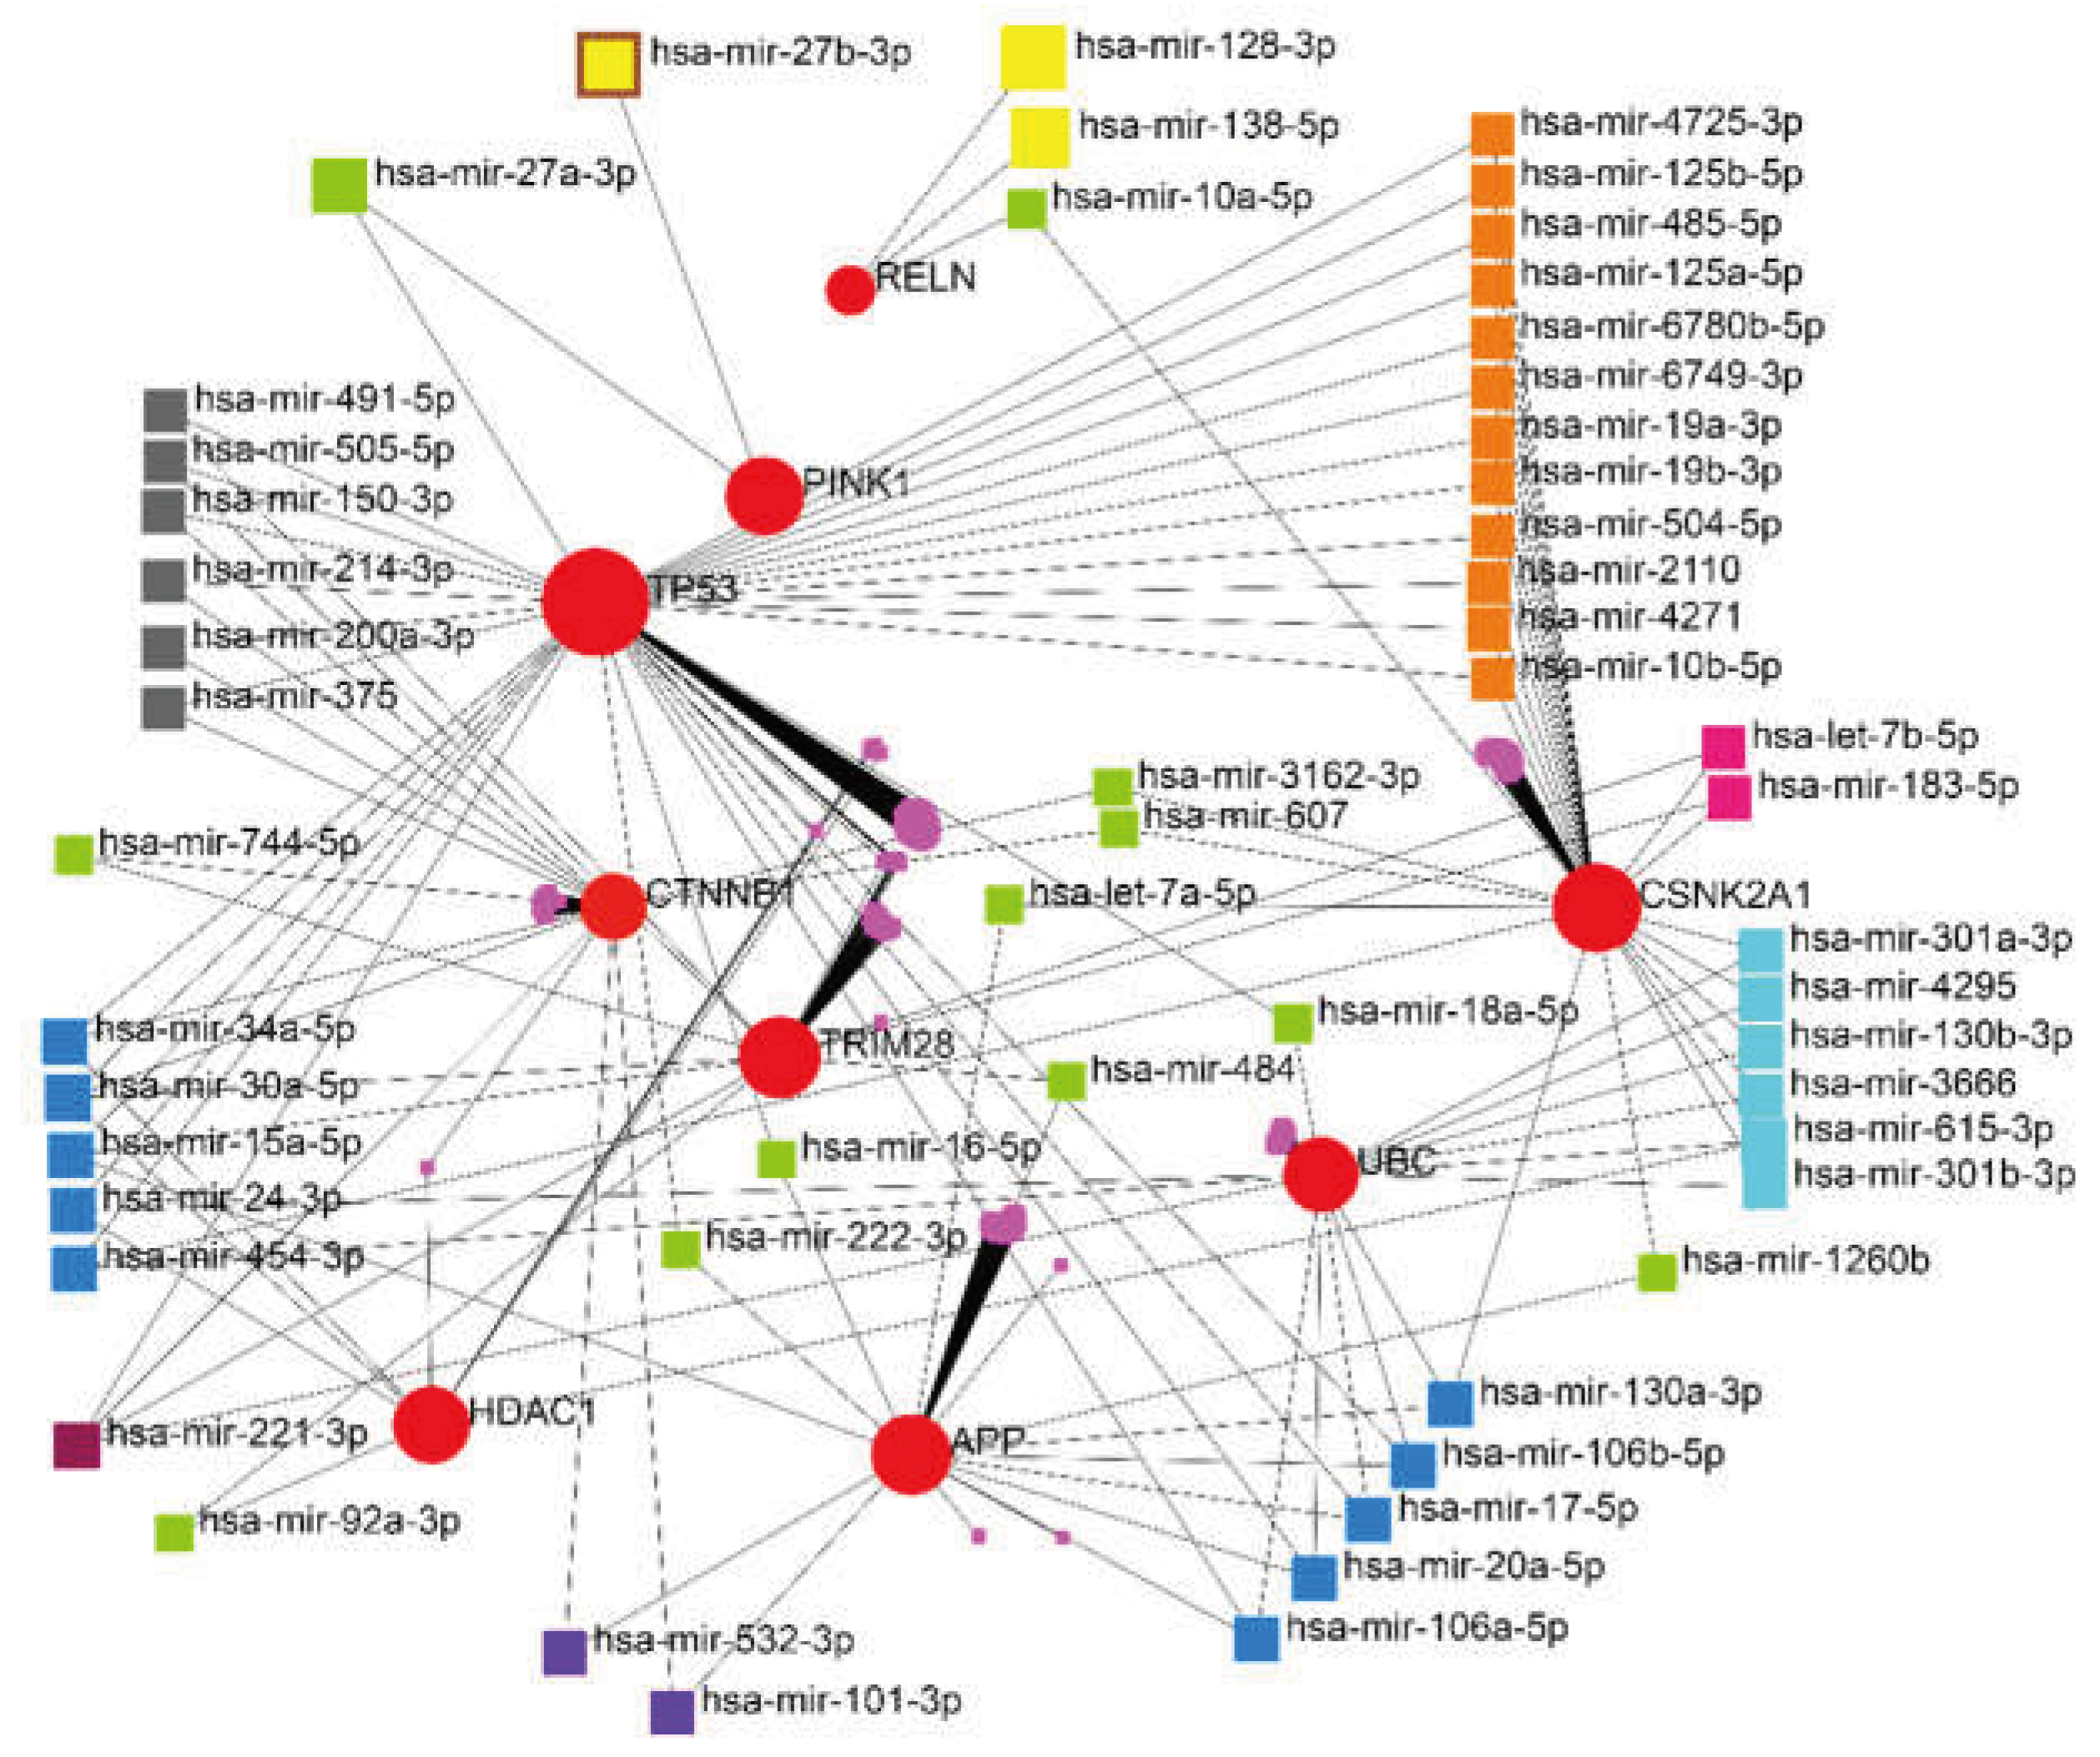
| 1 | VEGF signaling pathway- hsa04370 | 40 | TNF signaling pathway-hsa04668 |
|---|---|---|---|
| 2 | PI3K-Akt signaling pathway-hsa04151 | 41 | Citrate cycle (T.C.A. cycle)-hsa00020 |
| 3 | Ras signaling pathway- hsa04014 | 42 | Glycolysis / Gluconeogenesis-hsa00010 |
| 4 | TGF-beta signaling pathway- hsa04350 | 43 | Oxidative phosphorylation-hsa00190 |
| 5 | HIF-1 signaling pathway- hsa04066 | 44 | Starch and sucrose metabolism-hsa00500 |
| 6 | AMPK signaling pathway- hsa04152 | 45 | Pentose phosphate pathway- hsa00030 |
| 7 | MAPK signaling pathway - hsa04010 | 46 | Pyruvate metabolism- hsa00620 |
| 8 | Rap1 signaling pathway - hsa04015 | 47 | Insulin signaling pathway- hsa04910 |
| 9 | Wnt signaling pathway - hsa04310 | 48 | Lysosome-hsa04142 |
| 10 | Notch signaling pathway-hsa04330 | 49 | Phospholipase D signaling pathway- hsa04072 |
| 11 | Hedgehog signaling pathway -hsa04340 | 50 | Mitophagy- hsa04137 |
| 12 | Hippo signaling pathway -hsa04390 | 51 | Signaling pathways regulating pluripotency of stem cells- hsa04550 |
| 13 | JAK-STAT signaling pathway -hsa04630 | 52 | Cell adhesion molecules- hsa04514 |
| 14 | Apelin signaling pathway - hsa04371 | 53 | Cell cycle -hsa04110 |
| 15 | NF-kappa B signaling pathway-hsa04064 | 54 | ECM-receptor interaction-hsa04512 |
| 16 | TNF signaling pathway - hsa04668 | 55 | PD-L1 expression and PD-1 checkpoint pathway in cancer- hsa05235 |
| 17 | FoxO signaling pathway - hsa04068 | 56 | Pathways in cancer-hsa05200 |
| 18 | Phosphatidylinositol signaling system - hsa04070 | 57 | Transcriptional misregulation in cancer-hsa05202 |
| 19 | mTOR signaling pathway - hsa04150 | 58 | Central carbon metabolism in cancer- hsa05230 |
| 20 | p53 signaling pathway-hsa04115 | 59 | IL-17 signaling pathway-hsa04657 |
| 21 | Apoptosis-hsa04210 | 60 | Necroptosis-hsa04217 |
| 22 | Ubiquitin-mediated proteolysis- hsa04120 | 61 | Cellular senescence - hsa04218 |
| 23 | Cell cycle- hsa04110 | 62 | Chemokine signaling pathway-hsa04062 |
| 24 | Regulation of actin cytoskeleton - hsa04810 | 63 | Transcriptional misregulation in cancer-hsa05202 |
| 25 | Calcium signaling pathway- hsa04020 | 64 | ECM-receptor interaction- hsa04512 |
| 26 | T cell receptor signaling pathway- hsa04660 | 65 | Proteoglycans in cancer-hsa05205 |
| 27 | Focal adhesion- hsa04510 | 66 | Choline metabolism in cancer-hsa05231 |
| 28 | Adherens junction- hsa04520 | 67 | PD-L1 expression and PD-1 checkpoint pathway in cancer-hsa05235 |
| 29 | Gap junction-hsa04540 | 68 | Ferroptosis-hsa04216 |
| 30 | Tight junction- hsa04530 | 69 | Cholesterol metabolism- map04979 |
| 31 | Arachidonic acid metabolism- hsa00590 | 70 | Lipid and atherosclerosis-map05417 |
| 32 | Autophagy-hsa04140 | 71 | Fat digestion and absorption - map04975 |
| 33 | Regulation of lipolysis in adipocytes- hsa04923 | 72 | Vitamin digestion and absorption - map04977 |
| 34 | Cytokine-cytokine receptor interaction-hsa04060 | 73 | Aldosterone synthesis and secretion - map04925 |
| 35 | Proteasome- hsa03050 | 74 | Primary bile acid biosynthesis - map00120 |
| 36 | B cell receptor signaling pathway- hsa04662 | 75 | Cortisol synthesis and secretion - map04927 |
| 37 | Complement and coagulation cascades- hsa04610 | 76 | Bile secretion - map04976 |
| 38 | Toll-like receptor signaling pathway-hsa04620 | 77 | Ovarian steroidogenesis - map04913 |
| 39 | RIG-I-like receptor signaling pathway- hsa04622 | 78 | Steroid biosynthesis - map00100 |
| Gene Name | description | Deg | Bet | Bridg | Cent | Close | EiVe |
|---|---|---|---|---|---|---|---|
| UBC | Ubiquitin C [Source: HGNC Symbol; Acc: HGNC:12468 | + | + | -- | -- | + | + |
| HDAC1 | Histone deacetylase 1 [Source: HGNC Symbol; Acc: HGNC:4852 | + | -- | -- | -- | + | + |
| CTNNB1 | Catenin beta 1 [Source: HGNC Symbol; Acc: HGNC:2514 | + | -- | -- | -- | + | + |
| TRIM28 | Tripartite motif-containing 28 [Source: HGNC Symbol; Acc: HGNC:16384 | -- | + | -- | -- | + | + |
| CSNK2A1 | casein kinase two alpha 1 [Source: HGNC Symbol; Acc: HGNC:2457 | -- | -- | -- | -- | + | + |
| RBBP4 | RB binding protein 4, chromatin remodeling factor [Source: HGNC Symbol; Acc: HGNC:9887 | + | -- | -- | -- | -- | -- |
| TP53 | Tumor protein p53 [Source:HGNC Symbol;Acc:HGNC:11998 | + | -- | -- | -- | -- | -- |
| APP | Amyloid beta precursor protein [Source: HGNC Symbol; Acc: HGNC:620 | -- | + | -- | -- | -- | -- |
| DAB1 | DAB1, reelin adaptor protein [Source: HGNC Symbol; Acc: HGNC:2661 | -- | + | -- | -- | -- | -- |
| PINK1 | PTEN-induced putative kinase 1 [Source: HGNC Symbol; Acc: HGNC:14581 | -- | + | -- | -- | -- | -- |
| RELN | Reelin | literature review + miRNA-gene regulatory network | |||||
| Label | Degree | Betweenness |
|---|---|---|
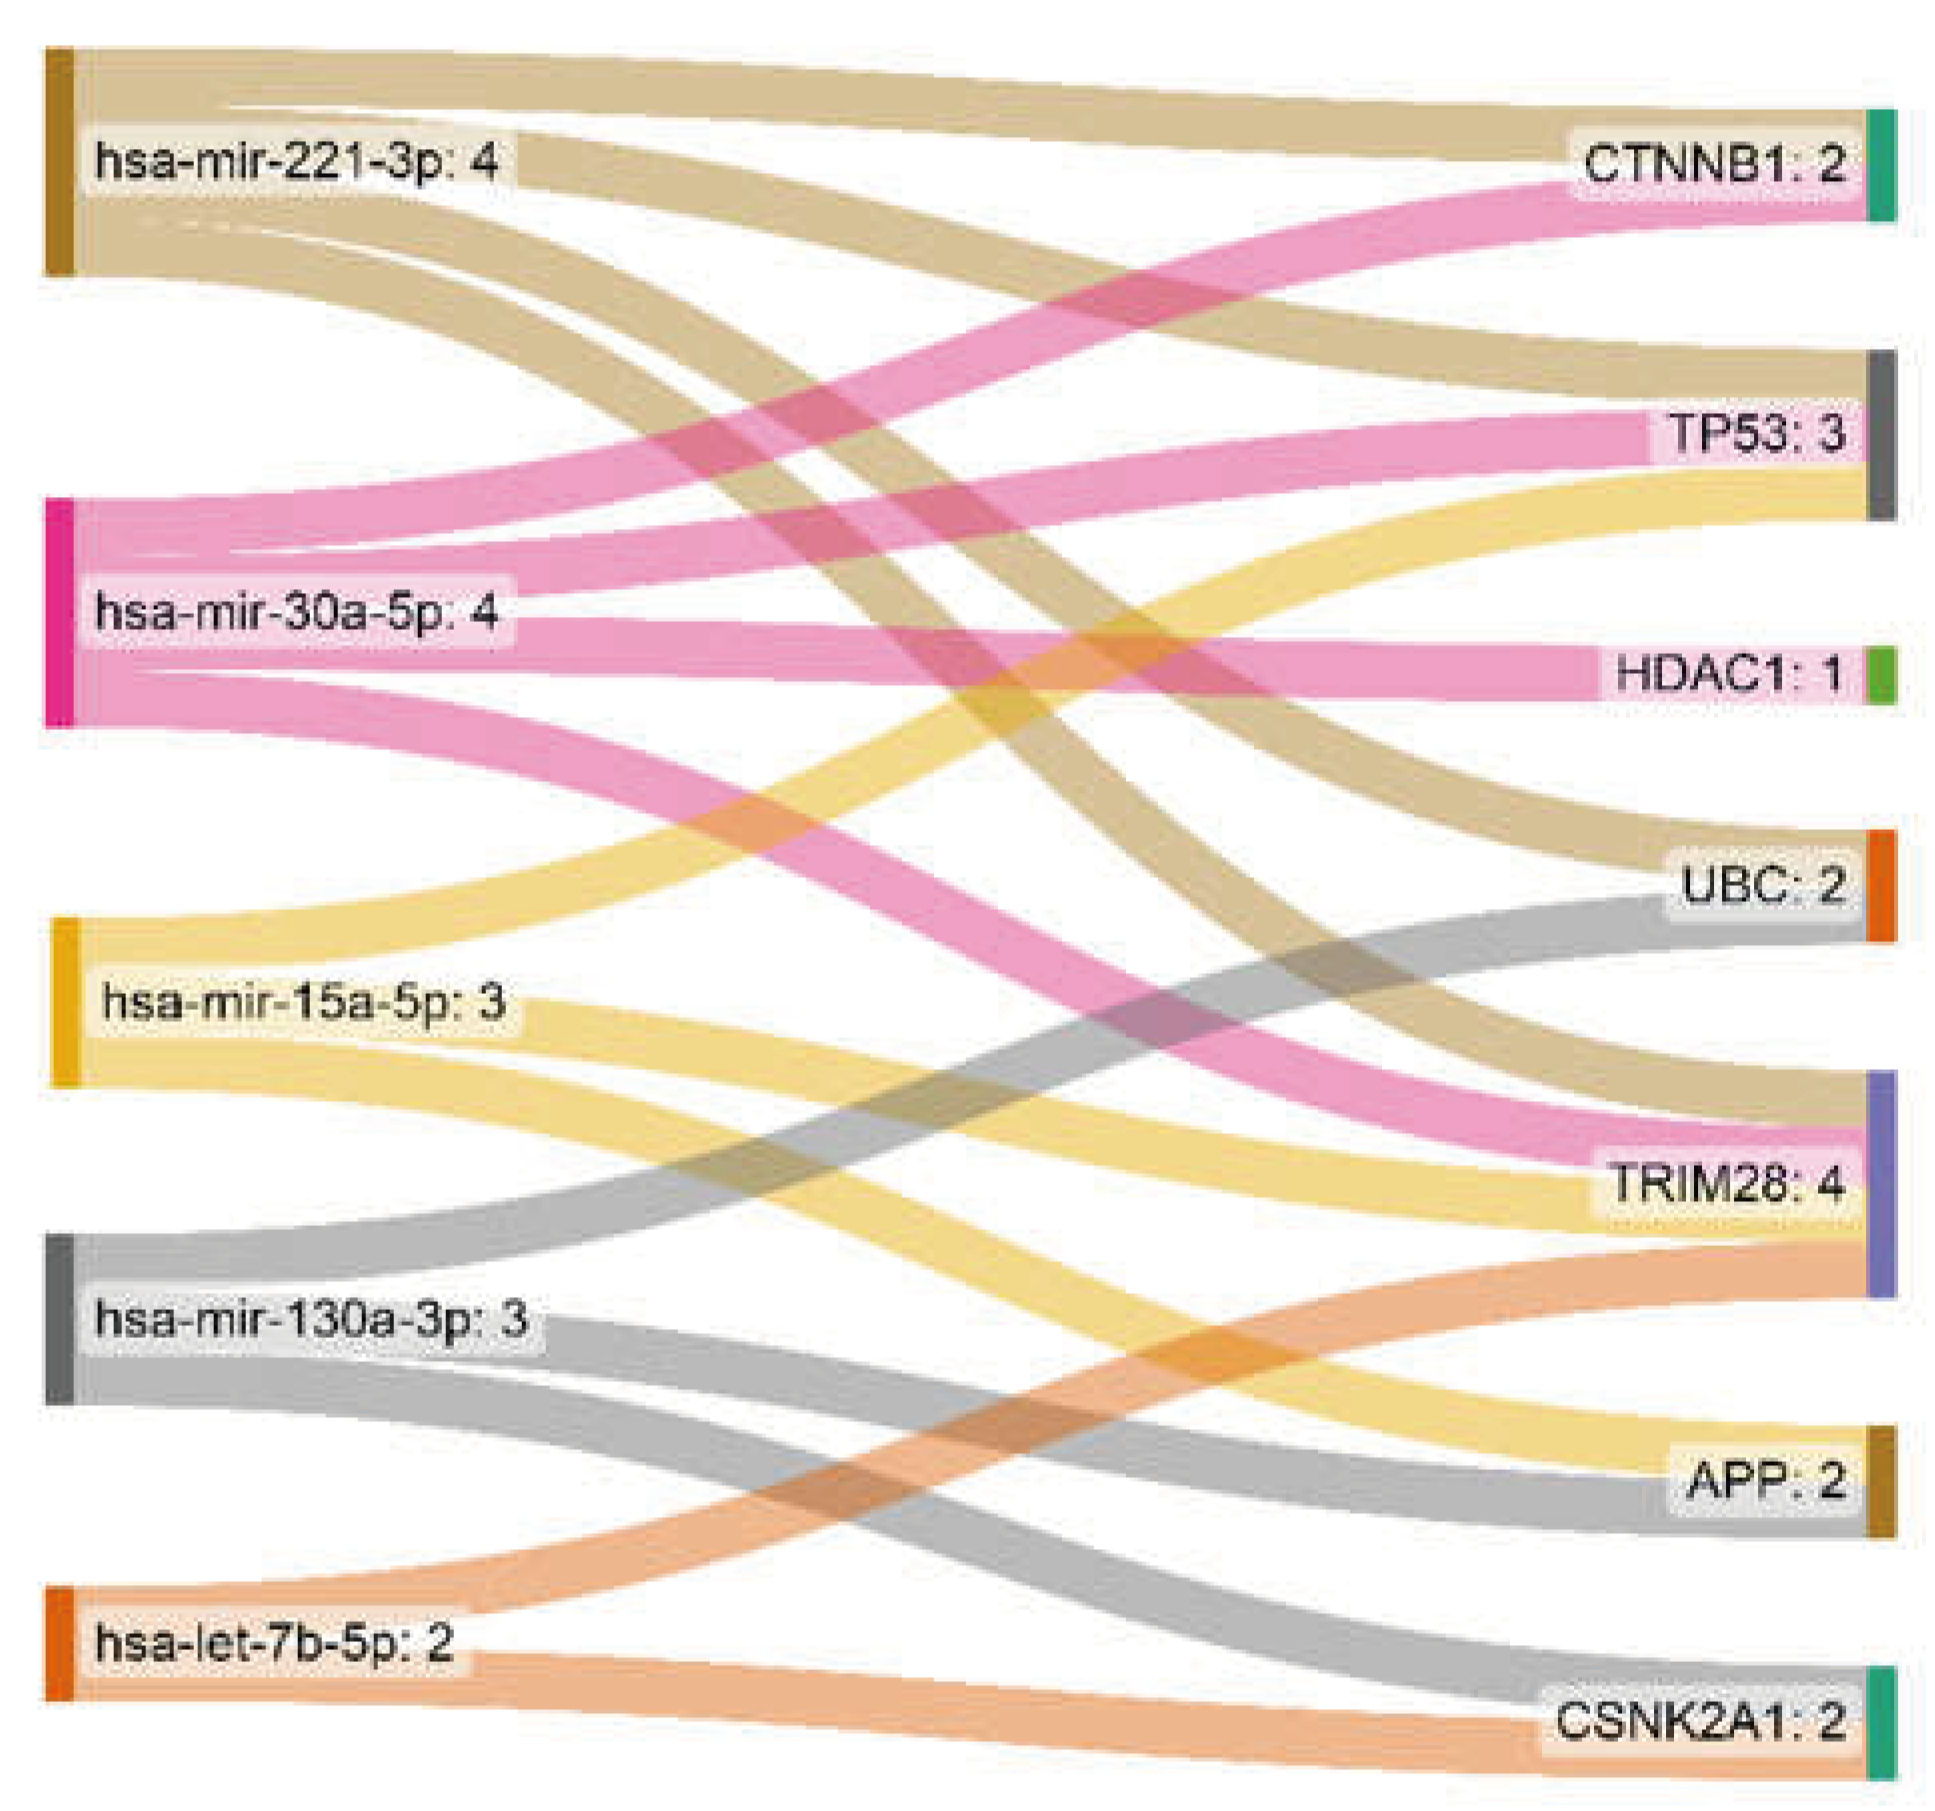
| hsa-mir-221-3p | 4 | 5682.13 |
| hsa-mir-30a-5p | 4 | 2373.43 |
| hsa-mir-15a-5p | 3 | 3710.08 |
| hsa-mir-130a-3p | 3 | 3589.18 |
| hsa-let-7b-5p | 2 | 2523.74 |
| Gene Name | Non- tumor | GBM | Pairwise t-test (GBM-Non-tumor) p.adj (p-value with Bonferroni correction) |
Primary | Secondary | Recurrent |
|---|---|---|---|---|---|---|
| UBC | -- | + | 1.8E-03 | + | -- | -- |
| HDAC 1 | -- | + | 7.8E-18 | + | -- | -- |
| CTNNB1 | -- | + | 6.0E-03 | + | -- | -- |
| TRIM28 | -- | + | 1.1E-03 | + | -- | -- |
| CSNK2A1 | -- | + | 6.9E-01 (ns) | + | -- | -- |
| RBBP4 | -- | + | 3.2E-05 | + | -- | -- |
| TP53 | -- | + | 1.6E-13 | + | -- | -- |
| APP | + | -- | 1.2E-03 | + | -- | -- |
| DAB1 | + | -- | 4.0E-04 | + | -- | -- |
| PINK1 | + | -- | 2.9E-10 | + | -- | -- |
| RELN | + | -- | 5.7E-08 | + | -- | -- |
| Result | Visualization methods | Enrichment method | Topology analysis | Reference metabolome | Pathway library |
|---|---|---|---|---|---|
| 1 | Scatter plot | Hypergeometric test | Relative-betweenness centrality R-b C |
All compounds in the selected pathway library | Homo sapiens (KEGG) |
| 2 | Scatter plot | Hypergeometric test | Out-degree Centrality O-d C |
All combinations in the selected pathway library | Homo sapiens (KEGG) |
| 3 | Scatter plot | Hypergeometric test | Relative-betweenness centrality | All compounds in the selected pathway library | Homo sapiens (SMPDB) |
| 4 | Scatter plot | Hypergeometric test | Out-degree Centrality | All combinations in the selected pathway library | Homo sapiens (SMPDB) |
| KEGG Database | SMPDB Database | ||||||||||
|---|---|---|---|---|---|---|---|---|---|---|---|
| Result 1 | R-b C impact |
FDR | Result 2 | O-d C impact |
FDR | Result 3 | R-b C impact |
FDR | Result 4 | O-d C impact |
FDR |
| Final Decision (FD) | Final Decision (FD) | Final Decision (FD) | Final Decision (FD) | ||||||||
| Nitrogen metabolism | 1 | 0.043213 | Arginine biosynthesis | 0.8125 | 1.90E-07 | Alanine metabolism | 1 | 0.010641 | Malate-aspartate shuttle | 0.63333 | 0.013128 |
| FD: + | FD: -- | FD: + | FD: + | ||||||||
| Phenylalanine, tyrosine, and tryptophan biosynthesis | 1 | 0.12885 | Alanine, aspartate and glutamate metabolism | 0.75 | 1.73E-07 | Trehalose degradation | 0.84211 | 0.18355 | Phosphatidylcholine biosynthesis | 0.56707 | 0.00011577 |
| FD: -- | FD: + | FD: -- | FD: -- | ||||||||
| Synthesis and degradation of ketone bodies | 0.86667 | 0.18716 | Valine, leucine, and isoleucine biosynthesis | 0.75 | 8.82E-05 | Aspartate metabolism | 0.8 | 0.0044894 | Transfer of acetyl groups into mitochondria | 0.54167 | 0.010641 |
| FD: -- | FD: -- | FD: + | FD: -- | ||||||||
| Alanine, aspartate and glutamate metabolism | 0.81732 | 1.73E-07 | Nitrogen metabolism | 0.75 | 0.043213 | Glycerol phosphate shuttle | 0.7619 | 0.3023 | Ammonia recycling | 0.49306 | 0.00011577 |
| FD: + | FD: + | FD: -- | FD: -- | ||||||||
| One-carbon pool by folate | 0.80793 | 0.46957 | Phenylalanine, tyrosine, and tryptophan biosynthesis | 0.75 | 0.12885 | Malate-Aspartate Shuttle | 0.71429 | 0.013128 | Cardiolipin biosynthesis | 0.49057 | 0.013128 |
| FD:-- | FD:-- | FD: + | FD: -- | ||||||||
| Result | Enrichment method | Topology measure | Integration method |
|---|---|---|---|
| 1 | Hypergeometric test | Degree centrality | Combined score |
| 2 | Betweenness centrality | ||
| 3 | Closeness centrality |
| Title | Degree | Betweenness | Closeness |
|---|---|---|---|
| Alanine, aspartate and glutamate metabolism | + | + | -- |
| Citrate cycle (TCA cycle) | + | + | + |
| Arginine biosynthesis | + | + | + |
| Synthesis and degradation of ketone bodies | + | -- | + |
| Pyruvate metabolism | + | -- | + |
| Purine metabolism | + | + | -- |
| Glutathione metabolism | + | + | -- |
| Pyrimidine metabolism | + | + | -- |
| Glycolysis or gluconeogenesis | -- | + | + |
| Enrichment Analysis | Pathway analysis | Joint pathway analysis | ||
|---|---|---|---|---|
| Eleven Genes | Five miRNAs | 182 Metabolites | ||
| Mitophagy | Fatty acid biosynthesis | Aminoacyl-tRNA biosynthesis | Nitrogen metabolism | Citrate cycle (TCA cycle) |
| Wnt signaling pathway | Galactose metabolism | Arginine biosynthesis | Alanine, aspartate and glutamate metabolism | Arginine biosynthesis |
| Mucin-type O-glycan biosynthesis | Alanine, aspartate and glutamate metabolism | Malate-aspartate shuttle | ||
| Autophagy | Glutamate metabolism | |||
| Urea cycle | ||||
| Arginine and proline metabolism | ||||
| Metabolite | SNP |
|---|---|
| HDL | rs111929233, rs7298751 |
| N6-acetyllysine | rs12602273, rs12603869, rs12945970, rs12947788, rs12949655, rs12951053, rs1642782, rs17881556, rs1794284, rs2078486, rs5819163 |
| Cholesterol | rs35608584, rs111929233 |
| Formate | rs17520463 |
| N, N-Dimethylglycine/Xylose | rs41450451 |
| X2.piperidinone | rs75787097, rs75524270, rs79232054, rs145435197, rs74901488, rs117235978 |
Disclaimer/Publisher’s Note: The statements, opinions and data contained in all publications are solely those of the individual author(s) and contributor(s) and not of MDPI and/or the editor(s). MDPI and/or the editor(s) disclaim responsibility for any injury to people or property resulting from any ideas, methods, instructions or products referred to in the content. |
© 2023 by the authors. Licensee MDPI, Basel, Switzerland. This article is an open access article distributed under the terms and conditions of the Creative Commons Attribution (CC BY) license (http://creativecommons.org/licenses/by/4.0/).


