Submitted:
20 March 2023
Posted:
21 March 2023
You are already at the latest version
Abstract
Keywords:
1. Introduction
2. Experimental
2.1. Preparation of MnO2
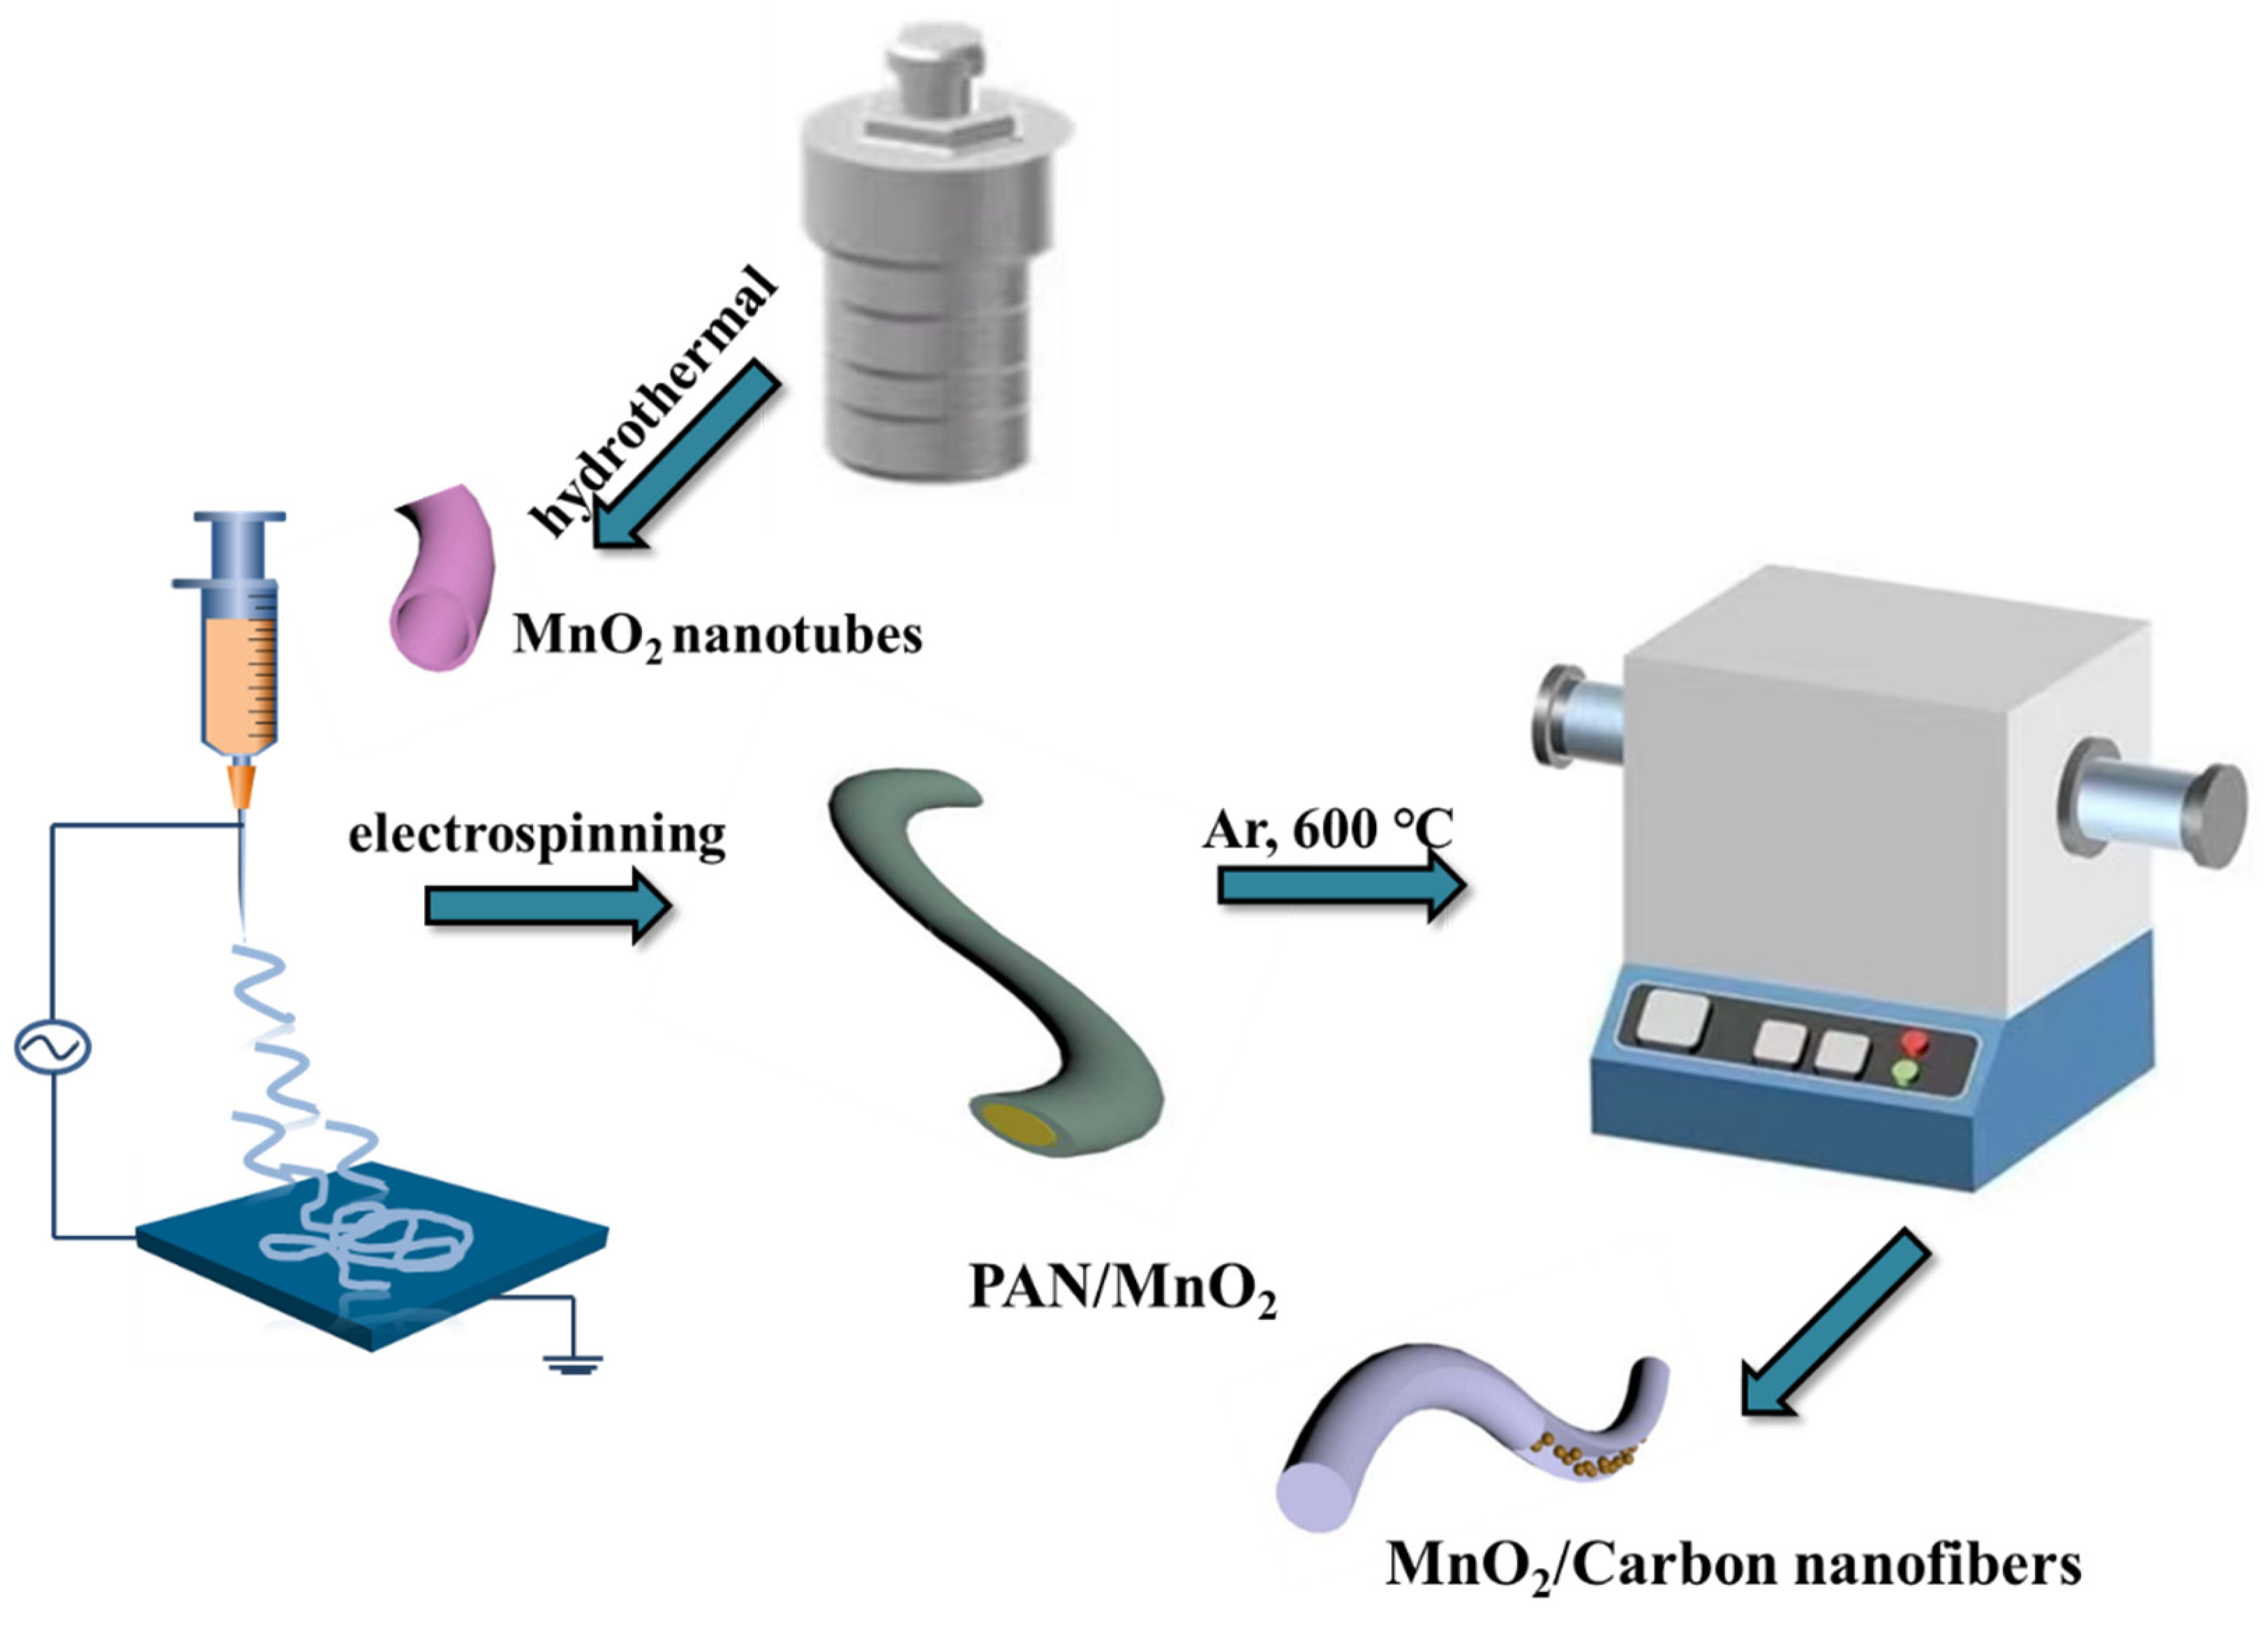
2.2. Preparation of MnO2 NTs
2.3. Preparation of MnO2 Nanofibers (NFs)
2.4. Preparation of MnO2 /CNFs
2.5. Materials Characterization
3. Results and Discussion
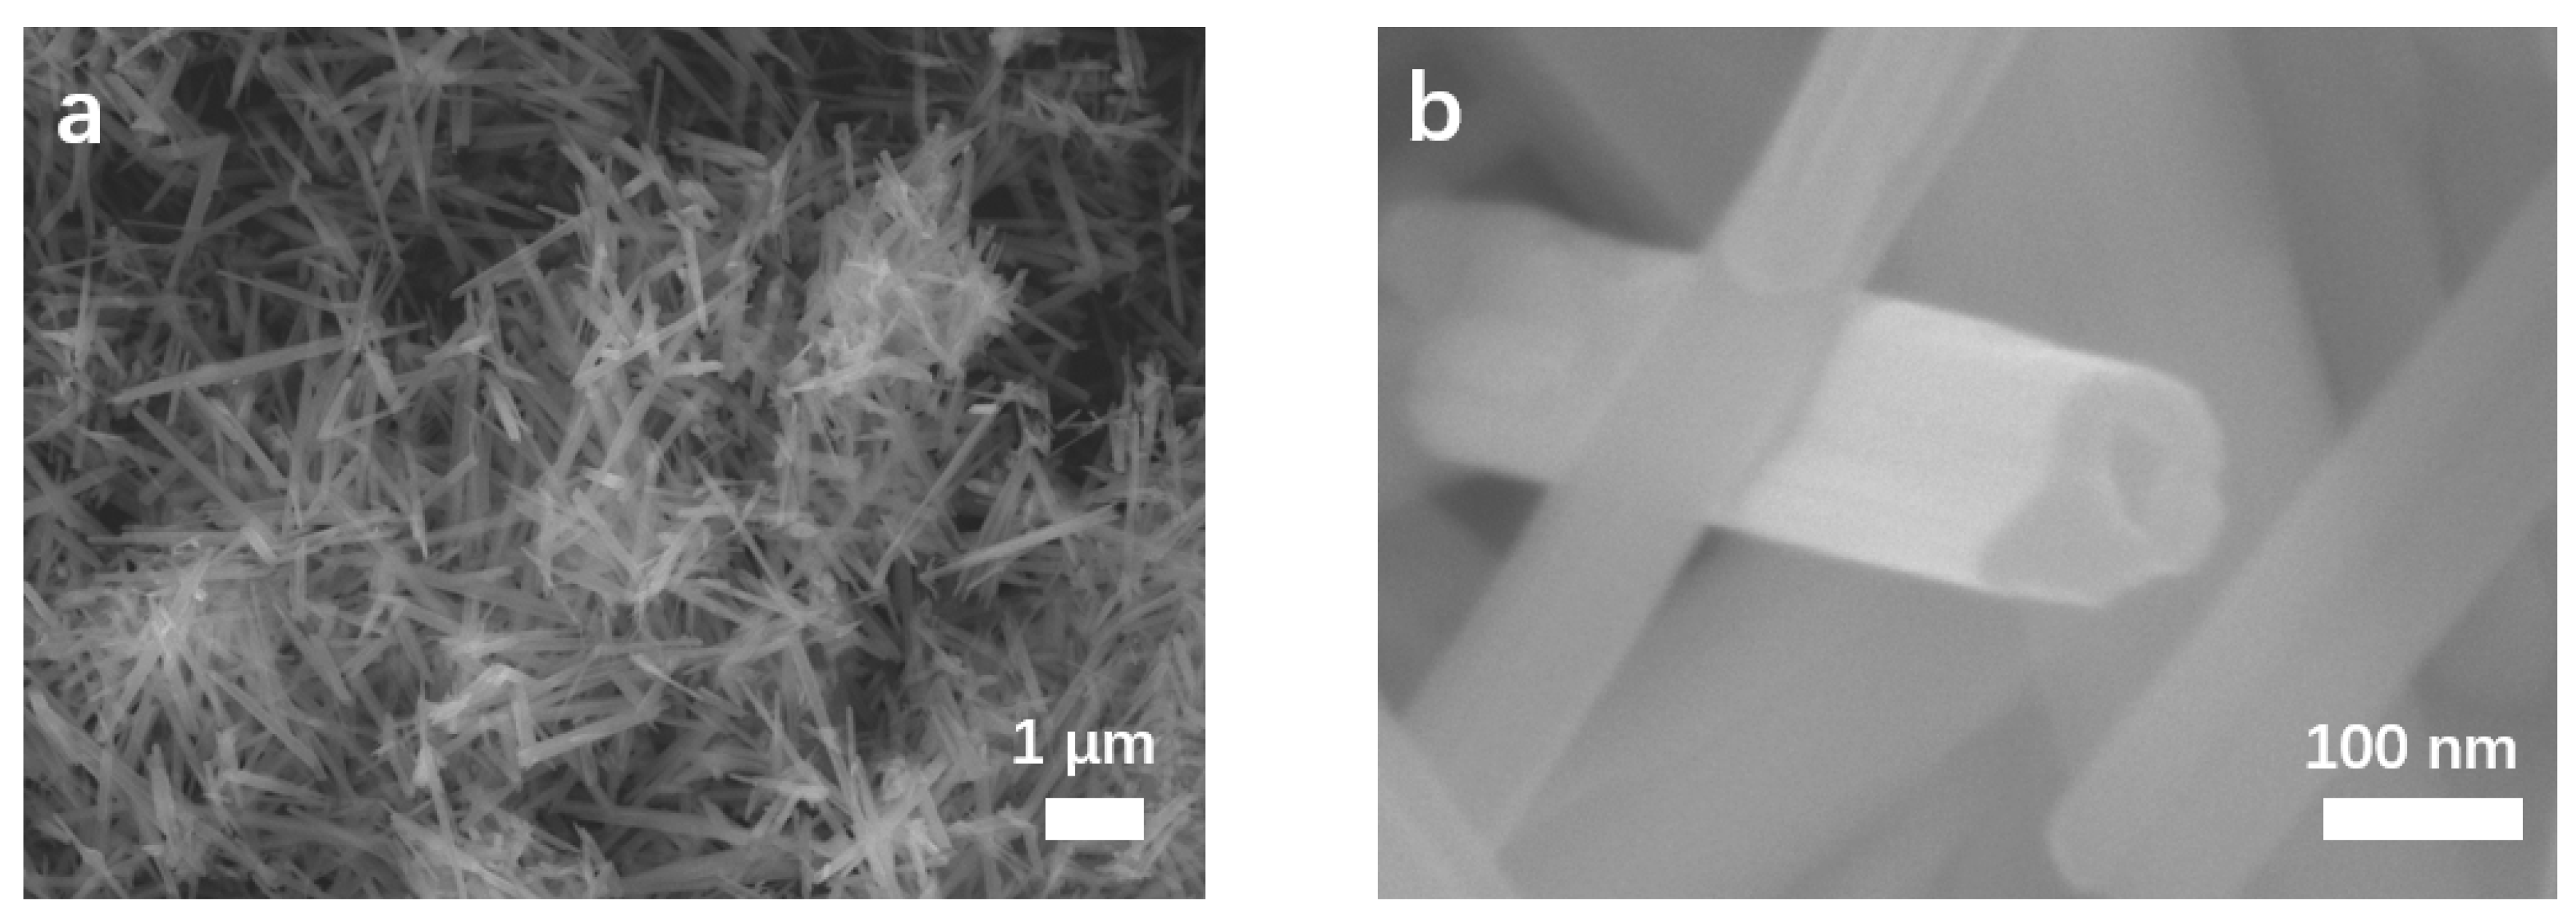
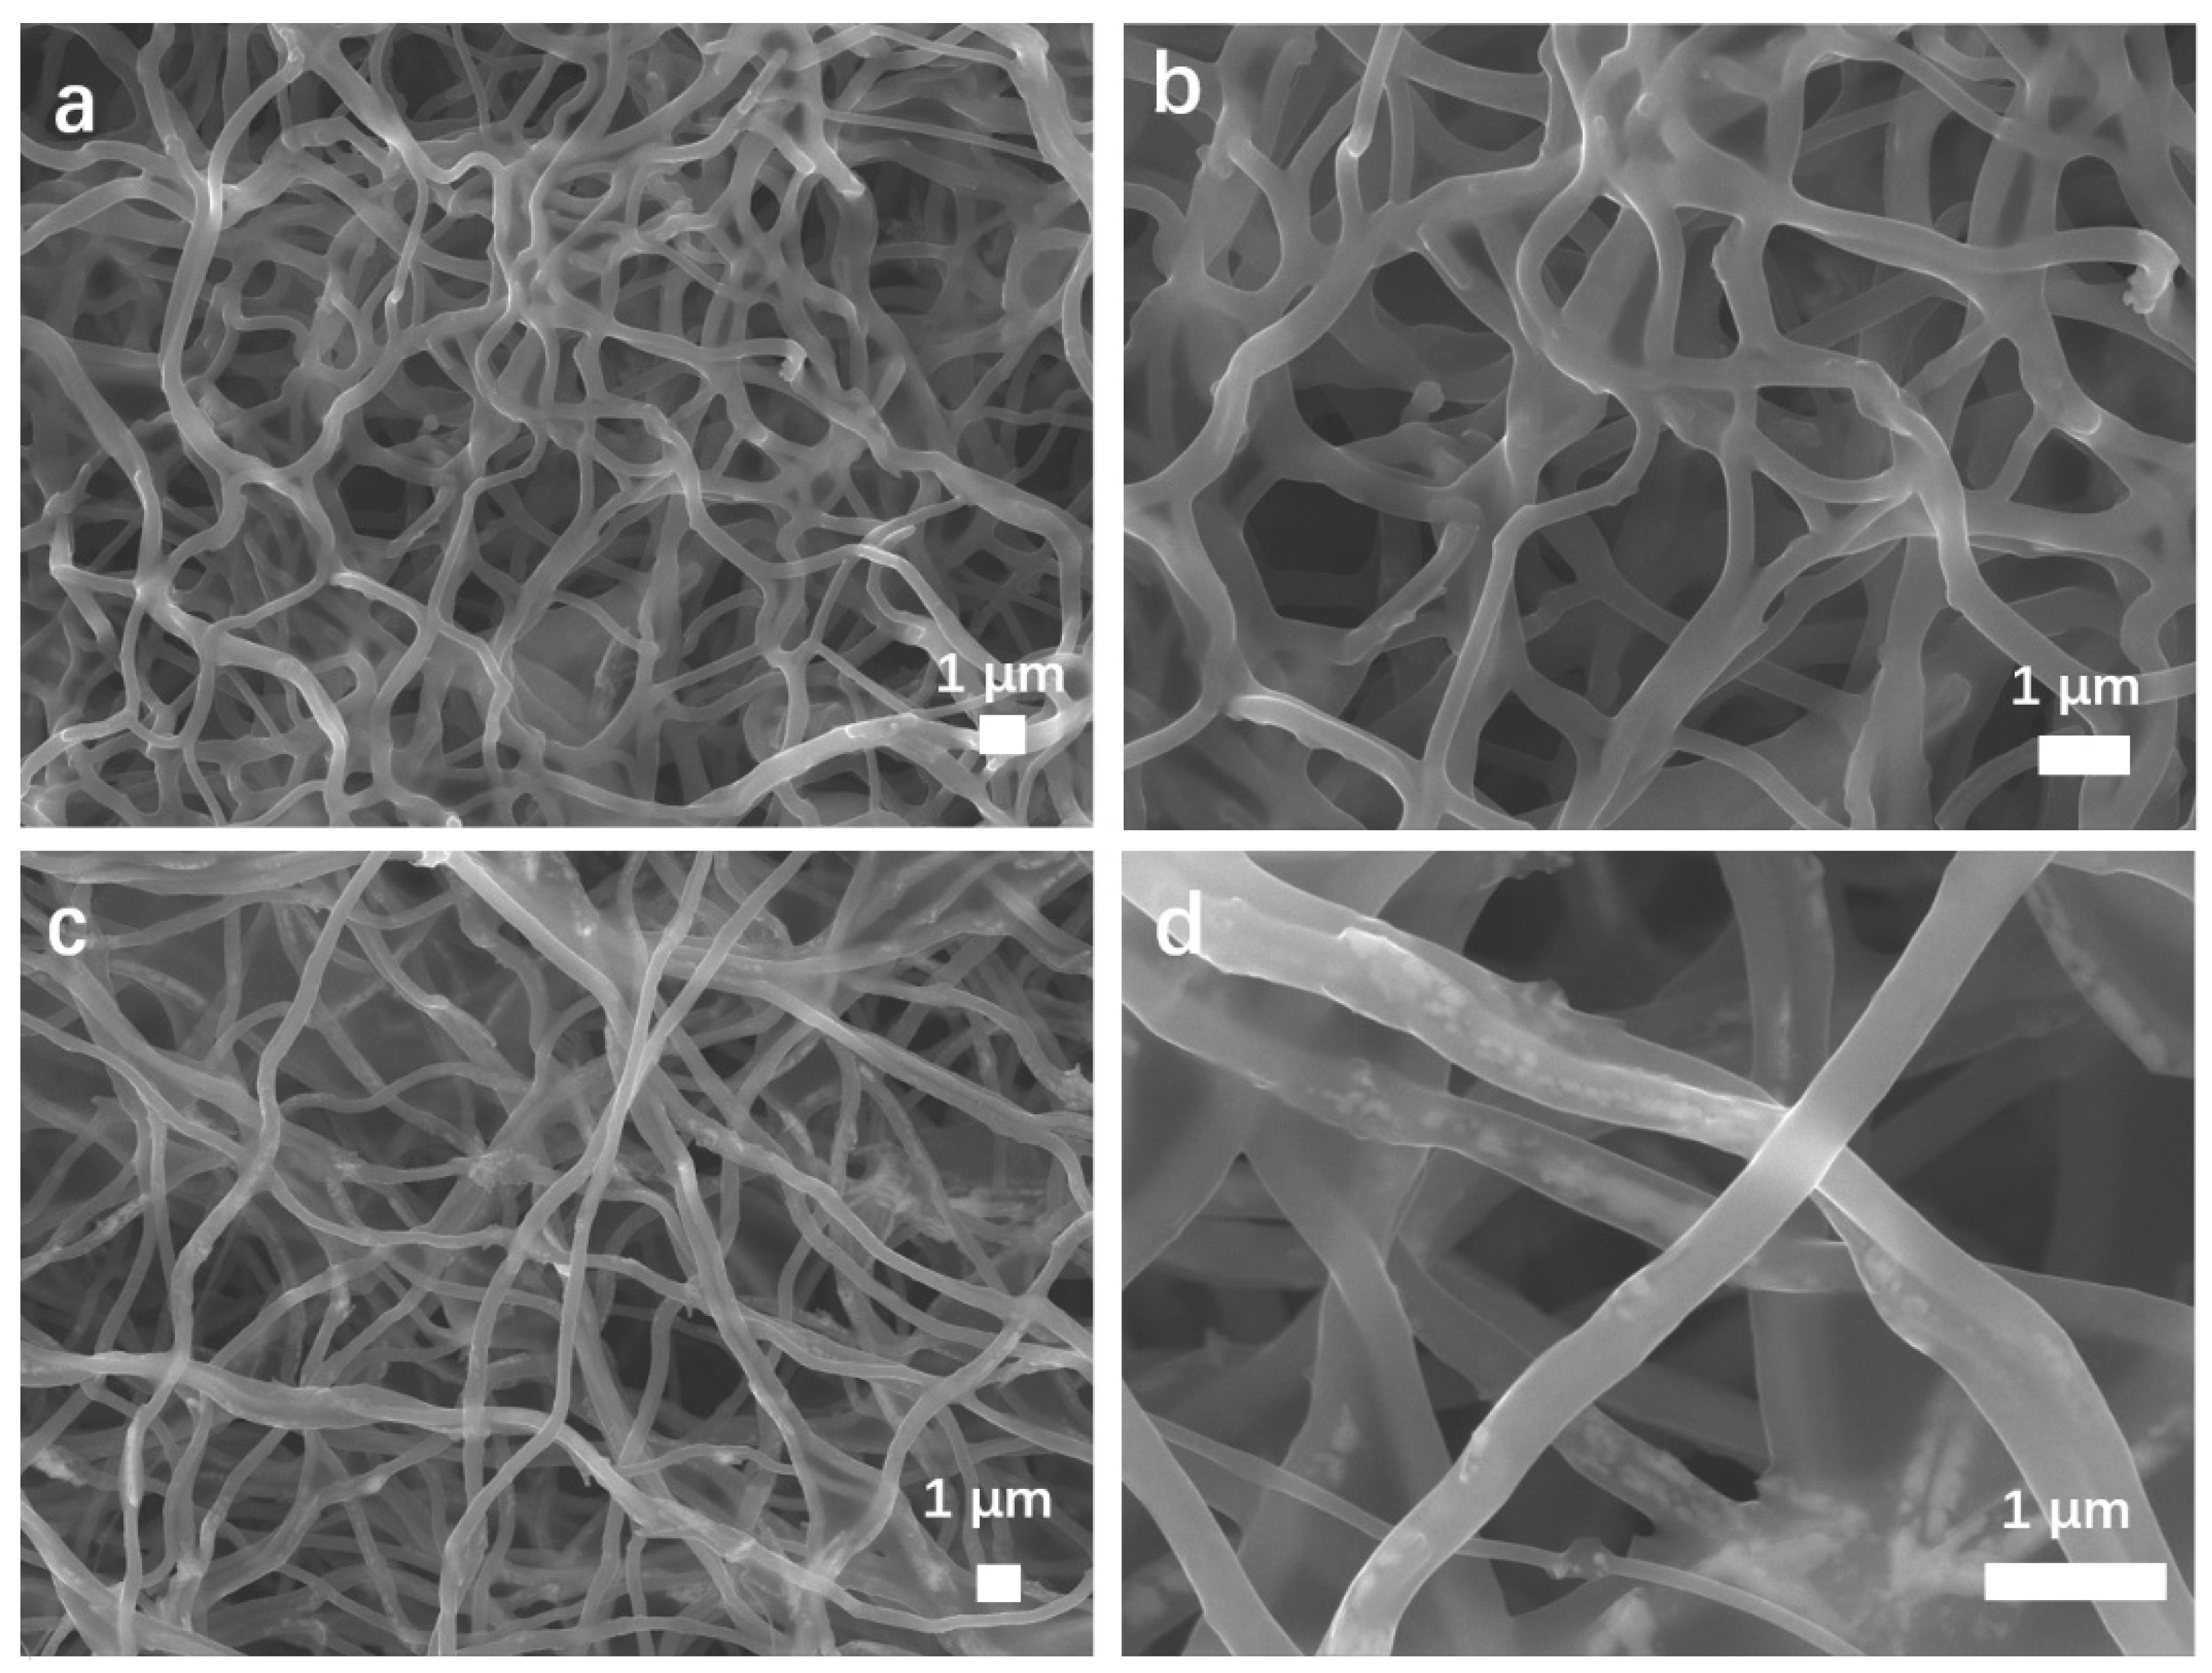
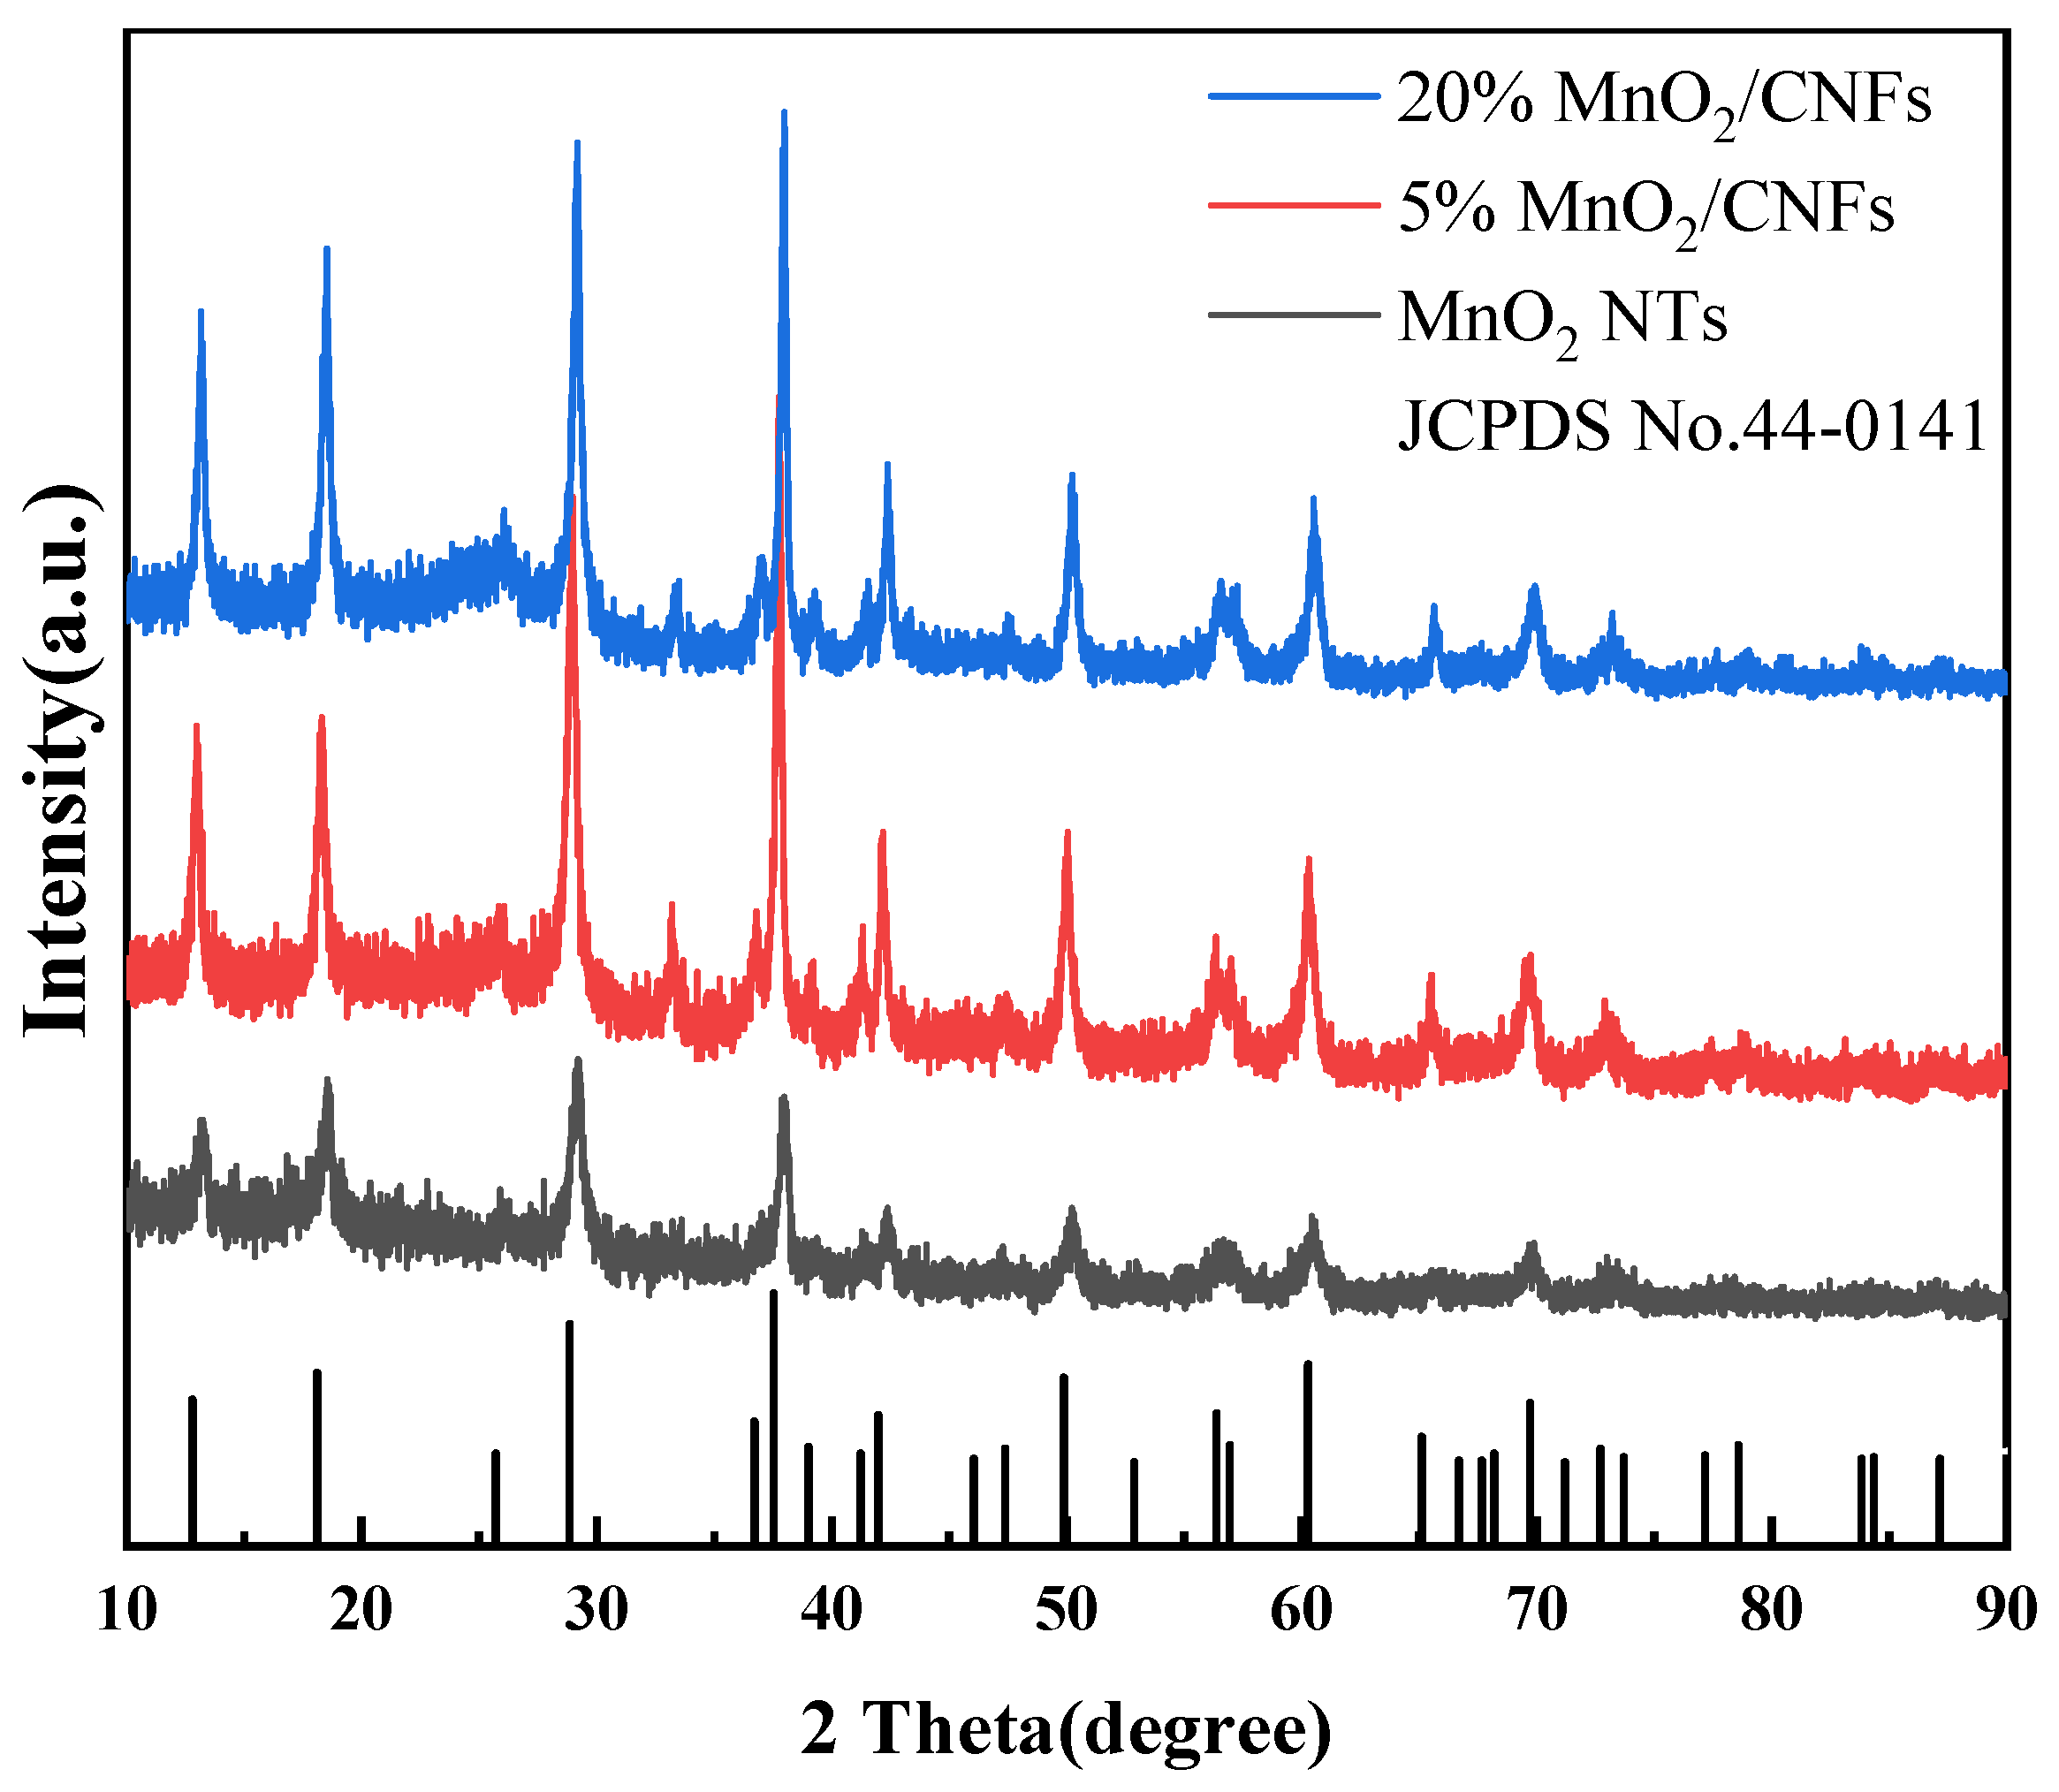
3.1. Morphology and Structure
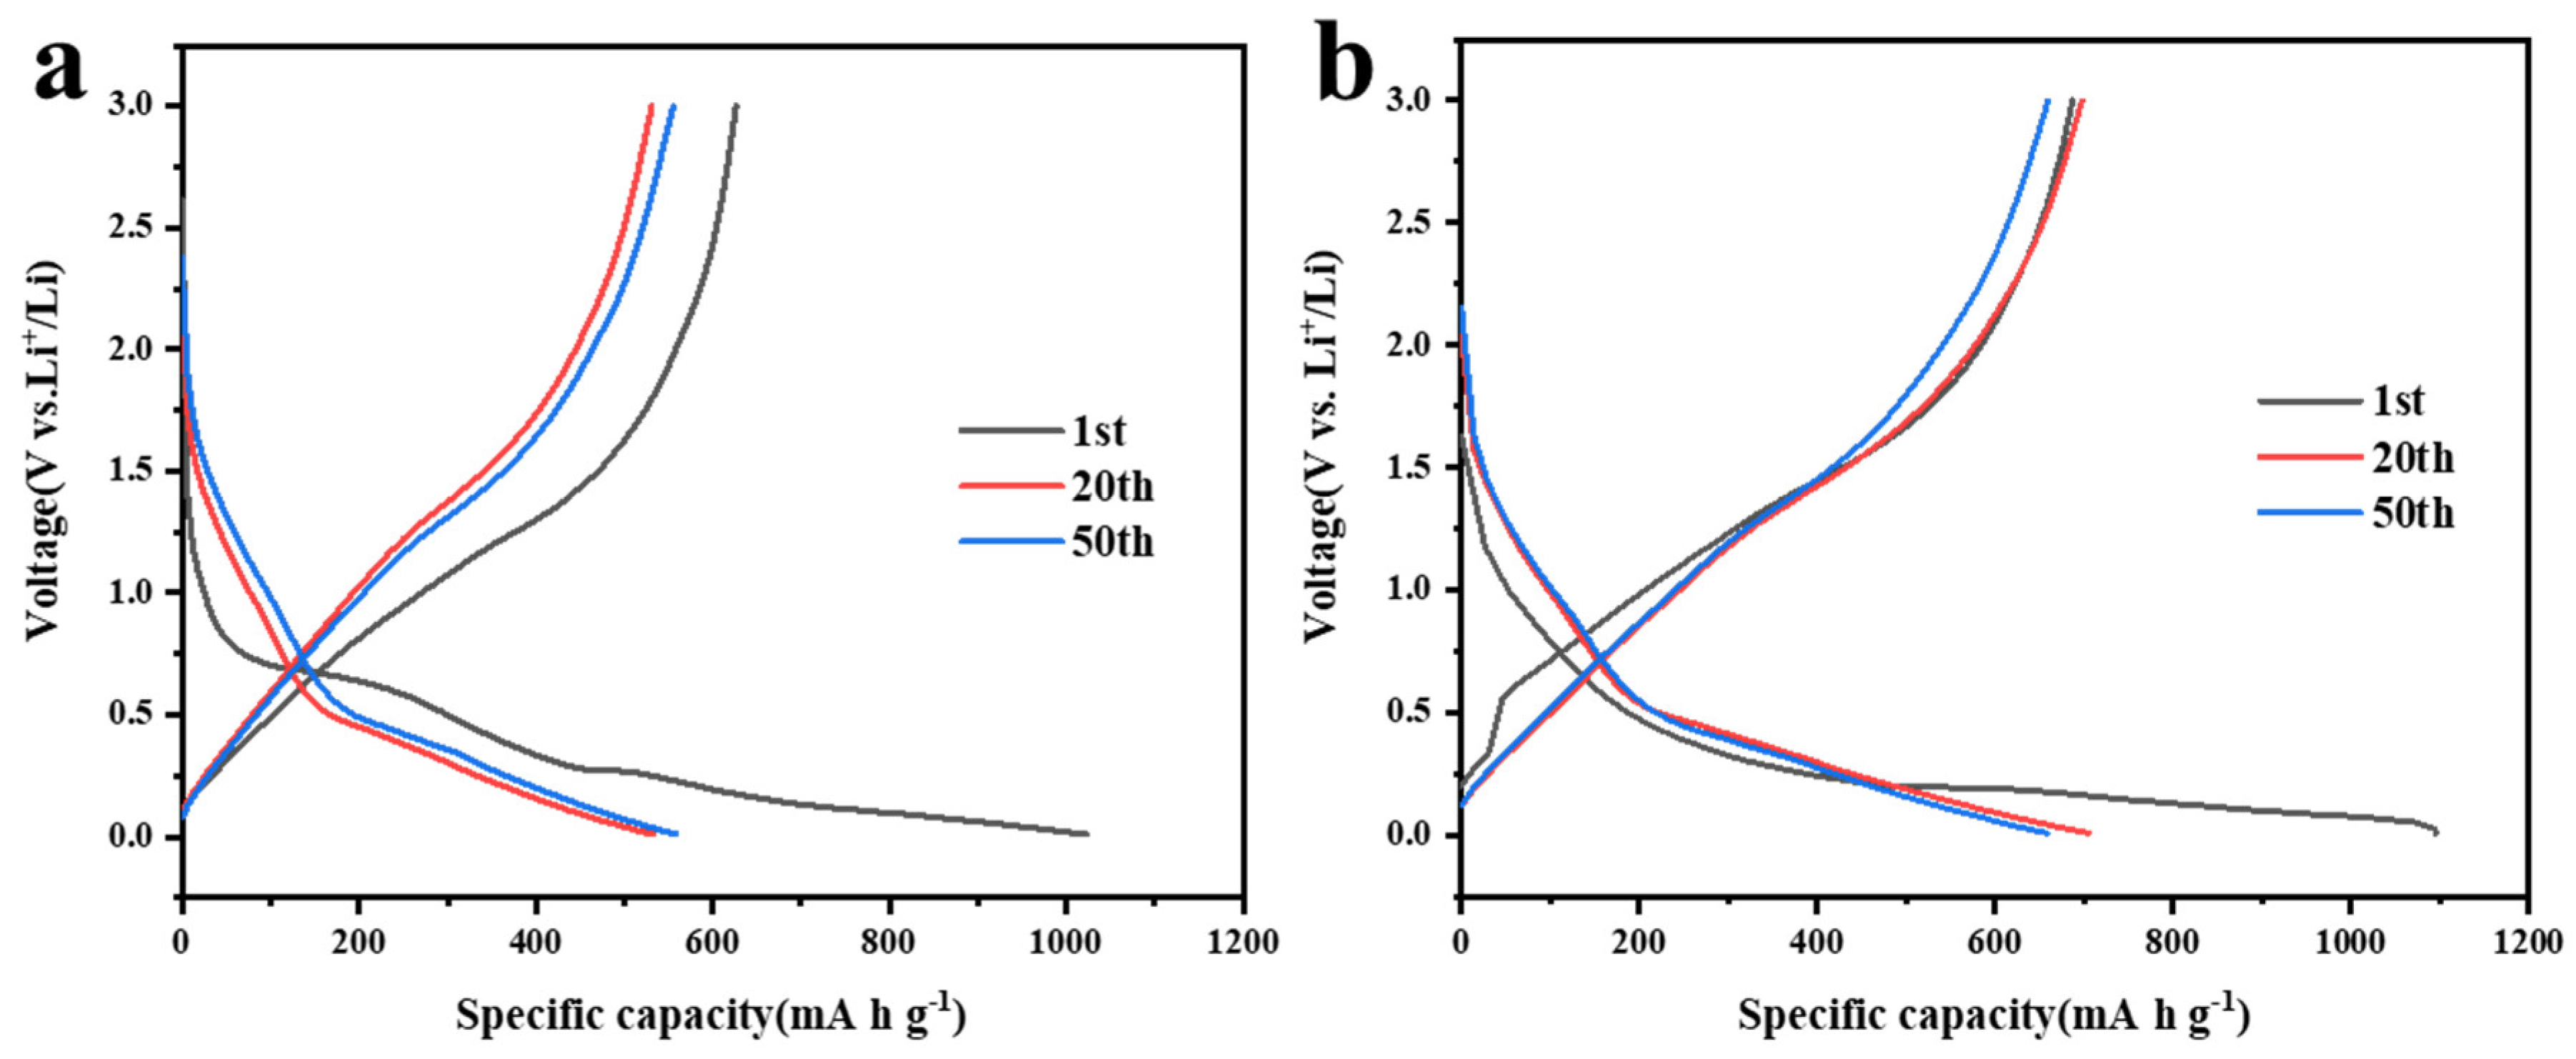
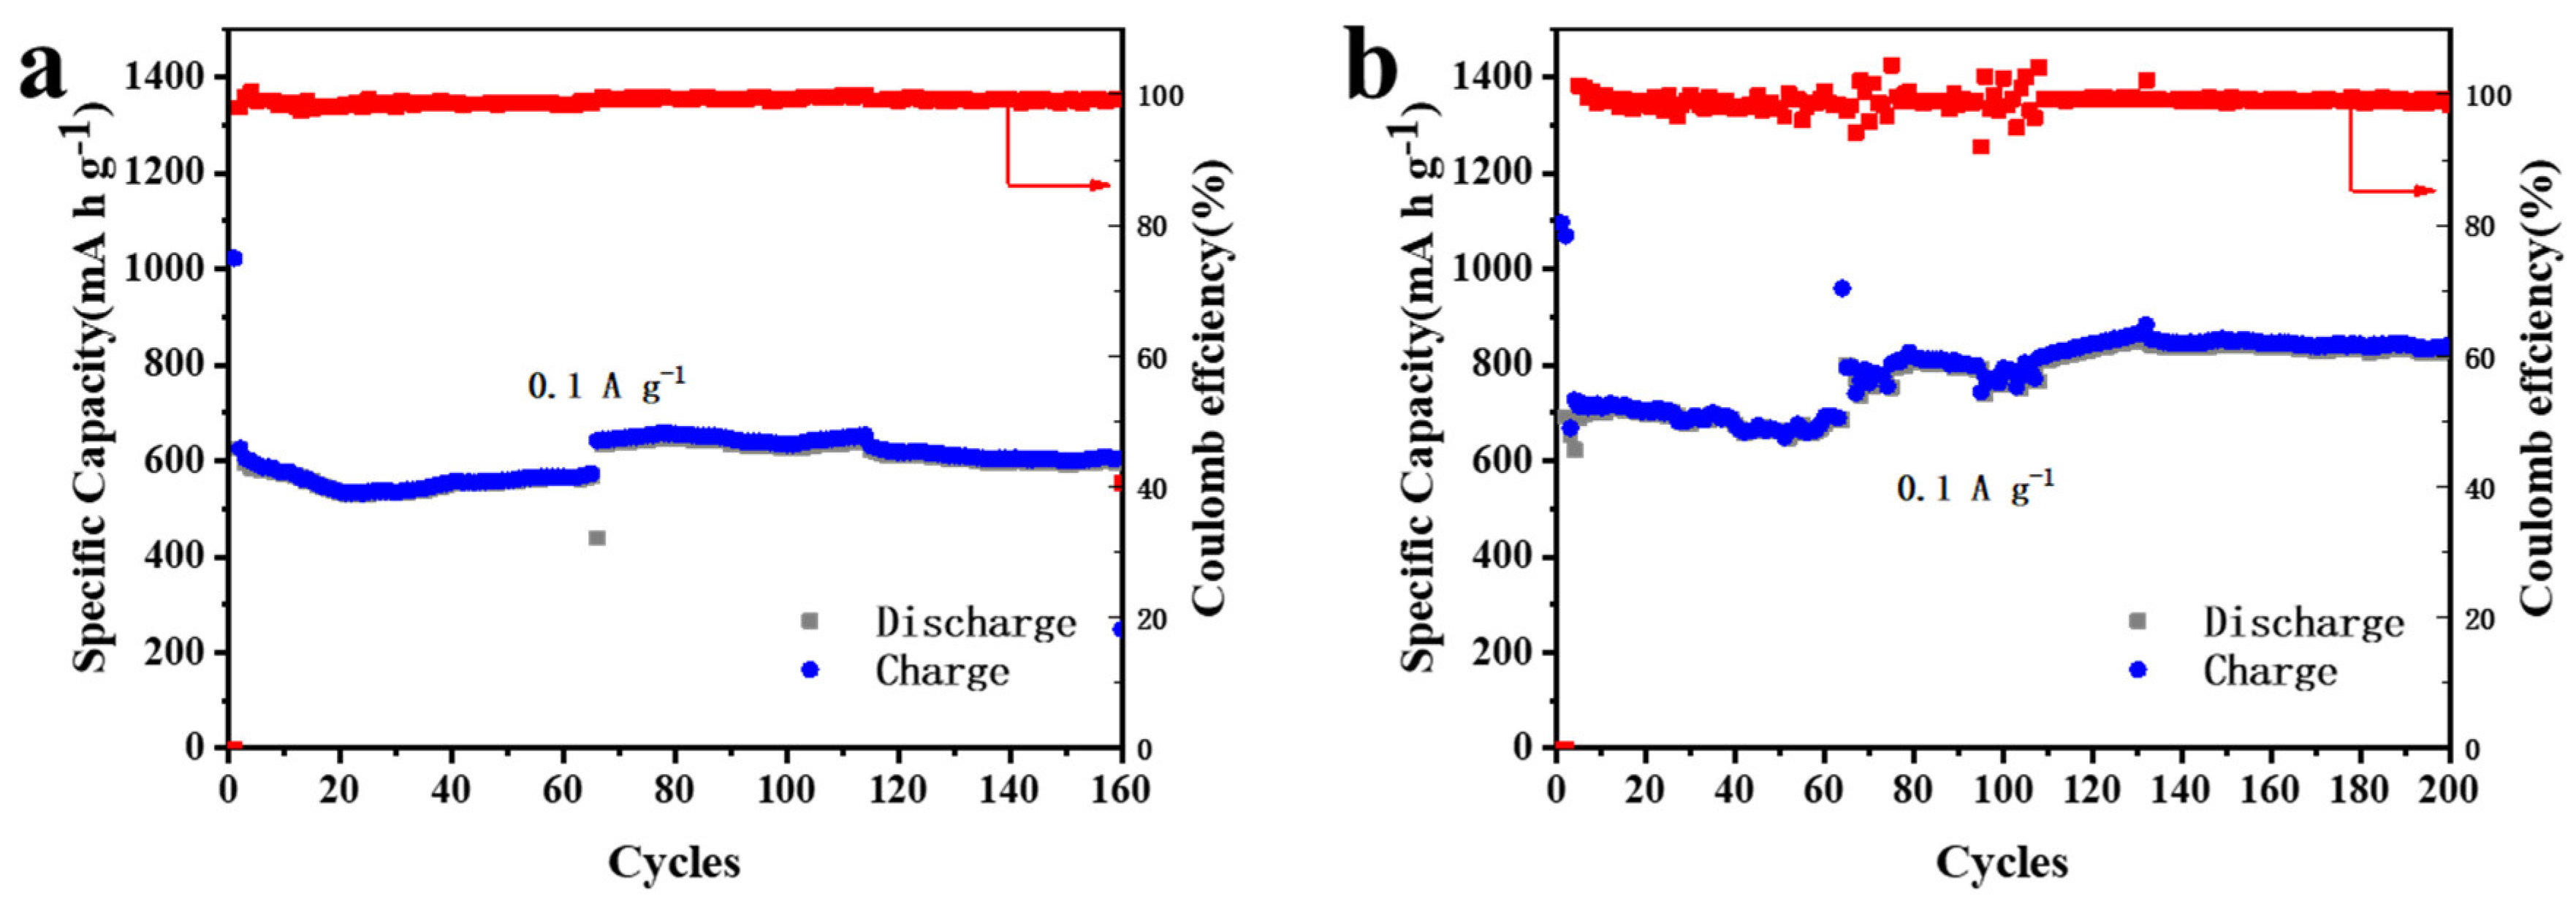
3.2. Electrochemical Performance
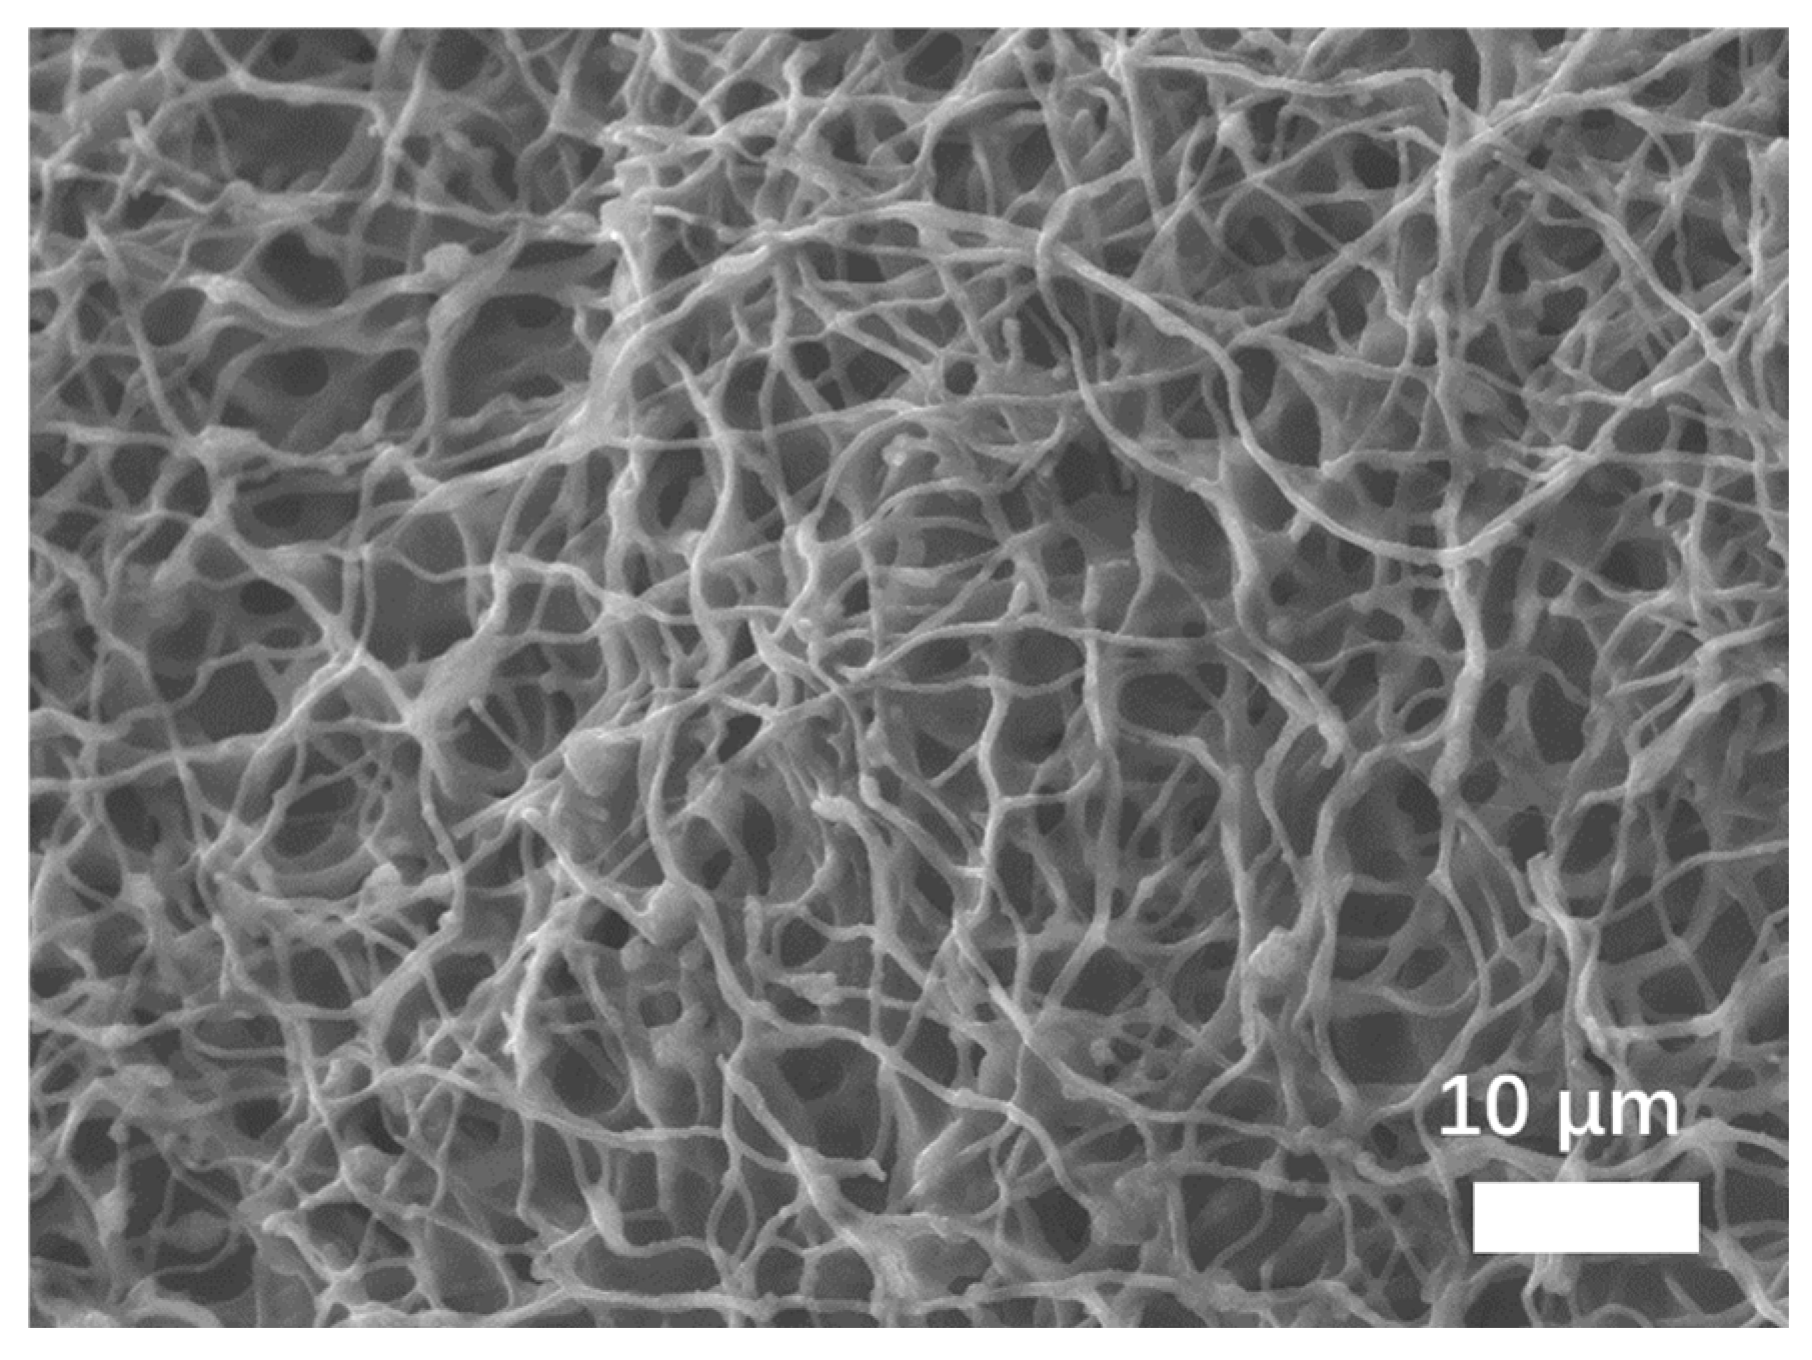
3.3. Analysis of Electrode Structure after Circulation
4. Conclusions
Acknowledgments
Conflicts of Interest
References
- Takeuchi; E.S.; Takeuchi; K.J.; Marschilok, A.C. The Ongoing Importance of Lithium Primary Batteries: 50+ Years and Going Strong. ECS Meet. Abstr. 2022, MA2022-02, 102.
- Zheng, Y.; Yao, Y.; Ou, J.; Li, M.; Luo, D.; Dou, H.; Li, Z.; Amine, K.; Yu, A.; Chen, Z. A review of composite solid-state electrolytes for lithium batteries: Fundamentals, key materials and advanced structures. Chem. Soc. Rev. 2020, 49, 8790–8839. [Google Scholar] [CrossRef] [PubMed]
- Zeng, X.; Li, M.; El-Hady, D.A.; Alshitari, W.; Al-Bogami, A.S.; Lu, J.; Amine, K. Commercialization of lithium battery technologies for electric vehicles. Adv. Energy Mater. 2019, 9, 1900161. [Google Scholar] [CrossRef]
- Evarts, E.C. Lithium batteries: To the limits of lithium. Nature 2015, 526, S93–S95. [Google Scholar] [CrossRef]
- Y. ; Chen; W.; Lei; T.; Jiao; Y.; Huang; J.; Hu; A.; Gong; C.; Yan; C.; Wang; X.; Xiong, J. Strategies toward high-loading lithium–sulfur battery. Adv. Energy Mater. 2020, 10, 2000082. [Google Scholar] [CrossRef]
- Roselin, L.S.; Juang, R.-S.; Hsieh, C.-T.; Sagadevan, S.; Umar, A.; Selvin, R.; Hegazy, H.H. Recent Advances and Perspectives of Carbon-Based Nanostructures as Anode Materials for Li-ion Batteries. Materials 2019, 12, 1229.
- X. ; Zhang; M.; Yuan; S.; Lu, C. Research Progress of Silicon/Carbon Anode Materials for Lithium-Ion Batteries: Structure Design and Synthesis Method. ChemElectroChem 2020, 7, 4289–4302. [Google Scholar] [CrossRef]
- Y. ; Chen, J. Prospects of organic electrode materials for practical lithium batteries. Nat. Rev. Chem. 2020, 4, 127–142. [Google Scholar] [CrossRef]
- Luo; J. ; Peng; J.; Zeng; P.; Wu; Z.; Li; J.; Li; W.; Huang; Y.; Chang; B.; Wang, X. TiNb2O7 nano-particle decorated carbon cloth as flexible self-support anode material in lithium-ion batteries. Electrochim. Acta 2019, 332, 135469. [Google Scholar]
- Kim; H. ; Choi; W.; Yoon; J.; Lee; E.; Yoon, W.S. Polymorphic Effects on Electrochemical Performance of Conversion-Based MnO2 Anode Materials for Next-Generation Li Batteries. Small 2021, 17, 2006433. [Google Scholar] [CrossRef]
- C. ; Li; C.; Tang; H.; Liu; T.; Tang, Z. Binder-free flexible Li2ZnTi3O8@MWCNTs stereoscopic network as lightweight and superior rate performance anode for lithium-ion batteries. J. Alloy. Compd. 2019, 816, 152580. [Google Scholar]
- Chen; Y. ; Yuan; X.; Yang; C.; Lian; Y.; Razzaq; A.A.; Shah; R.; Guo; J.; Zhao; X.; Peng; Y.; Deng, Z. γ-Fe2O3 nanoparticles embedded in porous carbon fibers as binder-free anodes for high-performance lithium and sodium ion batteries. J. Alloy. Compd. 2019, 777, 127–134. [Google Scholar] [CrossRef]
- Narsimulu; D. ; Nagaraju; G.; Sekhar; S.C.; Ramulu; B.; Yu, J.S. Three-dimensional porous SnO2/carbon cloth electrodes for high-performance lithium-and sodium-ion batteries. Appl. Surf. Sci. 2021, 538, 148033. [Google Scholar] [CrossRef]
- Tang; C. ; Zhang; H.; Jiao; D.; Hu; R.; Liu, Z. Hierarchical C-doped CuO nanorods on carbon cloth as flexible binder-free anode for lithium storage. Mater. Des. 2019, 162, 52–59. [Google Scholar] [CrossRef]
- Wang; D. ; Wang; Y.; Li; Q.; Guo; W.; Zhang; F.; Niu, Urchin-like α-Fe2O3/MnO2 hierarchical hollow composite microspheres as lithium-ion battery anodes. J. Power Sources 2018, 393, 186–192. [Google Scholar] [CrossRef]
- Wang; S. -G.; Lin; J.; Fan; C.-Y.; Li; Y.-F.; Zhang; J.-P.; Wu; X.-L.; Sun; H.-Z.; Deng; M.-X.; Su, Z.-M. Target encapsulating NiMoO4 nanocrystals into 1D carbon nanofibers as free-standing anode material for lithium-ion batteries with enhanced cycle performance. J. Alloy. Compd. 2020, 830, 154648. [Google Scholar] [CrossRef]
- T. -F.; Peng; P.-P.; Han; X.; Zhu; Y.-R.; Luo, S. Interconnected Co3O4@CoNiO2@PPy nanorod and nanosheet composite grown on nickel foam as binder-free electrodes for Li-ion batteries. Solid State Ion. 2019, 329, 131–139. [Google Scholar] [CrossRef]
- Tyagi; A.; Banerjee; S.; Cherusseri; J.; Kar, K.K. Characteristics of transition metal oxides. In Handbook of Nanocomposite Supercapacitor Materials I; Springer: 2020; pp. 91–123.
- X. ; Yue; J.; Li; L.; Xue; H.; Yang; J.; Zhao, X. General Synthesis of MnOx (MnO2, Mn2O3, Mn3O4, MnO) Hierarchical Microspheres as Lithium-ion Battery Anodes. Electrochim. Acta 2015, 184, 250–256. [Google Scholar] [CrossRef]
- J. Y.; Ji; S.; Unithrattil; S.; Lee; S.S.; Kim; Y.; Jung; H.-K.; Kang; Im, B.; W.; Choi, S. Rational design of electrochemically active polymorphic MnOx/rGO composites for Li+-rechargeable battery electrodes. Ceram. Int. 2019, 45, 9522–9528. [Google Scholar] [CrossRef]
- Yadav, M.S. Synthesis and characterization of Mn2O3−Mn3O4 nanoparticles and activated charcoal based nanocomposite for supercapacitor electrode application. J. Energy Storage 2020, 27, 101079. [Google Scholar] [CrossRef]
- Bhatt; M. D.; Lee, J.Y. High capacity conversion anodes in Li-ion batteries: A review. Int. J. Hydrog. Energy 2019, 44, 10852–10905. [Google Scholar] [CrossRef]
- Chen; M. ; Wang; E.; Liu; Q.; Guo; X.; Chen; W.; Chou; S.-L.; Dou, S.-X. Recent progress on iron- and manganese-based anodes for sodium-ion and potassium-ion batteries. Energy Storage Mater. 2019, 19, 163–178. [Google Scholar] [CrossRef]
- Bach-Toledo; L. ; Hryniewicz; B.M.; Marchesi; L.F.; Dall'Antonia; L.H.; Vidotti; M.; Wolfart, F. Conducting polymers and composites nanowires for energy devices: A brief review. Mater. Sci. Energy Technol. 2019, 3, 78–90. [Google Scholar]
- Jia; B. ; Chen; W.; Luo; J.; Yang; Z.; Li; L.; Guo, L. Construction of MnO2 Artificial Leaf with Atomic Thickness as Highly Stable Battery Anodes. Adv. Mater. 2019, 32, 1906582. [Google Scholar]
- Voskanyan; A. A.; Ho; C.-K.; Chan, K.Y. 3D δ-MnO2 nanostructure with ultralarge mesopores as high-performance lithium-ion battery anode fabricated via colloidal solution combustion synthesis. J. Power Sources 2019, 421, 162–168. [Google Scholar] [CrossRef]
- Abdah; M. A.A.M.; Mokhtar; M.; Khoon; L.T.; Sopian; K.; Dzulkurnain; N.A.; Ahmad; A.; Sulaiman; Y.; Bella; F.; Su’ait, M.S. Synthesis and electrochemical characterizations of poly (3, 4-ethylenedioxythiophene/manganese oxide coated on porous carbon nanofibers as a potential anode for lithium-ion batteries. Energy Rep. 2021, 7, 8677–8687. [Google Scholar]
- Magu; T. O.; Agobi; A.U.; Hitler; L.; Dass, P.M. A Review on Conducting Polymers-Based Composites for Energy Storage Application. J. Chem. Rev. 2019, 1, 19–34. [Google Scholar] [CrossRef]
- Sui; Y. ; Liu; C.; Zou; P.; Zhan; H.; Cui; Y.; Yang; C.; Cao, G. Polypyrrole coated δ-MnO 2 nanosheet arrays as a highly stable lithium-ion-storage anode. Dalton Trans. 2020, 49, 7903–7913. [Google Scholar] [CrossRef]
- Lin, Y.; Zhang, L.; Xiao, J.; Liu, H. MnO/C cubo-polyhedrons derived from α-MnO 2@ ZIF-8 as anode materials for high-performance lithium-ion batteries. Sustain. Energy Fuels 2020, 4, 633–642. [Google Scholar] [CrossRef]
- Cao, Z.; Yang, Y.; Qin, J.; Su, Z. A core-shell porous MnO2/Carbon nanosphere composite as the anode of lithium-ion batteries. J. Power Sources 2021, 491, 229577. [Google Scholar] [CrossRef]
- Zhang, X.; Su, X.; Zhang, B.; Wang, J. Preparation of MnO2@ CNFs composites and their tunable microwave absorption properties. Mater. Res. Express 2019, 6, 075005. [Google Scholar] [CrossRef]
- Wang, Z.; Han, Y.; Fan, W.; Wang, Y.; Huang, L. Shell-core MnO2/Carbon@ Carbon nanotubes synthesized by a facile one-pot method for peroxymonosulfate oxidation of tetracycline. Sep. Purif. Technol. 2021, 278, 119558. [Google Scholar] [CrossRef]
- Kim, E.S.; Lee, H.-J.; Kim, B.-H. Sandwich-structured carbon nanofiber/MnO2/carbon nanofiber composites for high-performance supercapacitor. Electrochim. Acta 2022, 406, 139883. [Google Scholar] [CrossRef]
- Huang, C.-L.; Chiang, L.-M.; Su, C.-A.; Li, Y.-Y. MnO2/carbon nanotube-embedded carbon nanofibers as core–shell cables for high performing asymmetric flexible supercapacitors. J. Ind. Eng. Chem. 2021, 103, 142–153. [Google Scholar] [CrossRef]
- Cui, Y.; Yang, K.; Lyu, Y.; Liu, P.; Zhang, Q.; Zhang, B. Hollow nitrogen-doped carbon nanofibers filled with MnO2 nanoparticles/nanosheets as high-performance microwave absorbing materials. Carbon 2022, 196, 49–58. [Google Scholar] [CrossRef]
- Dirican, M.; Yanilmaz, M.; Asiri, A.M.; Zhang, X. Polyaniline/MnO2/porous carbon nanofiber electrodes for supercapacitors. J. Electroanal. Chem. 2020, 861, 113995. [Google Scholar] [CrossRef]
- Park, J.H.; Choi, W.Y.; Lee, S.; Kim, T.-S.; Lee, J.W. Graphene intercalated free-standing carbon paper coated with MnO2 for anode materials of lithium ion batteries. Electrochim. Acta 2020, 348, 136310. [Google Scholar] [CrossRef]
- Zhao, Y.; Chang, L.; He, W.; Xu, S.; Liu, K.; Huang, T.; Li, Y.; Cui, M.; Xie, J. Improved supercapacitive performances of manganese dioxide on acid-treated carbon nanofibers derived from polyaniline. J. Energy Storage 2023, 60, 106596. [Google Scholar] [CrossRef]
- Yan, S.; Tang, C.; Wang, X.; Zhang, H.; Yang, Z.; Zhang, C.; Liu, S. Hierarchical MnO2 nanowire arrays consisting of multitripod structures grown on porous carbon nanofibers for high-performance supercapacitor electrode. J. Electroanal. Chem. 2020, 856, 113475. [Google Scholar] [CrossRef]
- Jeong, J.H.; Kim, Y.A.; Kim, B.-H. Electrospun polyacrylonitrile/cyclodextrin-derived hierarchical porous carbon nanofiber/MnO2 composites for supercapacitor applications. Carbon 2020, 164, 296–304. [Google Scholar] [CrossRef]
- Liu, C.-S.; Huang, C.-L.; Fang, H.-C.; Hung, K.-Y.; Su, C.-A.; Li, Y.-Y. MnO2-based carbon nanofiber cable for supercapacitor applications. J. Energy Storage 2021, 33, 102130. [Google Scholar] [CrossRef]
- Rao, T.P.; Kumar, A.; Naik, V.M.; Naik, R. Effect of carbon nanofibers on electrode performance of symmetric supercapcitors with composite α-MnO2 nanorods. J. Alloys Compd. 2019, 789, 518–527. [Google Scholar] [CrossRef]



Disclaimer/Publisher’s Note: The statements, opinions and data contained in all publications are solely those of the individual author(s) and contributor(s) and not of MDPI and/or the editor(s). MDPI and/or the editor(s) disclaim responsibility for any injury to people or property resulting from any ideas, methods, instructions or products referred to in the content. |
© 2023 by the authors. Licensee MDPI, Basel, Switzerland. This article is an open access article distributed under the terms and conditions of the Creative Commons Attribution (CC BY) license (http://creativecommons.org/licenses/by/4.0/).


