Preprint
Article

Forest restoration challenges in Brazilian Amazonia

Altmetrics

Downloads

242

Views

277

Comments

0

Submitted:

19 March 2023

Posted:

21 March 2023

You are already at the latest version

Alerts
Abstract
In its Nationally Determined Contribution (NDC) to the United Nations Framework Convention on Climate Change, Brazil committed to reducing greenhouse gas emissions and restoring its forests. This study examines the challenges of fulfilling these commitments in Brazilian Amazonia. We carry out a detailed assessment of the current status of land tenure in the region and its relation to deforestation. After dealing with conflicts and overlaps between data from various sources, we produce a new map of public and private land tenure in Amazonia. Combining this map with Brazil's official data on deforestation, we find out how much natural vegetation has been preserved in each public or private area. The result is used to estimate how much deforestation is illegal. We also establish how much deforestation is associated with each land tenure type. Our results show that most deforestation inside rural properties is done by a few landowners, a finding that has important consequences for law enforcement. We then assess the challenges for reforestation in detail. To do so, we consider how much forest needs to be rehabilitated according to Brazil's Forest Code. Our analysis provides a comprehensive appraisal of the potential opportunity costs for forest restoration in the biome, considering farm size and land use. This analysis provides insights into targeted land use policies that can meet Brazil’s forest restoration goals.
Keywords: 
Subject: Arts and Humanities  -   Religious Studies

1. Introduction

Deforestation in the Brazilian Amazonia biome has cut 76.85 million hectares (Mha) from the original forest cover of 390.2 Mha [1]. Strong action by the Brazilian government led to an 84% drop in deforestation from 2004 to 2012. Since then, deforestation has been increasing. From 2018 to 2022, deliberate inaction by the Bolsonaro government allowed 4.54 Mha of forest cuts. This situation requires urgent action. Brazil needs sound public policies to reverse the current trends and regain control over Amazonia.
The legal basis for land policy in Brazil is Law 12651/2012 (Forest Code). The Code regulates private land use. A fraction of each farm, called the legal reserve, should be set aside to preserve natural vegetation. In the Amazonia biome, the legal reserve must cover 80% of the property, with exemptions specified by Law. The Code also forbids removing natural vegetation on hilltops and near streams (Areas of permanent preservation, APP); these areas of permanent preservation safeguard water resources and protect the soil. Chiavari et al. [2] compare forest policies enacted by Brazil, Argentina, Canada, China, France, Germany, and the US. According to them, Brazil is unique among these countries in its compulsory protection mandate in private lands.
Landowners who remove part or all of their legal reserve have a natural vegetation deficit. Farmers with legal reserve deficits before 22 July 2008 must restore natural vegetation in their lands to meet legal limits. Removal of natural vegetation inside the legal reserve after this date is prohibited and subject to fines. Farmers accrue a surplus if they use less land than allowed by law. Surpluses can be converted into environmental reserve quotas. Farmers with deficits can offset them by buying quotas from properties with surpluses within the same biome. Thus, the Code provides measures for avoiding deforestation, restoring forests, and creating a forest credits market.
In 2015, Brazil submitted its Nationally Determined Contribution (NDC) to the UN Framework Convention on Climate Change. Brazil’s NDC pledges “to reach zero illegal deforestation by 2030 and compensate for greenhouse gas emissions from legal suppression of vegetation by 2030’’. Brazil commits to “restoring and reforesting 12 Mha of forests by 2030’’. Soterroni et al. [3] argue that compliance with the Forest Code is essential for Brazil to reach the emissions reduction and forest restoration goals set in its NDC.
Given the global importance of the Amazonia rainforest for preserving biodiversity, reducing emissions, and balancing climate change, we examine the challenges of forest restoration in the Brazilian Amazonia biome. Our results use up-to-date information on land tenure, deforestation, and land use. This work complements and extends earlier research [4,5,6,7,8,9,10] by using new datasets produced after these papers were published. As part of our work, we produced an updated land tenure map for the region. Combining the land tenure map with a new land use map, we got original results on the potential opportunity costs of forest restoration. Our findings present new perspectives on how Brazil can meet its NDC and forest restoration goals.

2. Data Sources

To produce an updated assessment of land tenure and land use in Amazonia, we used public datasets produced by Brazilian institutions, as shown in Table 1. These datasets are described in this section.
The 1988 Brazilian Constitution assures the right of pre-Columbian populations to exclusive use of their territories. The National Foundation for Indigenous People (in Portuguese Fundação Nacional do Índio or FUNAI) provides data on indigenous lands.
The Chico Mendes Institute for Biodiversity Conservation (in Portuguese, Instituto Chico Mendes de Conservação da Biodiversidade, or ICMBio) has data on conservation units that includes areas of full protection and of sustainable use. No land use is allowed in the first case. Sustainable use units allow private lands inside them under strict land management plans [11].
The National Institute for Colonization and Agrarian Reform (in Portuguese, Instituto Nacional de Colonização e Reforma Agrária, or INCRA) keeps a database of quilombola lands. Quilombola lands are those occupied by descendants of a community of people who resisted the slavery regime and their rights to the land are recognized by the Brazilian Constitution.
INCRA also provides rural settlement data. Rural settlements in Brazil started during military rule in the 1970s. To reduce social tension and allocate landless people far from urban areas, the government set up settlements in Amazonia. Most settlers lacked the farming skills required; they had no access to credit, markets and technical support [12]. The result was a strong impact on deforestation. For this reason, settlements created after the 2000s have to follow sustainable use rules [13].
In addition, INCRA has three databases of private land tenure: (a) SNCI (Sistema Nacional de Certificação de Imóveis, Nacional Land Certification System) holds records from 2004 to 2018; (b) SIGEF (Sistema de Gestão Fundiária, Land Tenure Management System) has data ranging from 2013 up to 2021; and (c) Terra Legal (Legal Land Cadastre) that was created in 2009 to certify land for small farmers on public areas.
The fourth source of private land tenure data is the Rural Environmental Registry (Cadastro Ambiental Rural or CAR), maintained by the Brazilian Forestry Service (in Portuguese, Serviço Florestal Brasileiro, or SFB). The 2012 Forest Code created the CAR to fill a gap in land tenure data since there is much uncertainty in land ownership in Brazil [14]. All landowners have to self-register their properties in the CAR. To do so, the owner provides the property limits, the areas of permanent preservation, and the legal reserve. When the CAR was set into Law, its proponents expected it to solve the gaps and issues of land tenure in Brazil [15]. However, entries provided by owners in the CAR have many conflicts and errors [16], including duplicate entries, geometric inconsistencies (such as overlaps and gaps), legal incompatibilities, and missing or conflicting information. To make matters worse, state authorities have been slow in solving such problems and creating a clean cadastre. As a result, most CAR records are pending validation [4].
The Brazilian Forest Service also provides the National Cadastre of Public Forests (Cadastro Nacional de Florestas Públicas or CNFP). The CNFP includes two types of data: (a) public forests defined as conservation units, indigenous lands, military lands, and other sustainable use areas; (b) identified areas yet to be designated to a tenure category by federal or state governments. As Azevedo-Ramos et al. [17] pointed out, the undesignated areas are vulnerable to land grabbing. This cadastre has not been updated since 2016 and has sizeable gaps. As a result, large forest areas in Amazonia are missing from CNFP.
Brazil’s National Institute for Space Research (INPE) provides annual assessments of deforestation by clear-cut in Amazonia since 1988 using the PRODES system. INPE and the Brazilian Agricultural Research Corporation (Embrapa) also produce a land use map for the deforested areas in the biome [18]. Embrapa also provides the Interactive System of Geospatial Analysis of the Legal Amazonia (SIAGEO). This system lists initiatives of ecological-economic zoning in the region. By late 2022, five states (Acre, Maranhão, Pará, Rondônia, and Tocantins) had used this legal provision to reduce the protection level of part of their areas [19].
MapBiomas is a collaborative platform that uses satellite data and machine learning to map and monitor land use and land cover changes in Brazil. Operated by a consortium of organizations [20], it produces annual maps of land use and land cover in Brazil.

3. Methods

3.1. Building Maps of Public and Private Land Tenure

Our analysis requires maps of public and private land tenure. The public land tenure map contains protected areas set by Law. We found significant overlaps between different conservation units and between them and indigenous lands. To solve overlaps, we used an order of precedence: (a) indigenous lands from FUNAI; (b) quilombola lands from INCRA; (c) fully protected conservation units from ICMBIO; (d) military areas from CNFP; (e) sustainable use conservation units from ICMBIO; (f) undesignated public forests. The last category includes undesignated forests listed in CNFP and all other unidentified areas. After removing all conflicts, the public land tenure data we used is shown in Table 2.
To get the private land tenure map, we used data from INCRA (SIGEF, SNCI, and TerraLegal) and CAR. These datasets have mismatches, overlaps, and conflicts. Conflicts between properties registered more than once were fixed by taking one data source as a reference and removing overlaps from the other. INCRA records are validated; the associated properties are thus certified. Therefore, INCRA is a reliable source of private land tenure. Thus, SIGEF and SNCI have the highest priority, followed by Terra Legal. Since the CAR has self-declared records, it has the lowest priority. This ranking allowed us to use the best information first and to reduce the work on data cleaning.
We set up five rules to create the private land tenure map (see Figure 1). The first two rules apply to INCRA’s data. Rule (A) refers to conflicts between SIGEF and SNCI. New entries in these cadastres can be added without removing previous ones that cover the same area. We consider these cases to result from land sales and take the newest registered property as the valid one. Rule (B) takes the resulting data and includes entries from the TerraLegal cadastre that do not conflict with the joined SIGEF and SNCI data. The result is a clean dataset based on INCRA’s data.
Next, we use Rule (C) to remove overlaps between CAR self-declarations. To resolve these conflicts, we assume legitimate owners are rigorous in their declarations. Entries with many overlaps are more likely to result from illicit claims than those with no intersections. As a first step, we take entries with no intersections to be valid. Then, we apply the following procedure to remove intersections.
(i)
Identify all properties in the dataset that have overlapping areas.
(ii)
For each pair of overlapping properties, do as follows:
  • Determine the number of overlaps for each property.
  • If one property has more overlaps than the other, remove the overlapping area from that property.
  • If both properties have the same number of overlaps, remove the overlapping area from the property with the larger area.
(iii)
Repeat the process for all overlapping properties until all intersecting areas have been removed.
This algorithm provides a systematic approach for addressing conflicts in the CAR. After applying it to all CAR items, we used Rule (D) to match the clean INCRA dataset with the cleaned CAR. In case of conflicts between INCRA and CAR entries, properties listed by INCRA have priority over those in CAR. We get a register of private rural properties with no intersections and no conflicting information.
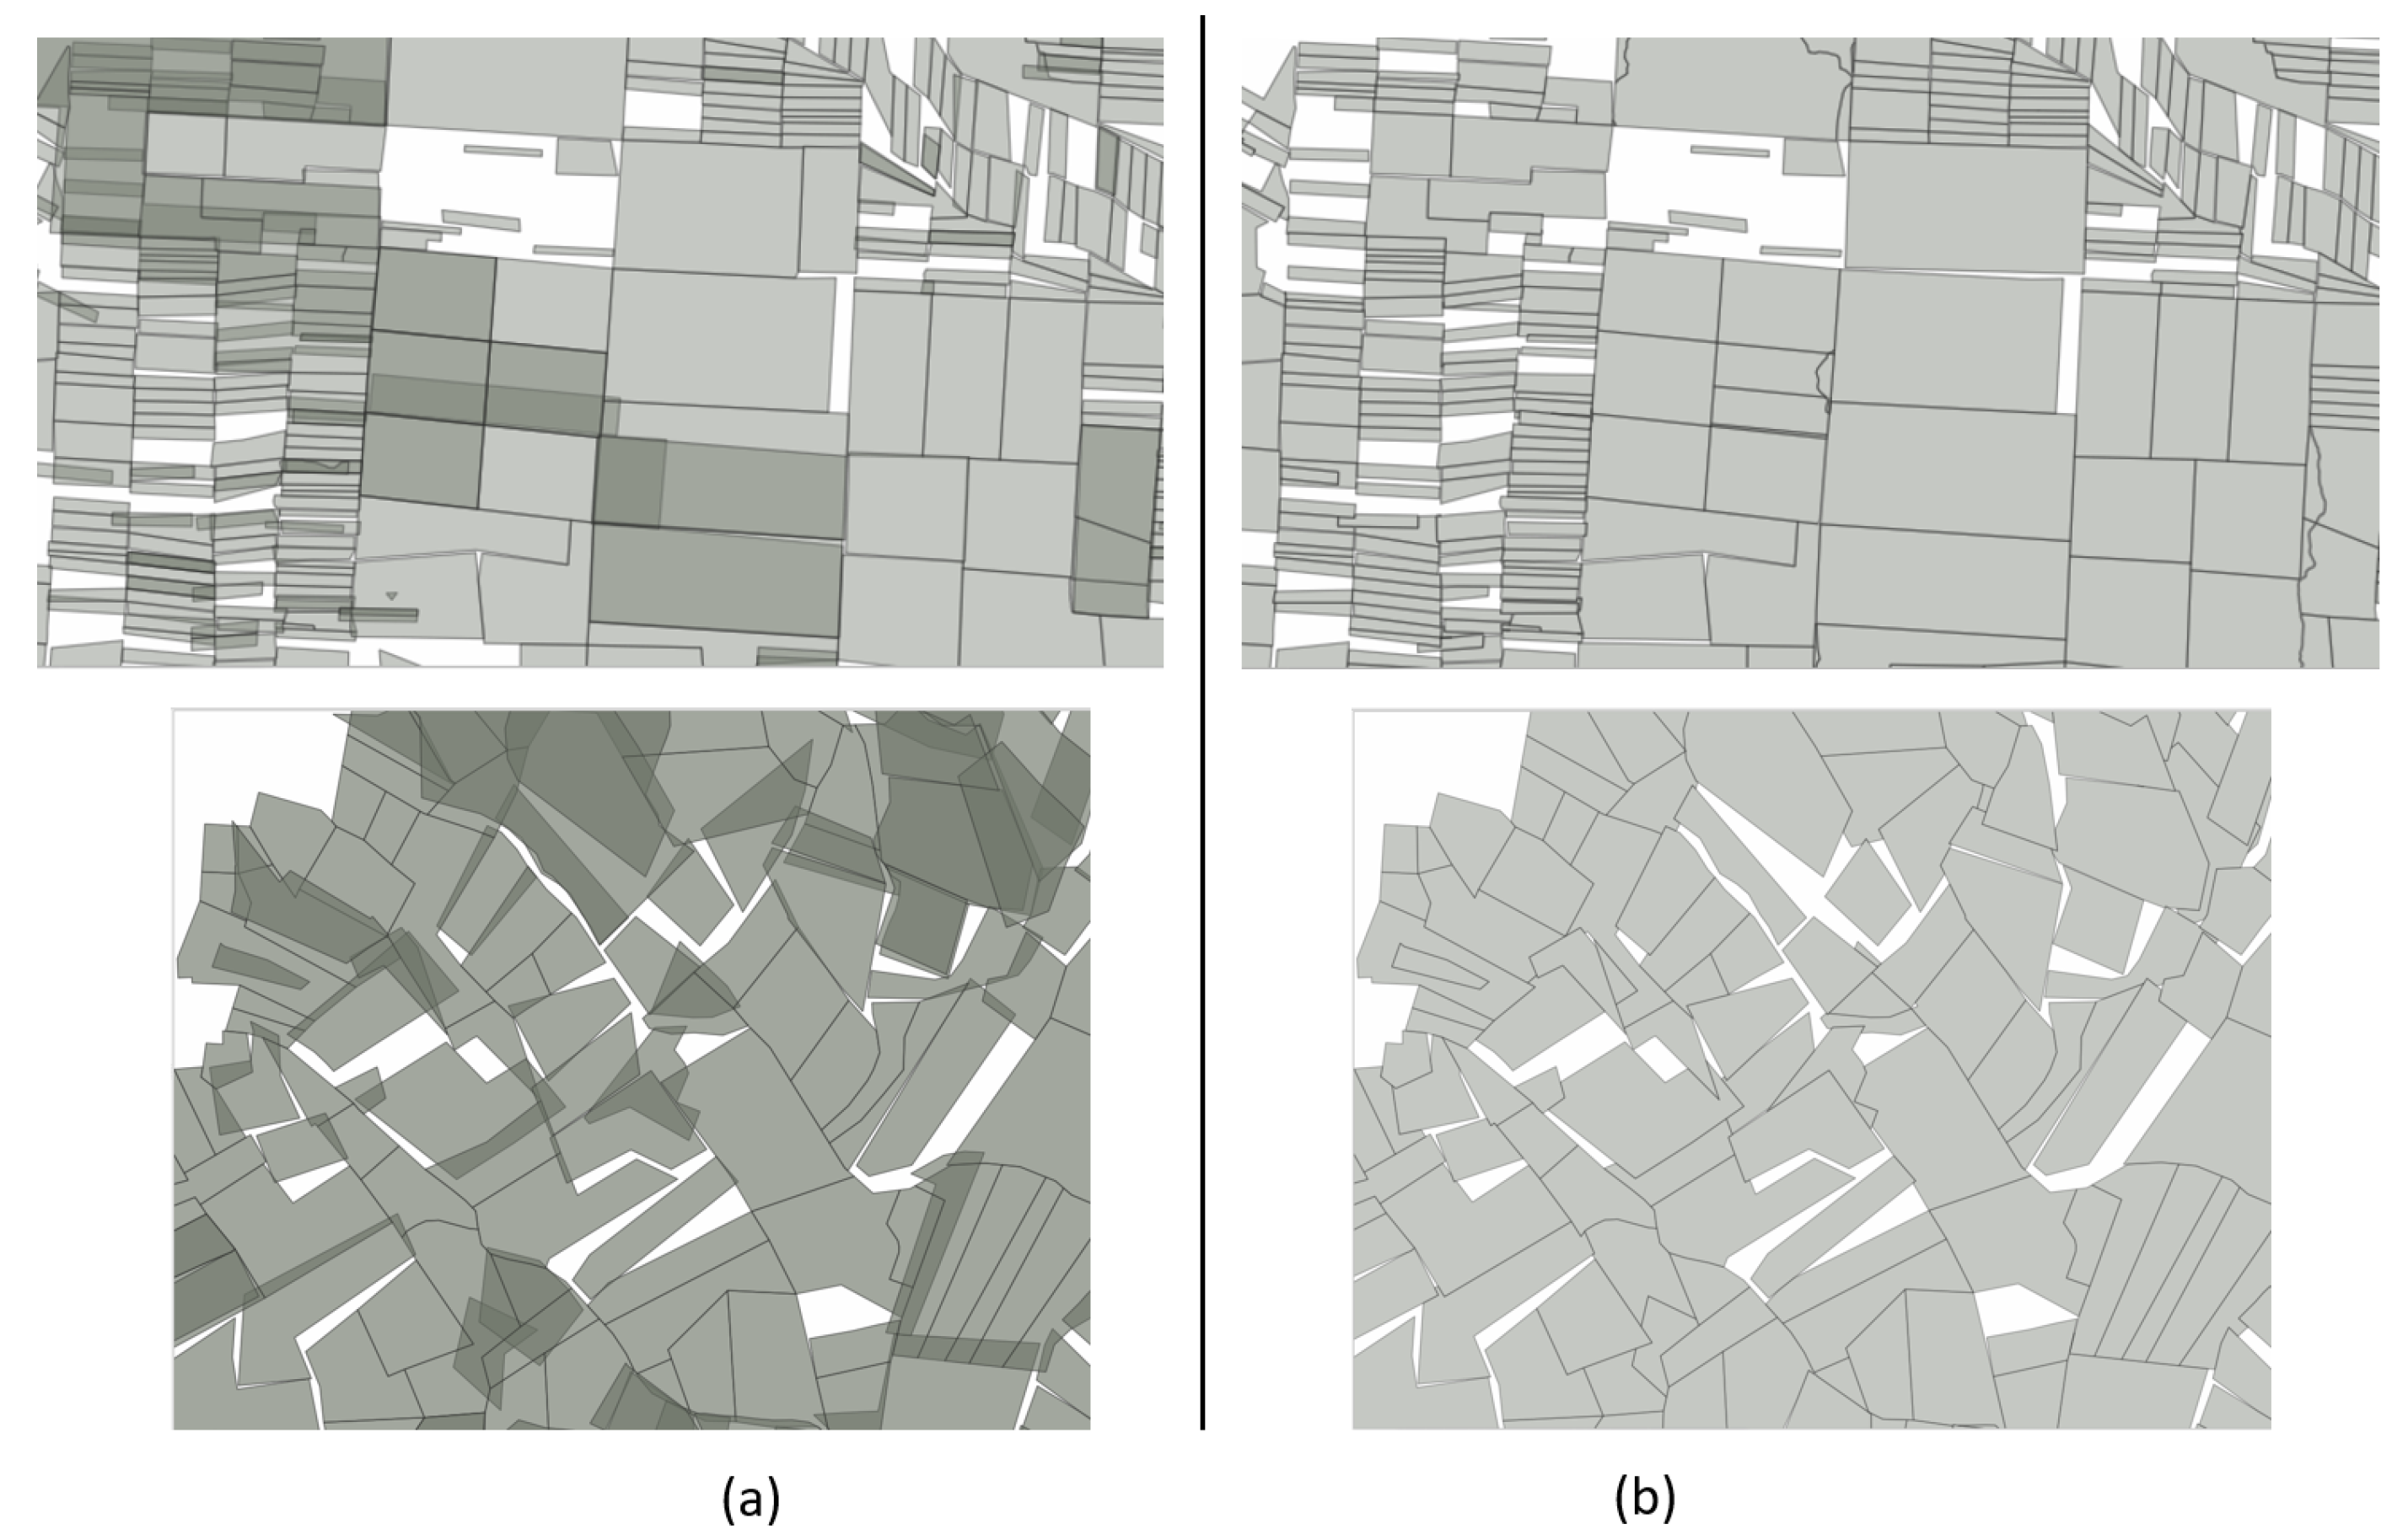
To show how we produce a consistent data set, Figure 2 illustrates corrections made in two distinct regions of Amazonia. In each case, the left side shows private properties declared in the CAR, while the right shows the property map after corrections.
The final step includes rural settlements. The Law allows two possibilities for legal reserves in settlements: (a) each property has its legal reserve; (b) the settlement has a common area designated as a shared legal reserve. However, the status of legal reserves per settlement is not available in the INCRA data; thus, our study takes all properties inside a settlement as a single entity. Thus, we define Rule (E), which dissolves all boundaries of individual farms inside a settlement. These rules produce a consistent private land tenure map. The resulting dataset has 489,795 unique private lands outside settlements covering 128.1 Mha; there are 2,333 settlements covering 32.9 Mha.
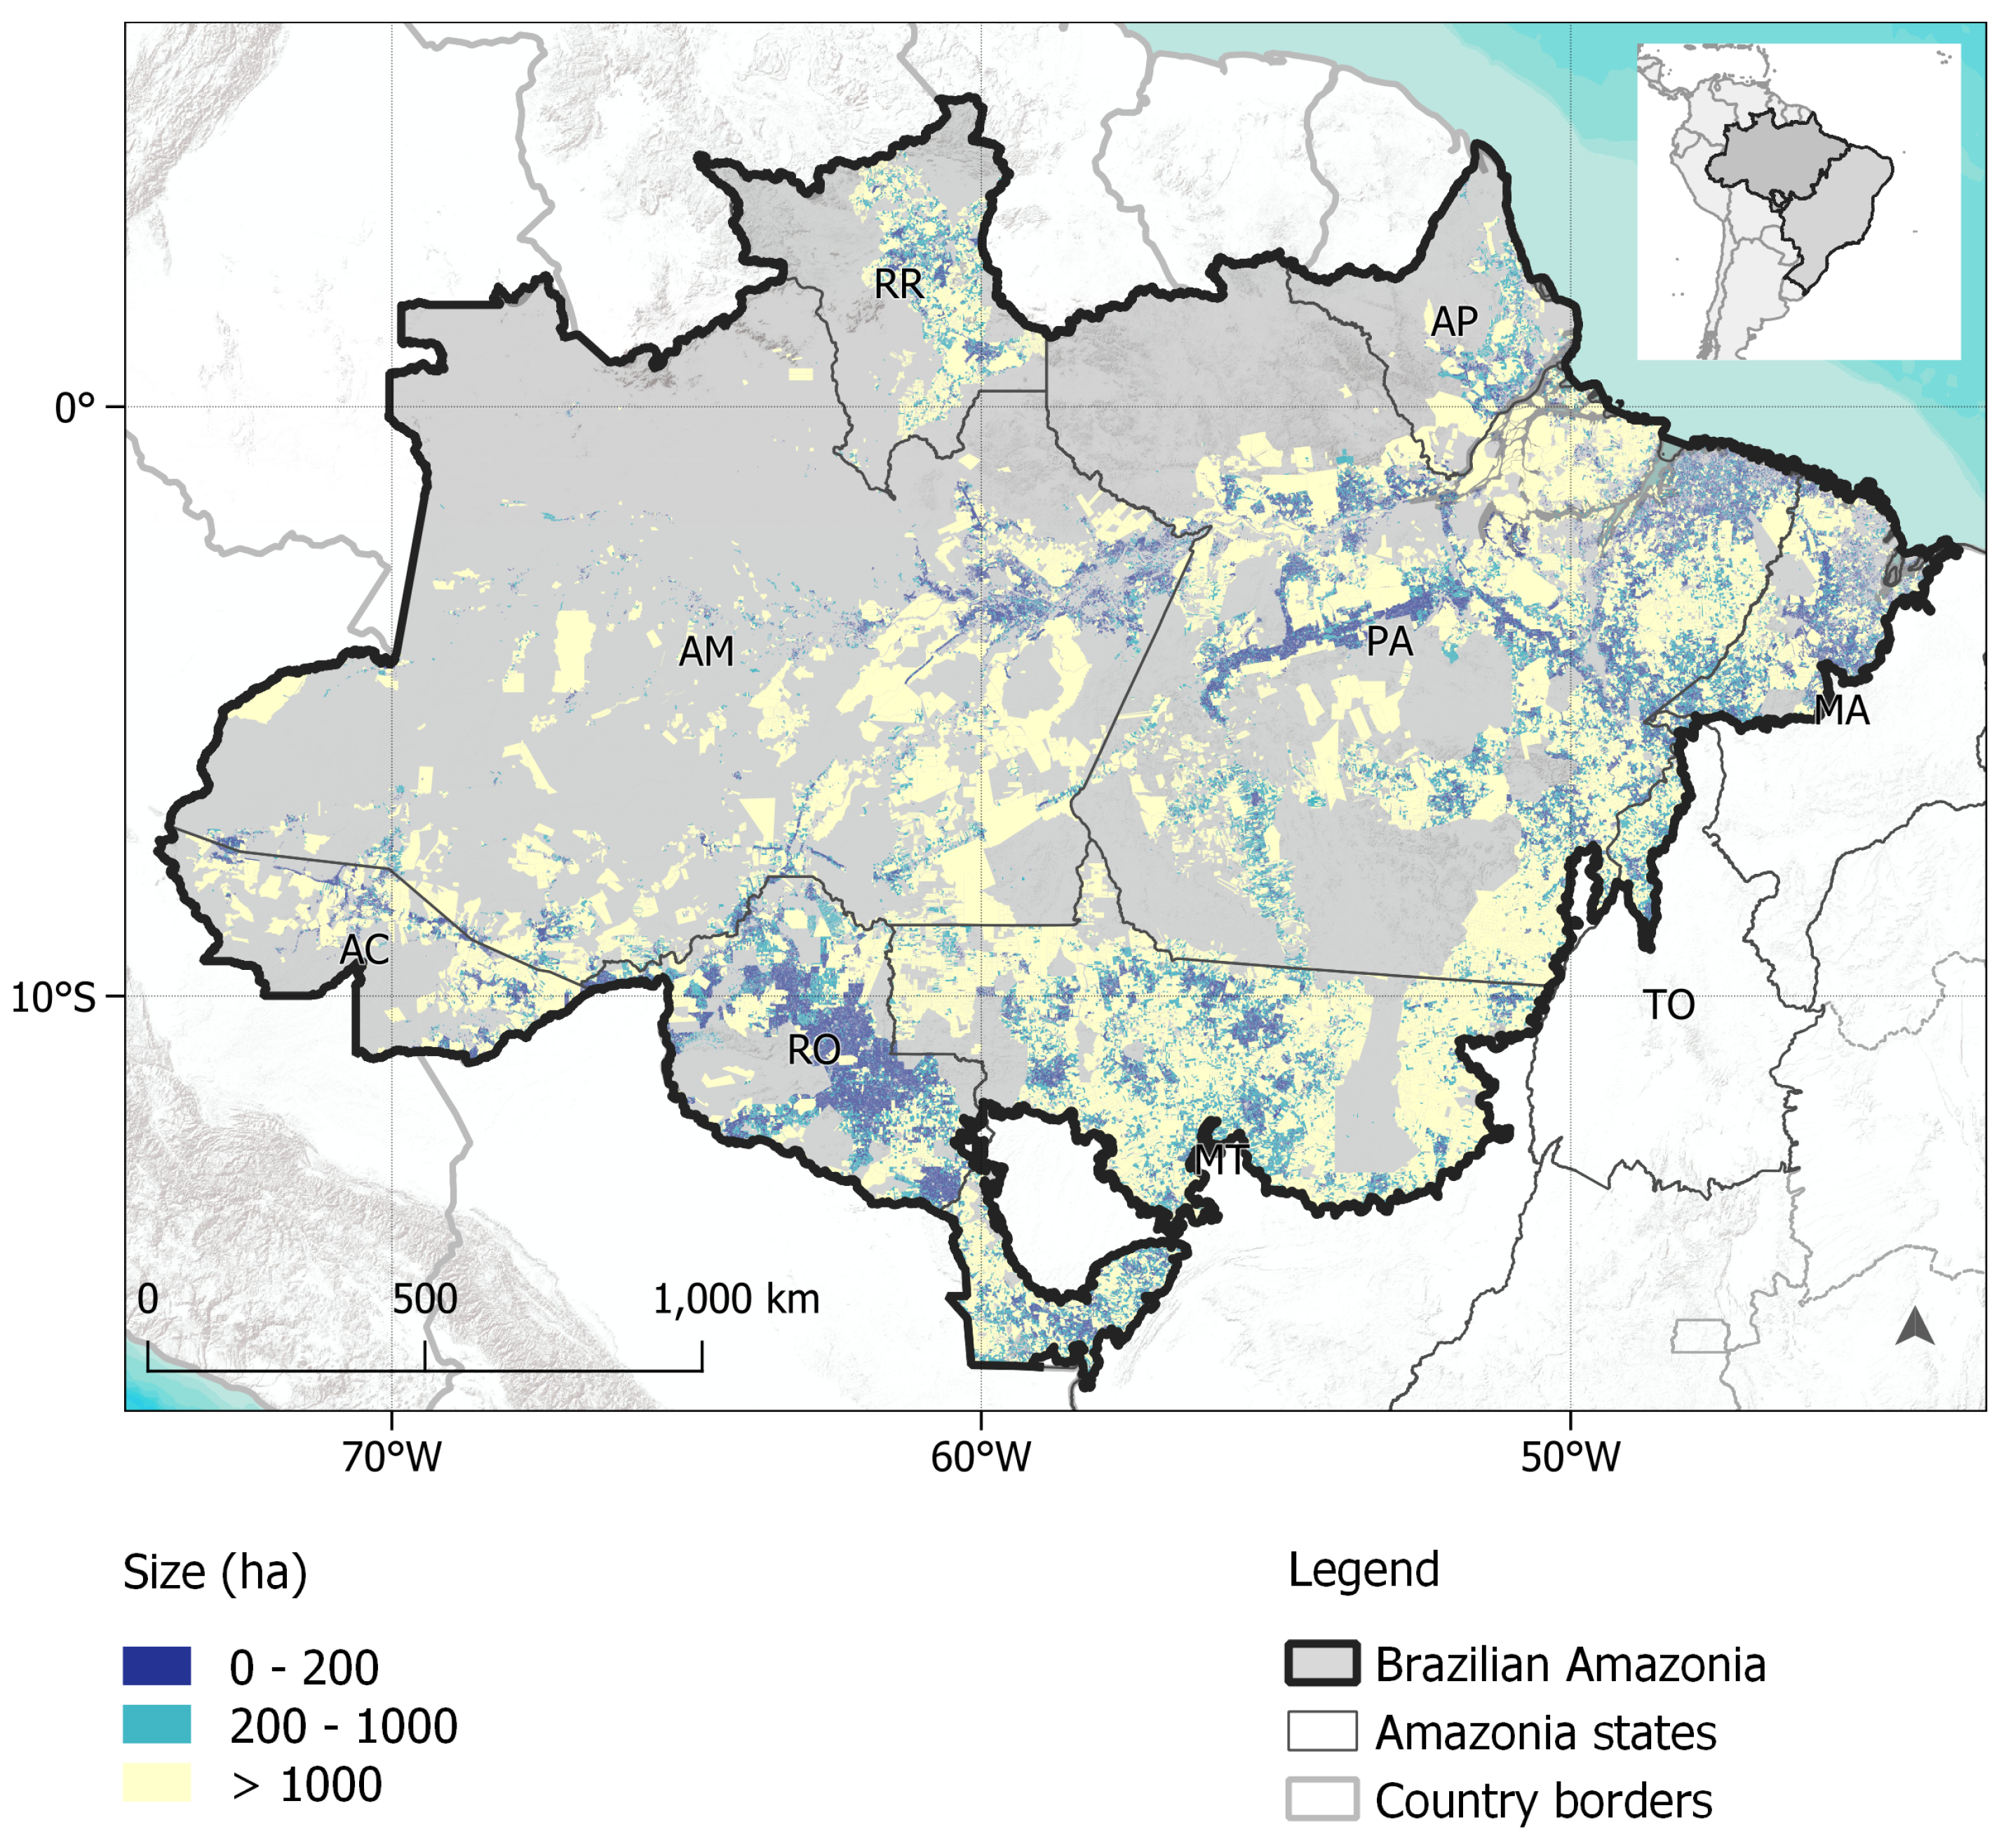
Figure 3 depicts private properties and settlements in the Amazonia biome by size class. The largest concentrations of small properties (smaller than 200 ha) are in the state of Rondônia (RO), Northeastern Pará (PA) and the Trans-Amazonian highway (across the center of PA), and in Maranhão (MA). Most of these areas were occupied before the 2000s. In Mato Grosso (MT), the Southern portion of PA, and Southeastern Amazonas (AM), most properties date from the 2000s and later; most of them have medium (200 to 1000 ha) and large (over 1000 ha) sizes. The spatial distribution of farm size is thus an indirect indicator of how Amazonia has been occupied.

3.2. Forest Protection Mandates

To assess legal compliance by private landowners, we need to match the private land tenure map with information on forest protection mandates. Some provisions of the Forest Code are unclear and subject to interpretation. Moreover, there is currently no authoritative source of forest protection mandates for Amazonia. Thus, we had to produce such a map; to do so, we considered rulings related to public land tenure areas and those that apply to private lands. When in doubt, we applied our best understanding of the Law.
We first built a map of protection mandates in public areas. Indigenous lands, fully protected conservation units, and quilombola areas have a 100% forest protection mandate. Sustainable conservation units and sustainable settlements follow an 80% protection mandate. Considering the unclear status of the undesignated forests in Amazonia, we assign an 80% protection level to them. Future decisions by Brazil’s federal and local governments can assign a different protection level to these forests. In this case, some of our results will have to be updated. For this reason, the authors provide the full data sets used in this paper to allow reproduction and reuse of our work.
In the case of forest protection mandates in private properties, the Forest Code states that owners must set aside 80% of their forest area as legal reserve. However, the Code has several exceptions and waivers. There are two cases where the Law grants absolute reduction of legal reserve:
  • Article 12 §5 provides a special condition for states with over 65% of their area occupied by conservation units and indigenous lands. Private properties in those states benefit from an unconstrained legal reserve reduction from 80% to 50%.
  • Article 67 provides a waiver for small rural properties. For these lands, the legal reserve is taken as the remaining forest area as of 22 July 2008. The Law grants this amnesty if owners did not deforest their lands after that date.
Including these articles on the forest, the protection map is straightforward. Article 12 §5 applies only to Roraima (RR) and Amapá (AP) states. To include the exemptions of Article 67, we identified all small properties covered by this provision. We used the INPE PRODES maps from 2008 to 2021 to find which properties had not cut forests since 2008.
Other provisions of the Forest Code allow reducing the legal reserve from 80% to 50% for restoration purposes only, as follows:
  • Article 12 §4 singles out municipalities where more than 50% of its area is taken by conservation units and indigenous lands.
  • Article 13 allows states to define special areas of ecological-economic zoning where the legal reserve is to be reduced.
  • Article 68 considers rural properties that had cut forests up to 25 July 1996 respecting the legal reserve limit of 50% valid before that date and that have not deforested their lands since.
To include Article 12 §4, we matched data on conservation units and indigenous lands, municipal boundaries, and the location of rural properties. As for Article 13, we used data on ecological-economic zoning provided by Embrapa’s SIAGEO database to identify which subregions in Amazonia qualify for reduction in legal reserve.
The final step was to determine whether a rural property is eligible for the exception granted by Article 68. To do so, we had to estimate the extent of deforestation on the property by July 1996. Because the INPE PRODES deforestation maps are only available from 2008 onwards, we used the MapBiomas annual maps from 1985 to 1998 [20]. Our analysis requires that primary and secondary forests are mapped as different classes. Unlike PRODES, MapBiomas annual maps have a single forest class that includes both cases. For this reason, we combined the PRODES and MapBiomas maps to get a land cover map for 1996 where natural forests are split from secondary forests. The resulting map allowed us to determine which properties meet the requirements of Article 68 of the Forest Code.
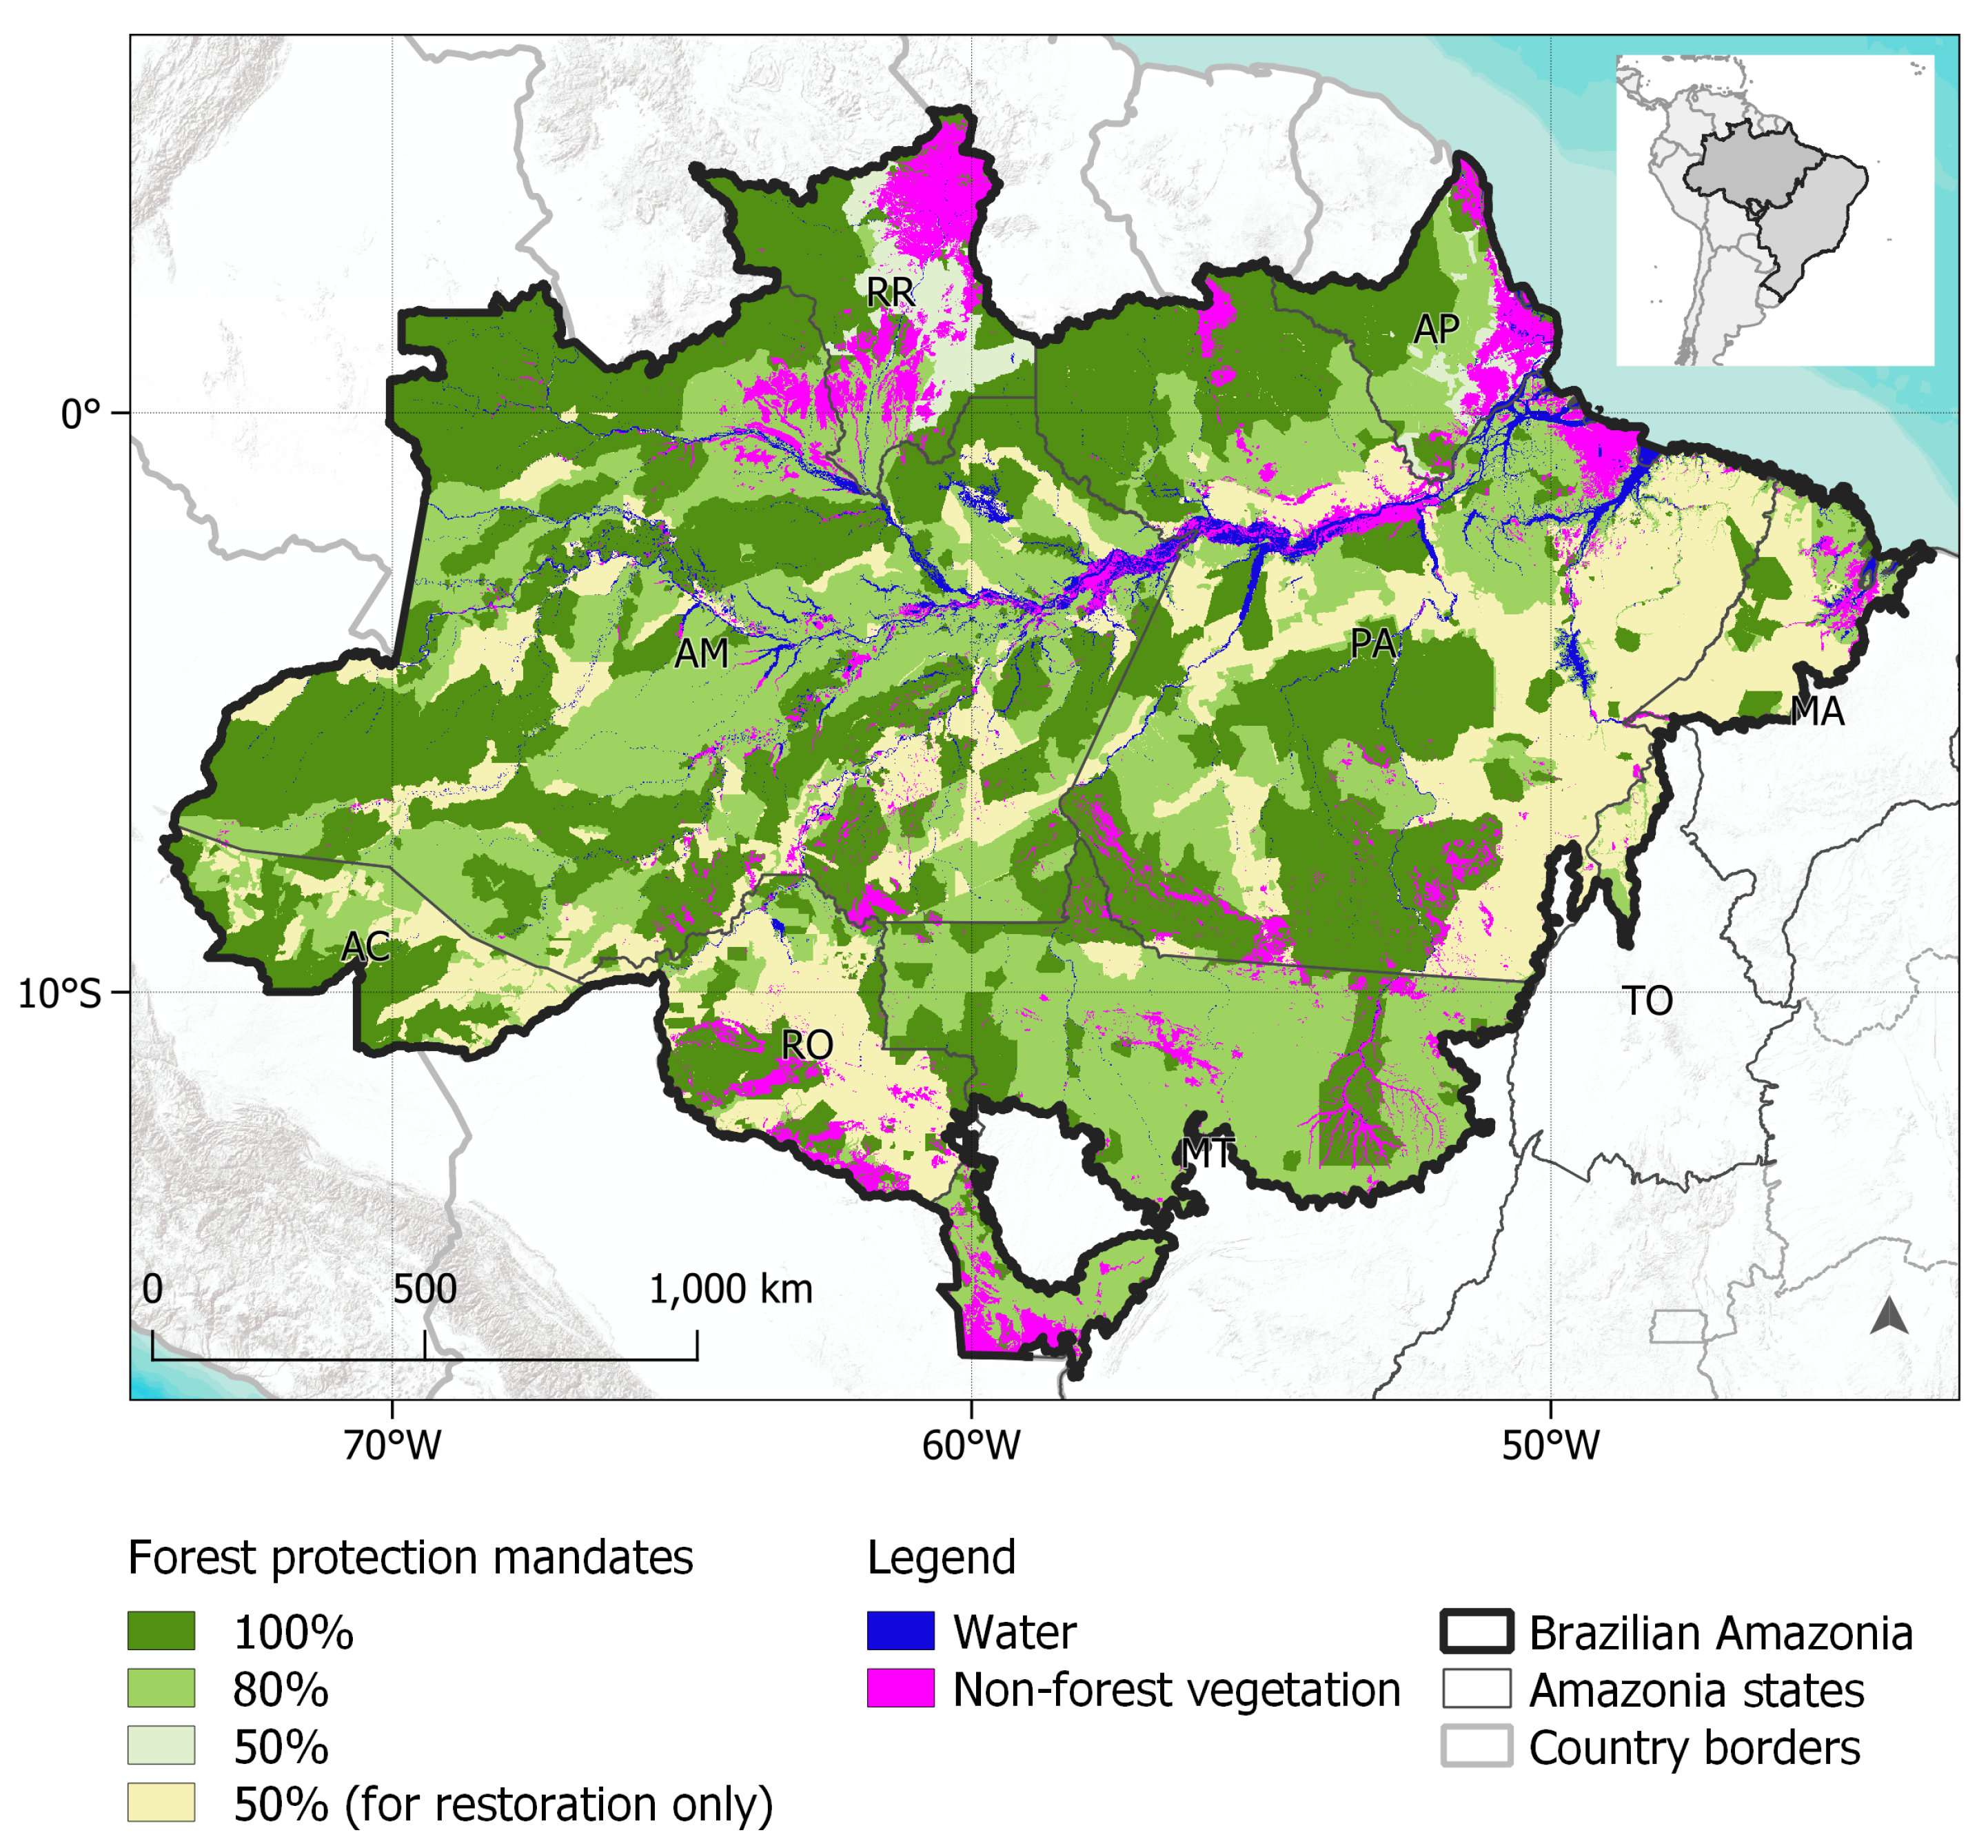
Combining all legal provisions of the Forest Code, we produced a map of forest protection mandates, shown in Figure 4. For easier viewing, Figure 4 does not show the exceptions enacted by Articles 67 and 68. There are overlaps between entries in the combined public and private land tenure map [14], not shown in Figure 4. Since the legal status of these conflicted areas is yet to be defined, we did not solve these mismatches. We apply the protection level of public lands to private lands inside them, using proportional allocation if required. For example, a private property is inside a 80% protection area, we assign that protection level to the private land. The result is a map where each area of the Amazon biome has a unique protection mandate.

3.3. Areas of Permanent Preservation

The next step was to get the map of areas of permanent preservation (APPs) in Amazonia. Since we used a 30-meter grid for our maps, we considered two cases. For rivers wider than 30 meters, we used the water mask provided by INPE [1] and the Forest Code rules to assign the grid cells that will be part of the APP. To include rivers narrower than 30 meters, we computed a drainage network for Amazonia as proposed by Rosim et al. [21]. Comparative studies show drainage networks computed using this method are suitable to define APPs [22]. Based on the drainage network, we inferred the location and extent of narrow streams and riparian areas to estimate the fraction of each cell assigned as an APP. The resulting grid had values ranging from 0% to 100%. The final step was to use the Forest Code rules and deforestation maps to establish the areas that must be restored for each property listed in our land tenure map.

4. Results and Discussion

4.1. Trends in Deforestation in Amazonia: 2008-2021

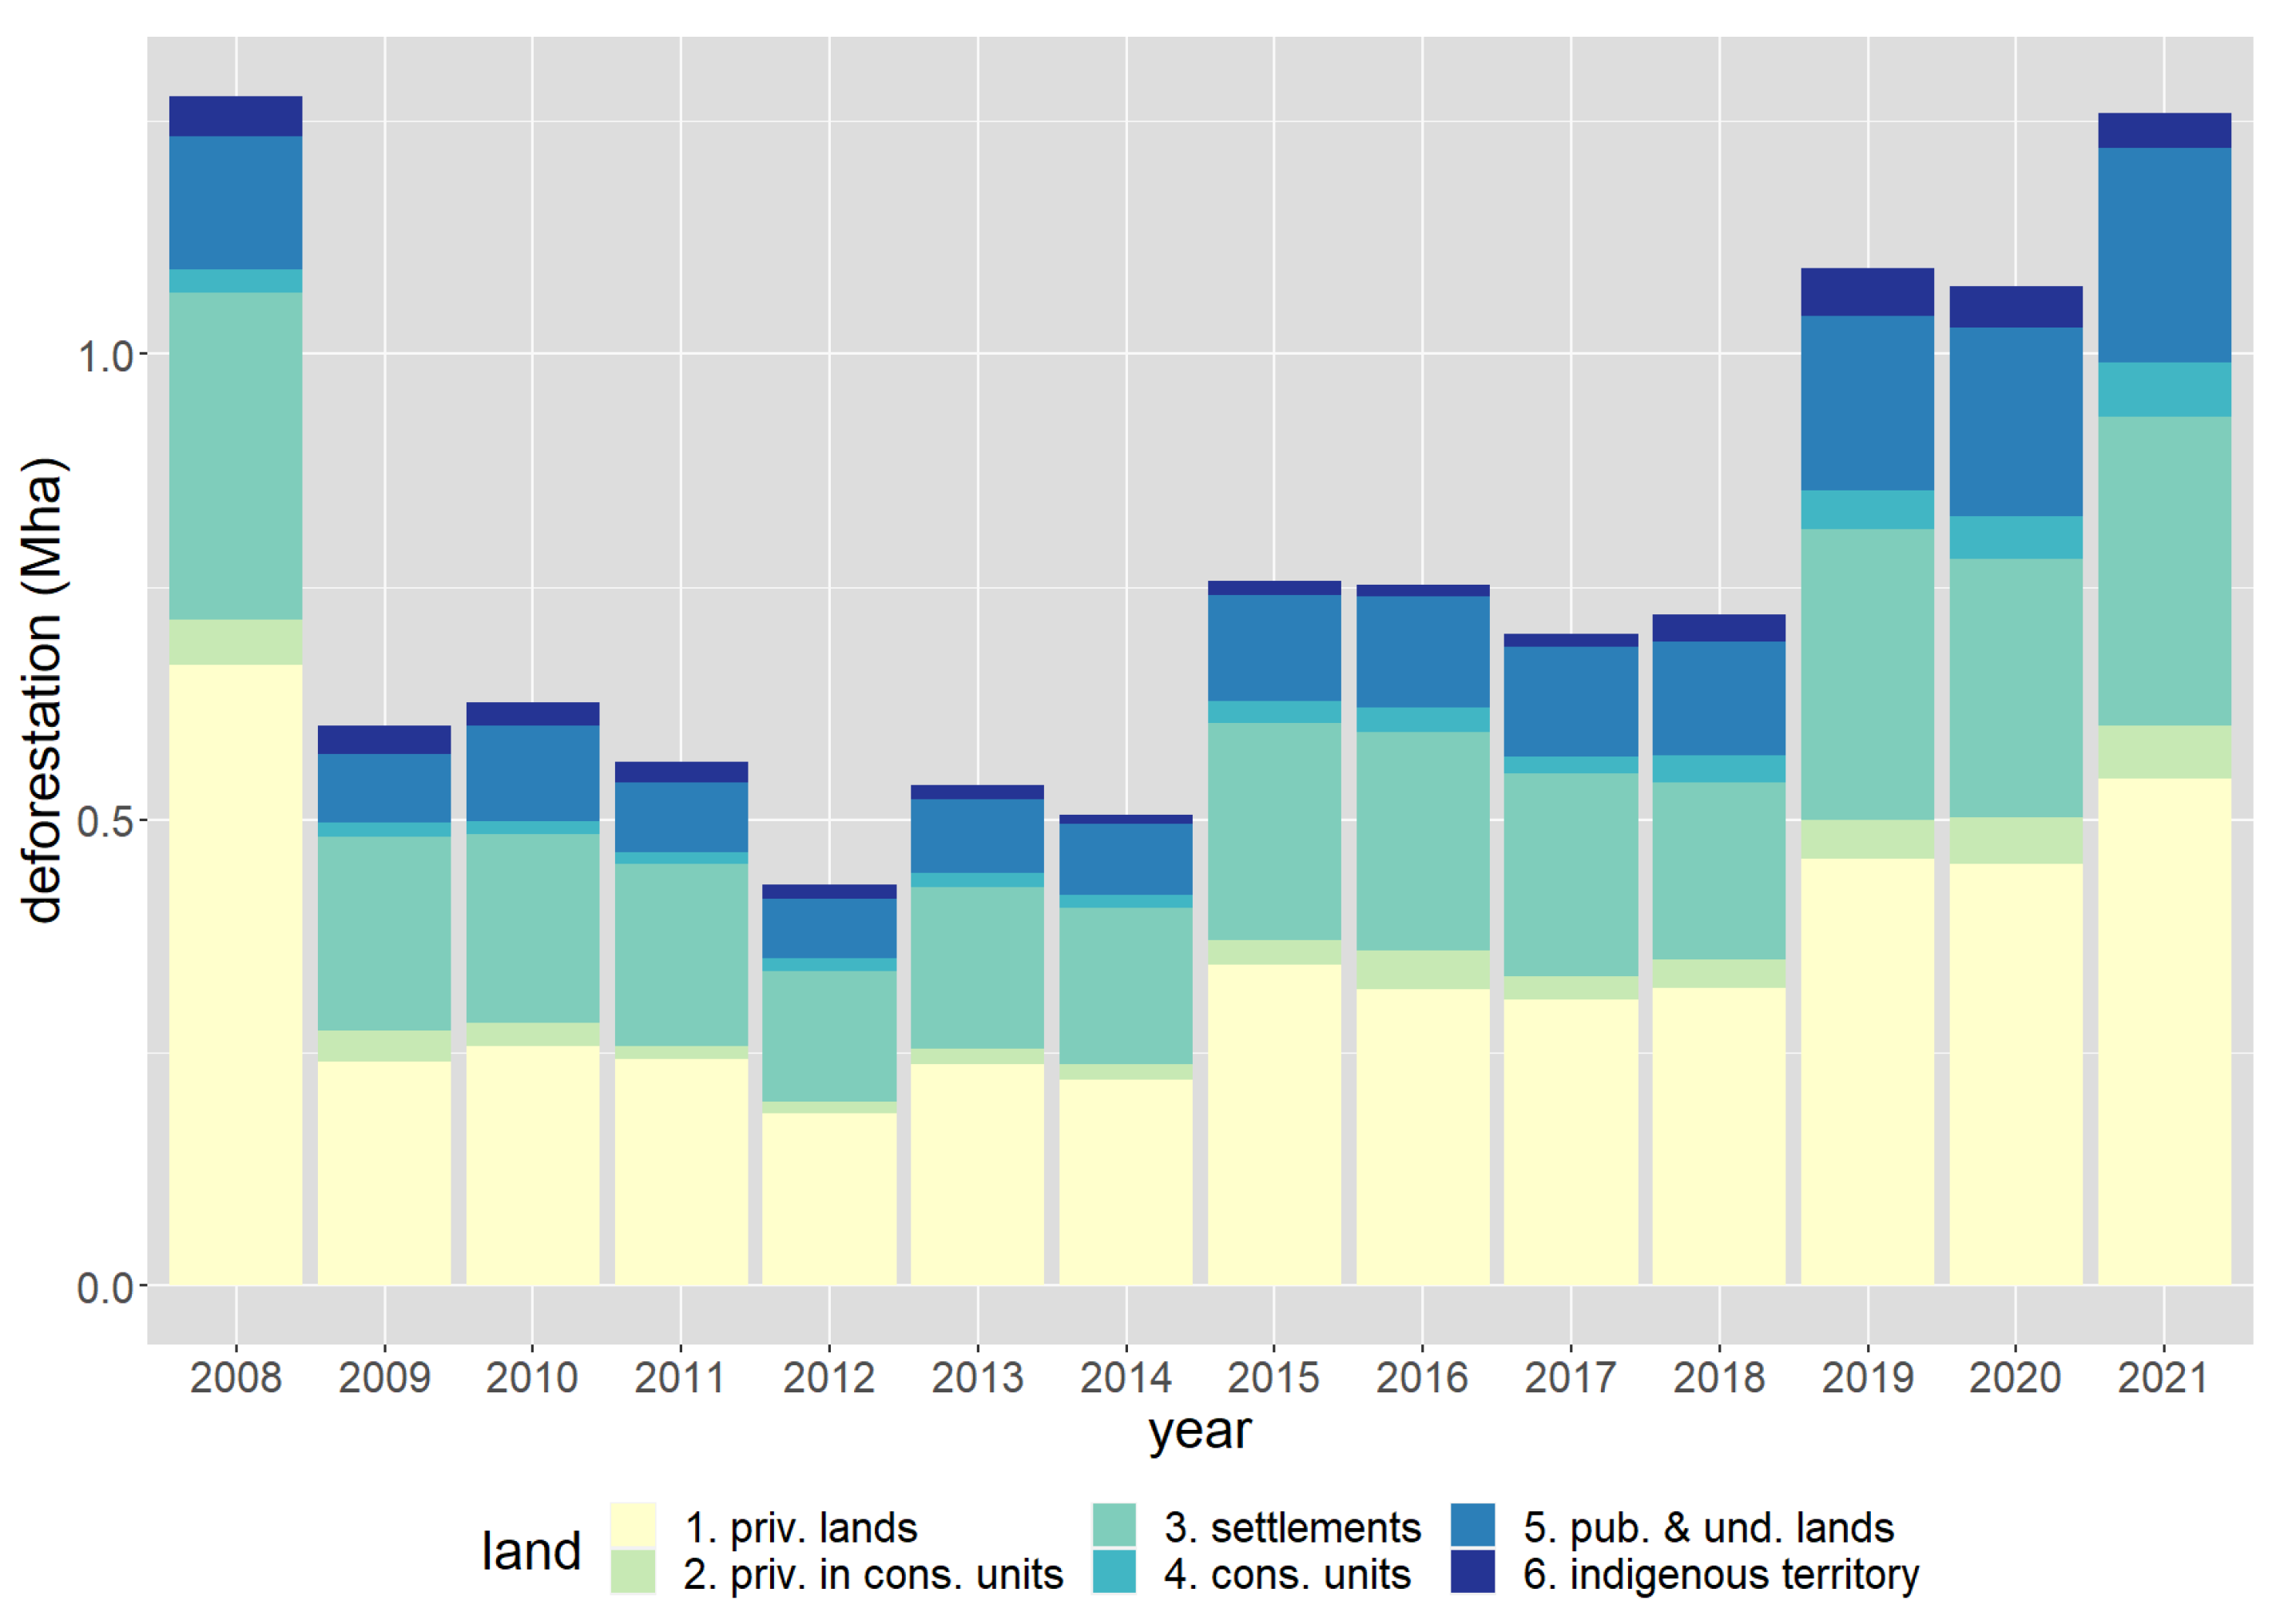
How are forest cuts related to the different types of land tenure? To answer this question, we measured deforestation in private properties, settlements, conservation units, indigenous lands, and undesignated public lands. Figure 5 shows the annual deforestation by land tenure type from 2008 to 2021. Deforestation inside private lands accounts for 44% of the total. Cuts in private areas inside conservation units amount to about 4% of the total. Forest removal in settlements decreases from 31.4% of the total in 2008–2012 to 26.9% in recent years (2019–2021). Deforestation in undesignated public lands increases from 11.1% in 2008 to 18.2% in 2021. Such increase is a sign of expansion of the land frontier to new areas outside the so-called “arch of deforestation” in Mato Grosso, Rondonia, and South and Southeastern Pará [23]. Schielein and Börner refer to these areas as the “new frontiers” of Amazon deforestation [24].
How much deforestation in Amazonia is legal? To measure illegal deforestation, we considered all cases that do not comply with the preservation requirements set by the Forest Code. Our analysis used the following criteria:
(i)
Inside fully protected areas or indigenous lands, deforestation is illegal.
(ii)
In undesignated public areas and sustainable conservation units outside the private land tenure map, deforestation is illegal.
(iii)
Rural properties inside sustainable conservation units have to abide by an 80% legal reserve limit.
(iv)
Other rural properties and settlements can only cut forests legally if they respect the legal reserve limit and do not remove areas of permanent preservation.
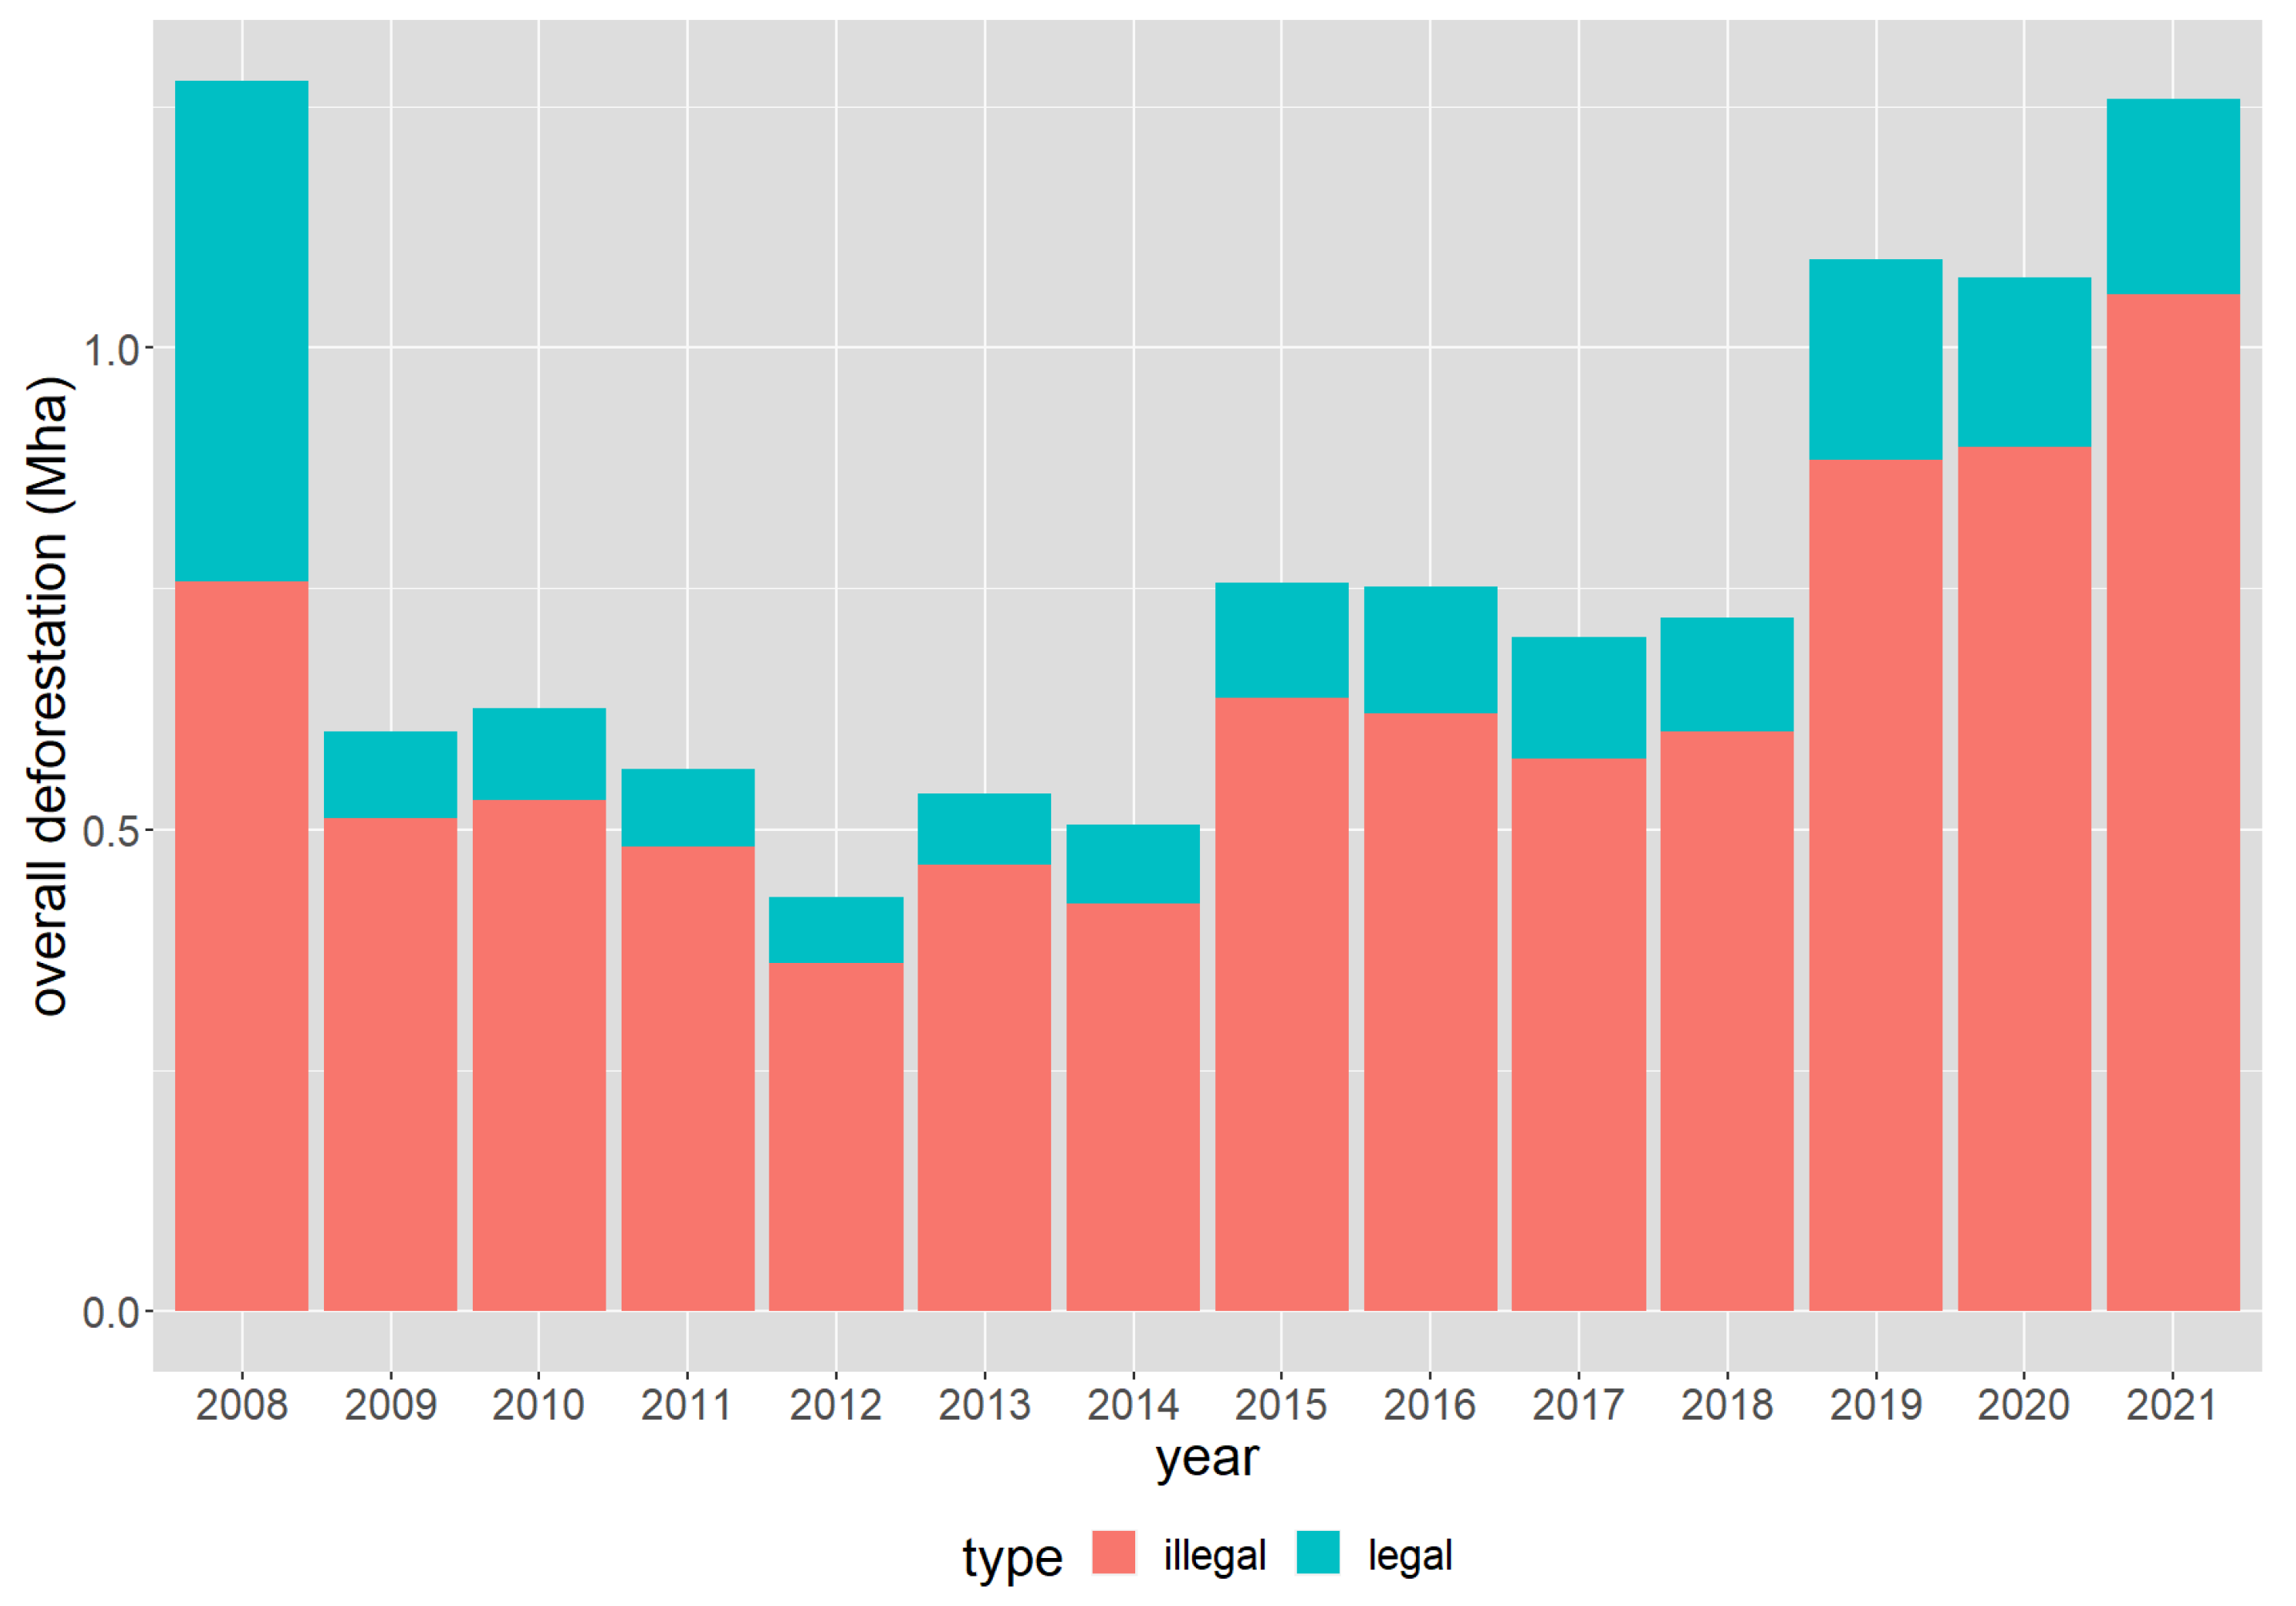
Based on these assumptions, we determined the extent of legal and illegal deforestation for the period 2008–2021, as shown in Figure 6. Except for 2008, the proportion of illegal deforestation ranges between 81% and 86%. The outlier for 2008 is due to the exemption granted by the Forest Code to small properties deforested before July 2008. Since most deforestation in Amazonia is illegal, public policies to preserve the forest have to include a strong command and control strategy. Only strict law enforcement can reduce illegal actions in the region.
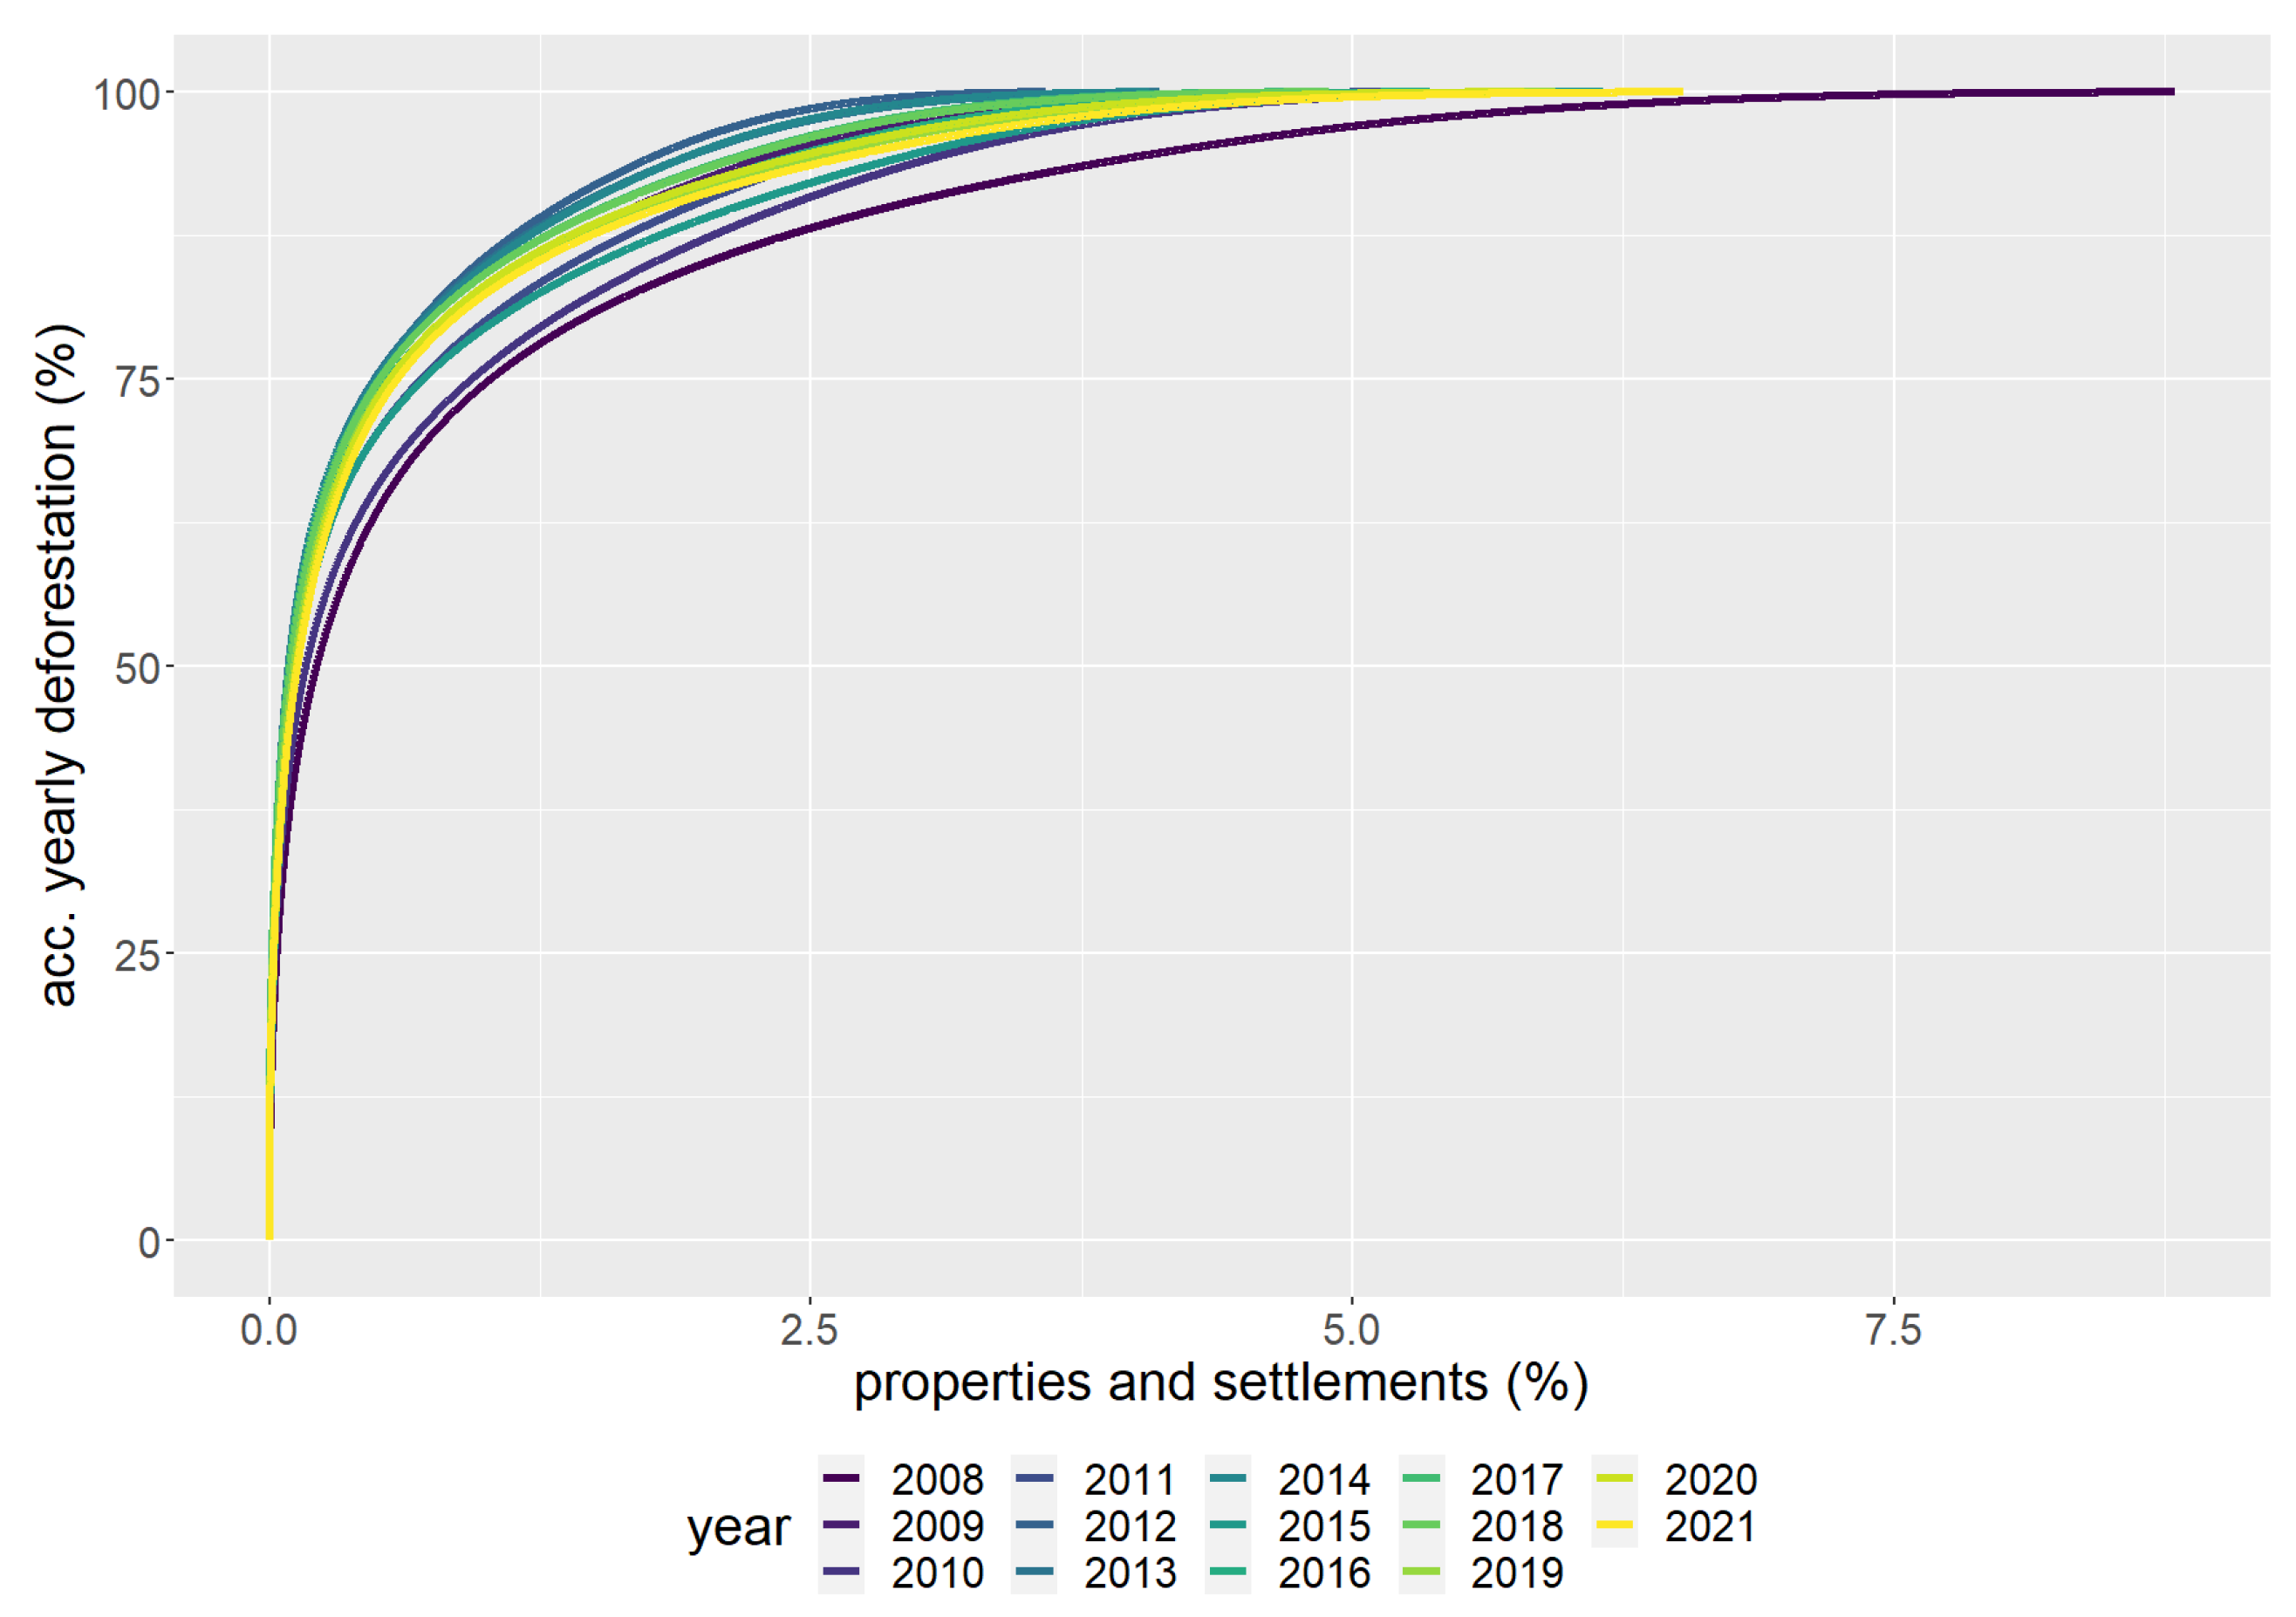
How concentrated is deforestation in Amazonia? To address this question, we measured the cumulative distribution of deforestation on properties and settlements, as shown in Figure 7. Entries in the private land tenure map are ordered from highest to lowest annual deforestation. The graph excludes cuts in undesignated public lands, conservation units, and indigenous lands, which amount to between 20% and 25% of total yearly deforestation. The graph follows a power law. In general, only about 5% of the private properties and settlements are responsible for 100% of the forest cuts each year within the areas registered in the CAR.
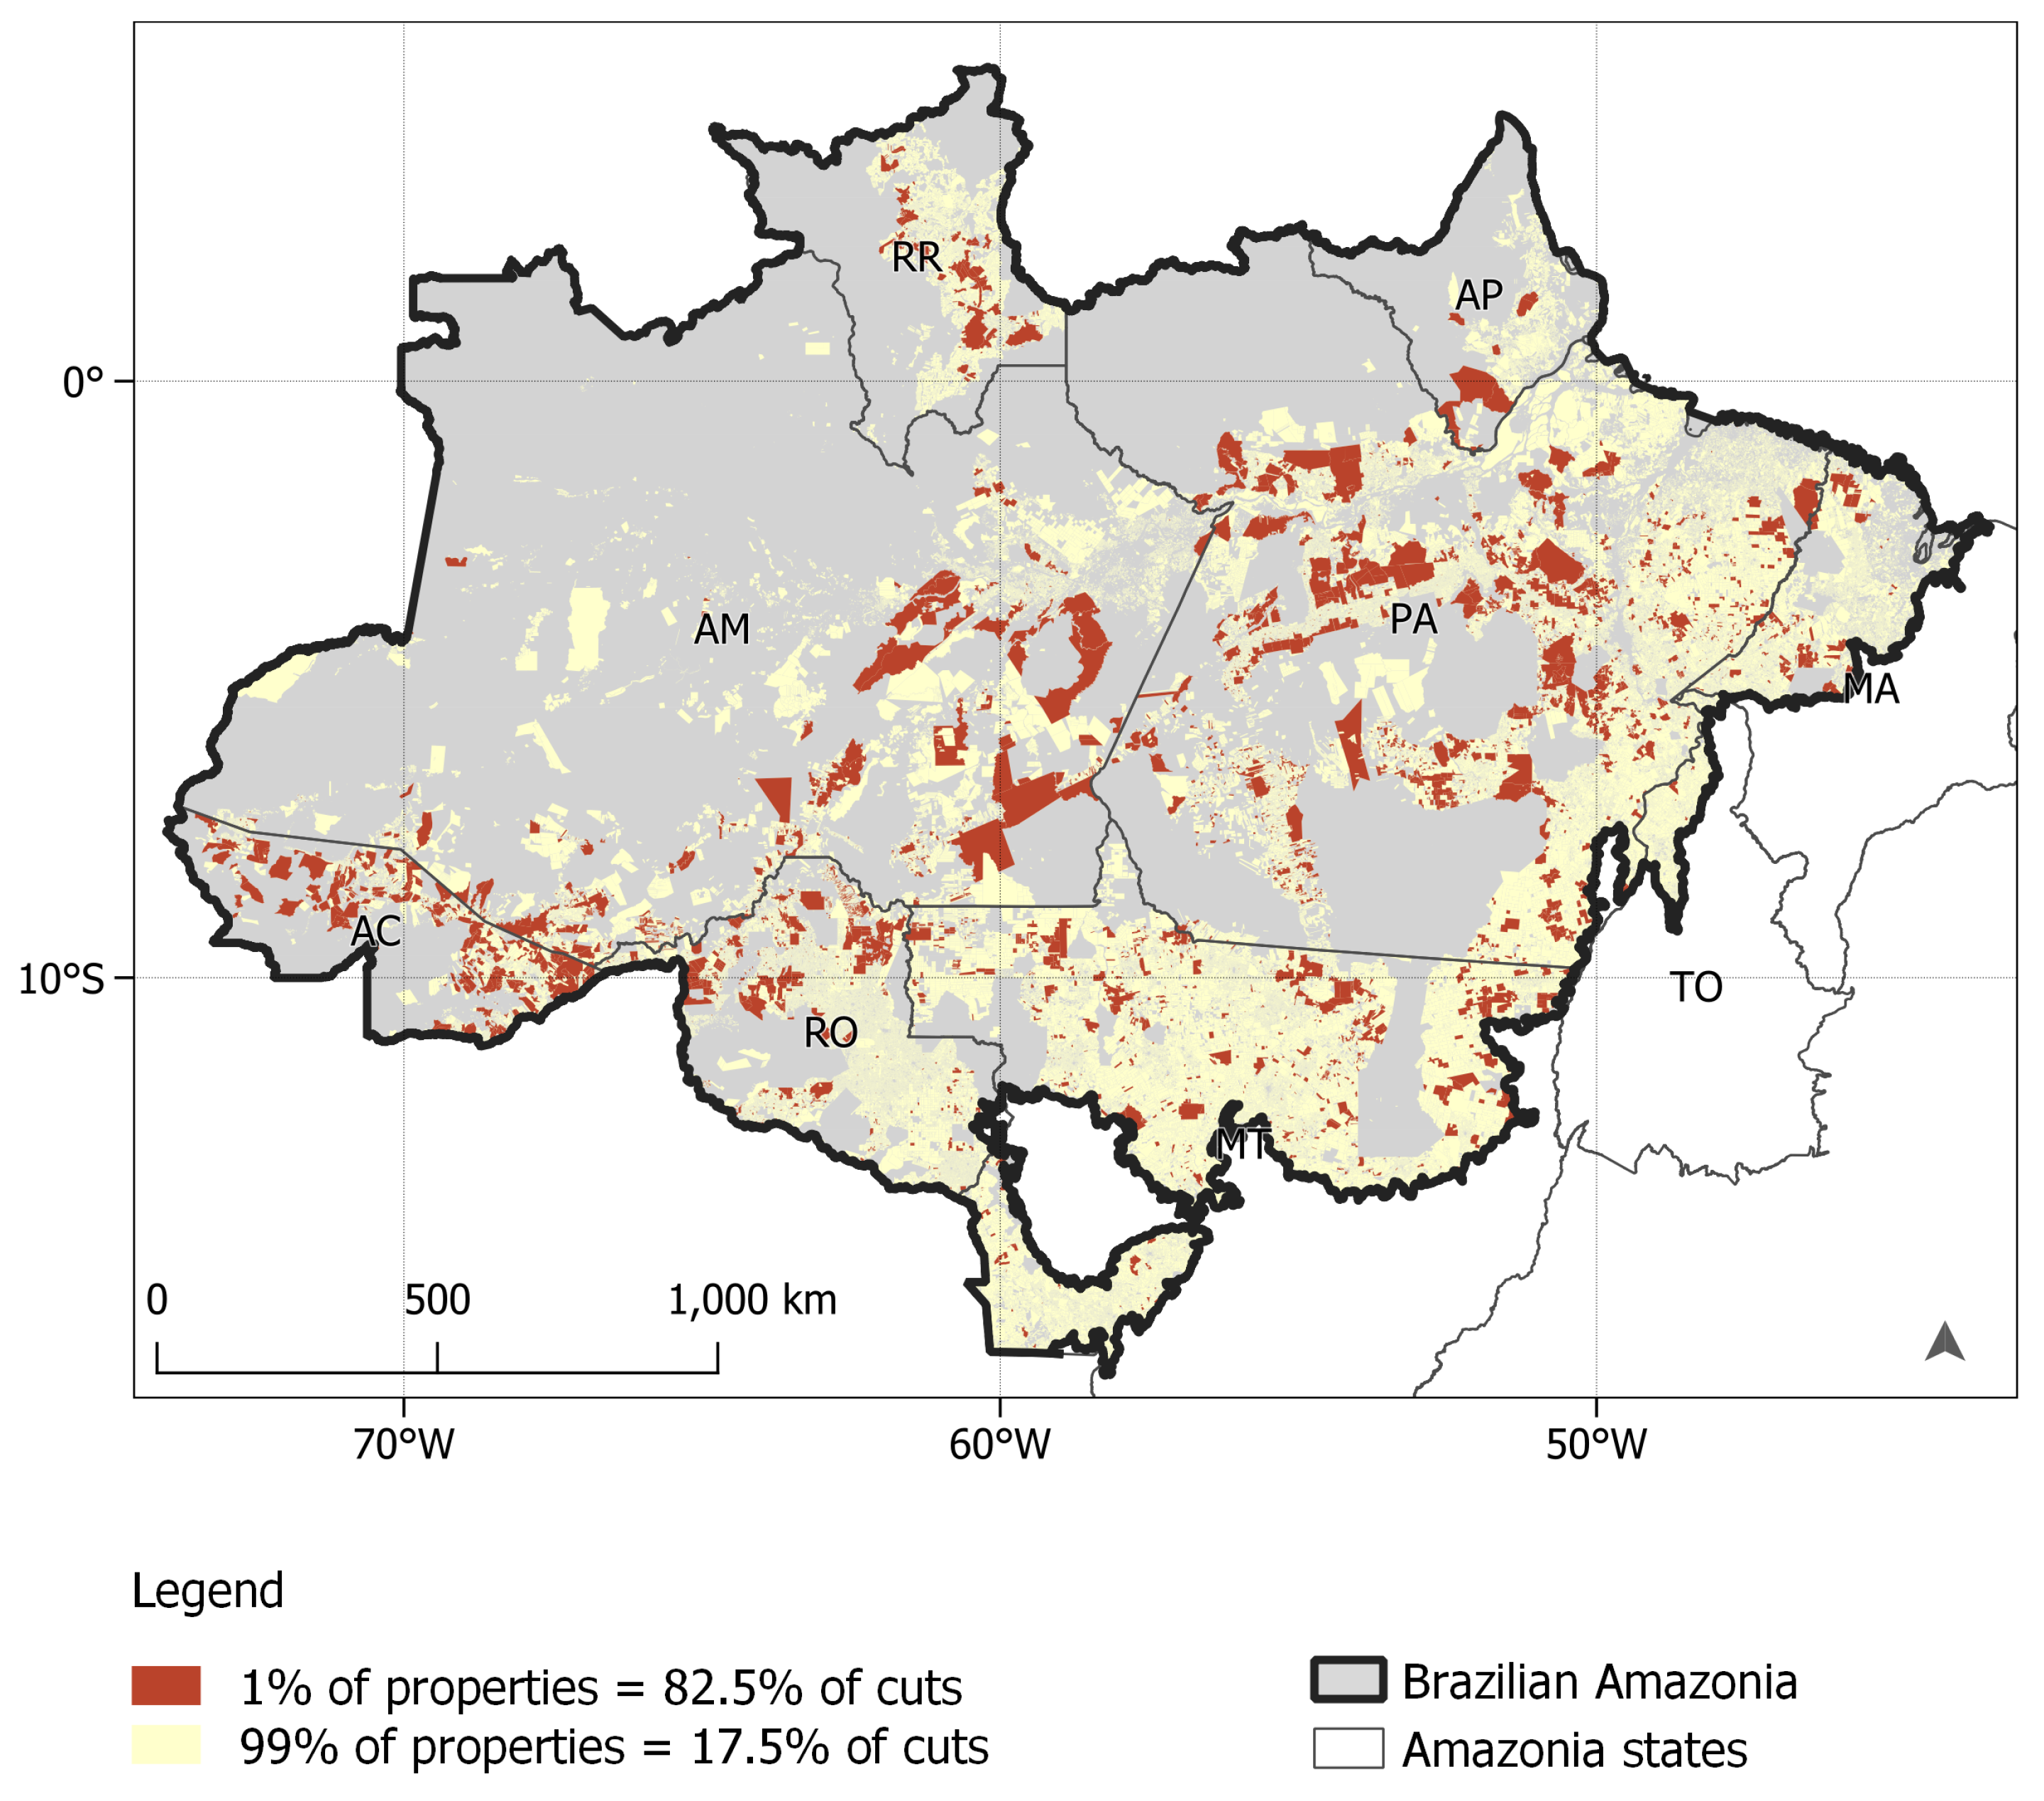
From 2008 to 2012, a time of strong government action, about 1% of the properties carried out 75% of the forest cuts. During 2018–2021, when enforcement was strongly reduced, about 0.5% of the properties did 75% of the cuts. In recent years, only 2,500 properties and settlements concentrate most of the cuts. Figure 8 shows the location of all properties and settlements in the private land tenure map. We highlight the 1% percent of properties that account for 82.5% percent of forest cuts in registered areas in 2021. Such concentration indicates that the government needs targeted control actions to prevent illegal deforestation. In the past, the lack of such detailed information led to blanket measures that punished all owners in a region, regardless of the legality of their actions [25]. As shown in this paper, associating private land tenure with deforestation supports effective law enforcement actions.

4.2. Estimating Opportunity Costs of Forest Restoration

Government actions to enforce the Forest Code and achieve Brazil’s NDC need to deal with landowners’ resistance to comply with the Law. In most cases, cleared areas are a source of income. Without compensatory policies, farmers are reluctant to recover forests [15]. Making owners restore natural vegetation in their lands will require targeted strategies. Restoration policies need to be designed according to land use, farm size, and access to credit and technology.
An alternative for direct restoration is the forest credits market. The Law allows owners with forest surpluses to offset legal reserve deficits of other properties in the same biome. Upon registration and recognition by state authorities, farmers can use their surpluses as tradable titles in the credits market. Assessing forest deficits and surpluses is thus an important element of public policies for forest preservation.
How much legal reserve deficits and surpluses exist in private properties and settlements in Amazonia? To make this estimate, we took INPE’s PRODES data for 2021 as a basis. We took the current forest areas from PRODES and added the clear-cut areas to estimate the original forest cover. Then we compared the current forest area for each property with the expect cover based on the Forest Code, thus obtaining a value of deficit or surplus for each property. The individual values are added for each group of properties by type and size to obtain the data shown in Table 3.
Our estimate of current forest area includes 5.30 Mha of secondary forests which have remained intact since 2014 in private lands and settlements. These area arise from clear-cuts which are later abandoned. If left to itself, an area of secondary forest will evolve into a native vegetation area in the long term [26]. Many secondary forests are temporary and are not part of forest restoration actions [24,27,28]. Our hypothesis is that a 9-year continuous period (since 2014) indicates areas that farmers want to recover native vegetation.
Table 3 shows the results as of 2021. There are 18.17 Mha of legal reserve deficits and 12.49 Mha of surpluses. Even if all forest surpluses are offered in the forest credits market, farmers will need to restore 5.67 Mha to comply with the Forest Code. Brazil has pledged to restore 12.0 Mha of forests in its NDC; thus, compliance with the Forest Code in Amazonia is not enough to meet Brazil’s goals. This poses a challenge to the Brazilian government. Either it will have to intervene in the forest credits market to ensure restoration goals are met, or it will need to restore 6.33 Mha in other biomes. The latter goal is hampered by the fact that legal forest mandates are less restrictive in other biomes. Furthermore, there are many obstacles to ensure farmers’ compliance with the Forest Code. To better understand these challenges, we need to consider how the type of land use in deforested areas affects farmers’ reluctance for legal compliance, as we discuss next.
To calculate the legal reserve deficits associated with each land use type, we used the 2020 data from the land use map of deforested areas (TerraClass) produced by INPE and Embrapa [18]. The land use classes identified in TerraClass include: (a) secondary forests; (b) herbaceous pasture with grasses; (c) shrubby pasture combining woody vegetation and grasses; (d) single-crop farming, mostly soybeans; (e) multi-crop farming, mostly soy-corn or soy-cotton; (f) permanent crops such as coffee, oil palm, and cocoa; (g) sugarcane; (h) planted forests. The farm areas by land use type and their legal reserve deficits for the first five land use classes are shown in Table 4. Together, the last three classes use a total area of 0.75 Mha and have a deficit of 0.24 Mha; given their small areas, these land use classes are less significant for our discussion and thus are not shown in Table 4.
In what follows, we look at potential opportunity costs for forest restoration and their consequences for public policy. Opportunity costs refer to gains foregone due to restoring forests in a piece of land instead of using it for agriculture [29,30]. These costs depend on the current and future costs and gains of land production, which are quite variable for Amazonia. Börner et al. [29] provide state-wide estimates of opportunity costs of timber extraction, extensive cattle ranching, and cash crops for the states of Amazonas and Mato Grosso. They estimate an average net present value of US$ 1,080/ha for crops and US$ 719/ha for livestock farming in Mato Grosso. Silva et al. [30] provide average shadow prices for carbon sequestration for Amazonian states. They estimate an average cost of US$ 797/ha for reforestation, corresponding to a shadow price of US$ 16 per ton of CO2 emissions removal. However, opportunity costs are affected by constraints such as soil type, distance to markets, climate conditions, and land prices. Thus, detailed calculation of these costs is outside the scope of this paper. For this reason, we limit our discussion to potential opportunity costs. To support future studies, we provide all data required to reproduce and reuse our work (see Data Availability section).
There are 5.86 Mha of secondary forests in Amazonia, with a surplus of 4.28 Mha. These are areas that have been cut after 2014 and thus have less than seven years of recovery. In principle, areas of secondary vegetation have the lowest opportunity cost to meet Brazil’s NDC target. These areas should be the focus of specific government policies that could include payments for restoration.
TerraClass maps provide information on herbaceous and shrubby pastures separately. Herbaceous pastures are areas where farmers invested in exogenous grasses that allow for a greater stocking rate. Shrubby pastures emerge as part of a pasture degradation process; if not enough money is spent on renewing pasture grasses, natural regeneration will occur, leading to a mixed land cover with grasses and shrubs [26]. As shown by Uhl et al. [26], planted pasture grasses lose vigor after three to four years. A 1994 study by Mattos and Uhl [31] estimates that restoring a degraded forest had a cost of US$ 260/ha (US$ 560 in 2022 values). In a 2017 study, Garcia et al. [32] state that maintaining high-yield pastures in Amazonia has an average yearly cost of US$ 1,335/ha. Thus, maintaining good-quality herbaceous pastures requires continuous capital investment, favoring medium and large farmers. For this reason, shrubby pastures occur most frequently (58% of the total) in small farms and settlements in Amazonia.
Herbaceous pastures (90% or more of grasses) cover 32.83 Mha, associated with big herds on medium and large farms. About one-third of these areas (10.89 Mha) have legal reserve deficits. Here, Brazil faces a substantial challenge. Should the government fail to enforce the Law on deficits of such magnitude, it will condone impunity. However, full legal compliance requires ranchers to increase the stocking rate of cattle herds by over 50%. The magnitude of this productive transformation cannot be underestimated. Moreover, cattle ranchers have a strong political presence in the region and Congress; they will press for incentives and payments for environmental services resulting from restoration. To make progress, the Brazilian government should combine intelligent credit policies and new livestock production technologies associated with strong Forest Code compliance requirements.
Shrubby pastures occupy a smaller area than herbaceous pastures (10.62 Mha), where almost one-third (3.12 Mha) should be reforested to comply with the Law. Smallholders and settlements have 6.15 Mha of shrubby pastures, of which 1.63 Mha (27%) correspond to legal reserve deficits. Farmers with areas of shrubby pasture have lower incomes than the large cattle ranchers. Forest restoration in shrubby pasture areas requires investment, given the natural regeneration rate in Amazonia [26]. Maintaining high-yield pastures can be profitable in medium to large farms, but is not viable in small farms [32]. Small farmers and settlements cannot maintain profitable livestock farms that abide by the Law. Establishing an incentive regime for forest recovery from shrubby pastures in small farms and settlements would be conducive to social justice.
Most single-crop and multi-crop farming occur in medium and large properties (4.63 Mha), with an associated deficit of 2.06 Mha (45%). Since crop producing areas have high economic value [29,33], owners of these properties are more likely to buy environmental reserve quotas than to use their lands for restoration. Given that most crop production in Amazonia goes to export [34], pressure from international markets could induce Brazilian crop producers to comply with the Law. Thus, the case of crop producers in Amazonia provides an opportunity to set up a viable forest credits market. The government has to be careful to ensure such a market promotes forest protection and social justice [35].
Our results make the case for targeted public policies to restore forests in Amazonia. These policies need to consider farm size, land use, soil and climate conditions, restoration potential, and legal reserve deficits. Secondary forests, where forest succession is already in place, need particular attention. In this scenario, an effective forest credits market can promote restoration. We argue that an efficient forest credits market can play a significant role in promoting restoration efforts. There needs to be a coupling between secondary forests and the obligations of large-scale crop producers and cattle ranchers. The initial step is to set a minimum period for secondary forest areas to be eligible for environmental reserve quotas. Large-scale crop producers and cattle ranchers need to be obligated to either restore their legal reserve deficits or buy quotas in the forest credits market. A similar policy could be set for small farmers and settlements with shrubby pastures, as it may not be economically feasible for them to be both profitable and legally compliant. In conclusion, well-designed forest restoration policies have the potential to be effective and equitable.

5. Conclusions

This work presents new information on the forest restoration challenges in Brazilian Amazonia. We show that a valid private land tenure cadastre is essential for meeting the targets of reducing land use emissions and promoting forest restoration set in Brazil’s NDC. The paper presents a set of methods for producing a clean version of the CAR and for estimating compliance of landowners with the Forest Code. The Brazilian government could consider employing similar methods to those presented in the paper to speed up official validation of the cadastre.
An official CAR will also help to reduce deforestation. In terms of law enforcement, each year a few farms and settlements are responsible for most forest cuts in private lands; most deforestation is illegal. Thus, targeted command-and-control actions would help Brazil to achieve zero illegal deforestation.
Once the CAR is completed, the government can establish a forest credits market based on environmental reserve quotas. Large-scale crop producers and cattle ranchers are likely to use environmental reserve quotas to meet their legal reserve deficits. This demand needs to be matched by offering forest credits. These credits could come from small farmers and settlements that would restore their lands and use the resulting surpluses in the quota market to compensate for their foregone opportunity costs. Therefore, by validating the CAR, focusing on the few landowners that deforest the most, using public credits to enforce forest restoration, and building a viable credits market, Brazil can protect the Amazon rain forest with a stable arrangement that combines production with protection.

Author Contributions

G.C. conceived and designed the study, interpreted the results and was the main writer of the manuscript. R.S., H.R., and P.A. produced the maps of land tenure, forest protection, and areas of permanent preservation, developed scripts for data analysis, discussed the results, and supported writing of the manuscript; A.S. and F.R. supported the study conception and revised the manuscript at various stages; R.R. and M.S. performed additional data analysis; C.A. and L.M. produced the deforestation maps, analysed the results, and revised the final drafts; I.S., A.C., J.E., J.A., A.V., M.A. produced the land use map, analysed the results and revised the final drafts. All authors reviewed the results and approved the final version of the manuscript.

Data Availability Statement

The original data used in this study was obtained from Brazilian public institutions listed in Section 2 of the paper. Data from public institutions in Brazil is open by legal mandate as stated in Federal Decree 6.666/2008. The maps, scripts, and tables necessary to reproduce and reuse the results of this paper are publicly available from the figshare open repository using DOI 10.6084/m9.figshare.22129325. The authors take full responsibility for the integrity of the data and the accuracy of its analysis.

Acknowledgments

This work was partially funded by the International Climate Initiative (IKI) of the German Ministry of Environment, Nature Conservation, and Nuclear Safety, through grant 17-III-084- Global-A-RESTORE+ (“RESTORE+: Addressing Landscape Restoration on Degraded Land in Indonesia and Brazil”). It was also supported by the Amazon Fund, through the BNDES/FUNCATE agreement 17.2.0536.1 (project “Monitoring of Brazilian Biomes”). Additional resources were provided by Microsoft, Group on Earth Observations, and Instituto Clima e Sociedade. The European Commission also contributed through the Horizon Europe program, with funding from the project “Open Earth Monitor” (project no. 101059548). The TerraClass project (INPE/Embrapa) is supported by the World Bank and the Centro Gestor e Operacional do Sistema de Proteção da Amazônia (CENSIPAM). The PRODES system is funded by the Ministry of Science and Technology of the government of Brazil, through action 20V9 (“Monitoring of the Budget of Brazilian Biomes”), with additional support from the National Council for Scientific Development (CNPq), through process 444418/2018-0.

Conflicts of Interest

The authors declare no competing interest.

References

  1. INPE. Amazon Deforestation Monitoring Project (PRODES). Technical report, National Institute for Space Research, Brazil, 2022.
  2. Chiavari, J.; Lopes, C.L. Forest and Land Use Policies on Private Lands: An International Comparison. Technical report, Climate Policy Initiative / PUC-Rio, 2017.
  3. Soterroni, A.C.; Mosnier, A.; Carvalho, A.X.Y.; Camara, G.; Obersteiner, M.; Andrade, P.R.; Souza, R.C.; Brock, R.; Pirker, J.; Kraxner, F.; Havlik, P.; Kapos, V.; Ermgassen, E.; Valin, H.; Ramos, F.M. Future Environmental and Agricultural Impacts of Brazil’s Forest Code. Environmental Research Letters 2018, 13, 074021. [Google Scholar] [CrossRef]
  4. Chiavari, J.; Lopes, C.; Araujo, J. Onde Estamos Na Implementação Do Código Florestal? Radiografia Do CAR e Do PRA Nos Estados Brasileiros (Implementation of Forest Code - Current Status). Technical report, Climate Policy Initiative / PUC-Rio, 2021.
  5. Soares-Filho, B.; Rajao, R.; Macedo, M.; Carneiro, A.; Costa, W.; Coe, M.; Rodrigues, H.; Alencar, A. Cracking Brazil’s Forest Code. Science 2014, 344, 363–364. [Google Scholar] [CrossRef] [PubMed]
  6. Rajão, R.; Soares-Filho, B.; Nunes, F.; Börner, J.; Machado, L.; Assis, D.; Oliveira, A.; Pinto, L.; Ribeiro, V.; Rausch, L.; Gibbs, H.; Figueira, D. The Rotten Apples of Brazil’s Agribusiness. Science 2020, 369, 246–248. [Google Scholar] [CrossRef] [PubMed]
  7. Guidotti, V.; Ferraz, S.F.d.B.; Pinto, L.F.G.; Sparovek, G.; Taniwaki, R.H.; Garcia, L.G.; Brancalion, P.H.S. Changes in Brazil’s Forest Code Can Erode the Potential of Riparian Buffers to Supply Watershed Services. Land Use Policy 2020, 94, 104511. [Google Scholar] [CrossRef]
  8. Stabile, M.C.C.; Guimarães, A.L.; Silva, D.S.; Ribeiro, V.; Macedo, M.N.; Coe, M.T.; Pinto, E.; Moutinho, P.; Alencar, A. Solving Brazil’s Land Use Puzzle: Increasing Production and Slowing Amazon Deforestation. Land Use Policy 2020, 91, 104362. [Google Scholar] [CrossRef]
  9. Brites, A.; Mello, K. O Avanco Da Implementacao Do Codigo-Florestal No Brasil (Progress in Forest Code Implementation in Brazil). Technical report, Observatorio do Codigo Florestal, 2021.
  10. CSR. Panorama Codigo Florestal Brasileiro (Status of Brazil’s Forest Code). Technical report, Centro de Sensoriamento Remoto, UFMG, 2022.
  11. Drummond, J.A.; Franco, J.L.d.A.; Ninis, A.B. Brazilian Federal Conservation Units: A Historical Overview of Their Creation and of Their Current Status. Environment and History 2009, 15, 463–491. [Google Scholar] [CrossRef]
  12. Foresta, R.A. Amazonia and the Politics of Geopolitics. Geographical Review 1992, 82, 128–142. [Google Scholar] [CrossRef]
  13. Pereira, A.S.A.d.P.; dos Santos, V.J.; Alves, S.d.C.; Amaral e Silva, A.; da Silva, C.G.; Calijuri, M.L. Contribution of Rural Settlements to the Deforestation Dynamics in the Legal Amazon. Land Use Policy 2022, 115, 106039. [Google Scholar] [CrossRef]
  14. Sparovek, G.; Reydon, B.P.; Guedes Pinto, L.F.; Faria, V.; de Freitas, F.L.M.; Azevedo-Ramos, C.; Gardner, T.; Hamamura, C.; Rajão, R.; Cerignoni, F.; Siqueira, G.P.; Carvalho, T.; Alencar, A.; Ribeiro, V. Who Owns Brazilian Lands? Land Use Policy 2019, 87, 104062. [Google Scholar] [CrossRef]
  15. Azevedo, A.A.; Rajão, R.; Costa, M.A.; Stabile, M.C.C.; Macedo, M.N.; dos Reis, T.N.P.; Alencar, A.; Soares-Filho, B.S.; Pacheco, R. Limits of Brazil’s Forest Code as a Means to End Illegal Deforestation. Proceedings of the National Academy of Sciences 2017, 114, 7653–7658. [Google Scholar] [CrossRef]
  16. Dockendorff, C.; Fuss, S.; Agra, R.; Guye, V.; Herrera, D.; Kraxner, F. Committed to Restoring Tropical Forests: An Overview of Brazil’s and Indonesia’s Restoration Targets and Policies. Environmental Research Letters 2022, 17, 093002. [Google Scholar] [CrossRef]
  17. Azevedo-Ramos, C.; Moutinho, P.; Arruda, V.L.d.S.; Stabile, M.C.C.; Alencar, A.; Castro, I.; Ribeiro, J.P. Lawless Land in No Man’s Land: The Undesignated Public Forests in the Brazilian Amazon. Land Use Policy 2020, 99, 104863. [Google Scholar] [CrossRef]
  18. Almeida, C.; Coutinho, A.; Esquerdo, J.; Adami, M.; Venturieri, A.; Diniz, C.; Dessay, N.; Durieux, L.; Gomes, A. High Spatial Resolution Land Use and Land Cover Mapping of the Brazilian Legal Amazon in 2008 Using Landsat-5/TM and MODIS Data. Acta Amazonica 2016, 46, 291–302. [Google Scholar] [CrossRef]
  19. EMBRAPA. SIAGEO Amazônia (Sistema Interativo de Análise Geoespacial Da Amazônia Legal). https://www.amazonia.cnptia.embrapa.br/, 2022.
  20. Souza Jr, C.M.; Z. Shimbo, J.; Rosa, M.R.; Parente, L.L.; A. Alencar, A.; Rudorff, B.F.T.; Hasenack, H.; Matsumoto, M.; G. Ferreira, L.; Souza-Filho, P.W.M.; de Oliveira, S.W.; Rocha, W.F.; Fonseca, A.V.; Marques, C.B.; Diniz, C.G.; Costa, D.; Monteiro, D.; Rosa, E.R.; Vélez-Martin, E.; Weber, E.J.; Lenti, F.E.B.; Paternost, F.F.; Pareyn, F.G.C.; Siqueira, J.V.; Viera, J.L.; Neto, L.C.F.; Saraiva, M.M.; Sales, M.H.; Salgado, M.P.G.; Vasconcelos, R.; Galano, S.; Mesquita, V.V.; Azevedo, T. Reconstructing Three Decades of Land Use and Land Cover Changes in Brazilian Biomes with Landsat Archive and Earth Engine. Remote Sensing 2020, 12, 2735. [CrossRef]
  21. Rosim, S.; Rennó, C.D. TerraHidro: A Distributed Hydrology Modelling System With High Quality Drainage Extraction. GEOProcessing 2013: The Fifth International Conference on Advanced Geographic Information Systems, Applications, and Services, 2013, p. 7.
  22. da Costa, F.R.; de Souza, R.F.; da Silva, S.M.P. Análise comparativa de metodologias aplicadas à delimitação da bacia hidrográfica do Rio Doce - RN (Comparative analysis of methodologies applied to the demarcation of the basin of Rio Doce - RN). Sociedade & Natureza 2016, 28. [Google Scholar]
  23. Aguiar, A.; Camara, G.; Escada, I. Spatial Statistical Analysis of Land-Use Determinants in the Brazilian Amazonia: Exploring Intra-Regional Heterogeneity. Ecological Modelling 2007, 209, 169–188. [Google Scholar] [CrossRef]
  24. Schielein, J.; Borner, J. Recent Transformations of Land-Use and Land-Cover Dynamics across Different Deforestation Frontiers in the Brazilian Amazon. Land Use Policy 2018, 76, 81–94. [Google Scholar] [CrossRef]
  25. Cruz, D.C.; Benayas, J.M.R.; Ferreira, G.C.; Santos, S.R.; Schwartz, G. An Overview of Forest Loss and Restoration in the Brazilian Amazon. New Forests 2021, 52, 1–16. [Google Scholar] [CrossRef]
  26. Uhl, C.; Buschbacher, R.; Serrao, E.A.S. Abandoned Pastures in Eastern Amazonia. I. Patterns of Plant Succession. Journal of Ecology 1988, 76, 663–681. [Google Scholar] [CrossRef]
  27. Tyukavina, A.; Hansen, M.C.; Potapov, P.V.; Stehman, S.V.; Smith-Rodriguez, K.; Okpa, C.; Aguilar, R. Types and Rates of Forest Disturbance in Brazilian Legal Amazon, 2000–2013. Science Advances 2017, 3. [Google Scholar] [CrossRef]
  28. Picoli, M.C.A.; Rorato, A.; Leitão, P.; Camara, G.; Maciel, A.; Hostert, P.; Sanches, I.D. Impacts of Public and Private Sector Policies on Soybean and Pasture Expansion in Mato Grosso—Brazil from 2001 to 2017. Land 2020, 9, 20. [Google Scholar] [CrossRef]
  29. Börner, J.; Wunder, S. Paying for Avoided Deforestation in the Brazilian Amazon: From Cost Assessment to Scheme Design. International Forestry Review 2008, 10, 496–511. [Google Scholar] [CrossRef]
  30. Silva, F.d.F.; Perrin, R.K.; Fulginiti, L.E. The Opportunity Cost of Preserving the Brazilian Amazon Forest. Agricultural Economics 2019, 50, 219–227. [Google Scholar] [CrossRef]
  31. Mattos, M.M.; Uhl, C. Economic and Ecological Perspectives on Ranching in the Eastern Amazon. World Development 1994, 22, 145–158. [Google Scholar] [CrossRef]
  32. Garcia, E.; Ramos Filho, F.S.V.; Mallmann, G.M.; Fonseca, F. Costs, Benefits and Challenges of Sustainable Livestock Intensification in a Major Deforestation Frontier in the Brazilian Amazon. Sustainability 2017, 9, 158. [Google Scholar] [CrossRef]
  33. Spera, S.A.; Cohn, A.S.; VanWey, L.K.; Mustard, J.F.; Rudorff, B.F.; Risso, J.; Adami, M. Recent Cropping Frequency, Expansion, and Abandonment in Mato Grosso, Brazil Had Selective Land Characteristics. Environmental Research Letters 2014, 9, 064010. [Google Scholar] [CrossRef]
  34. zu Ermgassen, E.K.H.J.; Ayre, B.; Godar, J.; Lima, M.G.B.; Bauch, S.; Garrett, R.; Green, J.; Lathuillière, M.J.; Löfgren, P.; MacFarquhar, C.; Meyfroidt, P.; Suavet, C.; West, C.; Gardner, T. Using Supply Chain Data to Monitor Zero Deforestation Commitments: An Assessment of Progress in the Brazilian Soy Sector. Environmental Research Letters 2020, 15, 035003. [Google Scholar] [CrossRef]
  35. May, P.H.; Bernasconi, P.; Wunder, S.; Lubowski, R. Environmental Reserve Quotas in Brazil’s New Forest Legislation: An Ex Ante Appraisal. Technical report, Center for International Forestry Research (CIFOR), 2015. [CrossRef]
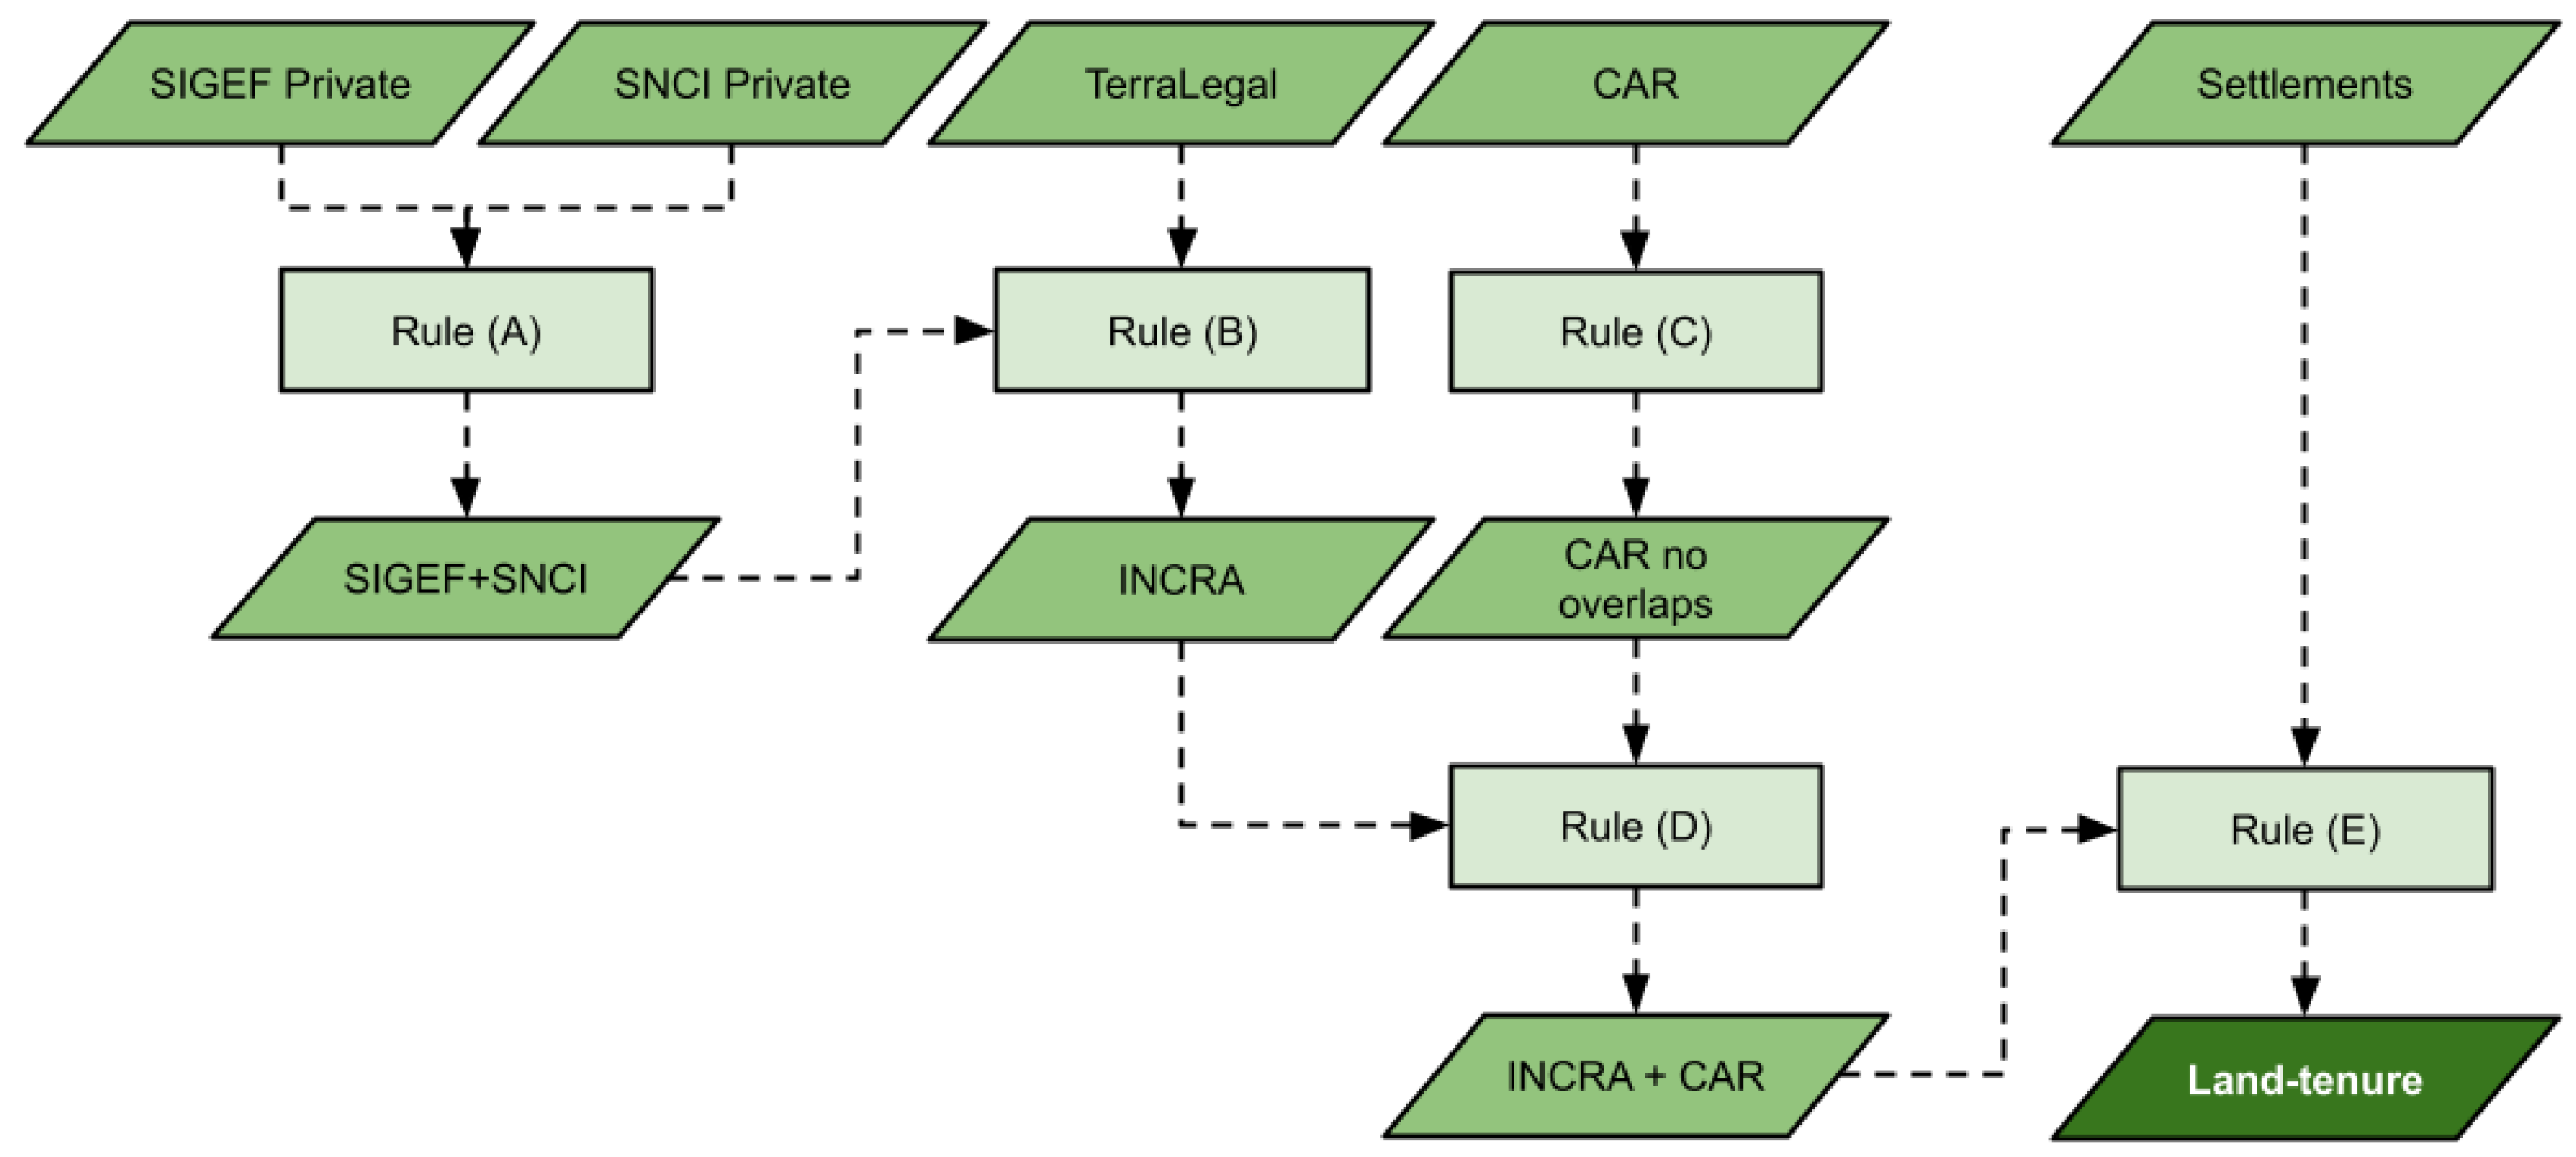
Figure 1. Steps to generate the private land tenure map.
Preprints 69988 g001
Figure 2. Resolving overlaps in CAR using rule (C) (a) before correction; and (b) after removals and adjustments. Dark areas in the left images denote overlapping property claims in CAR.
Preprints 69988 g002
Figure 3. Rural properties and settlements in Amazonia by size (ha).
Preprints 69988 g003
Figure 4. Map of forest protection mandates, including inland water areas and non-forest vegetation.
Preprints 69988 g004
Figure 5. Deforestation area by land tenure type (2008-2021).
Preprints 69988 g005
Figure 6. Legal and illegal deforestation in Amazonia biome (2008-2021).
Preprints 69988 g006
Figure 7. Cumulative distribution of deforestation on properties and settlements.
Preprints 69988 g007
Figure 8. Private land tenure in Amazonia, showing 4,737 properties (1%) responsible for 82.5% of deforestation inside private lands and settlements in 2021.
Preprints 69988 g008
Table 1. List of land databases for Brazil.
Type Description Source Year
Public Indigenous lands FUNAI 2021
land tenure Conservation units ICMBIO 2021
Quilombola lands INCRA 2021
Rural settlements INCRA 2021
Undesignated CNFP 2016
public forests
Private SIGEF (rural properties) INCRA 2021
land tenure SNCI (rural properties) INCRA 2021
Terra Legal (rural properties) INCRA 2019
CAR (Self-declared SFB 2021
environmental cadastre)
Land use and PRODES (deforestation) INPE 2021
land cover MapBiomas 1985–1998 MapBiomas 2022
TerraClass INPE/Embrapa 2020
Ecological SIAGEO (areas where Embrapa 2022
economic zones legal reserve is reduced)
Table 2. Public land tenure in Amazonia.
Category Amount Total Area (Mha)
Indigenous lands 357 108.6
Quilombola lands 128 1.7
Fully protected conservation units 116 35.7
Sustainable use conservation units 232 41.2
Military use 1 2.2
Undesignated public forests 61.6
Total 251.0
Table 3. Total forest and deforested area, and legal reserve surpluses and deficit per property size for year 2021.
Farm Type Farm Size Total Forest (Mha) Deficit (Mha) Surplus (Mha)
Private 0-200 ha 19.0 0.99 0.48
properties 200-1000 ha 22.8 3.81 1.55
> 1000 ha 65.1 7.67 8.20
Settlements 30.6 5.70 2.26
Total 137.5 18.17 12.49
Table 4. Area and legal reserve deficits per land use and farm size on private land tenure properties in Amazonia.
Land use Farm type Farm Size (ha) Area (Mha) Deficit (Mha)
Secondary private 0-200 1.29 0.10
forests 200-1000 1.15 0.32
> 1000 2.07 0.65
settlements 1.35 0.51
Total 5.86 1.58
Herbaceous private 0-200 7.68 0.59
pasture 200-1000 6.80 2.28
> 1000 10.69 4.45
settlements 7.66 3.57
Total 32.83 10.89
Shrubby private 0-200 2.65 0.26
pasture 200-1000 1.84 0.60
> 1000 2.63 0.89
settlements 3.50 1.37
Total 10.62 3.12
Single-crop private 0-200 0.10 0.01
farming 200-1000 0.20 0.08
> 1000 0.37 0.16
settlements 0.07 0.03
Total 0.74 0.28
Multi-crop private 0-200 0.50 0.02
farming 200-1000 1.30 0.45
> 1000 2.76 1.37
settlements 0.27 0.19
Total 4.83 2.03
Disclaimer/Publisher’s Note: The statements, opinions and data contained in all publications are solely those of the individual author(s) and contributor(s) and not of MDPI and/or the editor(s). MDPI and/or the editor(s) disclaim responsibility for any injury to people or property resulting from any ideas, methods, instructions or products referred to in the content.
Copyright: This open access article is published under a Creative Commons CC BY 4.0 license, which permit the free download, distribution, and reuse, provided that the author and preprint are cited in any reuse.
Prerpints.org logo

Preprints.org is a free preprint server supported by MDPI in Basel, Switzerland.

Subscribe

© 2024 MDPI (Basel, Switzerland) unless otherwise stated