1. Introduction
The electricity grid is a complex system that interconnects generators and consumers of electricity through transmission and distribution infrastructure. The frequency of the supplied voltage is thus a critical parameter that must be kept constant and resilient despite the numerous factors that affect its stability. Indeed, variations in the frequency of the electrical grid can have serious consequences at the local and large-scale levels, including blackouts and damage to electrical equipment [
1,
2].
In the last decade, a considerable increase in number of frequency fluctuations in the grid has been detected, mainly due to the penetration of distributed renewable energy sources [
3], and synchronous generators being replaced by power inverters, thus reducing the grid's inertia and increasing the degree of relative instability [
4]. Additionally, certain renewable energy sources, such as solar photovoltaic or wind power, are unpredictable and fluctuate, introducing new terms of randomness, in addition to traditional sources of internal noise, into the process of stability characterization [
5,
6].
Unscheduled energy demand also affects grid stability. For example, during high demand periods, such as peak hours, generation may not be sufficient to meet it, causing subsequent frequency fluctuations. Therefore, adequate control and regulation systems are necessary to maintain a sufficient level of relative stability. In these systems, monitoring, analysis, and characterization of the fluctuation pattern play a crucial role [
7,
8]
.
In this paper, after performing a data analysis with MATLAB
TM, the hourly points of maximum and minimum frequency were detected using two different algorithms. The frequency data was obtained based on the methods described in previous work [
9]. Analyzing the production data provided by the official website of the Spanish Electric Network, we searched for a relationship between different energy sources, including renewable sources (wind, solar photovoltaic, hydropower, solar thermal), and combined-cycle power plants [
10].
The results show that the gradient of hydropower is correlated with the appearance of the aforementioned local frequency maxima and minima, while the gradient is positive, the tendency is the appearance of maxima, existing the same relationship between negative gradient and minima.
This caracterization will allow, on the one hand, to provide quantitative information on the range of frequency variation in a real case. On the other hand, correction mechanisms for corrective maintenance actions can be implemented based on the models.
The paper is structured as follows. After this introduction, the methodology is presented in the next section.
Section 3 details the results, which are subsequently discussed in
Section 4. Finally, the conclusions are drawn in Section 5.
2. Experimental methodology
Two datasets have been used: measurements of the frequency and production data of the grid.
The former is extracted from a database of the research group PAIDI-TIC-168, of the University of Cadiz. This dataset collects the values of the grid frequency measured every 10 seconds online.
The second dataset collects grid power production data, which includes real, forecasted, and scheduled power, as well as power generated from different energy technologies (nuclear, coal, combined-cycle, renewables, etc.) [
11].
First, the network signal was acquired at the Algeciras Technical School of Engineering using hardware, which essentially consists of a chassis and a data acquisition card (DAQ) from the manufacturer NI™, which receives on one hand the voltage input (50 Hz, 230 V RMS) of the electricity grid, and on the other hand, the pulsed signal (1 PPS) from the GPS receiver (Symmetricon™) [
9].
Once the frequency signal was obtained, several sudden fluctuations in the instantaneous frequency of the grid were identified, which occurred during the hourly blocks of the electricity market, i.e., during peak hours. Two algorithms have been programmed to search for these changes using MATLABTM software, which are detailed below:
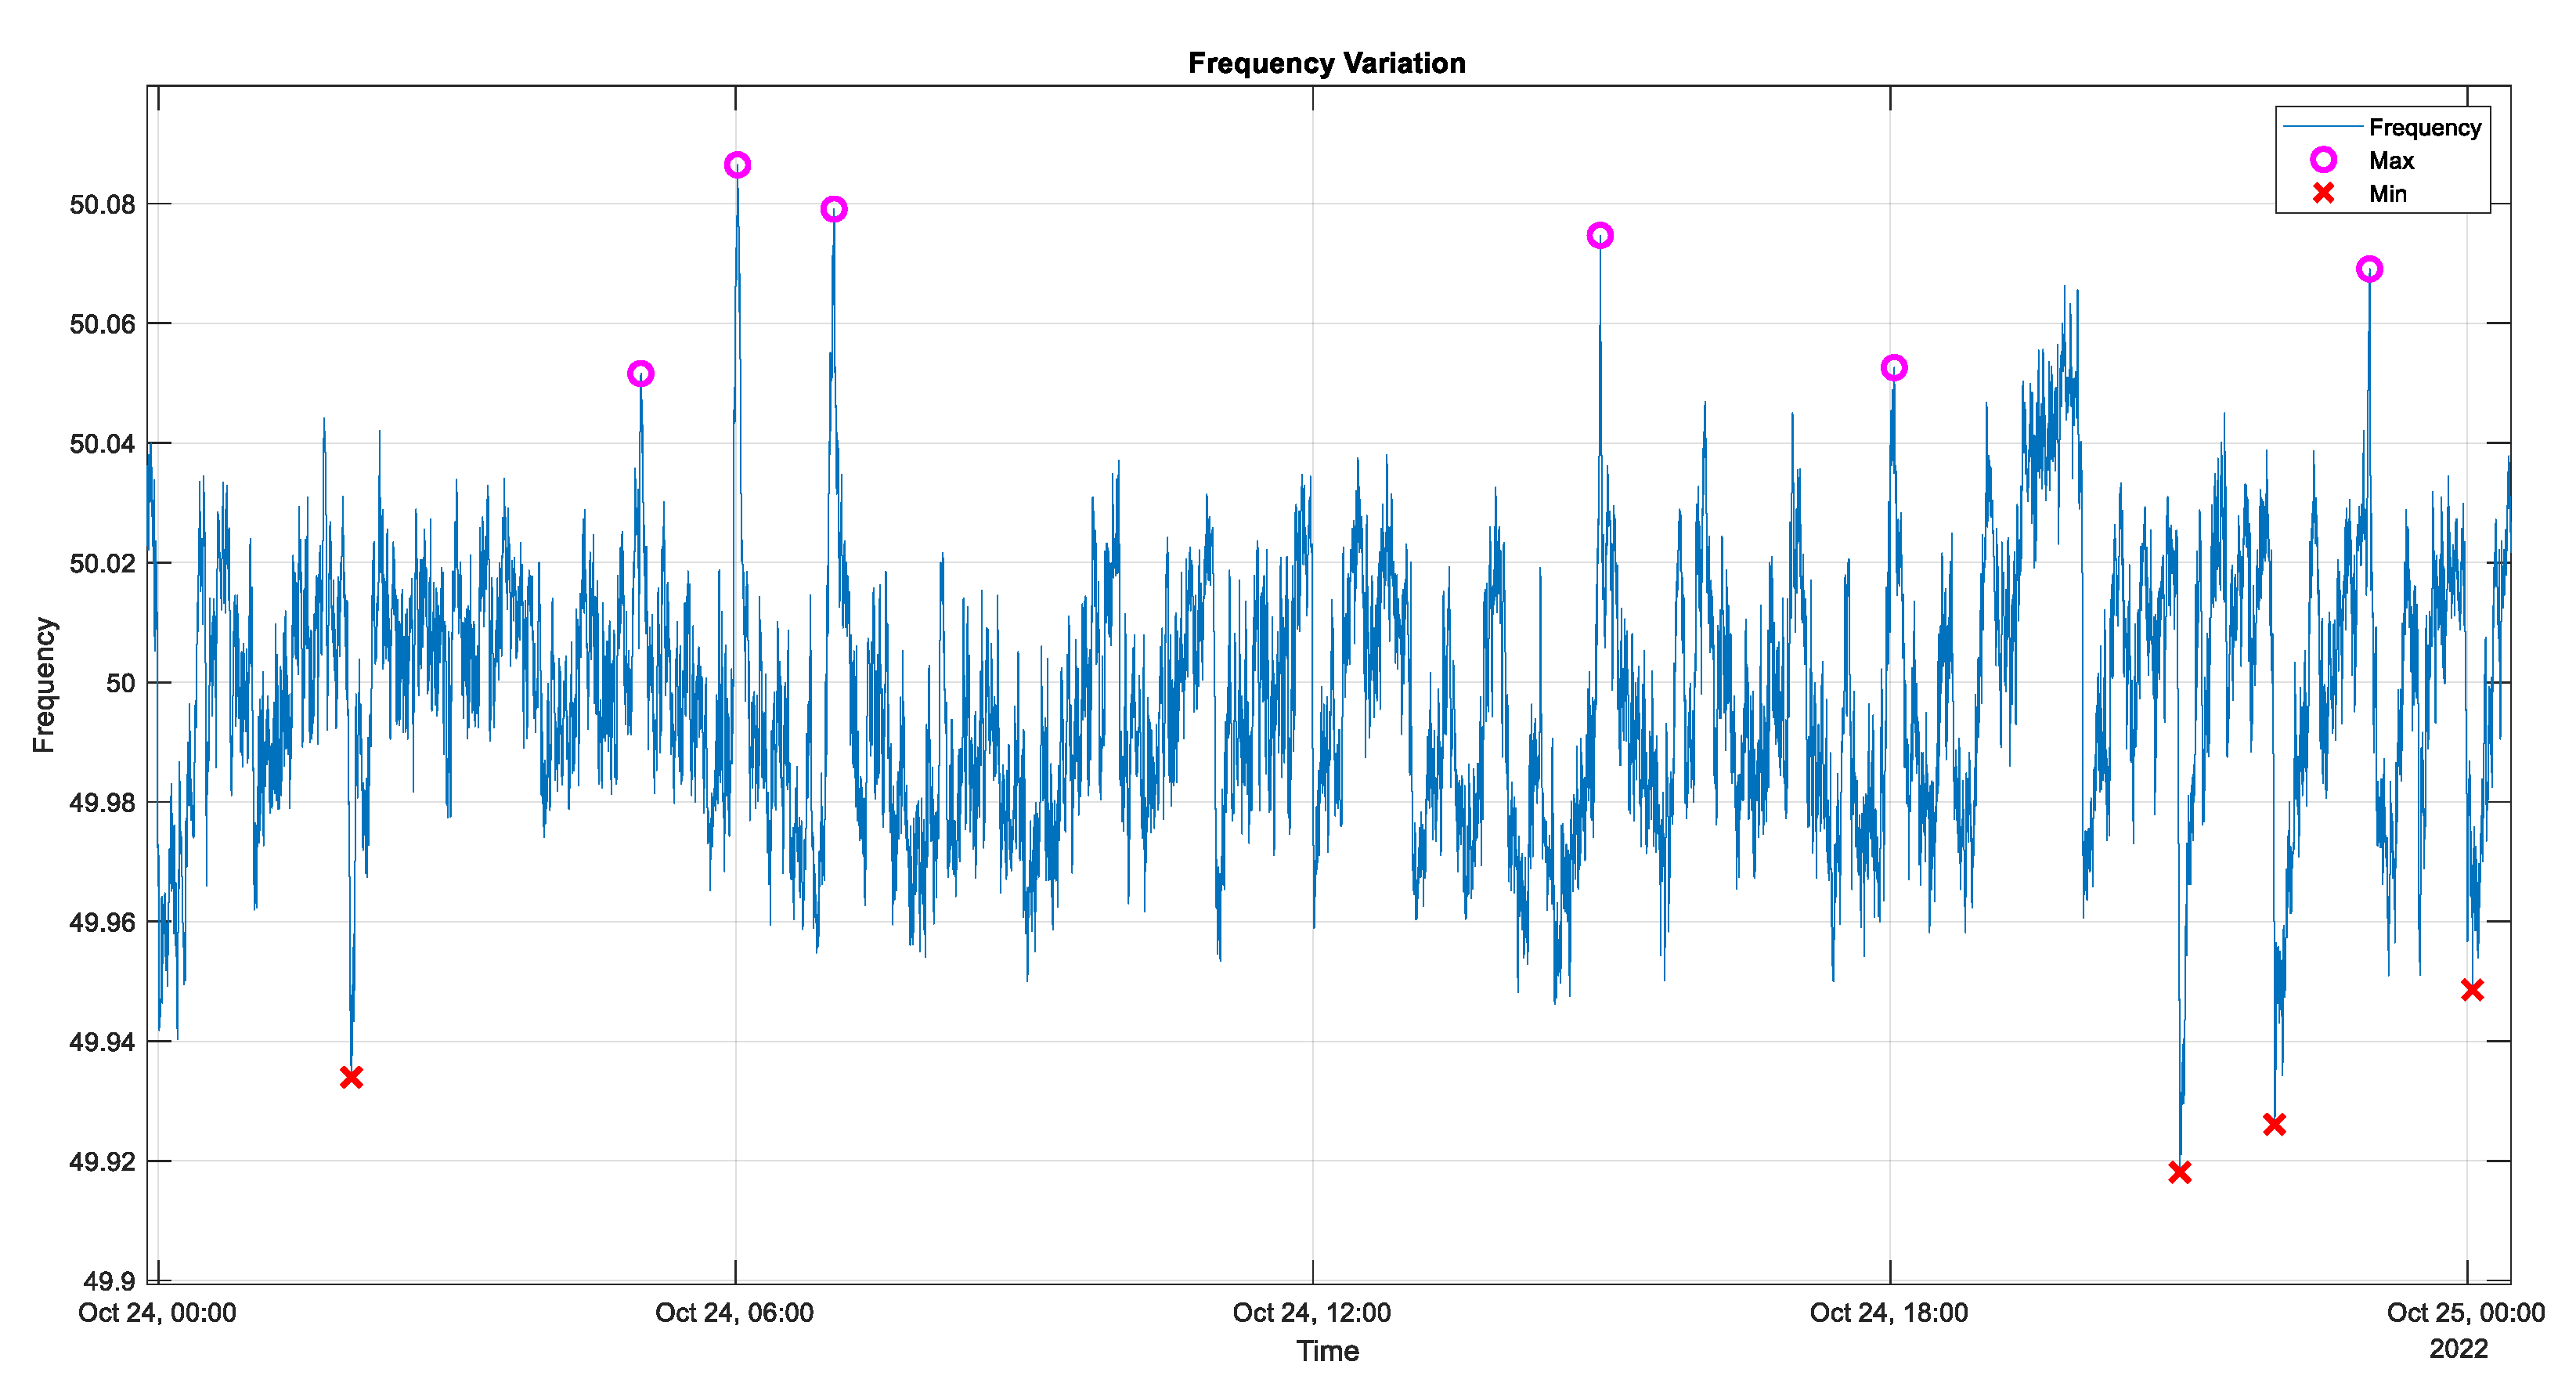
This method is based on stabilizing signals with weak damping around a final value. An algorithm was developed using the MATLABTM function "Findpeaks", which locates local extremes. The method identifies the first location using the "MinPeakHeight" and "MinPeakDistance" parameters of the "findpeaks" function, and identifies the second location by first inverting the signal so that the local minimum of the signal becomes the local maximum, and then using the same parameters to locate the R peak. Under these conditions, a search for these extremes was performed and the algorithm identified the following extremes over the course of a month.
Figure 1.
Local máxima and mínima detection on October 24th, 2022, using the “specular inertia” method.
Figure 1.
Local máxima and mínima detection on October 24th, 2022, using the “specular inertia” method.
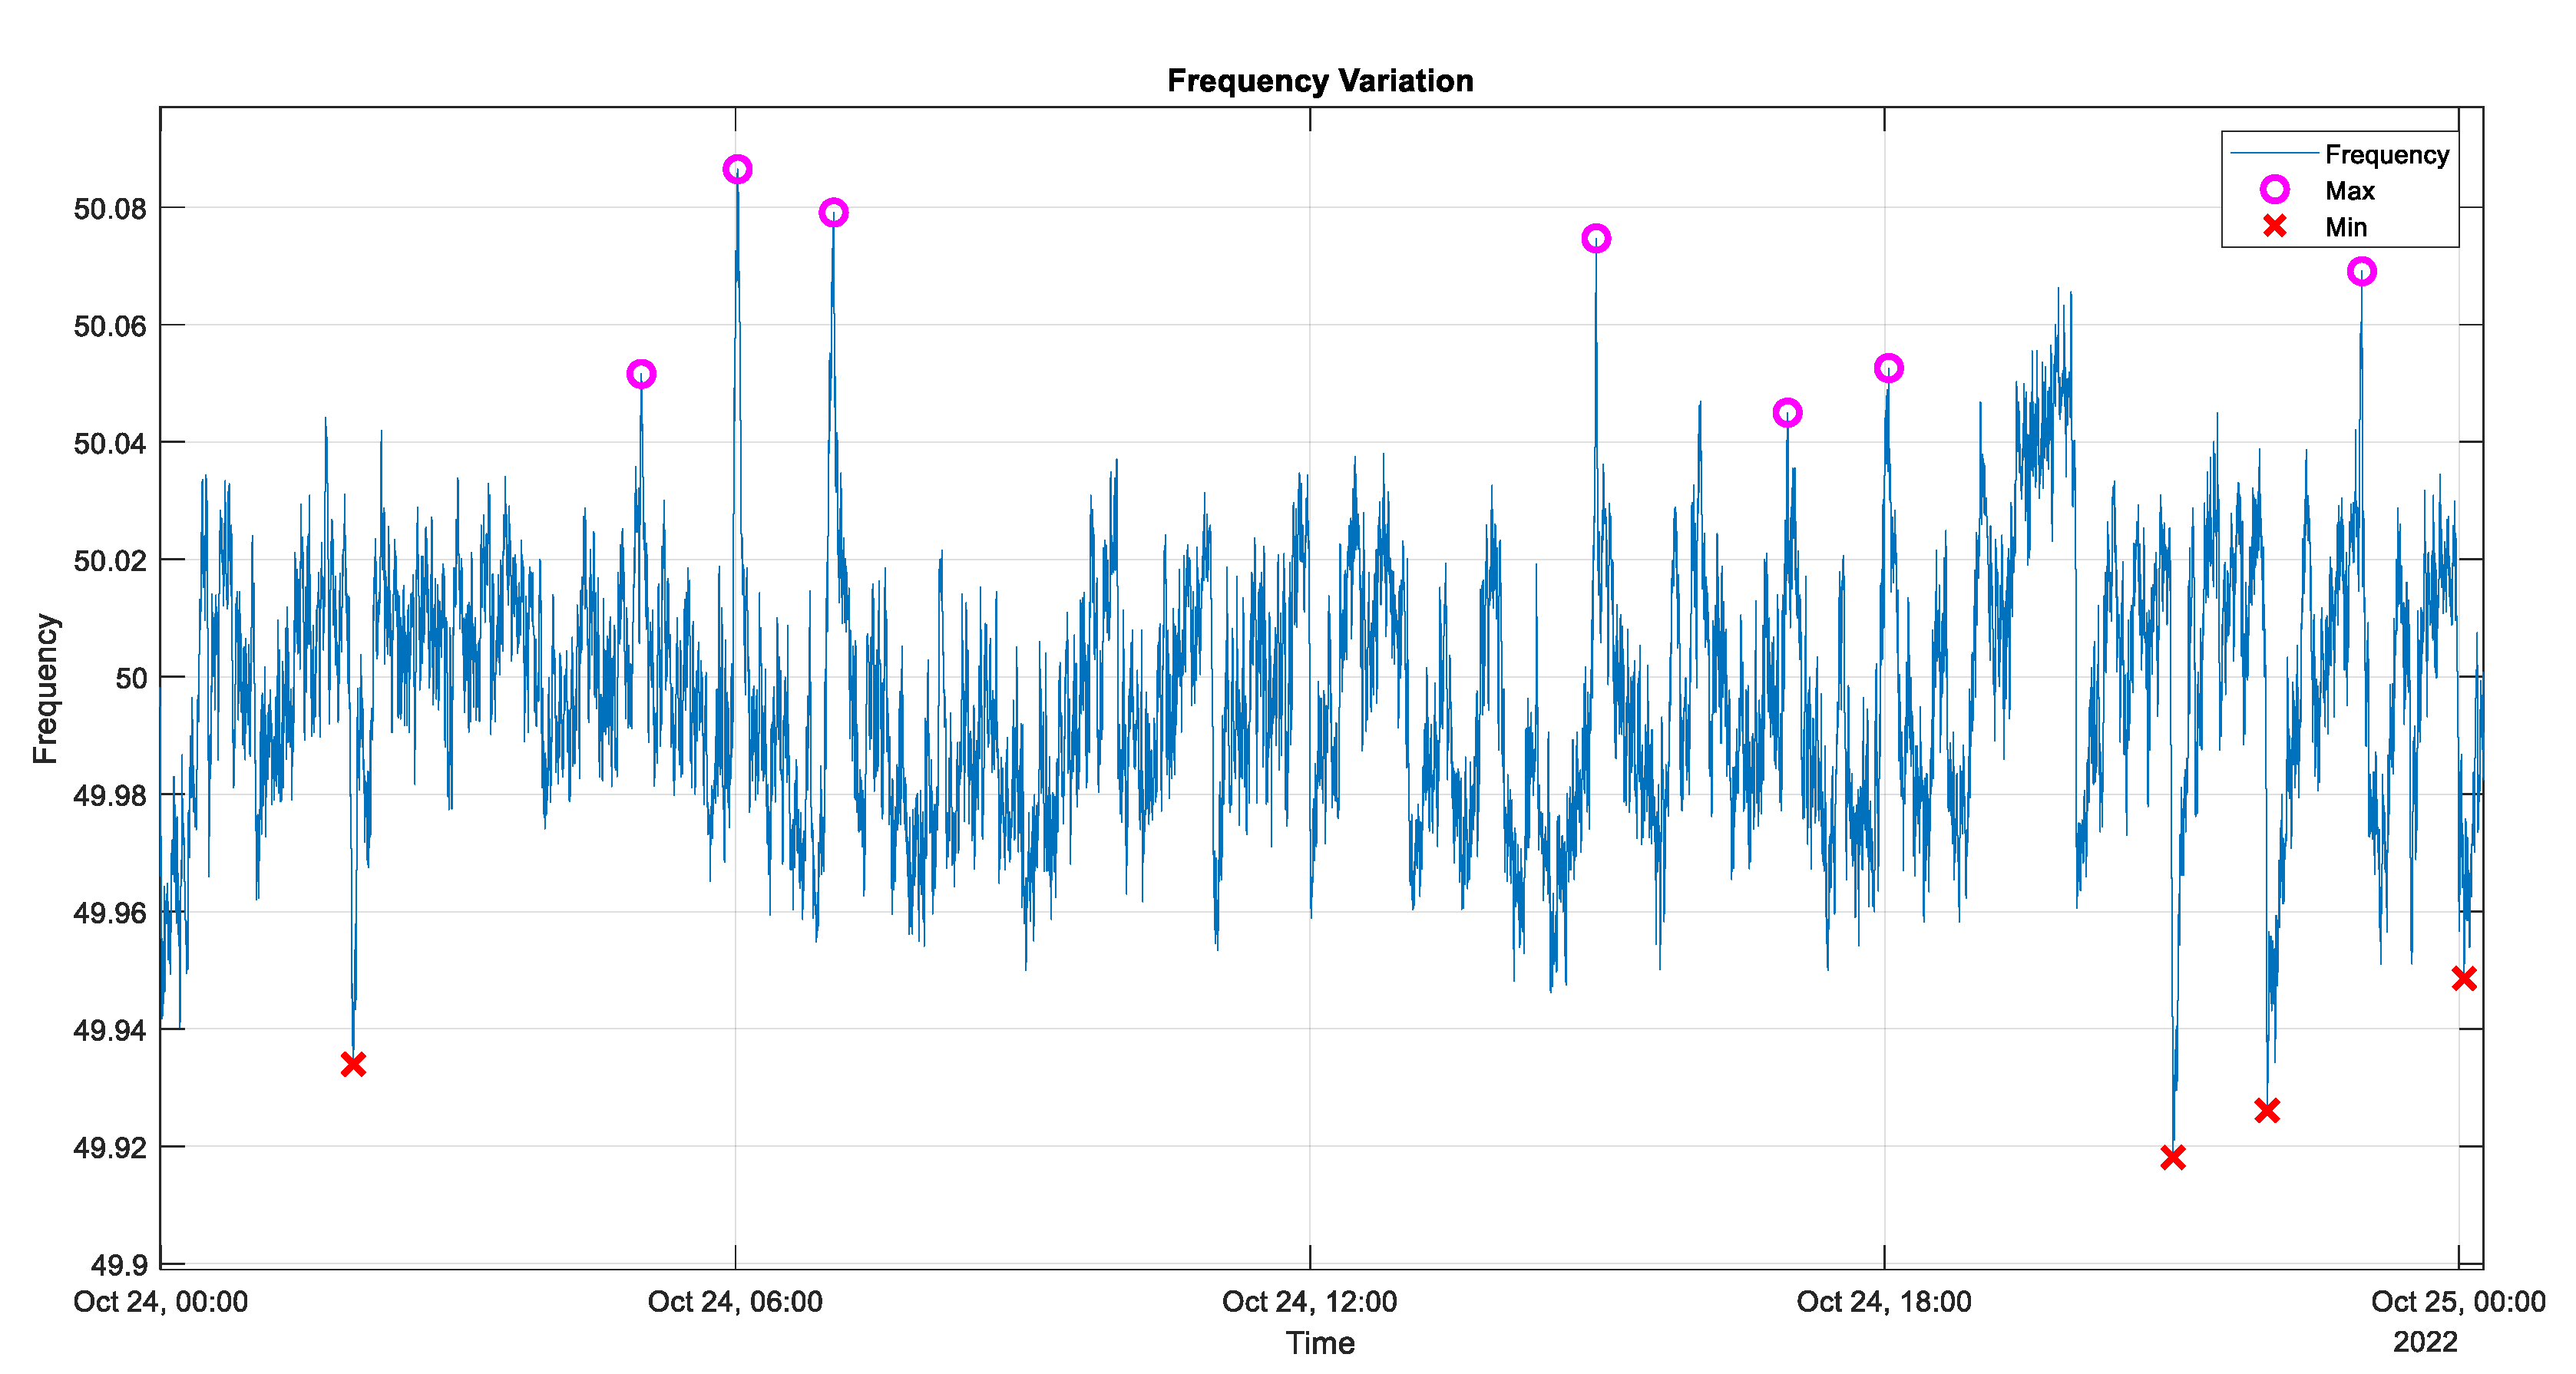
This method is based on comparing the 10-minute moving average of the frequency with the current value. If the comparison value exceeds a certain threshold and falls within the range of an hourly block in the electricity market, at each hour on the hour, it is identified as a local maximum or minimum extreme, depending on its value.
Figure 2.
Local máxima and mínima detection on October 24th, 2022, using the comparison with the moving average-based method.
Figure 2.
Local máxima and mínima detection on October 24th, 2022, using the comparison with the moving average-based method.
Later on, the gradient of hydropower will be used to test the hypothesis that maxima tend to occur in situations where there is an increase in hydropower, and conversely, where there are minima, there is a decrease in hydropower.
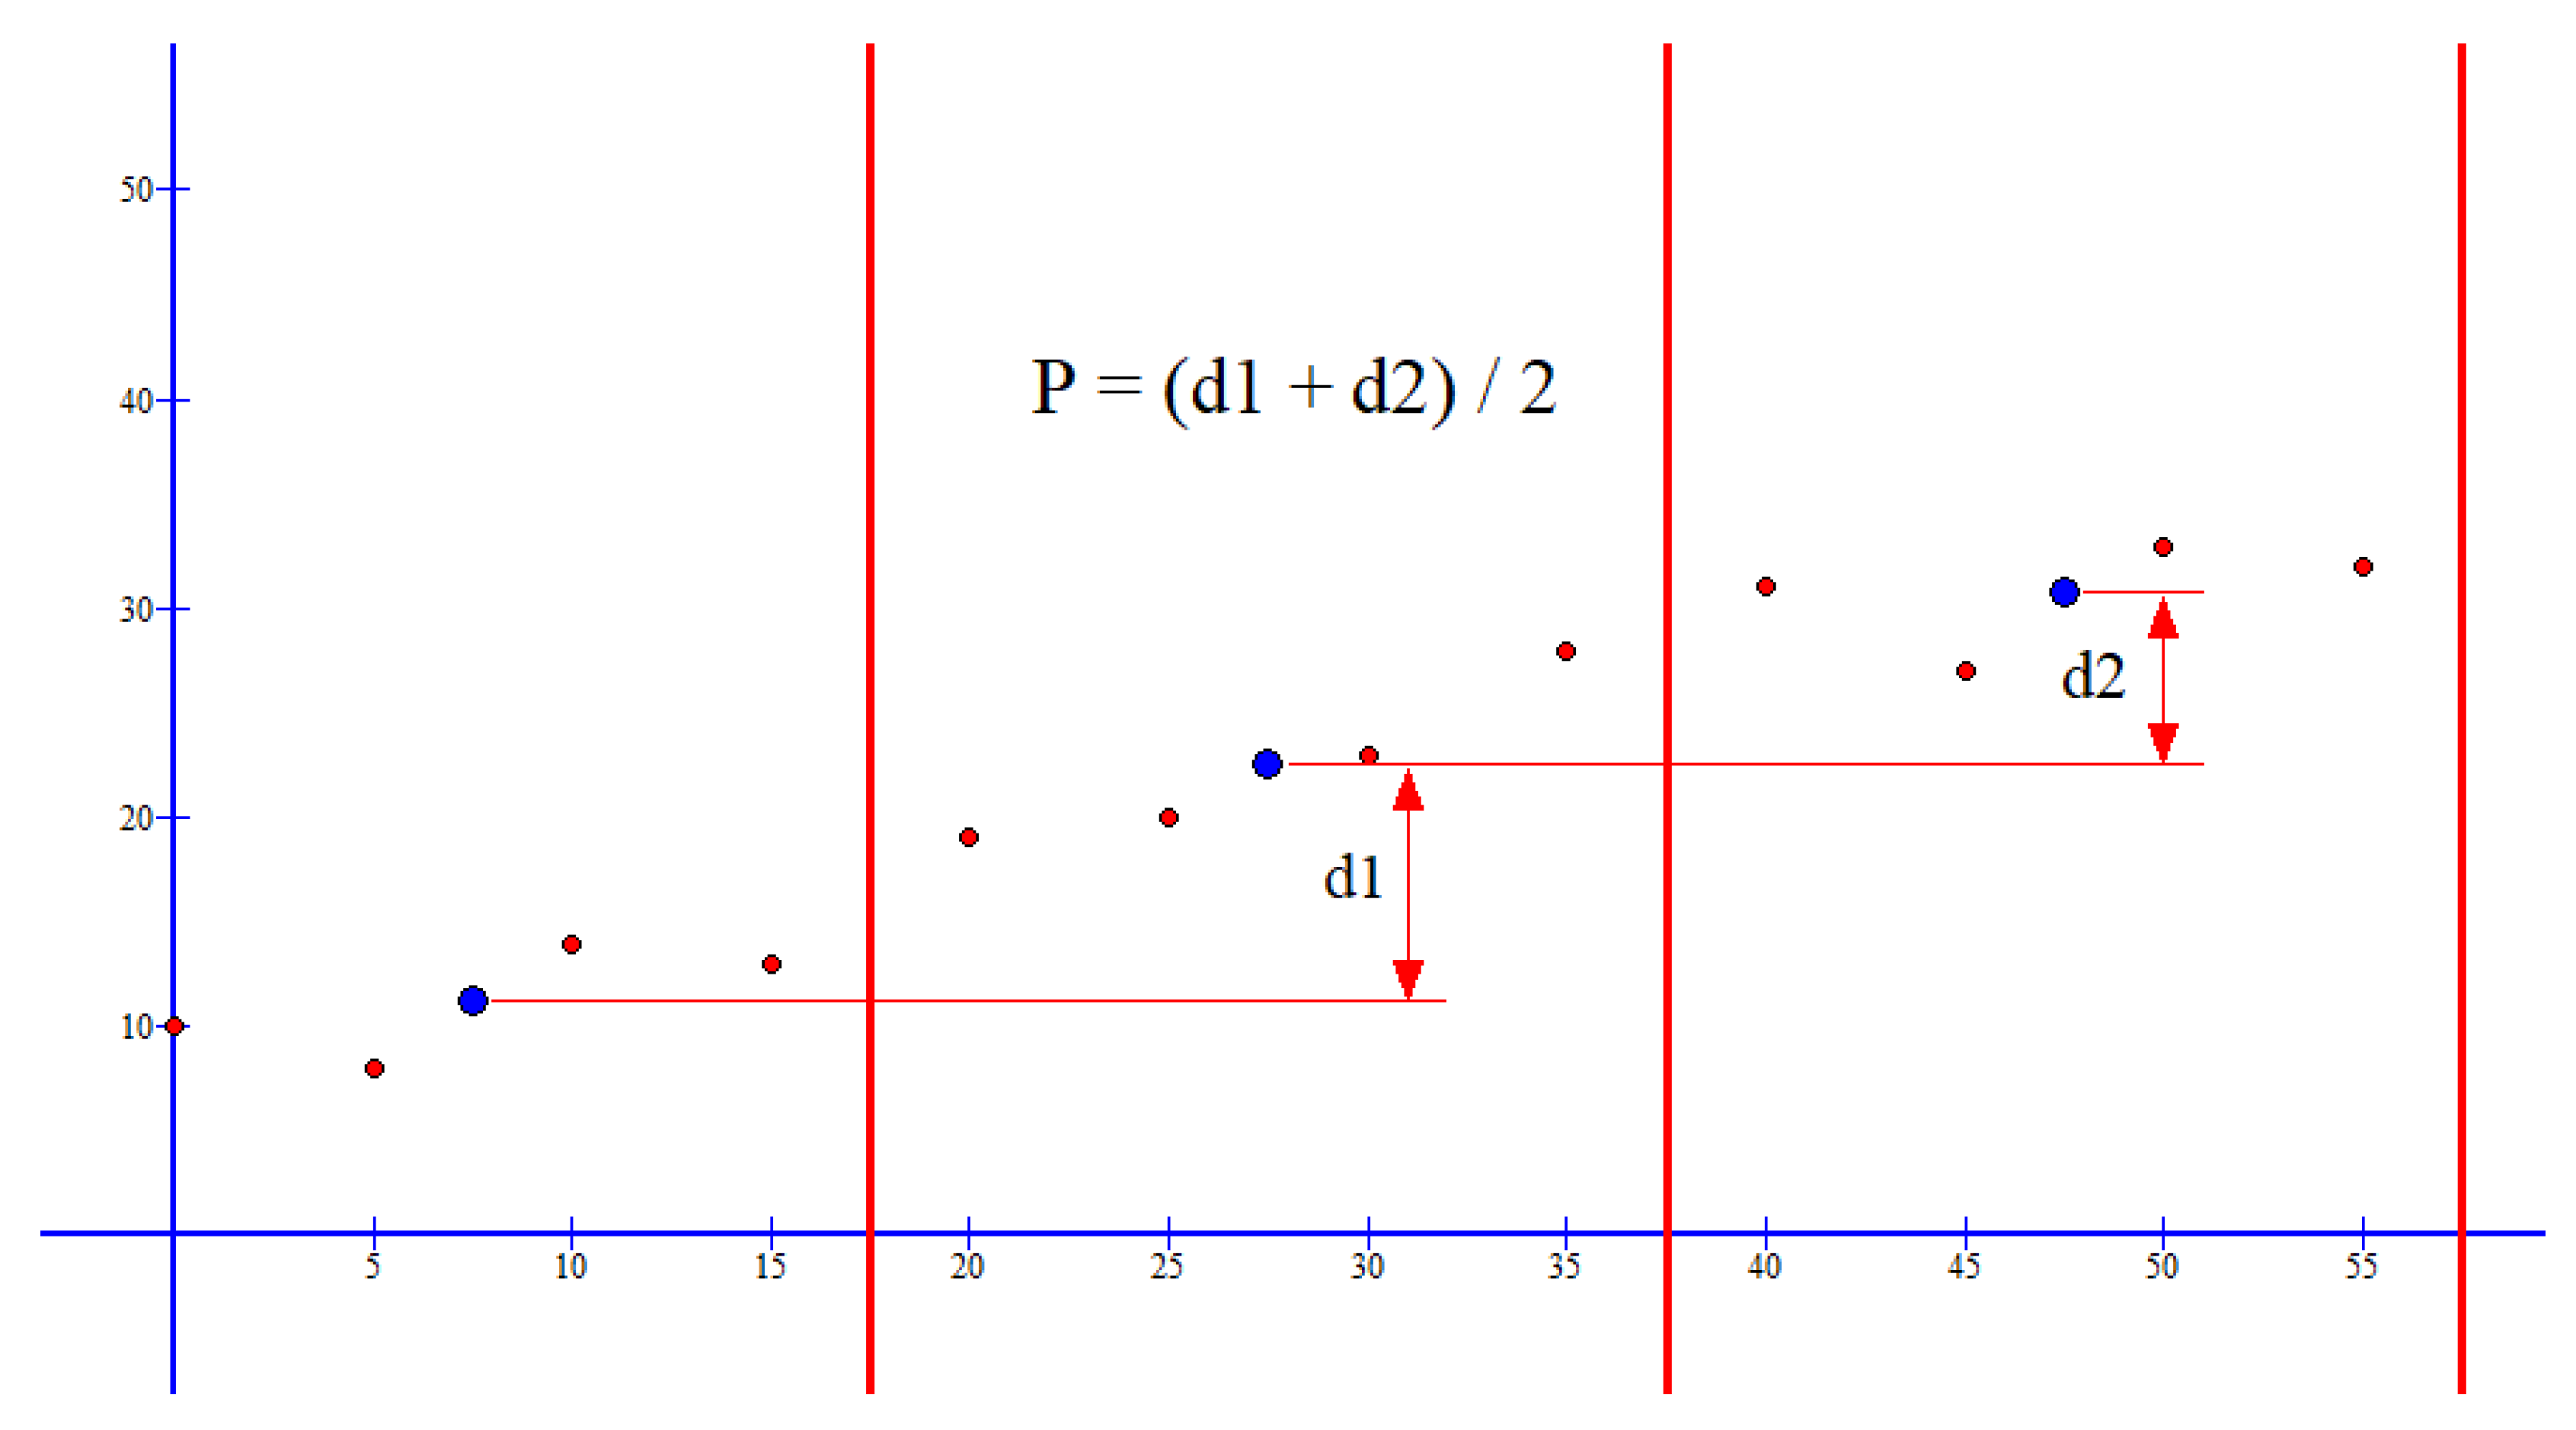
To calculate this gradient, production data, which is provided every 5 minutes, is used. The objective is to obtain an average gradient per hour in order to compare it with the hourly maxima and minima and determine the average slope at which they occur.
Since there are 12 production data points in an hour (one every 5 minutes), they are divided into 3 blocks of 4 data points. The average of each block is calculated, and with those 3 averages, the increase of the first block average with the second block average, and the increase of the second block average with the third block average is calculated, concluding with the average of both increases. This average will be the hourly value of the gradient used in subsequent sections.
Figure 3 graphically represents the described method.
3. Results
To obtain the results presented in this section, the "specular inertia" method was used to obtain maxima and minima, and the "pseudo-linear regression" method was used to obtain the gradients of the hydropower.
After collecting the local extrema, the data is represented through various graphs to facilitate comprehension and observation. First, let's look at some histograms differentiating between local maxima and minima, classified by whole month, weekdays, and weekends, to see if there is any different pattern in these time intervals throughout the month.
Figure 4.
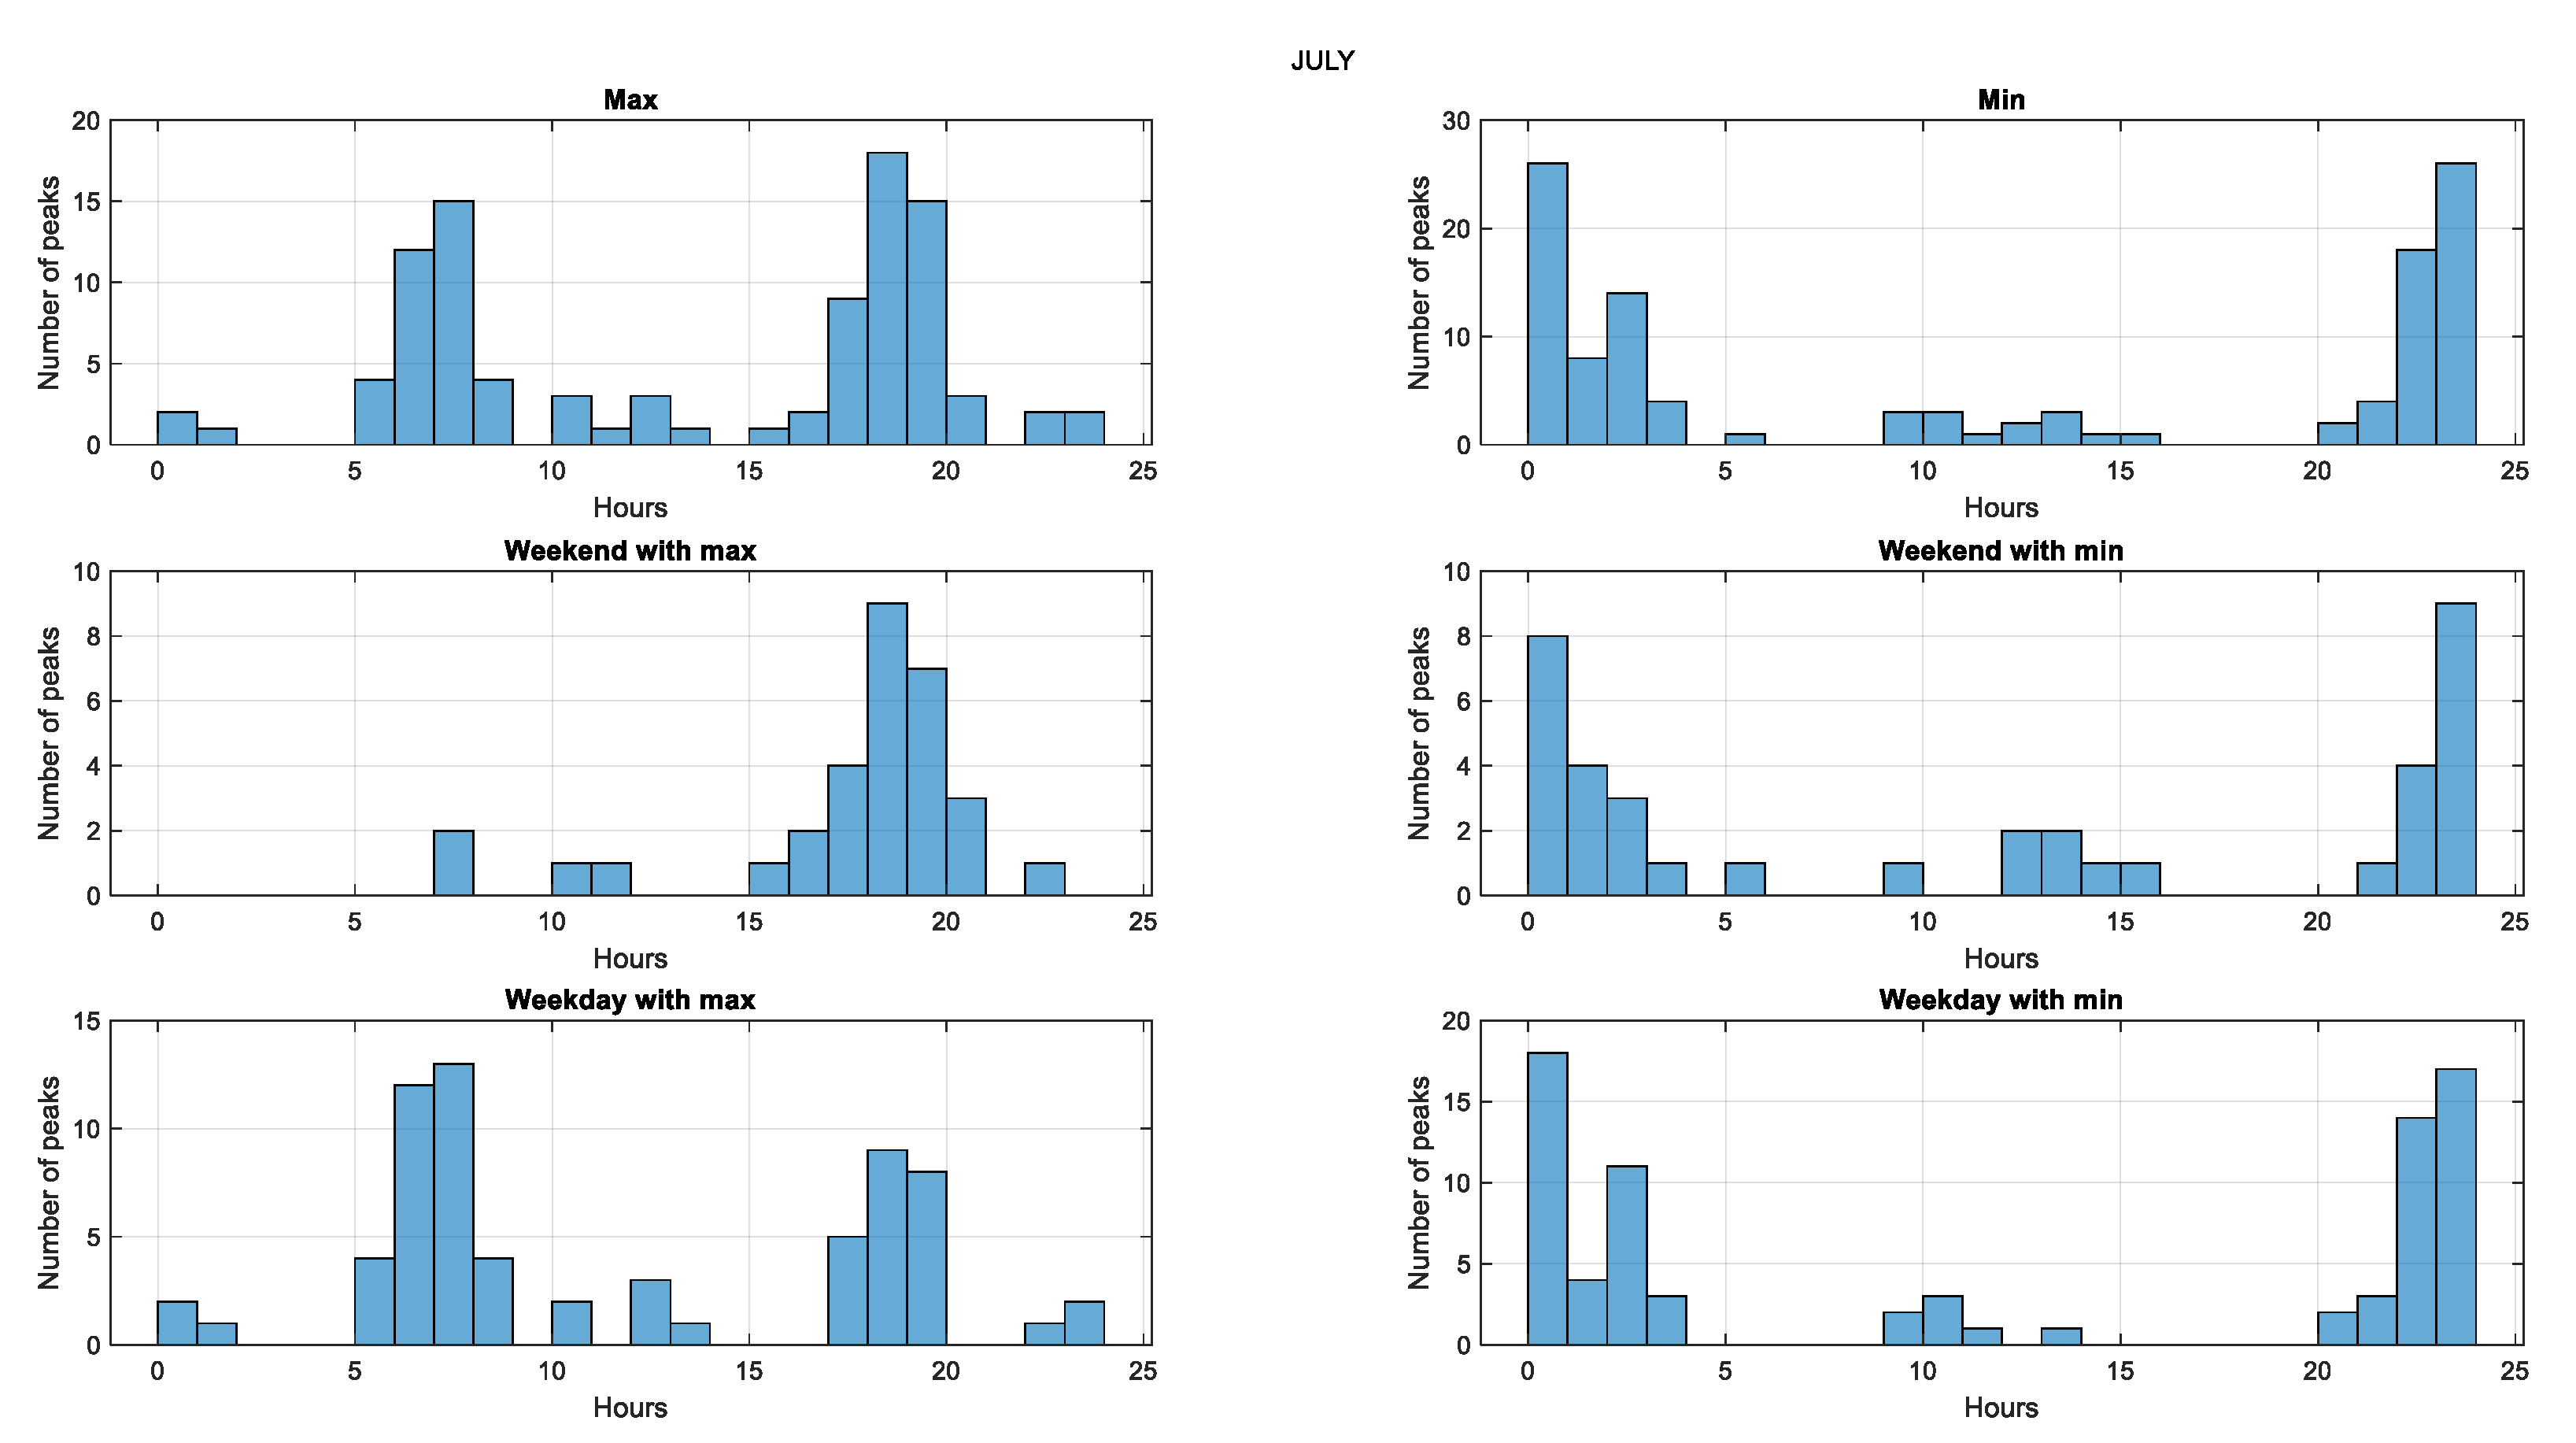
Maxima and minima hourly histogram on July 2022.
Figure 4.
Maxima and minima hourly histogram on July 2022.
In
Figure 4, the classification of the extrema identified with the algorithm is observed for both the whole month and weekdays/weekends. Throughout the month, the extrema occur within a specific time period, in the case of local minima, between 9 PM and 4 AM. Let's look at another month to compare this observation.
Figure 5.
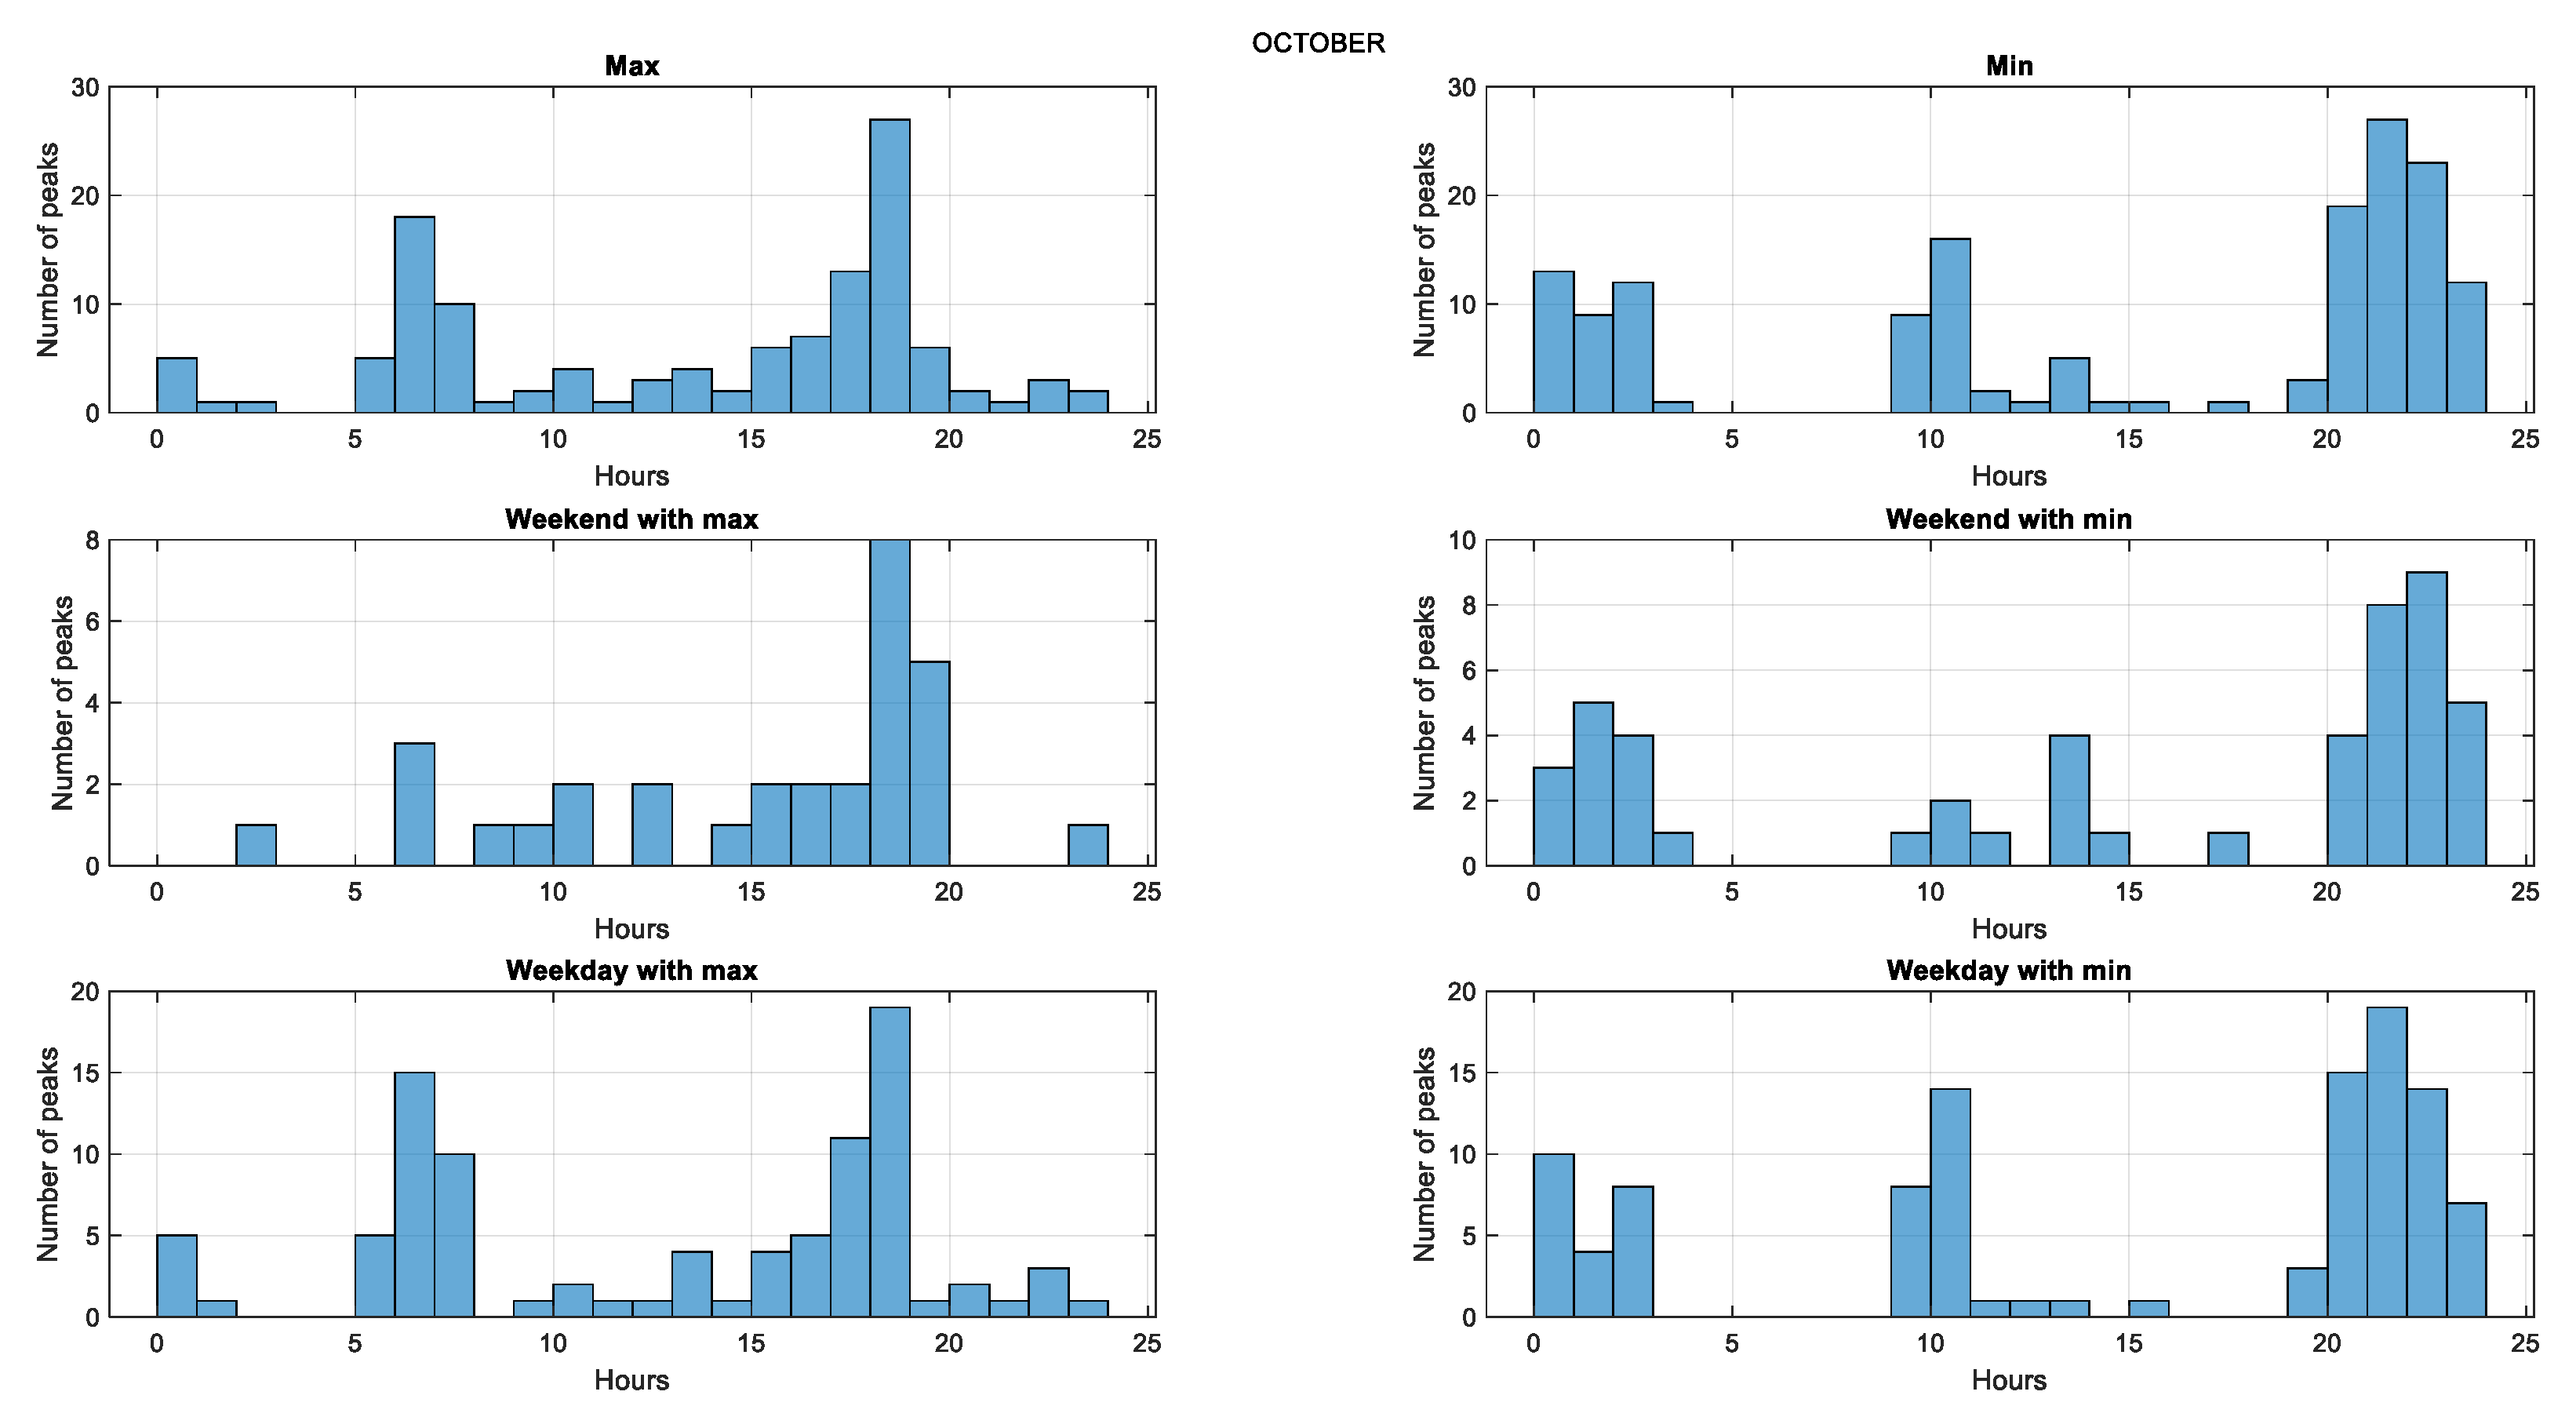
Maxima and minima hourly histogram on October 2022.
Figure 5.
Maxima and minima hourly histogram on October 2022.
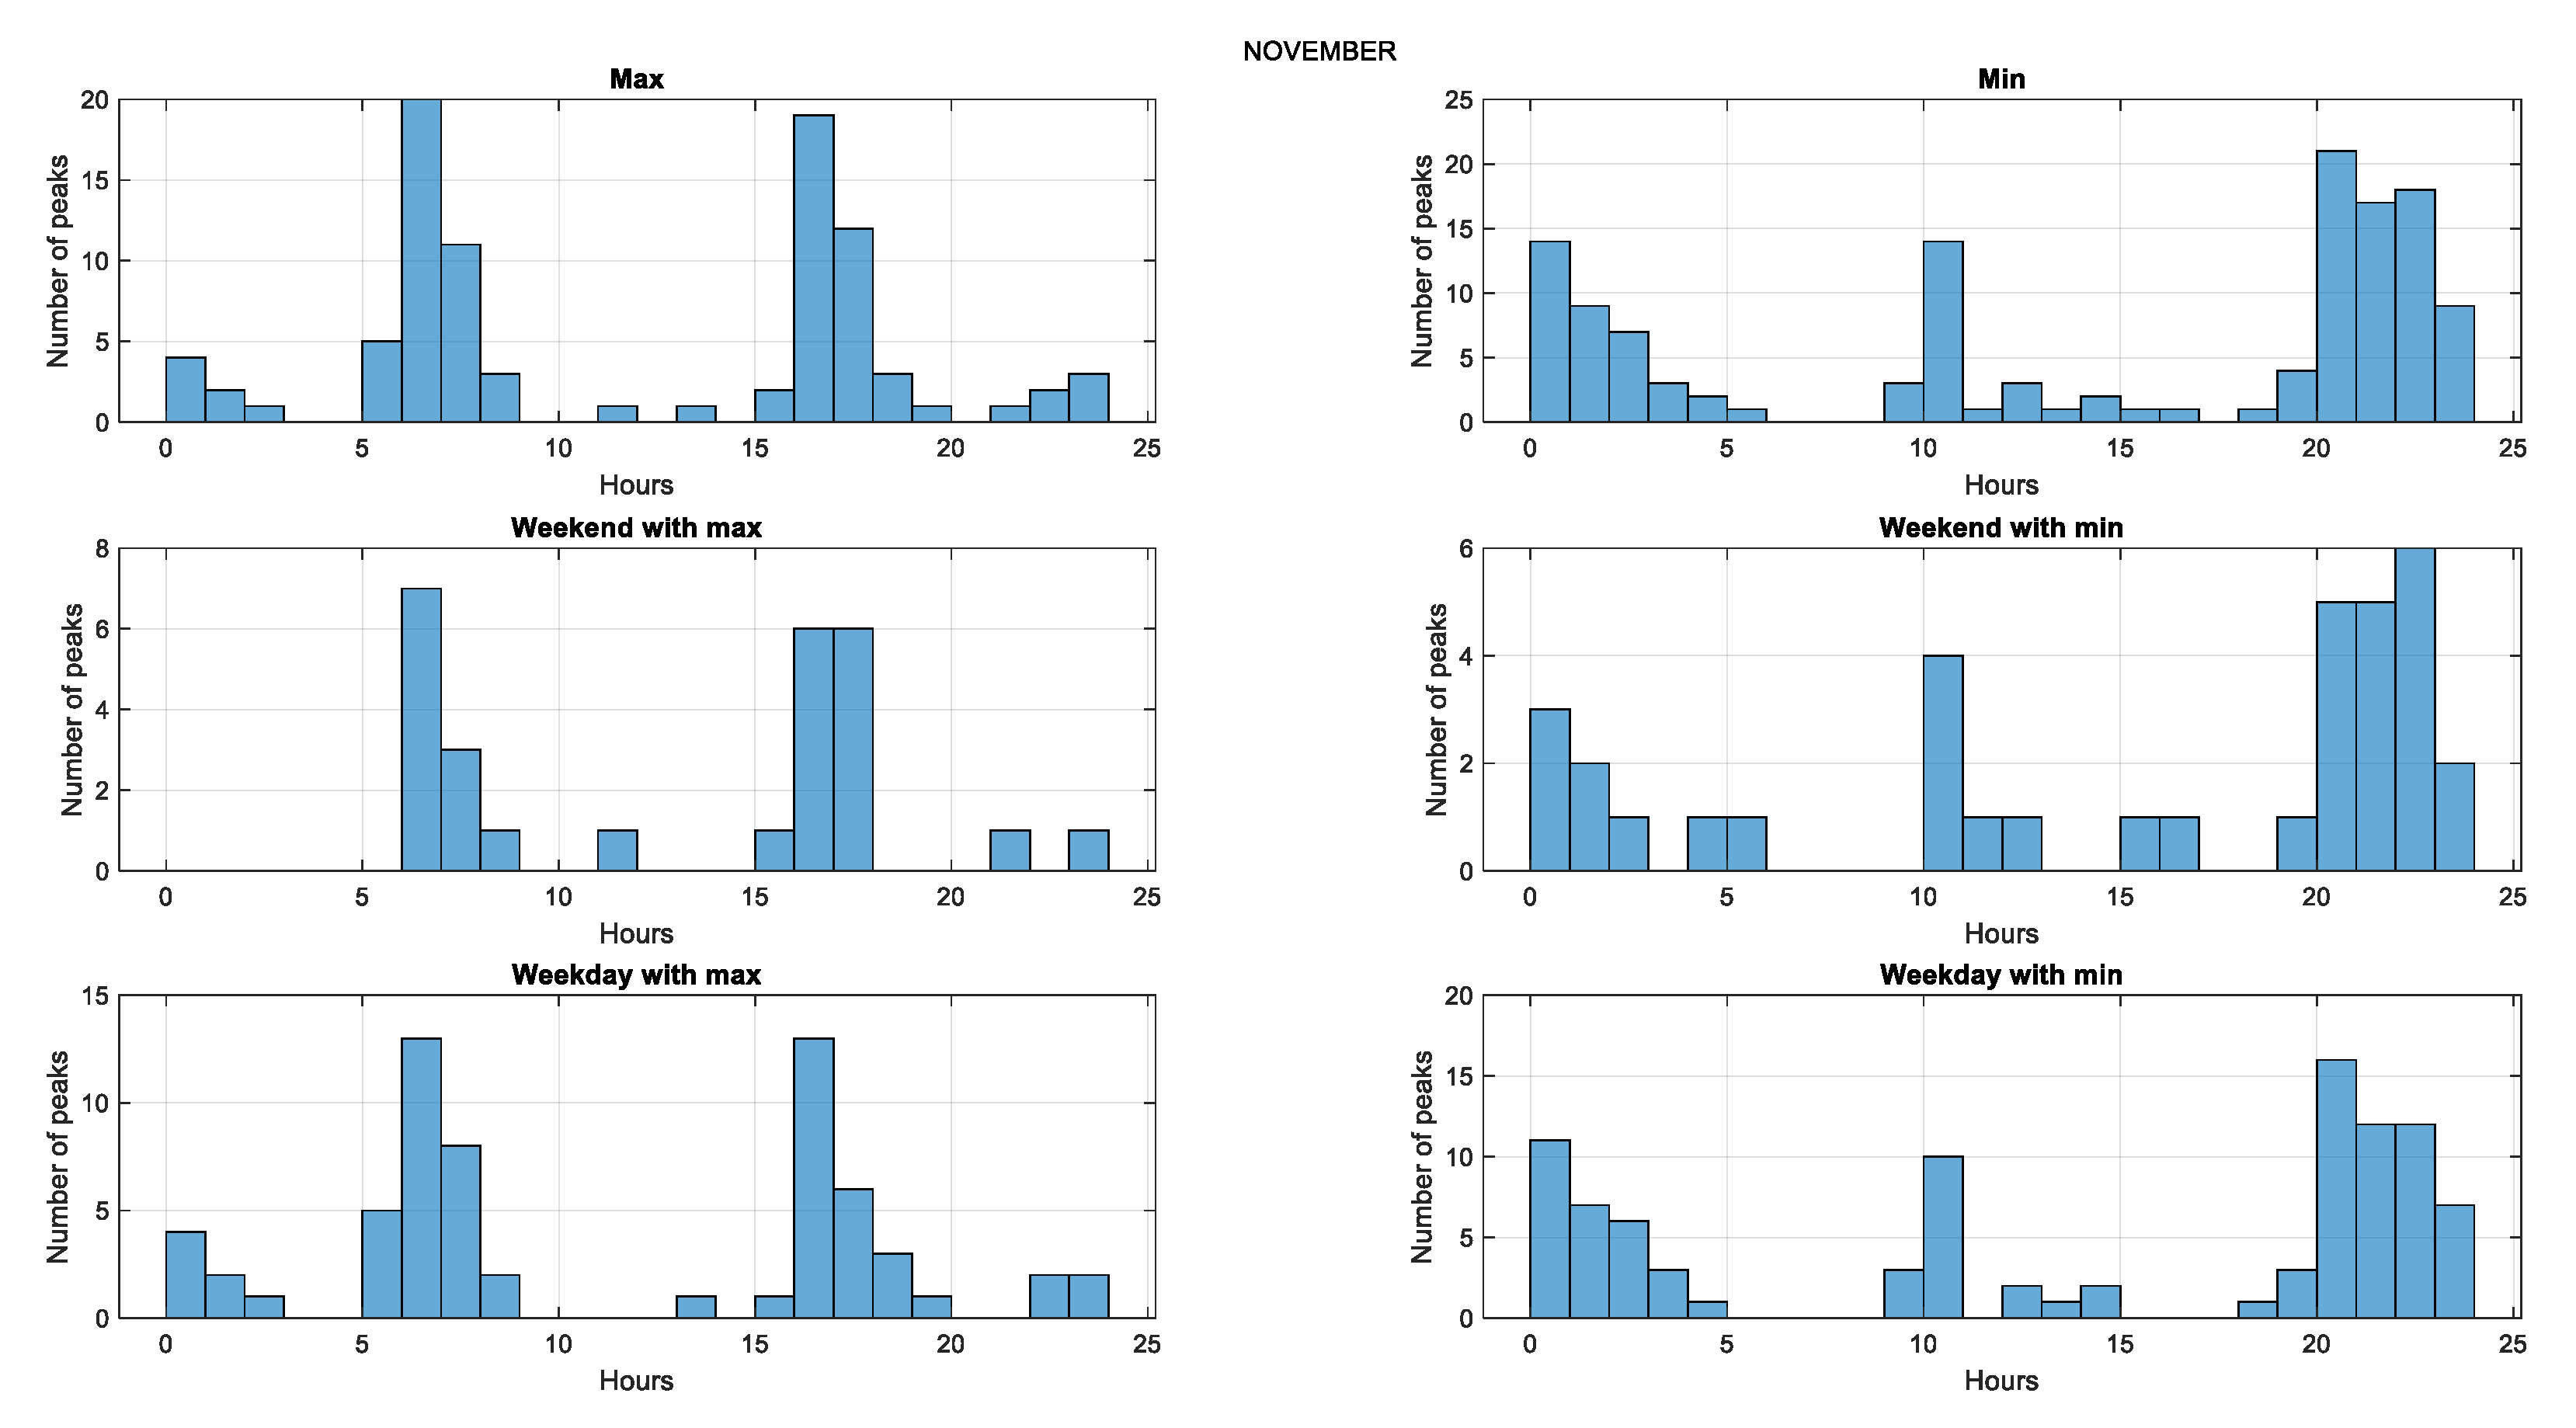
Figure 6.
Maxima and minima hourly histogram on November 2022.
Figure 6.
Maxima and minima hourly histogram on November 2022.
We can see that the trend of occurrence of the extrema is the same in both months.
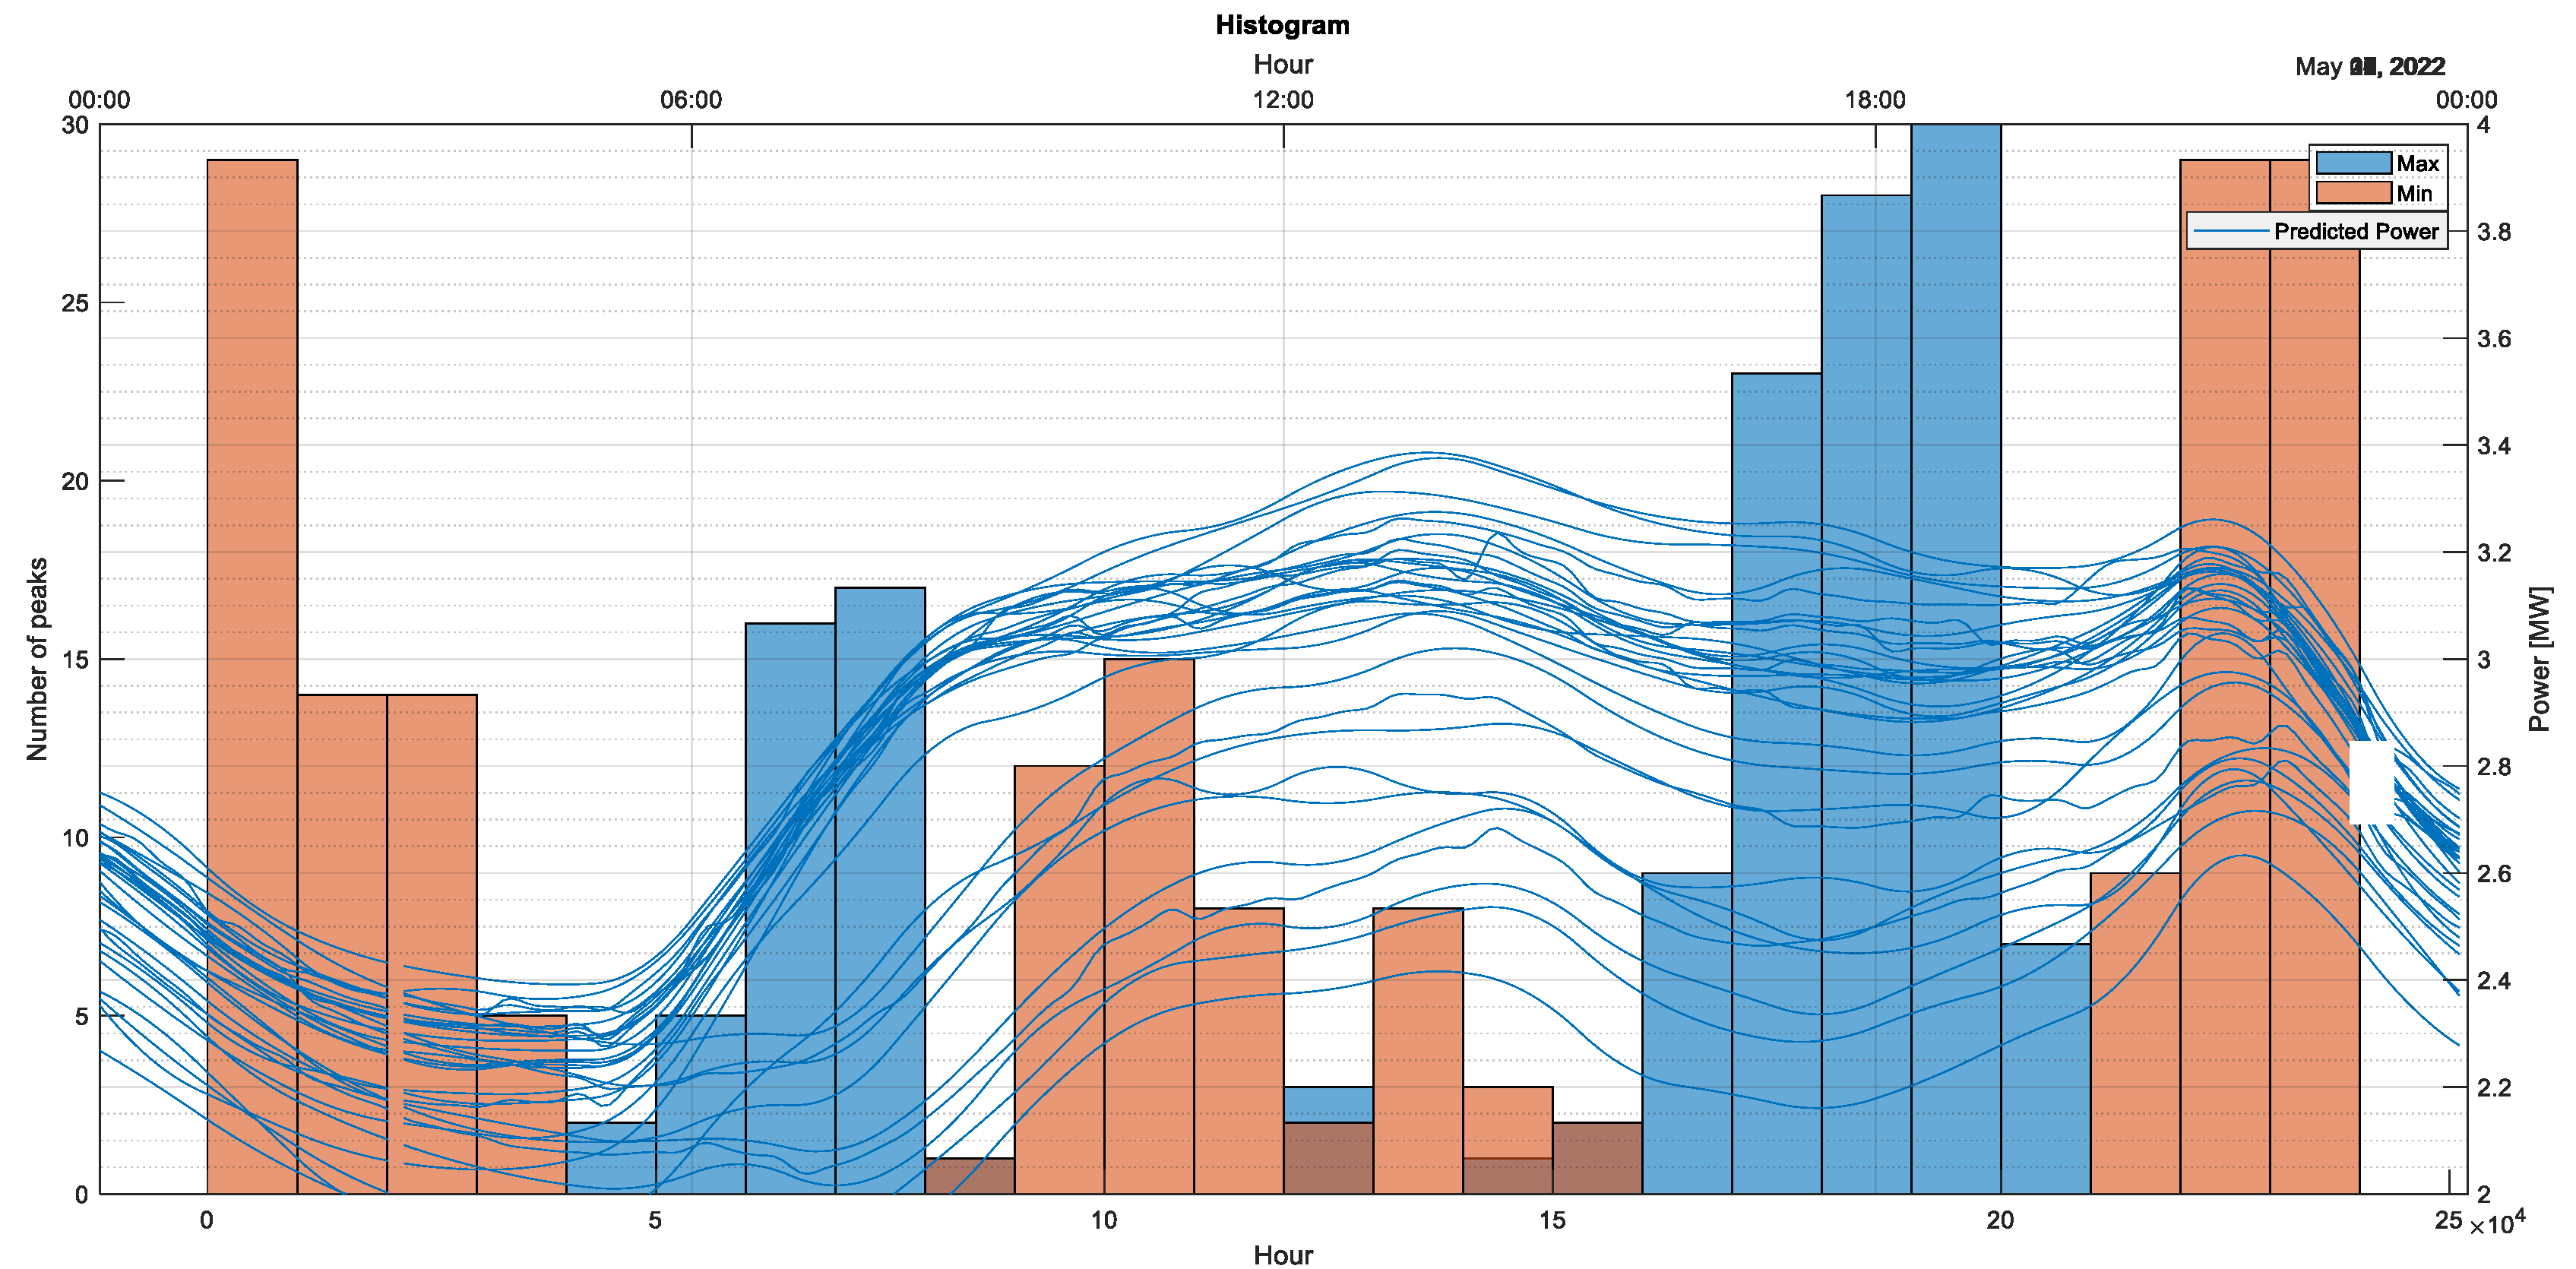
As the points identified by the algorithm fall within a specific time period, the next step is to relate these extrema to the grid energy sources. For this purpose, the above histogram is represented on the same graph as the forecasted power curve for November 2022
Figure 7.
Maxima and minima hourly histogram on November 2022, along with forecasted power curve.
Figure 7.
Maxima and minima hourly histogram on November 2022, along with forecasted power curve.
In
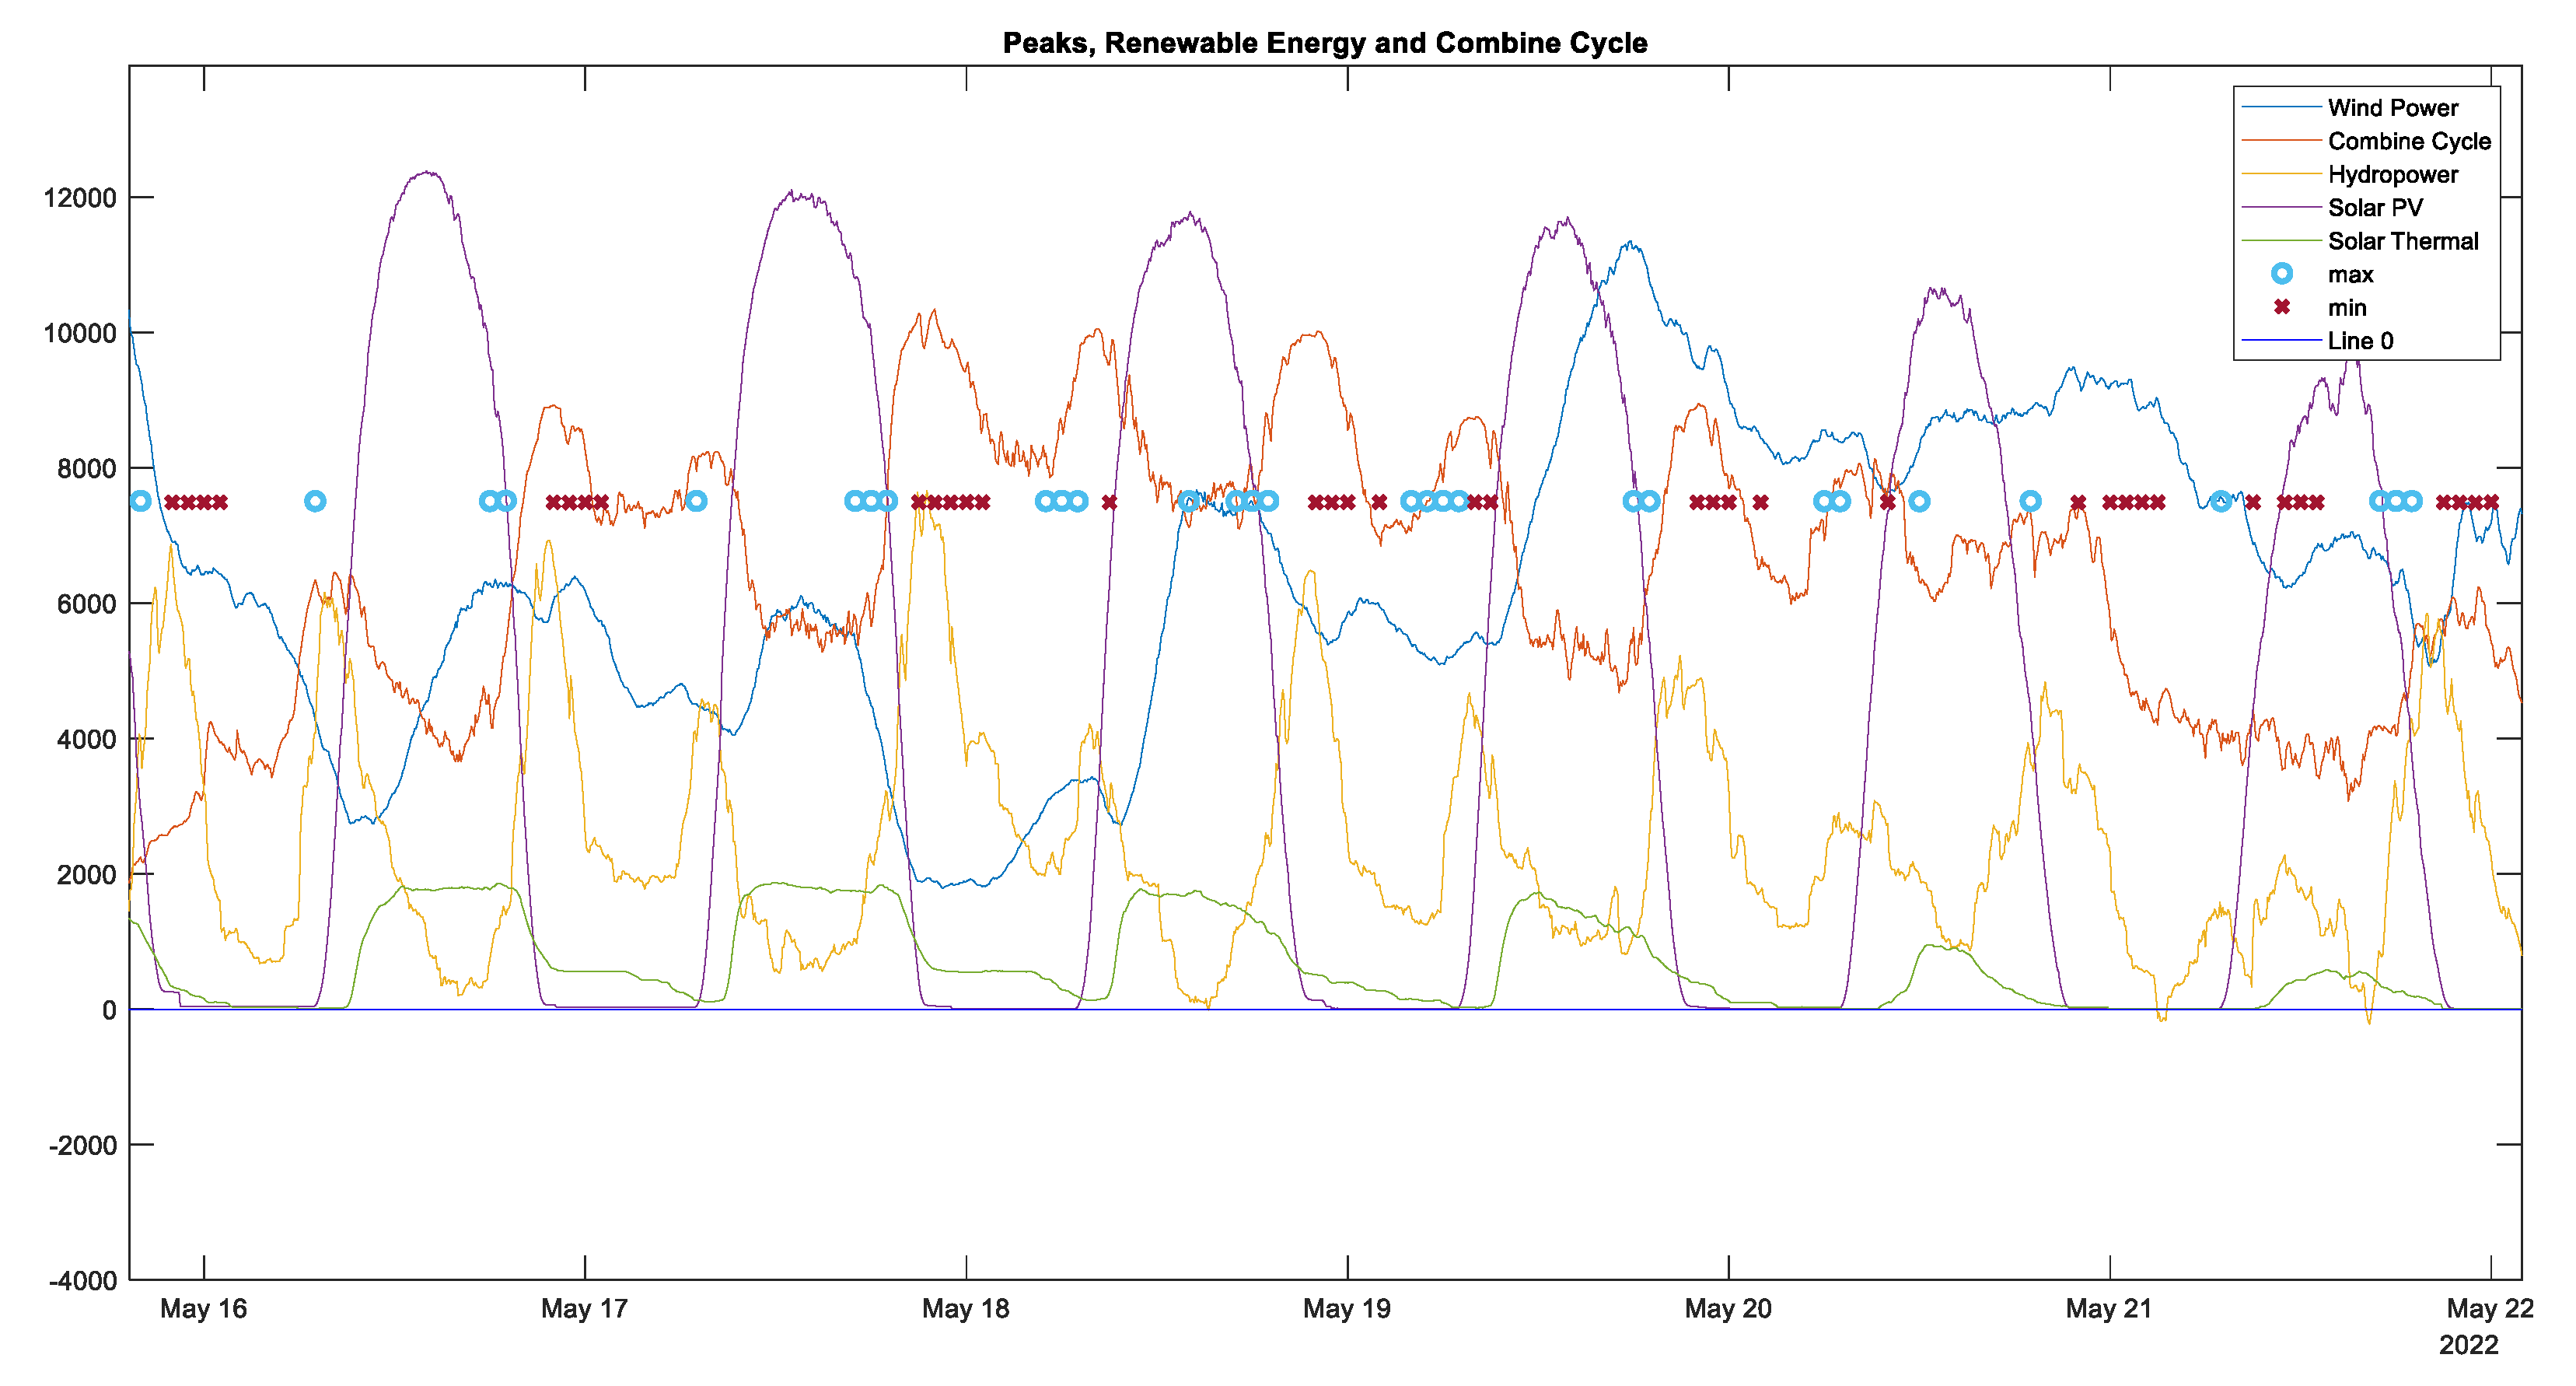
Figure 7, we observe the relationship between the localized minimum points and the downward trend of the predicted power gradient, while no relationship is observed between the detected maximum points and the upward trend of the predicted power. In order to look for any pattern that relates the maximum and minimum points localized by the algorithm, in
Figure 8 we represent the points along with various renewable sources (wind power, PV solar, thermal solar, and hydropower) along with the maximum and minimum points represented by the symbols 'o' and 'x', respectively.
As shown in
Figure 8, we can observe at a glance that no energy source has any relationship with the localized points except for two of them: hydropower and combined-cycle. In both cases we notice higher probability for localized maximum points to appear when there is an upward trend of power, and localized minimum points in sections with a downward trend of power. This effect is even more noticeable on hydropower, so we are going to focus the rest of the paper on this exact technology.
If we acquire the hydropower, combined-cycle and wind power information from
Figure 8 and we represent it with a histogram for any given month as shown in
Figure 6, we obtain the following Figure.
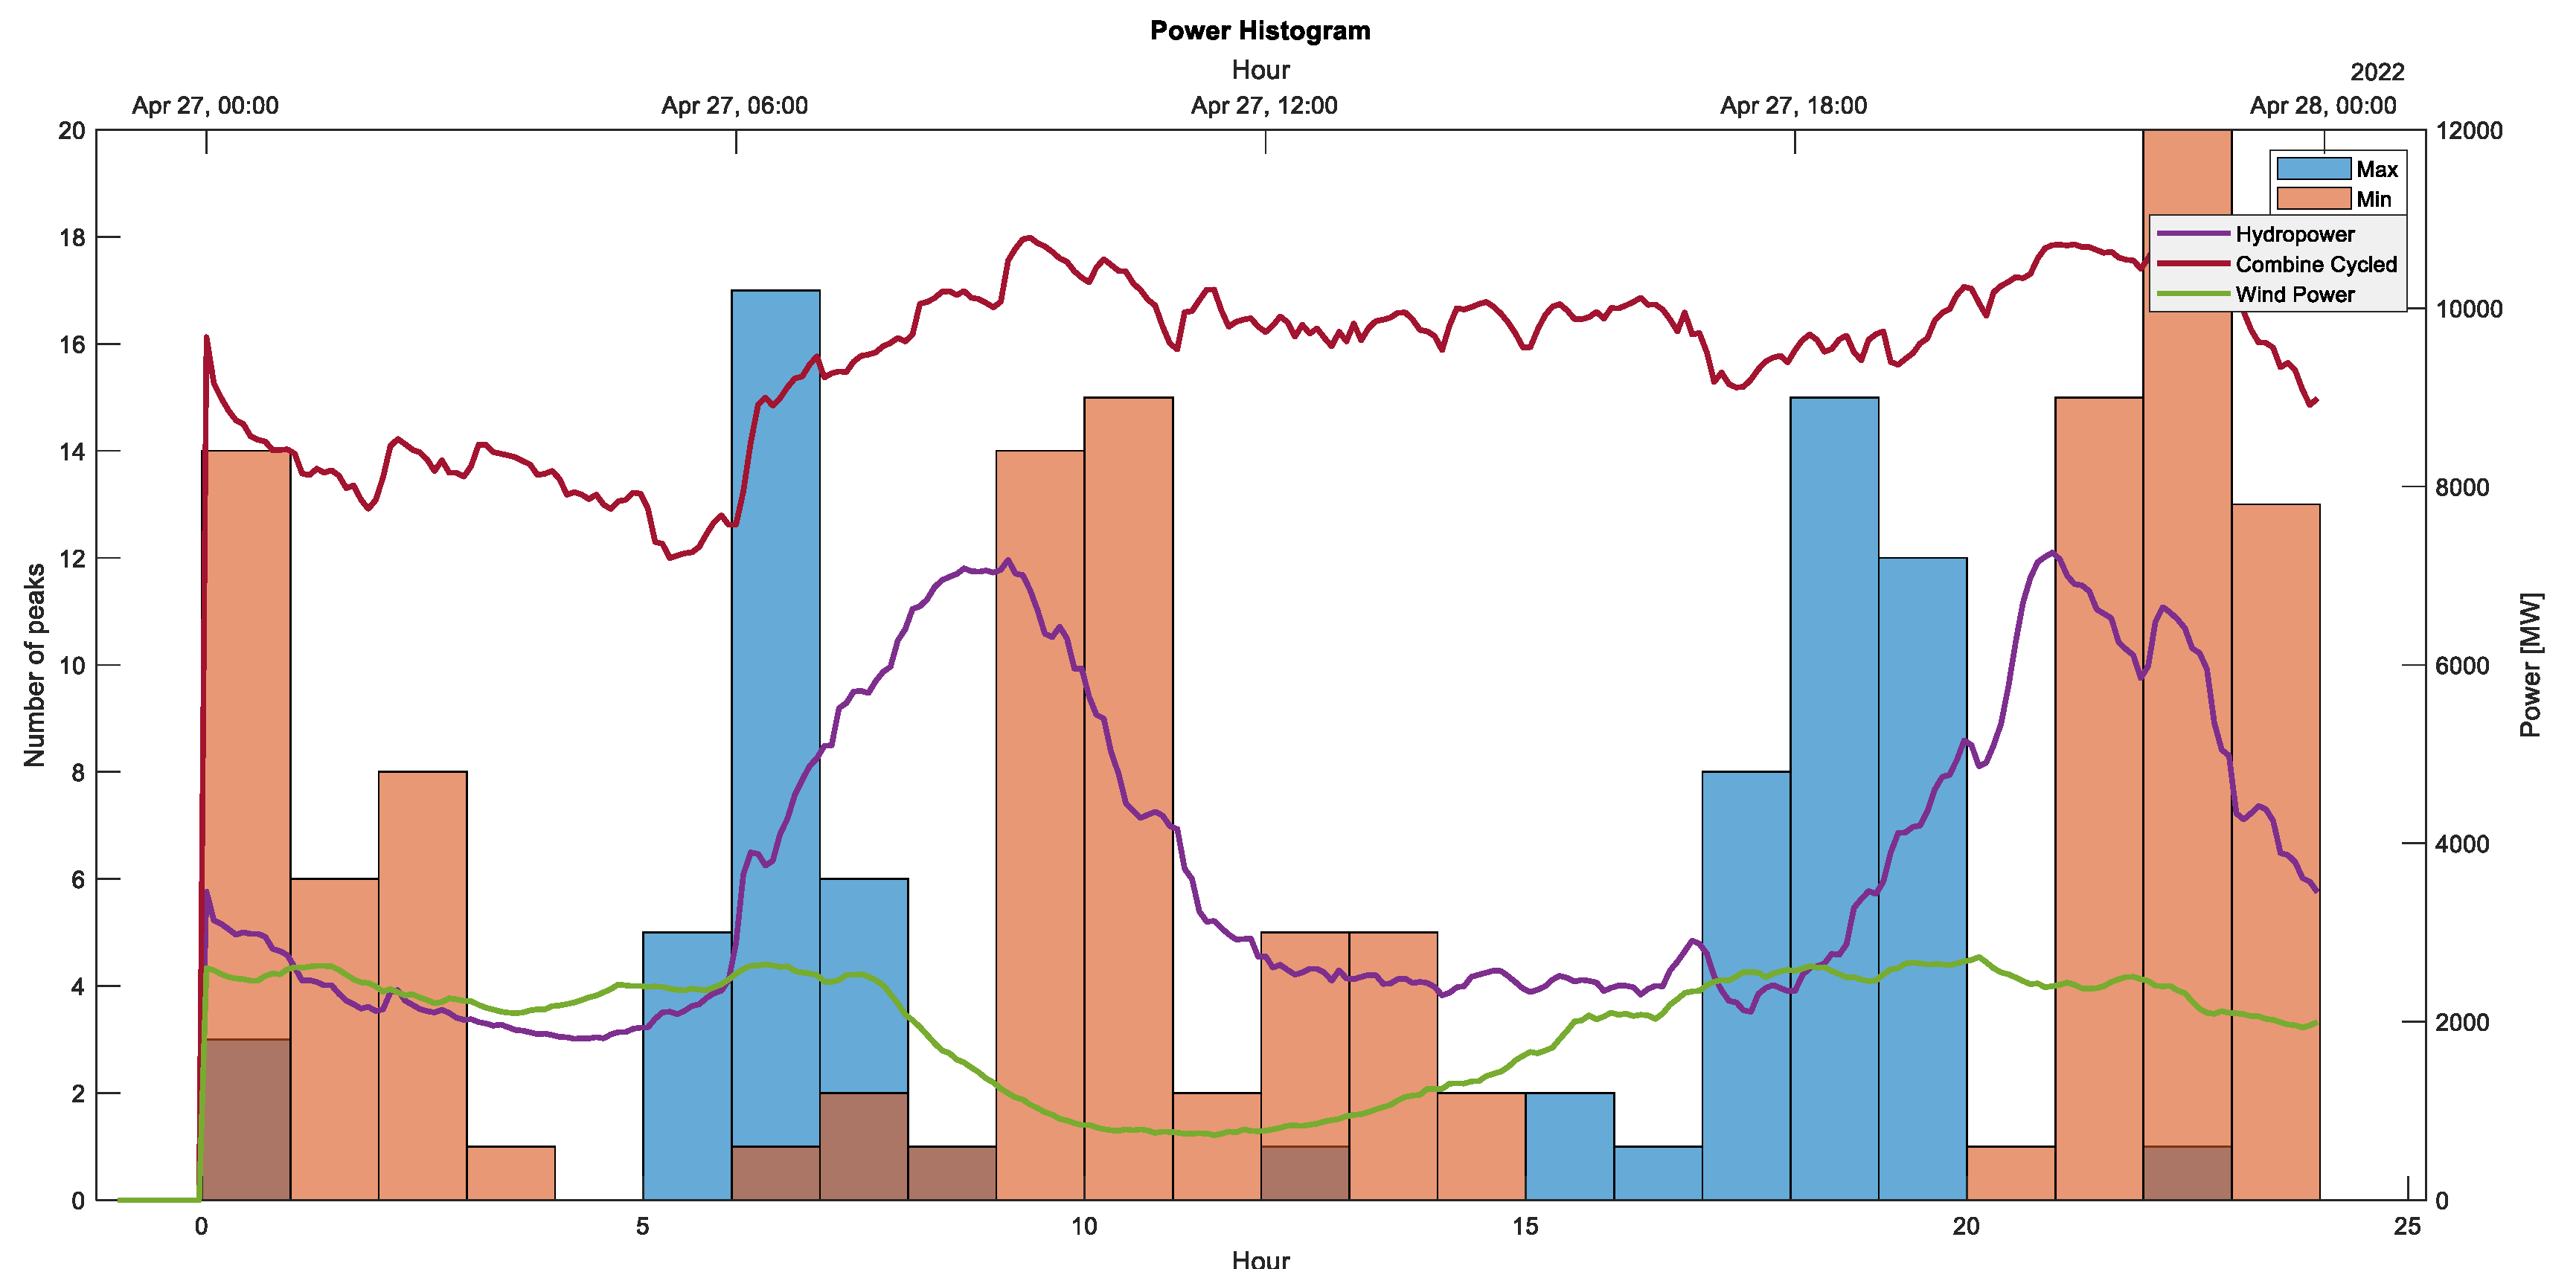
Figure 9.
Maxima and minima hourly histogram on 27th April 2022, along with hydropower, combine cycle and wind power curves.
Figure 9.
Maxima and minima hourly histogram on 27th April 2022, along with hydropower, combine cycle and wind power curves.
In
Figure 9, we observe in greater detail the aforementioned assertion. We can observe that when the hydropower power curve tends to decrease, localized minimum points appear (orange bars), and when it tends to increase, localized maximum points appear (blue bars).
For combined-cycle, the same affirmation can be made to a lower extent, but for wind power, no correlation between the power curve and the extrema has been found.
Later on this paper we will corroborate all these assertions statistically.
However, this representation shows only one day of power. If we calculate the hourly gradients only for the hydropower curve and represent the values of these gradients on a single histogram, we obtain the following representation.
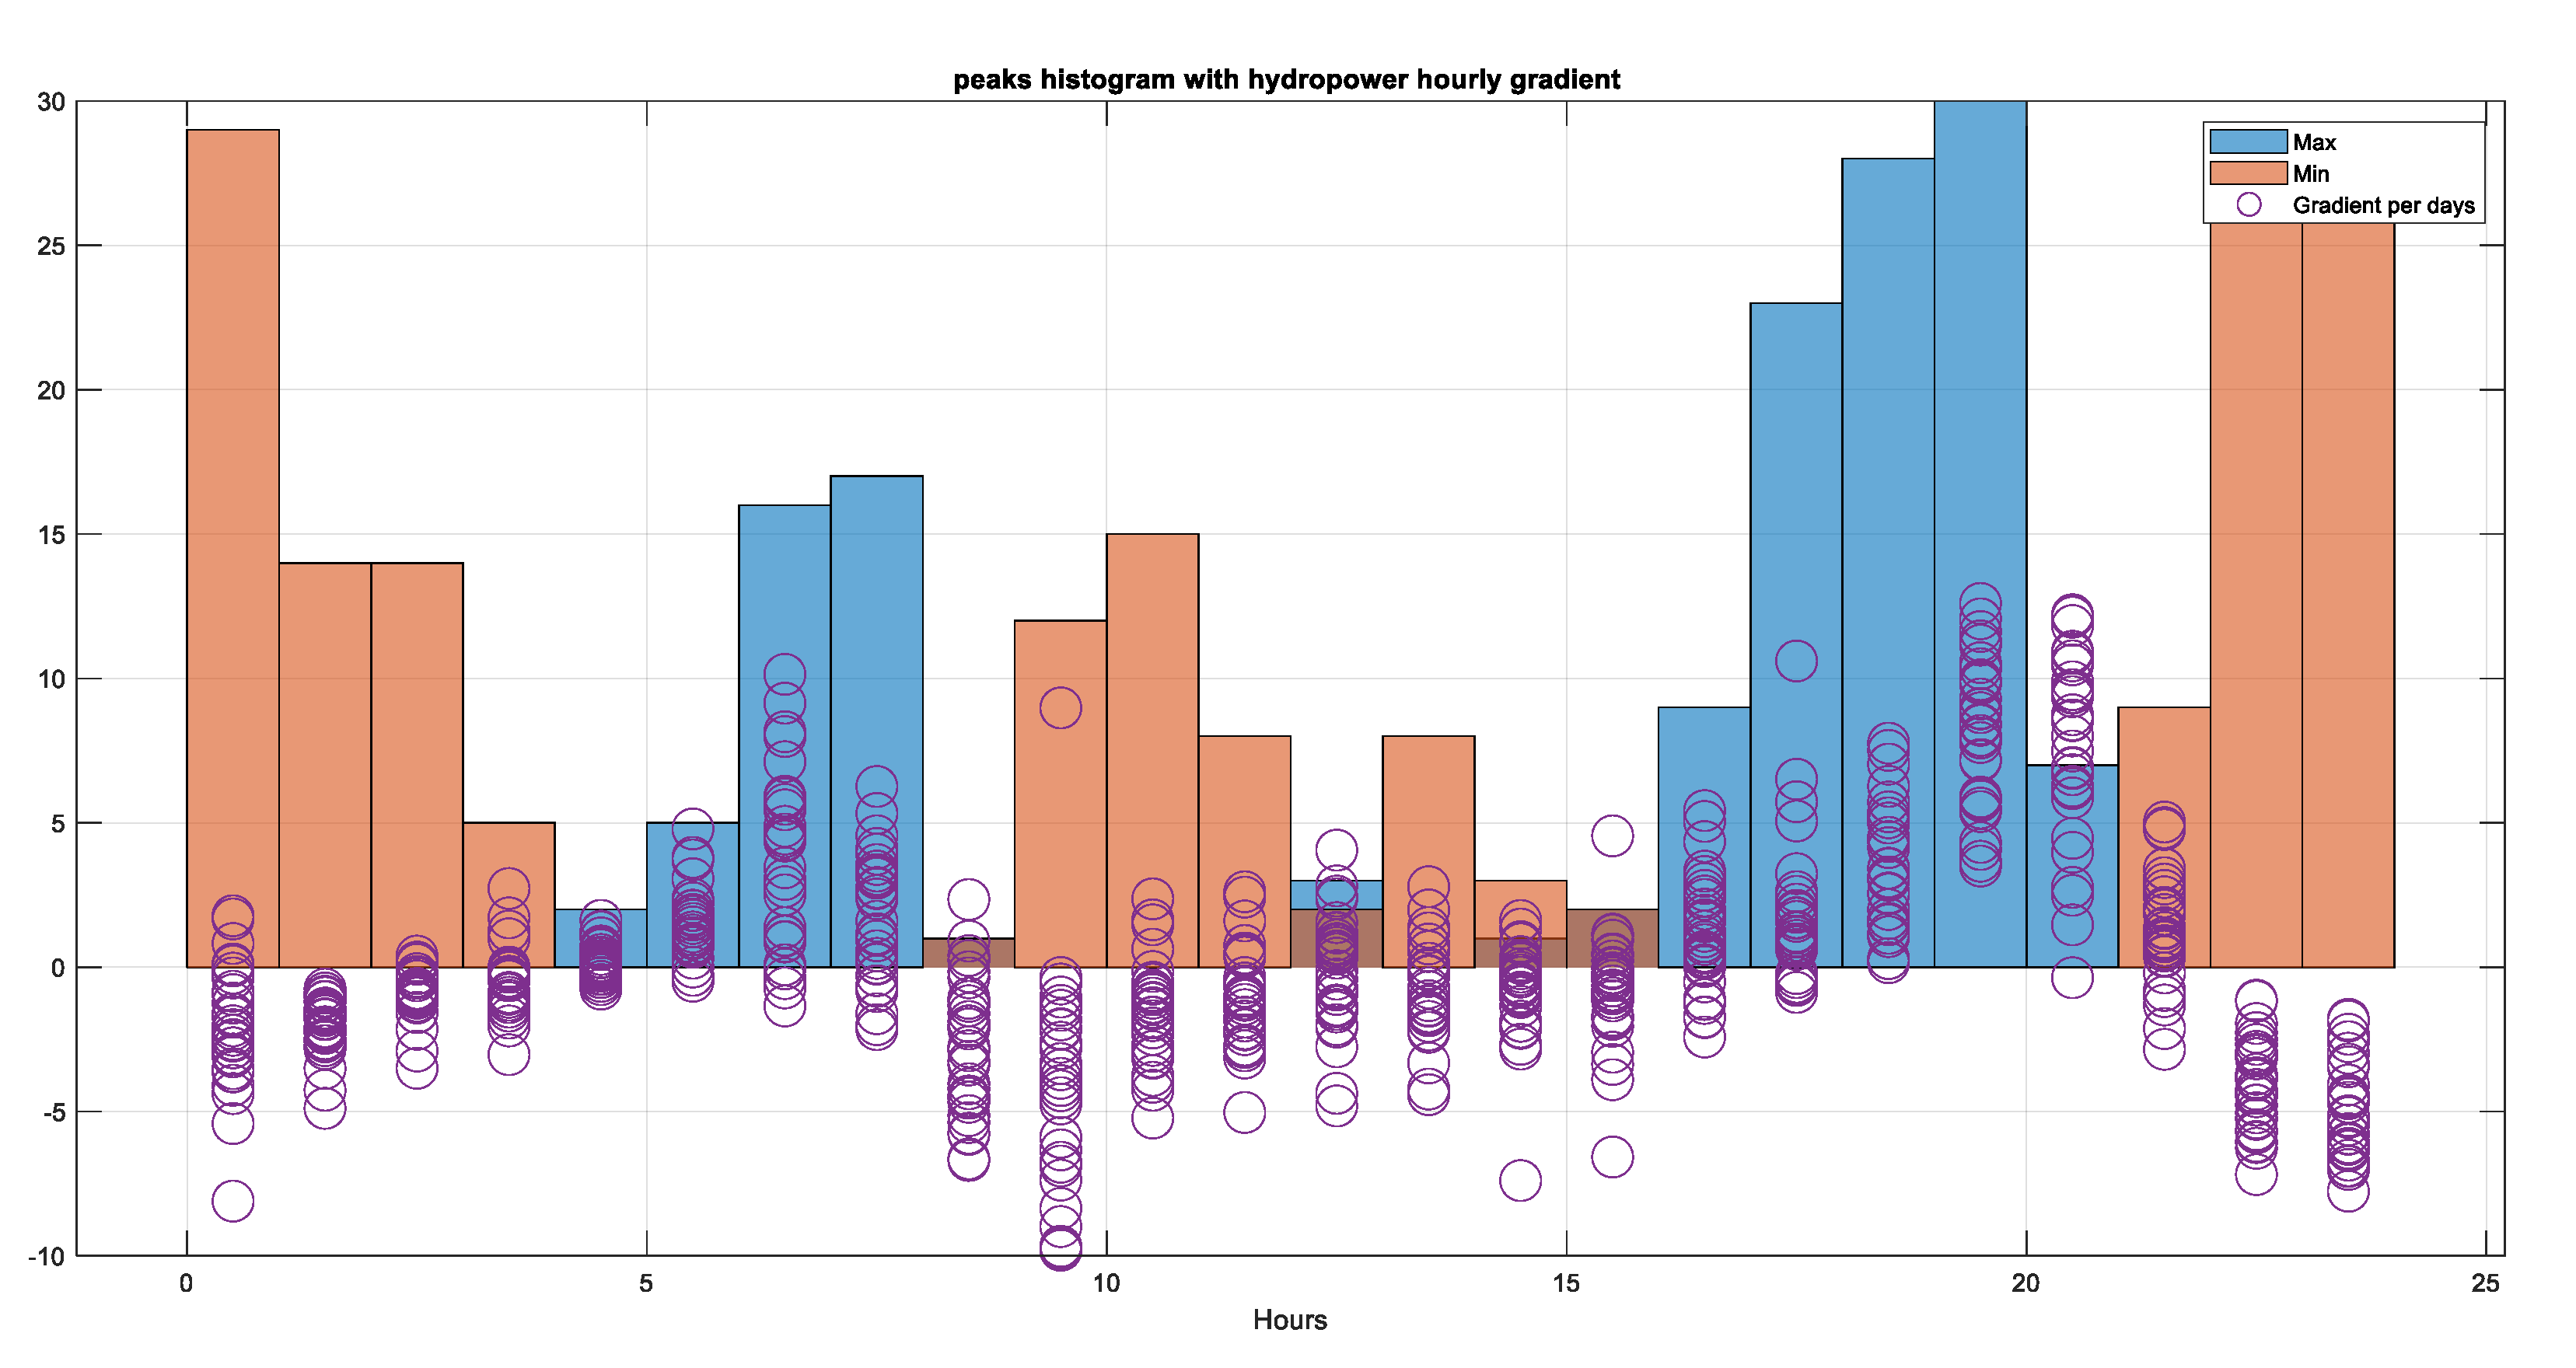
Figure 10.
Maxima and minima hourly histogram on November 2022, along with hourly hydropower gradient.
Figure 10.
Maxima and minima hourly histogram on November 2022, along with hourly hydropower gradient.
In
Figure 10, we can clearly notice that when localized minimum points appear, the slopes at which these minimum points occurred tend to be negative for the most part, representing a downward trend of the power curve. On the contrary, if we look at the areas of local maxima, we see that most of the gradients are positive, which represent the upward trend of the hydropower curve.
Table 1 shows the percentage of sign similarity of the gradients calculated using the pseudo-linear and linear regression methods. This indicates that both methods have a very high percentage of similarity in terms of the upward and downward trends, which are the focus of
Figure 10.
Figure 11.
Scatter plot of local maxima and minima vs hourly hydropower gradient on December 2022.
Figure 11.
Scatter plot of local maxima and minima vs hourly hydropower gradient on December 2022.
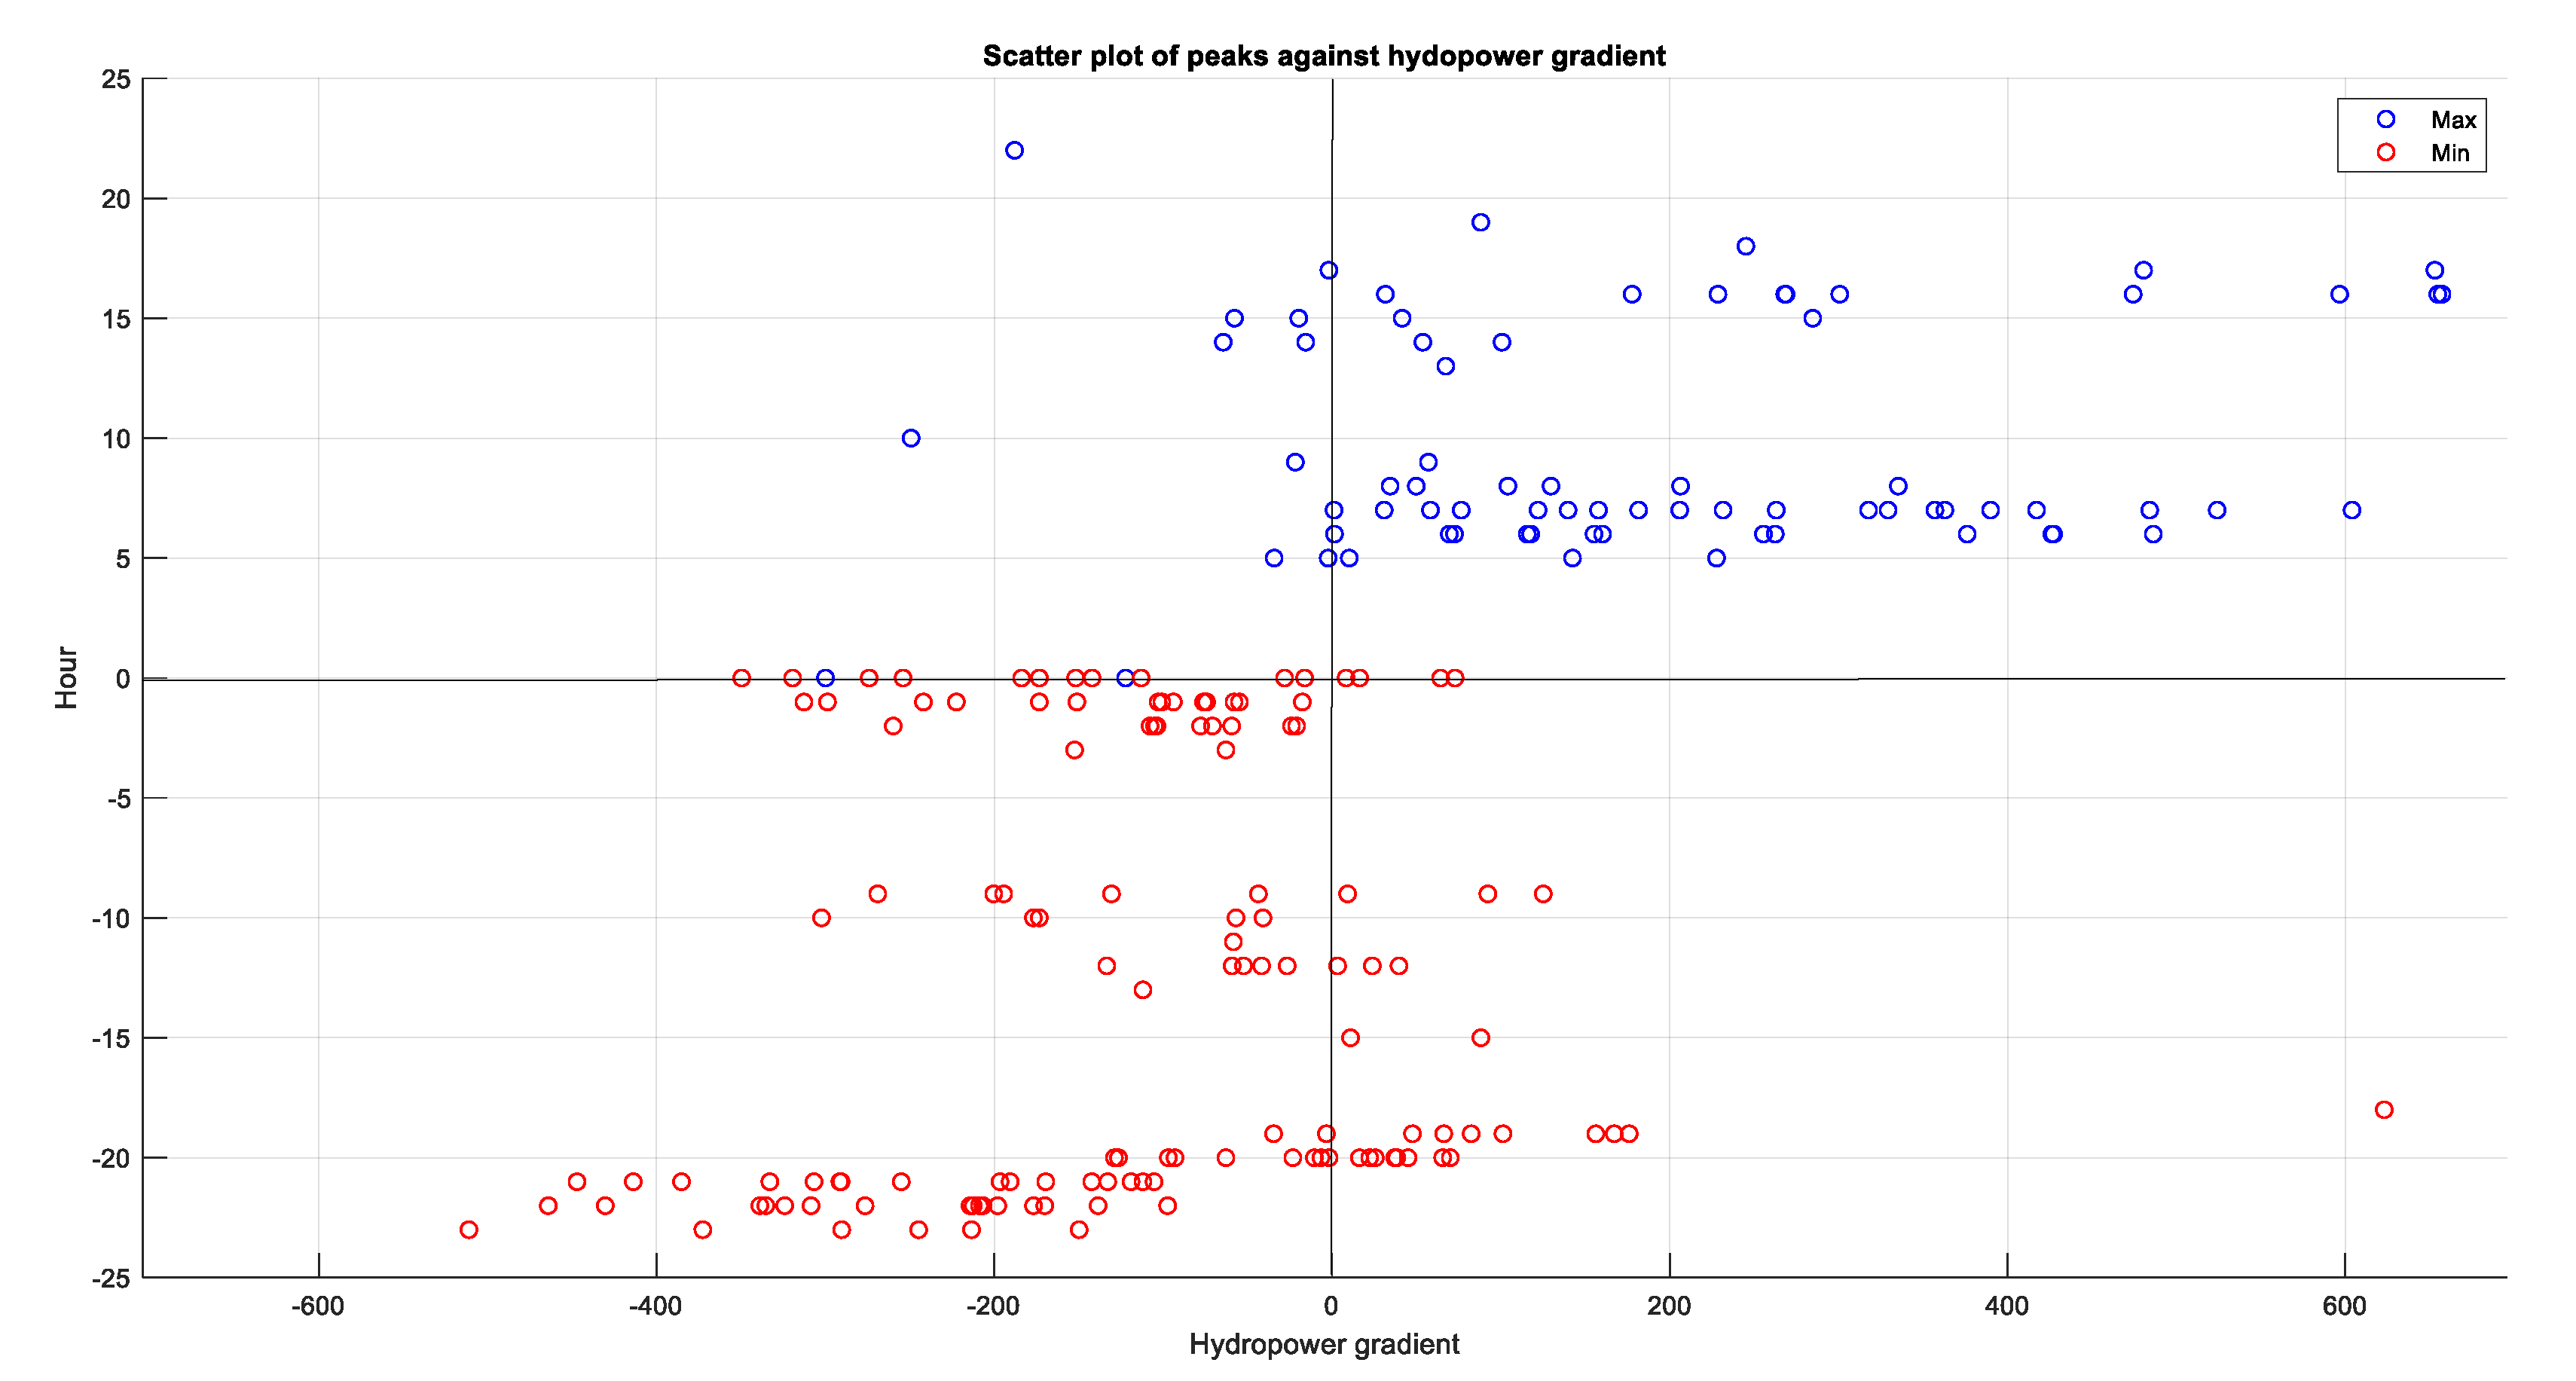
Finally, a scatter plot was created to confirm the veracity of the relationship between hydropower gradient and the located maximum and minimum points.
In
Figure 11 we represent the values of the hourly slopes of the hydropower on the X-axis, and on the Y-axis, the hours at which these maxima or minima have occurred. Positive values on the Y-axis represent days where maxima have occurred, and negative values represent days where minima have occurred. Therefore, we see that quadrants 1 and 3 of the diagram contain the most localized points. Quadrant 1 indicates positive gradient values and local maxima obtained by the algorithms, while quadrant 3 indicates negative gradient values and local minima filtered by the algorithm.
Table 2 shows the percentage of local maxima and minima found in the first and third quadrant, respectively, as seen in
Figure 11.
These statistical results support the hypothesis that local frequency maxima are correlated with the positive gradient of the hydropower, while local frequency minima are correlated with the negative gradient of the power.
In
Table 3 and
Table 4 we can observe the accuracy percentage of matching maxima and minima with positive and negative gradient, for combined-cycle and wind power respectively.
These results lead us to the conclusion that hydropower has the strongest relationship with the maximum and minimum values. Nonetheless, as mentioned earlier, the gradients of power from combined-cycle have a significant correlation with the extremes that cannot be ignored. However, in the case of wind power, no statistically significant correlation has been found with the extremes.
4. Discussion
The study reveals a strong correlation between the gradient of hydropower and the frequency variations of the Spanish electric grid; however, due to design limitations and unmeasured factors, a causal relationship between these two variables cannot be demonstrated. Therefore, caution is important when interpreting these results and further research is needed to determine whether the observed correlation is due to a causal relationship or other factors that have not been considered in this study.
The main reason for this correlation could be attributed to the ability of hydropower plants to introduce large amounts of energy into the electricity grid in a relatively short period of time. Since the frequency of the electricity grid is directly proportional to the amount of energy supplied and consumed, sudden changes in hydropower could have a significant impact on the grid frequency.
It is important to note that abrupt frequency variations in the electricity grid can have a negative impact on the country's industrial equipment. This is because electrical equipment is designed to operate within specific frequency and voltage limits, and variations outside these limits can cause mechanical stress and strain that can damage internal components and reduce equipment efficiency [
2].
Therefore, it is essential to implement ad hoc measures to control the frequency and voltage of the electricity grid and minimize abrupt variations, while maintaining stability and quality of the supplied electrical energy. In addition, it is essential that industrial equipment is designed to withstand frequency and voltage variations within established limits to avoid damage and loss of efficiency.
Finally, it should be noted that despite the limitations of this study, the results provide a solid foundation for future research seeking to determine causality between grid frequency and hydropower. It is necessary to carry out studies that use more rigorous and comprehensive methods, such as obtaining frequency data at a point near a hydropower plant, as frequency disturbances will be measured more clearly at points closer to the source of the disturbance than at points farther away.
The results of such investigations are useful for grid operators for the development of strategies related with the implementation of renewable energy resources in the grid.
Author Contributions
F.-J.G.-V. y J.A.-H programmed MATLABTM codes. J.-J.G.-d.-l.-R. y J.-M.S.-F developed the whole paper organization and were responsible for experiments design and equipment operation. F.-J.G.-V. y J.A.-H. analysed and interpreted the graphs generated. J.-J.G.-d.-l.-R. y J.-M.S.-F contributed to interpreting the results. J.A.-H did the bibliography research. All authors have read and agreed to the published version of the manuscript.
Funding
This research is funded by the Spanish Ministry of Science and Education through the project PID2019-108953RB-C21; has been co-financed by the European Union under the 2014–2020 ERDF Operational Program. Additionally, funding for frequency monitoring comes from the Andalusian-FEDER project FEDER-UCA18-108516 (Intelligent Techniques for visualization and data compression of PQ data in the smart grid).
Data Availability Statement
Acknowledgments
The authors express their gratitude to the Spanish Ministry of Science and Education for funding the research project PID2019-108953RB-C21, entitled “Strategies for Aggregated Generation of Photo-Voltaic Plants-Energy and Meteorological Data” (SAGPV-EMOD). This work has been co-financed by the European Union under the 2014–2020 ERDF Operational Program and by the Department of Economy, Knowledge, Business and University of the Regional Government of Andalusia.
Conflicts of Interest
The authors declare no conflict of interest.
References
- Alhelou, H.H.; Hamedani-Golshan, M.E.; Njenda, T.C.; Siano, P. A survey on power system blackout and cascading events: Research motivations and challenges. Energies 2019, 12, 682. [Google Scholar] [CrossRef]
- Eurelectric - European Network of Transmission System Operators for Electricity (ENTSO-E), “Deterministic frequency deviations-root causes and proposals for potential solutions,” 2011. [Online]. Available: https://www.entsoe.eu/home//.
- Gielen, D.; Boshell, F.; Saygin, D.; Bazilian, M.D.; Wagner, N.; Gorini, R. The role of renewable energy in the global energy transformation. Energy Strategy Reviews 2019, 24, 38–50. [Google Scholar] [CrossRef]
- Saha, S.; Saleem, M.I.; Roy, T.K. Impact of high penetration of renewable energy sources on grid frequency behaviour. International Journal of Electrical Power & Energy Systems 2023, 145, 108701. [Google Scholar] [CrossRef]
- Ortiz-Villalba, D.; Rahmann, C.; Alvarez, R.; Canizares, C.A.; Strunck, C. Practical Framework for Frequency Stability Studies in Power Systems with Renewable Energy Sources. IEEE Access 2020, 8, 202286–202297. [Google Scholar] [CrossRef]
- Musau M, Chepkania T, Odero A, and Wekesa C, Effects of Renewable Energy on Frequency Stability: A Proposed Case Study of the Kenyan Grid. IEEE, 2017.
- Singh, V.P.; Samuel, P.; Kishor, N. Impact of demand response for frequency regulation in two-area thermal power system. Int. Trans. Electr. Energy Syst. 2017, 27, etep–2246. [Google Scholar] [CrossRef]
- F. de León and B. T. Ooi, “Damping power system oscillations by unidirectional control of alternative power generation plants,” in Proceedings of the IEEE Power Engineering Society Transmission and Distribution Conference, 2001, vol. 2, no. WINTER MEETING, pp. 747–752. [CrossRef]
- J. Fernández-Morales et al. Statistical Dataset and Data Acquisition System for Monitoring the Voltage and Frequency of the Electrical Network in an Environment Based on Python and Grafana. Data 2022, 7, 77. [CrossRef]
- Strielkowski, W.; Civín, L.; Tarkhanova, E.; Tvaronavičienė, M.; Petrenko, Y. Renewable energy in the sustainable development of electrical power sector: A review. Energies 2021, 14, 8240. [Google Scholar] [CrossRef]
- Red Eléctrica Española, “National - Monitoring of Electrical Energy,” Available: https://demanda.ree.es/visiona/peninsula/nacional/total, 2023.
|
Disclaimer/Publisher’s Note: The statements, opinions and data contained in all publications are solely those of the individual author(s) and contributor(s) and not of MDPI and/or the editor(s). MDPI and/or the editor(s) disclaim responsibility for any injury to people or property resulting from any ideas, methods, instructions or products referred to in the content. |
© 2023 by the authors. Licensee MDPI, Basel, Switzerland. This article is an open access article distributed under the terms and conditions of the Creative Commons Attribution (CC BY) license (http://creativecommons.org/licenses/by/4.0/).
