Submitted:
24 March 2023
Posted:
27 March 2023
You are already at the latest version
Abstract
Keywords:
1. Introduction
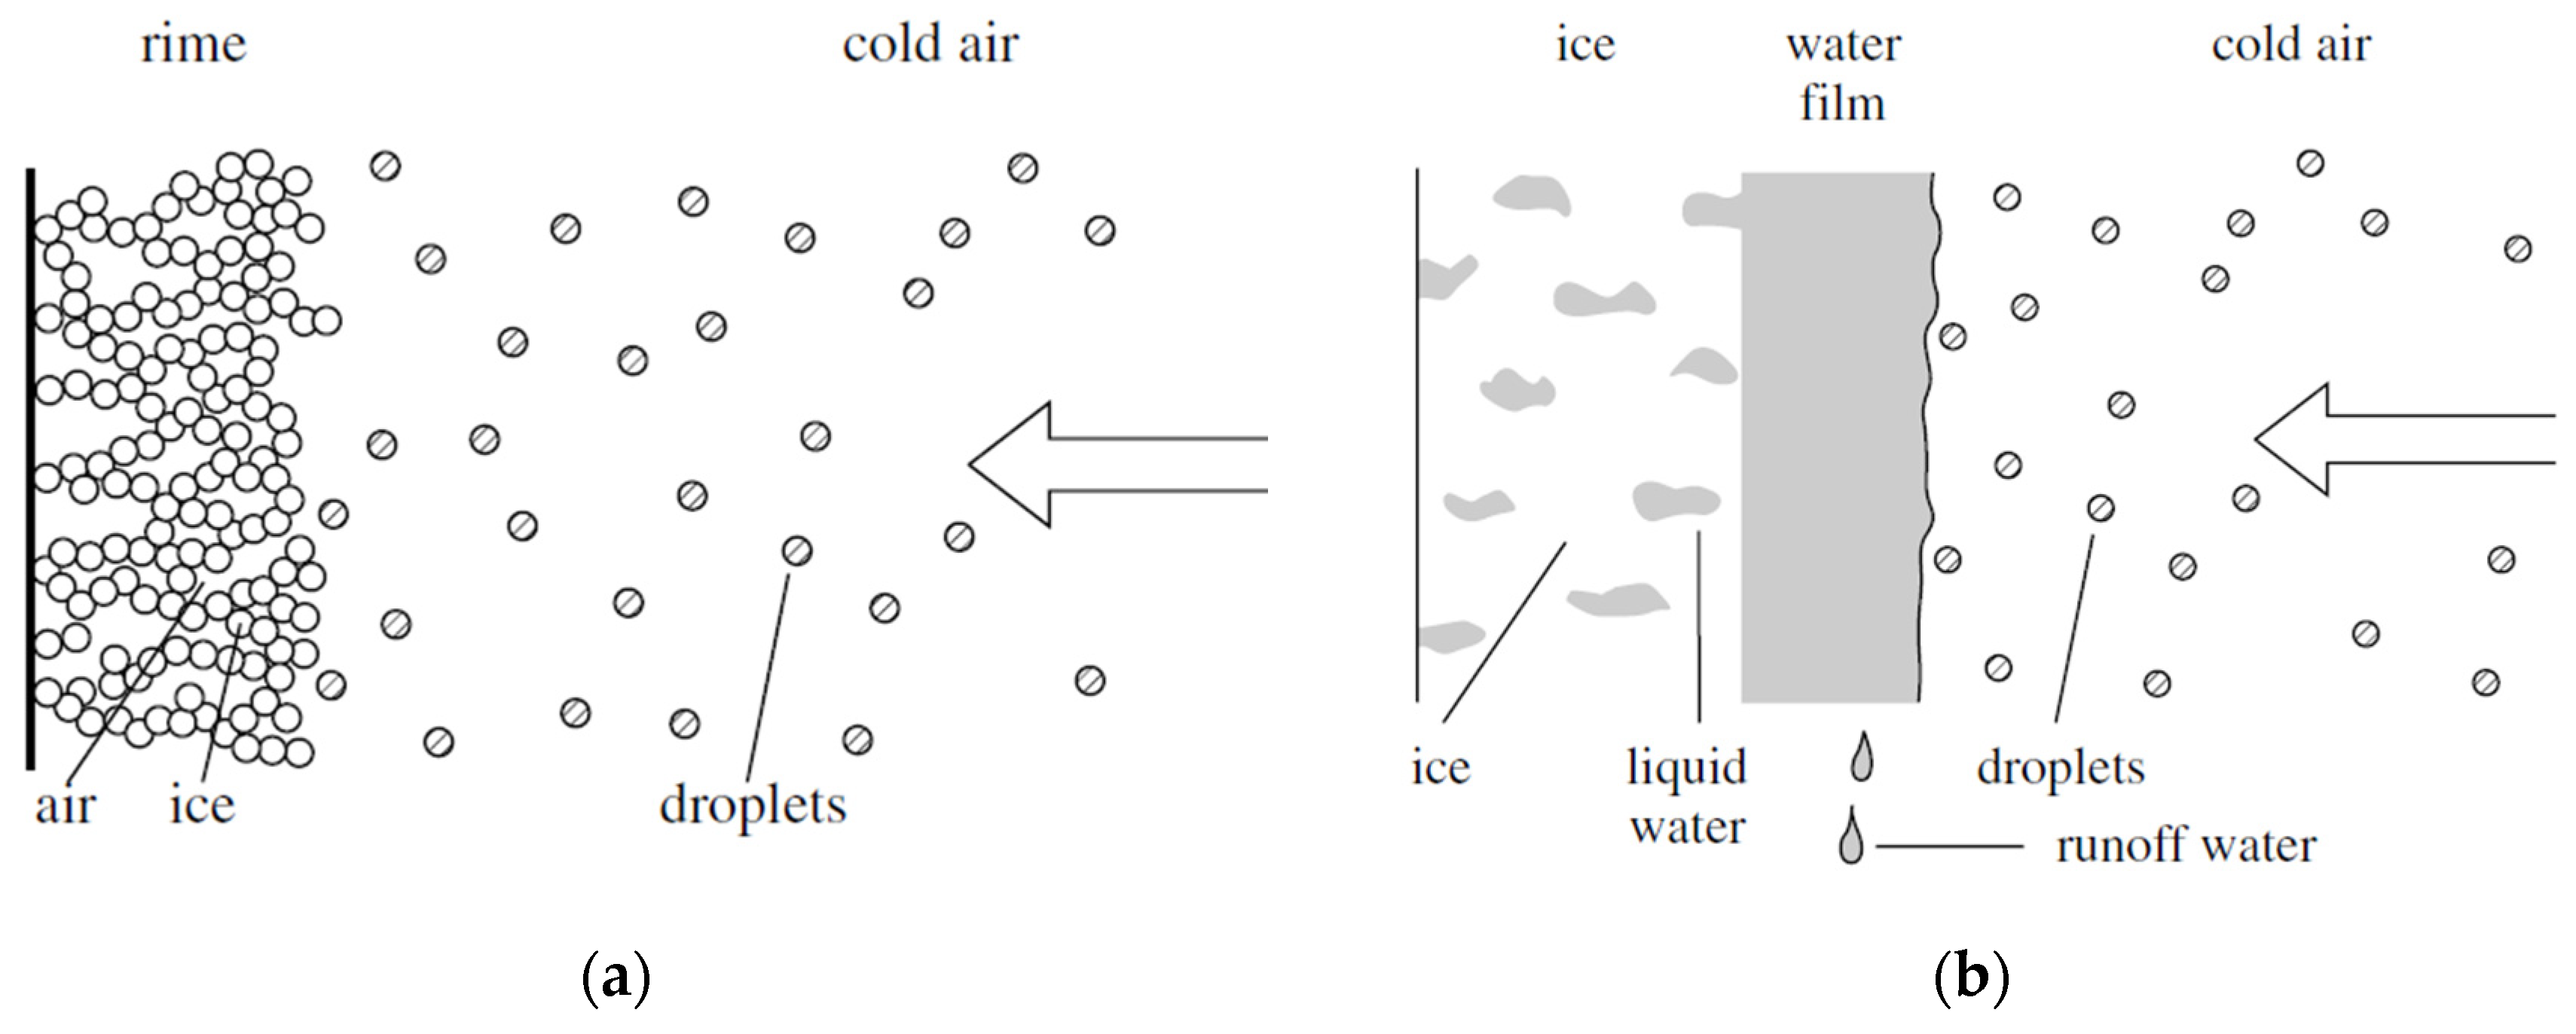
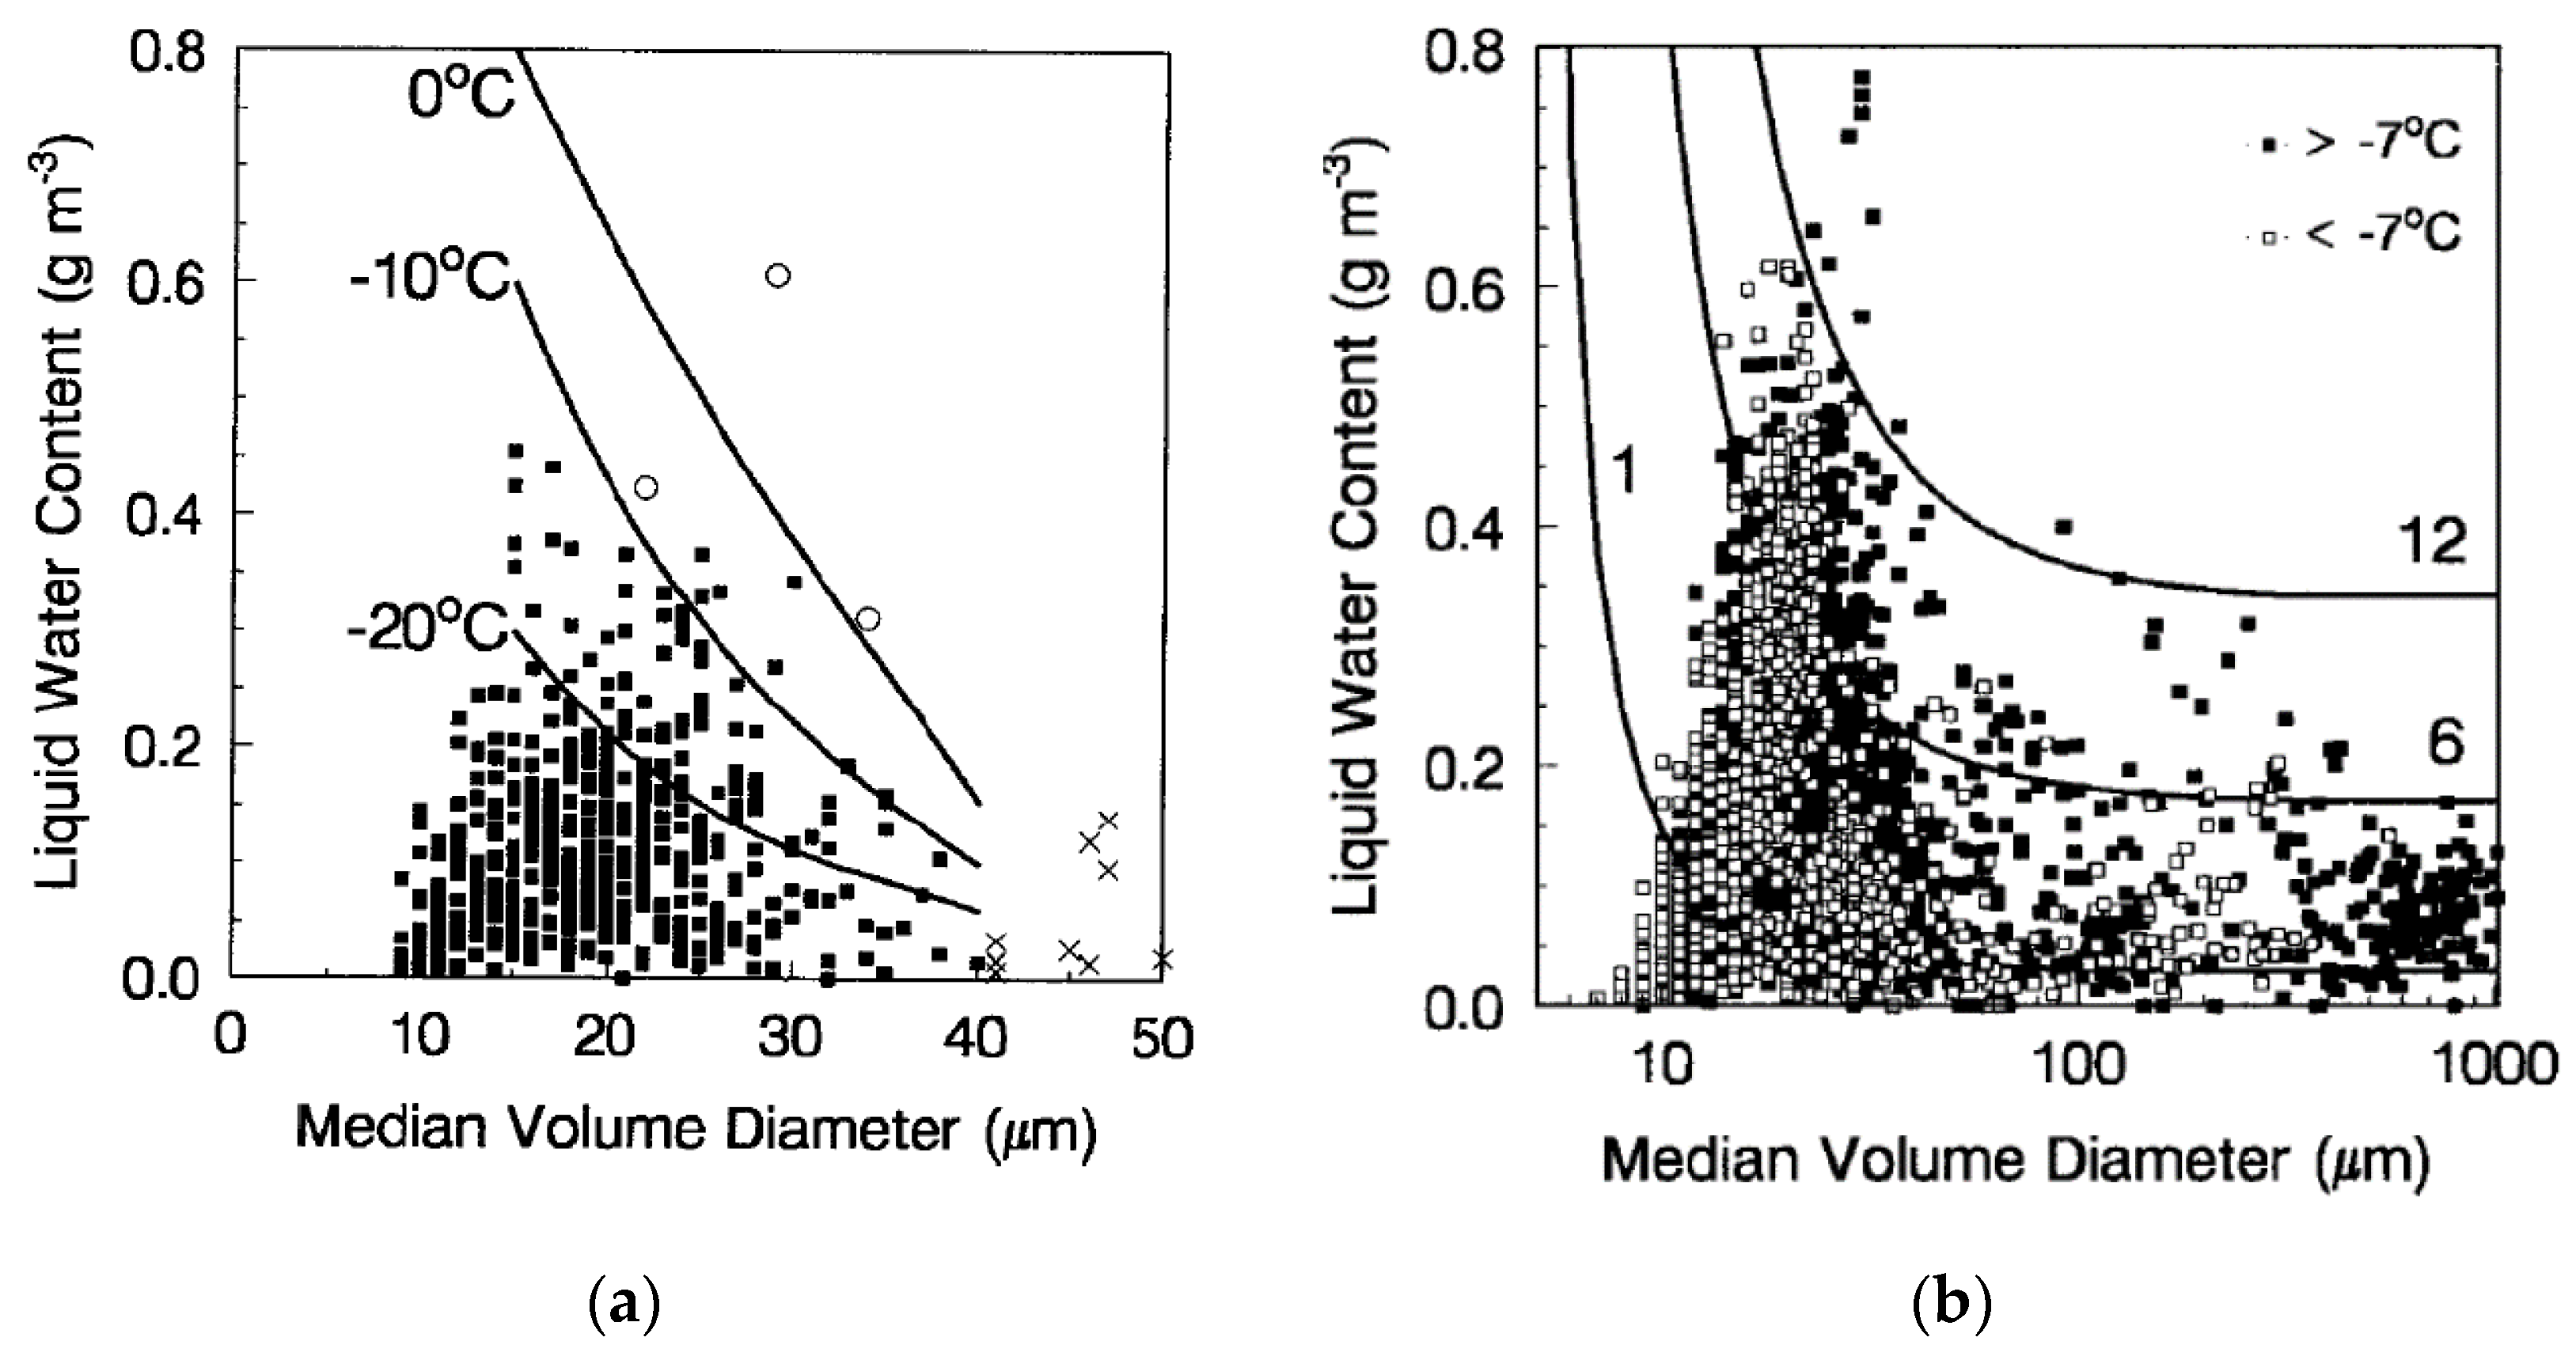
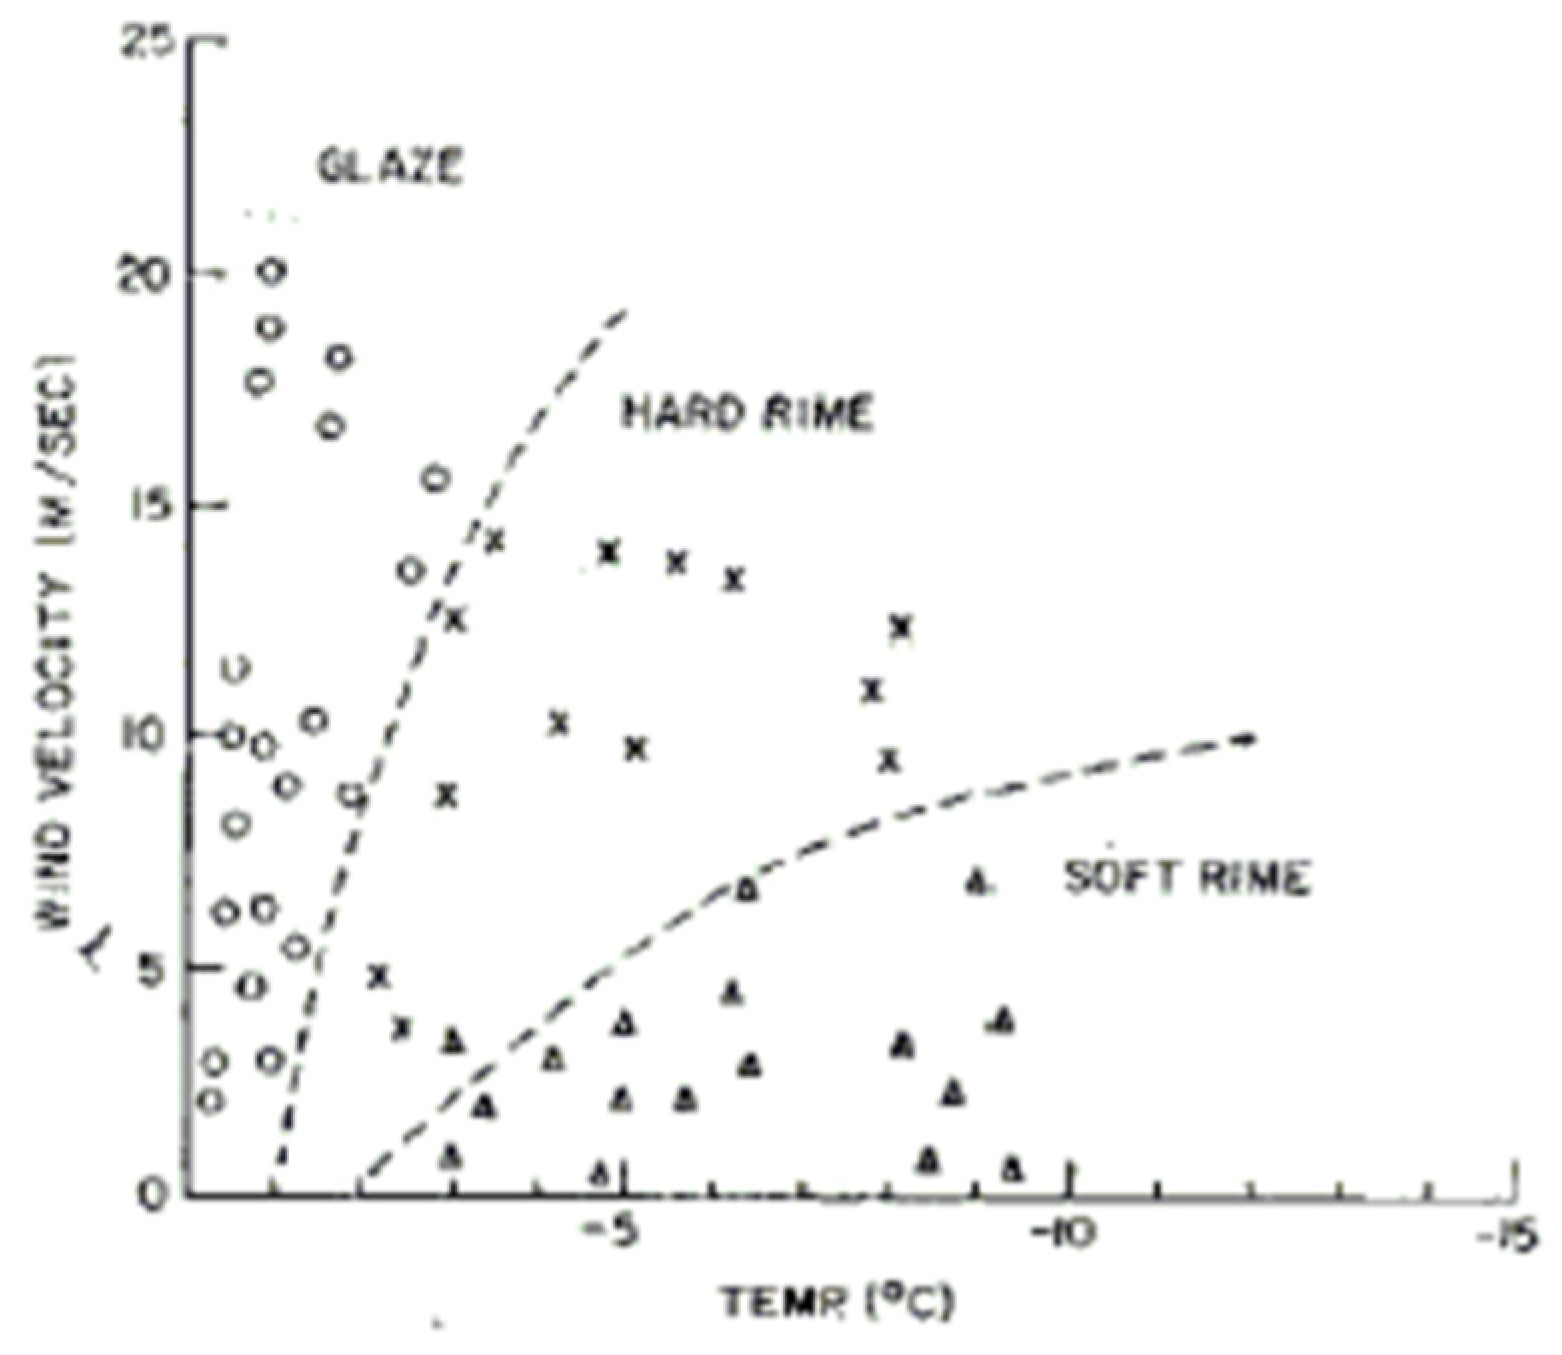
- Rime ice: it forms with air temperature ranging from -40°C to -15°C. water droplets suspended in air immediately freeze after impact; due to the rapidity air its trapped inside ice resulting a white ice crystalline and brittle. It is easy to remove with de-icing system such as inflatable boots. Rime ice can affect seriously the aerodynamic performance due to the irregular horn shaped protrusion that affect the adhesion of the boundary layer of the airstream [7,8,9,10].
- Clear Ice: occurs at higher temperatures, ranging from -10°c to 0°C with larger supercooled water droplets. Water remaining liquid runs back as a thin film and freezes progressively. Ice formed have no air cavities and so the final ice appears translucent. Clear ice is considered the most tenacious to remove and the most critical for balancing due to the high density [11,12].
- Mixed Ice: between -15°C and -10°C mixed ice forms. It is basically a blend of the previous two with the worst characteristics of both; glaze ice is surrounded by thin feather-shaped rime ice formations [13].

- Increased weight: Ice accumulation on an aircsraft's wings, tail, and other surfaces can increase its weight, which can affect its performance and fuel consumption;
- Reduced lift: Ice can change the shape of an aircraft's wings and reduce its ability to generate lift, which reduce the performance and make it harder to take off, climb, and maintain altitude.
- Increased drag: Ice can increase the drag on an aircraft's wings and other surfaces, which can reduce its speed and fuel efficiency.
- Risk of stall: the protrusions created by the ice formation can led to detachment of the boundary layer and so can induce a stall phenomenon. Furthermore stall warning system are designed to operate with clean airfoil. The profile change due to ice accumulation anticipates the stall effect without giving to pilot prodromal advices;
- Loss of control: Ice can affect an aircraft's control surfaces, such as the ailerons, elevators, and rudder, making it more difficult to maneuver and potentially leading to a loss of control.
- Engine problems: Ice can accumulate on an aircraft's engines, disrupting their airflow and potentially causing them to malfunction or stall.
- Reduced visibility/ Air Data corruption: Ice accumulation on an aircraft's windshield, windows, and air data sensors can reduce visibility and corrupt air data (pressure altitude, air speed, vertical speed) reducing the safety of the flight.
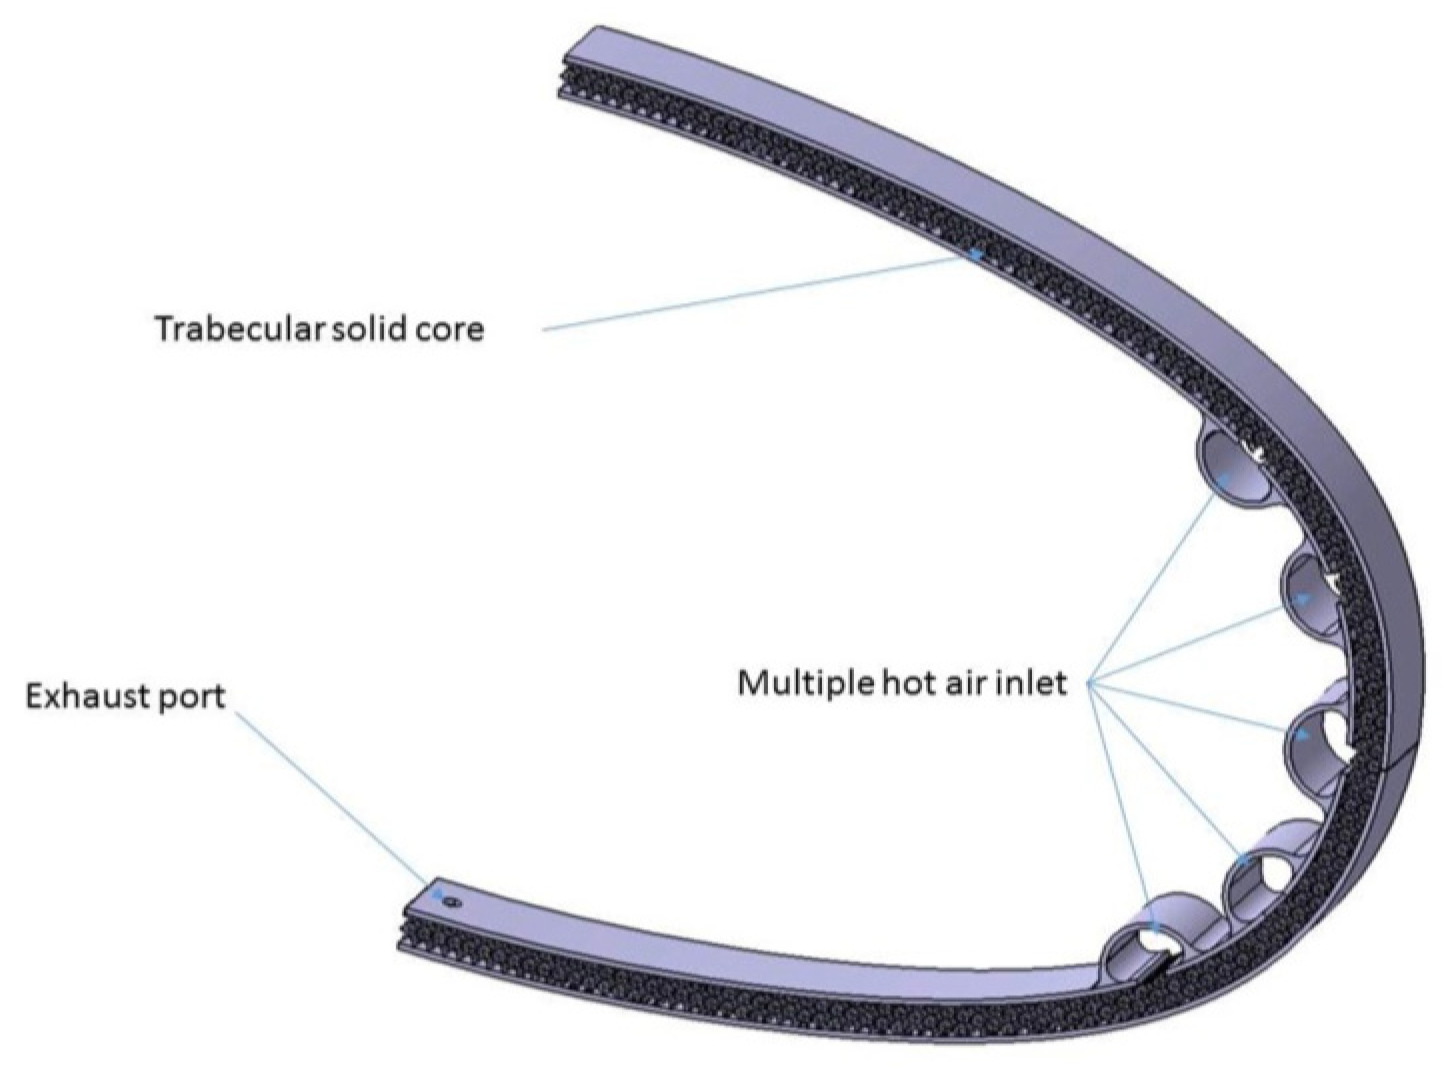
- Thermal efficiency: air passage inside of the lattice core create a high turbulence that enhances the heat exchange. Moreover the punctual control over the lattice permits to customize the heat diffused where needed;
- System efficiency: integrating the system function inside of the structure permits an important weight saving;
- Reduction in construction and maintenance cost: the panel is recyclable and is a single piece plug and play without need of welding, joining or special gluing;
- Easy to rescale and manufacture: permits to install this system even in small scale aircraft or UAV with an enhancement in the flight safety and operability
2. Materials and Methods
2.1. Ice accretion model
- Flow field resolution: external flow is solved through Navier Stokes Equations.
- Dispersed Phase: calculation of the trajectories of liquid phase is entered using Dispersed Multiphase Model (DMP) present in STAR CCM+.
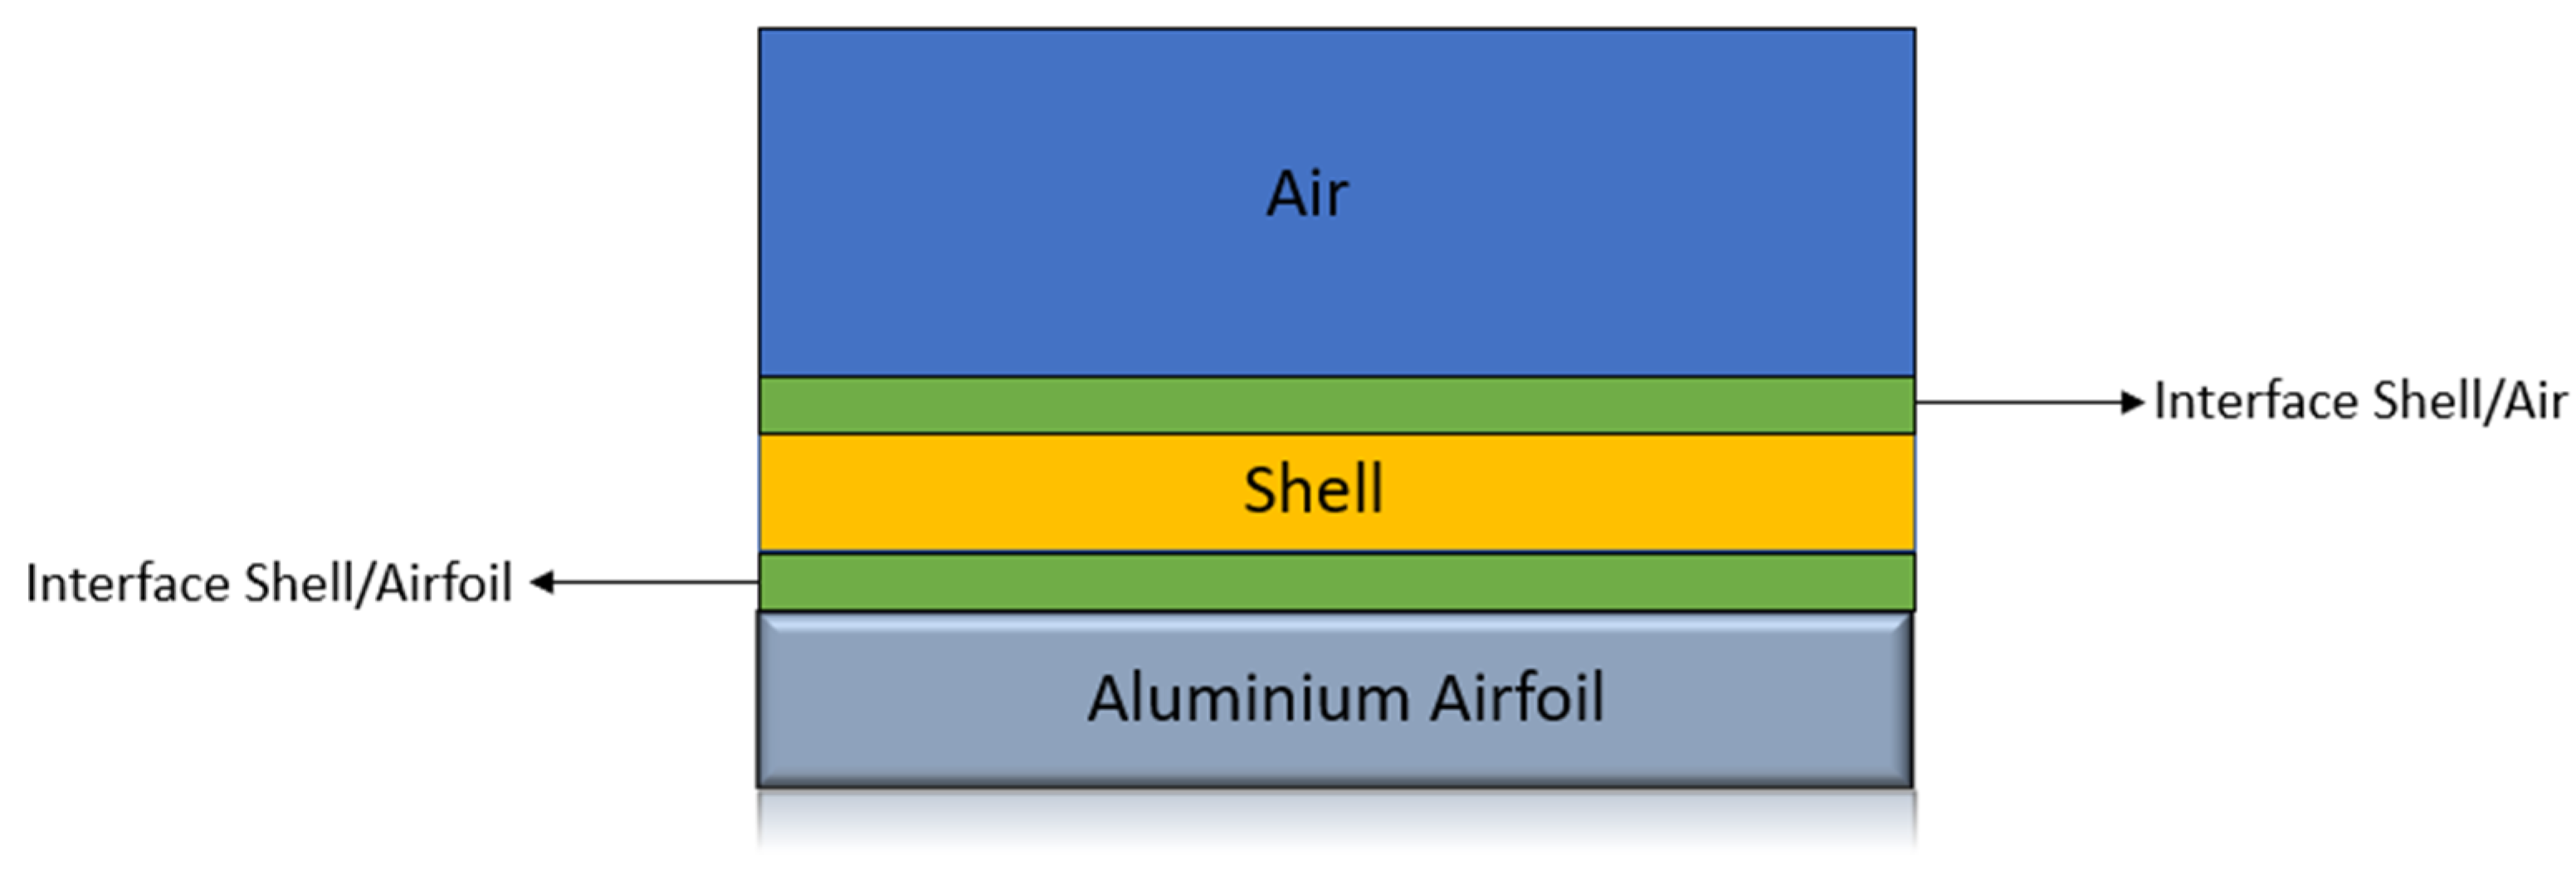
- Fluid Film Resolution: evaluates the impacting particles and determines freezing or liquefaction by solving Conjugate heat Transfer (CHT) thermodynamic balance.
- Ice thickness calculation; identify the local thickness formed in step 3.
- Morphing: modify the flow grid subtracting the solidified ice from the air domain.
2.1. Anti ice Model Setup
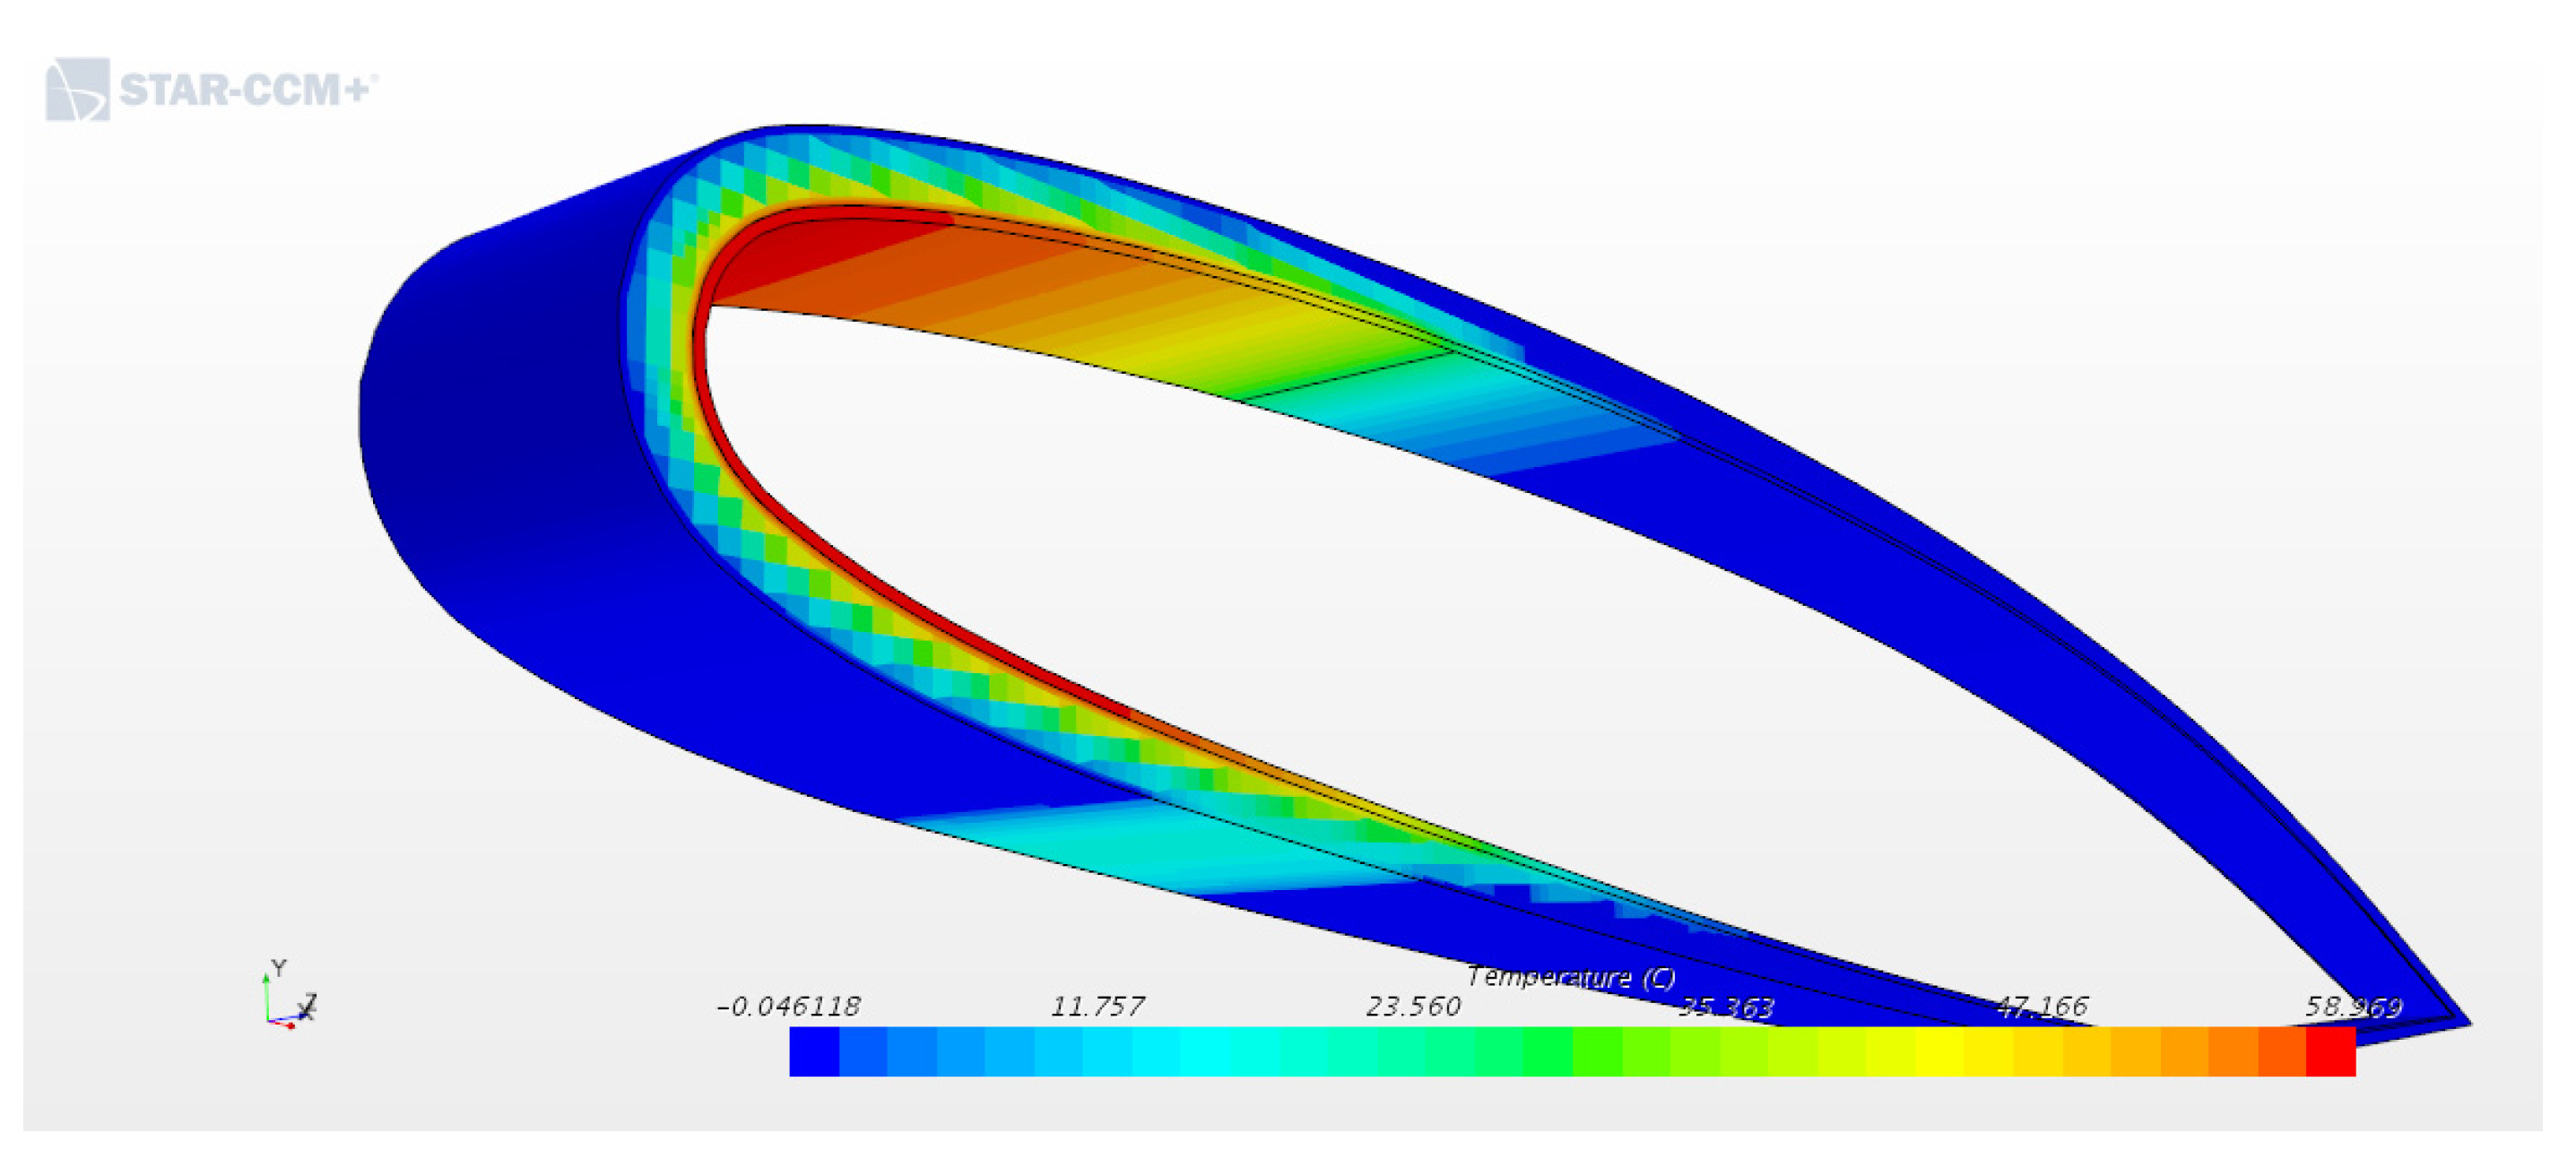
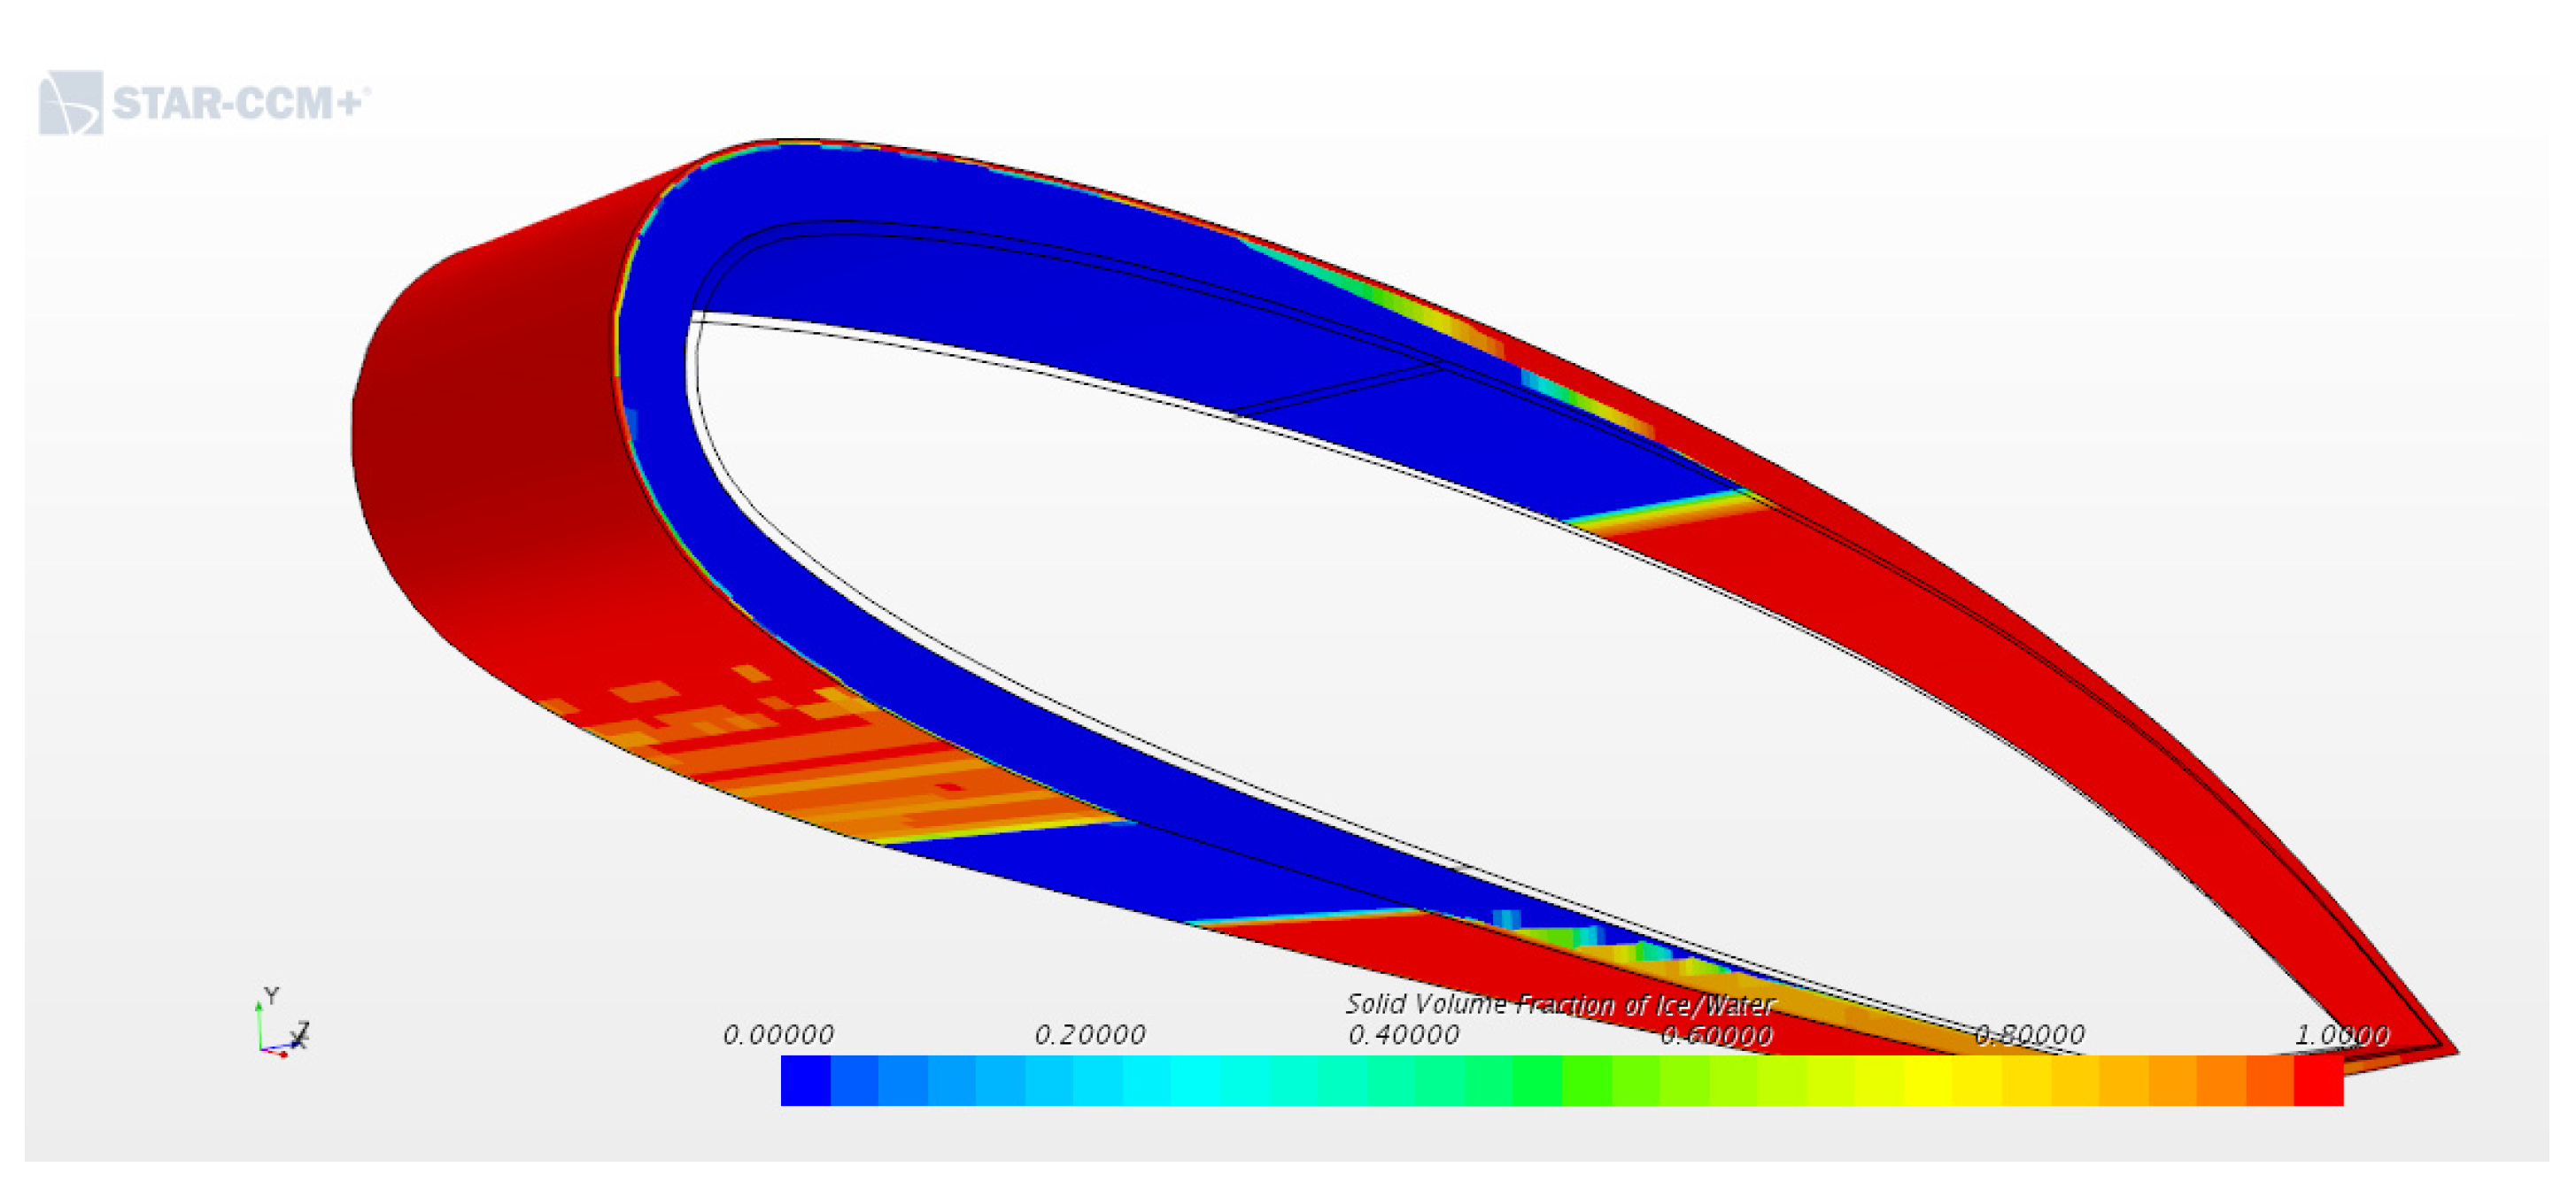
2.2. De ice Model Setup

3. Results
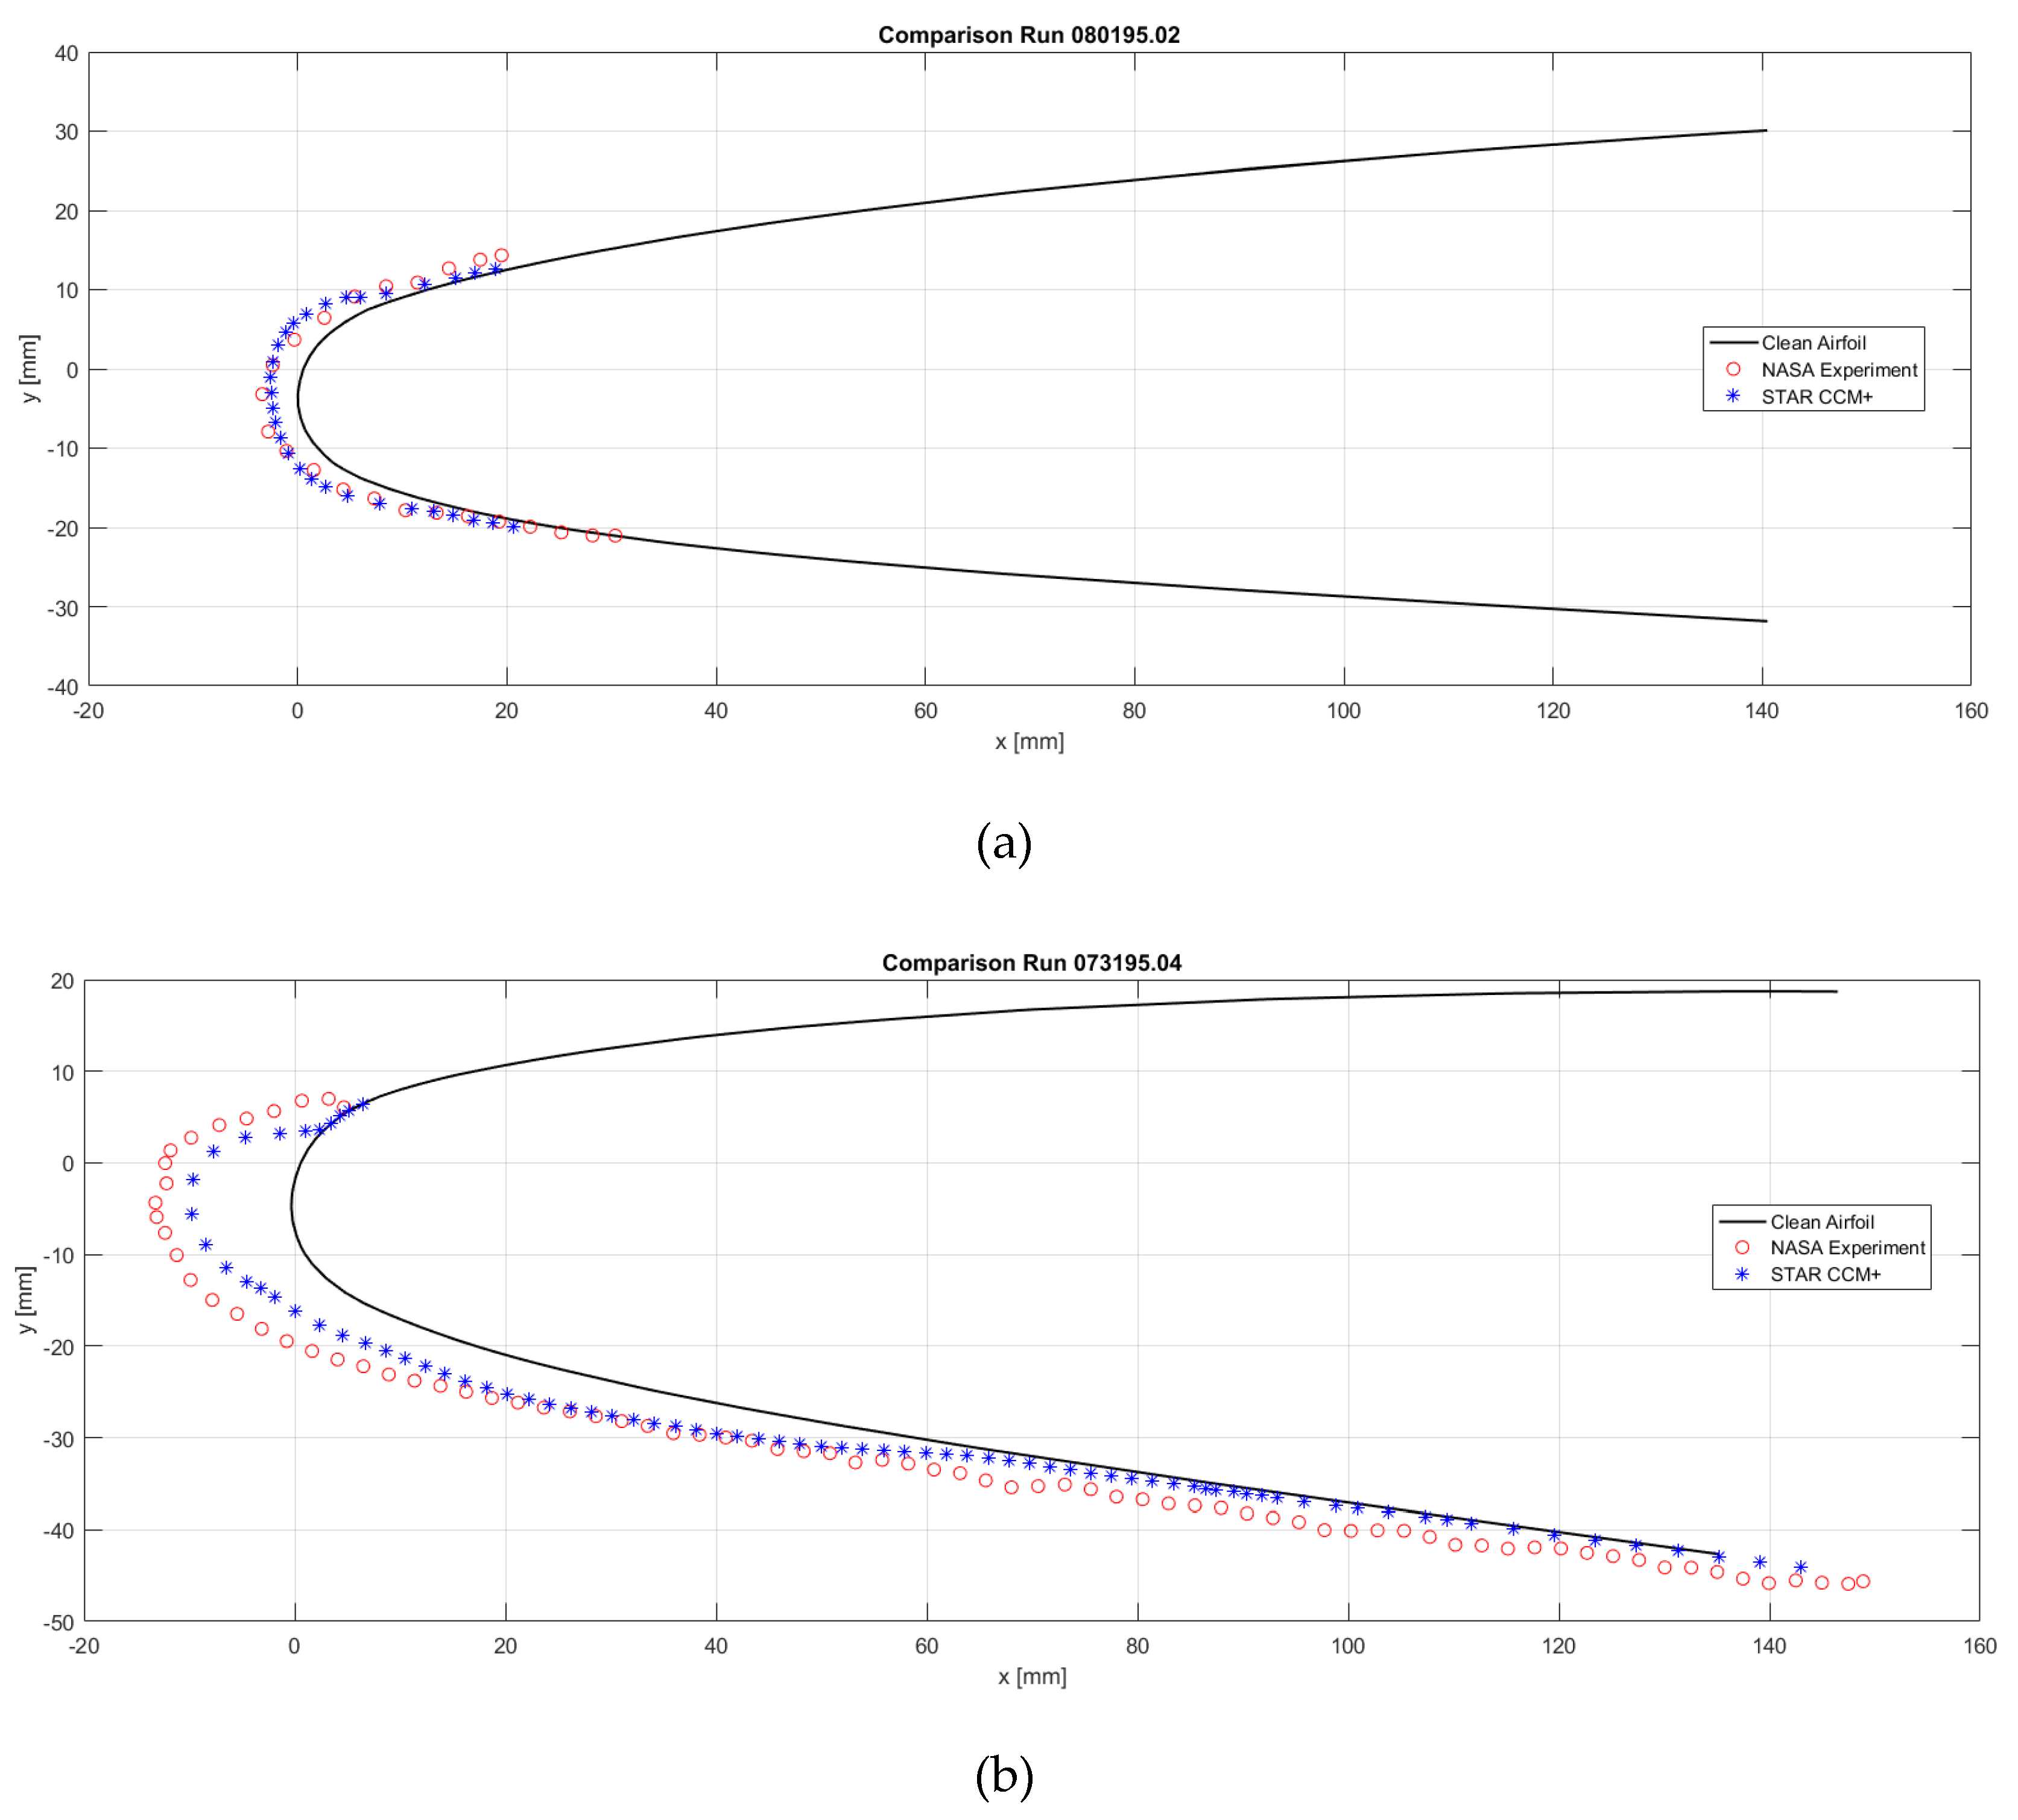
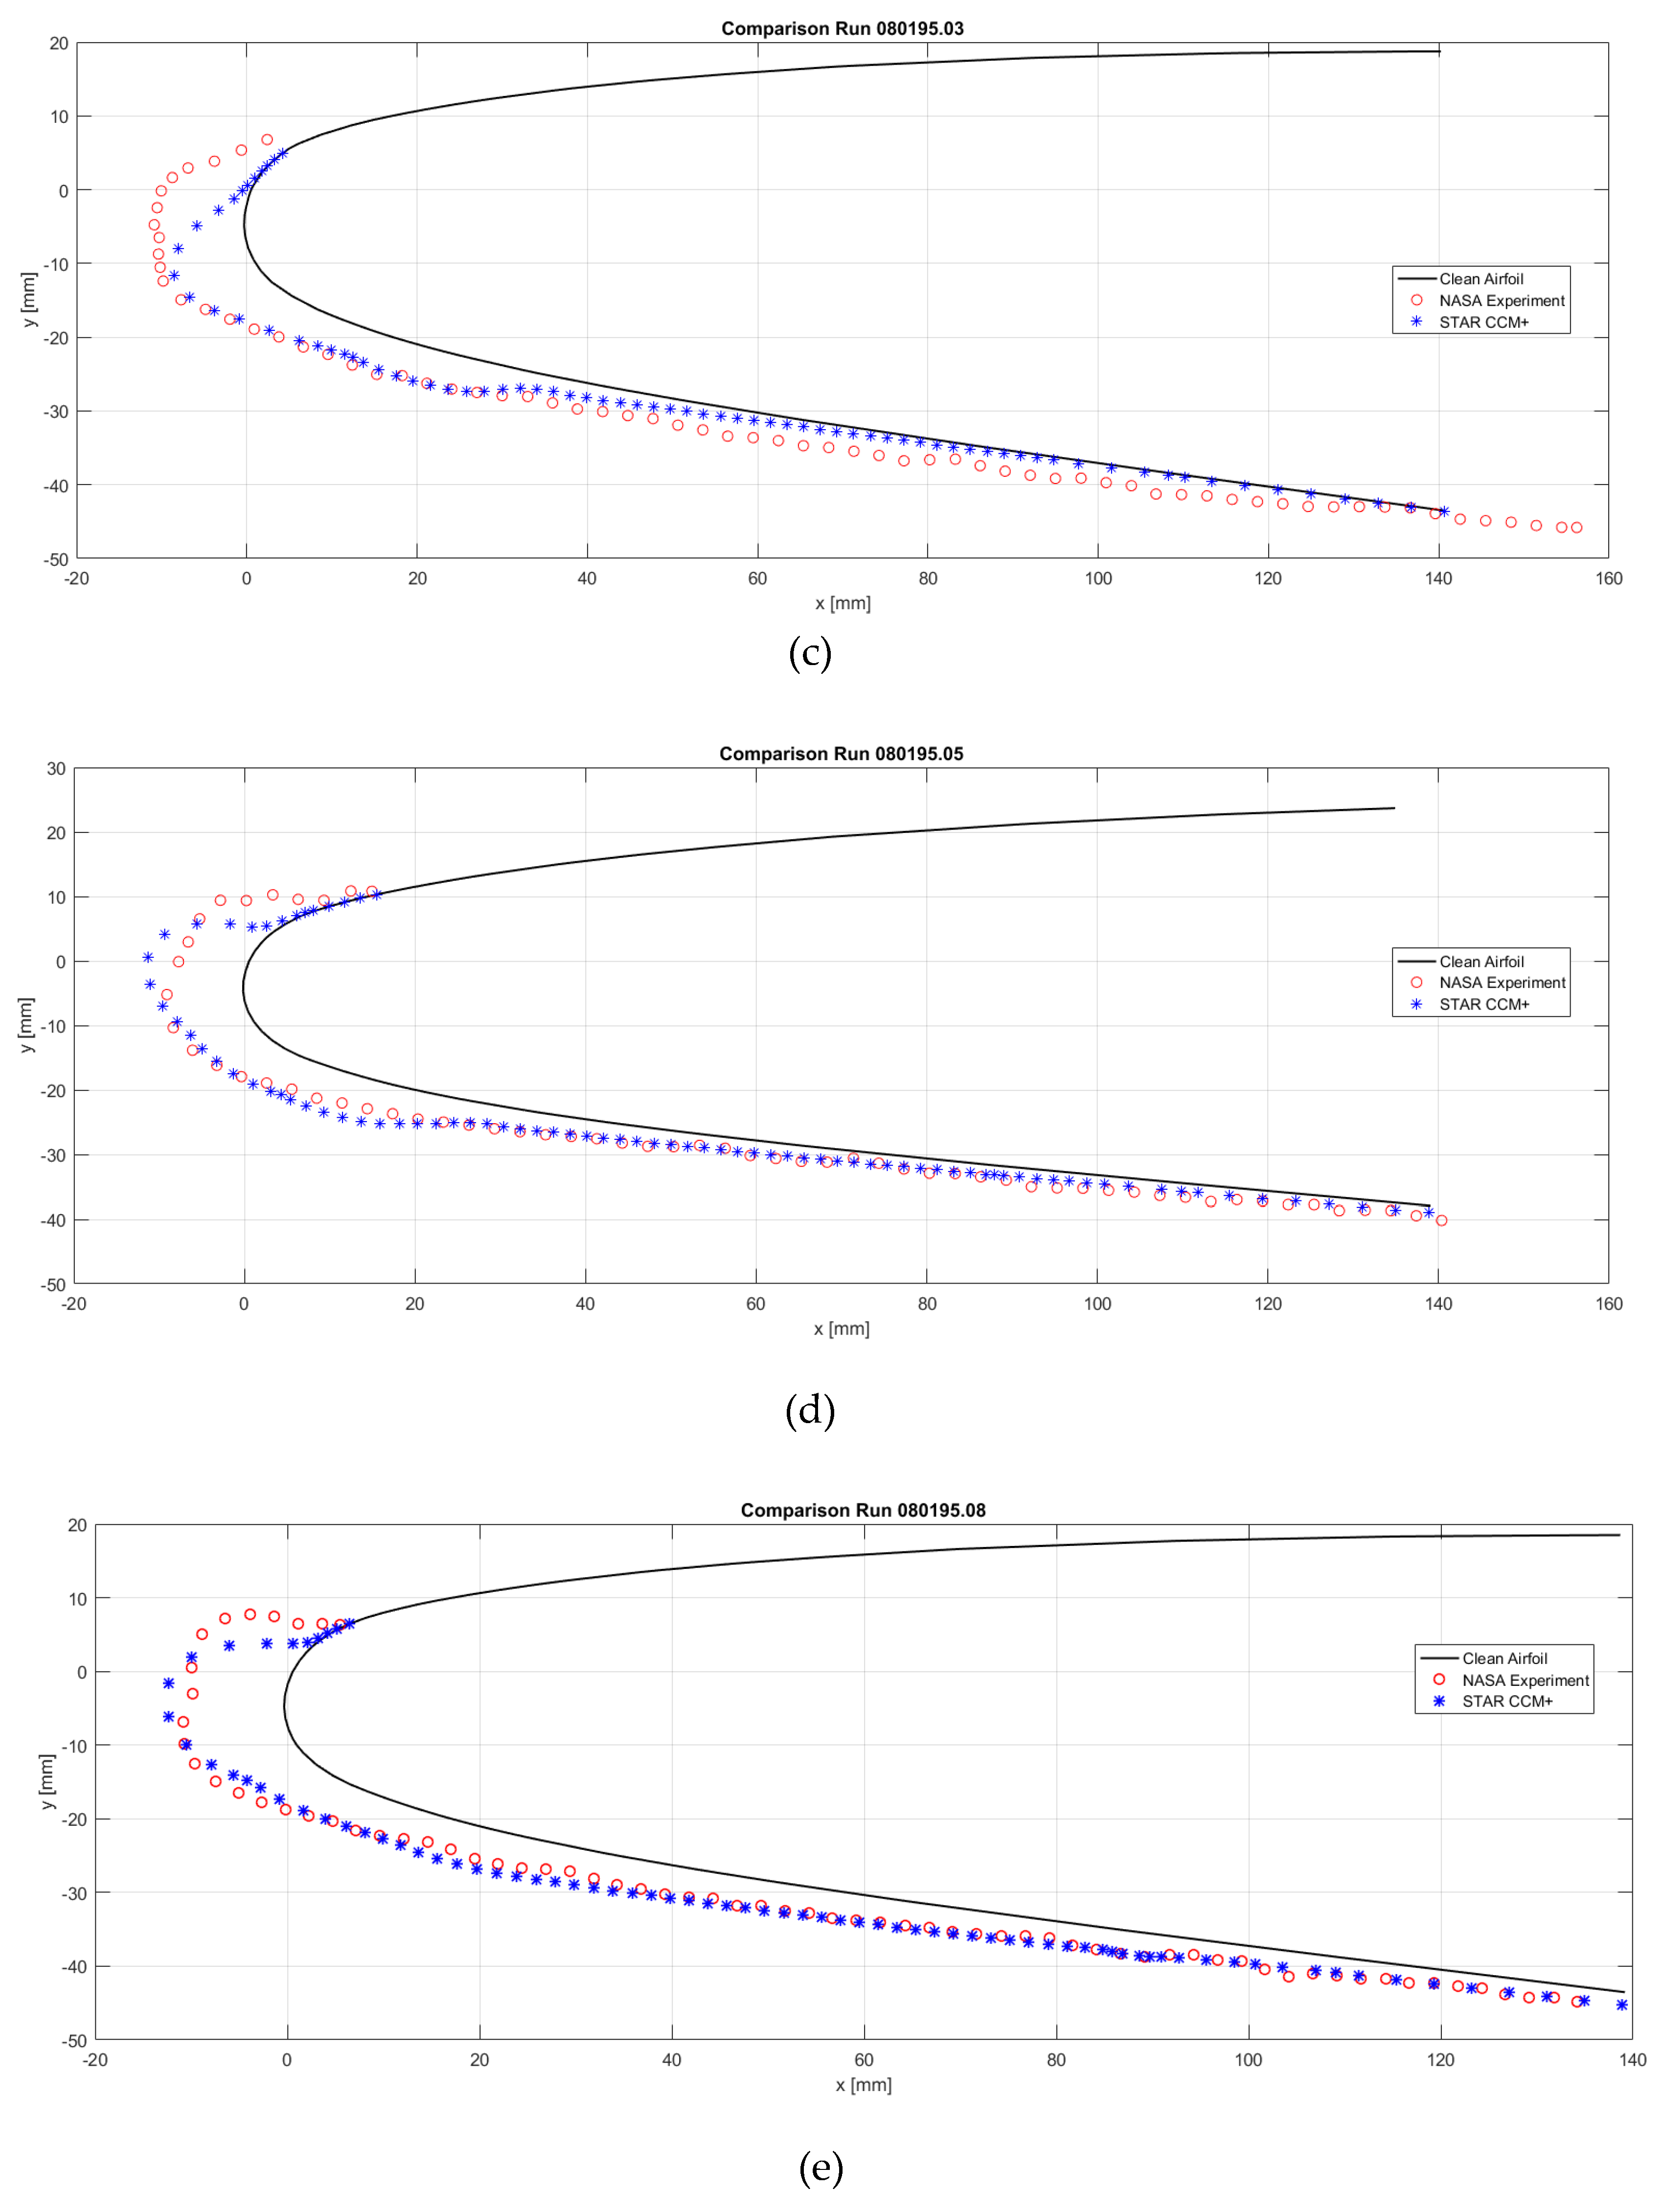
3.1. Ice accretion model Validation
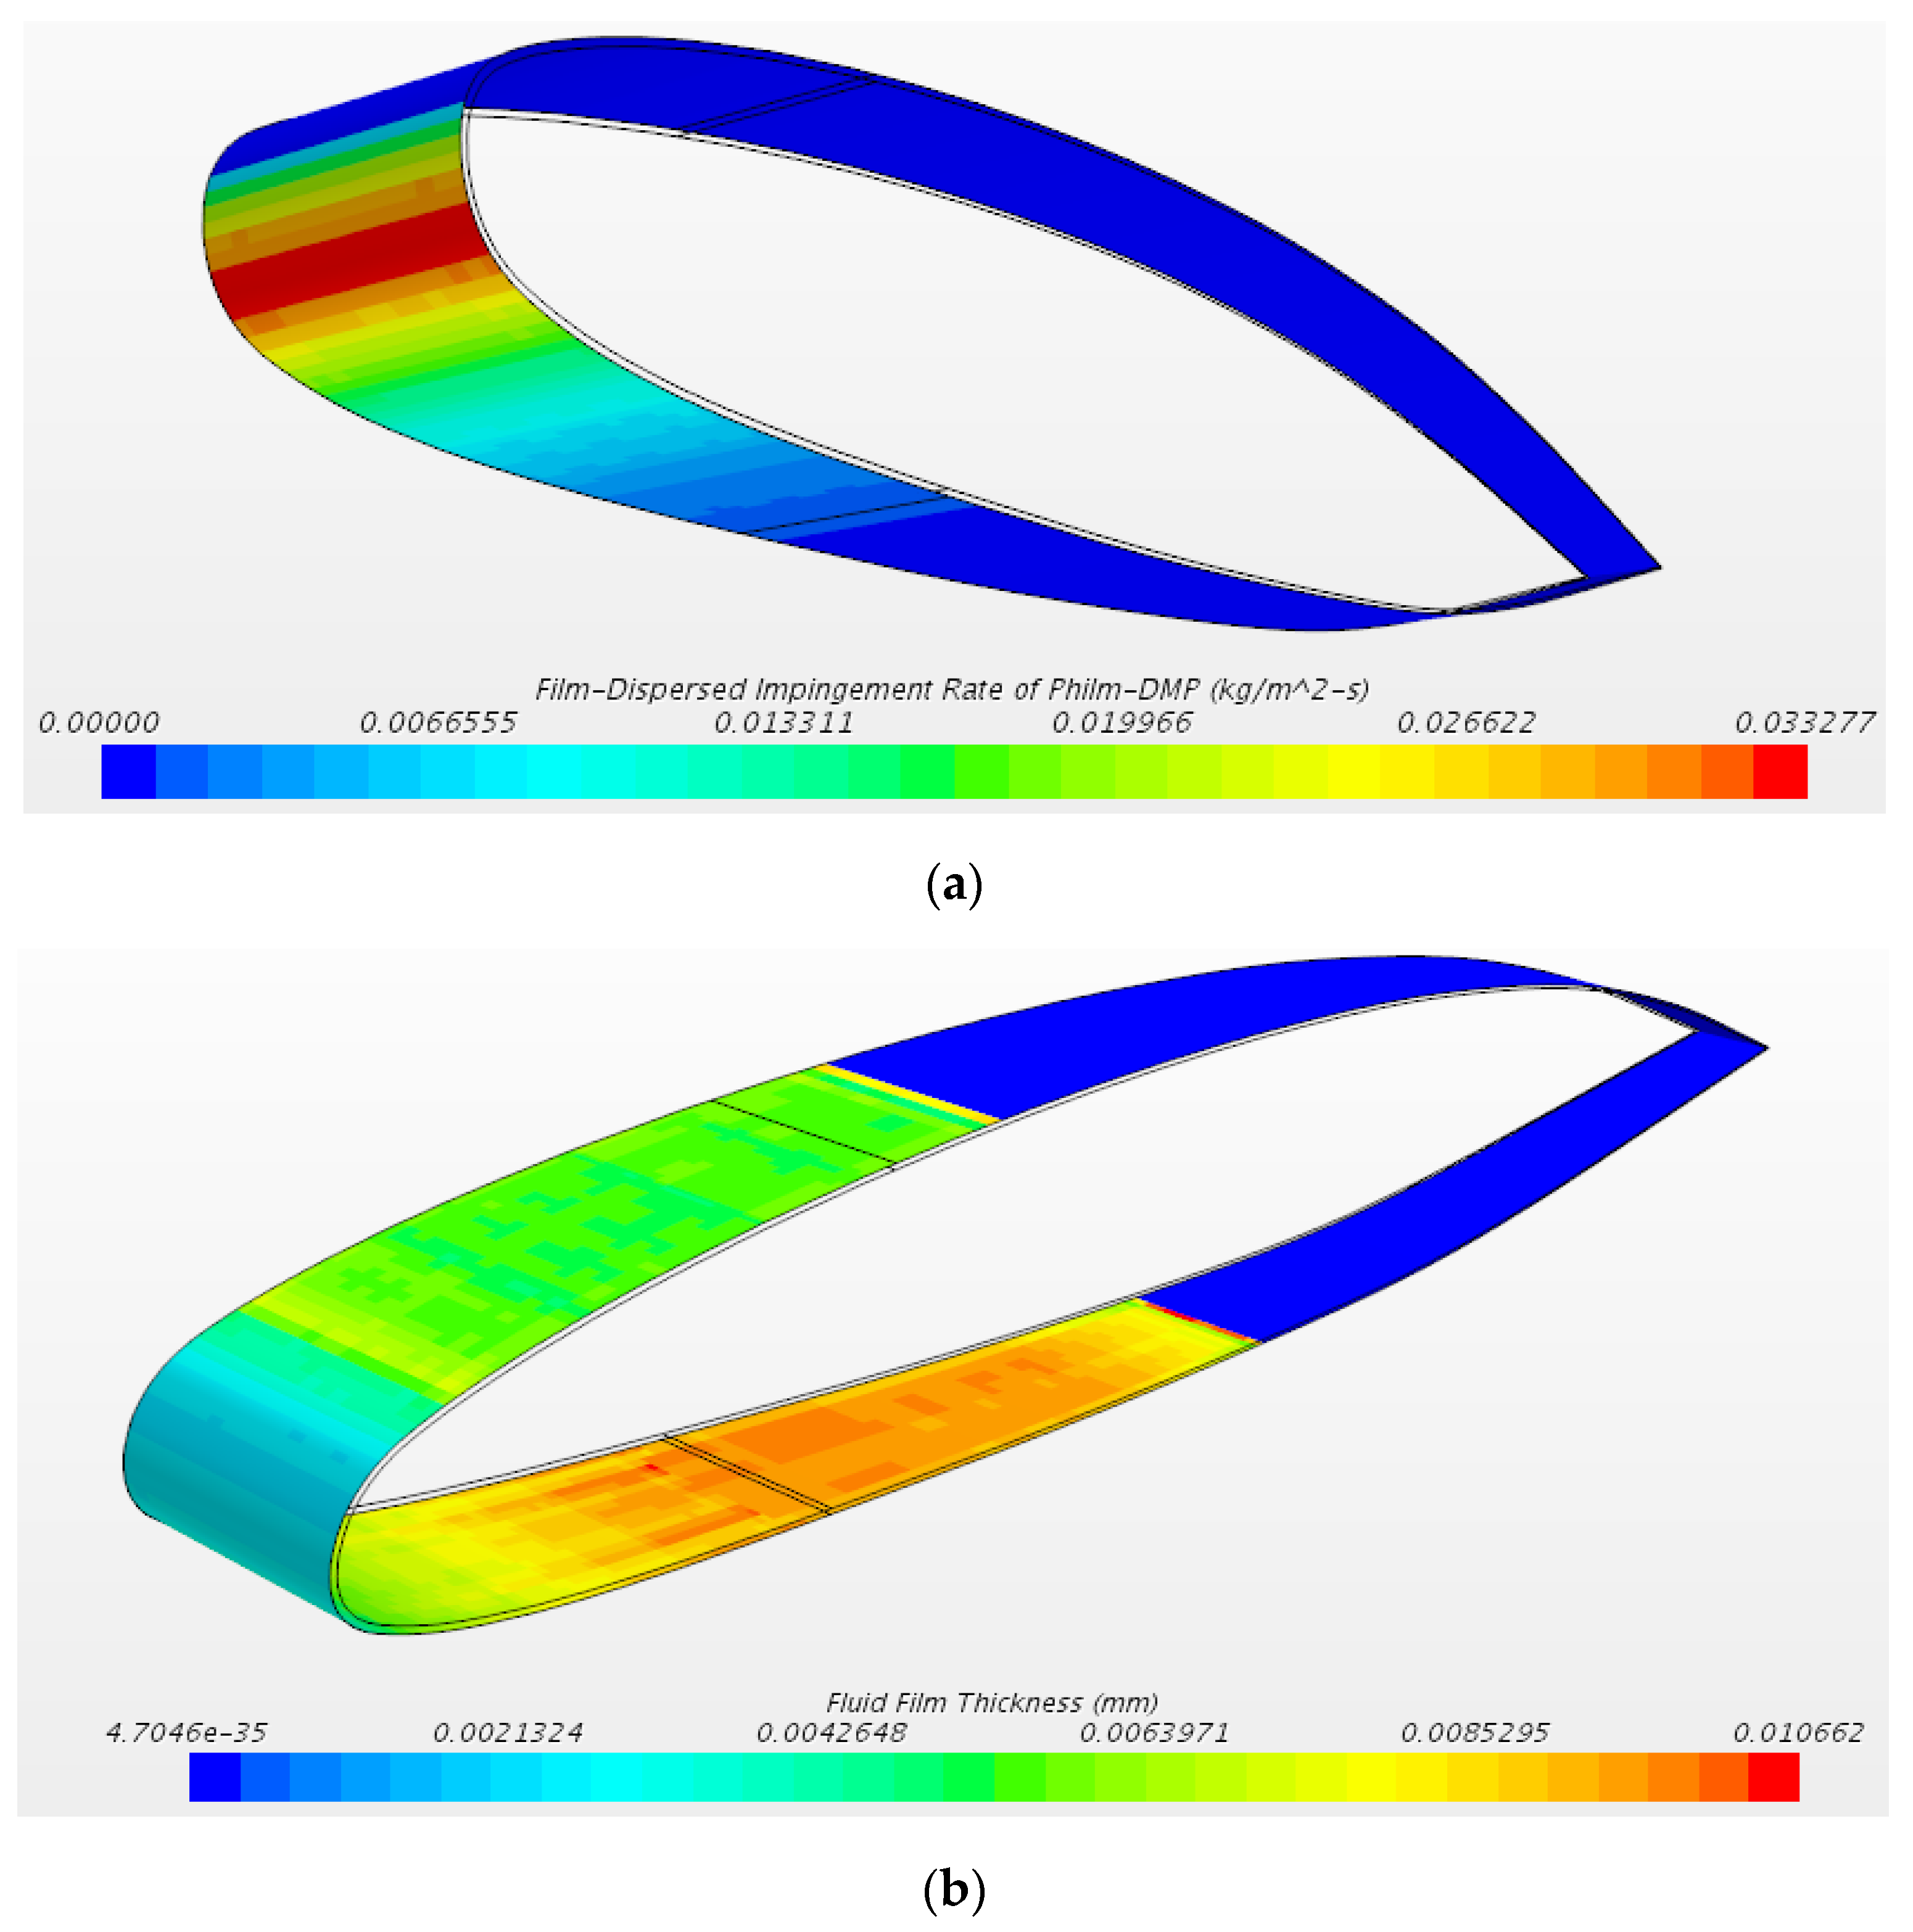
3.2. Anti icing Results
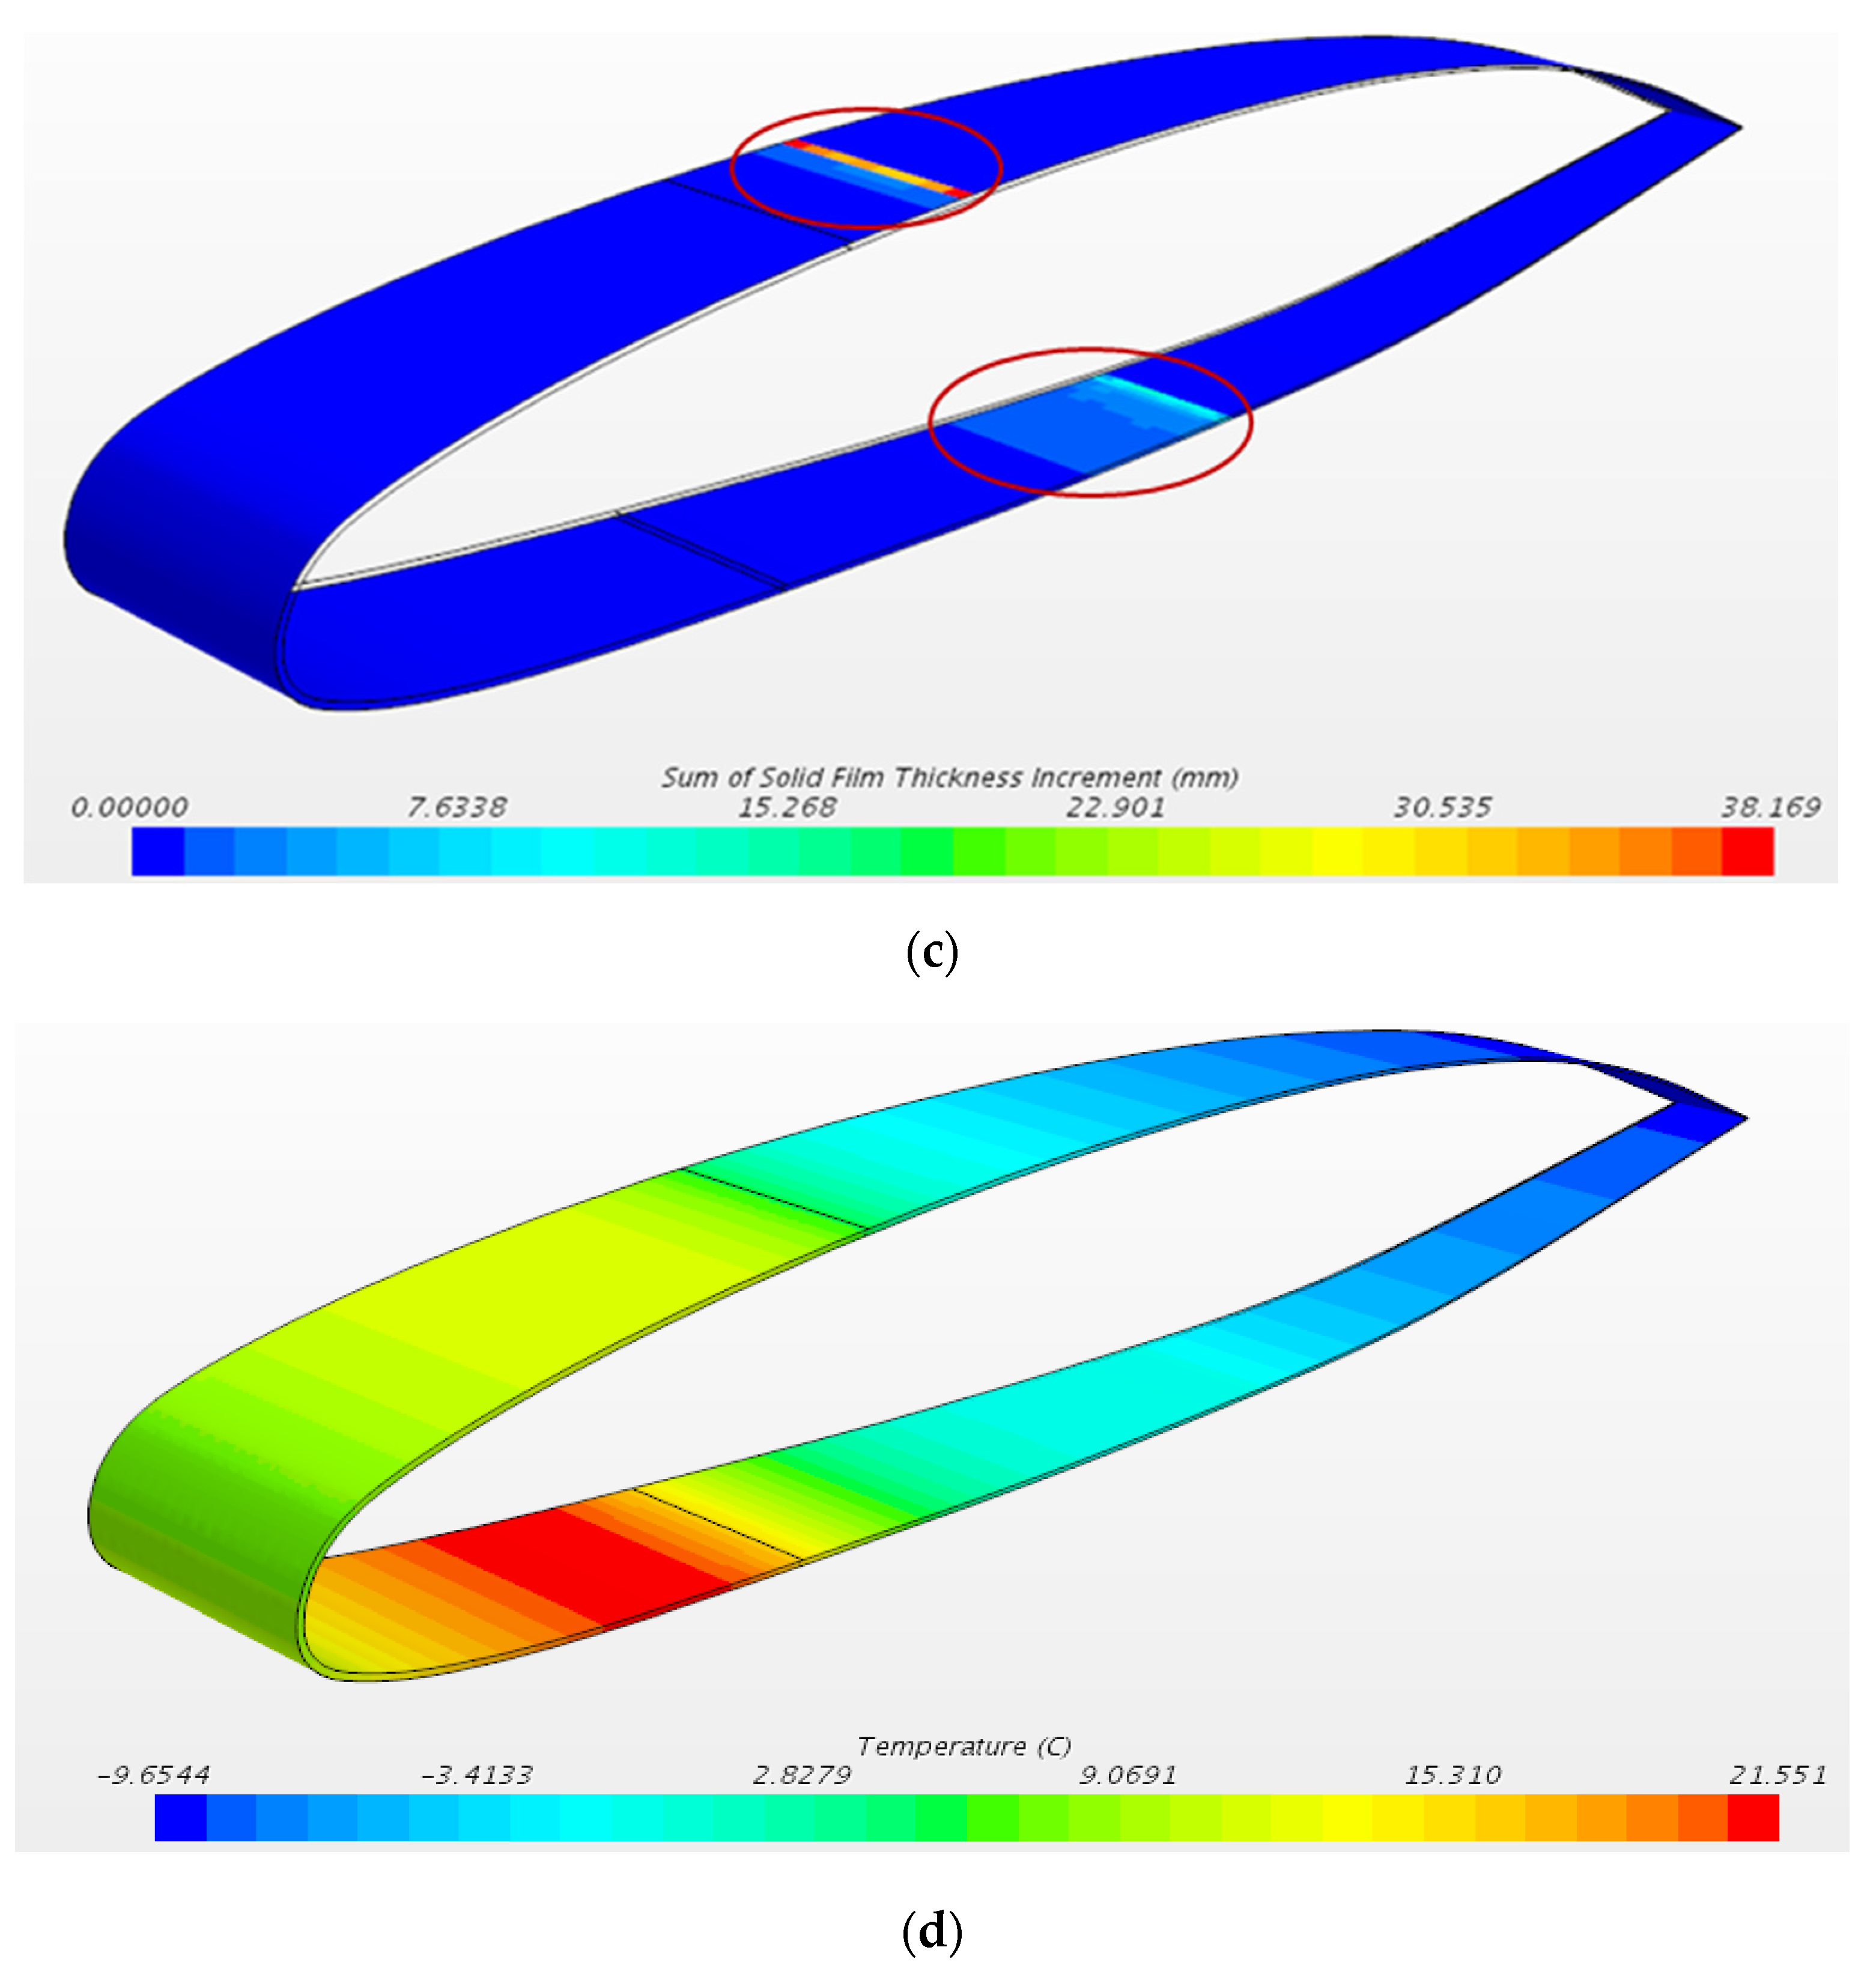
3.3. De Icing Results
| Group | Parameters | Test Case |
|---|---|---|
| Aluminium | Static Temperature[°C] | -4 |
| Heat Flux [W/m2] | 1*104 | |
| Ice /Water | Water Density [kg/m3] | 997 |
| Ice Density [kg/m3] | 917 | |
| Water thermal conductivity [W/m*K] | 0.62 | |
| Ice thermal conductivity [W/m*K] | 2.33 | |
| Initial ice layer thickness[mm] | 5 |
5. Conclusions
6. Patents
Author Contributions
Funding
Conflicts of Interest
References
- NTSB, “Crash During Approach to Landing Empire Airlines Flight 8284,” 2009.
- NTSB, “Aircraft Accident Takeoff Stall in Icing Conditions of USAIR Flight 405,” 1992.
- NTSB, “NTSB Identification: CEN12FA152,” 2012.
- BEA, “Interim Report n ° 3 On the accident on 1st June 2009 to the Airbus A330-203 registered F-GZCP operated by Air France flight AF 447 Rio de Janeiro - Paris Bureau,” 2009.
- Y. Cao, Z. Wu, Y. Su, and Z. Xu, “Aircraft flight characteristics in icing conditions,” Progress in Aerospace Sciences, vol. 74. 2015. [CrossRef]
- S. G. Cober, G. A. Isaac, and J. W. Strapp, “Characterizations of Aircraft Icing Environments that Include Supercooled Large Drops,” J. Appl. Meteorol., vol. 40, no. 11, pp. 1984–2002, 2001. [CrossRef]
- M. B. Bragg, G. M. Gregorek, and J. D. Lee, “EXPERIMENTAL AND ANALYTICAL INVESTIGATIONS INTO AIRFOIL ICING.,” in Congress of the International Council of the Aeronautical Sciences, 1984, vol. 2.
- M. S. Virk, M. C. Homola, and P. J. Nicklasson, “Effect of rime ice accretion on aerodynamic characteristics of wind turbine blade profiles,” Wind Eng., vol. 34, no. 2, 2010. [CrossRef]
- M. B. BRAGG, “RIME ICE ACCRETION AND ITS EFFECT ON AIRFOIL PERFORMANCE,” The Ohio State University PP - United States -- Ohio, United States -- Ohio, 1981. [Online]. Available online: https://www.proquest.com/dissertations-theses/rime-ice-accretion-effect-on-airfoil-performance/docview/303170684/se-2?accountid=28840.
- H. E. Addy Jr., Ice Accretions and Icing Effects for Modern Airfoils, no. April. 2000.
- R. HANSMAN, JR., K. BREUER, D. HAZAN, A. REEHORST, and M. VARGAS, “Close-up analysis of aircraft ice accretion,” 1993. [CrossRef]
- W. Olsen and E. Walker, “EXPERIMENTAL EVIDENCE FOR MODIFYING THE CURRENT PHYSICAL MODEL FOR ICE ACCRETION ON AIRCRAFT SURFACES.,” 1986.
- Z. A. Janjua, B. Turnbull, S. Hibberd, and K. S. Choi, “Mixed ice accretion on aircraft wings,” Phys. Fluids, vol. 30, no. 2, 2018. [CrossRef]
- M. B. Bragg, T. Hutchison, J. Merret, R. Oltman, and D. Pohkariyal, “Effect of Ice Accretion on Aircraft Flight Dynamics University of Illinois at Urbana-Champaign,” 38th AIAA Aerosp. Sci. Meet. Exhib., 2000. [CrossRef]
- Y. Cao, W. Tan, and Z. Wu, “Aircraft icing: An ongoing threat to aviation safety,” Aerospace Science and Technology, vol. 75. 2018. [CrossRef]
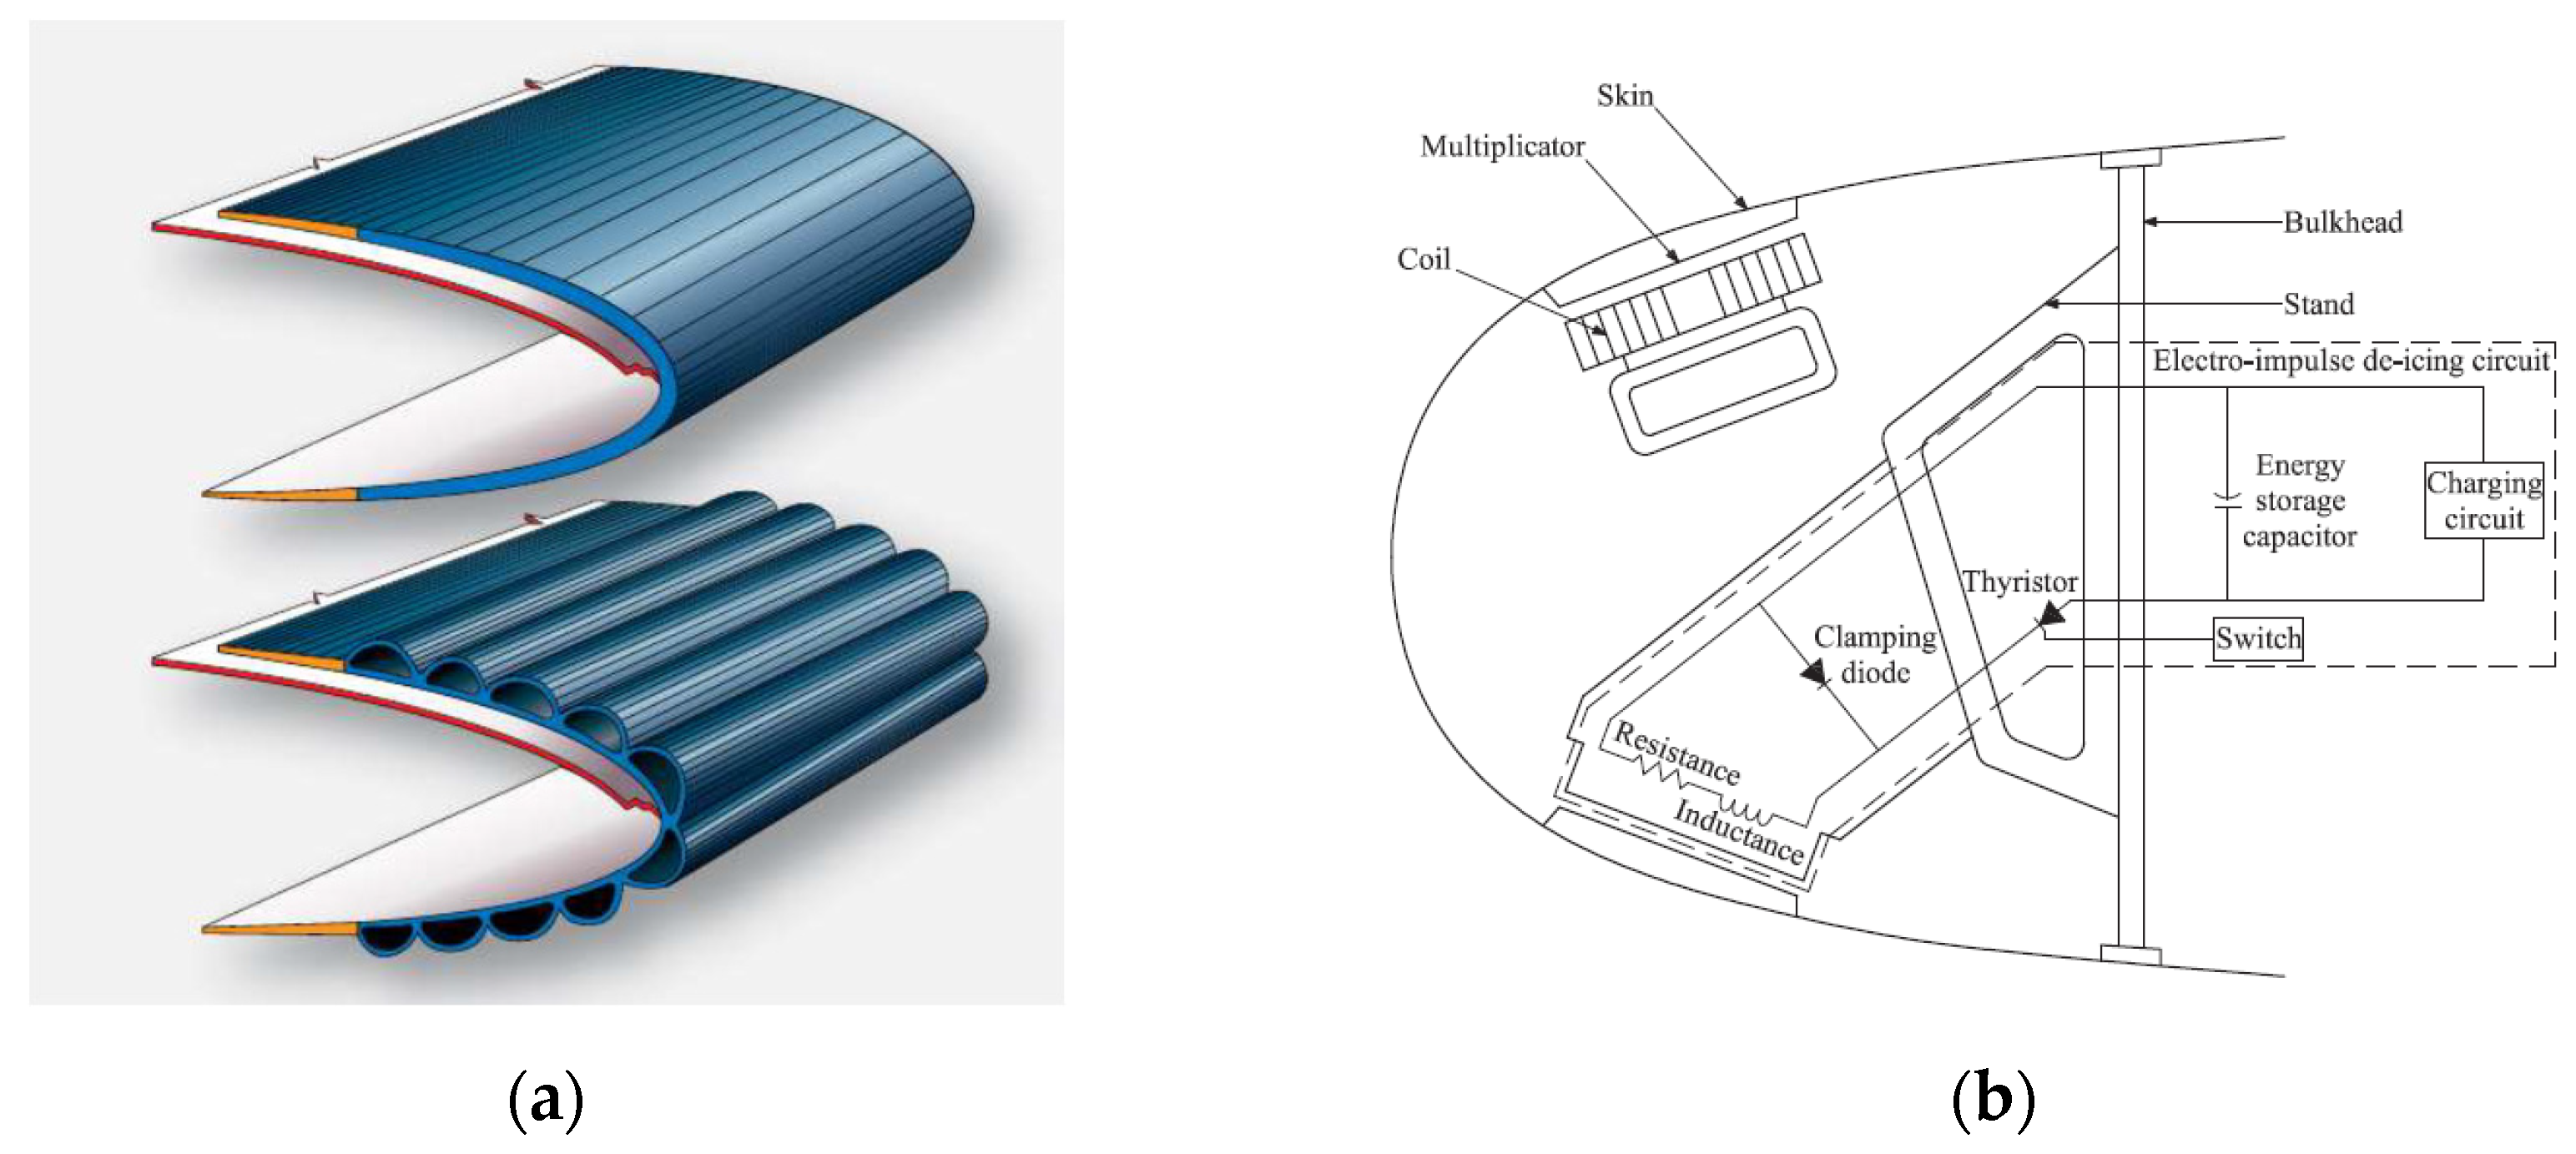
- FAA, “Ice and Rain Protection,” Amt_Airframe_Handbook, no. July, pp. 570–582, 2011.
- Charles W Leguillon, “No Title,” US1942867A, 1932.
- X. Jiang and Y. Wang, “Studies on the electro-impulse de-icing system of aircraft,” Aerospace, vol. 6, no. 6, 2019. [CrossRef]
- L. Hao, Q. Li, W. Pan, and B. Li, “Icing detection and evaluation of the electro-impulse de-icing system based on infrared images processing,” Infrared Phys. Technol., vol. 109, 2020. [CrossRef]
- M. Mohseni and A. Amirfazli, “A novel electro-thermal anti-icing system for fiber-reinforced polymer composite airfoils,” Cold Reg. Sci. Technol., vol. 87, 2013. [CrossRef]
- H. J. Coffman, “HELICOPTER ROTOR ICING PROTECTION METHODS.,” J. Am. Helicopter Soc., vol. 32, no. 2, 1987. [CrossRef]
- C. J. Johnson, “Anti Icing Duct,”. US Patent 2320870, 1943.
- P. Maggiore, Fabio Vitti, C. G. Ferro, and Varetti Sara, “Thermal anti ice system integrated in the structure and method for its fabrication,” 102016000098196, 2016.
- P. M. Carlo Giovanni Ferro, Sara Varetti, Fabio Vitti, “Thermal anti ice system integrated in the structure and method for its fabrication,” 102016000098196, 2016.
- C. Ferro et al., “A Robust Multifunctional Sandwich Panel Design with Trabecular Structures by the Use of Additive Manufacturing Technology for a New De-Icing System,” Technologies, vol. 5, no. 2, p. 35, 2017. [CrossRef]
- G. a. Ruff and B. M. Berkowitz, “Users manual for the improved NASA Lewis ice accretion code LEWICE 1.6,” 1990.
- Y. B. H. B. W. G. Habashi, “Development of a Shallow-Water Icing Model in FENSAP-ICE,” J. Aircr., vol. 37, pp. 640–646, 2000. [CrossRef]
- RAE TR 90054, “ONERA three-dimensional icing model,” AIAA, 1995.
- R. T. E. Iuliano, V. Brandi, G. Mingione, C. de Nicola, “Water impingement prediction on multi-element airfoils by means of Eulerian and Lagrangian approach with viscous and inviscid air flow,” AIAA Aerosp. Sci. Meet. Exhib. [CrossRef]
- R.W. Gent, “TRAJICE2–A combined water droplet trajectory and ice accretion prediction program for aerofoils,” RAE TR 90054, 1990.
- K. Mortensen, “CFD Simulations of an Airfoil With Leading Edge Ice Accretion,” no. August, pp. 1–117, 2008.
- L. Makkonen, “Models for the growth of rime, glaze, icicles and wet snow on structures,” Philos. Trans. R. Soc. A Math. Phys. Eng. Sci., vol. 358, no. 1776, pp. 2913–2939, 2000. [CrossRef]
- Ackley and M.K Templeton, “Computer Modeling of Atmospheric Ice Accretion,” 1979.
- D. Champvillair, “Numerical and experimental validation of an innovative anti ice panel by means of computational fluid dynamics,” 2018.




| Ice Location | Control Method |
|---|---|
| Leading edge of wing | Thermal pneumatic, thermal electric, chemical and pneumatic (deice) |
| Leading edges of vertical and horizontal stabilizers |
Thermal pneumatic, thermal electric and pneumatic (deice) |
| Windshield, windows | Thermal pneumatic, thermal electric and chemical |
| Heater and engine air inlets | Thermal pneumatic and thermal electric |
| Pitot and static air data sensors | Thermal electric |
| Propeller blade leading edge and spinner | Thermal electric and chemical |
| Carburetors | Thermal pneumatic and chemical |
| Lavatory drains and portable water lines | Thermal electric |
| Material Properties | ||
|---|---|---|
| Range temperature | Density | Thermal Conductivity |
| T > 273.15 K (Water) | 917 kg/m3 | 0.620 W/mK |
| T < 273.15 K (Ice) | 997 kg/m3 | 2.330 W/mK |
| Group | Parameters | Simulations Test Cases | ||||
|---|---|---|---|---|---|---|
| A | B | C | D | E | ||
| External Flow | Velocity [m/s] | 129 | 90 | 90 | 90 | 90 |
| Temperature [°C] | -20 | -15 | -18 | -18 | -18 | |
| Dispersed Phase | MVD [µm] | 40 | 20 | 20 | 40 | 40 |
| LWC [g/m3] | 0.41 | 0.54 | 0.53 | 0.53 | 0.53 | |
| Airfoil | AOA | 1.5 | 6.1 | 6.1 | 4 | 6.2 |
| Ice Accretion Time [min] | 1.5 | 6 | 6 | 6 | 6 | |
| Group | Parameters | Test Case |
|---|---|---|
| External Flow | Velocity [m/s] | 90 |
| Temperature [°C] | -14.75 | |
| Dispersed Phase | MVD [µm] | 20 |
| LWC [g/m3] | 0.54 | |
| Airfoil | AOA | 6.1 |
| Ice Accretion Time [min] | 1.5 | |
| Leading Edge Heat Flux [W/m2] | 1*104 | |
Disclaimer/Publisher’s Note: The statements, opinions and data contained in all publications are solely those of the individual author(s) and contributor(s) and not of MDPI and/or the editor(s). MDPI and/or the editor(s) disclaim responsibility for any injury to people or property resulting from any ideas, methods, instructions or products referred to in the content. |
© 2023 by the authors. Licensee MDPI, Basel, Switzerland. This article is an open access article distributed under the terms and conditions of the Creative Commons Attribution (CC BY) license (http://creativecommons.org/licenses/by/4.0/).

