Preprint
Article

An Intuitionistic Fuzzy Rough Set Based Classification for Anomaly Detection

Altmetrics

Downloads

152

Views

39

Comments

0

A peer-reviewed article of this preprint also exists.

This version is not peer-reviewed

Submitted:

27 March 2023

Posted:

28 March 2023

You are already at the latest version

Alerts
Abstract
The challenging issues of Computer Network and Databases are not only the intrusion detection but also the reduction of false positive and increase of detection rate. In any intrusion detection system, anomaly detection mainly focuses on modeling the normal behavior of the users and detecting the deviations from normal behavior which are assumed to be potential intrusions or treat. Several techniques have already been successfully tried for this purpose. However, the normal and suspicious behavior are hard to predict as there is no precise boundary differentiat-ing one from another. Here rough set theory and fuzzy set theory come into the picture. In this article, a hybrid approach based on rough set theory and intuitionistic fuzzy set theory is pro-posed for the detection of anomaly. The proposed approach is a classification approach which takes the advantages of softness properties both rough and fuzzy set theory to deal with uncer-tainty in the dataset. The algorithm classifies the data instances in such a way that they can be expressed using natural language. The experimental results with a real world dataset and a syn-thetic dataset show that the proposed algorithm has normal true positive rates of 91.989% and 96.99% and attack true positive rates of 91.289% and 96.29% respectively
Keywords: 
Subject: Computer Science and Mathematics  -   Software

1. Introduction

Anomaly detection can be termed as the detection of the patterns which deviate from the expected normal behavior [1]. Anomaly detection is essential when such abnormality in the datasets can provide sufficient system information [2]. An anomaly may be malicious activities, instrumentation errors, human errors etc. It is an emerging research area with applications in fields like fraud detection in banking or financial transactions, fault finding in manufacturing, intrusion detection in computer network, etc. With the advancement of computer and networks and their extensive uses, the organizations are becoming vulnerable to the malicious activities. Although the existing defense mechanism can provide protection up to a reasonable extent, the malicious attackers are becoming more sophisticated in intruding across the networks. In case of internal attack, it might be interesting to identify the anomalies.
Intrusion Detection Systems (IDS) are the security tools for preventing the systems or network from the illegitimate action that can jeopardize the integrity, privacy or accessibility. In general, there exist two categories of IDS viz. anomaly detection-based and signature recognition-based schemes. The former used to discover the network’s misuse and computer’s misuse or intrusions by keeping track of the systems and then classifying the activities into normal or anomalous. The consequent system is called anomaly-based intrusion detection system [3,4]. Anomaly-based intrusion detection can be effectively applied as a risk mitigation tool for computer and associated network.
Many anomaly detection techniques are proposed over the previous few decades [5,6,7,8,9,10]. The classification-based technique is one such. The classification [11] is a data processing tool to classify the objects into pre-defined classes which has been applied in several areas like, anomaly detection, fraud identification, pattern recognition, prediction, etc. In [12], the authors proposed a neighborhood rough set-based classification algorithm for the detection of anomaly in mixed attribute dataset. In [13], the authors proposed a decision tree- based anomaly detection in the results of computer assessment to improve the quality of educational management. In [14], the authors presented a Bayesian network-based anomaly detection algorithm. In [15], the authors designed a single deep RBF network for predicting control actions and detecting adversarial attacks in Cyber Physical System. In [16], the authors proposed a rough set attribute reduction approach for anomaly detection. In [17], the authors proposed an intuitionistic fuzzy set approach for anomaly detection in network traffic.
The problem similar to classification approach is also addressed using clustering approach [18,19,20,21,22]. In [23], the authored proposed a complex method for detecting anomaly from real-time data using recurrence and fractal analysis. In [24], the authors conducted a comparative analysis of five time-series anomaly detection models. In [25], an ensemble learning model is applied to analyze and forecast anomaly of the enormous system logs. In [26], the authors suggested a strategy for anomaly detection that permits the use of state of art feature selection techniques to idea representation meta-features. A novel framework focusing on real-time anomaly detection based on data technologies is proposed in [27], which uses streaming sliding window factor corset clustering algorithm. In [28], the authors proposed a mixed clustering algorithm for anomaly detection of real time data.
Most of the aforesaid methods addressed only accuracy of the anomaly detection and a few addressed the False Positive Rates of the methods. Since the increase in the False Positive Rate decreases the detection rates and so the efficacy of any classifier, it is required to minimize the False Positive Rates. Again, the normal and anomalous behavior of the system are difficult to predict as there is no precise boundary differentiating one from another. In this case, either fuzzy set theory or rough set theory or the combination of both can effectively be utilized.
L. A. Zadeh [29], introduced fuzziness in the realm of Mathematics by formally defining fuzzy set as a generalization of ordinary set. Atanassov [30] defined intuitionistic fuzzy sets as a generalization of fuzzy sets in terms of membership and non-membership functions. In [31], the authors proposed the formula for correlation coefficient of intuitionistic fuzzy sets whose value lies between 0 and 1. Fuzzy relation, α-cut of a fuzzy relation and fuzzy equivalence relations were introduced in [32,33].
Pawlak [34] introduced, the rough set theory, to address uncertainty and vagueness that exist in any datasets. In [35], the rough set-based classification is applied nicely to discrete datasets which uses the properties of equivalence relation. In [36], the authors proposed an efficient algorithm based on fuzzy neighborhood rough set for the detection anomaly in large datasets. In [37], the authors put forwarded an NN classification algorithm which uses the fuzzy-rough lower and upper approximations to classify test objects, or to predict their decision value.
Thivagar et al [38], proposed the definition of nano topological space with respect to a subset X of universe U in terms lower and upper approximation of X. In [39], the authors not only introduced a new structure of nano topology but also applied it in medical diagnosis. In [40], the authors introduced three new topologies namely the covering-based rough fuzzy nano topology, the covering-based rough intuitionistic fuzzy nano topology, and the covering-based rough neutrosophic nano topology. Most of classification-based anomaly detection algorithm developed till today used different well known measures to differentiate between classes and very few works were reported using the statistical measures like correlation coefficient. Secondly, most of fuzzy rough approaches considers the corresponding fuzziness in Zadeh’s sense [29]. However, if we extend the approach to the intuitionistic fuzzy set, then the detected anomalies can provide more information about the system.
In this article, a hybrid approach consisting of intuitionistic fuzzy set and rough set has used in the classification algorithm for the anomaly detection of network datasets. The objective of the paper is as follows:
  • First of all, an α-relation (for a pre-assigned value of α) and an equivalence relation [41,42,43] using the correlation coefficient of intuitionistic fuzzy sets are generated.
  • Secondly, with the help of α-relation on conditional attributes and equivalence relation on decision attributes, the intuitionistic fuzzy nano lower approximation space, and intuitionistic fuzzy nano upper approximation space along with boundary regions are found.
  • Thirdly, the certain and possible fuzzy rules are generated from two approximations.
Furthermore, the proposed algorithm (IFRSCAD) is implemented using Matlab with two well-known datasets KDDCUP’99 Network anomaly detection dataset [44] and Kinsune Network attack dataset [45]. The classification results are compared with other classification-based methods namely Cuijuan et al [16], Wang et al [17], Deep-RBF Network [15], Bayes Network [14] and Decision Tree [13]. It is found that the proposed algorithm is comparatively efficient than others in terms of parameters like True Positive Rates and False Positive Rates.
The article is prescribed as follows. The current developments in this field are described in the Section 2. The problem definition is given in Section 3. The algorithm and the flowchart explaining the system is given in Section 4. The complexity analysis is given in Section 5. The experimental analysis and results are given in Section 6, and finally, the Conclusions, Limitations and lines for future work are given in Section 7.

2. Related Works

Anomaly detection is termed as finding of such patterns which deviate from previously observed one [1]. It can be useful to get sufficient system information [2]. Anomaly Detection is one of the vital area of modern research which is getting attention to the researchers. A couple anomaly detection system has already been developed till today [3,4]. Classification based anomaly detections system is one of the many. Using classification-based labeling technique Abdullah et al [5], presented a method of anomaly detection in cellular network. In [6], the authors used negative selection algorithm for detecting anomalies in multi-dimensional data. Taha et al [7] reviewed the different anomaly detection methods for categorical data.
Mazarbhuiya et al [12] proposed a neighborhood rough set-based classification algorithm for the detection of anomaly in mixed attribute dataset. For assessment of computer and to improve the quality of educational management a decision tree-based anomaly detection was proposed [13]. A Bayesian network- based algorithm for anomaly detection and offering correction hints was presented in [14]. In [15], the authors designed a single deep RBF network for predicting control actions and detecting adversarial attacks in Cyber Physical System. In [16], the authors proposed a rough set attribute reduction approach for anomaly detection. Wang et al [17], designed an efficient intuitionistic fuzzy set-based approach for anomaly detection in network traffic. Maroune et al [36] proposed anomaly detection-based method on highly scalable approach to compute the nearest neighbor of object using rough set theory.
Anomaly detection using clustering approach was also studied by many researchers. In [18], the authors proposed an agglomerative hierarchical algorithm for anomaly detection in network dataset. An anomaly detection method based on fuzzy c-means clustering algorithm was proposed in [19]. In [20], a mixed algorithm consisting of features of both k-means and hierarchical algorithm was presented. Retting et al [21], proposed an algorithm of online anomaly detection in big data streams. Similar works were reported in [22]. Using fractal and recurrence analysis a real-time anomaly detection algorithm was presented in [23].
Kim et al [24], conducted a comparative analysis of five time-series anomaly detection models. In [25], the authors applied an ensemble learning model to analyze and forecast anomaly of the enormous system logs. Halstead et al [26], devised a strategy for anomaly detection, which permits the use of latest feature selection techniques to idea representation meta-features. Habeeb et al [27], presented a new framework focused on real-time anomaly detection based on data technologies, which uses streaming sliding window factor corset clustering algorithm. Mazarbhuiya et al [28], proposed a mixed clustering algorithm for anomaly detection of real time data.
Fuzzy set was formally introduced by Zadeh [29] to deal uncertainty and vagueness occurring in any dataset. Generalizing the concept of fuzzy set Atanassov [30] defined intuitionistic fuzzy sets in terms of membership and non-membership functions. Gerstenkorn et al [31] proposed the definition correlation coefficient of intuitionistic fuzzy sets. In [32], the authors introduced the details of fuzzy similarity relations. In [33], the concepts of α-cut of a fuzzy relation and fuzzy equivalence relations were introduced in detail.
Rough set theory was introduced by Pawlak [34] to address uncertainty and vagueness that exist in any datasets. Nowicki et al [35], proposed a rough set-based classification method on discrete datasets which uses the properties of equivalence relation. Yuan et al [37], put forwarded an NN classification algorithm using the fuzzy-rough lower and upper approximations to classify test objects, or to predict their decision value.
Thivagar et al [38,39], not only proposed the structure of nano topological space in terms lower and upper approximation but also applied it in medical diagnosis. Shumrani et al [40], first introduced the concept of the covering-based rough fuzzy nano topology, the covering-based rough intuitionistic fuzzy nano topology, and the covering-based rough neutrosophic nano topology. In [41], the authors introduced the concept of fuzzy-rough set theory. Maji et al [42], applied fuzzy-roughs for relevant Genes selection from microarray data. Chimphlee et al [34], proposed an anomaly-based IDS which uses Fuzzy-Rough clustering method. In [28], the authors conducted the experimental studies with two well-known datasets KDD Cup’99 [44] network anomaly detection dataset and Kitsune [45] Network Attack dataset.

3. Problem Definitions

In below, we present some important terms and definitions used in the paper.
Definition 1.
Fuzzy set
Let X={x1, x2,… xn} be the universe of discourse. A fuzzy set [29], A on X is characterized by
A = { ( x i ,   μ A x i ) ;   x i X ,   i = 1 ,   2 , .. n }
where μ A : X 0 ,   1 , the membership function, gives the grade of membership of each element x i X in A.
Definition 2.
Intuitionistic fuzzy set
Atanassov [30] proposed the definition of an intuitionistic fuzzy set A on X as
A = { ( x i ; μ A x i ,   ν A x i ) ;   x i X ,   i = 1 ,   2 , n }
where μ A : X 0 ,   1  and  v A : X 0 ,   1  are the membership function and non-membership function of the fuzzy set A respectively satisfying the condition 0 ≤ μ A x i    +  ν A x i ≤ 1 for every  x i X
Definition 3.
Correlation of intuitionistic fuzzy sets
Let A={( x i ; μ A x i ,   ν A x i ) ;   x i X ,   i = 1 ,   2 , n } and B={( x i ; μ B x i ,   ν B x i ) ;   x i X ,   i = 1 ,   2 , n } are two intuitionistic fuzzy sets on X={x1, x2,… xn}, Gerstenkorn et al [31] proposed the formula correlation coefficient as
ρ A B = i = 1 n μ A x i μ B x i + ν A x i ν B x i i = 1 n ( μ A x i ) 2 + ( ν A x i ) 2 i = 1 n [ ( μ B x i ) 2 + ν B x i ) 2
Furthermore, 0≤   ρ A B ≤1
Definition 4.
Fuzzy relation [32,33]
For any data instances xi; i=1, 2,…m in U, we define a fuzzy relation R on U as R={(xi, xj); ρxixj; xi, xjU}. Since 0≤ρ≤1, R will be an equivalence relation.
Definition 5. 
α c u t Rα [32,33]
An α c u t Rα of a fuzzy relation R on U is a crisp set containing the elements with membership values greater than α that is
R α = { ( x ,   y ) ;   μ R x ,   y α ,   α ( 0 , 1 ] ,   x , y U }
Definition 6. 
α relation [32,33]
For any data instances xi; i=1, 2,…m in U and 0< α ≤1, the α cut Rα of R, generates α -relation (U, ρ ) as
α ( x i ) = { x ;   ρ x i x α } .
Proposition 
[32,33]
If a fuzzy relation R is an equivalence relation in max-min sense, then for α (0, 1], Rα possesses an equivalence relation. Therefore, any α relation represented by an α –cut Rα will have an equivalence relation. The ordered pair (U, Rα) is an approximation space.
Definition 7.
Fuzzy-Rough Set
Fuzzy-Rough set theory is a derivation of rough set theory in which the concept of crisp equivalence class is extended by incorporating fuzzy set theory to form fuzzy equivalence classes. Let the conditional and decision attributes of an information systems are both intuitionistic fuzzy sets and let us define an α relation as aforesaid manner. Since, a fuzzy equivalence relation generates a fuzzy partition of the universe of discourse, therefore α relation will generate a series of fuzzy equivalence classes [41,42,43], known as fuzzy knowledge granules. Let (U, R) represents a fuzzy approximation space and X be a fuzzy subject of U intuitionistic sense, the intuitionistic fuzzy nano lower approximation, the intuitionistic fuzzy nano upper approximation, and the intuitionistic nano boundary approximation of X on (U, R) are denoted by I ( ¯ X), I ( ¯ X ) and B I X ) respectively are expressed as follows [40]
I _ X = x ,   μ R _ X x ,   ν R _ X x , y x R , x U
I ¯ X = x ,   μ R ¯ X x ,   ν R ¯ X x , y x R , x U
B I X = I ¯ X I _ X
where
μ R _ X x = i n f y x R y , ν R _ X x = s u p y x R y , μ R ¯ X x = s u p y x R y  and  ν R ¯ X x = i n f y x R y

4. Proposed Algorithm

For generating classification rules, we choose a suitable value of the correlation coefficient (α), to define the α-relation. The correlation coefficient used to define the relation is given in section-3. The procedure of finding classification rules is given as follows. We have a collection of m-data instances each of which is described by n-intuitionistic fuzzy attributes and is represented as an intuitionistic fuzzy matrix, where each entry is <xij, yij>, xij∈[0, 1], yij∈[0, 1] [46] and 0≤ xij+ yij ≤1, i=1,2,..m and j=1,2,..n. Usually, the dataset can be expressed as an information system (U, CD), where C and D are conditional and decision attributes respectively are expressed as intuitionistic fuzzy sets. The method is described below.
The first step of the proposed method is to compute α-relation of the conditional attribute using correlation coefficient, and compute the equivalence classes of decision attributes using same formula of correlation coefficient. The value of α is taken to be 0.4. Then, “infimum” operator is applied on fuzzy knowledge granules of conditional attributes. Then, intuitionistic fuzzy nano lower approximation and intuitionistic fuzzy nano upper approximation are constructed using decision class. Then, the boundary regions are found. With the help of two approximations, two sets of fuzzy rules namely the certain fuzzy rules and possible fuzzy rules, can be generated. The proposed method is also explained with the help of flowchart given in Figure 1 below.
The pseudocode of the method is given as follows.
Algorithm.
Input (U, C∪D), α // C, the conditional fuzzy attributes, D, the decision fuzzy attributes
Step1. Create α-relation on C using correlation coefficient.
Step2. Create the fuzzy equivalence relation for D.
Step3. Apply ‘infimum’ operator on the fuzzy granules of records of U brought up by C.
Step4. Construct separately nano lower approximation space ( I _ X ) Nano upper approximation space I ¯ X for D and the result of fuzzy granules after applying ‘infimum’ to C.
Step5. Find boundary regions.
Step6. Generate certain fuzzy rules from Nano lower approximation space, possible fuzzy rules from Nano upper approximation, and boundary rules from boundary regions.
Obviously, each rules generated by the system is fuzzy in the intuitionistic sense. That is attributes contributing in any rule will be in intuitionistic fuzzy set

5. Complexity Analysis

To generate α-relation, the algorithm needs to choose all possible pair of data instances from U, compute their correlation coefficients then compare these with α. These done in (½ |U|C2 . |C| + ½ |U|C2), where (½ |U|C2) computation is required for choosing pair of data instances, |C| is required for computation correlation coefficients and (½ |U|C2) number of comparisons with α is required. Thus, the computational cost of step1 is O(m2 . n), where |U|=m, and |C|=n. For generating equivalence relation for D, the algorithm needs to take all possible pair of data instance and compute the correlations and this can be done in (½ |U|C2 . |C|). The computational cost for step 2 is O(m2.n). Thus the computational cost of step1 and step2 is O(m2 . n + m2 . n)= O(m2 . n). The computational cost for step 3 is O(m). For generating the nano topology, the lower approximation, upper approximation and boundary regions of the set has to be generated, which takes computational time O(|X|.|U|). So the total computational cost of step1 to step5 is O(m2. n + m + |X|.|U|) = O(m2.n) which is the worst-case complexity. The step6, takes constant time. Therefore, the overall complexity of proposed algorithm is O(m2. n) which shows that the proposed algorithm is quite efficient.

6. Experimental Analysis and Results.

A.
Datasets
KDD Cup’99 [44] network anomaly detection dataset: It is a synthetic dataset that simulate intrusion in the military network environment. The data are collected for 9 weeks, and its training data consists of 5000 thousand network connection. The attributes can be divided into the classes viz.: normal (unauthorized access to local super user privileges, unauthorized access from a remote machine), dos (denial of service), probe (surveillance and other probing).
Kitsune [45] Network Attack dataset: It is a collection of nine network attack datasets that were obtained from either an IP-based commercial surveillance system or a network of IoT devices, each of which contained millions of network packets and various cyberattacks.
The above datasets were obtained via the UCI machine repository. A concised view of the dataset explaining their characteristics, the attribute’s characteristics, the number of attributes, and the number of data instances is presented in Table 1.
B.
Experimental Results and Analysis
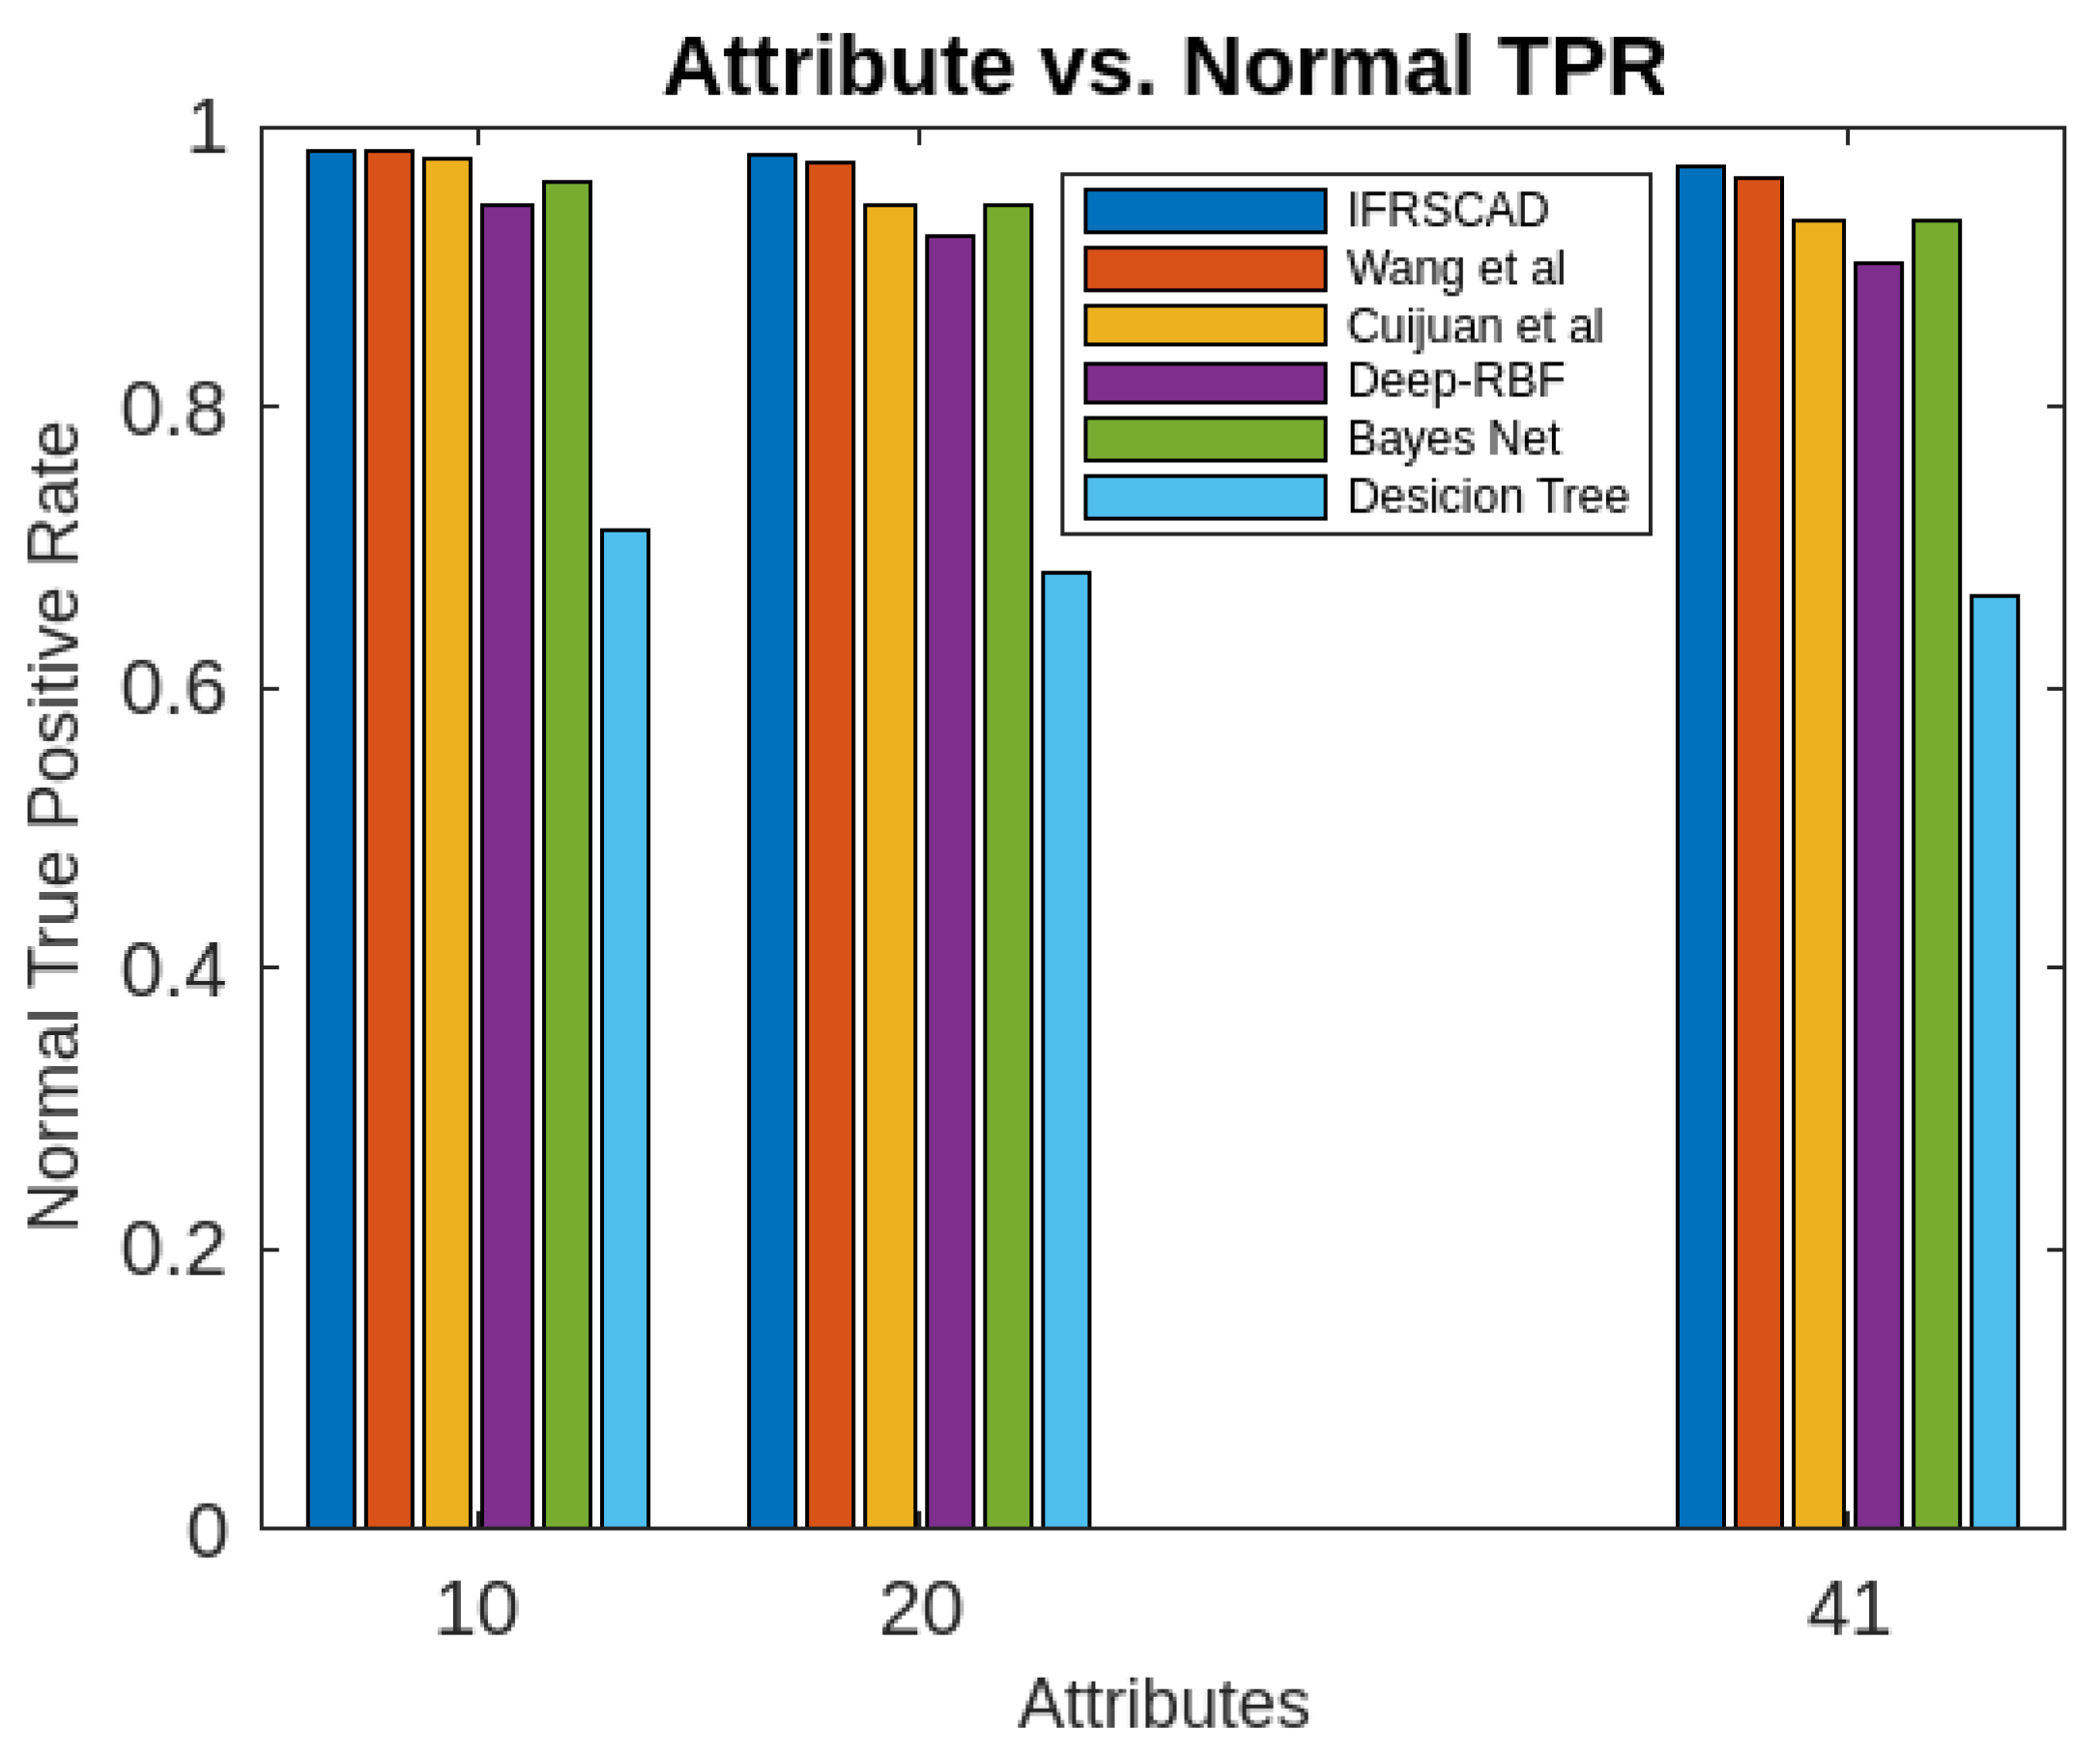
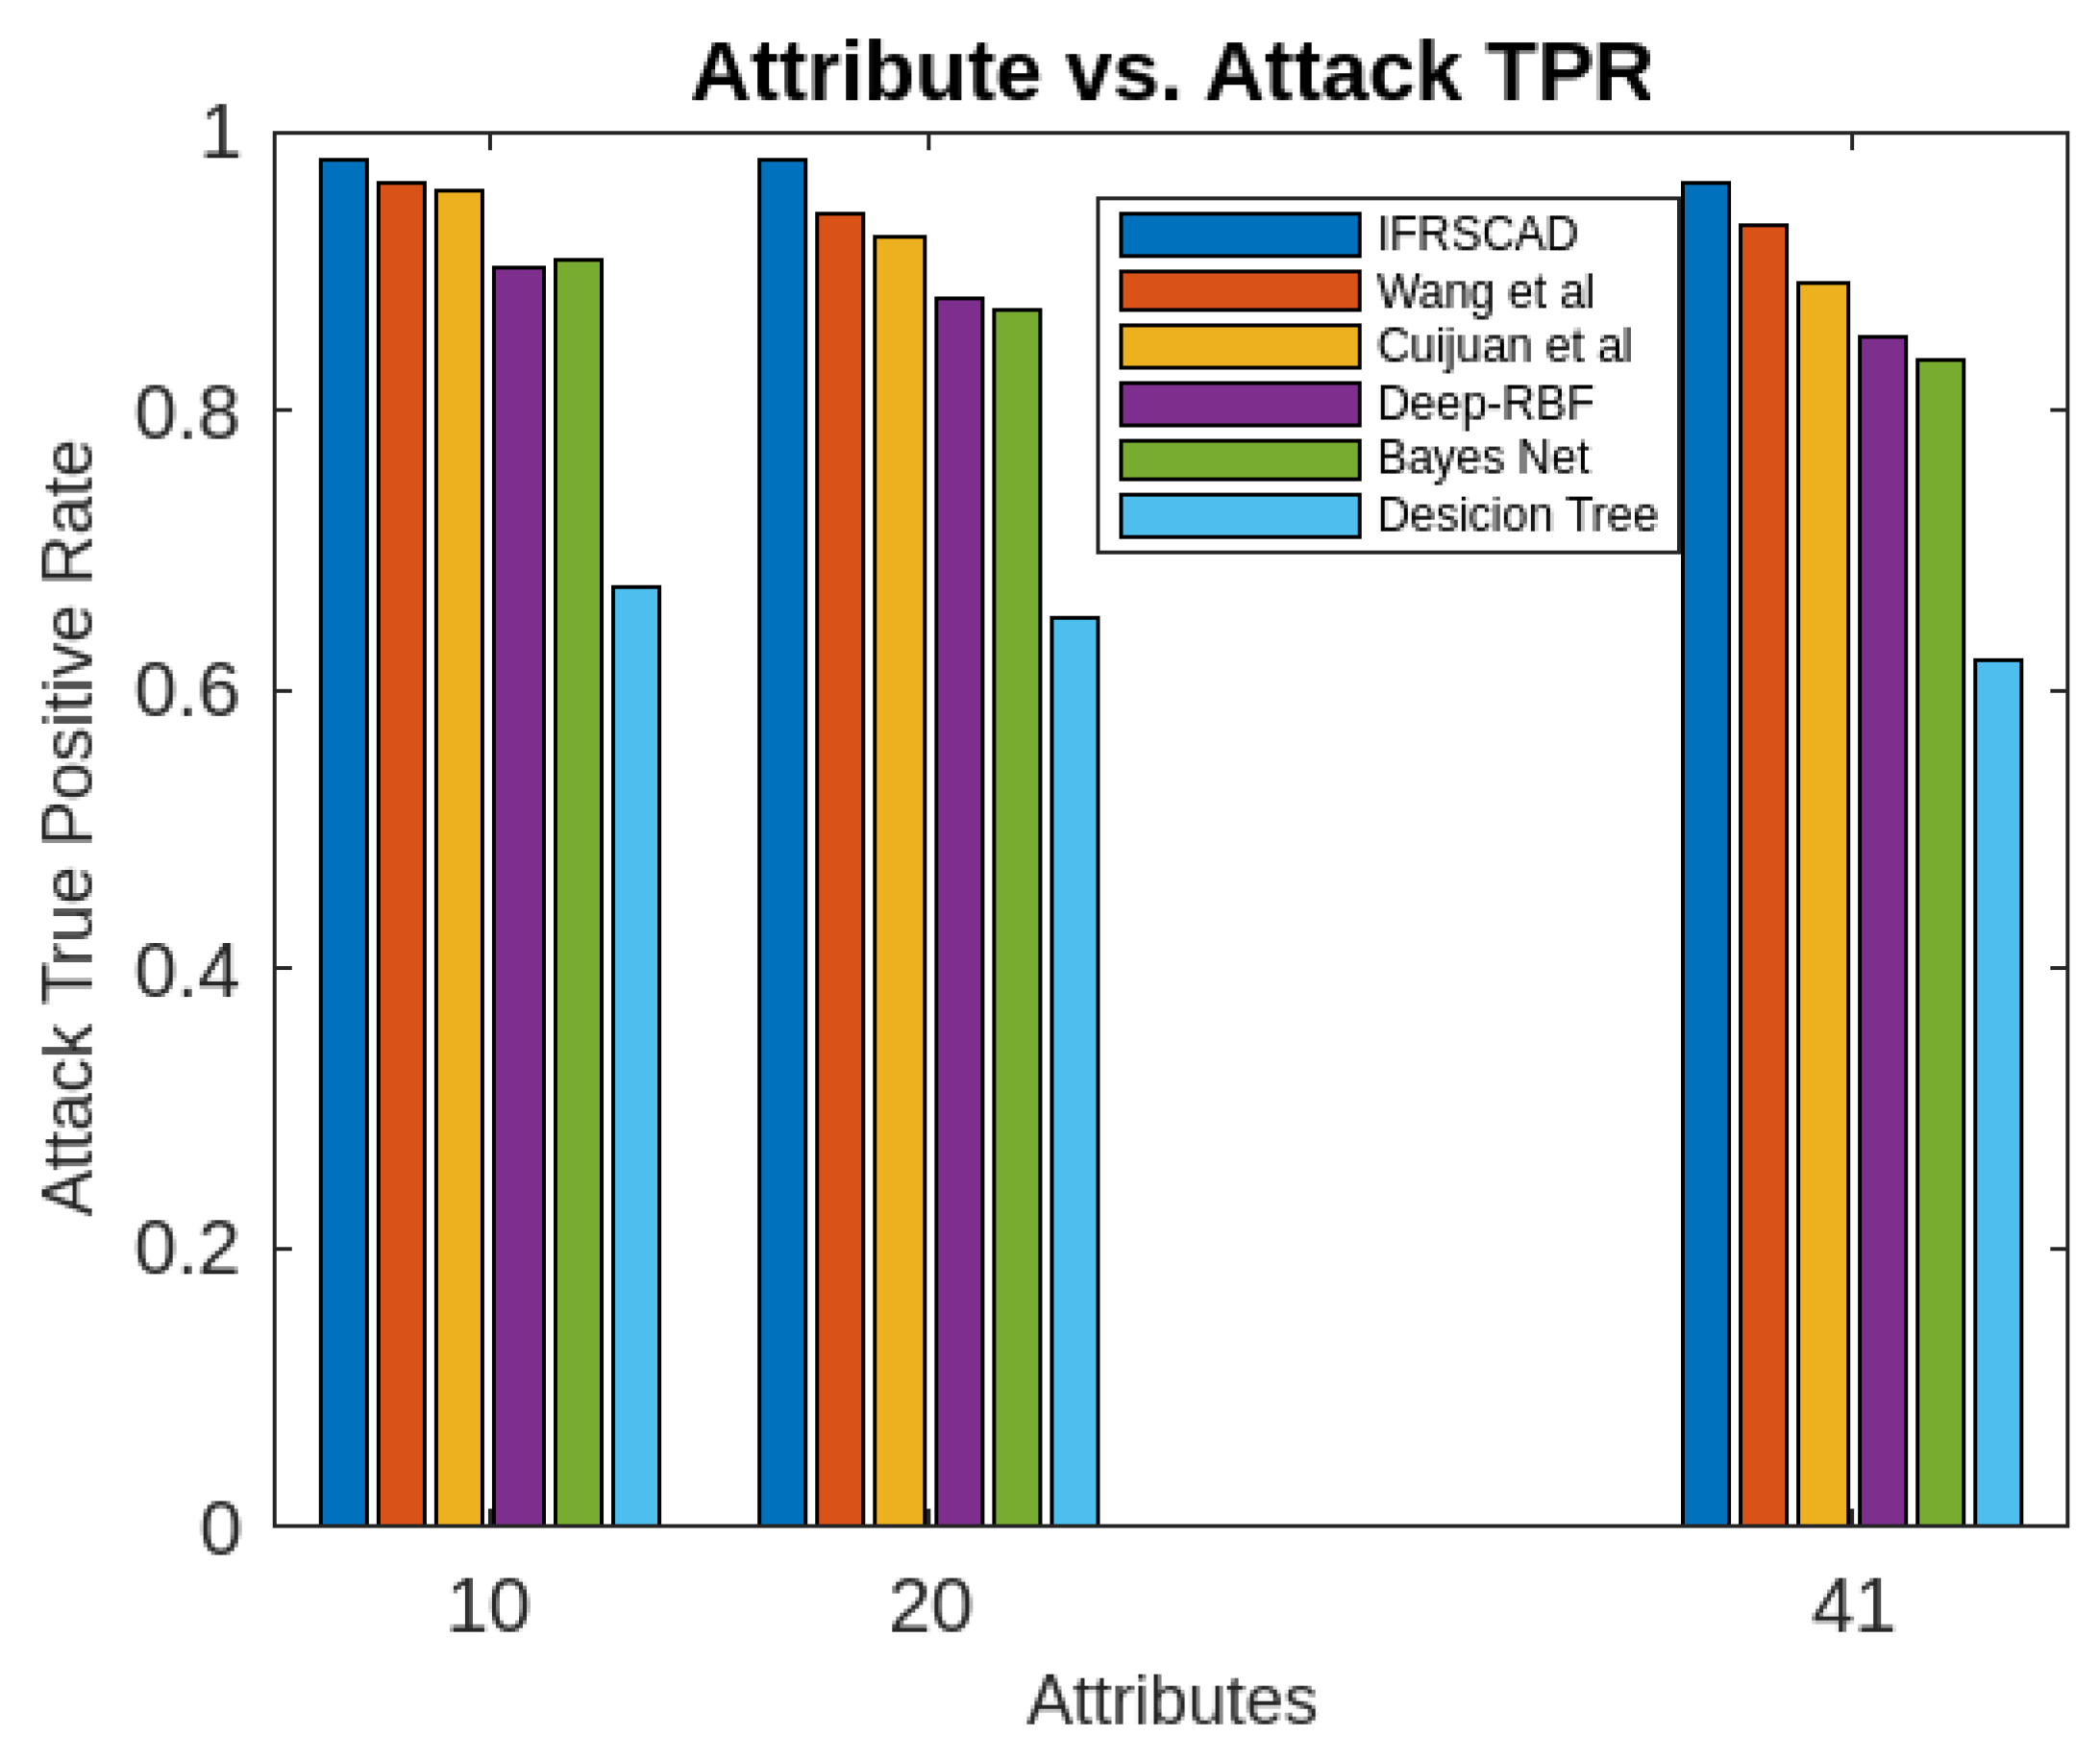
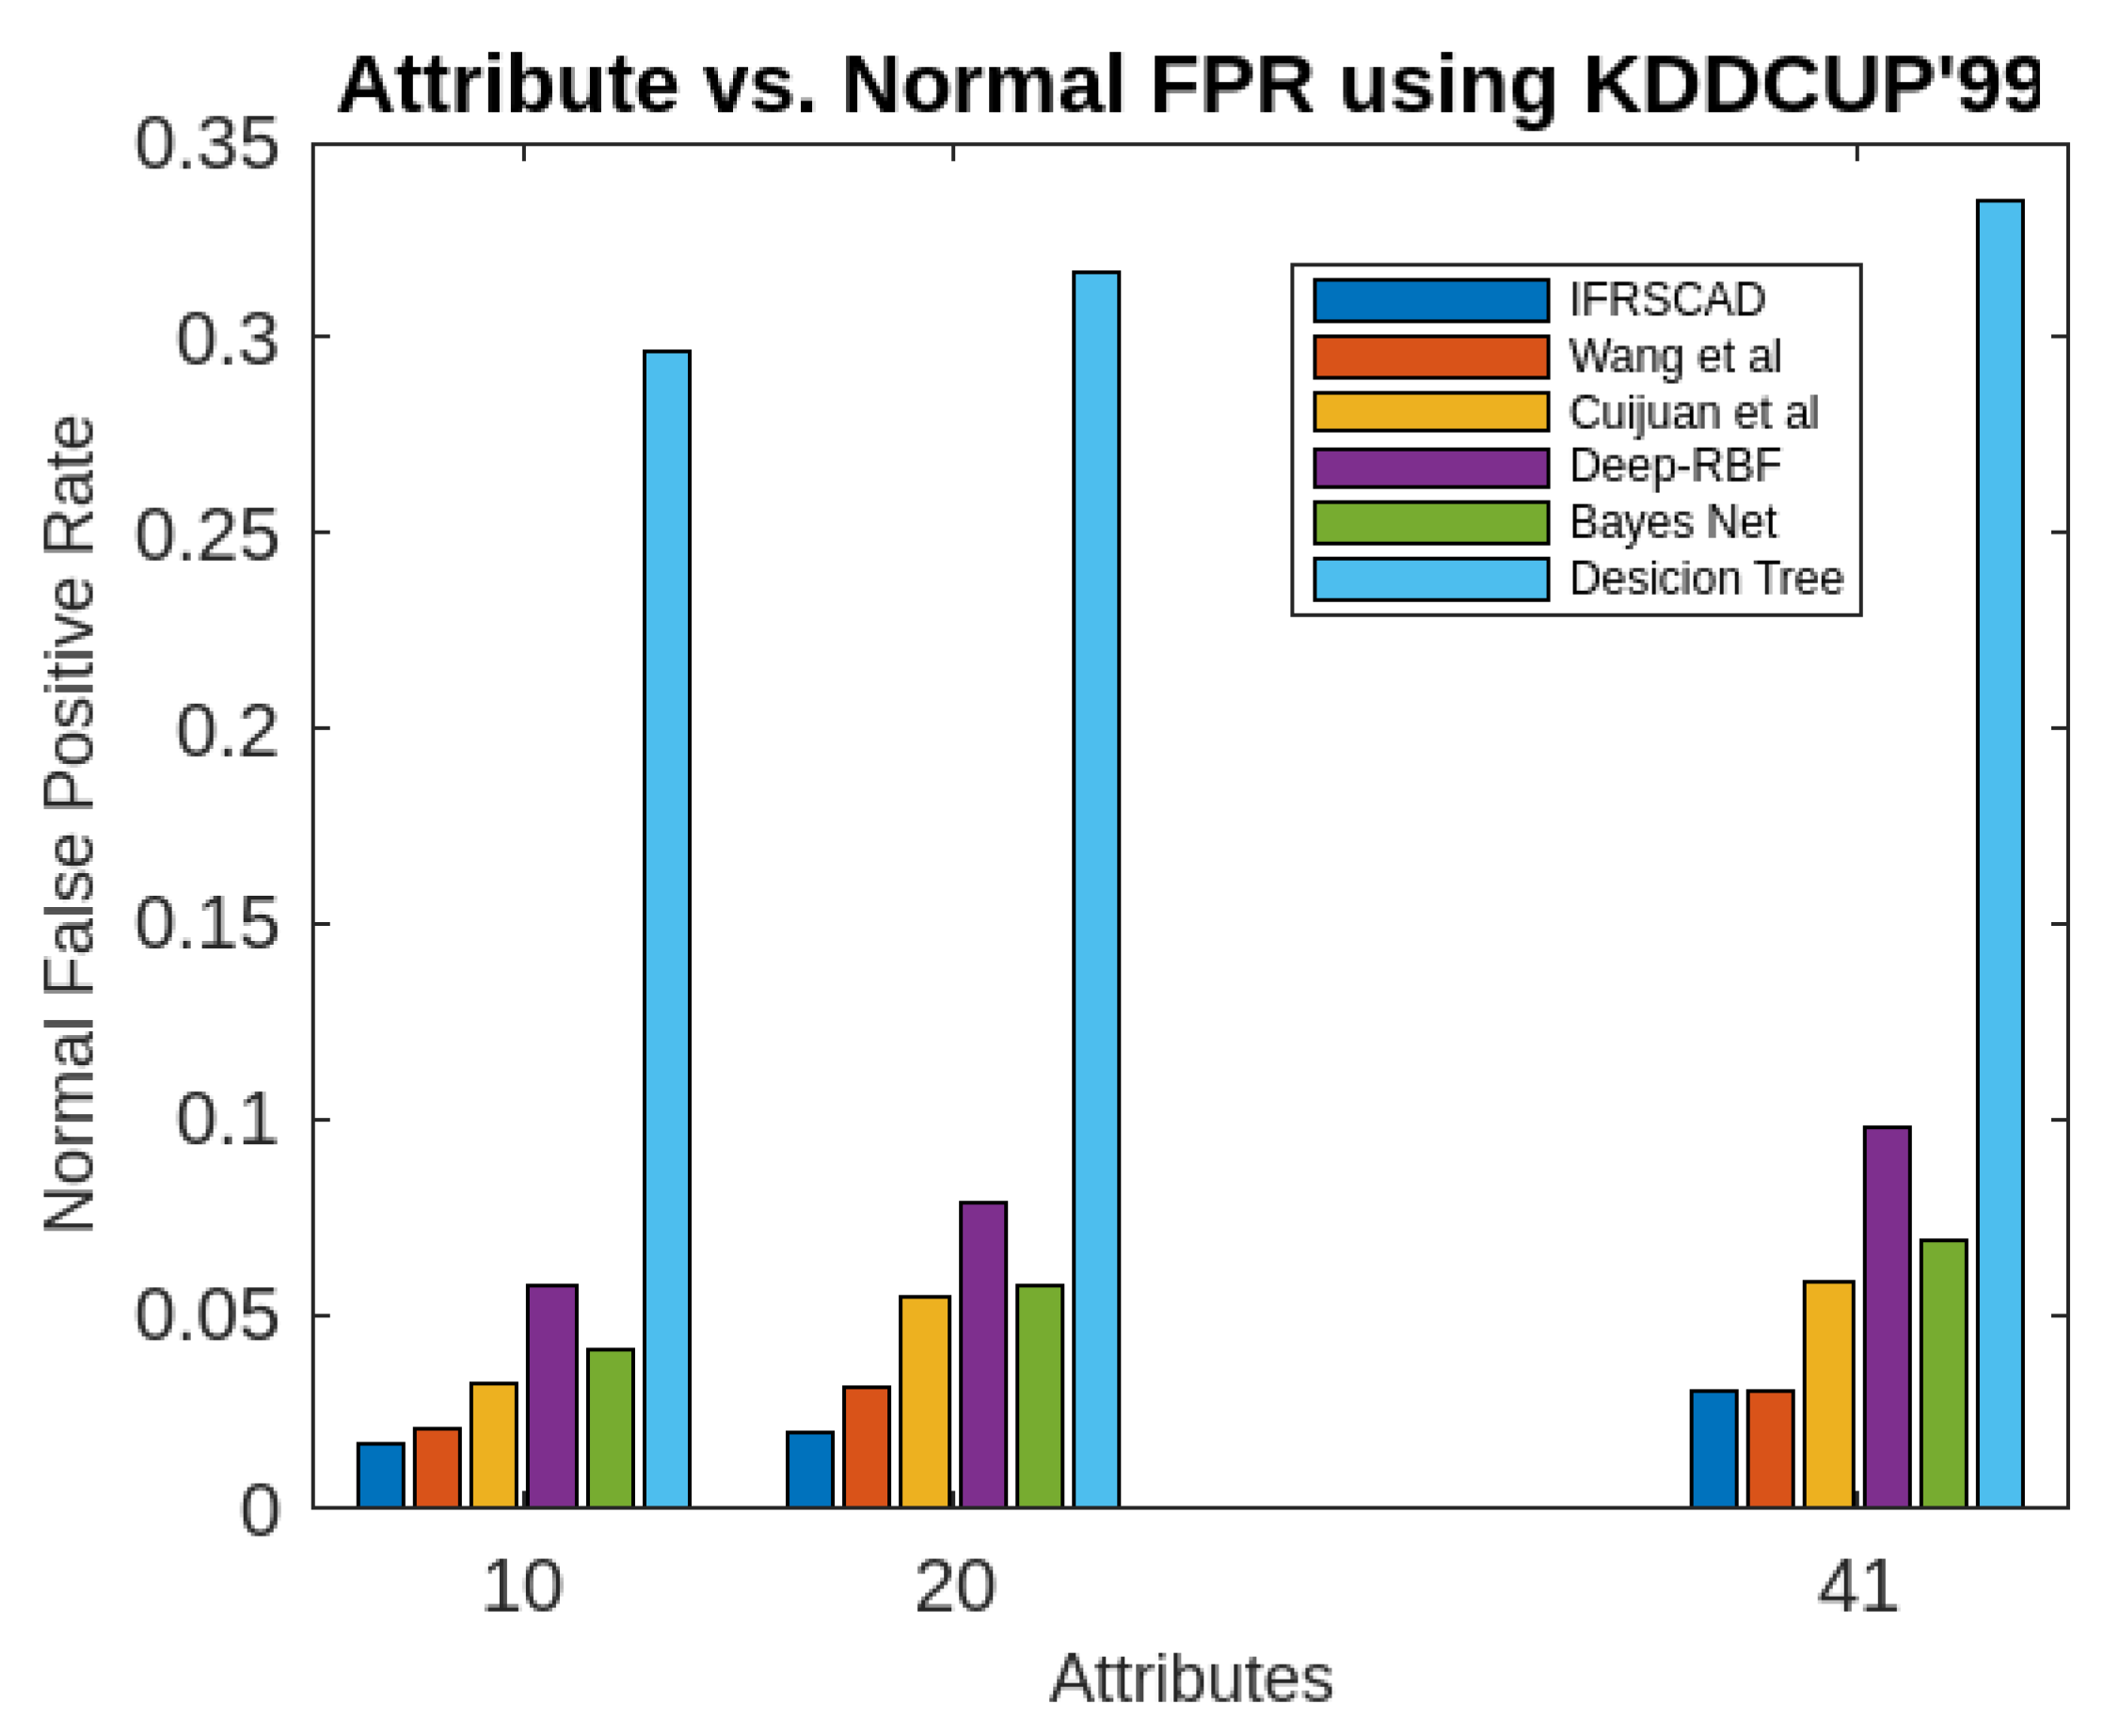
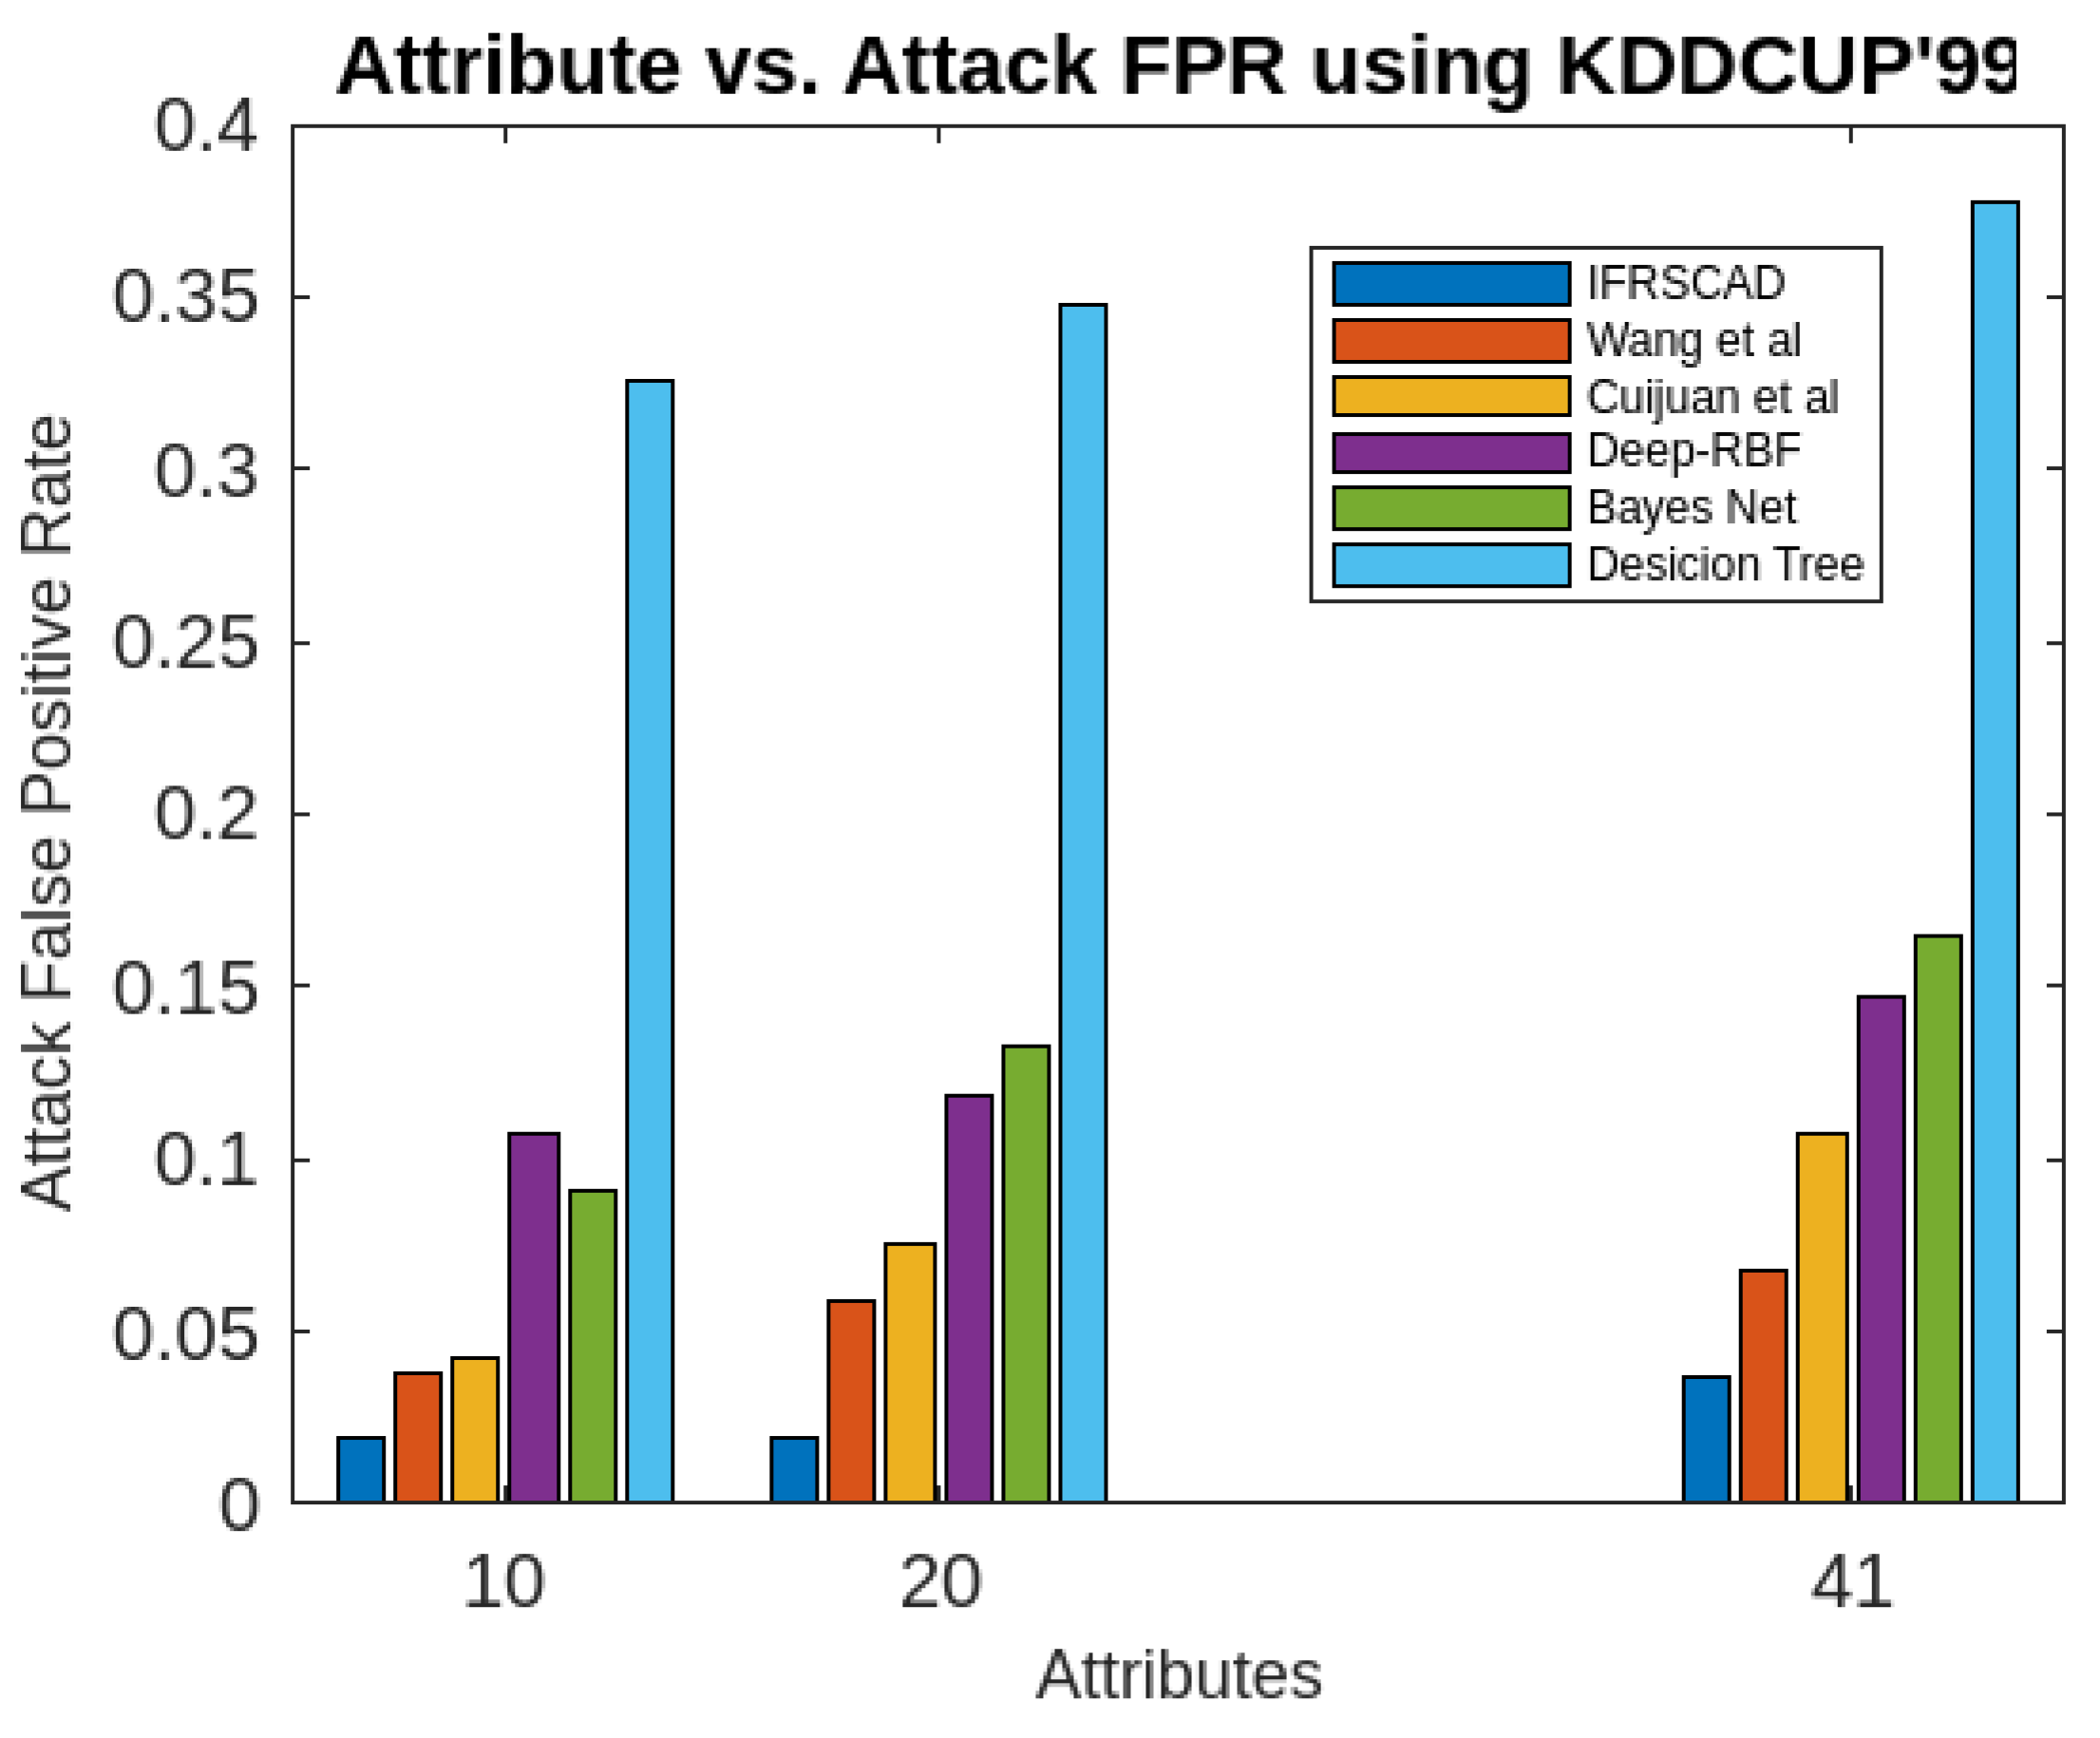
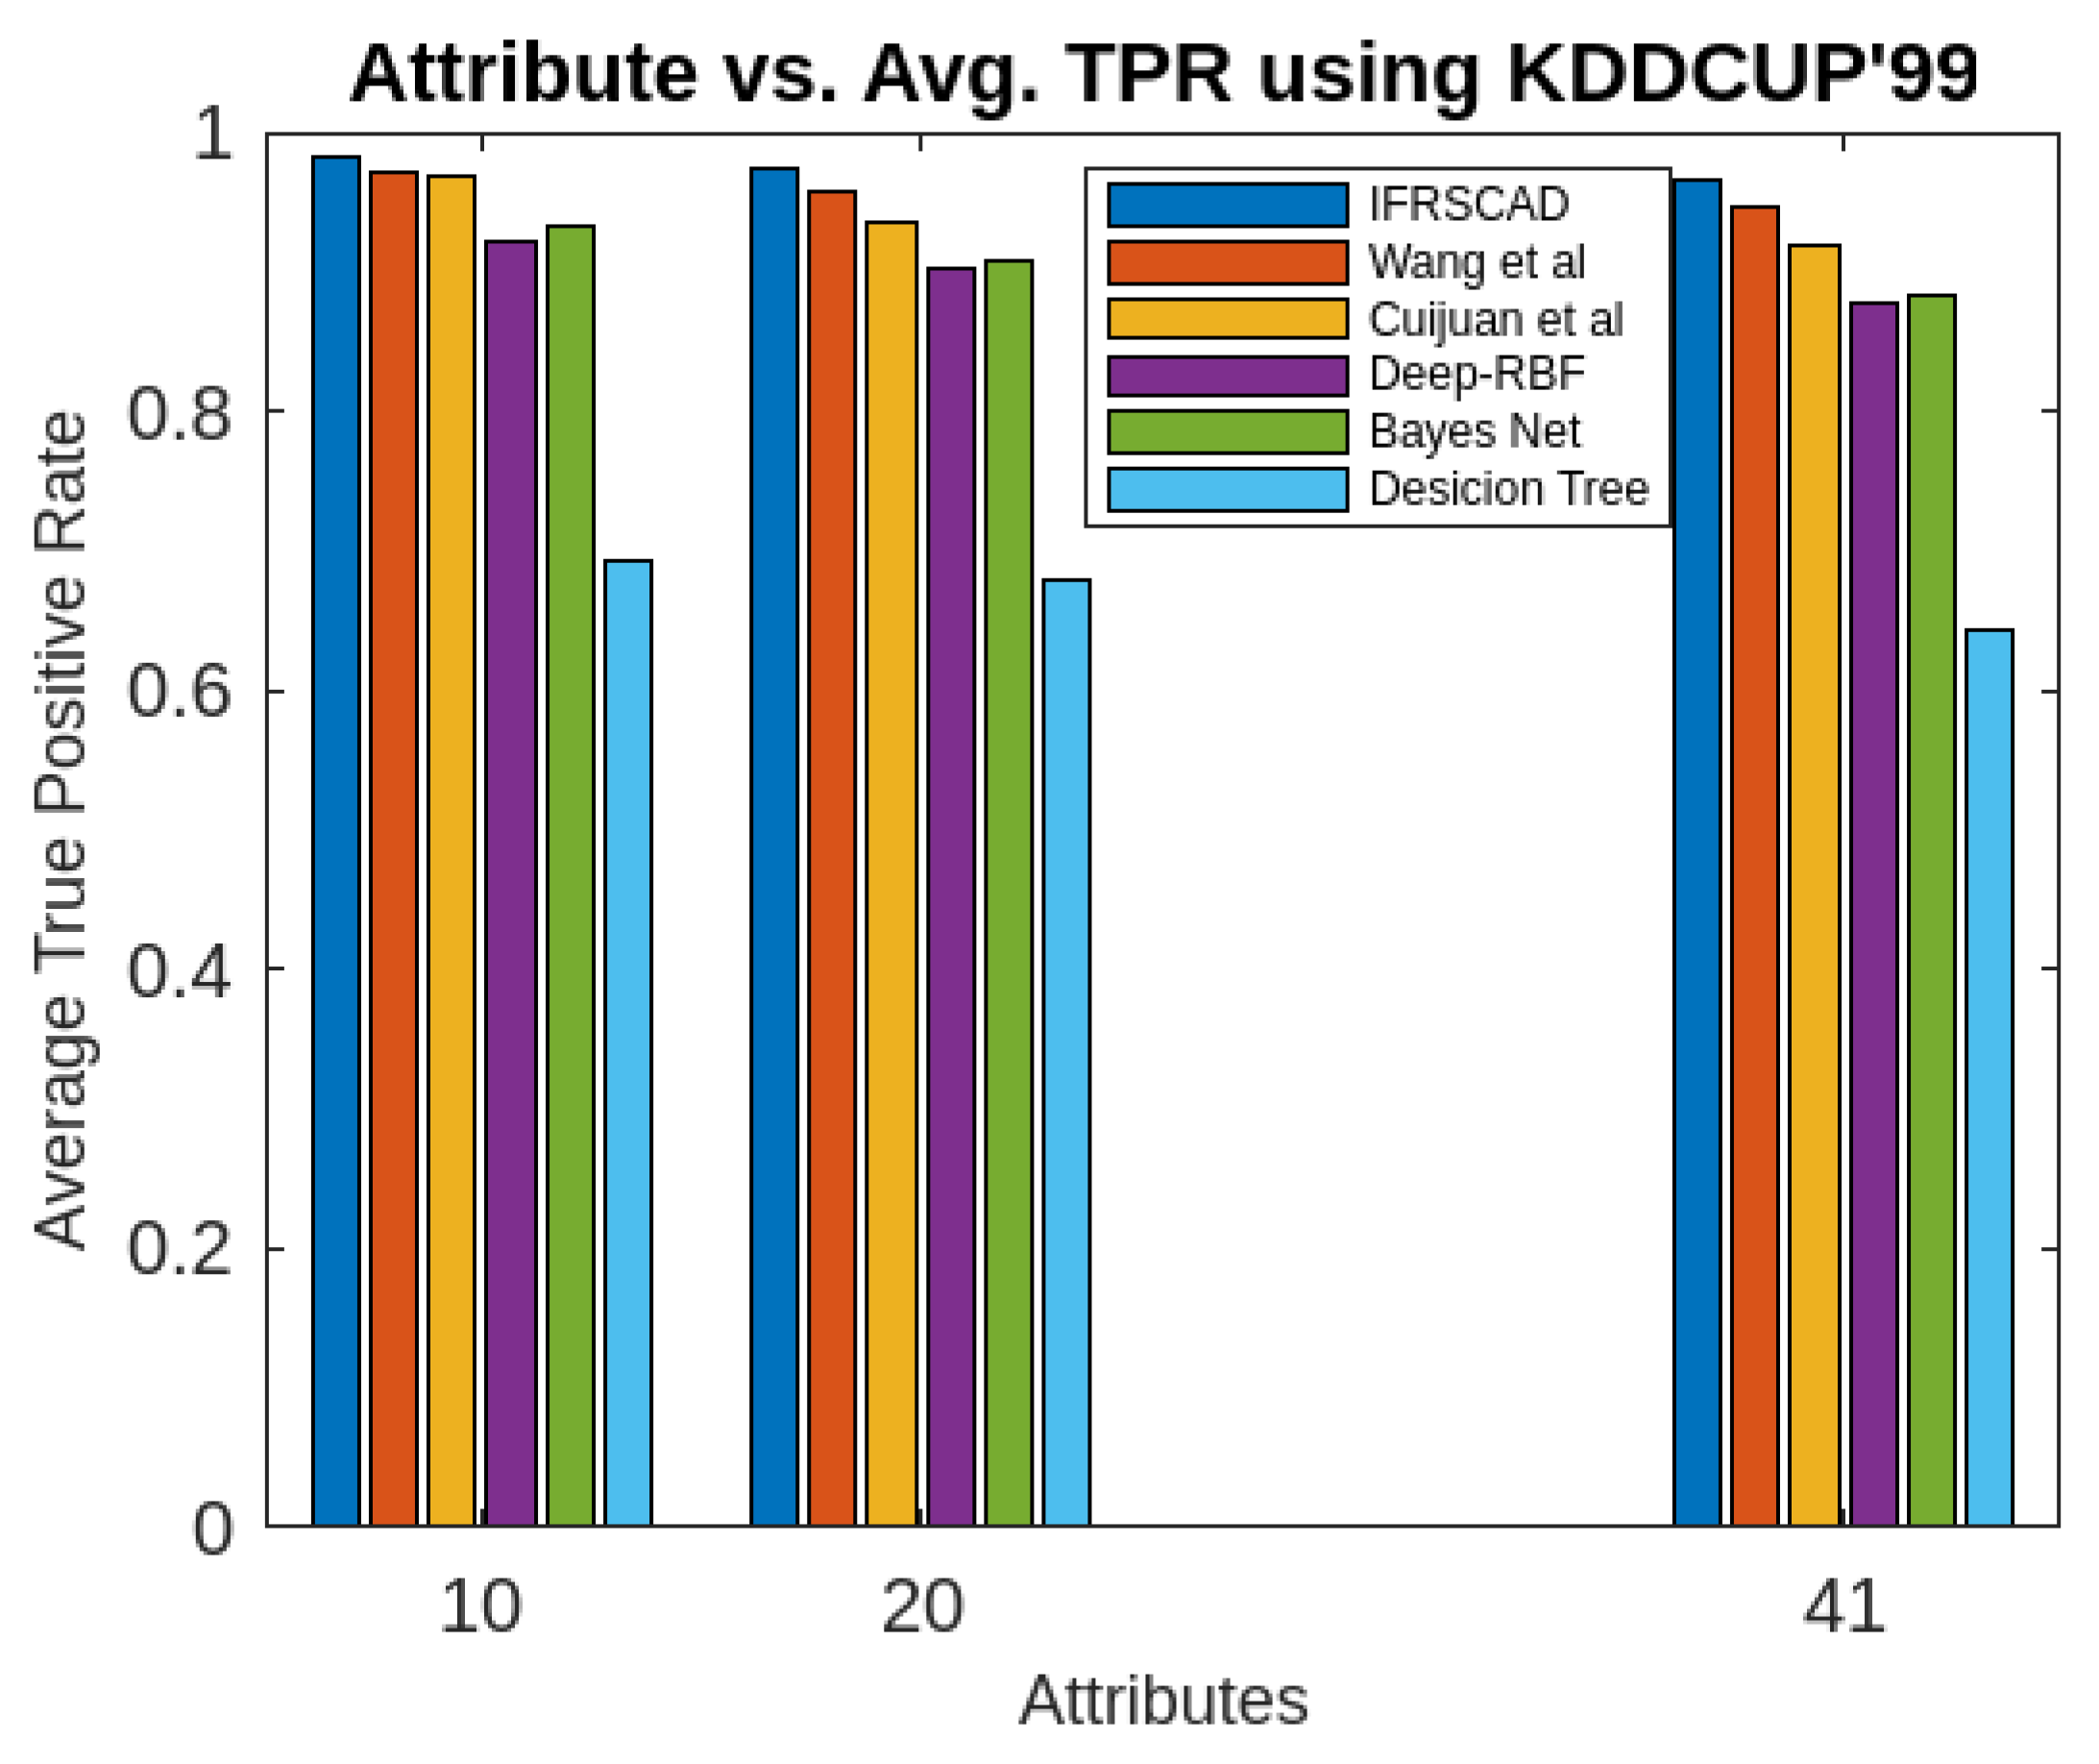
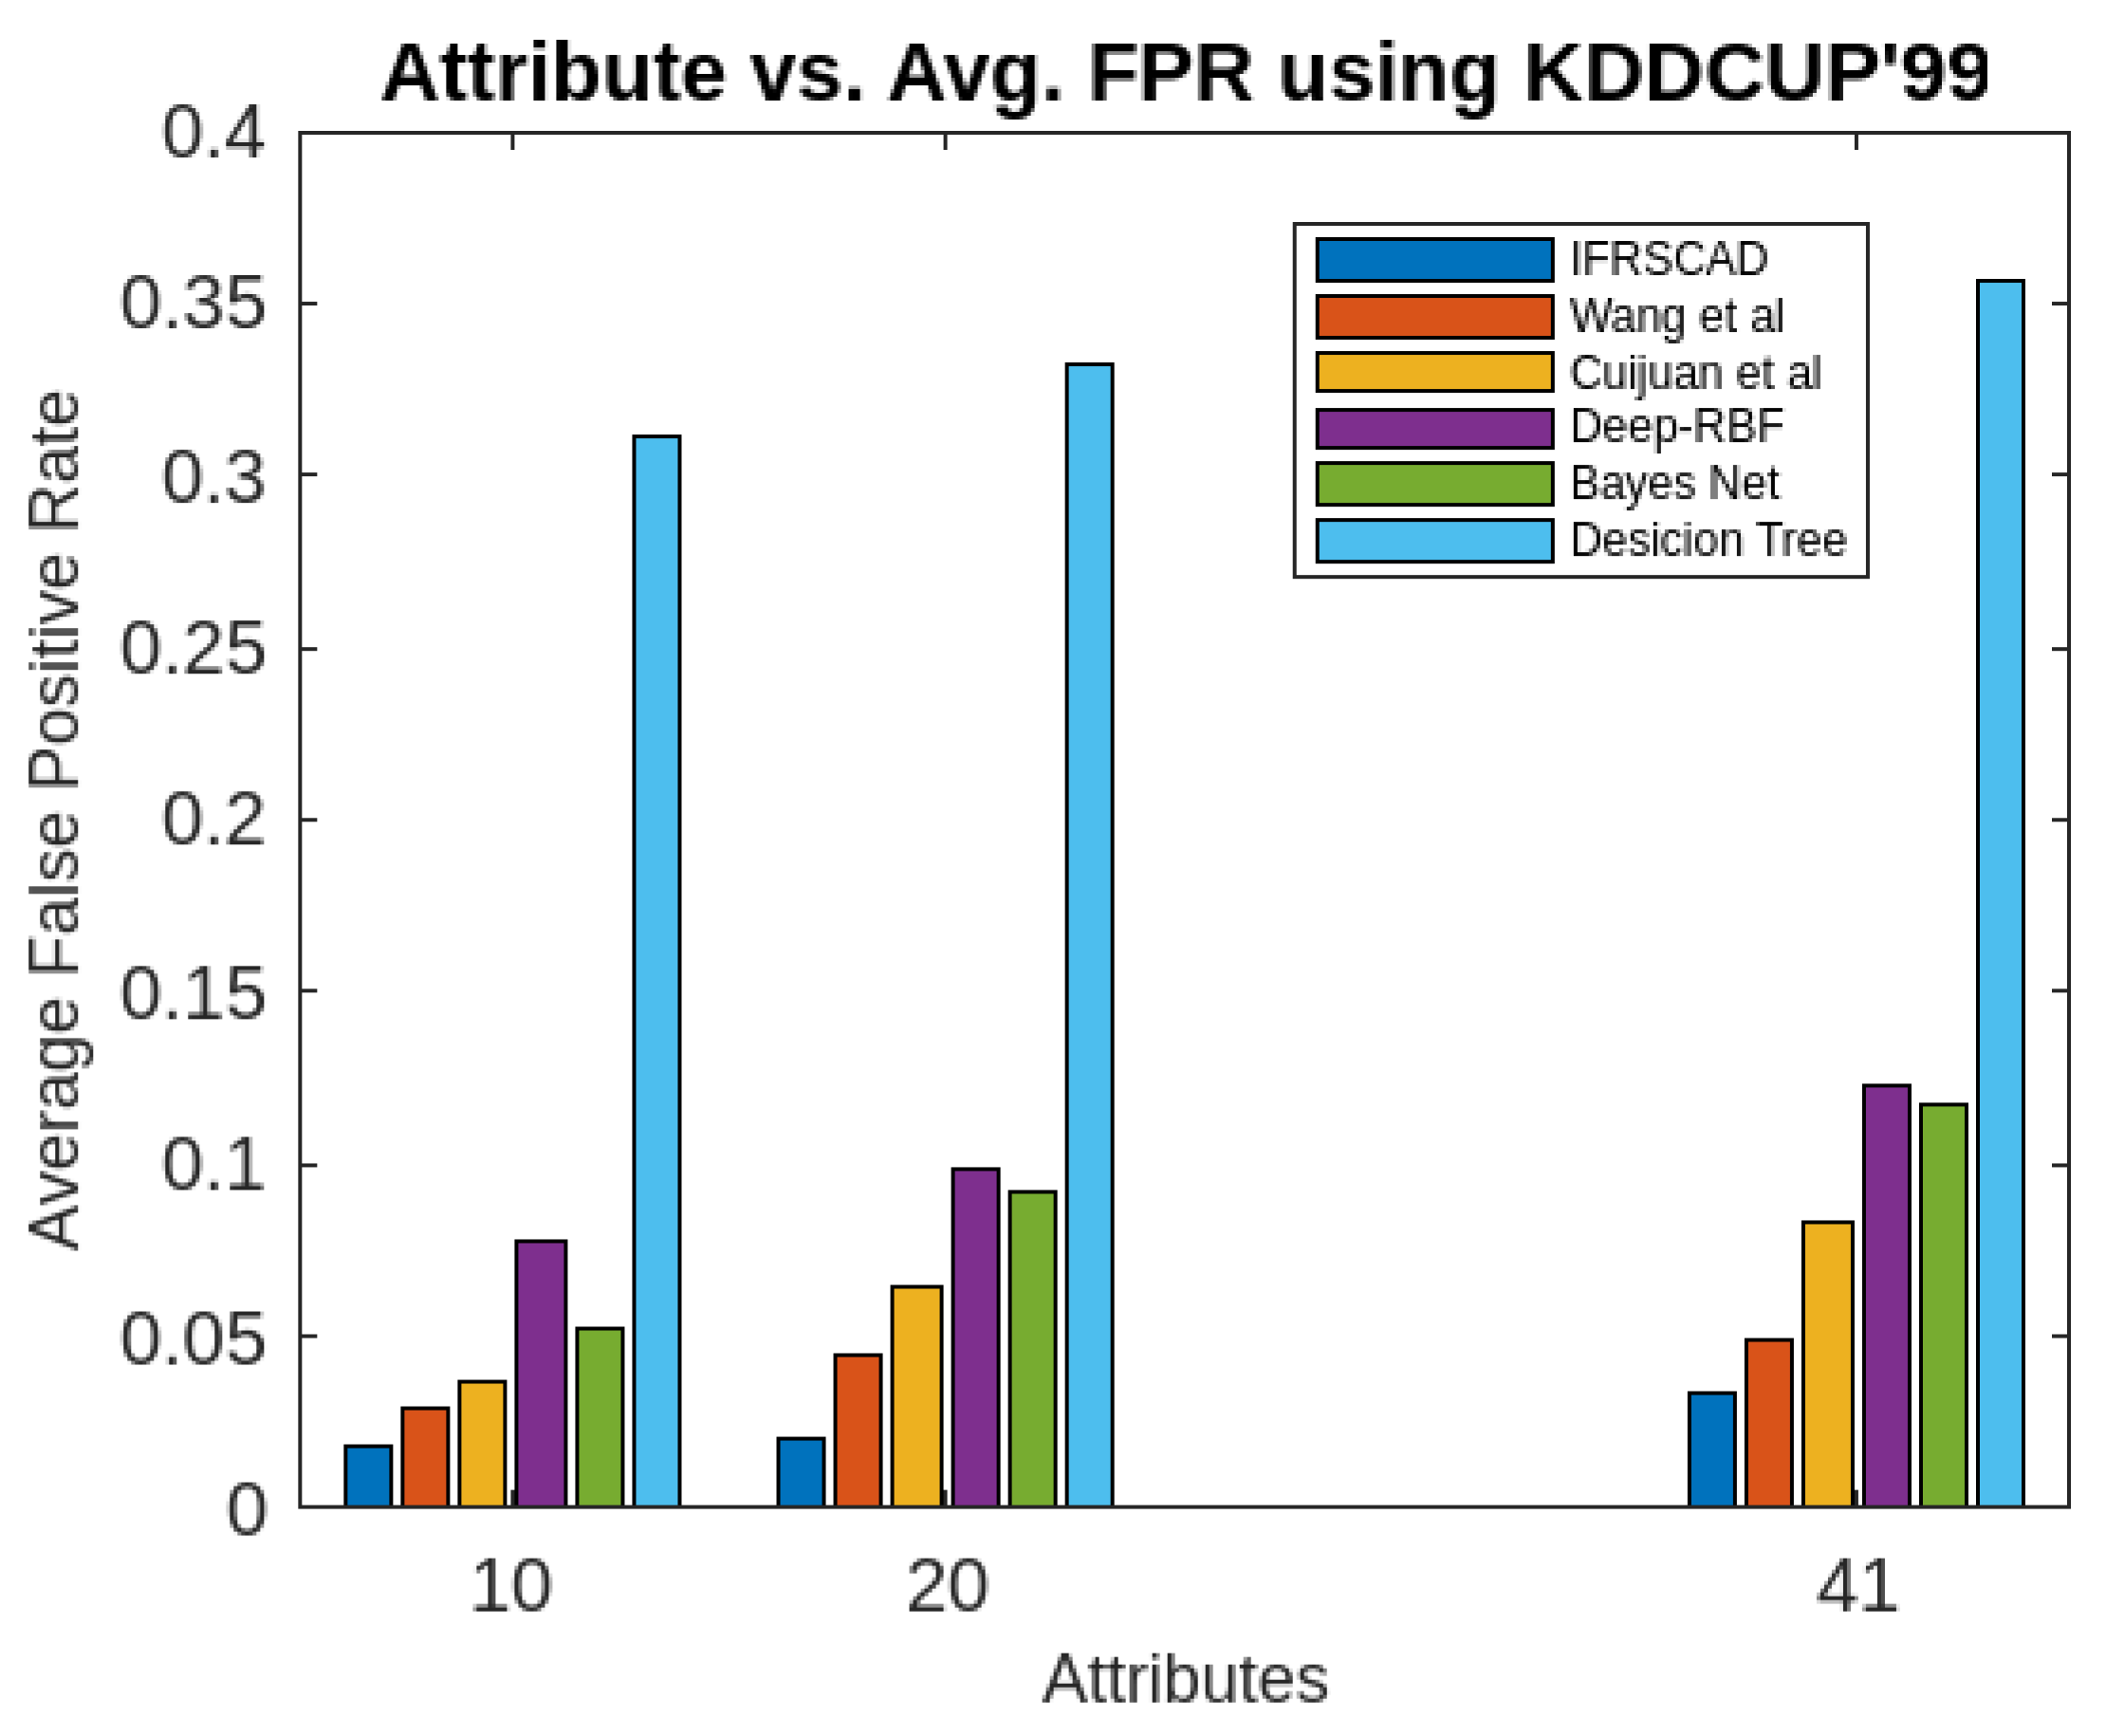
The experiments are conducted using Matlab on Intel Core i7-2600 machine with 3.4 GHz, 8 M Cache, 8 GB RAM, 500 GB Hard disc running Windows 10 and the results are compared with five well-known methods namely Cuijuan et al’s method [16], Wang et al’s method [17], Deep-RBF Network [15], Bayes Network [14], and Decision Tree [13]. The classifiers were built using the aforesaid dataset. The value of α is assumed to be 0.4. The classifiers are then used to categorize any new instance as either normal traffic or an attack. For a variety of attributes sizes, the outcomes of all the aforesaid six methods are recorded. Data instances from various attacks are significantly out of proportion to normal data. Parameters like True Positive Rate (TPR) and False Positive Rate (FPR) were utilized to estimate the effectiveness of the approaches and comparative analysis. A partial view of the results of the six algorithms describing the comparative analysis of Normal True Positive Rate, Attack True Positive Rate, Normal False Positive Rate, Attack False Positive Rate for different sizes of attribute-set of KDDCUP’99 datasets is presented in Figure 2, Figure 3, Figure 4, Figure 5, Figure 6 and Figure 7.
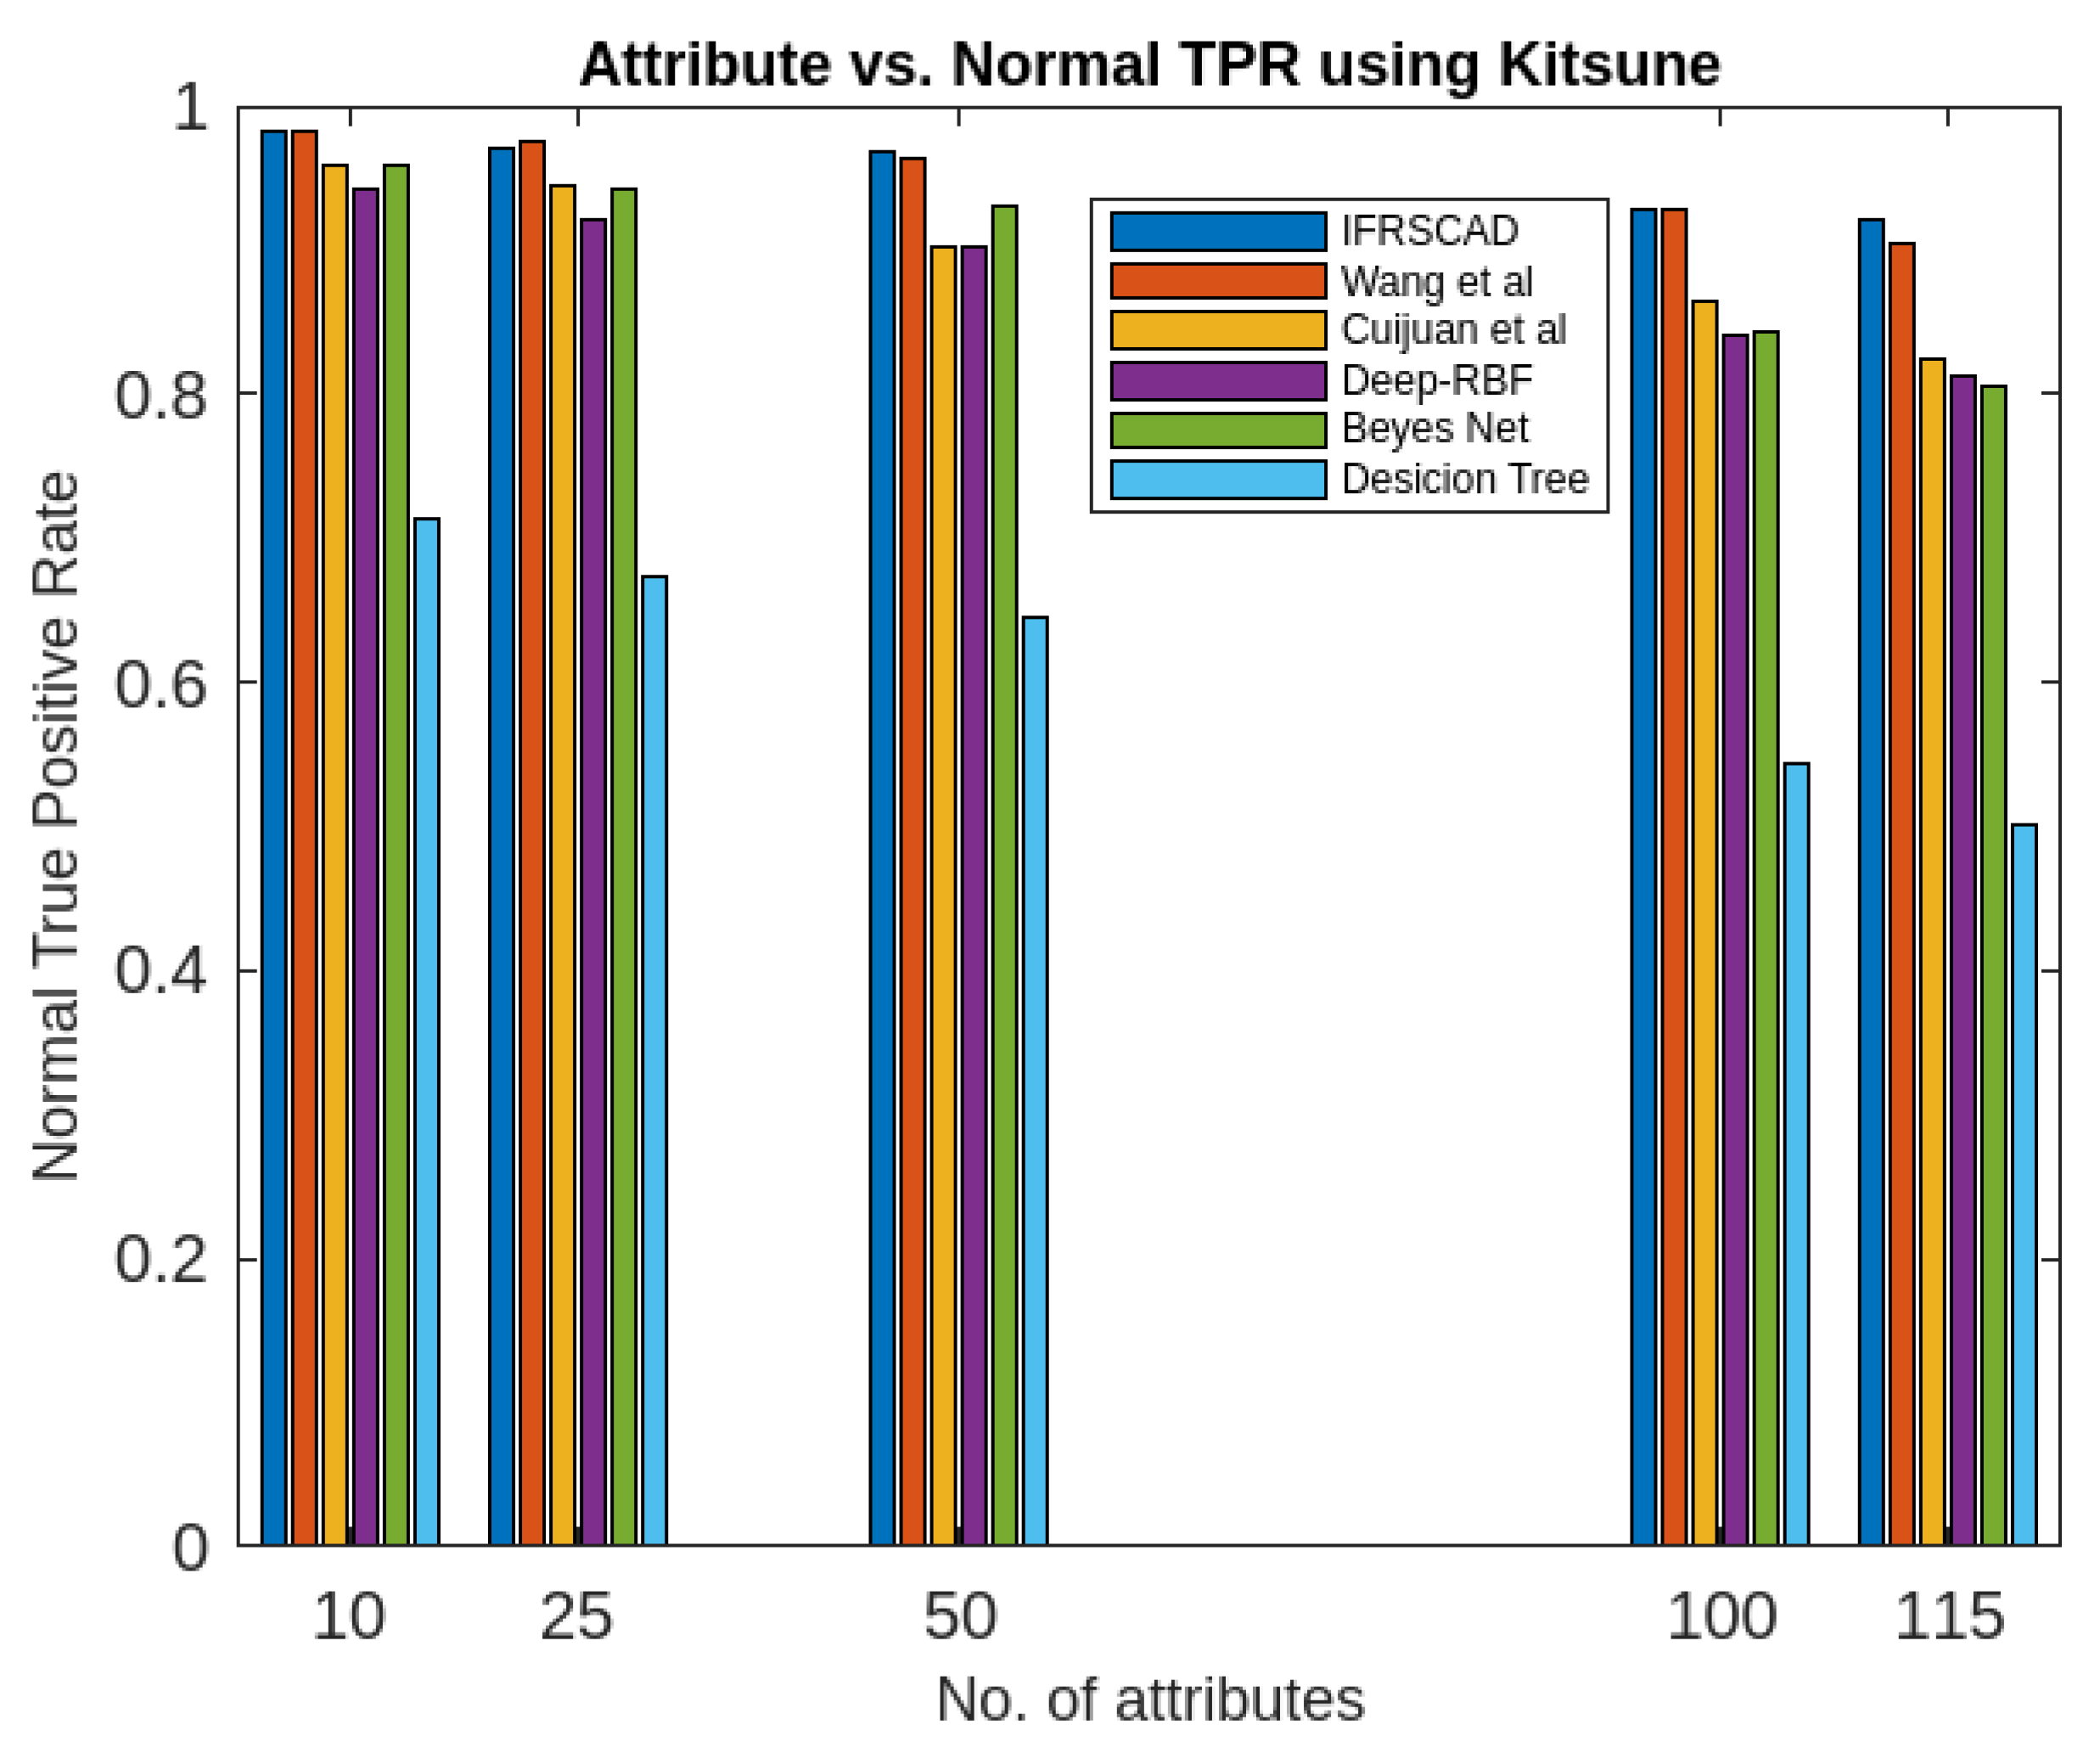
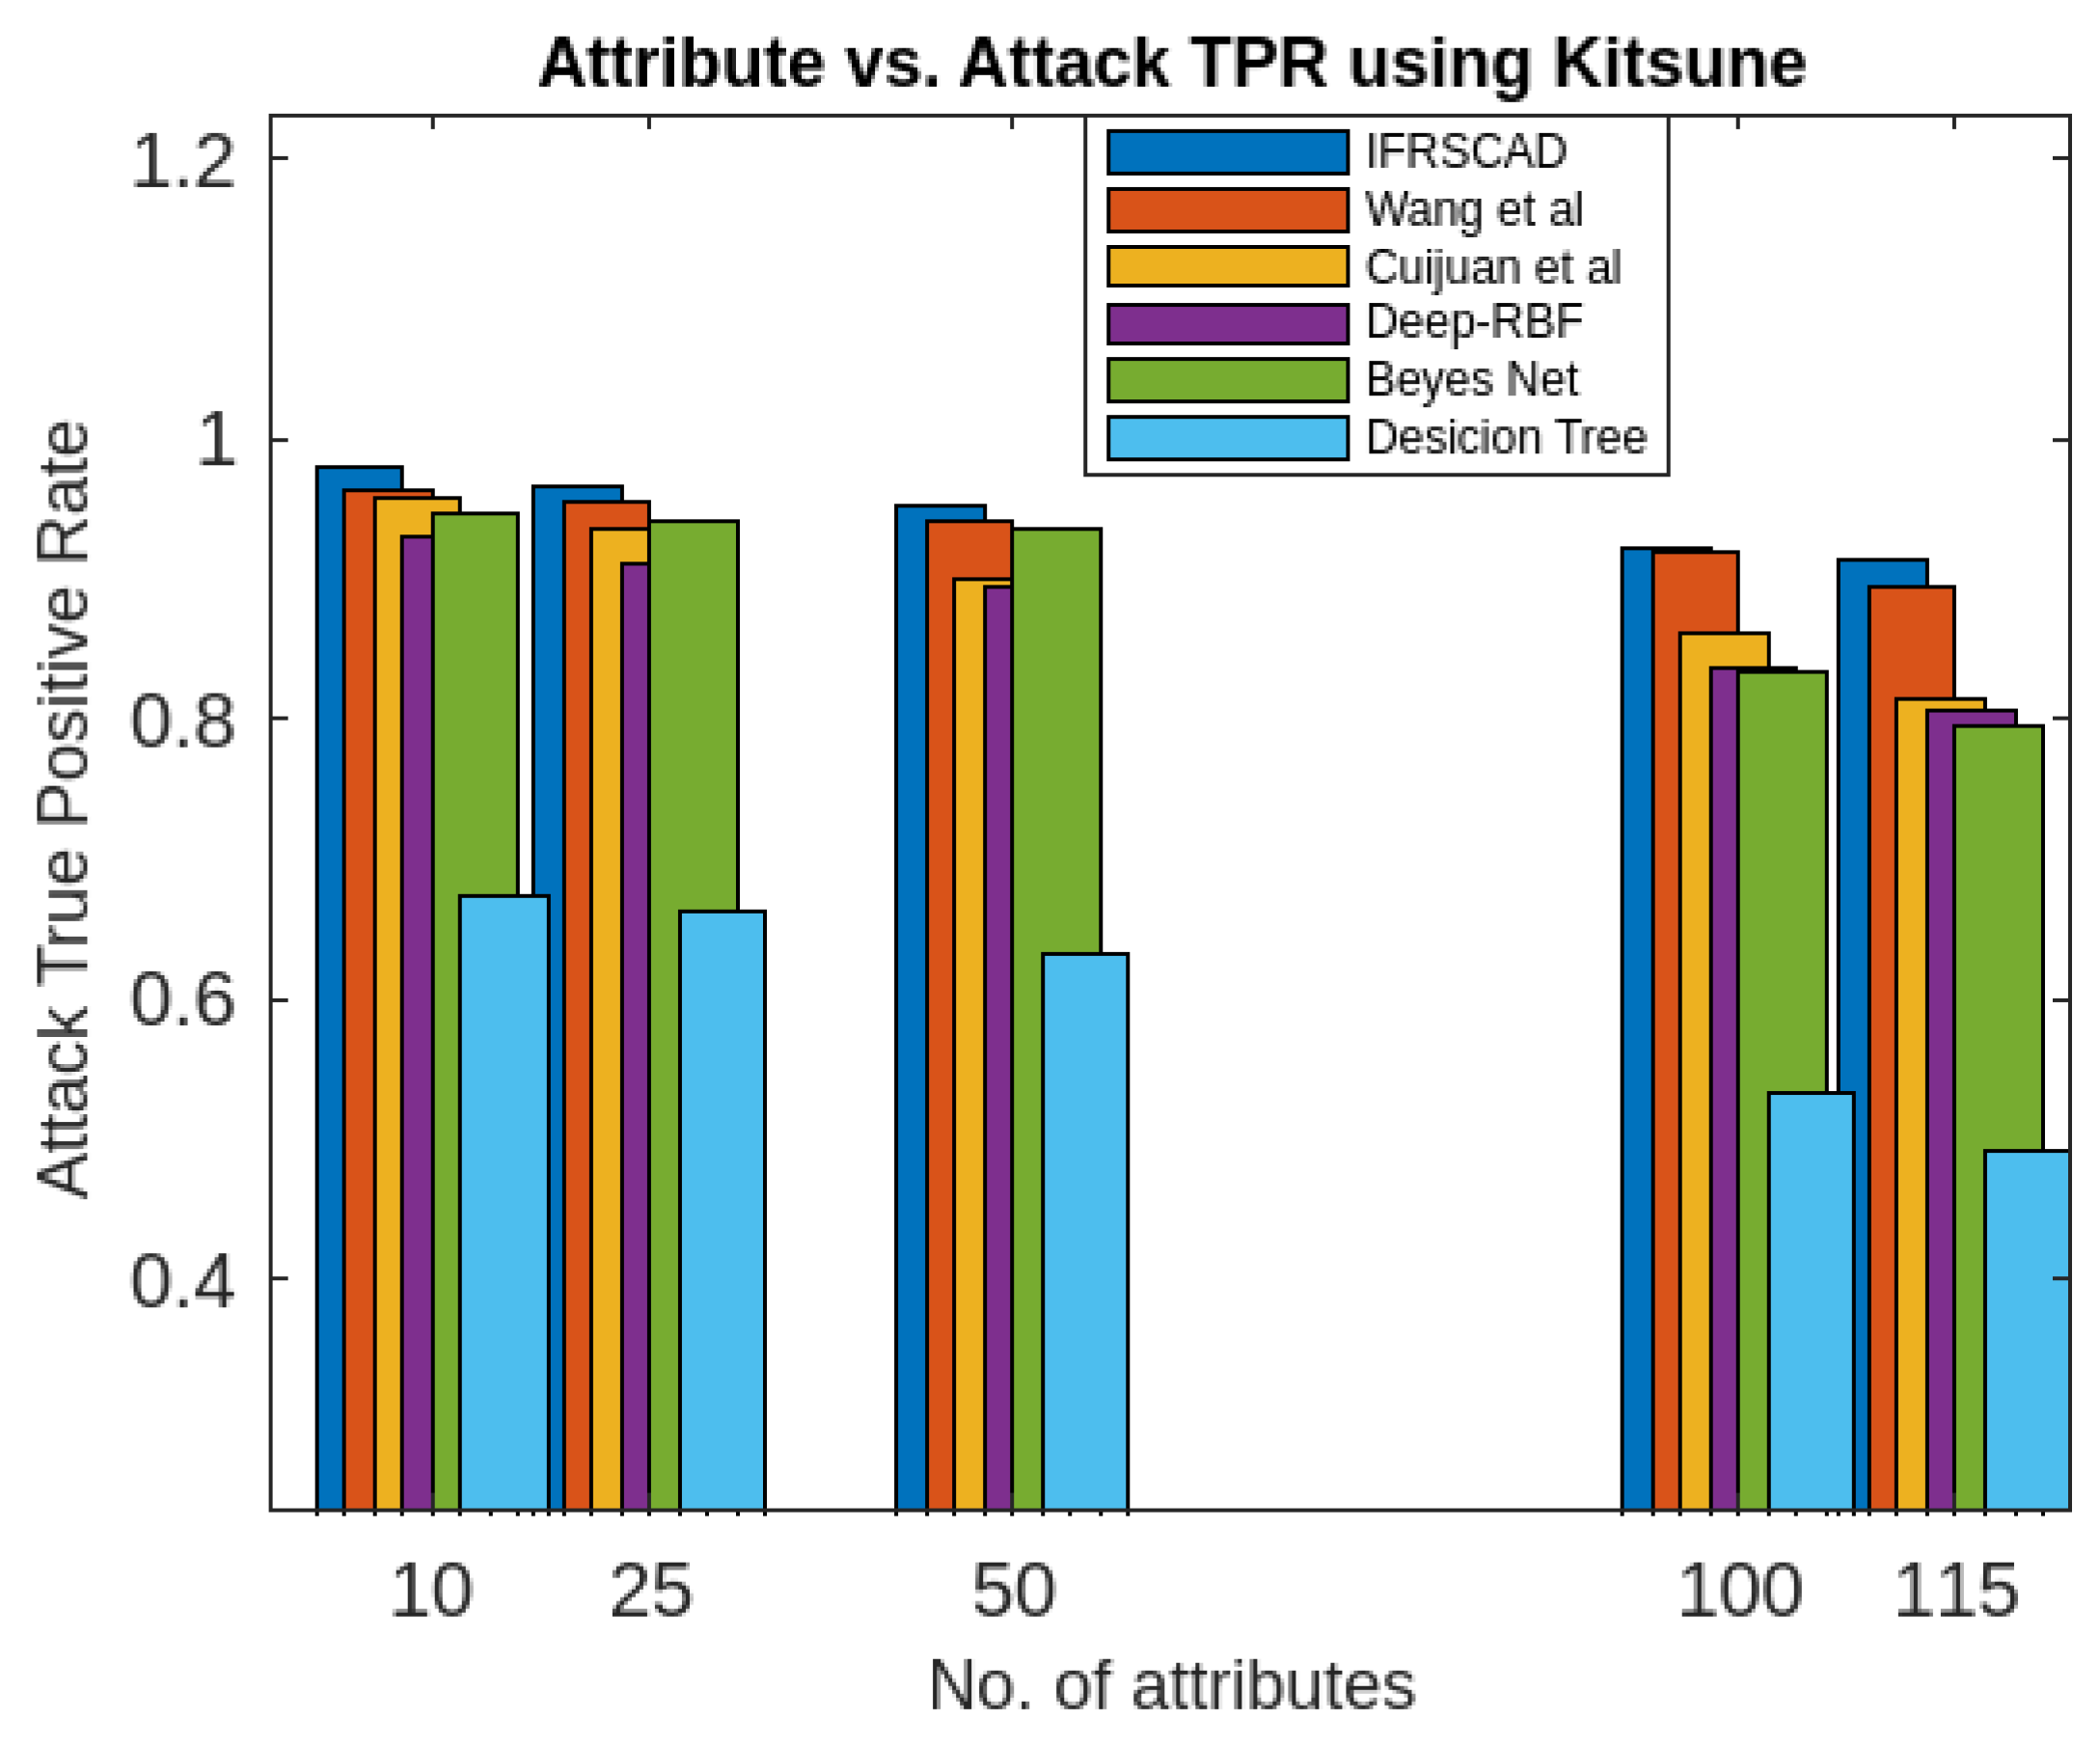
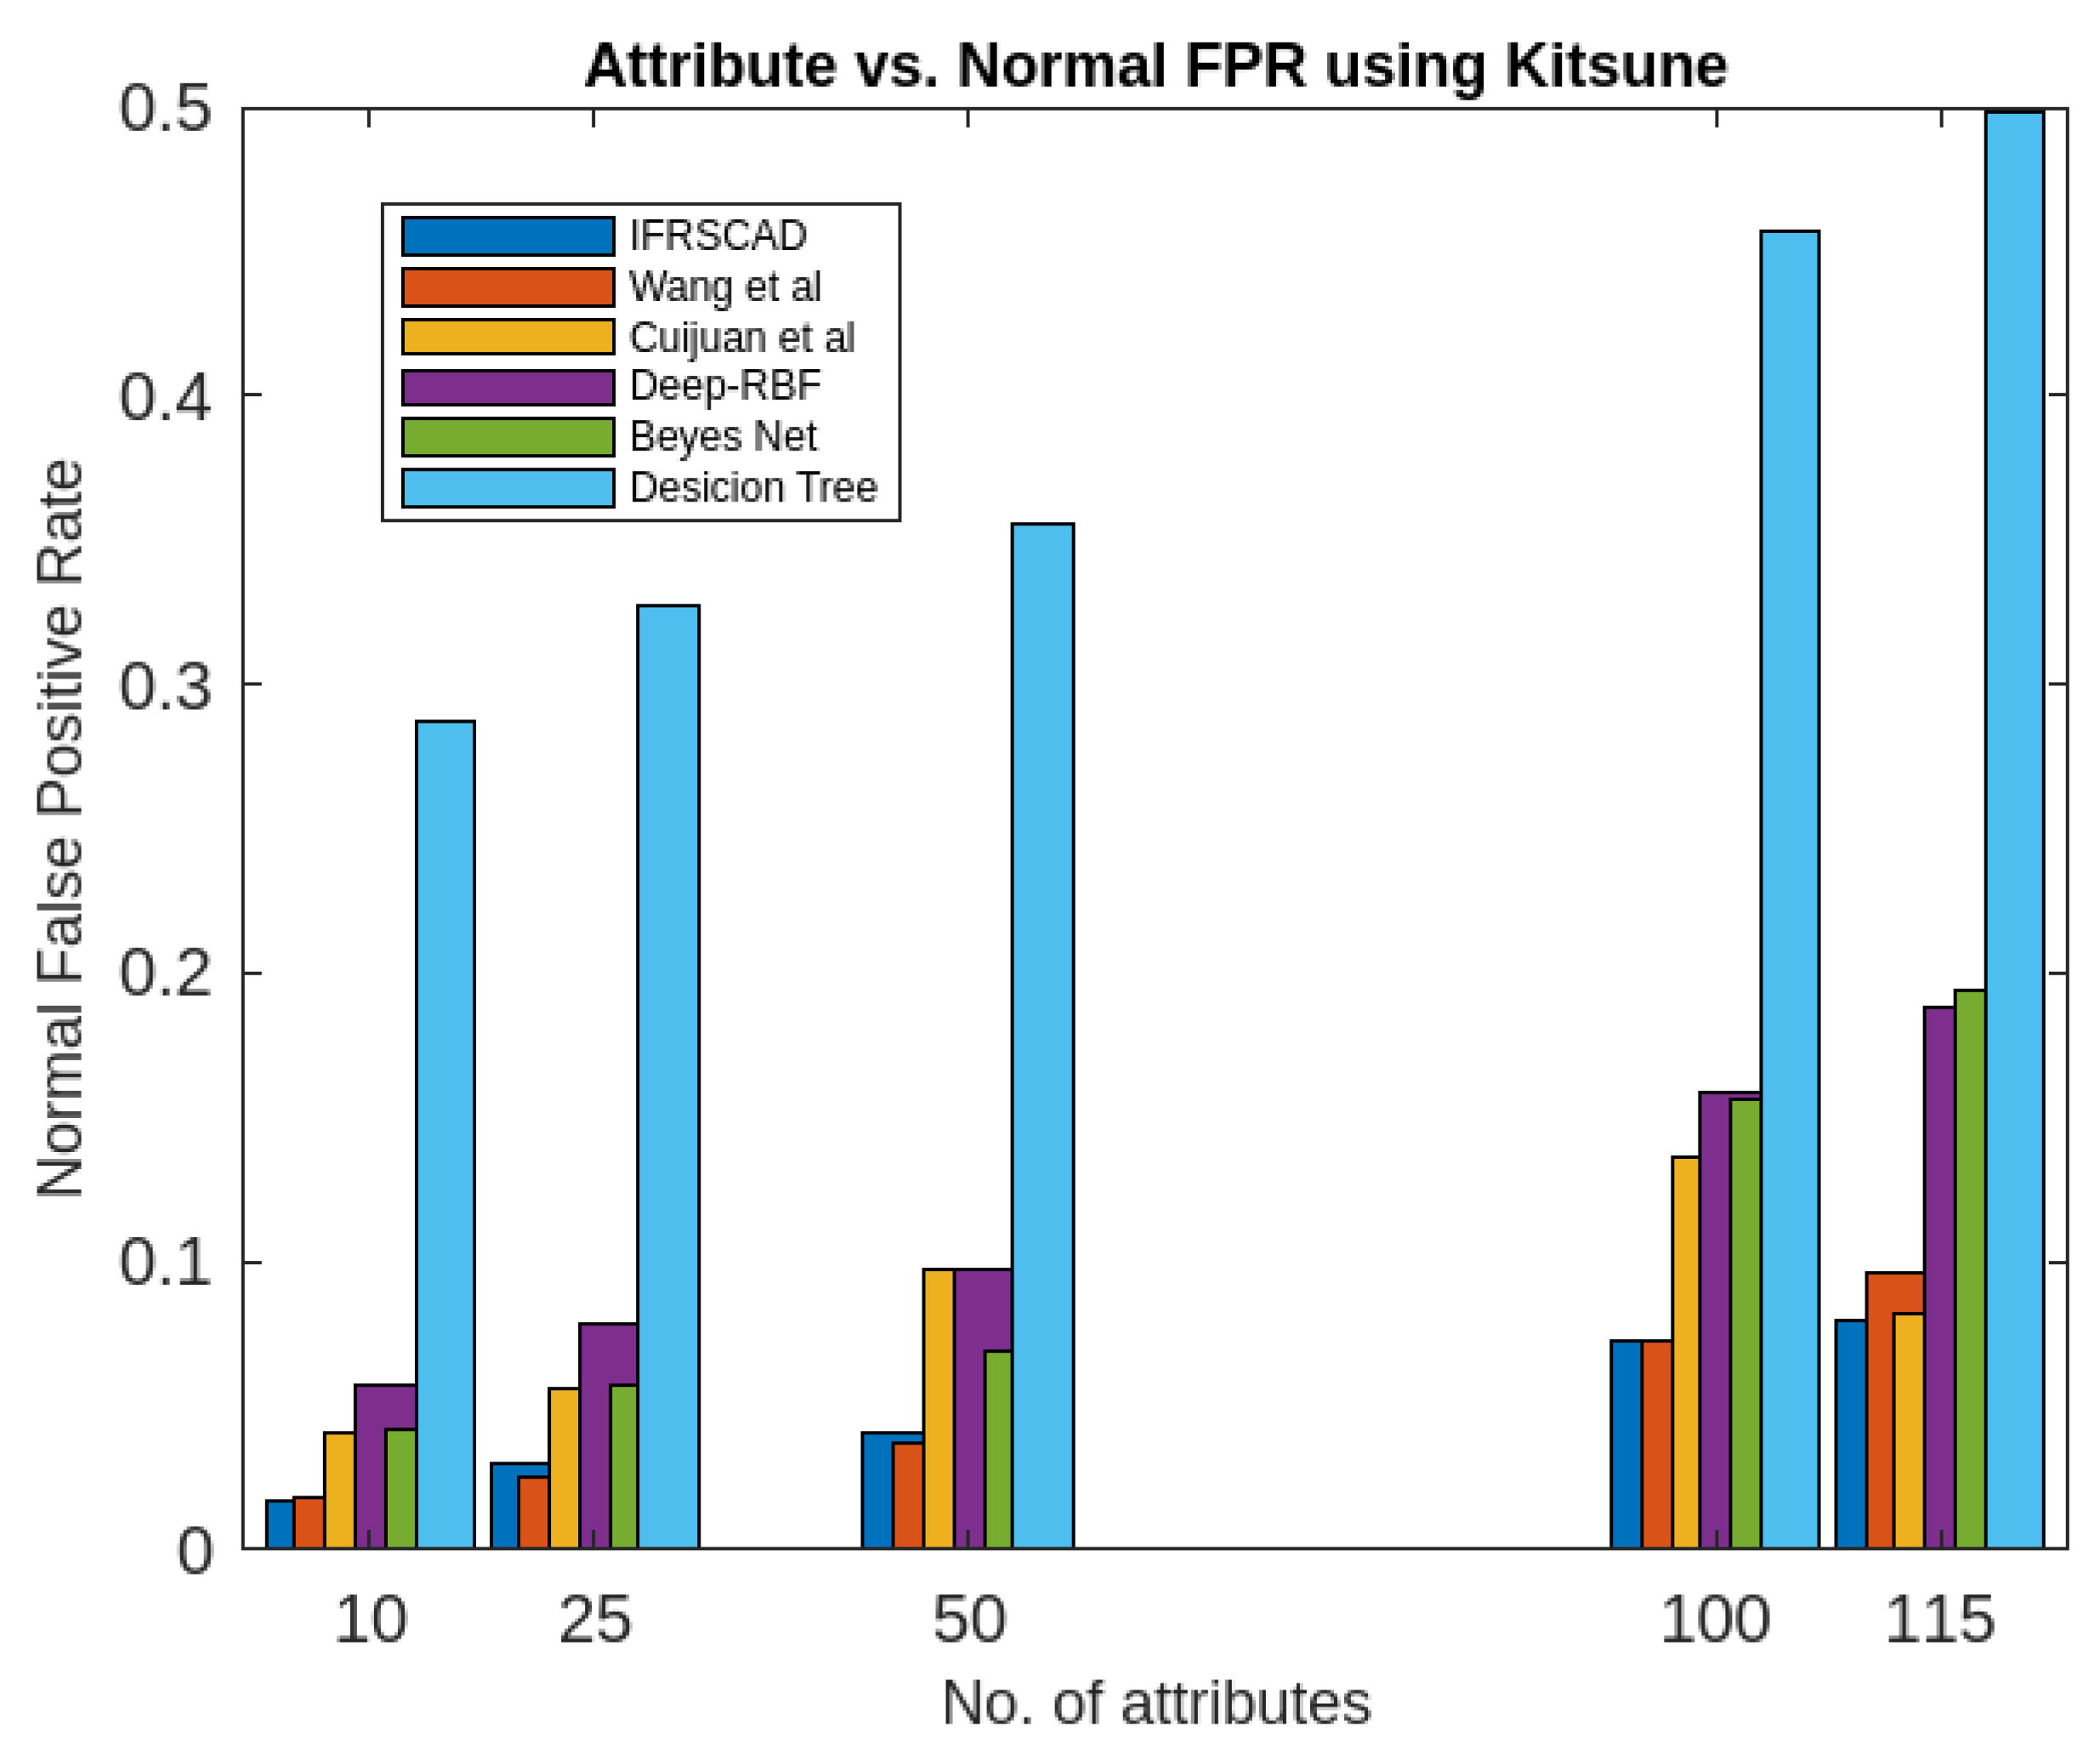
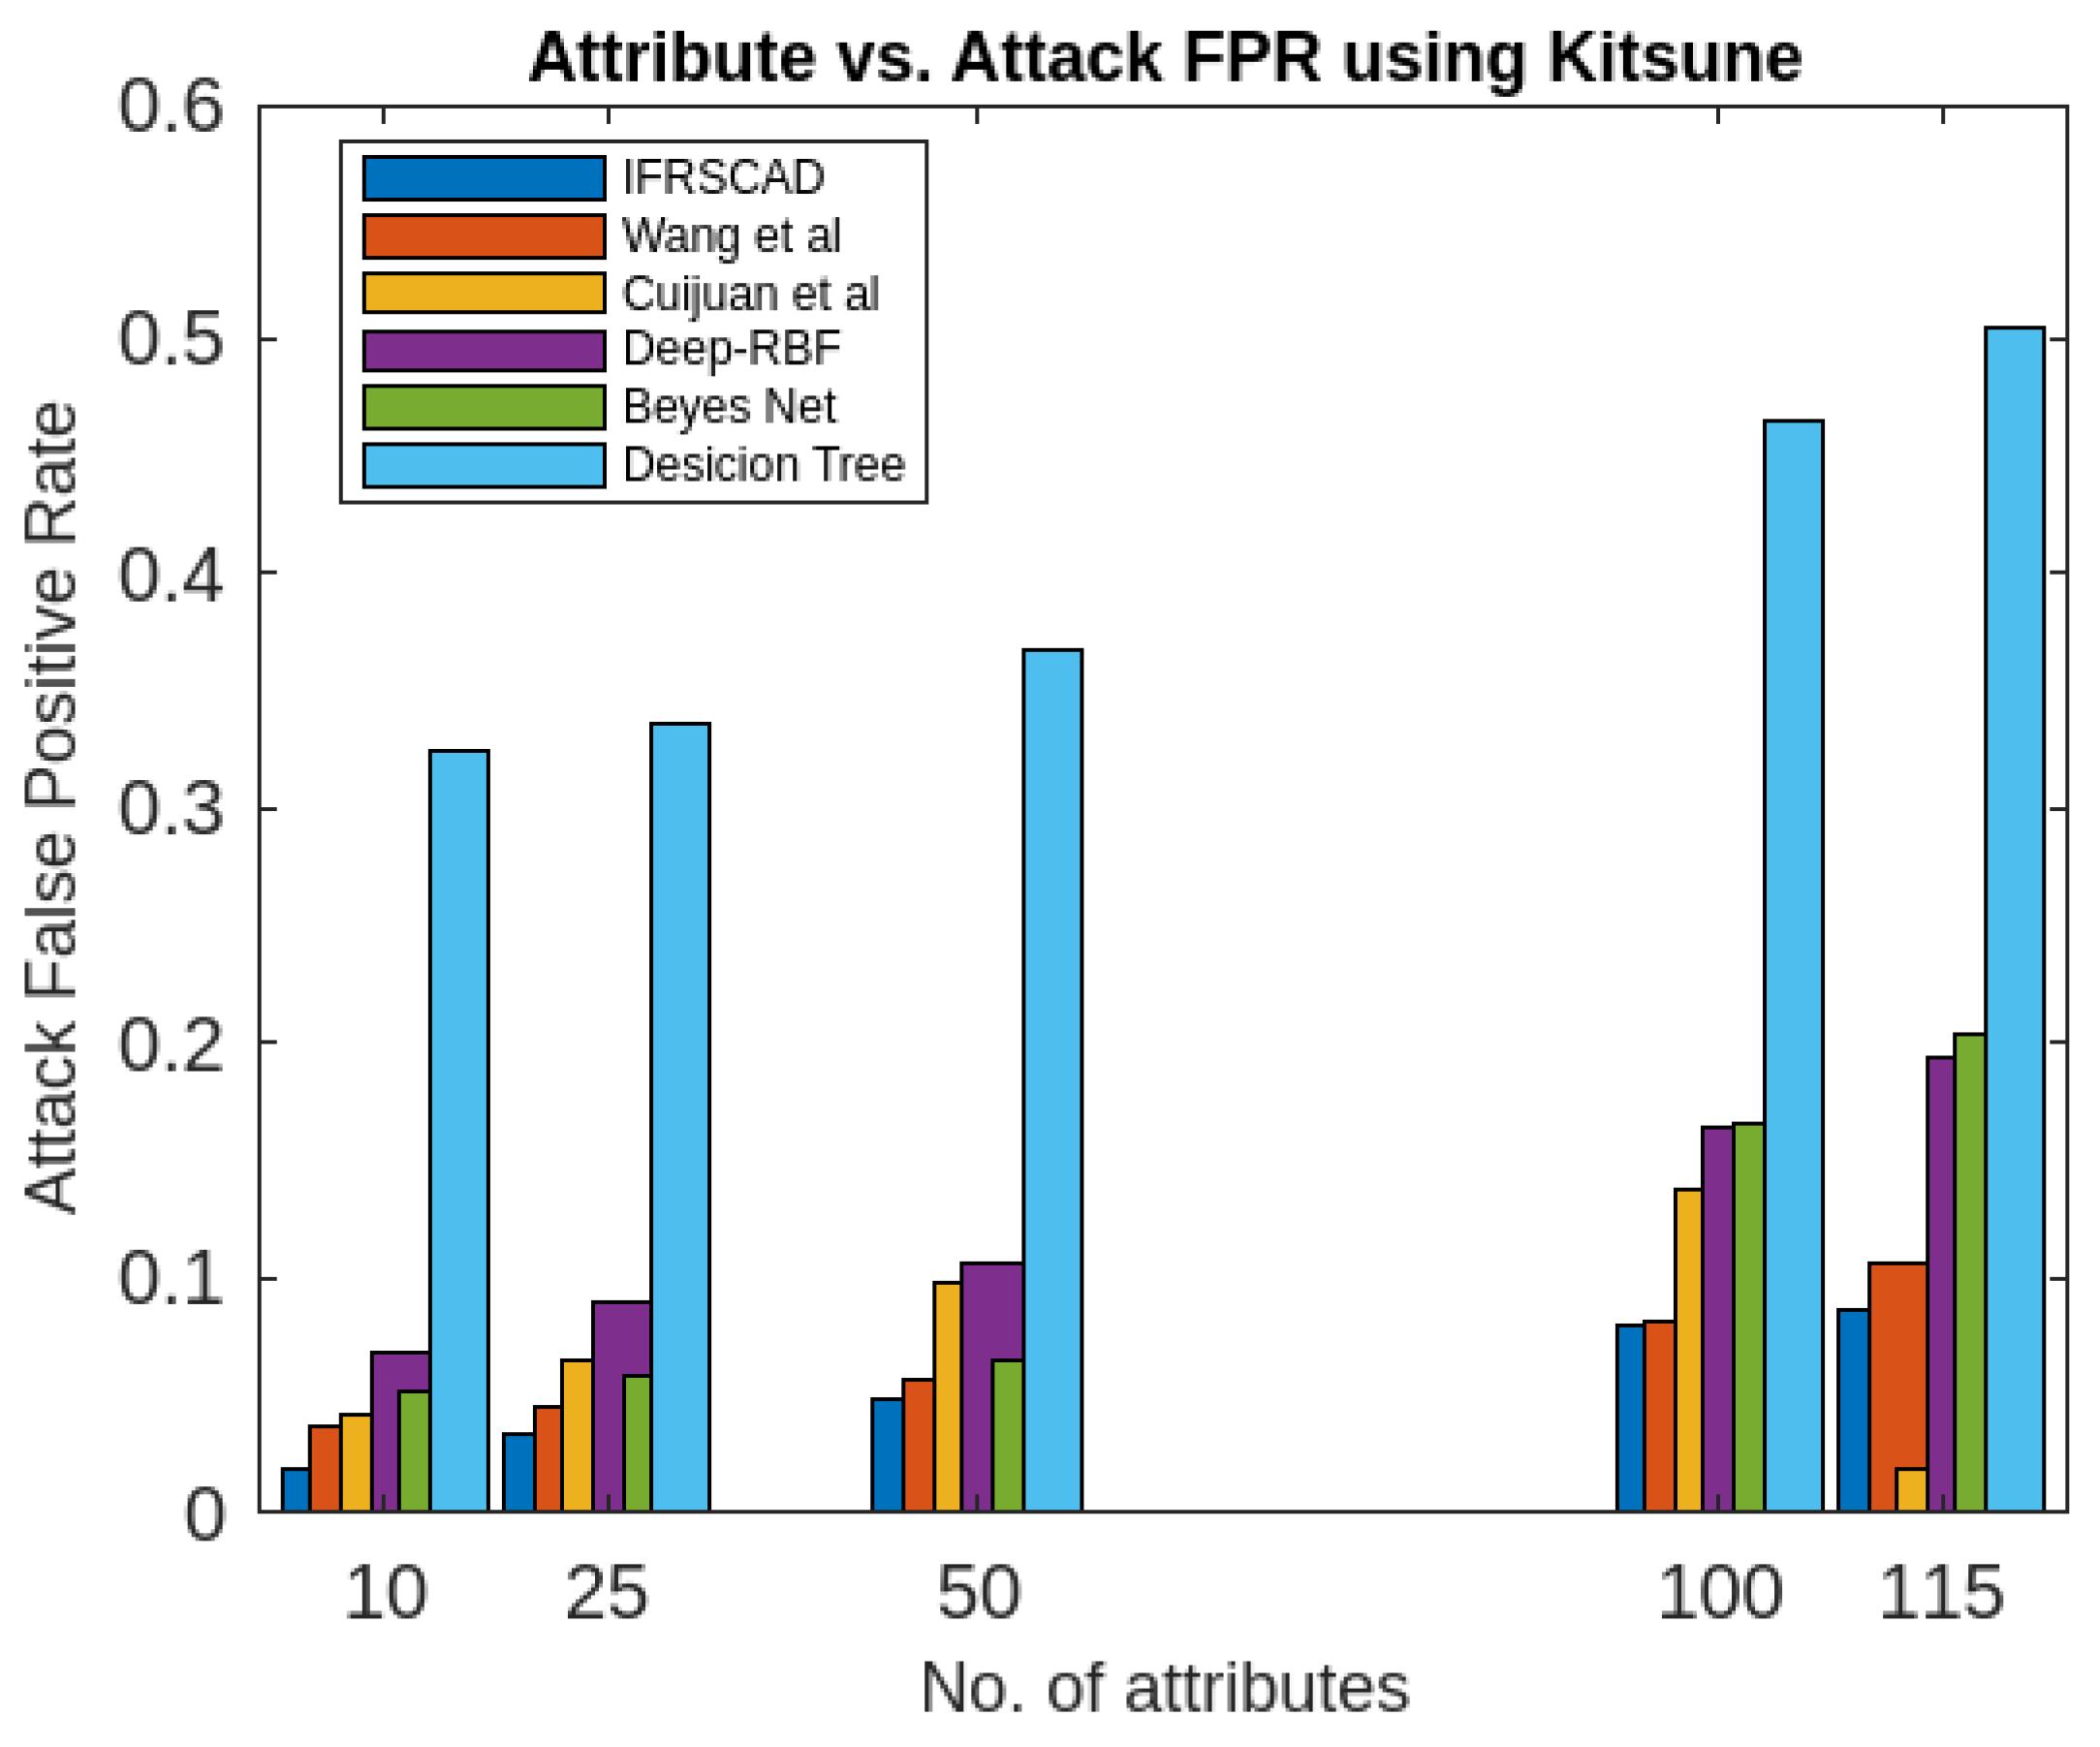
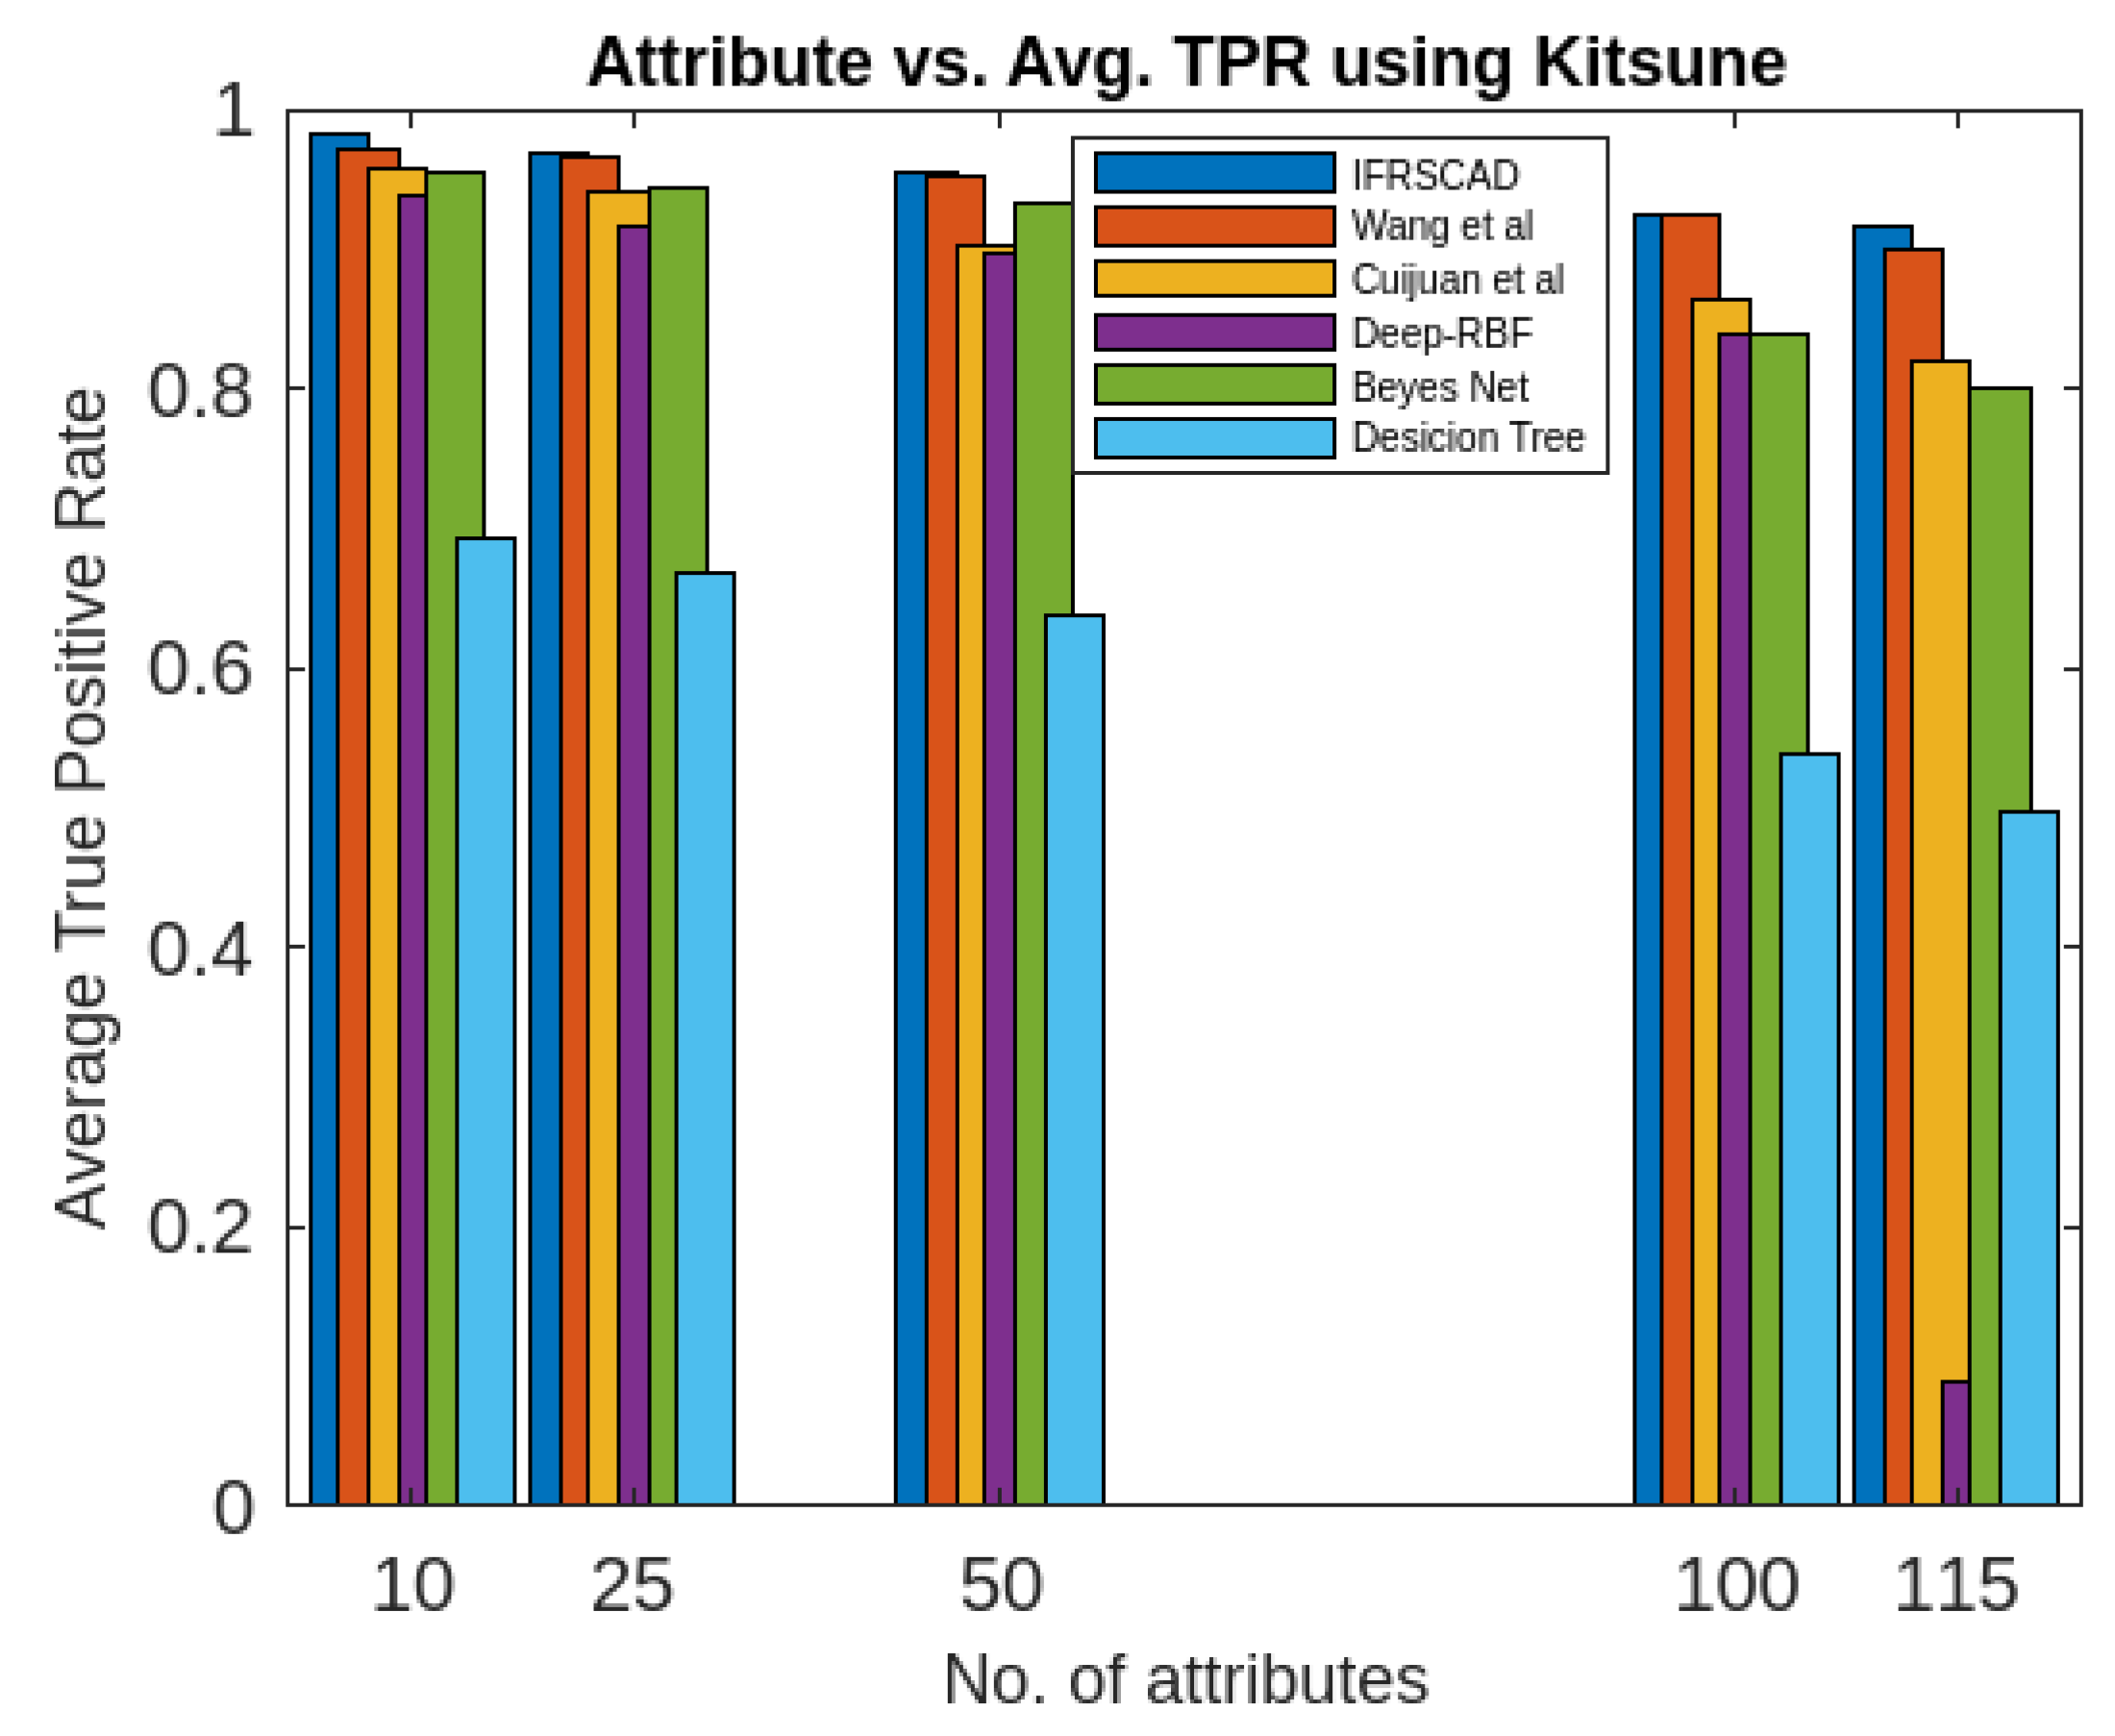
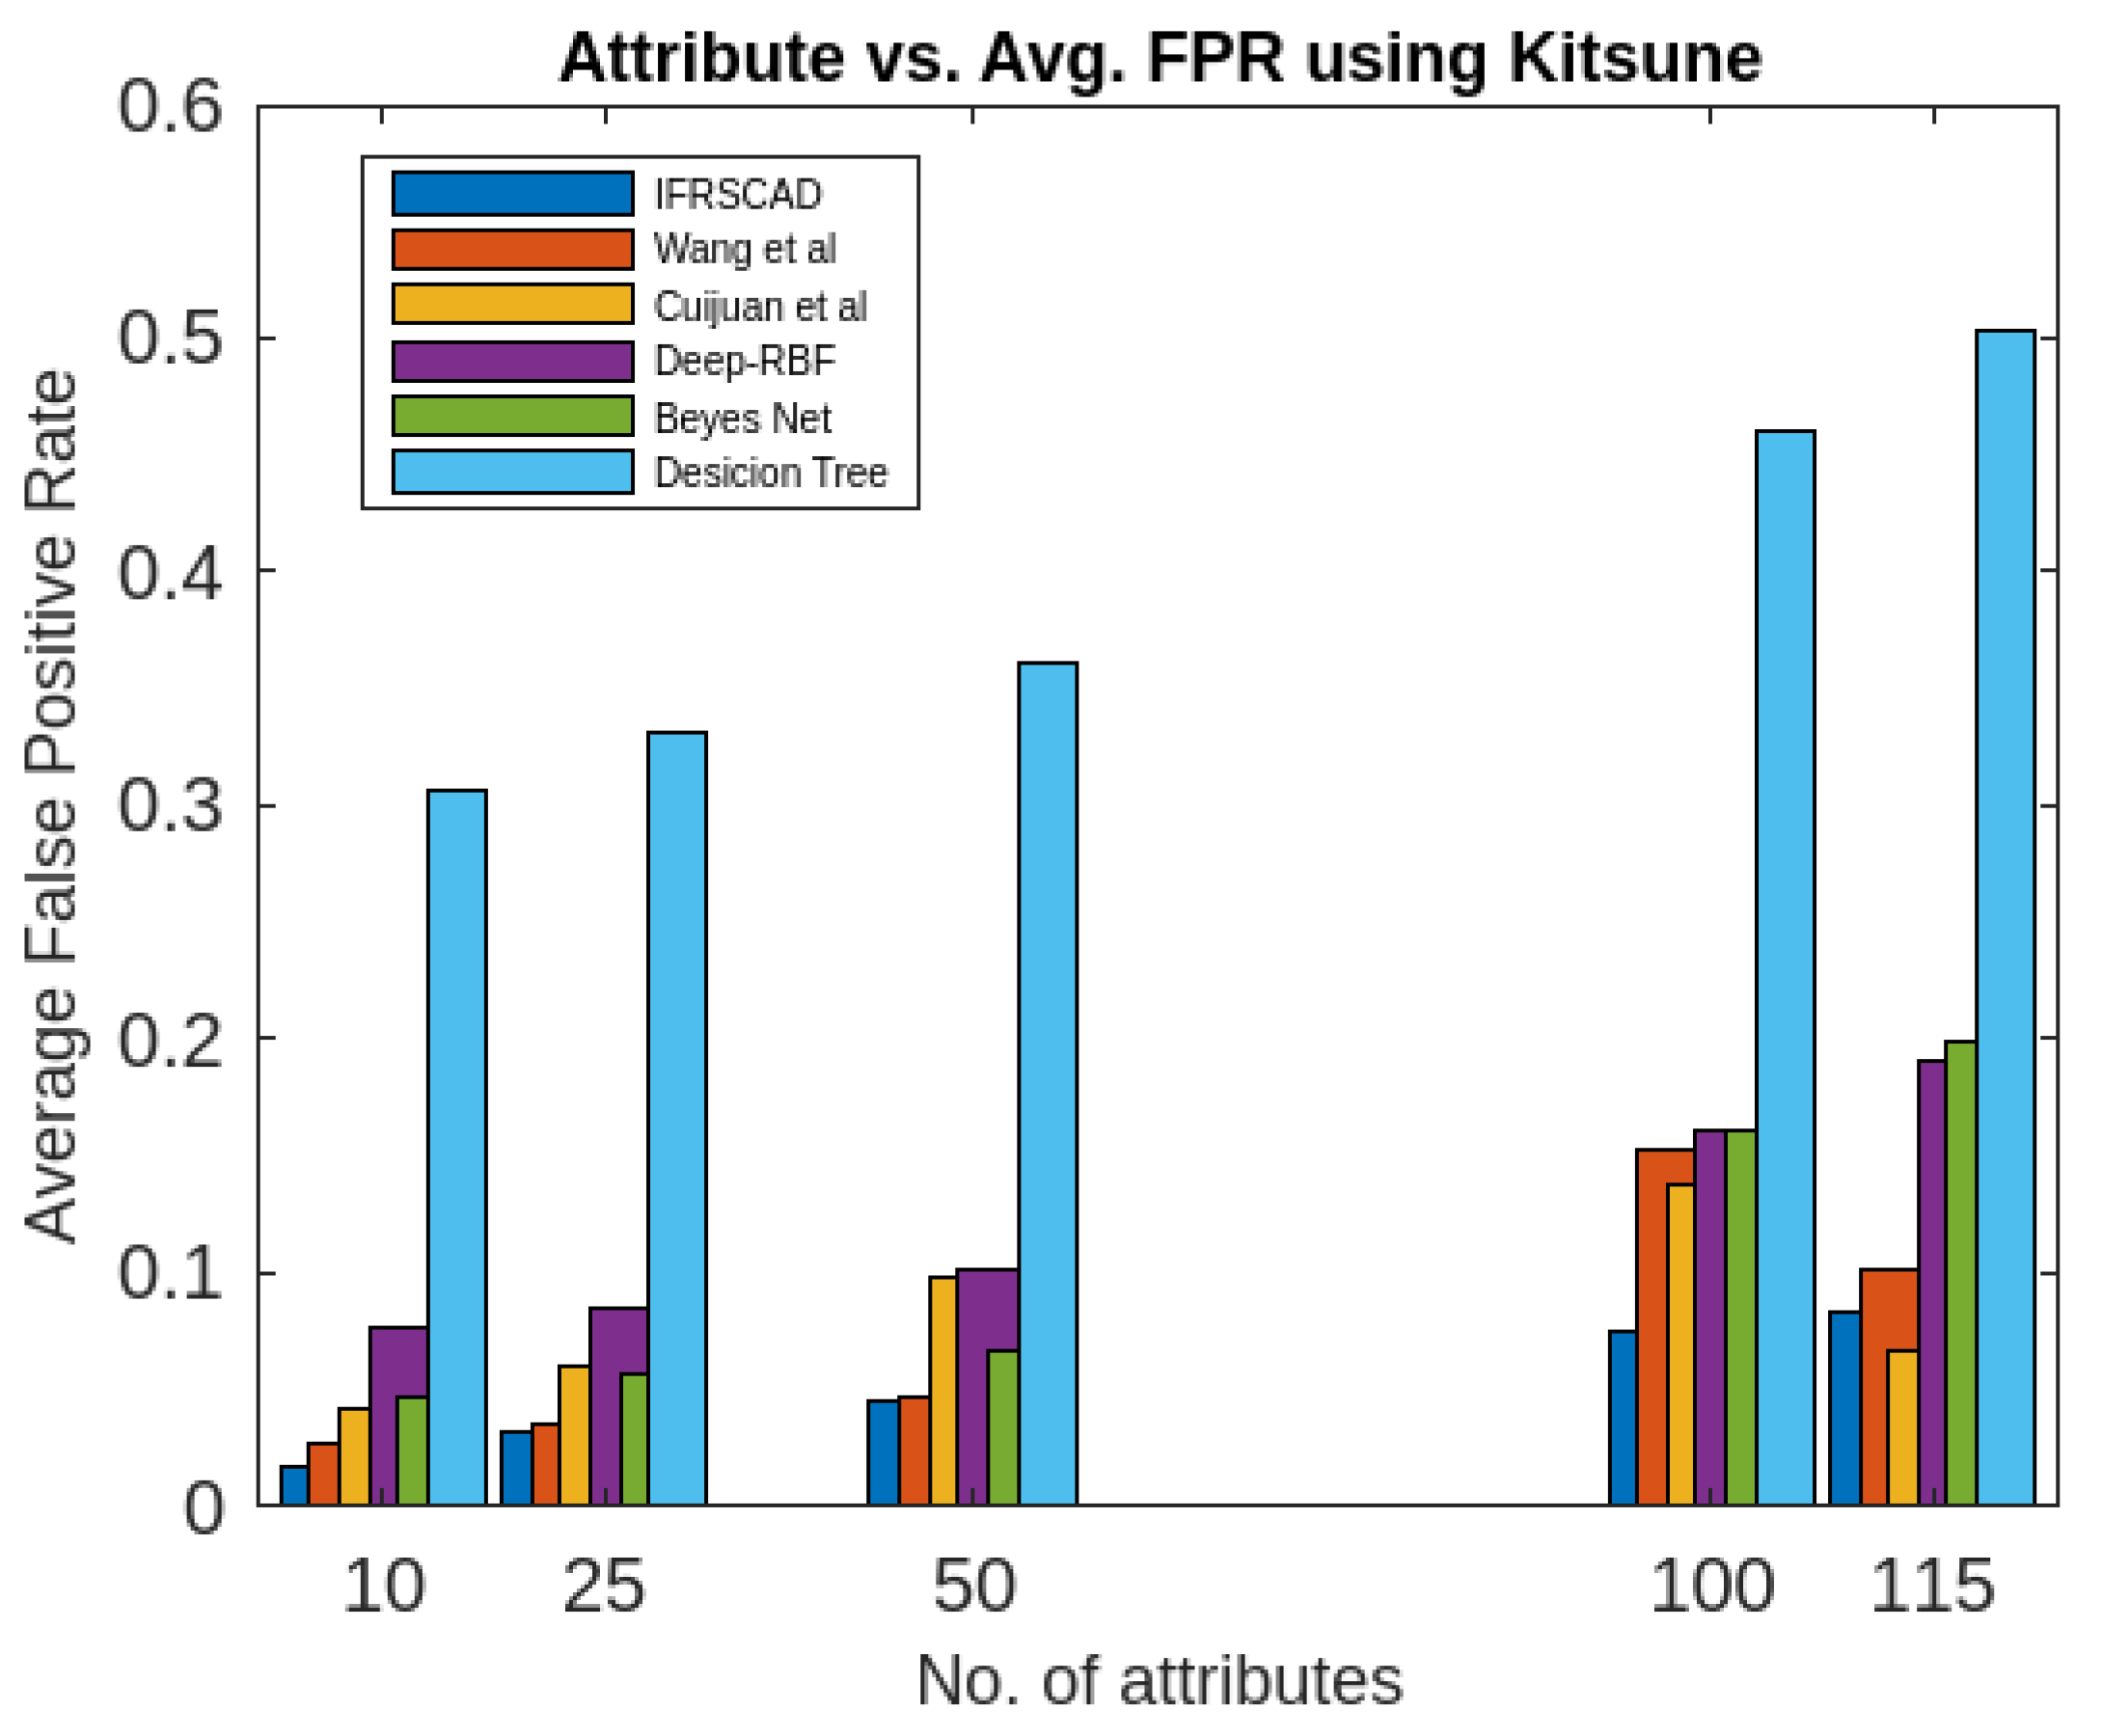
Similarly, a partial view of the results of the six algorithms describing the comparative analysis of Normal True Positive Rate, Attack True Positive Rate, Normal False Positive Rate, Attack False Positive Rate for different sizes of attribute-set of Kitsune Network Attack datasets is presented in Figure 8, Figure 9, Figure 10, Figure 11, Figure 12 and Figure 13.
The obtained results presented as a graphical forms offer the following observations:
  • The decision tree-based algorithm [13] has poorest detection rate. It has 71.31-66.45% of Normal TPR, 67.44-62.23% of Attack TPR, 29.69-33.51% of Normal FPR, and 32.56-37.71% of Attack FPR for ascending order of attribute sizes (from 10-41) of dataset KDDCUP’99 [44]. Similarly, it has 71.31-50.12% of Normal TPR, 67.45-49.34% of Attack TPR, 28.69-49.88% of Normal FPR, and 32.56-50.56% of Attack FPR for ascending order of attribute sizes (from 10-115) of dataset Kitsune [45]. It shows the algorithm has poorest performances and which decreases with the increase in dimension size of the dataset.
  • Deep-RBF Network-based algorithm [15] is better than the decision tree-based algorithm [13] and It has 94.25-90.24% of Normal TPR, 90.23-85.25% of Attack TPR, 5.75-9.75% of Normal FPR, and 9.75-14.75% of Attack FPR for ascending order of attribute sizes (from 10-41) of dataset KDDCUP’99 [44]. Similarly, it has 94.25-81.21% of Normal TPR, 93.11-80.56% of Attack TPR, 9.75-18.79% of Normal FPR, and 9.73-19.44% of Attack FPR for ascending order of attribute sizes (from 10-115) of dataset Kitsune [45].
  • Bayes Network-based algorithm [14] is better than Decision tree based algorithm [13] and Deep-RBF Network-based algorithm [15] in terms of detection rates. It has 85.87-93.13% of Normal TPR, 90.87-83.49% of Attack TPR, 4.13-6.87% of Normal FPR, and 9.136-16.51% of Attack FPR for ascending order of attribute sizes (from 10-41) of dataset KDDCUP’99 [44]. Similarly, it has 95.87-80.55% of Normal TPR, 94.8-79.53% of Attack TPR, 4.13-19.45% of Normal FPR, and 5.20-20.47% of Attack FPR for ascending order of attribute sizes (from 10-115) of dataset Kitsune [45]. Although the algorithm is quite efficient but its performance decreases with the increase in the dimension of datasets.
  • Cuijuan et al’s algorithm [16] is better than all the previous three algorithms as per as detection rates is concern. It has 97.75-93.25% of Normal TPR, 95.25-89.25% of Attack TPR, 3.20-5.807% of Normal FPR, and 4.25-10.75% of Attack FPR for ascending order of attribute sizes (from 10-41) of dataset KDDCUP’99 [44]. Similarly, it has 95.95-82.32% of Normal TPR, 95.75-89.25% of Attack TPR, 4.05-8.132% of Normal FPR, and 4.25-18.58% of Attack FPR for ascending order of attribute sizes (from 10-115) of dataset Kitsune [45]. Its performance also decreases proportionately with the increase in the dimension of datasets.
  • Wang et al’s algorithm [17] is the most efficient in comparison to all the aforesaid algorithms. It has 98.21-96.25% of Normal TPR, 96.21-93.25% of Attack TPR, 2.12-3.02% of Normal FPR, and 3.79-6.75% of Attack FPR for ascending order of attribute sizes (from 10-42) of dataset KDDCUP’99 [44]. Similarly, it has 98.20-90.44% of Normal TPR, 96.21-89.33% of Attack TPR, 1.79-9.56% of Normal FPR, and 3.79-10.67% of Attack FPR for ascending order of attribute sizes (from 10-115) of dataset Kitsune [45]. Its performance also decreases proportionately with the increase in the dimension of datasets.
  • The proposed algorithm (IFRSCAD) has 98.342-96.99% of Normal TPR, 98.04-96.29% of Attack TPR, 1.658-3.01% of Normal FPR, and 1.96-3.71% of Attack FPR for ascending order of attribute sizes (from 10-42) of dataset KDDCUP’99 [44]. Similarly, it has 98.351-91.989% of Normal TPR, 98.02-91.289% of Attack TPR, 1.658-8.011% of Normal FPR, and 1.96-8.711% of Attack FPR for ascending order of attribute sizes (from 10-115) of dataset Kitsune [45]. Its performance also decreases proportionately with the increase in the dimension of datasets. It is clear from the data that the proposed algorithm has more TPR and less FPR. The differences between Normal TPR and Attack TPR, Normal FPR and Attack FPR are also less in comparison other methods. The performance decrement is less with the increase in dimensions. Obviously, the proposed algorithm has mores average TPR and less average FPR than others.
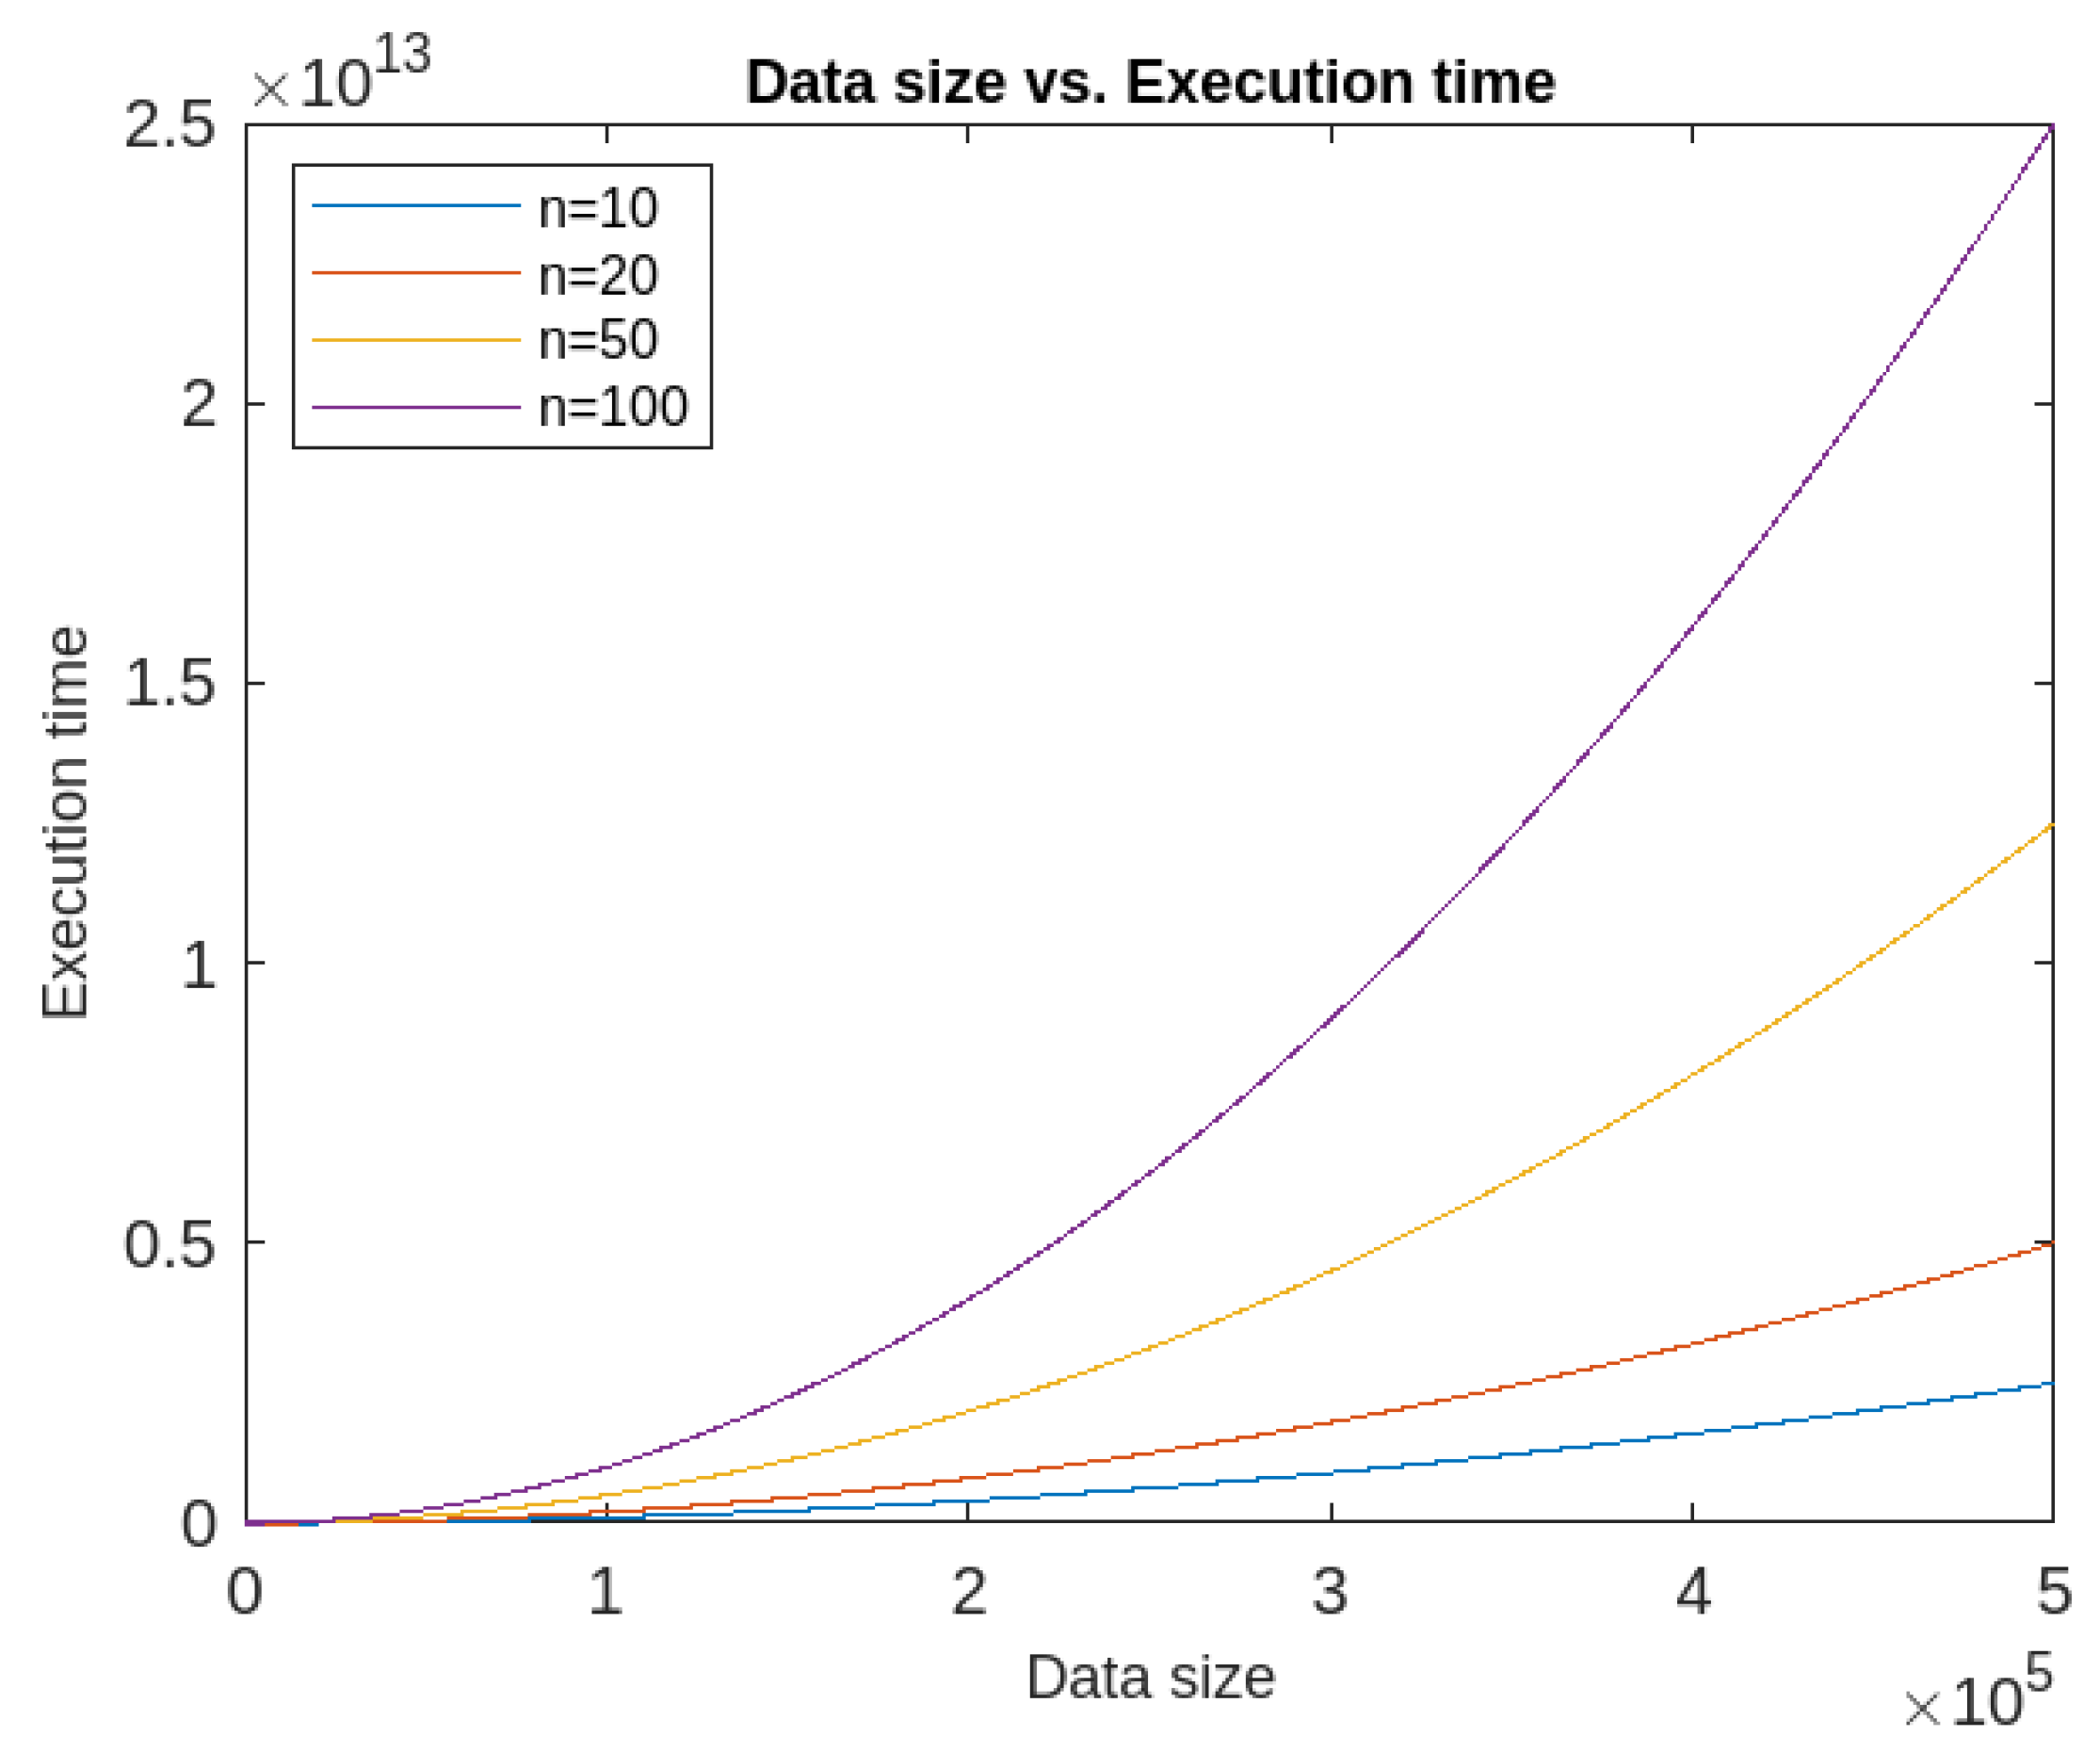
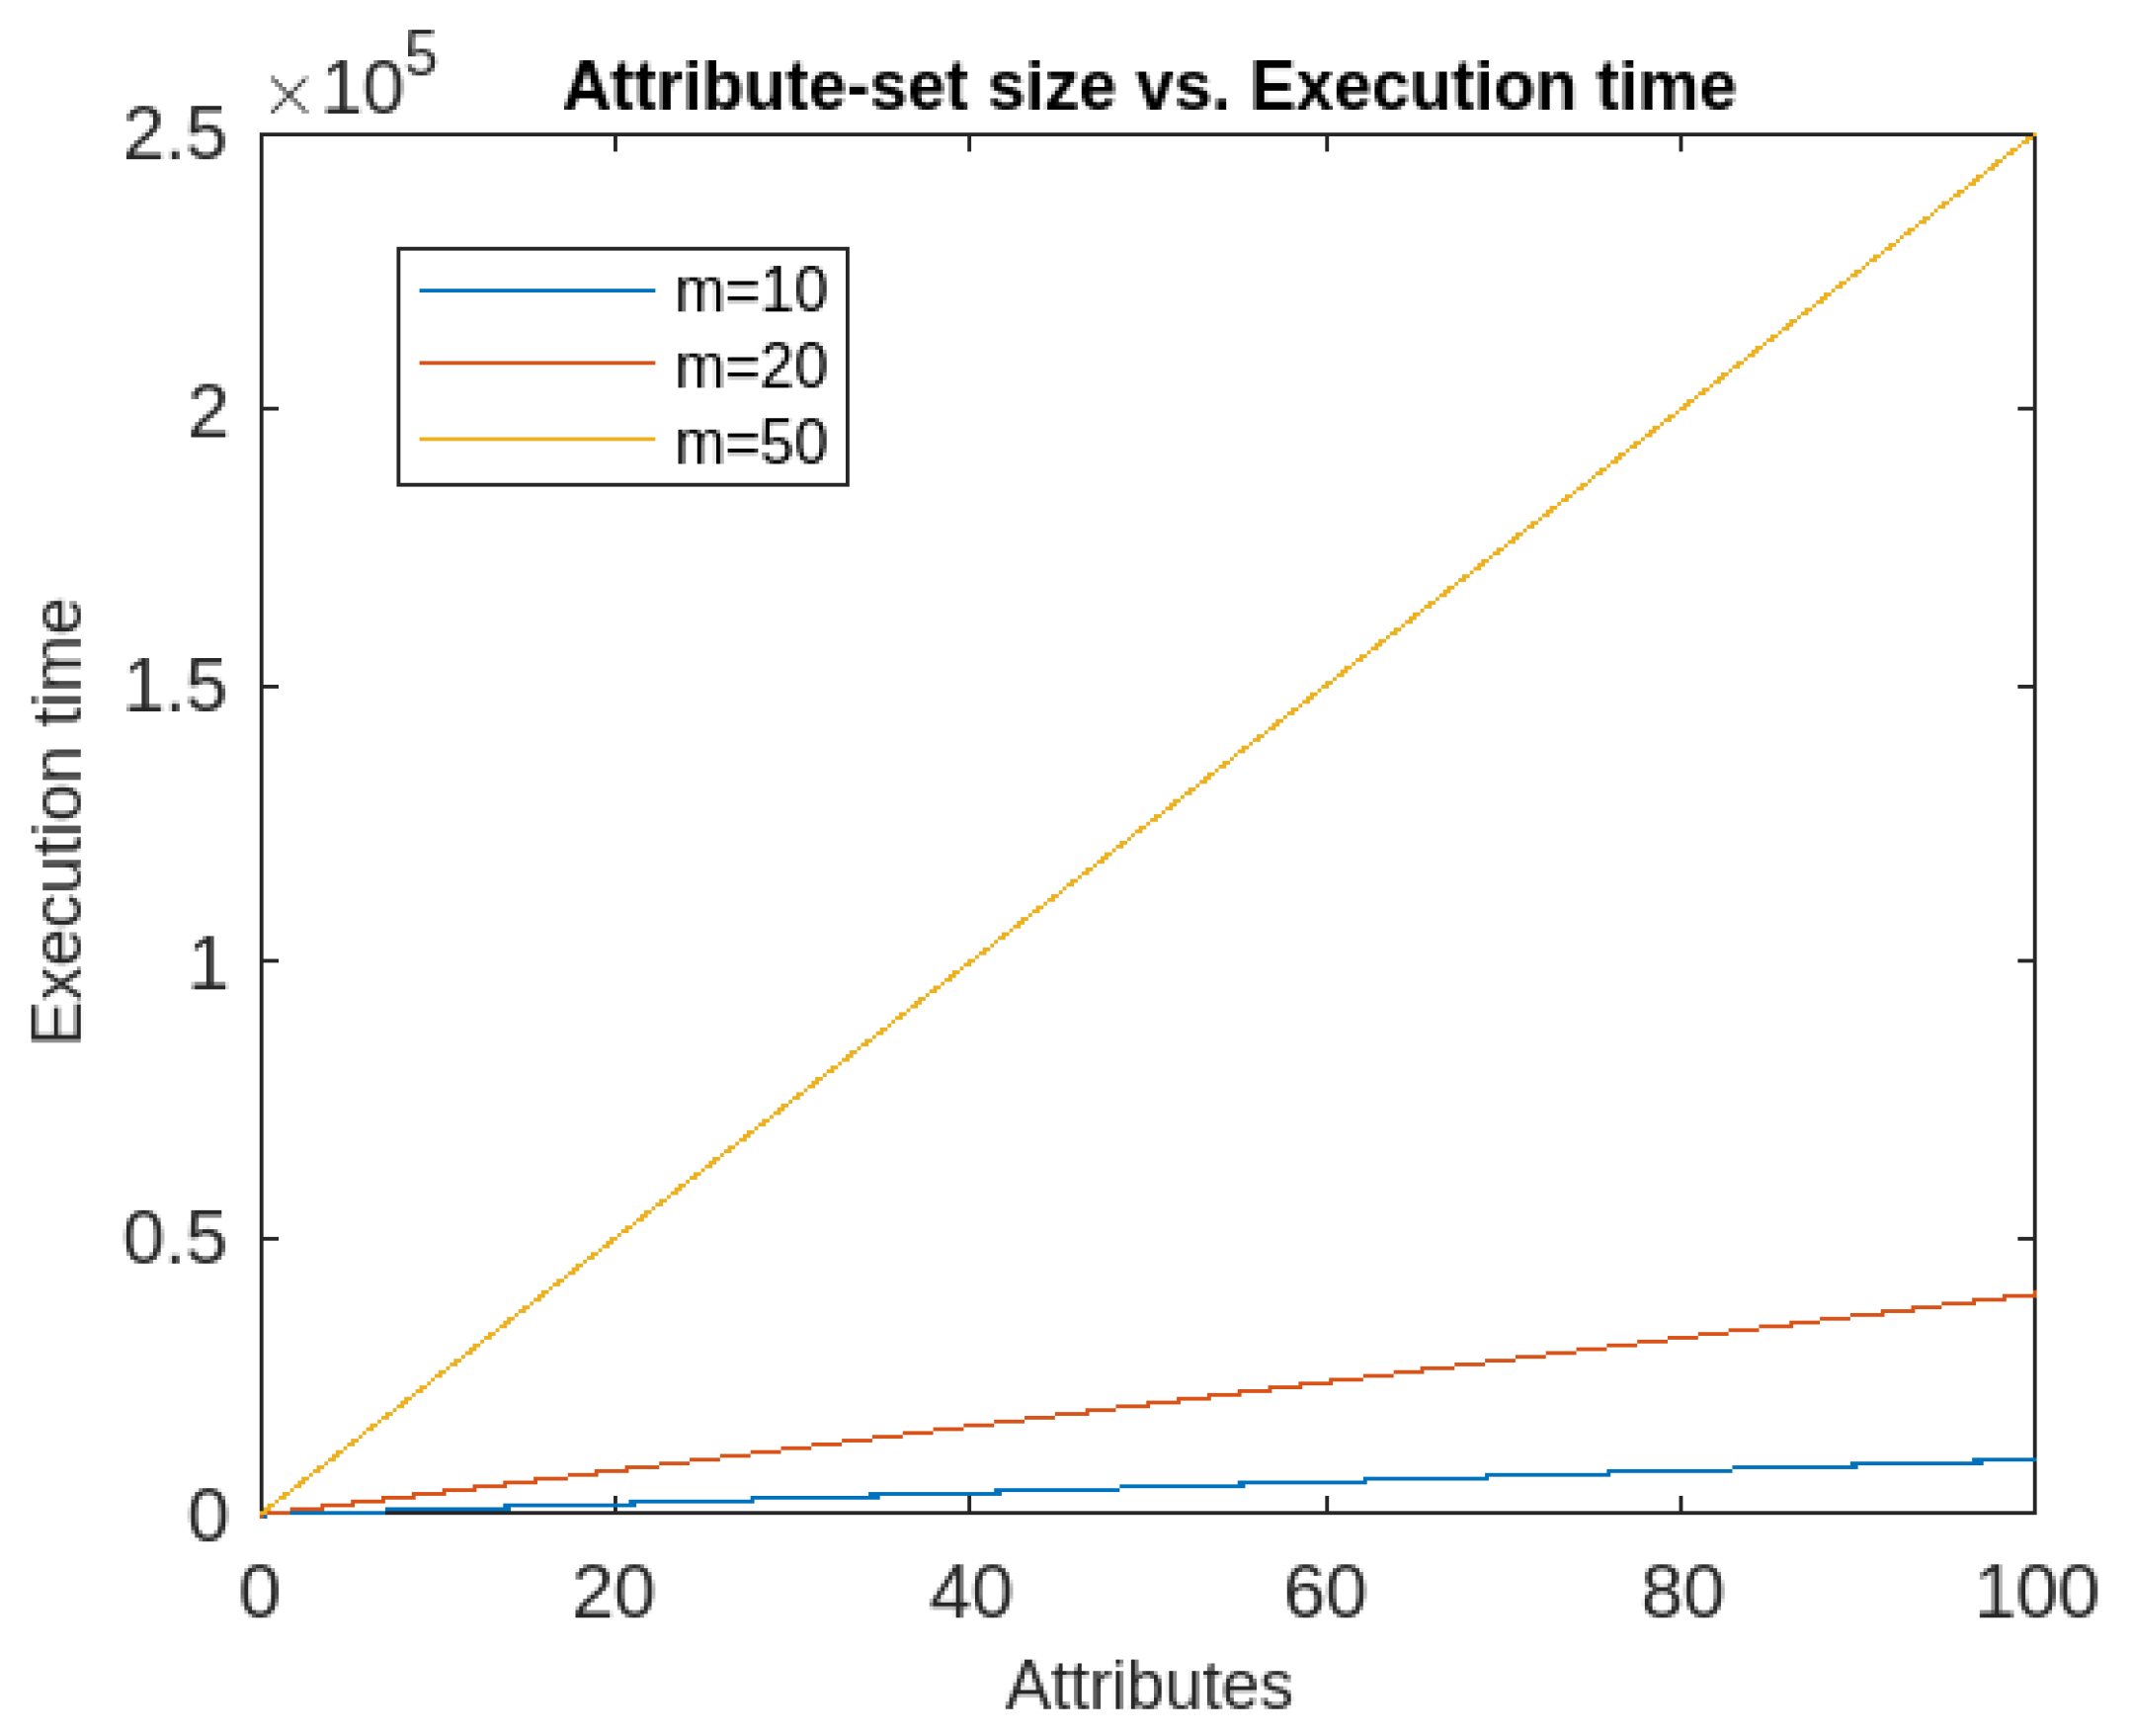
  • Also, the execution time of the proposed algorithm depends upon two factors namely dimension and size of the datasets. It has been found that if the dimension is kept constant, the algorithm has quadratic execution time, whereas if the data size is kept constant, it runs in linear time. So the proposed algorithm’s time complexity is more dependent on the data size than the number of attributes. The time-complexity graphs are given in Figure 14 and Figure 15.

7. Conclusions, Limitations and Lines for Future works

7.1. Conclusions

  • In this article, we have proposed an algorithm based on hybrid approach consisting both rough set theory and fuzzy set theory for the detection of anomaly.
  • The algorithm is a classification based algorithm which takes the advantages of softness property both rough and fuzzy set theory to deal with uncertainty in the dataset. The obtained rules can be expressed using intuitionistic fuzzy sets.
  • The proposed algorithm's performance is demonstrated by experimental analysis and with datasets KDD CUP'99 [44] network anomaly detection dataset and Kitsune [45] Network Attack dataset which shows that. The comparative analysis shows that the proposed algorithm outperforms a couple of well-known classification based algorithms.
  • Finally, the proposed algorithm’s time complexity is found to be less dependent on dimension of the dataset rather more dependent on the size of the datasets. However, detection rate depends more on dimensions as evident from the obtained results.

7.2. Limitations and Lines for Future work

Though the proposed algorithm performs very well, it has some limitations.
  • Firstly, although the run-time of the proposed algorithm is less dependent of dimension of dataset, it detection rate decreases proportionately with the increase in dimension.
  • Secondly, the algorithm lacks efficacy in dealing with continuous data as rough set can’t handle continuous data and finding correlation coefficient in continuous would be difficult.
  • Finally, the algorithm in current form is inefficient to deal with real time data
Future works can be possible in the following directions
  • Efficient algorithm can be design to find anomalies from high dimensional data with continuous attributes.
  • Efficient algorithm can be design to find real time anomalies in high-dimensional, heterogeneous data with continuous attributes.

Author Contributions

Conceptualization, F.A.M.; Methodology, F.A.M.; Software, F.A.M., M.S.; Validation, F.A.M., M.S.; Formal Analysis, F.A.M.; Investigation, F.A.M., M.S.; Resounce, F.A.M., M.S.; Data Curation, F.A.M., M.S.; Writing—original draft preparation, F.A.M., M.S.; writing—review and editing, F.A.M., M.S.; visualization, F.A.M.; supervision, F.A.M.; project administration, F.A.M., M.S.; funding acquisition, M.S. All authors have read and agreed to the published version of the manuscript.

Funding

On behalf of all the authors the corresponding author states that this research has received no funding from any external agency.

Data Availability Statement

The data, code and other materials can be made available on request.

Conflicts of Interest

There is no conflict of interest or competing interests among the authors.

References

  1. Kumar, V.; Banejee, A.; and Chandola, V.; Anomaly detection: A survey, ACM Computing Surveys, vol. 41, July 2009. [CrossRef]
  2. Hodge, V.; and Austin, J.; A survey of outlier detection methodologies, Artificial Intelligence Review, vol. 22, pp. 85-126, October 2004. [CrossRef]
  3. Jyothsna, V.; and Prasad, K. M,; Anomaly-Based Intrusion Detection System, Computer and Network Security, 2019.
  4. Jabez, J.; and Muthikumar, B.;, Intrusion Detection System (IDS): Anomaly Detection using Outlier Detection Approach, Procedia Computer Science 2015, 48, 338-346. [CrossRef]
  5. Abdulla Al Mamuna, S M ; and Valimaki, Juha,; Anomaly Detection and Classification in Cellular Networks Using Automatic Labeling Technique for Applying Supervised Learning, Procedia Computer Science 140, pp. 186–195, 2018. [CrossRef]
  6. Dasgupta, D.; and Majumdar, N. S.; Anomaly detection in multidimensional data using negative selection algorithm, Proceedings of the 2002 Congress - Volume 02, CEC ’02, pp. 1039–1044, USA, 2002. [CrossRef]
  7. Taha, A.; and Hadi, A. S.; Anomaly Detection Methods for Categorical Data: A Review. 1, 1, pp. 1-35, 2019. [CrossRef]
  8. Mazarbhuiya, F. A.; Alzaharani, M. Y.; and Lilia, G,; Anomaly Detection using Agglomerative Hierarchical Clustering Algorithm, Information Science and Application 2018, LNEE, Vol. 514, pp. 475-484, 2018. [CrossRef]
  9. Mazarbhuiya, F. A.; Alzaharani, M. Y.; and A. K. Mahanta, Detecting Anomaly Using Partitioning Clustering with Merging; ICIC Express Letters Vol. 14(10), Japan, pp. 951-960, 2020. [CrossRef]
  10. Mazarbhuiya, F. A.; Detecting Anomaly using Neighborhood Rough Set based Classification Approach, ICIC Express Letters, Vol. 17(1), January, 2023. [CrossRef]
  11. Pujari, A. K.; Data Mining Techniques, University Press, 2001.
  12. Mazarbhuiya, F.A. Detecting Anomaly using Neighborhood Rough Set based Classification Approach. ICIC Express Lett. 2023, 17, 73–80. [Google Scholar] [CrossRef]
  13. Panasov, V L; and Nechitaylo, N M,; Decision Trees-based Anomaly Detection in Computer Assessment Results, Journal of Physics: Conference Series 2001 (2021) 012033, IOP Publishing. [CrossRef]
  14. Dufraisse, E.; Leray, P.; Nedellec, R.; and Benkhelif, T.; Interactive Anomaly Detection in Mixed Tabular Data using Bayesian Networks, 10th International Conference on Probabilistic Graphical Models (PGM 2020), Sep 2020, Aalborg, Denmark. ffhal-03014622f.
  15. Matthew Burruss, Shreyas Ramakrishna, and Abhishek Dubey, “Deep-RBF Networks for Anomaly Detection in Automotive Cyber-Physical Systems”, Autonomous Driving and Assured Autonomy, August 2021. [CrossRef]
  16. Liu Cuijuan, Li Yuanyuan, and Qin Yankai, Research on Anomaly Intrusion Detection Based on Rough Set Attribute Reduction, Proceedings of 2nd International Conference on Computer Application and System Modeling (2012), Published by Atlantis Press, Paris, France, pp. 607-610, 2012. [CrossRef]
  17. J. Wang, H. Zhao, J. Xu, H. Li, H. Zhu, S. Chao, C. Zheng, Using Intuitionistic Fuzzy Set for Anomaly Detection of Network Traffic from Flow Interaction, IEEE Access, Vol. 4, 2016, pp. 596–601. [CrossRef]
  18. Mazarbhuiya, F.A.; AlZahrani, M.Y.; Georgieva, L. Anomaly Detection Using Agglomerative Hierarchical Clustering Algorithm; ICISA 2018; Lecture Notes on Electrical Engineering (LNEE); Springer: Hong Kong, 2019; Volume 514, pp. 475–484. [Google Scholar] [CrossRef]
  19. Linquan, X.; Wang, W.; Liping, C.; Guangxue, Y. An Anomaly Detection Method Based on Fuzzy C-means Clustering Algorithm. In Proceedings of the Second International Symposium on Networking and Network Security, Jinggangshan, China, 2–4 April 2010; pp. 089–092. [Google Scholar]
  20. Mazarbhuiya, F.A.; AlZahrani, M.Y.; Mahanta, A.K. Detecting Anomaly Using Partitioning Clustering with Merging. ICIC Express Lett. 2020, 14, 951–960. [Google Scholar]
  21. Retting, L.; Khayati, M.; Cudre-Mauroux, P.; Piorkowski, M. Online anomaly detection over Big Data streams. In Proceedings of the 2015 IEEE International Conference on Big Data, Santa Clara, CA, USA, 29 October–1 November 2015. [Google Scholar] [CrossRef]
  22. Alguliyev, R.; Aliguliyev, R.; Sukhostat, L. Anomaly Detection in Big Data based on Clustering. Stat. Optim. Inf. Comput. 2017, 5, 325–340. [Google Scholar] [CrossRef]
  23. Alghawli, A.S. Complex methods detect anomalies in real time based on time series analysis. Alex. Eng. J. 2022, 61, 549–561. [Google Scholar] [CrossRef]
  24. Kim, B.; Alawami, M.A.; Kim, E.; Oh, S.; Park, J.; Kim, H. A Comparative Study of Time Series Anomaly Detection, Models for Industrial Control Systems. Sensors 2023, 23, 1310. [Google Scholar] [CrossRef] [PubMed]
  25. Wang, B.; Hua, Q.; Zhang, H.; Tan, X.; Nan, Y.; Chen, R.; Shu, X. Research on anomaly detection and real-time reliability evaluation with the log of cloud platform. Alex. Eng. J. 2022, 61, 7183–7193. [Google Scholar] [CrossRef]
  26. Halstead, B.; Koh, Y.S.; Riddle, P.; Pechenizkiy, M.; Bifet, A. Combining Diverse Meta-Features to Accurately Identify Recurring Concept Drit in Data Streams. ACM Trans. Knowl. Discov. Data 2023. [Google Scholar] [CrossRef]
  27. Habeeb, R.A.A.; Nasauddin, F.; Gani, A.; Hashem, I.A.T.; Amanullah, A.M.E.; Imran, M. Clustering-based real-time anomaly detection—A breakthrough in big data technologies. Trans. Emerg. Telecommun. Technol. 2022, 33, e3647. [Google Scholar] [CrossRef]
  28. Mazarbhuiya, F. A.; Shenify, M.; A Mixed Clustering Approach for Real-Time Anomaly Detection, Appl. Sci. 2023, 13, 4151. [CrossRef]
  29. L. A. Zadeh,” Fuzzy Sets as Basis of Theory of Possibility”, Fuzzy Sets and Systems 1, (1965), pp. 3-28. [CrossRef]
  30. K. T. Atanassov, “Intuitionistic fuzzy sets”. Fuzzy Sets and Systems, 20(1), (1986), pp. 87–96.
  31. T. Gerstenkorn, and J. Manko, “Correlation of Intuitionistic fuzzy sets”, Fuzzy Sets and Systems, vol. 44, 1991, pp. 29-43. [CrossRef]
  32. L. A. Zadeh, Similarity relations and fuzzy orderings, Information Science, Vol. 3, 1971, pp 177-200. [CrossRef]
  33. S. R. Kannan, and R. K. Mohapatra, New notions for fuzzy equivalence using α-cut relation, IOP Conf. Series: Journal of Physics: Conf. Series, 1344, 2019, pp. 1-9. [CrossRef]
  34. Z. Pawlak, Rough sets, International Journal of Computer and Information Sciences, vol. 11, pp. 341–356, 1982. [CrossRef]
  35. Robert, R. Nowicki, Rough Set Based Classification Systems, Springer, 2019. [CrossRef]
  36. El M. Maroune, and Z. Elhoussaine, A fuzzy neighborhood rough set method for anomaly detection in large scale data, International Journal of Artificial Intelligence, Vol. 9(1), pp. 1-10, March 2020. [CrossRef]
  37. Yuwen Li, Shoushui Wei, Xing Liu, and Zhimin Zhang, A Novel Robust Fuzzy Rough Set Model for Feature Selection, Conplexity, Hindawi, 2021, pp. 1-12. [CrossRef]
  38. M. L. Thivagar, C. Richard, On nano forms of weakly open sets. International Journal of Mathematics and Statistics Invention. 1(1), pp. 31–37, 2013.
  39. M. Lellis Thivagar, and S.P.R. Priyalatha, Medical diagnosis in an indiscernibility matrix based on nano topology, Cogent Mathematics (2017), 4: 1330180, pp. 1-9. [CrossRef]
  40. M. A. Al Shumrani, S. Topal, F. Smarandache, and C. Ozel, Covering-Based Rough Fuzzy, Intuitionistic Fuzzy and Neutrosophic Nano Topology and Applications, IEEE Access, Vo. 7, December, 2019, pp. 172839-172846. [CrossRef]
  41. D. Dubois and H. Prade, Rough fuzzy sets and fuzzy rough sets, Int. J. Gen. Syst., vol. 17, no. 2/3, pp. 191–209, Jun. 1990. [CrossRef]
  42. P. Maji, and S. Pal, Fuzzy–Rough Sets for Information Measures and Selection of Relevant Genes from Microarray Data, IEEE Transactions on Systems, man, and cybernetics—part b: cybernetics, vol. 40, no. 3, june 2010. [CrossRef]
  43. W. Chimphlee, H. Abdulla, M. H. M. Noor, and S. Srinoy, Anomaly-based intrusion detection using Fuzzy-Rough Clustering, Proc. of ICHIT 2006, IEEE Explore, South Korea. [CrossRef]
  44. KDD Cup’99 Data, http://kdd.ics.uci.edu/databases/kddcup99/kddcup99.html (accessed on 15 January 2020).
  45. Kitsune Network Attack dataset, https://github.com/ymirsky/Kitsune-py (accessed 12 December 2021).
  46. E. G. Eman, An operation on intuitionistic Fuzzy Matrices, Filomat 34(1), 2020, pp. 79-88. [CrossRef]
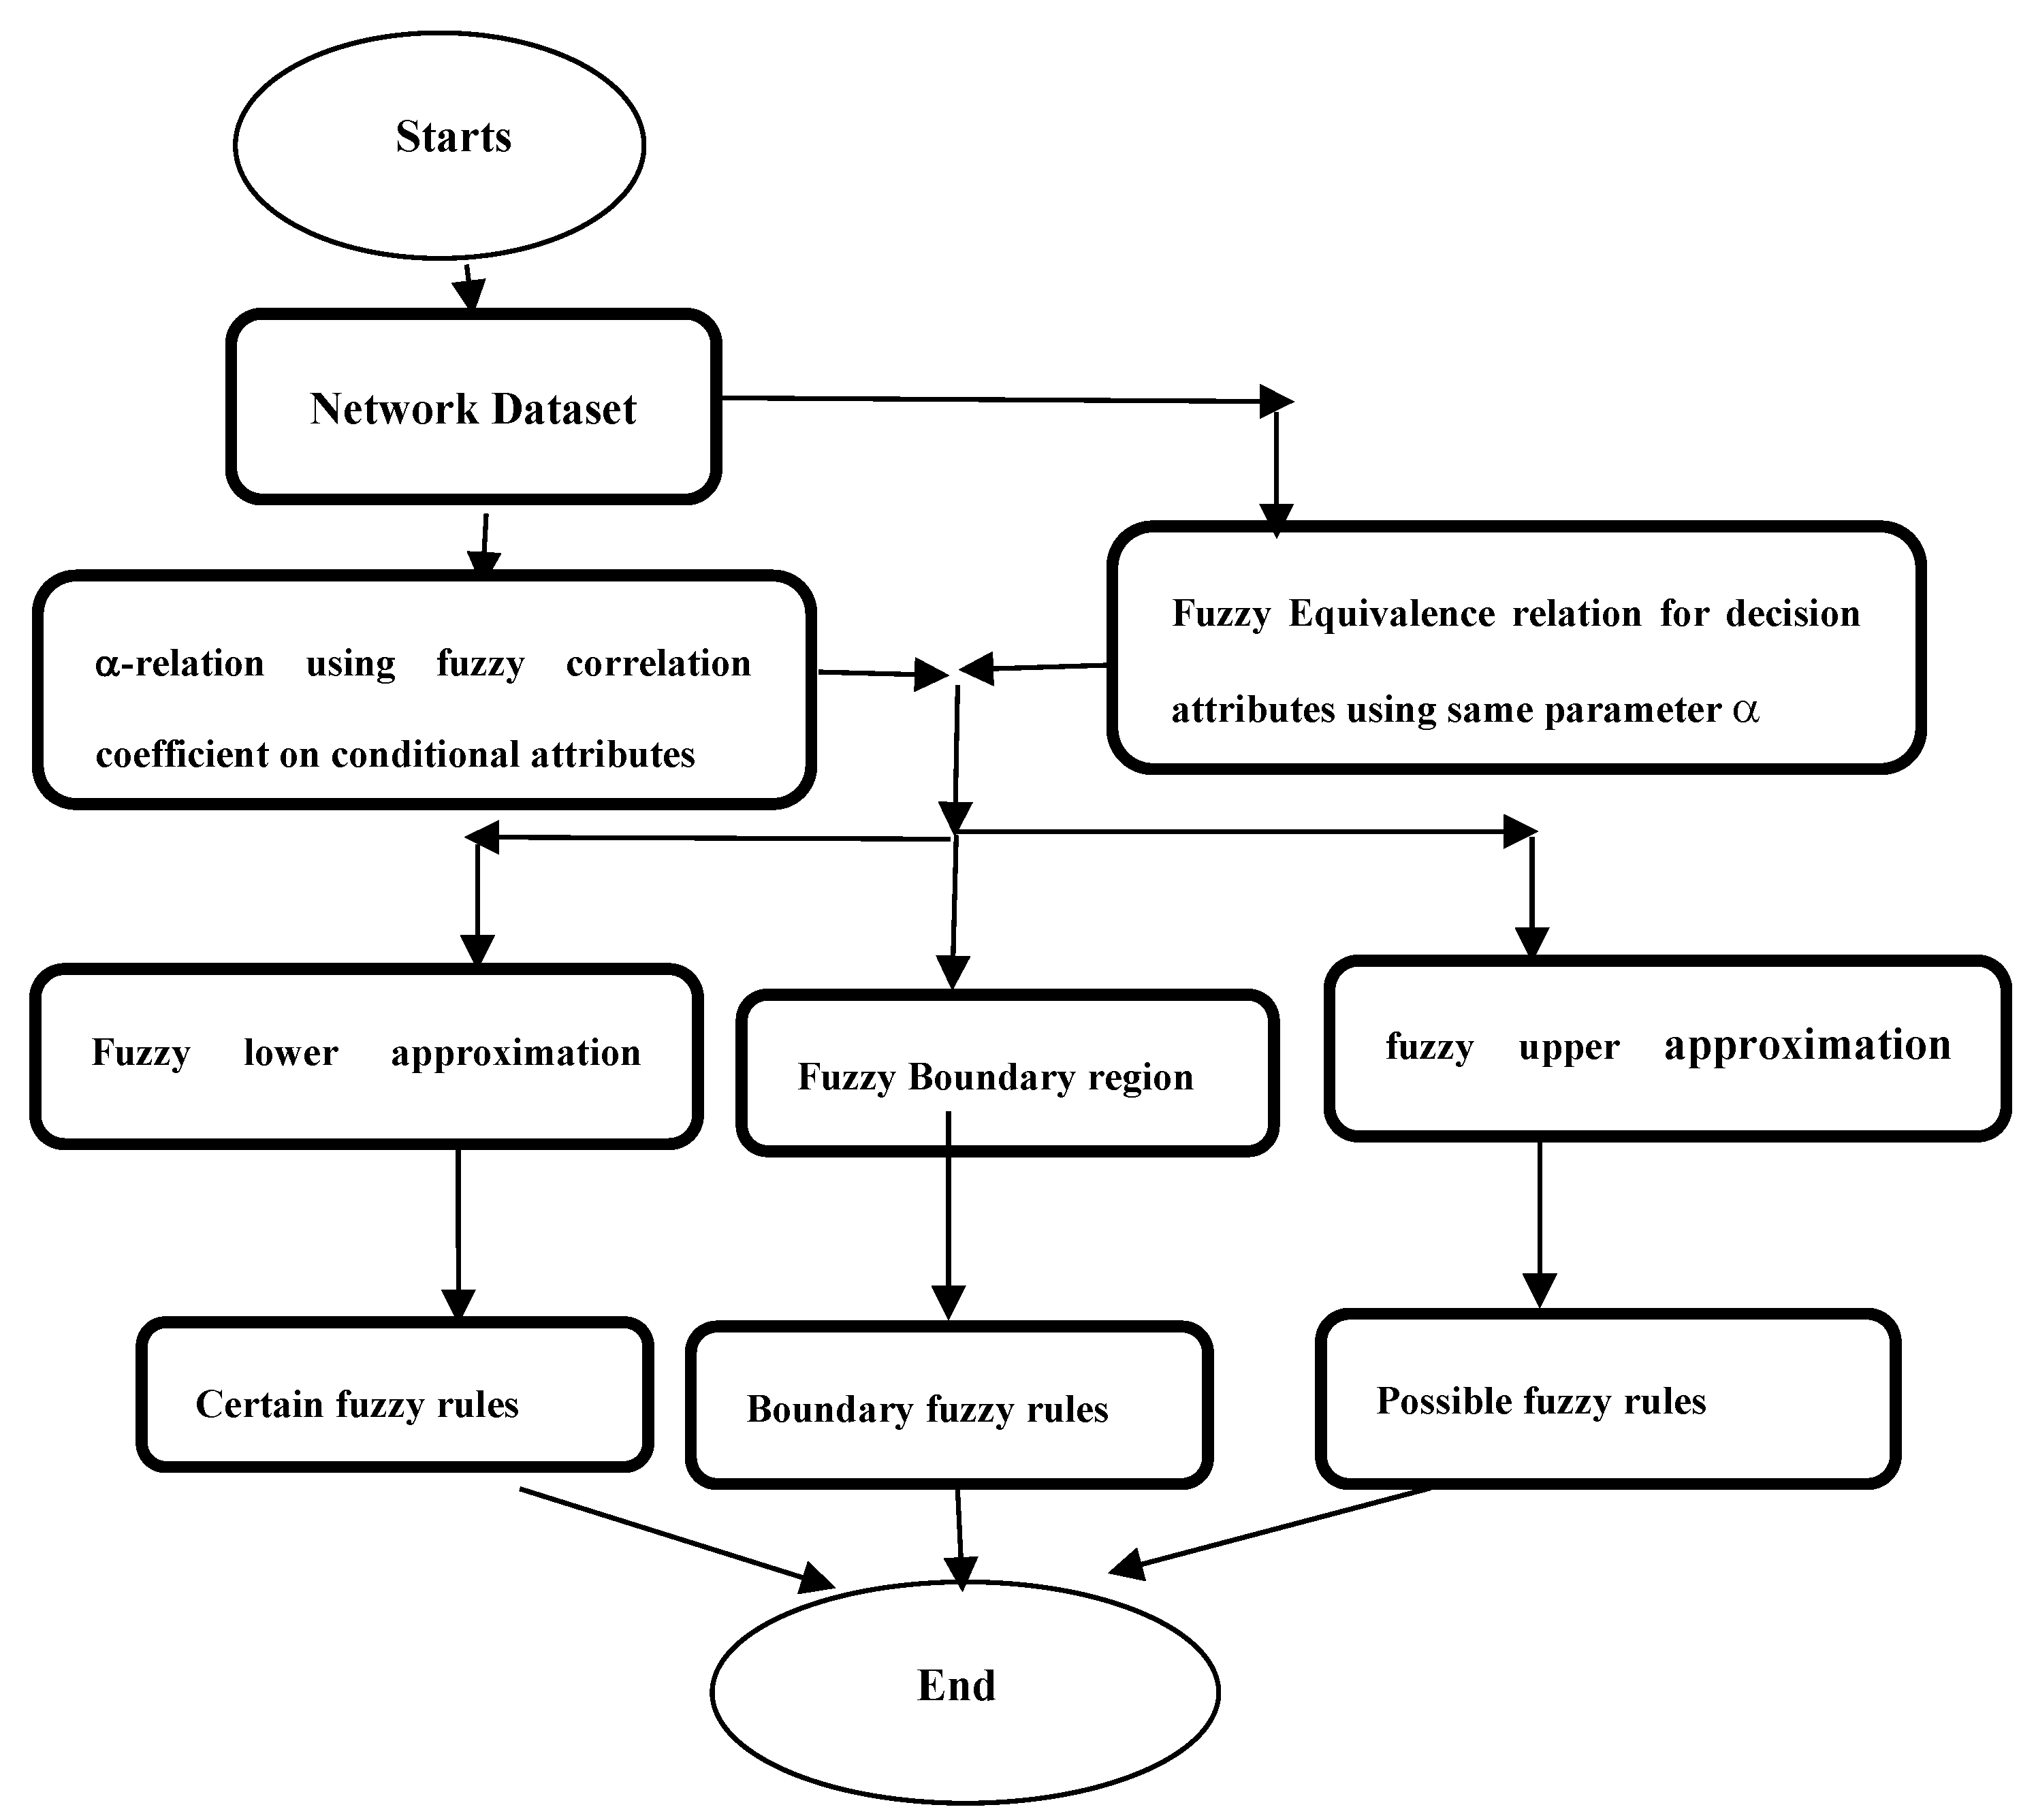
Figure 1. Flowchart of the proposed algorithm
Preprints 70227 g001
Figure 2. Comparative analysis of Normal True Positive Rates of different algorithms using KDDCUP’99
Preprints 70227 g002
Figure 3. Comparative analysis of Attack True Positive Rates of different algorithms using KDDCUP’99
Preprints 70227 g003
Figure 4. Comparative analysis of Normal False Positive Rates of different algorithms using KDDCUP’99
Preprints 70227 g004
Figure 5. Comparative analysis of Attack False Positive Rates of different algorithms using KDDCUP’99
Preprints 70227 g005
Figure 6. Comparative analysis of Average True Positive Rates of different algorithms using KDDCUP’99
Preprints 70227 g006
Figure 7. Comparative analysis of Average False Positive Rates of different algorithms using KDDCUP’99
Preprints 70227 g007
Figure 8. Comparative analysis of Normal True Positive Rates of different algorithms using Kitsune
Preprints 70227 g008
Figure 9. Comparative analysis of Attack True Positive Rates of different algorithms using Kitsune
Preprints 70227 g009
Figure 10. Comparing analysis of Normal False Positive Rates of different algorithms using Kitsune
Preprints 70227 g010
Figure 11. Comparing analysis of Attack False Positive Rates of different algorithms using Kitsune
Preprints 70227 g011
Figure 12. Comparing analysis of Average True Positive Rates of different algorithms using Kitsune
Preprints 70227 g012
Figure 13. Comparing analysis of Average False Positive Rates of different algorithms using Kitsune
Preprints 70227 g013
Figure 14. Execution time of IFRSCAD for different dimensions (n)
Preprints 70227 g014
Figure 15. Execution time of IFRSCAD for different data sizes (m)
Preprints 70227 g015
Table 1. Dataset’s description.
Dataset Dataset Characteristics Attribute Characteristics No. of Instances No. of Attributes
KDDCUP’99 Network Anomaly Multivariate Numeric, categorical, temporal 4,898,431 41
Kitsune Network Attack Multivariate, sequential, time-series Real, temporal 27,170,754 115
Disclaimer/Publisher’s Note: The statements, opinions and data contained in all publications are solely those of the individual author(s) and contributor(s) and not of MDPI and/or the editor(s). MDPI and/or the editor(s) disclaim responsibility for any injury to people or property resulting from any ideas, methods, instructions or products referred to in the content.
Copyright: This open access article is published under a Creative Commons CC BY 4.0 license, which permit the free download, distribution, and reuse, provided that the author and preprint are cited in any reuse.
Prerpints.org logo

Preprints.org is a free preprint server supported by MDPI in Basel, Switzerland.

Subscribe

© 2024 MDPI (Basel, Switzerland) unless otherwise stated