Preprint
Review

Measurements of the Cross Section for The tt¯ Heavy-flavor Production at the LHC+

Altmetrics

Downloads

83

Views

16

Comments

0

A peer-reviewed article of this preprint also exists.

This version is not peer-reviewed

Submitted:

22 March 2023

Posted:

29 March 2023

You are already at the latest version

Alerts
Abstract
At the LHC, the process of a Higgs boson decaying into bottom or charm quarks produced in association with a pair of top quarks, tt¯H, allows for an empirical exploration of the heavy-flavor quark Yukawa couplings to the Higgs boson. Accordingly, the cross sections for the tt¯ + heavy-flavor production without the appearance of the Higgs boson have been measured at the LHC in various phase spaces using data samples collected in pp collisions at s = 7, 8 and 13 TeV with the ATLAS and CMS experiments. Flavor ratios of cross sections of tt¯ + additional jets processes with different flavors are also measured. In this paper, the measured cross sections and ratios are reviewed and the prospects with more data are presented.
Keywords: 
Subject: Physical Sciences  -   Atomic and Molecular Physics

1. Introduction

Decades of theoretical and experimental exploration of the most elementary particles and their properties yielded a detailed description of fundamental interactions, captured in a quantum field framework known as the Standard Model of particle physics. The success of this model in describing observations over many orders of magnitude in interaction energy cannot be overestimated. However, on the way to a profound understanding, the research field faces several problems and mysteries. Some are related to cosmological observations of dark matter in the universe and the ubiquity of matter over antimatter, some to the mathematical consistency of the model itself with respect to even the smallest variations in its parameters. Several puzzling features are related to the flavor structure of the Standard Model of particle physics, not least those present in the heavy-flavor sector. Through accurate measurements, we try to find cracks in the model where theoretical predictions would not match experimental observations. These discoveries may open new avenues to address the open problems and mysteries, either within the realm of quantum field theory or even by questioning the basic principles underlying this mathematical framework.
After the Higgs (H) boson discovery in 2012, the consistency check with the H boson in the standard model was one of the highest priorities at the Large Hadron Collider (LHC), especially in the heavy-flavor sector. From analyzing the proton collision data of the LHC, the couplings of a top quark and a bottom quark (third generation quarks) in the standard model with the H boson were discovered in different processes [1,2]. However, the confirmation that both couplings are simultaneously consistent with the predictions, is only possible at the LHC by measuring the unique process of the H boson production in association with a t t ¯ pair ( t t ¯ H ), where the H boson decays to a pair of bottom (b) quarks. This process has yet to be discovered in the data, leading to a t t ¯ b b ¯ final state. Understanding the t t ¯ b b ¯ process in proton collisions without the presence of a H boson is a prerequisite to the discovery. In addition, the charm (c) jets in the t t ¯ c c ¯ process can also be misidentified as b jets, inducing a background in analogy of the t t ¯ b b ¯ process. Therefore, the measurements of cross sections of the t t ¯ +heavy-flavor process at the LHC are essential, yet challenging objectives.
Calculations of the inclusive production cross section for top quark pairs with additional jets have been performed to next-to-leading-order (NLO) precision in quantum chromodynamics (QCD) [3,4]. Theoretical QCD calculations of the t t ¯ b b ¯ process are available at next-to-leading-order (NLO) [5,6,7,8,9,10,11] but they suffer from large factorization and renormalization uncertainties due to the presence of two very different scales in this process. Therefore, precise measurements can also provide a good test of NLO QCD theory in itself.
The cross sections for the t t ¯ + heavy-flavor production have been measured in various phase spaces using data samples collected in pp collisions by the ATLAS and CMS experiments at s = 7, 8 and 13 TeV [12,13,14,15,16,17,18,19,20]. In order to obtain observable cross-section values, certain kinematic thresholds should be applied to the additional heavy-flavor jets. The interplay between the b jets from the top quark decay with the additional heavy-flavor jets is not trivial and accordingly, the definition of the signal is challenging. The definitions are different in each measurement and between experiments. We will discuss the definitions in Section 2 in more detail. In order to achieve higher precision, flavor ratios of cross sections of t t ¯ + additional jets processes with different flavors are also measured. The cross-section ratio measurement was originally motivated as many kinematic distributions are expected to be similar for t t ¯ b b ¯ , t t ¯ c c ¯ and t t ¯ j j ¯ leading to reduced systematic uncertainties in the ratio.
Most measurements focus on the t t ¯ b b ¯ cross-section. The t t ¯ c c ¯ process has been explored less due to the fact that the experimental signature of a c jet is sandwiched between that of b jets and light quark jets and gluons. With the recent development of charm jet taggers, the t t ¯ b b ¯ and t t ¯ c c ¯ processes can be more efficiently distinguished and the t t ¯ c c ¯ cross-section has now been measured by CMS.
In this experimental review, we summarize the results for the inclusive and differential cross-section measurements of t t ¯ + heavy-flavor production at the LHC submitted to journals before February 2023.

2. Definition of the t t ¯ +heavy-flavor signal

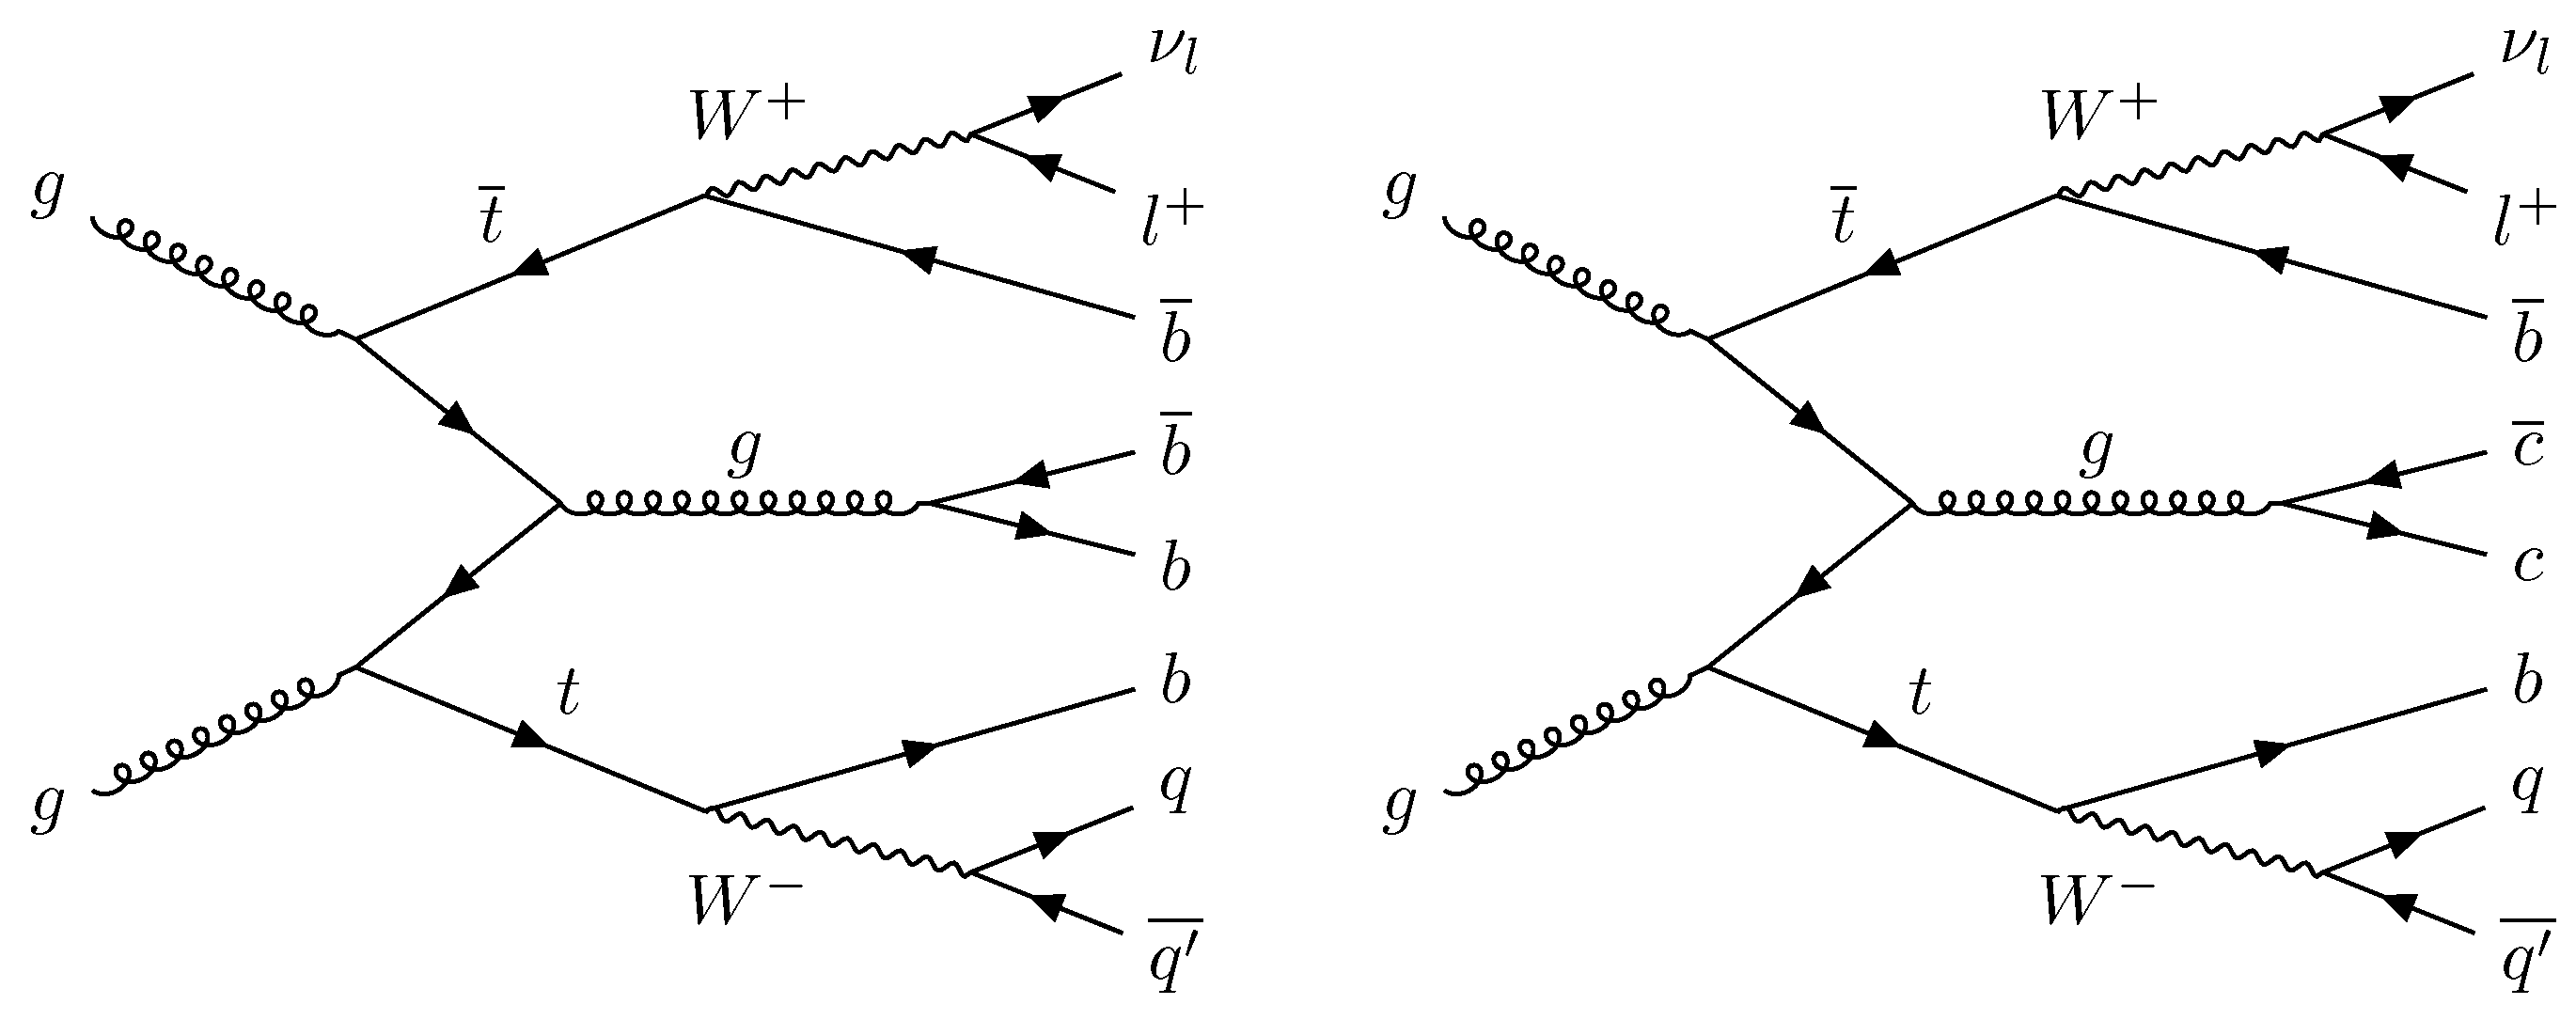
The measurements of the t t ¯ b b ¯ and t t ¯ c c ¯ cross sections are performed for both regions of the visible and the full phase space. The resulting cross-sections at the particle level in the visible phase space have reduced theoretical and modeling uncertainties while the purpose of performing the measurement in the full phase is to facilitate comparisons to theoretical calculations or measurements obtained in other decay modes. An example of the t t ¯ b b ¯ and t t ¯ c c ¯ processes Feynman diagrams are shown in Figure 1. Final state particles are defined in Section 2.1 and the processes in Section 2.2.

2.1. Particle level object definition

In the definition of the visible phase space, all generated objects such as leptons and jets are required to be within the experimentally accessible kinematic region. The objects are defined at the particle level which is based on the stable particles after the hadronization to reduce the dependence on the generation level information. In ATLAS, electrons and muons not emerging from hadron decays are considered. Furthermore, to reach the full particle level definition, for all charged leptons, potential final-state photon radiation within a Δ R = 0.1 cone around the lepton is added to the four-momenta of the lepton. In CMS, the electrons and muons are required to originate from a W boson at parton level. The electrons or muons originating from the leptonic decays of τ leptons produced in W τ ν decays are included. The procedure of adding final state photon radiation to the lepton is not performed in CMS. The particle level jets are defined by clustering stable particles, excluding neutrinos with the anti-kt algorithm with a distance parameter of 0.4 at a center of mass energy s = 13 TeV and 0.5 at s = 7 , 8 TeV. To identify the heavy-flavor b and c particle level jets, a so-called ghost matching is performed. The b- and c-hadrons are included in the jet clustering procedure after scaling their momenta to negligible values while preserving their directions. The b and c jets are then identified by the presence of the corresponding “ghost“ hadrons among the jet constituents. The approach to defining the particle-level jets is the same in ATLAS and CMS. However, in terms of defining the t t ¯ +heavy-flavor quarks processes, there are subtle distinctions between different channels and experiments we will discuss in the following section.

2.2. Process definition

In ATLAS, t t ¯ b ( b ¯ ) is defined by the presence of at least three (four) particle level b jets. Events with only three b jets can come from the case where one of the b jets is out of acceptance or two b jets are merged together. For t t ¯ c , in the dilepton channel, the number of particle level b jets should be less than 3 and at least one c-jet while in the lepton+jets channel, events should contain at least two c-jets as the events with exactly one c-jet would come from the W c s ¯ ( c ¯ s ) decays. In ATLAS, only measurements in the visible phase space are available and the origin of the heavy-flavor jets is not identified. Instead, the two b jets with the smallest Δ R separation or with the highest transverse momentum are selected. In CMS, for the visible phase space, the t t ¯ j j ¯ process is defined if the event contains at least four particle level jets including two b jets, and the same number of leptons as required at the reconstructed level. The t t ¯ b b ¯ process is defined by the presence of at least four b jets in the dilepton, lepton+jets channel, and hadronic channel (parton-independent). Additionally, in the hadronic channel, a parton-based definition of requiring two b jets originating from the top quark and two additional b jets is introduced. For the t t ¯ bL process, the event should contain only one additional b jet and at least one additional light-flavor jet or c jet. The t t ¯ LL process is the case where there are no additional b or c jets, but at least two additional light-flavor jets within the acceptance. In the t t ¯ c c ¯ measurements, the t t ¯ c c ¯ process is defined by the presence of at least two b jets and at least two c jets.
The cross sections are measured in the visible phase space to reduce the systematic uncertainties that can be coming from the theory dependence on the acceptance. For the full phase space measurements performed by CMS, the additional b jets are required not to be from the weak decay of the t t ¯ system at the generator level. There is no further requirement for the decay particles from the top quarks. Therefore, the measurements can be compared across different channels and also with theory predictions. The cross sections in the full phase space are obtained by taking into account the acceptance which can only be calculated based on simulations inducing an additional systematic uncertainty. The definitions of the signal phase space in ATLAS and CMS are summarized in Table 1.
The measured cross sections can not be compared directly between ATLAS and CMS due to the different phase space definitions. In the following sections, the results from the two experiments are reviewed.

3. Portfolio of cross section measurements

In ATLAS, the t t ¯ b and t t ¯ b b ¯ inclusive and differential cross sections are measured using data corresponding to an integrated luminosity of 4.7 fb−1 of proton-proton collisions at a center-of-mass energy of 7 TeV [12] and 20.3 fb−1 at s = 8 TeV [13]. At s = 13 TeV, the cross sections using data corresponding to an integrated luminosity of 36.1 fb−1 are measured in the e μ and in the lepton+jets channels [14].
In CMS, the t t ¯ b b ¯ inclusive and differential cross sections are measured using data collected at s = 8 TeV [16]. The inclusive cross sections of the t t ¯ b b ¯ production are also measured in the dilepton channel using early data corresponding to an integrated luminosity of 2.3 fb−1 at s = 13 TeV [17]. The inclusive analysis is updated in the dilepton channel and extended to the lepton+jets channel with data corresponding to an integrated luminosity of 35.9 fb−1 [18]. Measurements of the t t ¯ b b ¯ process in the hadronic channel are performed using data corresponding to an integrated luminosity of 35.9 fb−1 at s = 13 TeV [19]. Measurements of the t t ¯ c c ¯ production are also available at s = 13 TeV [20].
It is worth noting that only a small fraction of the available data has been used for all these σ t t ¯ b b ¯ and σ t t ¯ c c ¯ measurements.

3.1. Inclusive cross section measurement

In ATLAS, at s = 13 TeV, the cross-section measurements were performed in the e μ channel within the at least 3 b jet visible phase space and in lepton+jets channels within the t least 4 b jet visible phase space. To extract the t t ¯ + heavy-flavor number of events, in both channels, a binned maximum likelihood fit is used on observables discriminating between signal and background. A combined template is created from the sum of all backgrounds. Three templates of t t ¯ b , t t ¯ c and t t ¯ l events are created from all of t t ¯ , t t ¯ V and t t ¯ H simulations as those samples contain the signal process. In the e μ channel, t t ¯ c and t t ¯ l are merged together to fit to the distribution of the third highest b-tagging discriminant among the reconstructed jets in the event. The post-fit values of the free parameters are 1.33 ± 0.06 for the number of t t ¯ b events and 1.05 ± 0.04 for the number of the combined t t ¯ c + t t ¯ l events. In the lepton+jets channel, all three templates are used to fit to the 2D histograms of the third and fourth b-tagging discriminant. The best fit values are 1.11±0.2 for the number of t t ¯ b events, 1.59±0.06 for the number of t t ¯ c events and 0.962±0.003 for the number of t t ¯ l events. The measured cross-section values for t t ¯ b for both channels are compatible with each other.
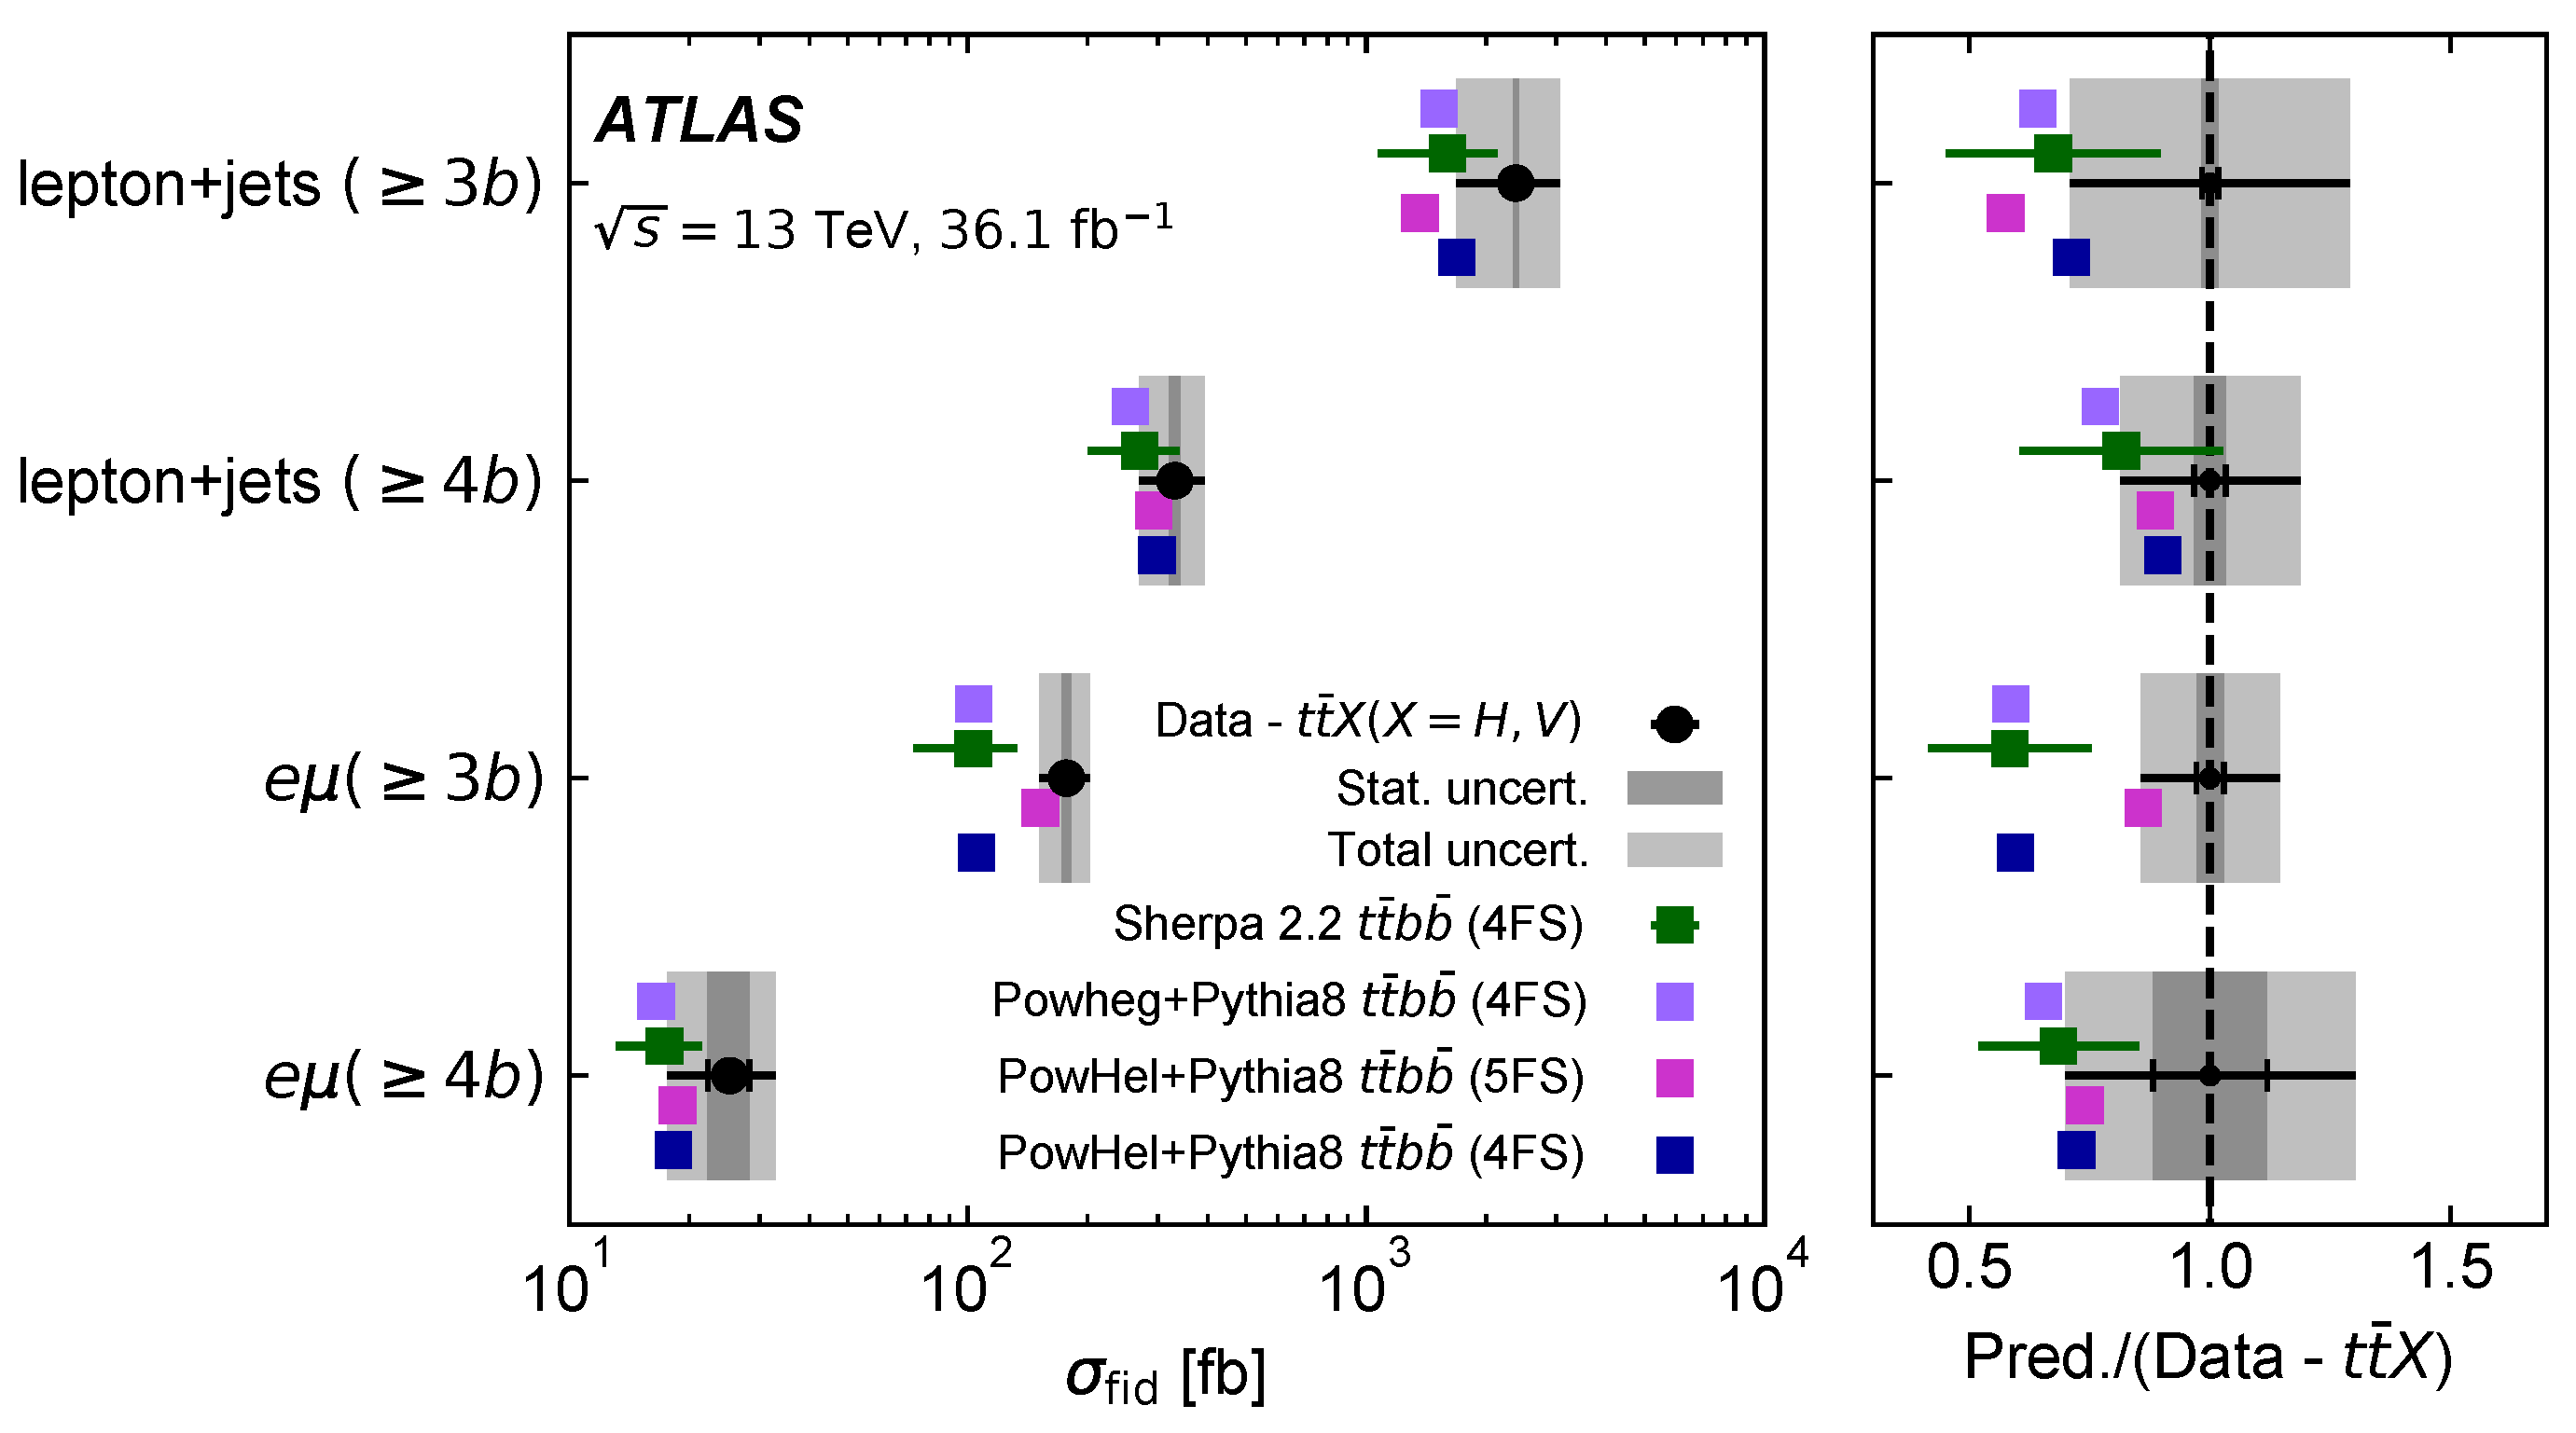
To facilitate the comparison with the theory t t ¯ b b ¯ cross-section, the t t ¯ H and t t ¯ V processes are also subtracted from the measured cross section. The measured inclusive cross sections are shown in Figure 2. All of the inclusive cross sections measured at s = 13 TeV in the visible phase space by the ATLAS experiment are summarized in Table 2. The cross-section measurement for the ≥ 3 b jet phase space in the e μ channel has an uncertainty of 13% which is the most precise measurement. The uncertainties are dominated by systematic uncertainties mainly from the t t ¯ modeling and b-tagging, and the jet energy scale.
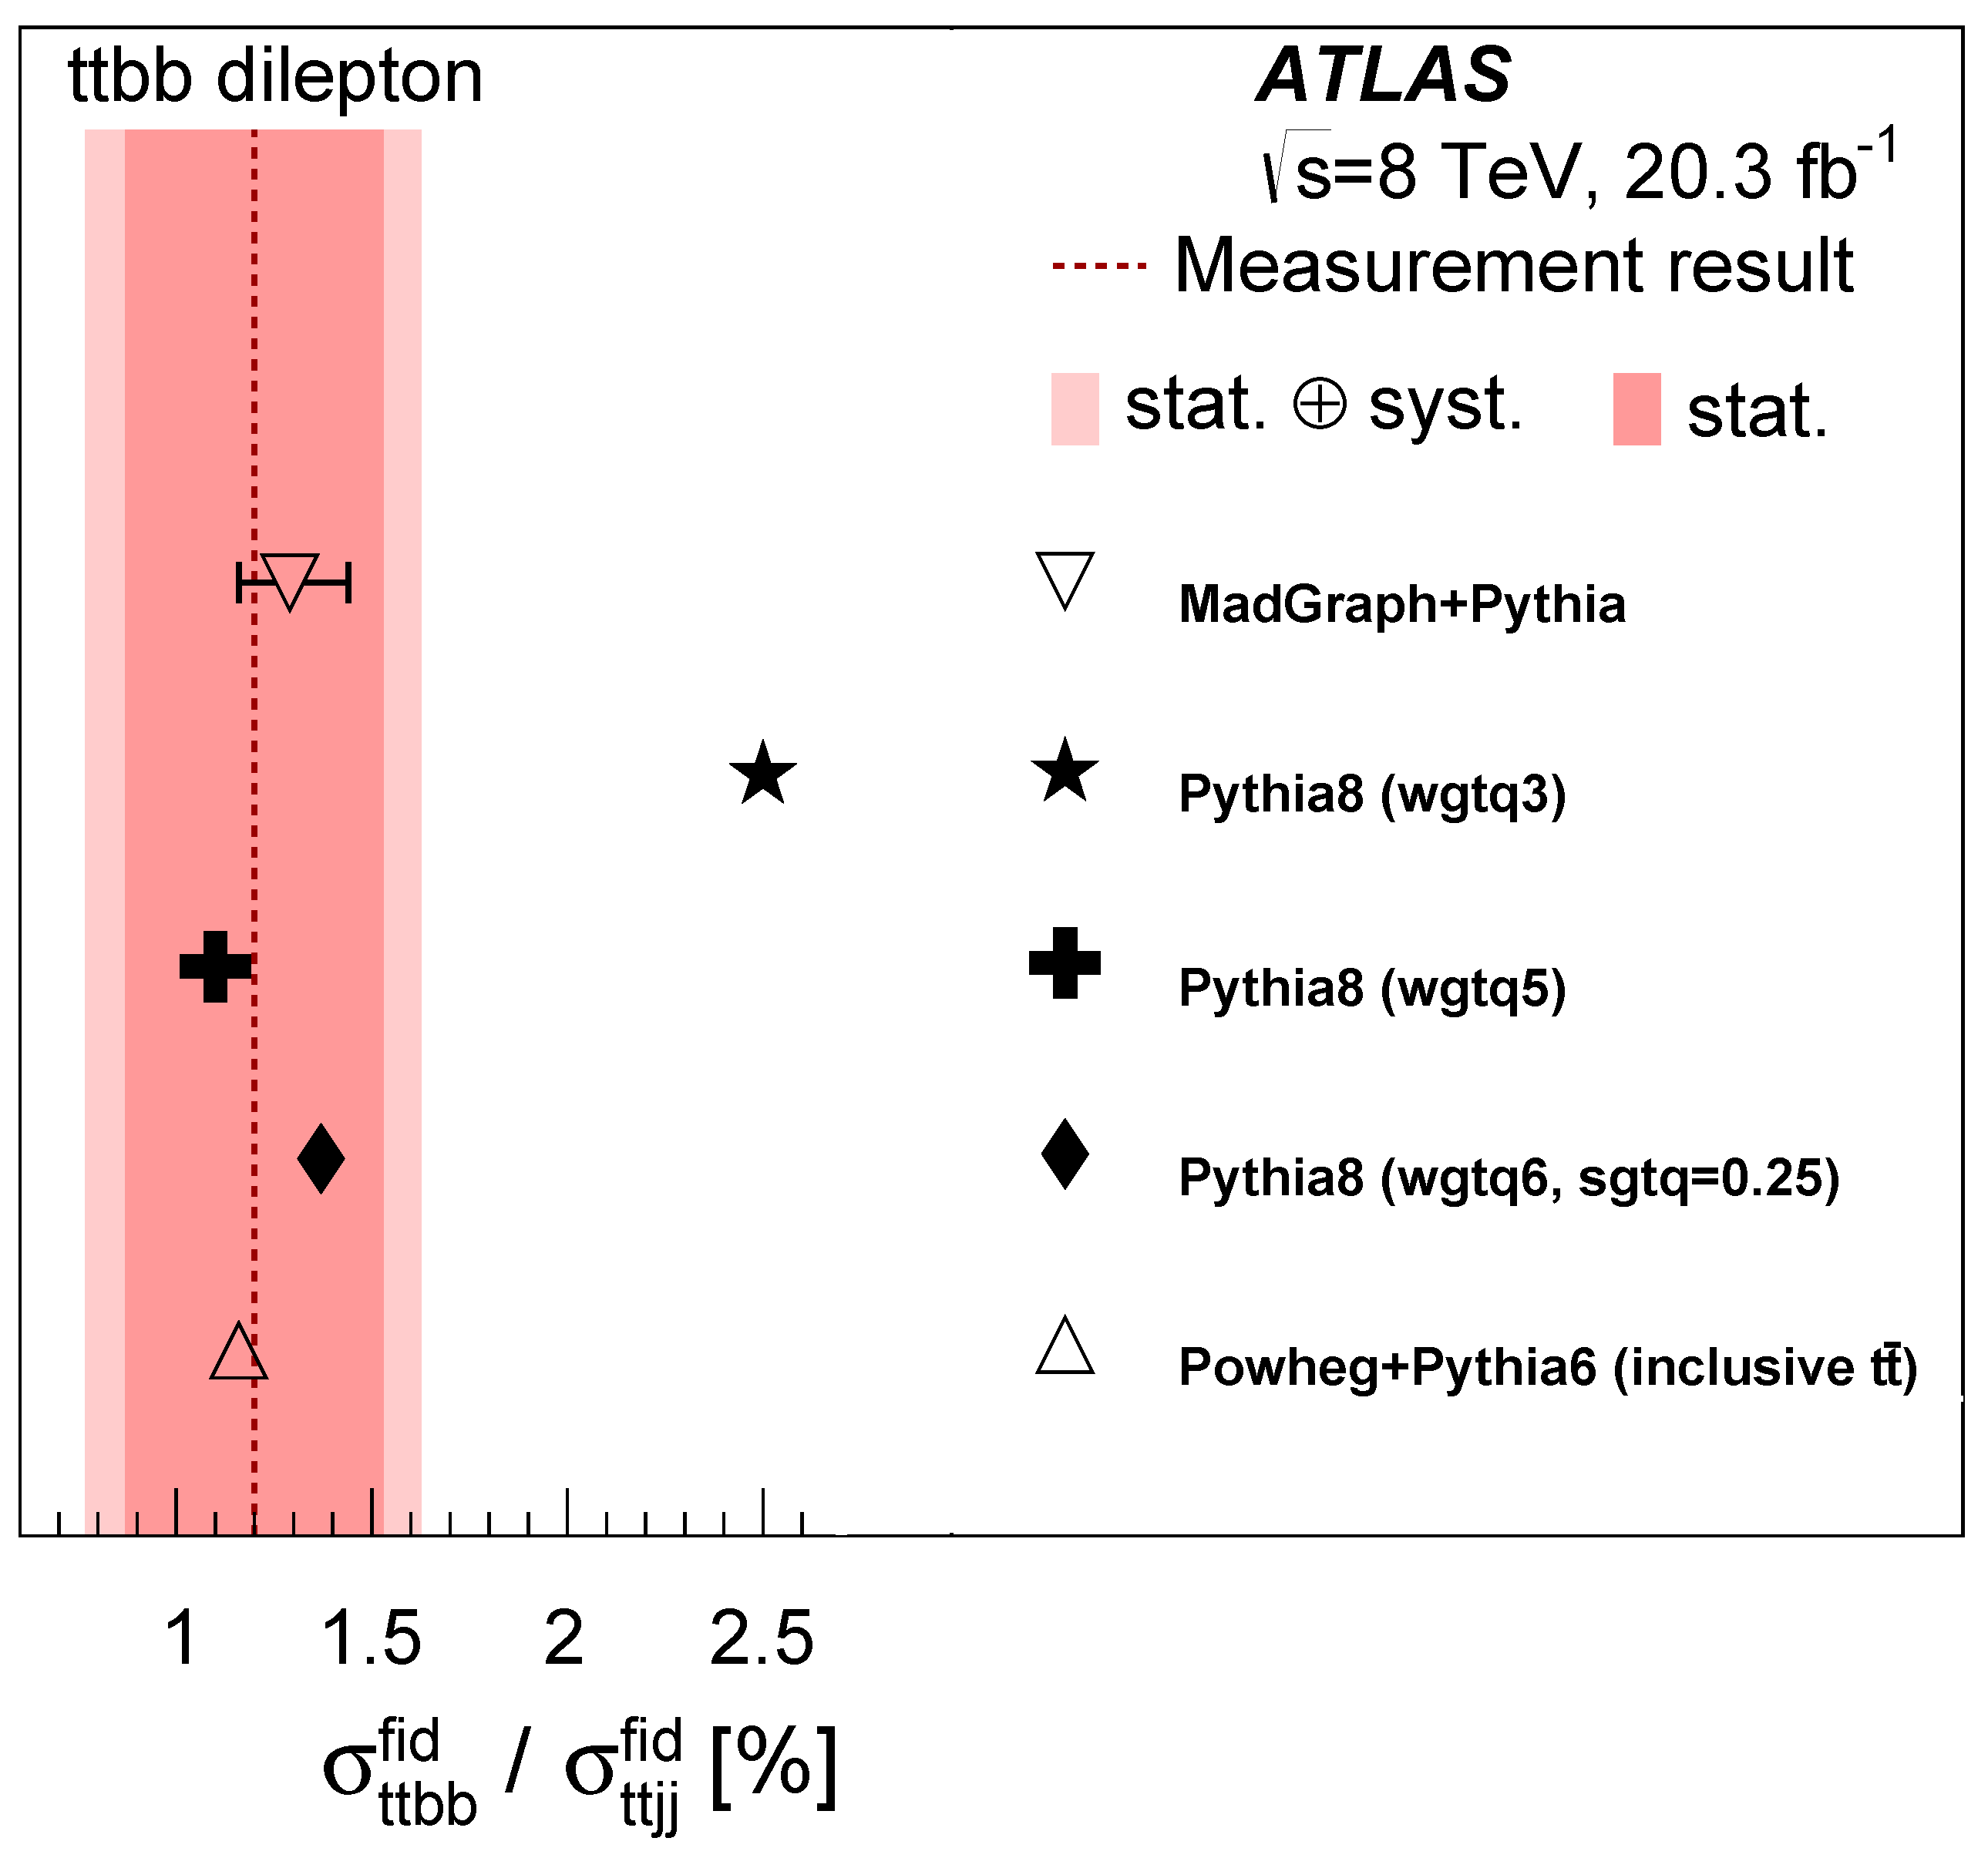
The ratio measurement of the cross sections of t t ¯ b b ¯ to t t ¯ j j ¯ production is also available using data collected at s = 8 TeV [13]. The ratio measurement is motivated to reduce the systematic uncertainties and the result is compared with predictions in Figure 3.
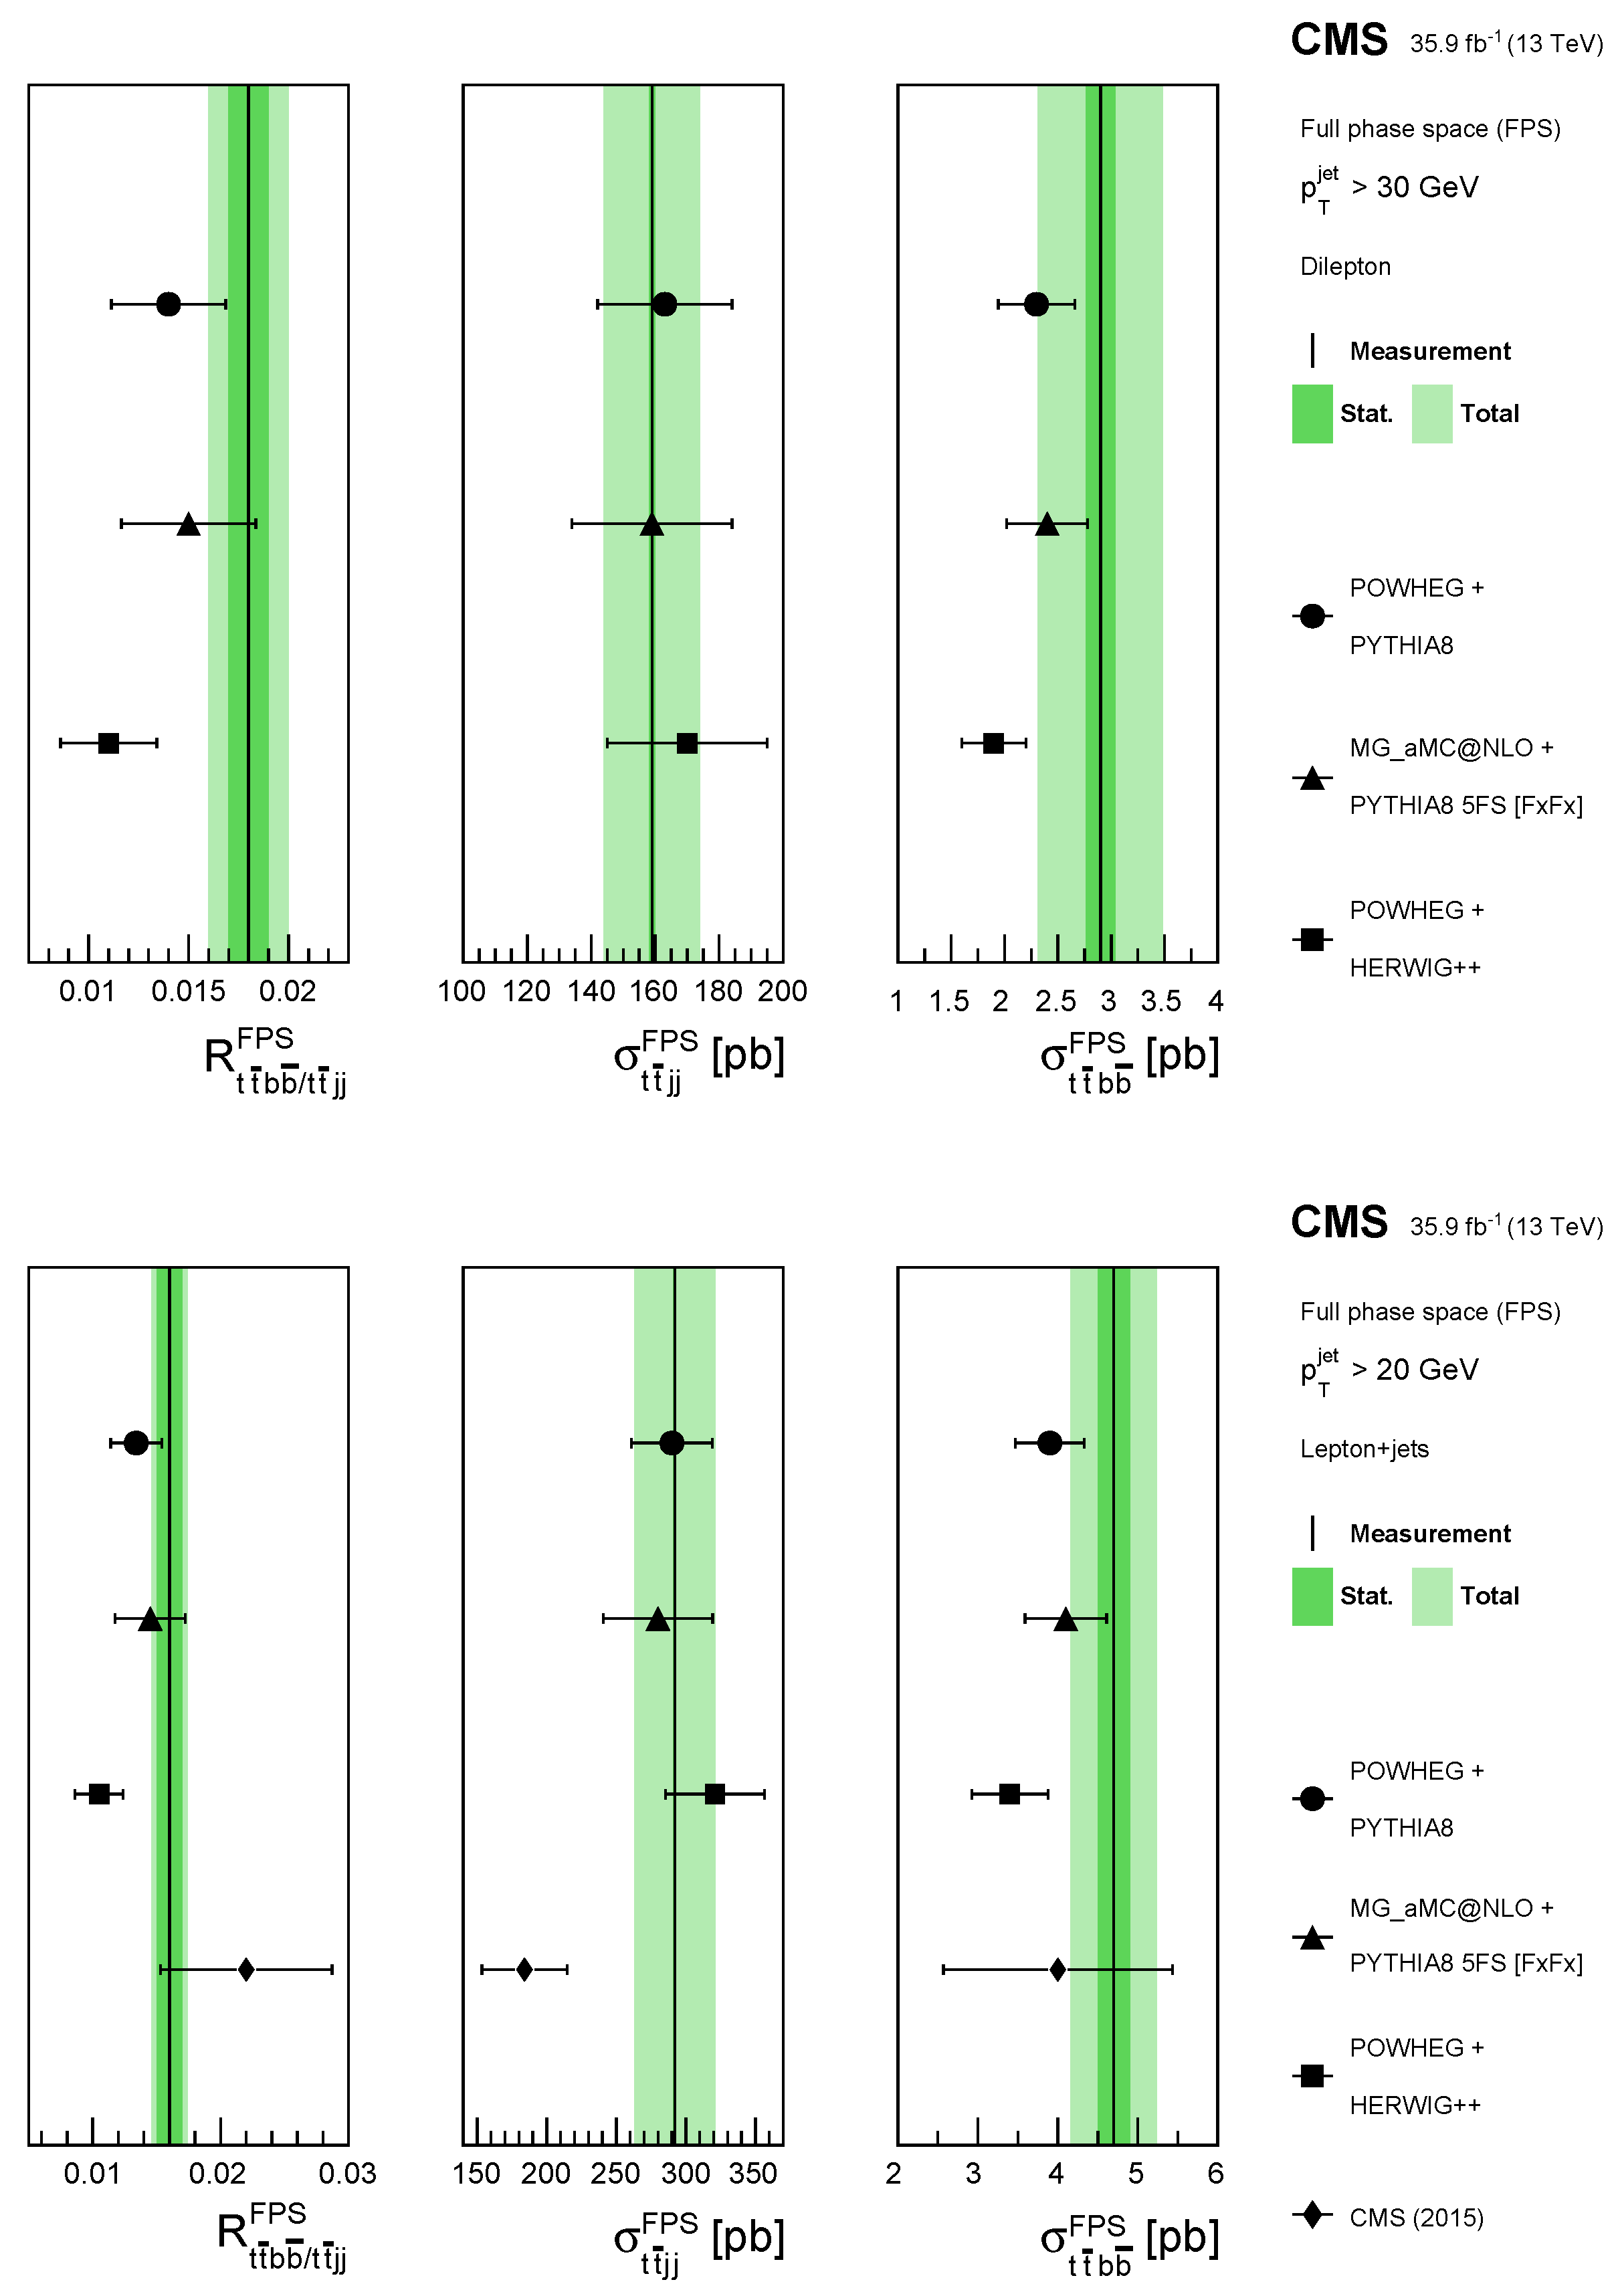
In CMS, the inclusive t t ¯ b b ¯ cross sections are measured in the different phase spaces of the dilepton, lepton+jets and hadronic channels using data collected at s = 13 TeV by CMS. In the dilepton channel, measurements at s = 8 TeV are also available. In the dilepton channel, the final state consists of two reconstructed leptons and at least 4 reconstructed b jets. With these two leptons, the dominating Z+jets background is estimated from data using control samples enriched in Z boson events. Among the at least 4 b jets, the first and the second jets in decreasing order of the b tagging discriminator tend to be the b jets from the top quark. Therefore, jets with the third and fourth largest b tagging discriminator are considered as the additional b jets. Using the two-dimensional distribution of these discriminators of two determined additional jets, the number of t t ¯ b b ¯ events is extracted. Together with the ratio σ t t ¯ b b ¯ / σ t t ¯ j j ¯ , the cross sections σ t t ¯ b b ¯ and σ t t ¯ j j ¯ are measured in the visible phase space. For the purpose of comparing the measurements with the theoretical prediction and with measurements in the other decay modes, the cross sections in the full phase space are obtained by taking into account the acceptance, σ f u l l = σ v i s i b l e / A , where A is the acceptance, defined as the number of events in the corresponding visible phase space divided by the number of events in the full phase space. The results for the full phase space are shown in Figure 4 (upper).
In the lepton+jets channel, the measurement was done at s = 13 TeV in CMS. In this channel, the identification of the origin of the jets is challenging because the final state with at least six jets including four b jets leads to ambiguities in the jet assignment. Besides, the heavy-flavor jet can also originate from the W boson decay. To cope with this, the kinematic reconstruction method is used to identify the additional b jets. The algorithm assigns a χ 2 value according to the goodness of the fit of each jet permutation to meet certain kinematic constraints. The solution selected is the one with the lowest χ 2 value. Once a jet topology is selected, the additional jets in the event are arranged in decreasing order of their b tagging discriminant value. Then, similar to the dilepton channel, only the information from two additional jets with the highest b tagging discriminant value is used to extract the t t ¯ b b ¯ cross section. The results for the ratio σ t t ¯ b b ¯ / σ t t ¯ j j ¯ , σ t t ¯ b b ¯ and σ t t ¯ j j ¯ are presented for both the visible phase space and the full phase space (see Figure 4).
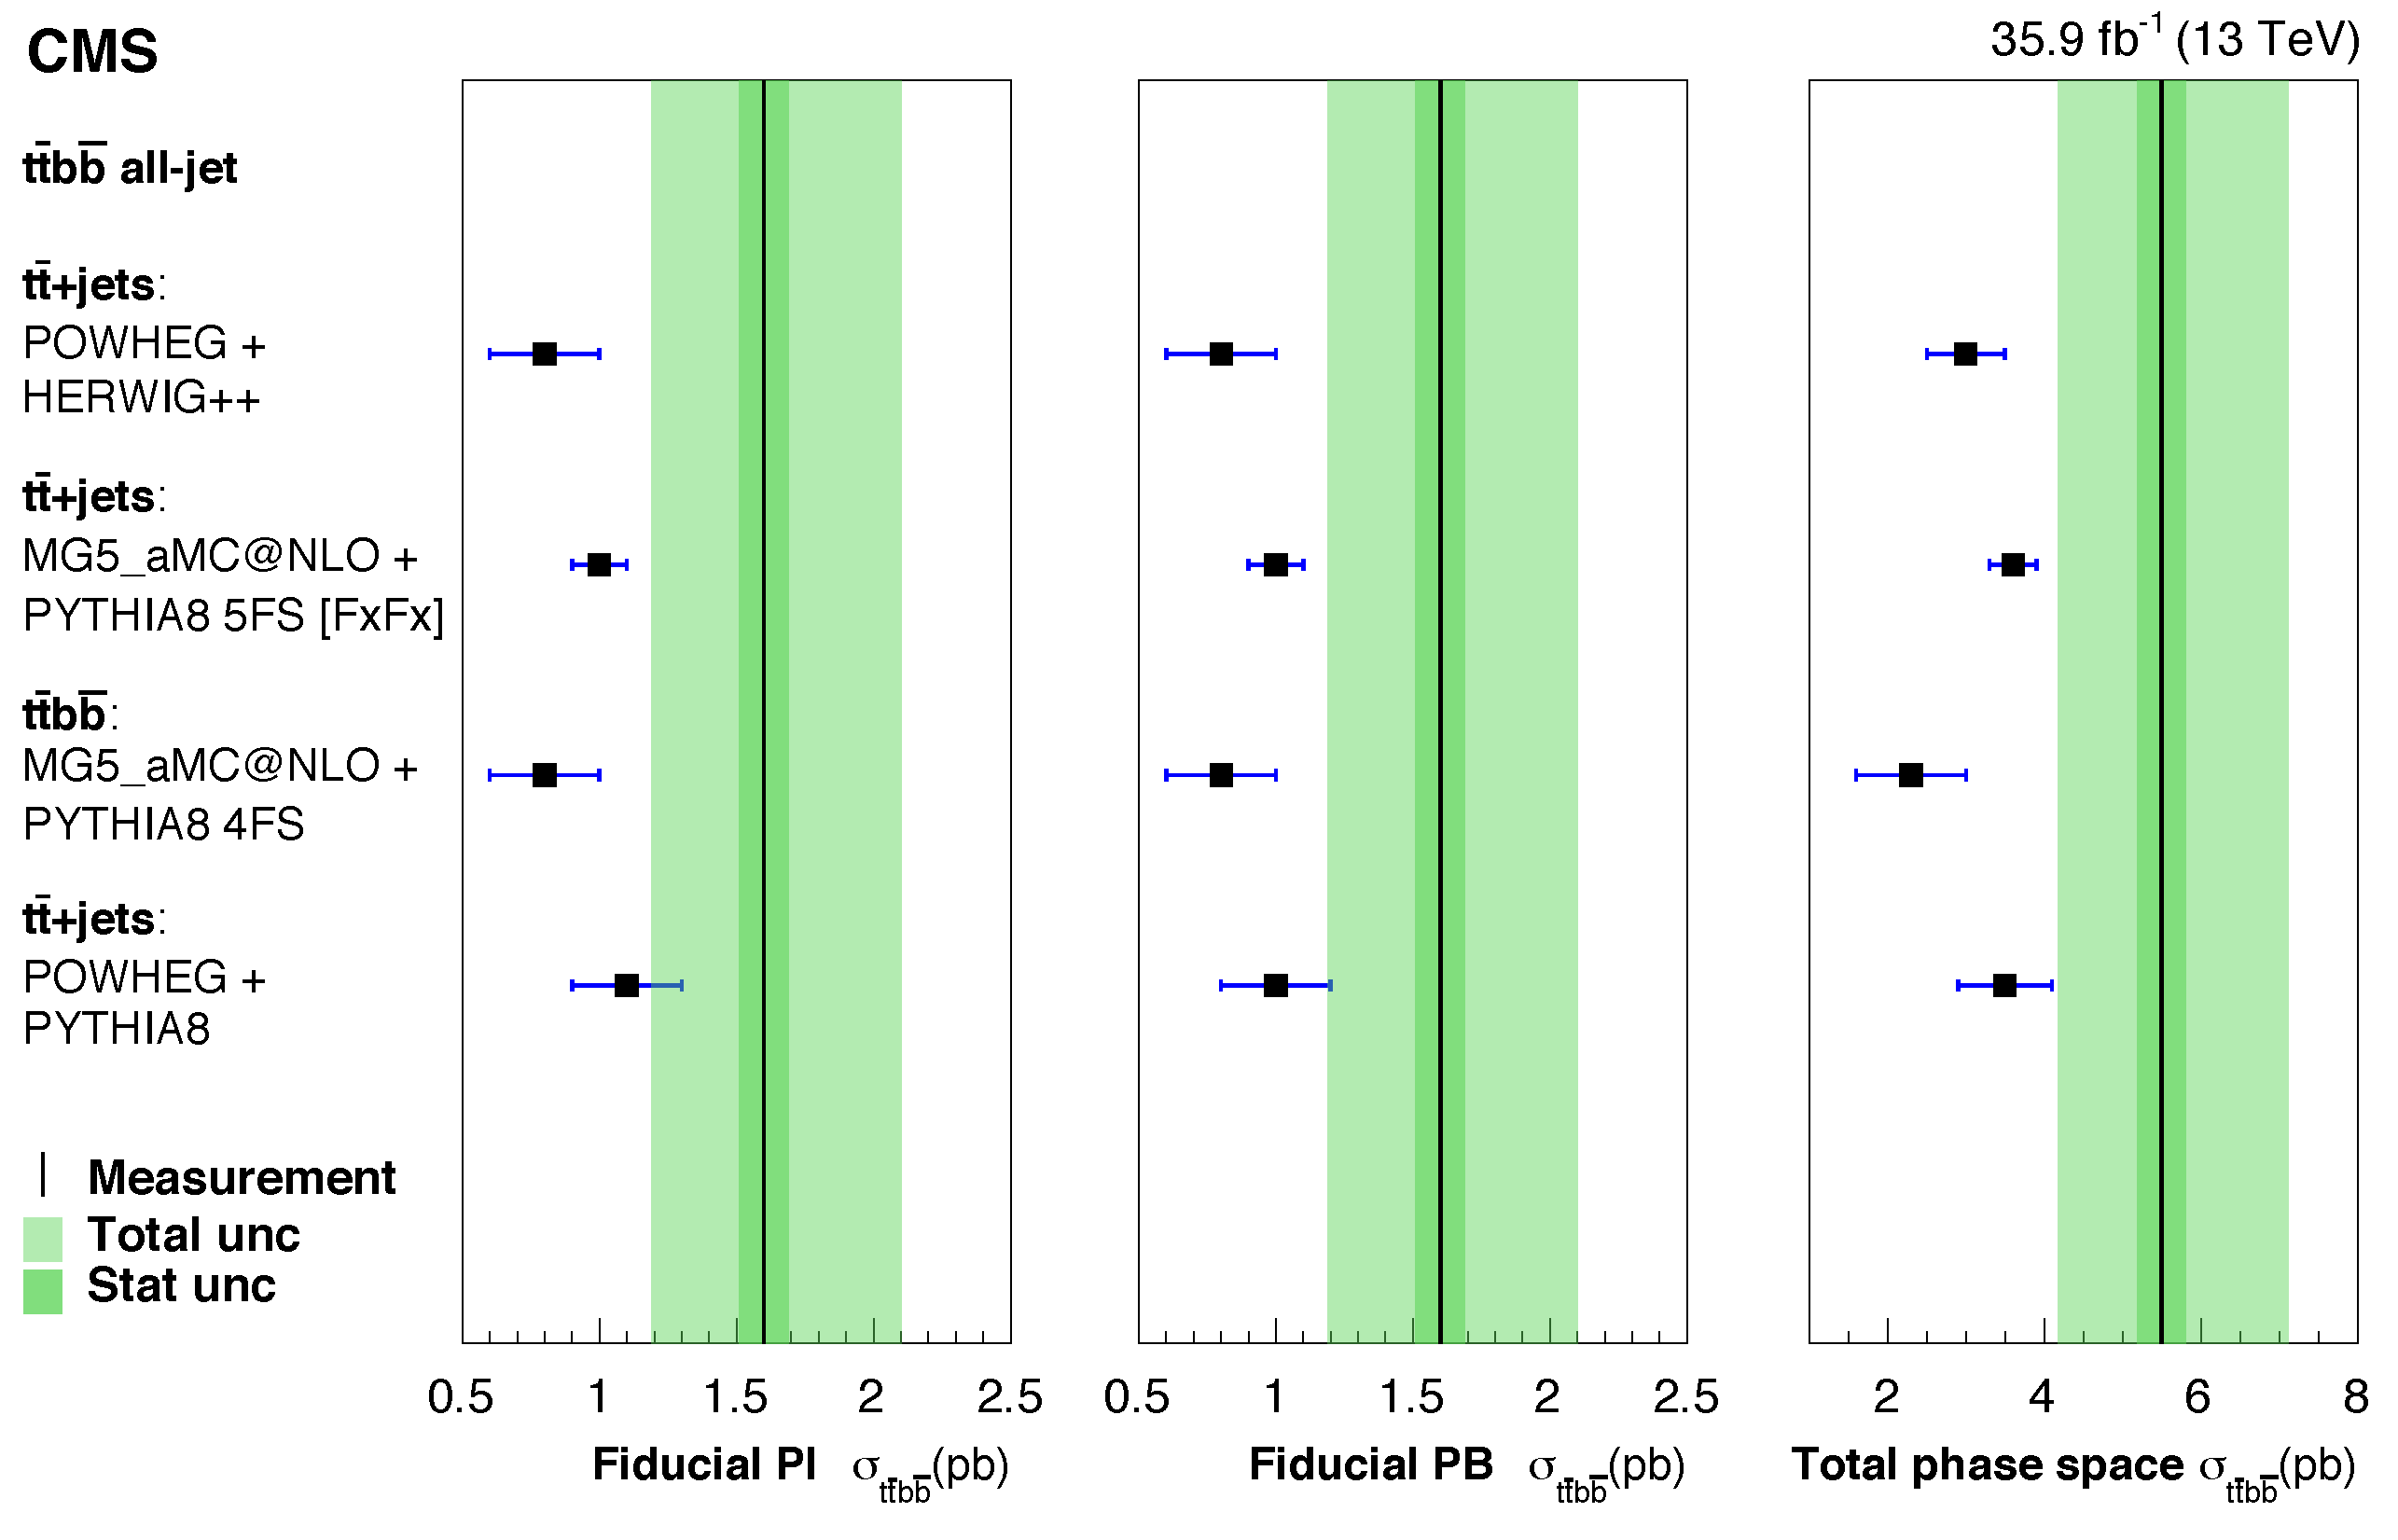
In the hadronic channel, the multi-jet process is the main background. To remove the multi-jet events, the quark-gluon discriminant was used. The unsupervised learning algorithm was also further used to maximize the contribution of t t ¯ b b ¯ events. The measured cross sections follow two definitions of the t t ¯ b b ¯ events in the fiducial phase space. One is based exclusively on stable generated particles after hadronization (parton-independent). This definition facilitates comparisons with predictions from event generators. The other uses parton-level information after radiation emission (parton-based). This definition is closer to the approach taken by searches for t t ¯ H production to define the contribution from the t t ¯ b b ¯ process. To address the large combinatorial ambiguity in identifying the additional jets in the events, a boosted decision tree (BDT) was used. The cross section is also reported for the total phase space by correcting the parton-based fiducial cross section by the experimental acceptance. The results are presented in the Figure 5.
The cross section of a top quark pair production with an additional pair of c jets ( t t ¯ c c ¯ ) has been measured for the first time by CMS. This measurement is challenging as the experimental signature of a b jet is very similar to that of a c jet. Two additional jets are selected using a deep neural network classifier. To separate the t t ¯ c c ¯ , t t ¯ b b ¯ , and t t ¯ LL events, a NN is trained using charm jet tagging information of the first and second additional jets, and kinematic variables such as the angular separation Δ R between two additional jets, and the NN score for the best jet permutation. This NN predicts the probabilities for five output classes of t t ¯ c c ¯ , t t ¯ cL , t t ¯ b b ¯ , t t ¯ bL and t t ¯ LL . Two discriminators are derived as follows.
Δ b c = P ( t t ¯ c c ¯ ) P ( t t ¯ c c ¯ ) + P ( t t ¯ b b ¯ ) , Δ L c = P ( t t ¯ c c ¯ ) P ( t t ¯ c c ¯ ) + P ( t t ¯ LL ) .
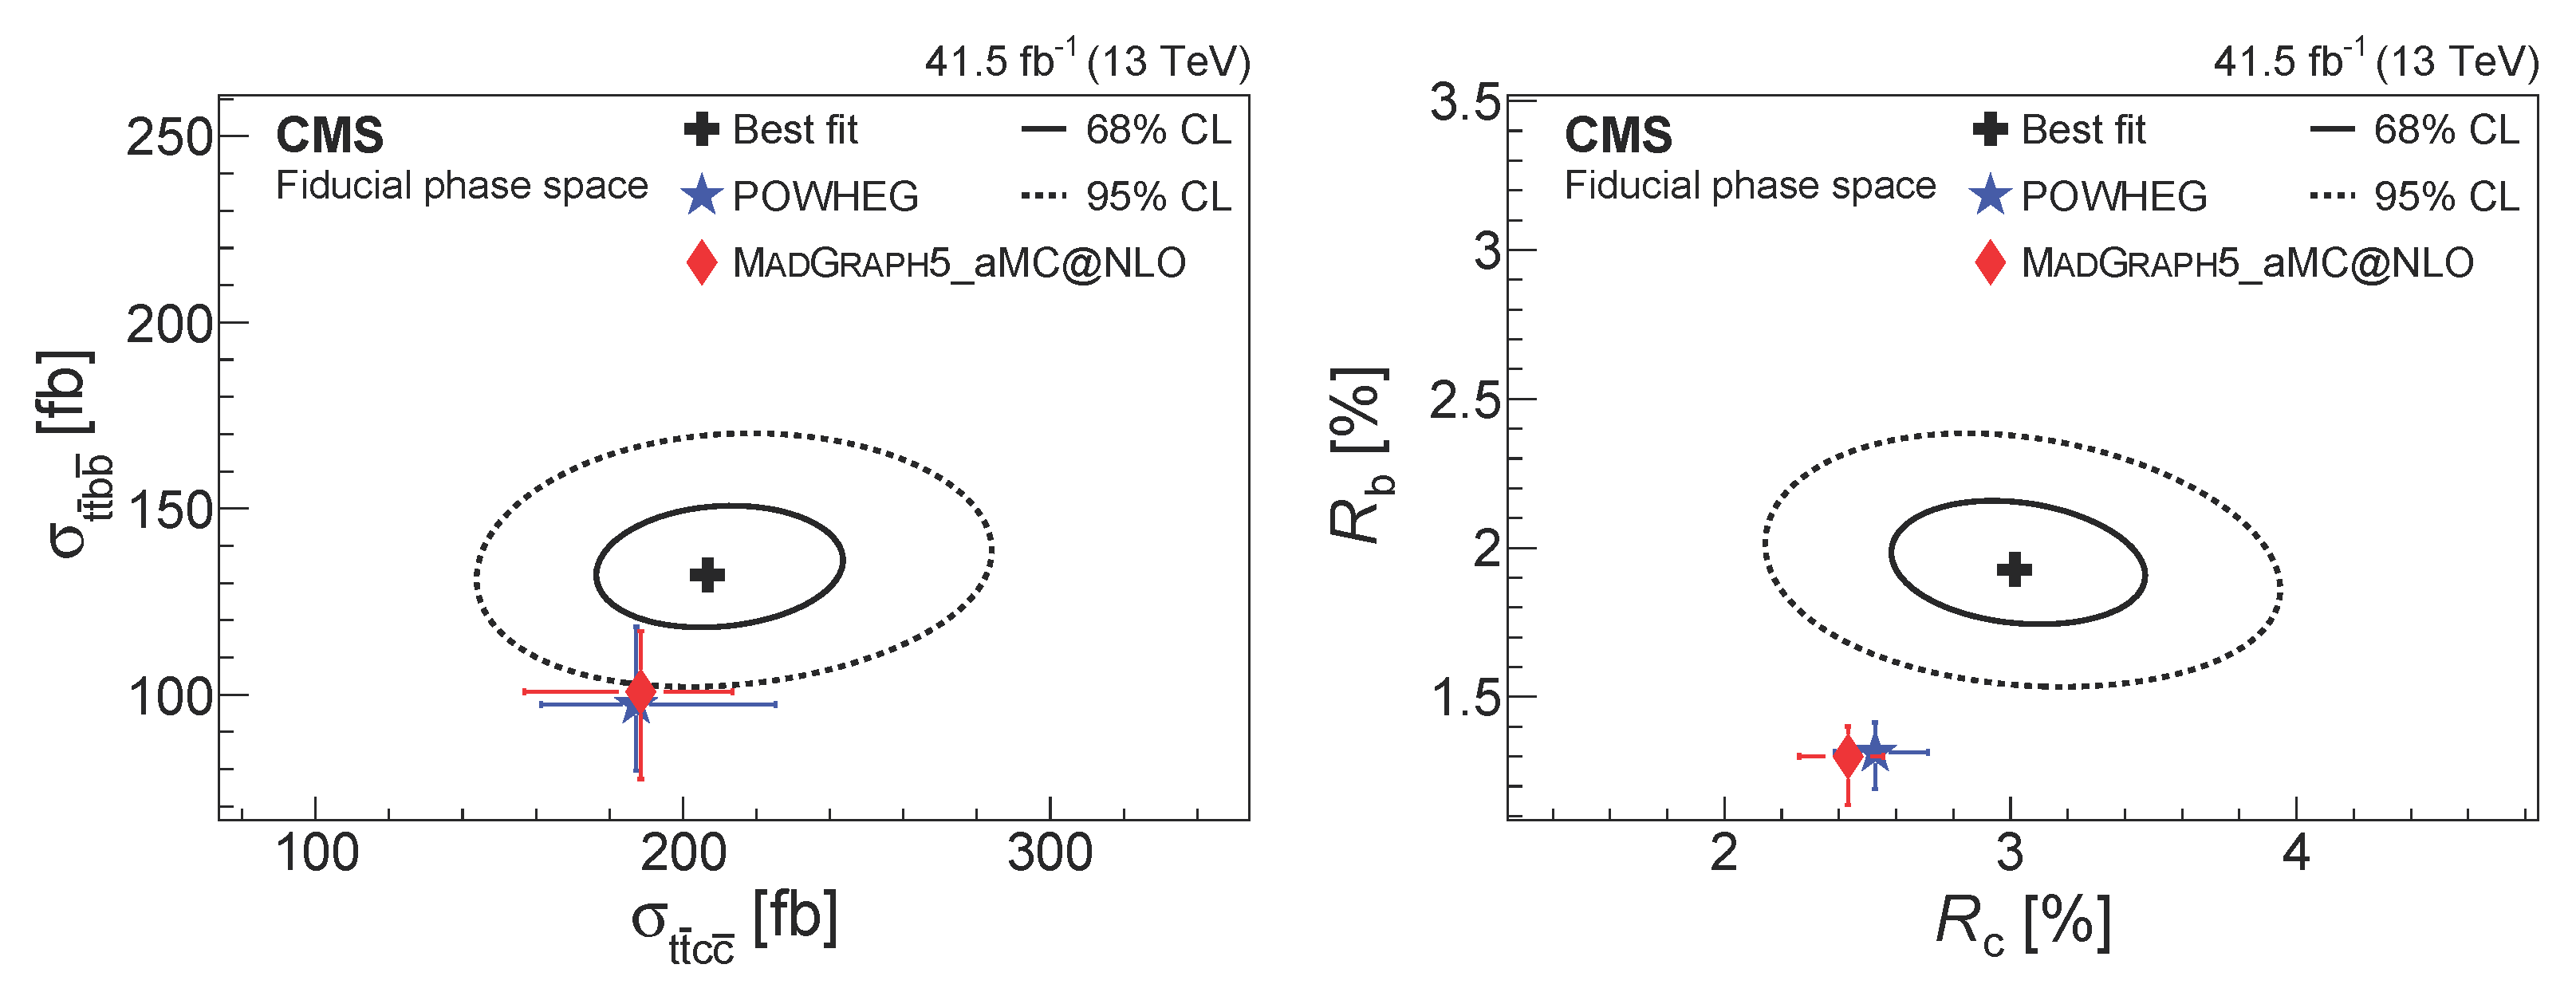
The t t ¯ c c ¯ , t t ¯ b b ¯ , and t t ¯ LL cross sections are extracted from a fit to the two-dimensional distribution of these discriminators. The ratios R b and R c of, respectively, the measured σ t t ¯ b b ¯ and σ t t ¯ c c ¯ cross-sections with respect to the inclusive t t ¯ + two jets cross-section were also measured. The results are compared to theoretical predictions of either the Powheg or MadGraph 5_aMC@NLO ME generators as shown in Figure 6.
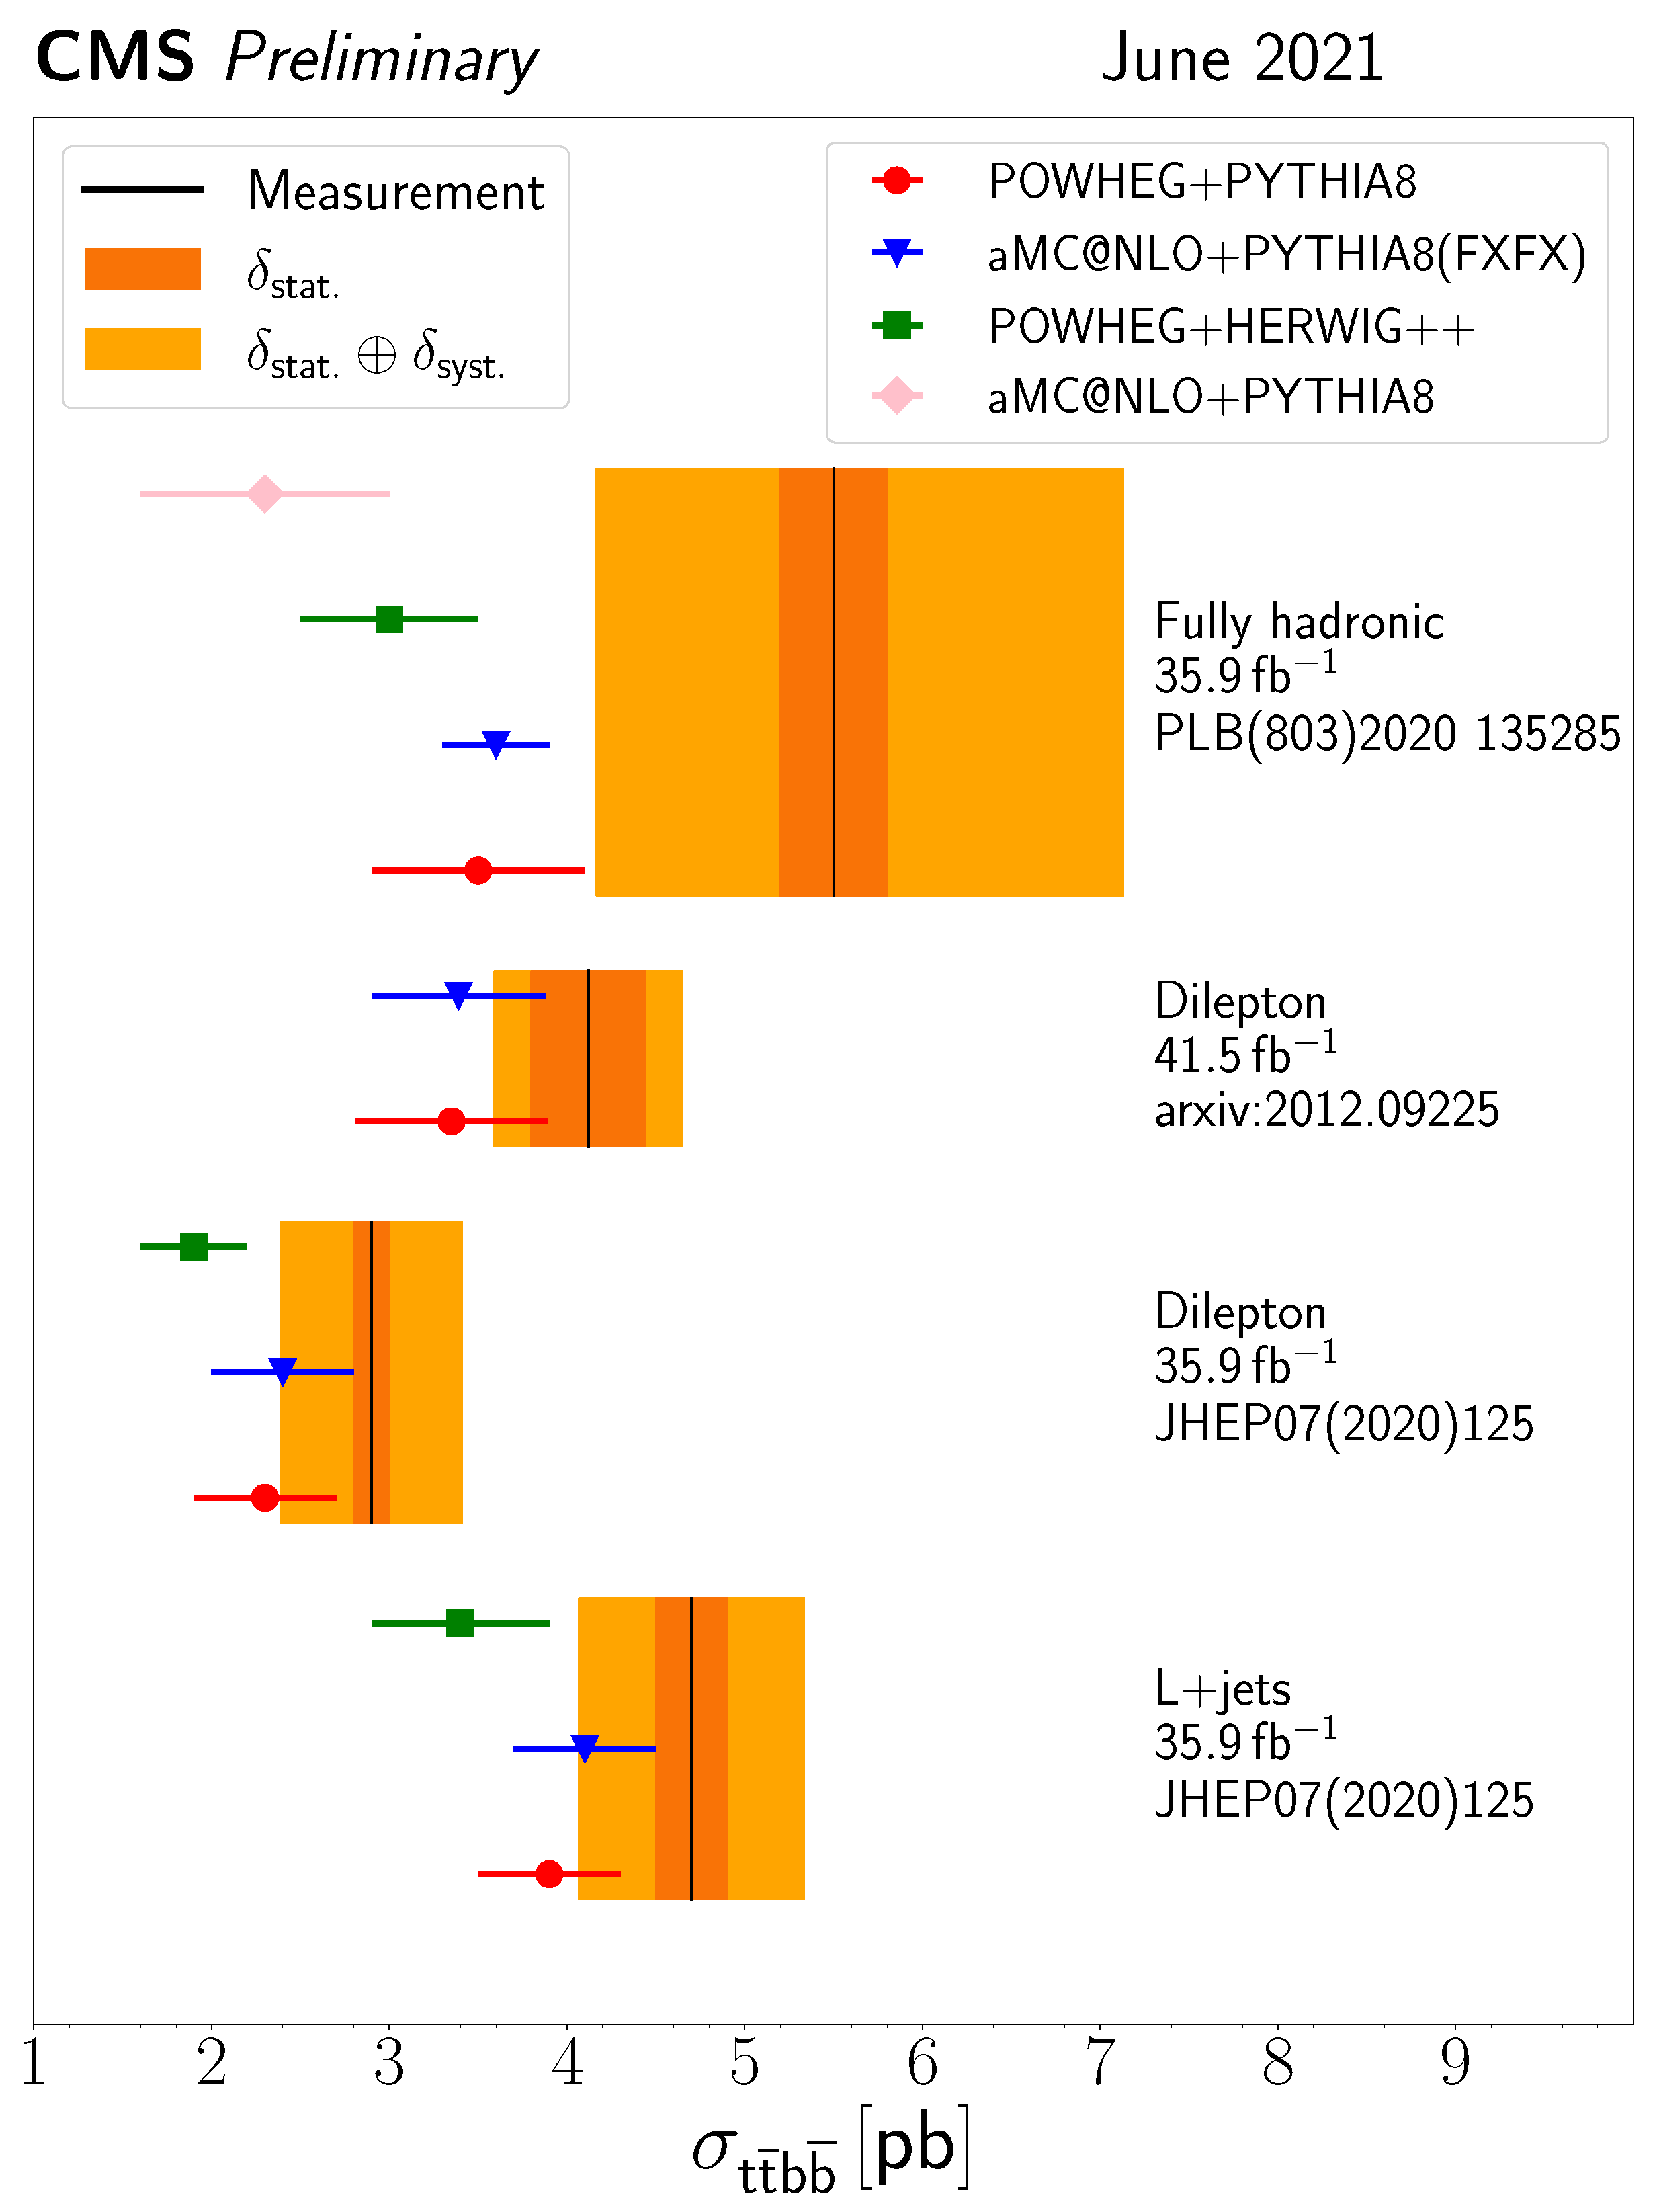
All of the inclusive cross sections measured in the visible phase space by the CMS experiment are summarized in Table 3 and Table 4, and for the full phase space in Table 5 and Table 6. Figure 7 also shows the comparison between the measured values in the full phase space and various theoretical predictions in CMS.

3.2. Differential cross-section measurements

In addition to the inclusive cross-section measurements, the differential measurements of the t t ¯ + heavy-flavor production cross-sections can also provide information on the perturbative QCD (pQCD) and enable the searches for potential new physics. The t t ¯ b b ¯ differential cross-section measurements have been performed at s = 7, 8 and 13 TeV with the ATLAS experiment and at s = 8 with the CMS experiment.
To measure the differential cross-sections, the measured distributions at the detector level need to be unfolded to the generator level where the detector effect is removed so that the resulting cross-section can be compared with theory predictions and results from other experiments. At the generator level, it is not trivial to define the additional b jets in the t t ¯ b b ¯ process as we have b jets from the top quark decay. Moreover, the b jet could also emerge from the W boson decay. The additional b jets are expected to come from the gluon decay and can also come from the decay of the H boson or another boson.
In the b jet identification, there is a clear difference between the two experiments ATLAS and CMS. In the ATLAS experiment, at the particle level, there is no attempt to identify the origin of the b jets relying on the simulation information. At this particle level, the two b jets with the highest p T or the smallest Δ R are selected for the differential cross-section measurement. The highest p T jets are considered as the b jets from the top quark while the b jets with the smallest Δ R are considered as the additional b jets not from the top quark decay to make use of the fact that the b jets from a gluon splitting tend to be collinear. While in CMS, the origin of the b jets is explicitly identified using the simulation information. For example, the b hadron is traced back through its ancestors in the simulation chain. In this way, only if the b jet is not from a top quark, the b jet is identified as one of the two additional b jets.
For the ATLAS measurements, the unfolded results are presented as normalized differential cross-sections in visible phase space as a function of the b jet multiplicity, global event properties and various kinematic variables. The measurements are done in the e μ channel with at least 3 reconstructed b jets and in the lepton+jets channel with at least 4 b jets. The sample with at least four b jets in the lepton + jets channel has high signal purity resulting in a measurement with smaller dependence on the simulation. The e μ channel benefits from an order of magnitude larger sample size containing at least three b jets.
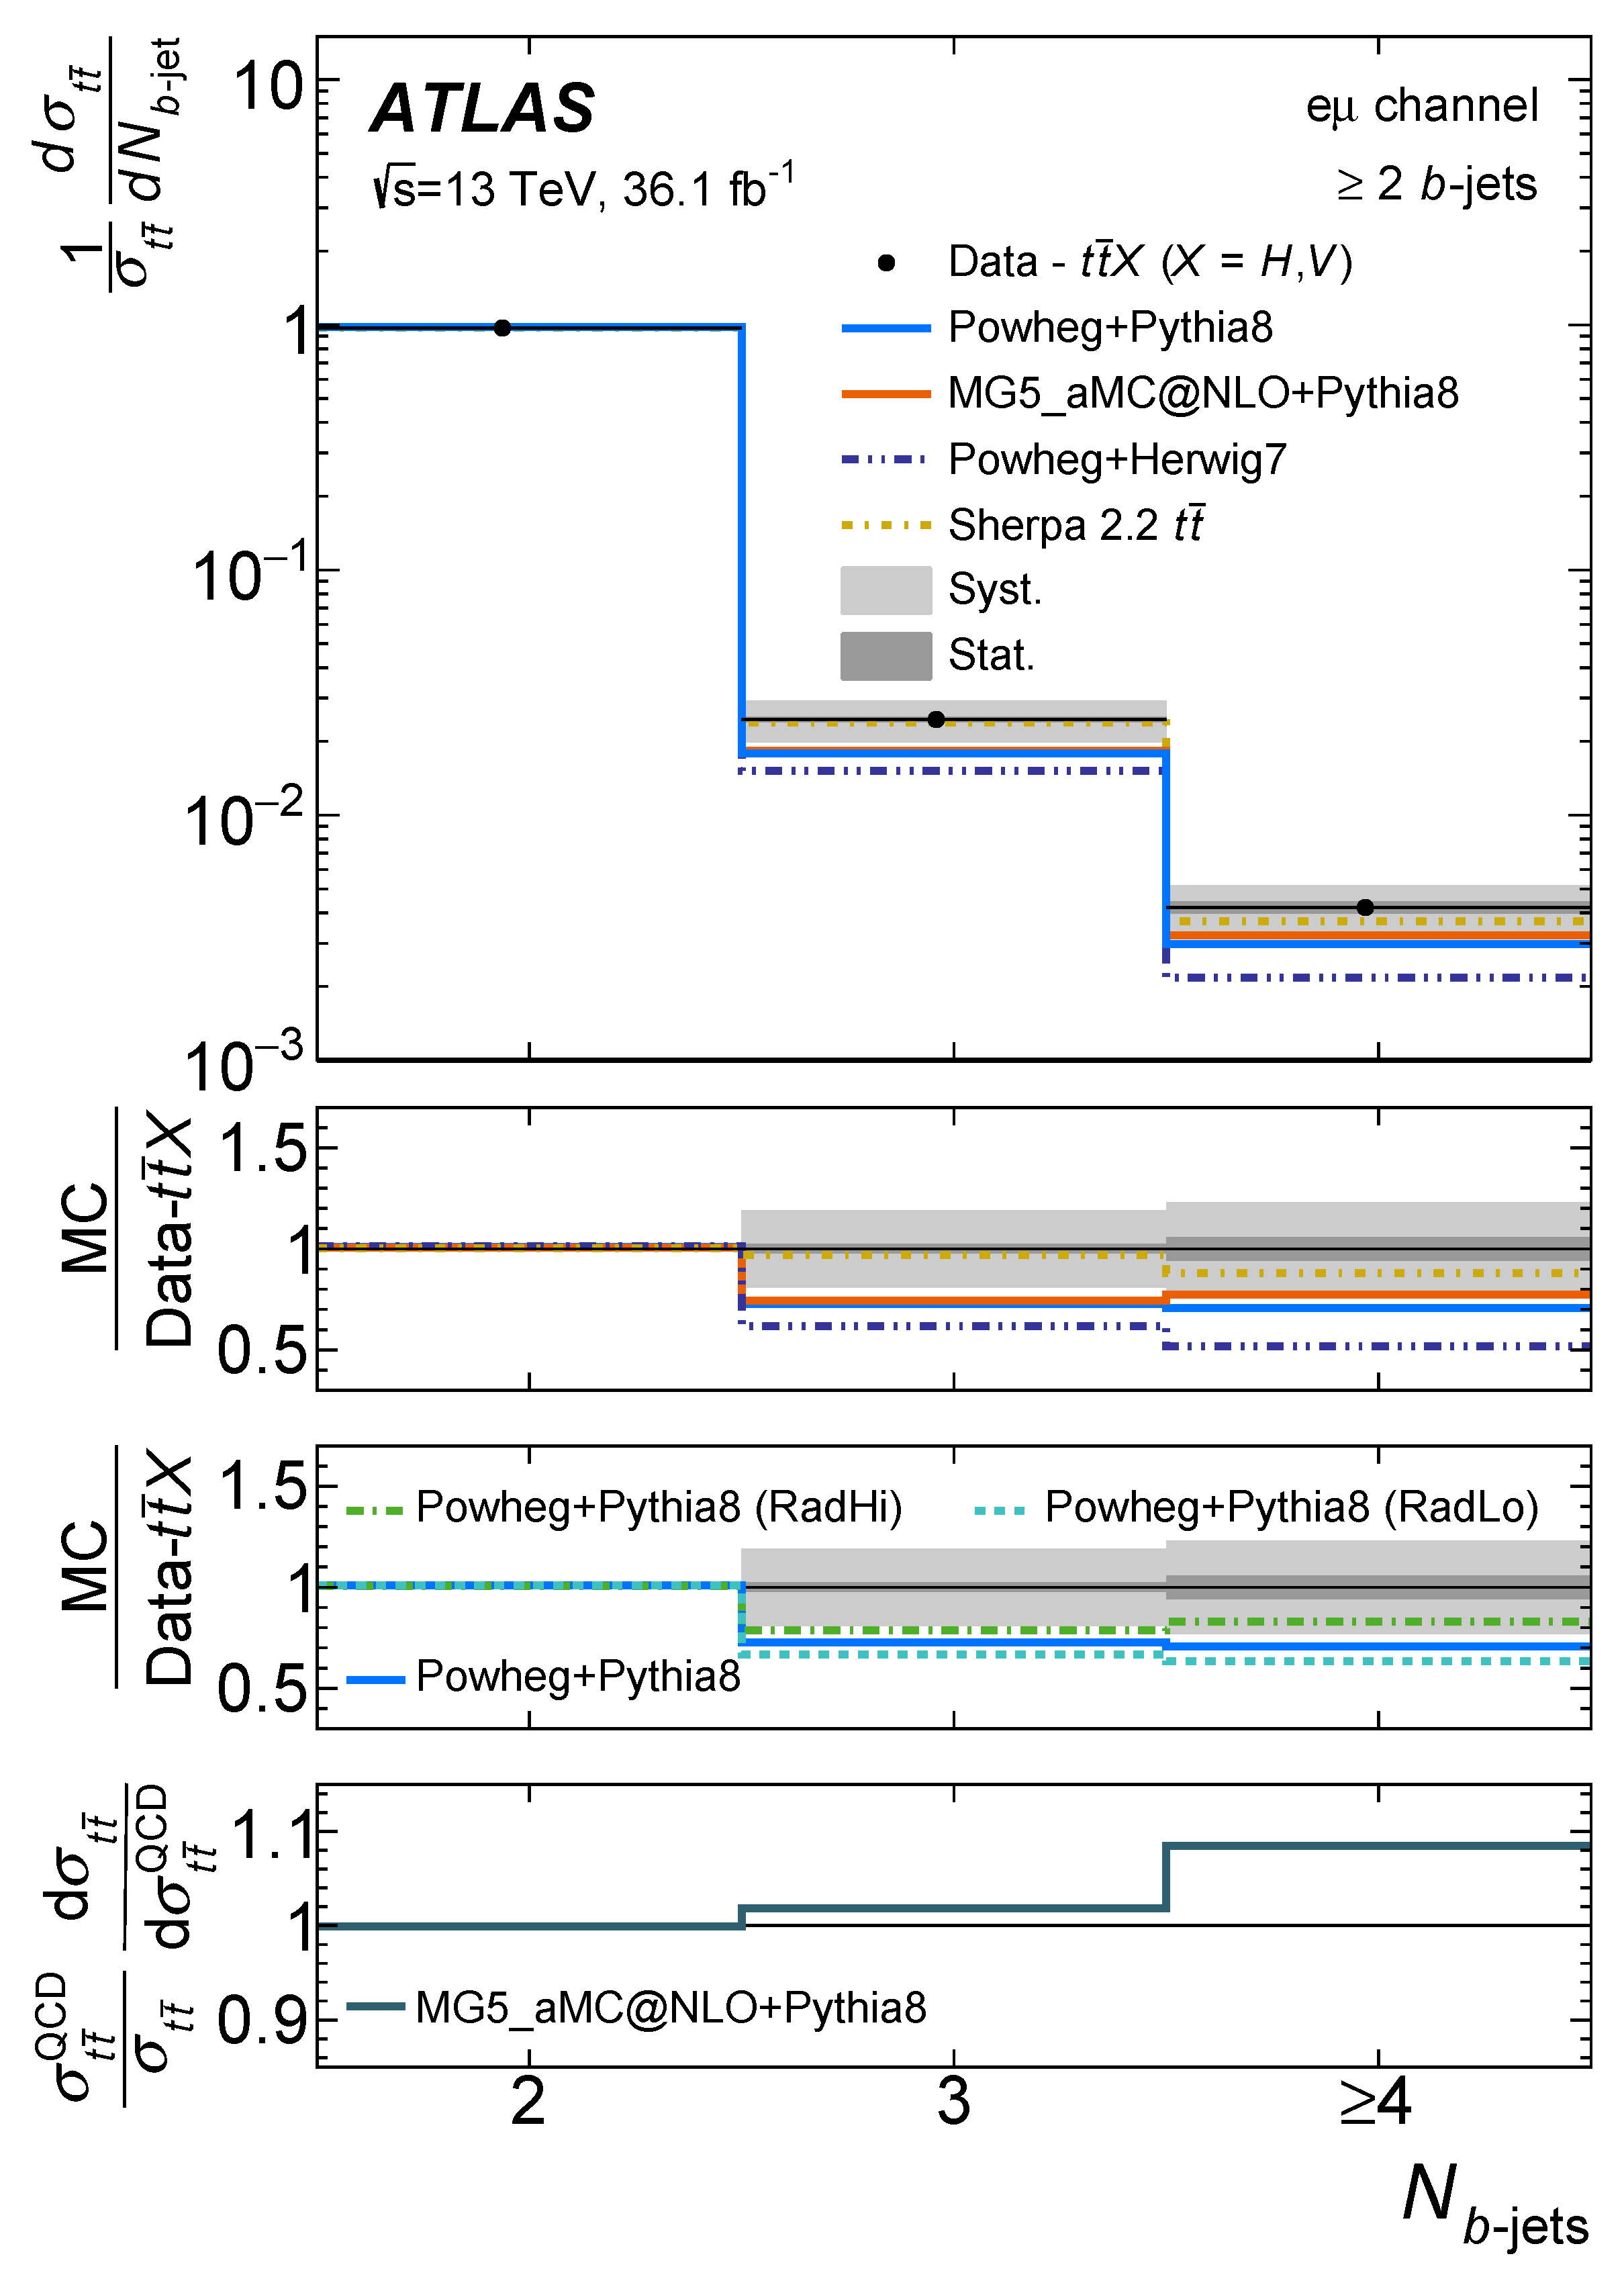
Once the reconstructed level distributions of t t ¯ + heavy-flavor events are extracted, then the measured distributions are unfolded to the particle level. The detector resolution effect and inefficiency are corrected by inverting the migration matrix which is optimized for a diagonal matrix. An iterative Bayesian unfolding technique [22] implemented in the RooUnfold software package [23] is used in this process. Detector efficiencies and acceptance are then corrected using a bin by bin method. Figure 8 shows the normalized cross-section as a function of the b jet multiplicity compared with predictions from various generator set-ups. The first three panels show the ratios of various predictions to data. The last panel shows the ratio of predictions of normalized differential cross-sections from MadGraph 5_aMC@NLO+pythia 8, including or not the contributions from the t t ¯ H and t t ¯ V processes. All predictions relying on the parton shower generation of jets for high multiplicities are lower compared to measurements. This suggests that the b jet production by the parton shower is not optimal in these processes. The comparison of the predictions from various generators with the measurements are made after subtracting the simulation-estimated contributions of t t ¯ V and t t ¯ H production from the data. The impact of including these processes in the prediction increases with b jet multiplicity, resulting in a change of about 10% relative to the QCD t t ¯ prediction alone in the inclusive four b jet bin. The measurement in the e μ channel with at least 3 b jets tends to be more precise than in the lepton + jets channel with at least 4 b jets.
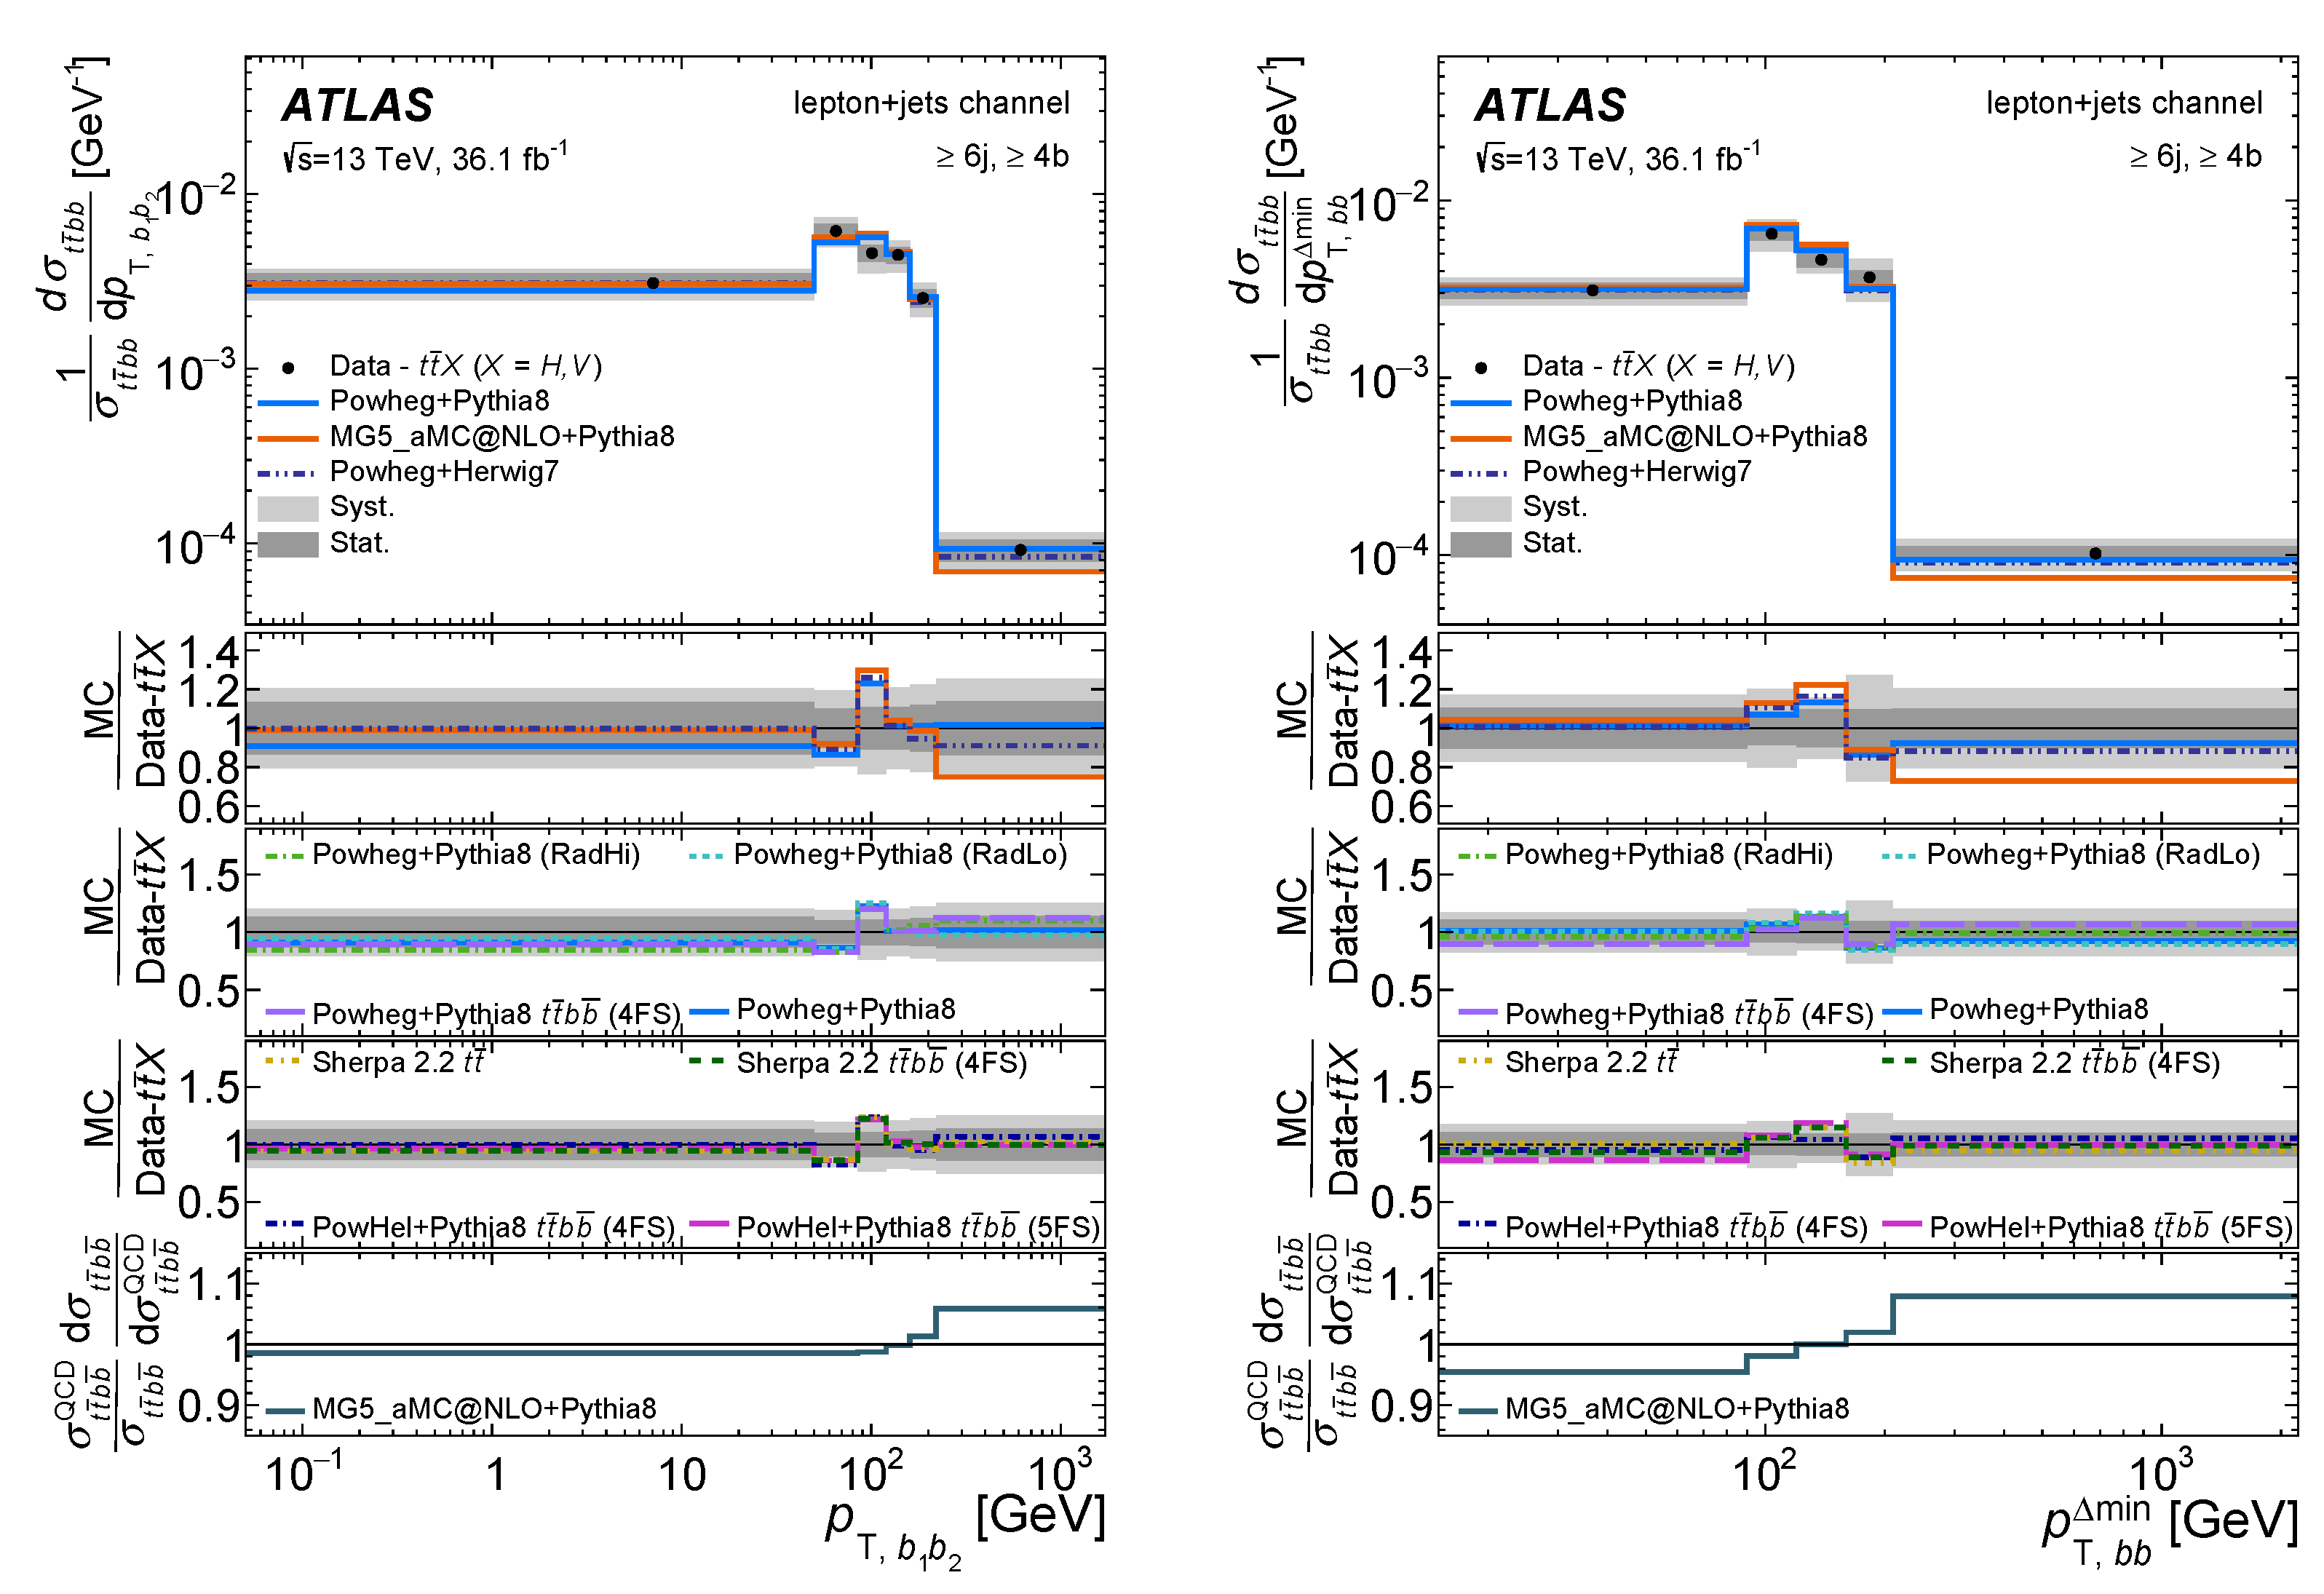
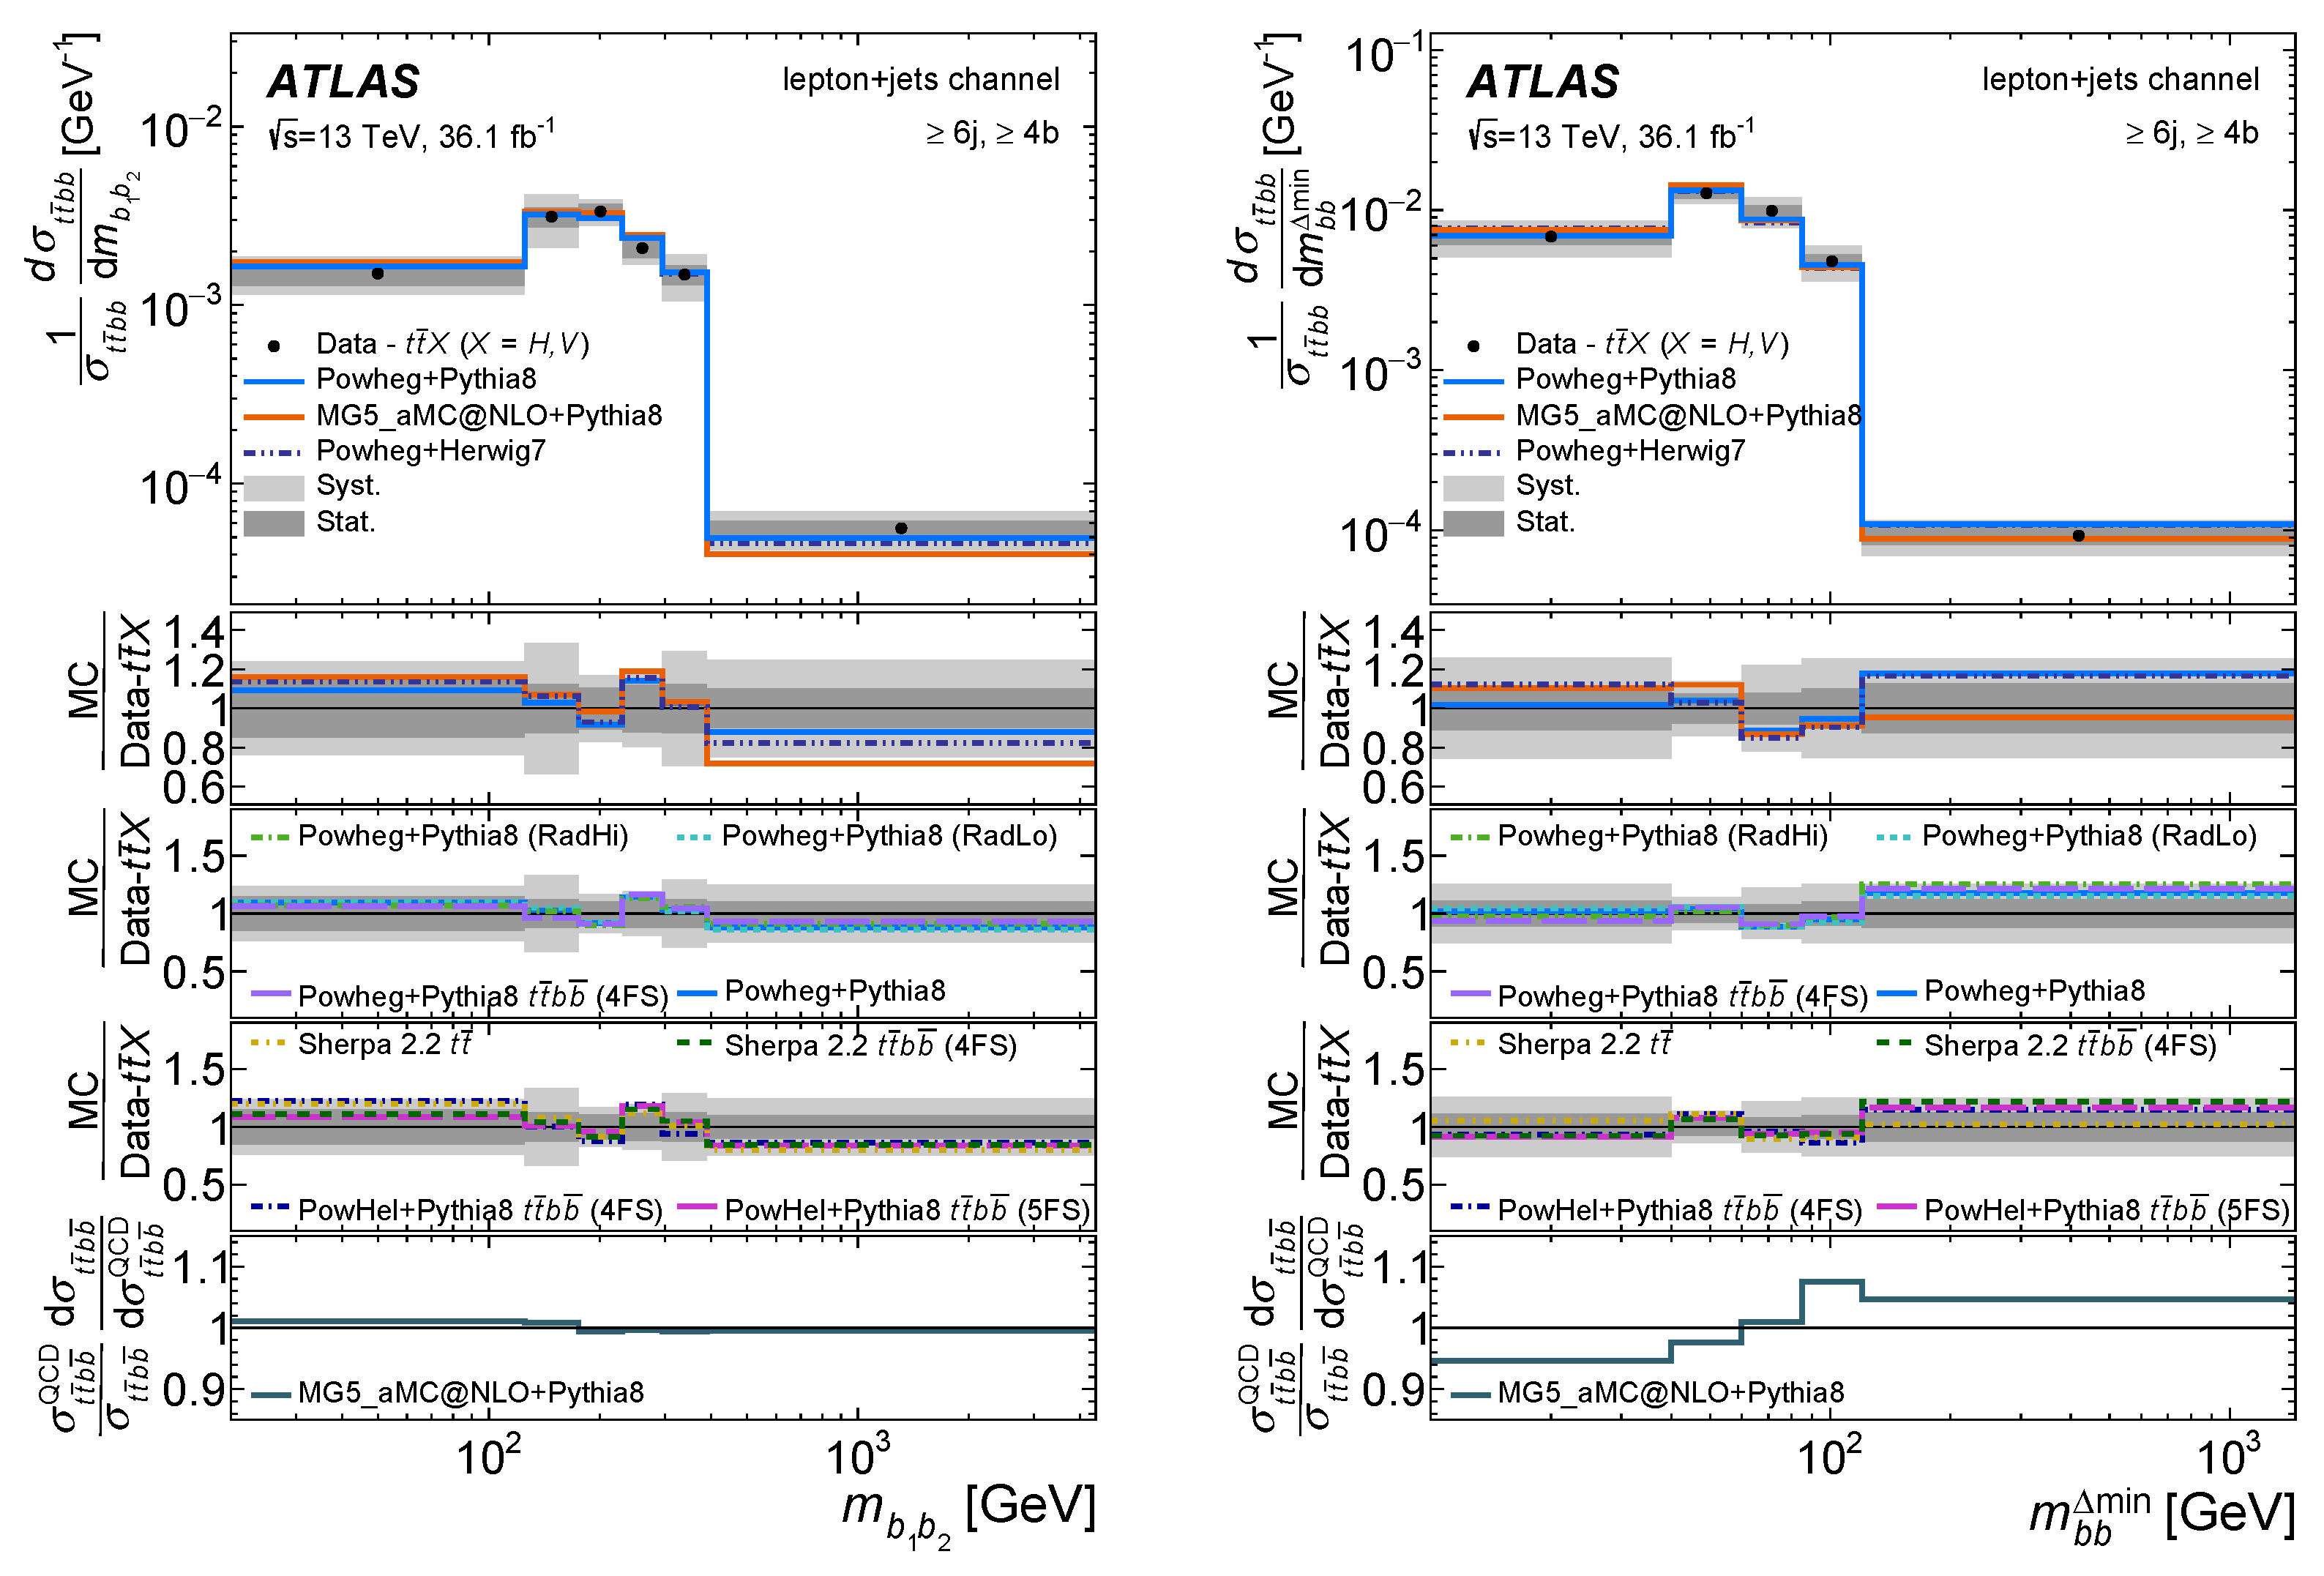
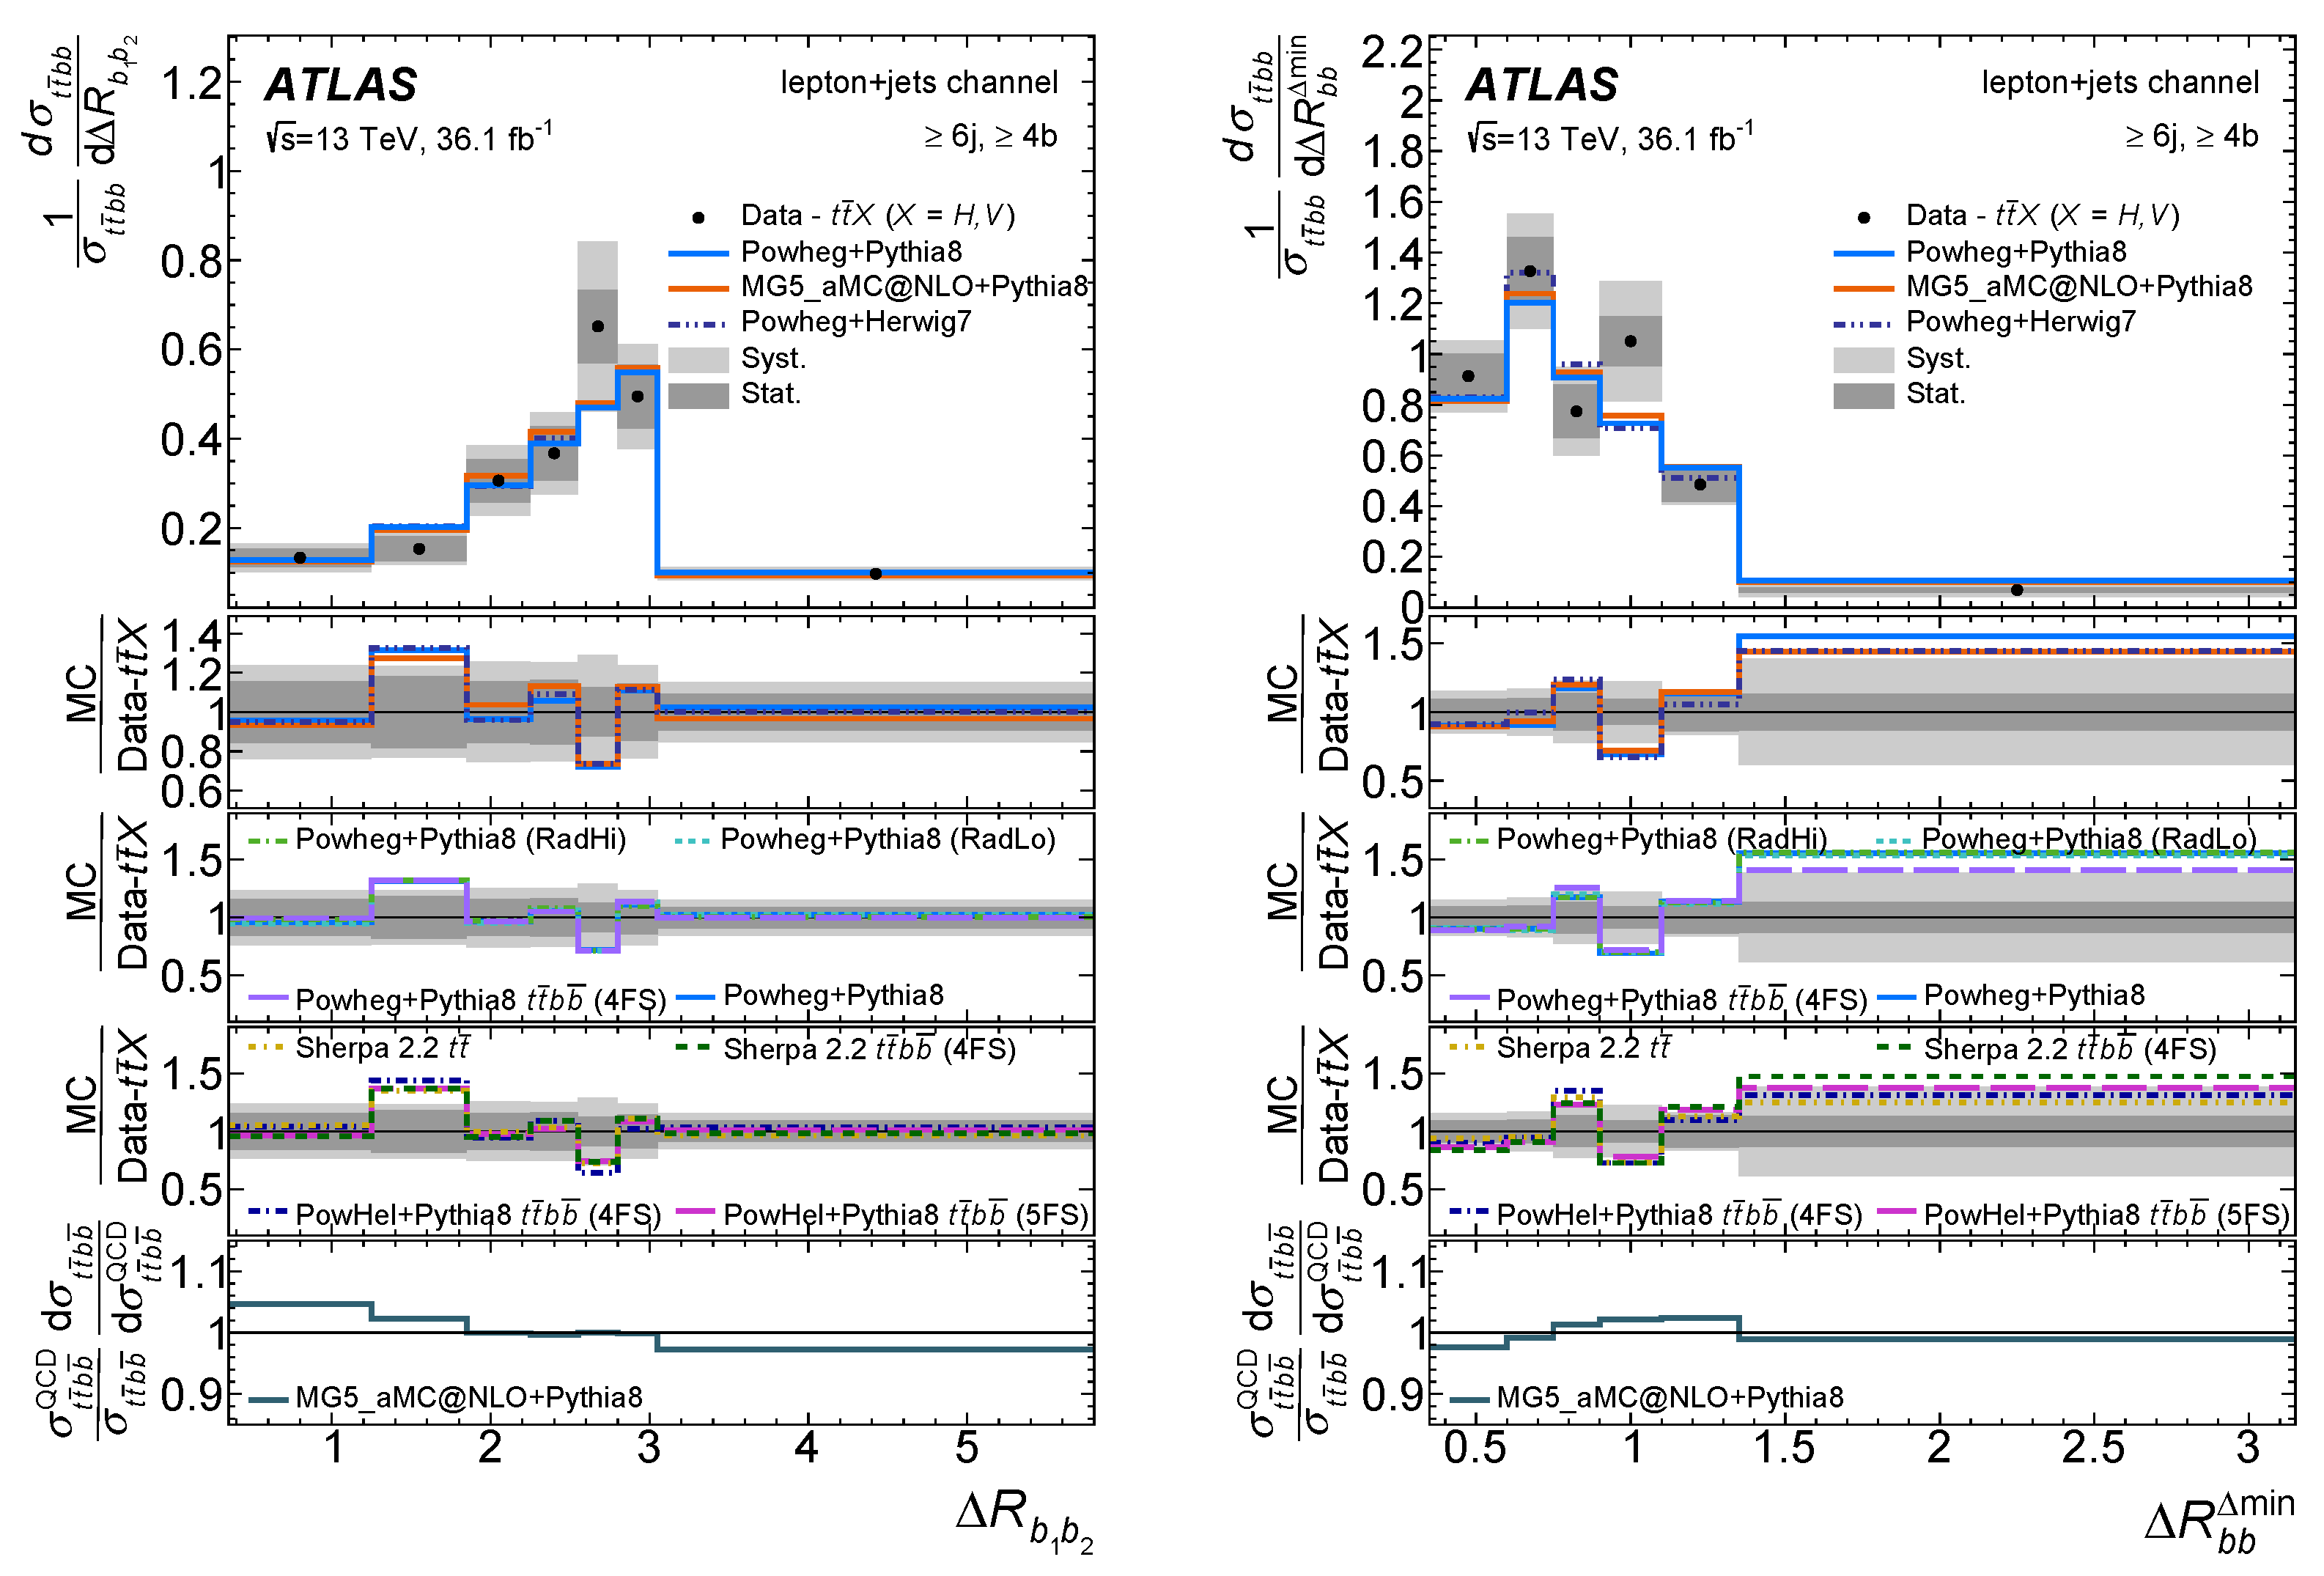
It is also of importance to check the distributions of the p T , the mass and the angular distance Δ R of the two b jets where the b 1 b 2 system is built from the two highest- p T b jets and the two closest b jets in Δ R . The measured distributions of those three variables in the lepton + jets channel are shown in Figure 9, Figure 10 and Figure 11. The differential cross-section as a function of the p T of the b 1 b 2 system is measured with a precision of 10%–15% over the full range in the e μ channel and with an uncertainty of 20%–25% in the lepton + jets channel. In general, the differential distributions are well described by the different theoretical predictions, which vary significantly less compared to the size of the experimental uncertainty. All other distributions such as H T or p T of additional b jets are available in Ref [14].
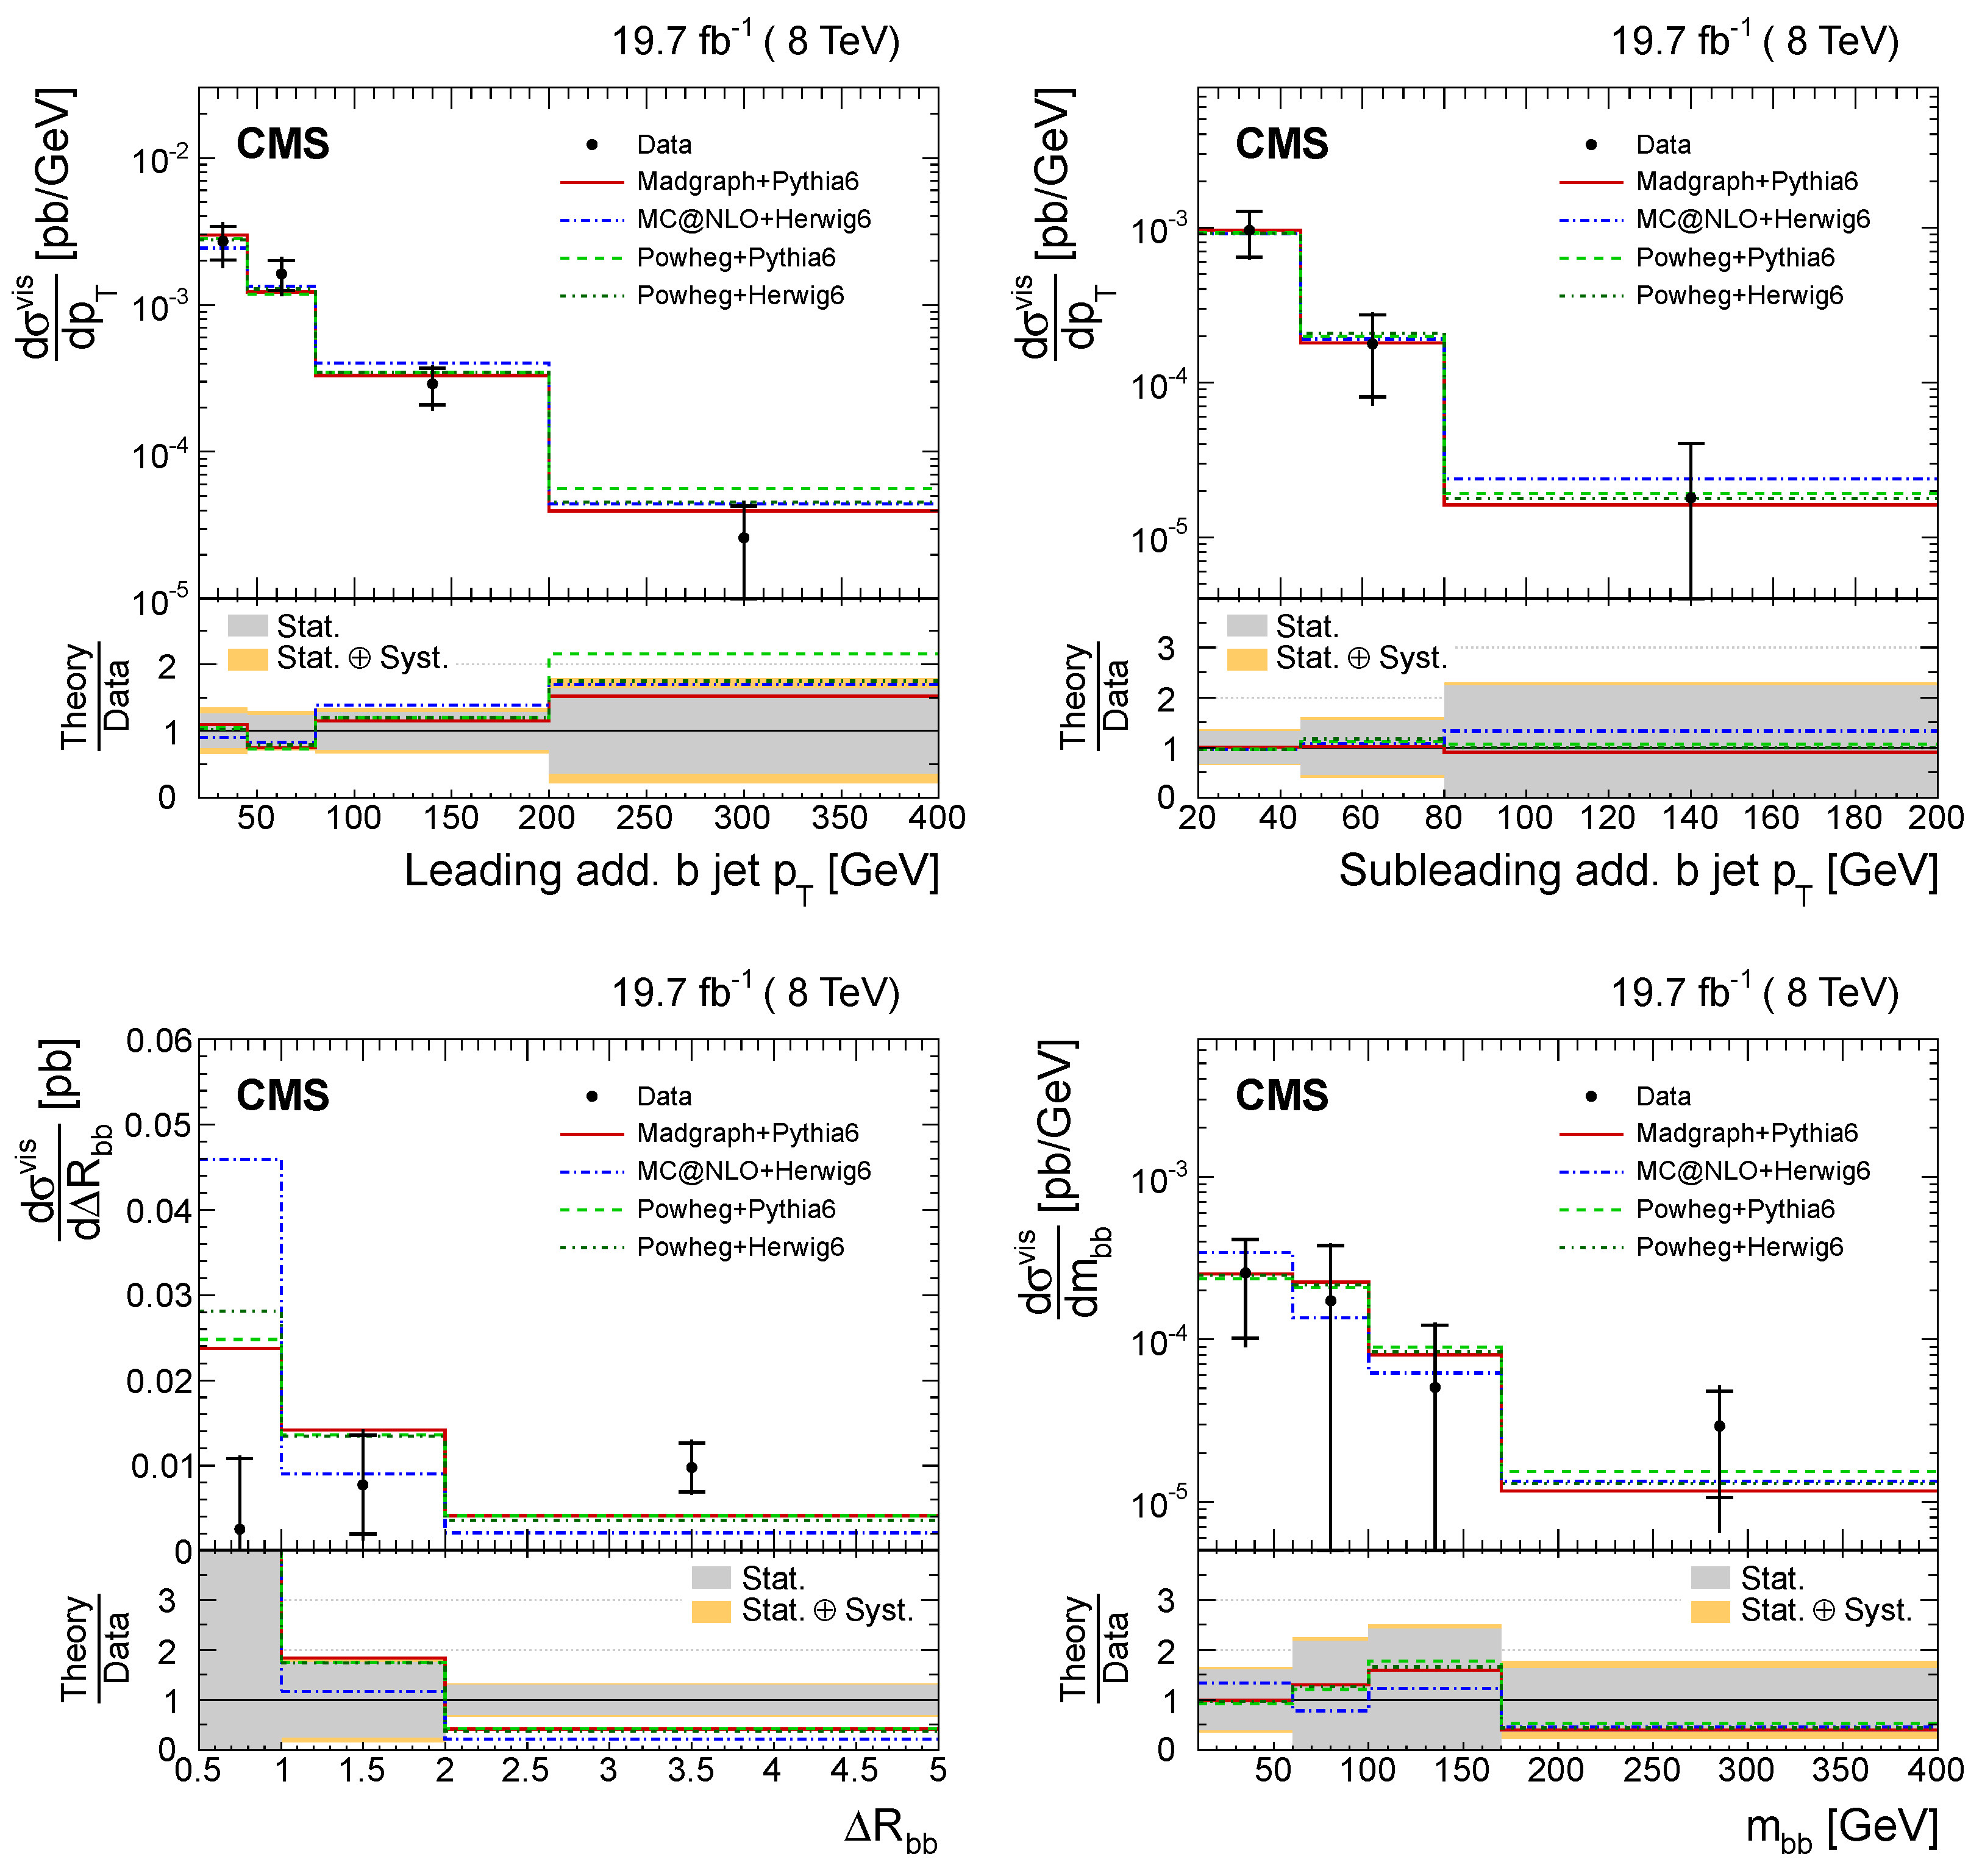
In CMS, the differential cross sections are measured in the visible phase space as a function of various kinematic properties such as the p T and η of the leading and subleading additional b jets, the angular distance Δ R between them and the invariant mass m b b ¯ of the two additional b jets. In particular, the differential cross sections as a function of the m b b ¯ and Δ R are of interest as the two additional b jets from a gluon tend to be produced collinearly and those from the H boson have the resonance peak at 125 GeV.
At the reconstruction level, it is very challenging to identify two additional b jets because there are 4 b jets from top quarks and a gluon splitting. To select the additional b jets, the multivariate approach of a Boosted Decision Tree (BDT) was used to maximize the correct assignment of additional b jets. The input variables to the BDT combine information from the two final-state leptons, the jets, and E T m i s s . A total of twelve variables, e.g. the sum and difference of the invariant mass of the b l + and b ¯ l system, m b l + ± m b ¯ l ; the absolute difference in the azimuthal angle between them, | Δ ϕ b l + , b ¯ l | ; the p T of the b l + and b ¯ l system, p T b l + and p T b ¯ l ; and the difference between the invariant mass of the two b jets and two leptons and the invariant mass of the b b ¯ pair, m b b ¯ l + l m b b ¯ are used as input variables. Those variables insensitive to the additional radiation are selected to avoid any dependence on the kinematics of the additional jets. The jets from the t t ¯ system are identified as the pair with the highest BDT discriminant. From the remaining jets, those b-tagged jets with the highest p T are selected as being the leading additional ones. With this method, the correct assignment rate for the additional b jets in t t ¯ b b ¯ events is around 40%.
A template fit to the b-tagged jet multiplicity distribution is performed to improve the data and simulation comparison. For the differential cross section measurements, effects from detector efficiency and resolution are corrected by using the regularized inversion of the response matrix which is calculated from simulated t t ¯ events. The measured differential cross sections as a function of the leading and subleading additional b jet p T , the Δ R and invariant mass of two additional b jets are shown in Figs. Figure 12 for CMS. Measured cross-sections are compared with various theoretical predictions. The shape of the p T distributions are well described by prediction. However, the measured values by CMS have larger uncertainties due to the use of a smaller data sample with respect to ATLAS.
4. Discussion

The results from the Run 1 and Run 2 data analyses of ATLAS and CMS of the measured inclusive cross sections of t t ¯ +heavy-flavor jets are higher than the theoretical predictions. It will be interesting to observe if these differences become significant with additional data. There were also attempts to measure the differential cross-sections aiming to identify variables where the differences become larger. The measured differential cross-sections are in general consistent with theory predictions. However, in the Δ R distribution, the HERWIG prediction tends to produce the two additional b jets with smaller angles than the measured value.
In the realm of t t ¯ + heavy-flavor, there is a large fraction of Run-2 data yet to be analyzed and we expect twice more data in Run-3 at the LHC in the coming years. We can envisage reducing not only the statistical uncertainty but also systematic uncertainties as more data would enable more data-driven techniques. More data will also allow using a smaller bin width to enable hints about potential discrepancies in the inclusive measurements. More advanced heavy-flavor tagging would distinguish the c-flavor jet better from the b-flavor jets. Novel flavor tagging developments can indeed increase our understanding of pQCD and the potential to discover potential new physics. More synchronized definitions are also required to compare or combine results from ATLAS and CMS.
As we have a systematically higher measured value of cross-section of the t t ¯ +heavy-flavor compared to prediction, more data from Run-3 and eventually from the High Luminosity-LHC would give interesting opportunities to find cracks in our theoretical understanding. We should also make use of the effective field theory (EFT) approach for possible new physics. To interpret experimental measurements in the context of physics beyond the standard model, the EFT approach is of interest as a model-independent approach [24]. Differential measurements would be crucial in this approach as the presence of the SMEFT operators can modify the kinematics in the standard model processes.

5. Conclusions

The inclusive and differential cross sections for the t t ¯ + heavy-flavor jet production have been measured extensively in ATLAS and CMS for the various phase spaces using data samples collected in pp collisions at s = 7, 8 and 13 TeV. The ratio of the cross sections of the t t ¯ + heavy-flavor jets with respect to the cross-section of the t t ¯ + additional jets is also measured aiming for reduced uncertainties as many kinematic distributions are expected to be similar between the t t ¯ + heavy-flavor jets and the t t ¯ + additional jets. These measured cross-sections systematically tend to be higher than predictions. The measurements are dominated by systematic uncertainties that could be reduced by deploying data-driven techniques to better control the impact of backgrounds and reconstruction-related systematic uncertainties. Having more data in the coming years with a better understanding of detectors and more sophisticated reconstruction techniques will bring us to the precision era where possible new physics could finally reveal.

Institutional Review Board Statement

Not applicable.

Informed Consent Statement

Not applicable.

Acknowledgments

This work was supported under the framework of international cooperation program managed by the National Research Foundation of Korea (NRF-2022K2A9A1A06093535). J.D. is supported in part by the Strategic Research Program “High-Energy Physics” of the VUB.

Conflicts of Interest

The authors declare no conflict of interest.

References

  1. CMS Collaboration, Observation of tt¯H Production, Phys. Rev. Lett. 2018, 120, 231801. [CrossRef] [PubMed]
  2. ATLAS Collaboration, Observation of Higgs boson production in association with a top quark pair at the LHC with the ATLAS detector, Phys. Lett. B 2015, 784.
  3. S. Hoeche et al., Next-to-leading order QCD predictions for top-quark pair production with up to two jets merged with a parton shower. Phys. Lett. B 2015, 748, 74. [CrossRef]
  4. M. Worek and G. Bevilacqua, On the ratio of tt¯bb¯ and tt¯jj¯ cross sections at the CERN Large Hadron Collider. JHEP 2014, 7, 135.
  5. A. Bredenstein, A. Denner, S. Dittmaier, and S. Pozzorini, NLO QCD corrections to ttbb production at the LHC: 1. Quark-antiquark annihilation. JHEP 2008, 8, 108. [CrossRef]
  6. A. Bredenstein, A. Denner, S. Dittmaier, and S. Pozzorini, NLO QCD corrections to pp →tt¯bb¯ + X at the LHC. Phys. Rev. Lett. 108, 103, 012002.
  7. F. Cascioli et al., NLO matching for tt¯bb¯ production with massive b quarks. Phys. Lett. B 2014, 734, 210. [CrossRef]
  8. M. V. Garzelli, A. Kardos and Z. Trócsányi, Hadroproduction of tt¯bb¯ final states at LHC: predictions at NLO accuracy matched with Parton Shower. 2015, 3, 083.
  9. G. Bevilacqua, M. V. Garzelli and A. Kardos, tt¯bb¯ hadroproduction with massive bottom quarks with PowHel. 2017; arXiv:1709.06915 [hep-ph].
  10. T. Jezo, J. M. Lindert, N. Moretti, and S. Pozzorini, New NLOPS predictions for tt¯ + b jet production at the LHC. Eur. Phys. J. C 2018, 78, 502. [CrossRef]
  11. F. Buccioni, S. Kallweit, S. Pozzorini, and M. F. Zoller, “NLO QCD predictions for tt¯bb¯ production in association with a light jet at the LHC”. JHEP 2019, 12, 015.
  12. ATLAS Collaboration, Study of heavy-flavor quarks produced in association with top-quark pairs at s =7 TeV using the ATLAS detector. Phys. Rev. D 2014, 89, 072012. [CrossRef]
  13. ATLAS Collaboration, Measurements of fiducial cross-sections for tt¯ production with one or two additional b-jets in pp collisions at s =8 TeV using the ATLAS detector, Eur. Phys. J. C 2016, 76, 11.
  14. ATLAS Collaboration, Measurements of inclusive and differential fiducial cross-sections of tt¯ production with additional heavy-flavour jets in proton-proton collisions at s = 13 TeV with the ATLAS detector. JHEP 2019, 4(46).
  15. CMS Collaboration, Measurement of tt¯ production with additional jet activity, including b quark jets, in the dilepton decay channel using pp collisions at s= 8 TeV, Eur. Phys. J. C 2016, 76, 379.
  16. CMS Collaboration, Measurement of the cross section ratio σtt¯bb¯/σtjj in pp collisions at s = 8 TeV, Phys. Lett. B 2015, 746, 132–153. [CrossRef]
  17. CMS Collaboration, Measurements of tt¯ cross sections in association with b jets and inclusive jets and their ratio using dilepton final states in pp collisions at s = 13 TeV. Phys. Lett. B 2018, 776, 355–278. [CrossRef]
  18. CMS Collaboration, Measurement of the cross section for tt¯ production with additional jets and b jets in pp collisions at s= 13 TeV. JHEP 2020, 7, 125.
  19. CMS Collaboration, Measurement of the tt¯bb¯ production cross section in the all-jet final state in pp collisions at s= 13 TeV. Phys. Lett. B 2020, 803, 135285. [CrossRef]
  20. CMS Collaboration, First measurement of the cross section for top quark pair production with additional charm jets using dileptonic final states in pp collisions at s = 13 TeV. Phys. Lett. B 2021, 820, 136565. [CrossRef]
  21. Available online:. Available online: https://twiki.cern.ch/twiki/bin/view/CMSPublic/PhysicsResultsTOPSummaryFigures (accessed on 5 March 2023).
  22. G. D’Agostini, A multidimensional unfolding method based on Bayes’ theorem. Nucl. Instrum. Meth. A 1995, 362, 487. [CrossRef]
  23. T. Adye, Unfolding algorithms and tests using RooUnfold, in Proceedings, PHYSTAT 2011 Workshop on Statistical Issues Related to Discovery Claims in Search Experiments and Unfolding, CERN, Geneva, Switzerland, 17–20 January 2011, CERN-2011-006, CERN, Geneva, Switzerland (2011), pg. 313.
  24. J. D’Hondt, A. Mariotti, K. Mimasu, S. Moortgat, and C. Zhang Learning to pinpoint effective operators at the LHC: a study of the tt¯bb¯ signature. JHEP 2018, 11, 131.
Figure 1. An example of the Feynman diagram of the t t ¯ b b ¯ and t t ¯ c c ¯ processes at the LHC in the lepton+jets channel.
Preprints 70077 g001
Figure 2. The visible phase space cross-sections measured by ATLAS compared with t t ¯ b b ¯ predictions obtained using Sherpa 2.2, Powheg +pythia 8 and PowHel +pythia 8 t t ¯ b b ¯ . The t t ¯ H and t t ¯ V processes are subtracted from the measurement to facilitate the comparison with theory [14].
Preprints 70077 g002
Figure 3. Measurement of the ratio between the t t ¯ b b ¯ and t t ¯ j j ¯ visible cross sections at s =8 TeV by ATLAS [13].
Preprints 70077 g003
Figure 4. The measured t t ¯ b b ¯ cross-sections in the full phase space in the dilepton channel (upper) and the lepton+jet channel (lower) from the CMS experiment. The dark (light) shaded bands show the statistical (total) uncertainties on the measured values [18].
Preprints 70077 g004
Figure 5. The measured t t ¯ b b ¯ cross-sections in the hadronic channel in the Parton-Independent (left), Parton-Based (center) and Full phase space (right) from the CMS experiment. The dark (light) shaded bands show the statistical (total) uncertainties on the measured values [19].
Preprints 70077 g005
Figure 6. Results of the t t ¯ b b ¯ versus t t ¯ c c ¯ cross section measured by CMS in the fiducial phase space, and their ratios to the inclusive t t ¯ +two jets cross section [20].
Preprints 70077 g006
Figure 7. The t t ¯ b b ¯ cross sections in the various channels for the full phase space measured by CMS [21].
Preprints 70077 g007
Figure 8. The relative differential cross-section as a function of the b jet multiplicity in events with at least two b jets in the e μ channel compared with various generators. The t t ¯ H and t t ¯ V contributions are subtracted from data. Uncertainty bands represent the statistical and total systematic uncertainties [14].
Preprints 70077 g008
Figure 9. Relative differential cross-sections as a function of p T of the two highest- p T b jets (left) and the two closest b jets in Δ R (right) in the events with at least four b jets in the lepton + jets channel compared with various generators from the ATLAS measurements. The contributions from t t ¯ H and t t ¯ V are subtracted from data [14].
Preprints 70077 g009
Figure 10. Relative differential cross-sections as a function of m b 1 b 2 of the two highest- p T b jets (left) and the two closest b jets in Δ R (right) in the events with at least four b jets in the lepton + jets channel compared with various generators from the ATLAS measurements. The contributions from t t ¯ H and t t ¯ V are subtracted from data [14].
Preprints 70077 g010
Figure 11. Relative differential cross-sections as a function of Δ R b 1 , b 2 of the two highest- p T b jets (left) and the two closest b jets in Δ R (right) in the events with at least four b jets in the lepton + jets channel compared with various generators from the ATLAS measurements. The contributions from t t ¯ H and t t ¯ V are subtracted from data [14].
Preprints 70077 g011
Figure 12. Absolute differential t t ¯ cross sections as a function of the leading and subleading additional b jet p T (upper) and angular separation and invariant mass of two additional b jets (lower) in the visible phase space at the CMS. Inner vertical bars indicate the statistical uncertainties [15].
Preprints 70077 g012
Table 1. Signal definitions at particle level in each measurement.
  Phase Space     Process      ATLAS    CMS
Full t t ¯ b b ¯ - ≥ 2b not from t [15,16,17,18]
t t ¯ c c ¯ - ≥ 2c not from t [20]
Visible t t ¯ b b ¯ (di-lepton)  1e, 1 μ , ≥ 3(4)b [12,13,14] ≥ 2l, ≥ 4b [15,16,17,18]
t t ¯ b b ¯ (semi-lepton)  1l, ≥ 5(6)j, ≥ 3(4)b [12,13,14] 1l, ≥ 6j, ≥ 4b [18]
t t ¯ b b ¯ (fully hadron)  - ≥ 8j, ≥ 4b [19]
t t ¯ c c ¯ (di-lepton)  - ≥ 2l, ≥ 2b, ≥ 2c [20]
Table 2. Measured t t ¯ b b ¯ cross sections compared with predictions from Sherpa 2.2 in the visible phase space at s = 13 TeV by ATLAS. The t t ¯ H and t t ¯ V contributions are subtracted from the measurement. The statistical and dominating systematical uncertainties on the measurements are presented.
Channel Measurements (pb) Predictions (pb) Phase space
t t ¯ b b ¯
( e μ ) [14] 177 ± 5 ± 24 103 ± 30 ≥ 3b
( e μ ) [14] 25 ± 3 ± 7 17.3 ± 4.2 ≥ 4b
(lepton+jets) [14]   2370 ± 40 ± 690 1600 ± 530 ≥ 5j, ≥ 3b
(lepton+jets) [14]   331 ± 11 ± 61 270 ± 70 ≥ 6j, ≥ 4b
Table 3. Measured and predicted cross-sections in the visible phase space at s = 13 TeV by CMS. In the hadronic channel, the parton-based cross section is shown. The predictions of Powheg are shown.
Channel Measurements (pb) Predictions (pb) b jet requirement
t t ¯ b b ¯
dilepton [17]   0.088 ± 0.012 ± 0.029 0.070 ± 0.009 p T > 20 GeV, | η | < 2.5
dilepton [18]   0.040 ± 0.002 ± 0.005 0.032 ± 0.004 p T > 30 GeV, | η | < 2.4
lepton+jets [18]  0.62 ± 0.03 ± 0.07 0.52 ± 0.06 p T > 20 GeV, | η | < 2.5
hadronic [19] 1.6 ± 0.1 0.4 + 0.5       1.0 ± 0.2 p T > 20 GeV, | η | < 2.5
dilepton [20]    0.132 ± 0.010 ± 0.015 0.097 ± 0.021 p T > 20 GeV, | η | < 2.4
t t ¯ c c ¯
dilepton [20] 0.207 ± 0.025±0.027 0.187 ± 0.038 p T > 20 GeV, | η | < 2.4
Table 4. Measured and predicted cross-section ratios in the visible phase space at s = 13 TeV by CMS. The predictions of Powheg +pythia 8 are shown.
Channel Measurements (%) Predictions (%) b jet requirement
t t ¯ b b ¯ / t t ¯ j j ¯
dilepton [17] 2.4 ± 0.3 ± 0.7 1.4 ± 0.1 p T > 20 GeV, | η | < 2.5
dilepton [18] 1.7 ± 0.1 ± 0.1 1.3 ± 0.2 p T > 30 GeV, | η | < 2.4
lepton+jets [18] 2.0 ± 0.1 ± 0.1 1.7 ± 0.2 p T > 20 GeV, | η | < 2.5
dilepton [20]   1.93 ± 0.15 ± 0.18 1.31 ± 0.12 p T > 20 GeV, | η | < 2.4
t t ¯ c c ¯ / t t ¯ j j ¯
dilepton [20]   3.01 ± 0.34 ± 0.31 2.53 ± 0.18 p T > 20 GeV, | η | < 2.4
Table 5. Measured and predicted cross-sections in the full phase space at s = 13 TeV by CMS. The predictions of Powheg +pythia 8 prediction are shown.
Channel Measurements (pb) Predictions (pb) b jet requirement
t t ¯ b b ¯
dilepton [17]     4.0 ± 0.6 ± 1.3 3.2 ± 0.4 p T > 20 GeV, | η | < 2.5
dilepton [18]     2.9 ± 0.1 ± 0.5 2.3 ± 0.4 p T > 30 GeV, | η | < 2.4
lepton+jets [18]     4.7 ± 0.2 ± 0.6 3.9 ± 0.4 p T > 20 GeV, | η | < 2.5
hadronic [19] 5.5 ± 0.3 1.3 + 1.6 3.5 ± 0.6 p T > 20 GeV, | η | < 2.5
dilepton [20]       4.54 ± 0.34 ± 0.56 3.34 ± 0.72 p T > 20 GeV, | η | < 2.4
t t ¯ c c ¯
dilepton [20]   10.1 ± 1.2 ± 1.4 9.1 ± 1.8 p T > 20 GeV, | η | < 2.4
Table 6. Measured and predicted cross-section ratios in the full phase space at s = 13 TeV by CMS. The predictions of Powheg +pythia 8 prediction are shown.
Channel Measurements (%) Predictions (%) b jet requirement
t t ¯ b b ¯ / t t ¯ j j ¯
dilepton [17] 2.2 ± 0.3 ± 0.6 1.2 ± 0.1 p T > 20 GeV, | η | < 2.5
dilepton [18] 1.8 ± 0.1 ± 0.2 1.4 ± 0.3 p T > 30 GeV, | η | < 2.4
lepton+jets [18] 1.6 ± 0.1 ± 0.1 1.3 ± 0.2 p T > 20 GeV, | η | < 2.5
dilepton [20]   1.51 ± 0.11 ± 0.16 1.03 ± 0.08 p T > 20 GeV, | η | < 2.4
t t ¯ c c ¯ / t t ¯ j j ¯
dilepton [20]   3.36 ± 0.38 ± 0.34 2.81 ± 0.20 p T > 20 GeV, | η | < 2.4
Disclaimer/Publisher’s Note: The statements, opinions and data contained in all publications are solely those of the individual author(s) and contributor(s) and not of MDPI and/or the editor(s). MDPI and/or the editor(s) disclaim responsibility for any injury to people or property resulting from any ideas, methods, instructions or products referred to in the content.
Copyright: This open access article is published under a Creative Commons CC BY 4.0 license, which permit the free download, distribution, and reuse, provided that the author and preprint are cited in any reuse.
Prerpints.org logo

Preprints.org is a free preprint server supported by MDPI in Basel, Switzerland.

Subscribe

© 2024 MDPI (Basel, Switzerland) unless otherwise stated