Preprint
Article

Drug Diffusion inside the Tapered Hydrogel Microneedle: A Numerical Study

Altmetrics

Downloads

257

Views

146

Comments

0

This version is not peer-reviewed

Submitted:

31 March 2023

Posted:

31 March 2023

You are already at the latest version

Alerts
Abstract
Hydrogel microneedles are a promising technology for the delivery of different types of medicines locally and painlessly, as well as ISF extraction. As the hydrogel microneedles are inserted into the tissue, they swell and release drugs. To improve the effectiveness of this technology in delivering medicine at controlled and desirable doses and intervals, a deep understanding of the mechanism of drug delivery inside the microneedles is required. In this work, drug diffusion inside a tapered microneedle is investigated using numerical simulation. The microneedle is divided into many small elements, and the mass transfer equation of meloxicam is solved in each element over time. The skin is simulated as the sink in the microneedle surface for drug absorption. Simulations are performed for different sizes of microneedles. For a microneedle with a height of 500 µm and a base diameter of 250 µm, the drug completely penetrates the skin within 3.2 seconds. The rate of drug diffusion from the tip of the microneedle is higher than diffusion from the side area near the microneedle base. The obtained data demonstrate that in addition to the height and the base diameter, the microneedle’s aspect ratio, h/d, also affects the time of drug diffusion. We present a nonlinear equation to predict the time of complete drug diffusion as a function of the microneedle geometrical parameter, including the height and base diameter. The proposed equation calculates the total drug diffusion time with an error of less than 7% for all studied cases. Predicting drug diffusion patterns inside microneedles can be helpful in the biomedical field, especially in the drug-controlled release system for the optimization of drug delivery.
Keywords: 
Subject: Engineering  -   Bioengineering

1. Introduction

Microneedles (MNs) are microstructural tools designed to carry a variety of drugs and agents locally and painlessly into the tissue [1,2,3]. Because of their small size, they do not reach the network of the nerves, and consequently, they cause no pain during insertion [4,5,6,7,8]. Developing local drug administration is of great interest to many fields [9,10,11,12,13,14]. Drug transport modeling can provide significant insights into MN drug delivery and promote this technology to achieve more desirable results [15].
Based on drug delivery mechanisms, MNs are categorized into solid MN, coated MN, hollow MN, and hydrogel MN (HMN) [16]. Solid MNs are applied as micro punchers to increase tissue permeability. After punching the skin, the drug will be used in the lotion, gel, or liquid form on the surface of the pierced skin [17,18]. Coated MNs are solid MNs that are coated with particular drugs or reagents [19]. When the coated MN is inserted into the tissue, the coating material absorbs the interstitial fluid (ISF) and then the loaded drug on the coating will be released [20]. Hollow MNs are miniaturized forms of conventional needles in medical injections [21]. They are used to deliver liquid reagents. There is another group of MNs fabricated of hydrogel materials in which the drug is embedded [22]. This type of MNs is the main focus of this study.
In HMNs, the drug is loaded within the MN body, as shown in Figure 1A. When the MN is inserted into the tissue, Figure 1B, the MN absorbs the ISF, and the drug is released and penetrates the deeper layer of the tissue, Figure 1C. Before insertion into the skin, the HMN is solid. When the HMN is inserted into the skin, it adsorbs ISF and becomes a liquid or gel. After that, the drug begins to diffuse inside the HMN and then penetrates through the tissue. After drug delivery, the HMNs are removed from the tissue [22]. Remaining MN long time in the tissue may cause undesired side effects. So it is crucial to know how much time is required for complete drug diffusion from the MN to the tissue, which is called Total Diffusion Time (TDT) in the present paper. TDT predicts the required time for HMN to be removed from the skin.
We can divide the drug delivery by the HMN into four phases as shown in Figure 1C: 1) ISF adsorption immediately after insertion into the skin, Figure 1C-i, 2) ISF interaction with the HMN and changing phase into liquid or gel from the solid form, Figure 1C-ii, 3) The drug diffusion inside the HMN body, Figure 1C-iii, and 4) Drug penetration from the HMN boundary to the deeper region of the tissue, Figure 1C-iv.
Phase 1 and Phase 2 were studied by several researchers experimentally and analytically [23,24]. The fourth phase is the same for all types of MNs and was studied more than the other phases in the literature [15,25,26,27,28,29]. Those works investigated drug diffusion within the tissue, and the MN was only simulated as the drug release source. For example, Olatunji et al. [25] investigated the impact of various geometrical parameters of the MN, such as the tip, base radius, and penetration depth of the MN, on the drug permeability in the skin from a coated MN. Ronnander et al. [27] studied drug permeation across the skin tissue from a pyramid-shaped microarray fabricated of dissolvable material experimentally and analytically. They incorporated the effect of MN dissolution on the distribution of the drug concentration in the skin in their mathematical model. Zoudania and Soltani [28] simulated the HMN dissolution in a porous medium. They evaluated the effects of the initial drug concentration and the size of the MNs pitch on the dissolution process and the drug concentration profile in the skin. Castilla-Casadiego et al. [29] assessed drug diffusion through the cow skin at different MN penetration depths into the skin.
In the previous works, the skin was modeled as the computational domain, phase 4, and the drug diffusion was investigated through the skin where the MN was inserted [30]. To the best of our knowledge, there is no publication that considers the transport mechanisms inside the MN body, i.e., phase 3 in Figure 1C-iii. The advancement of microneedle drug delivery technology requires more understanding of the transport mechanisms occurring within the MN body. For HMN it is critical to know how drug diffuses inside the MN body, especially in optimizing controlled drug release systems. Such information also can promote the therapeutic effects of the drug.
In the present work, drug diffusion inside the body of the HMN is simulated. We focus on the third phase of HMN drug delivery, which has received less attention in the literature. Accordingly, a comprehensive 3D model of the tapered MN is developed. Time-dependent drug diffusion inside the HMN is simulated for a given initial loaded drug. The effect of the MN geometrical parameter, such as height, base diameter, and drug diffusion coefficient, on the total diffusion time (TDT) is investigated. Based on the obtained results, a nonlinear relation for predicting the TDT as a function of the MN height and base diameter is developed for the tapered HMN. The obtained data are helpful for the optimal design and fabrication of HMN for controlled drug release systems.

2. Materials and Methods

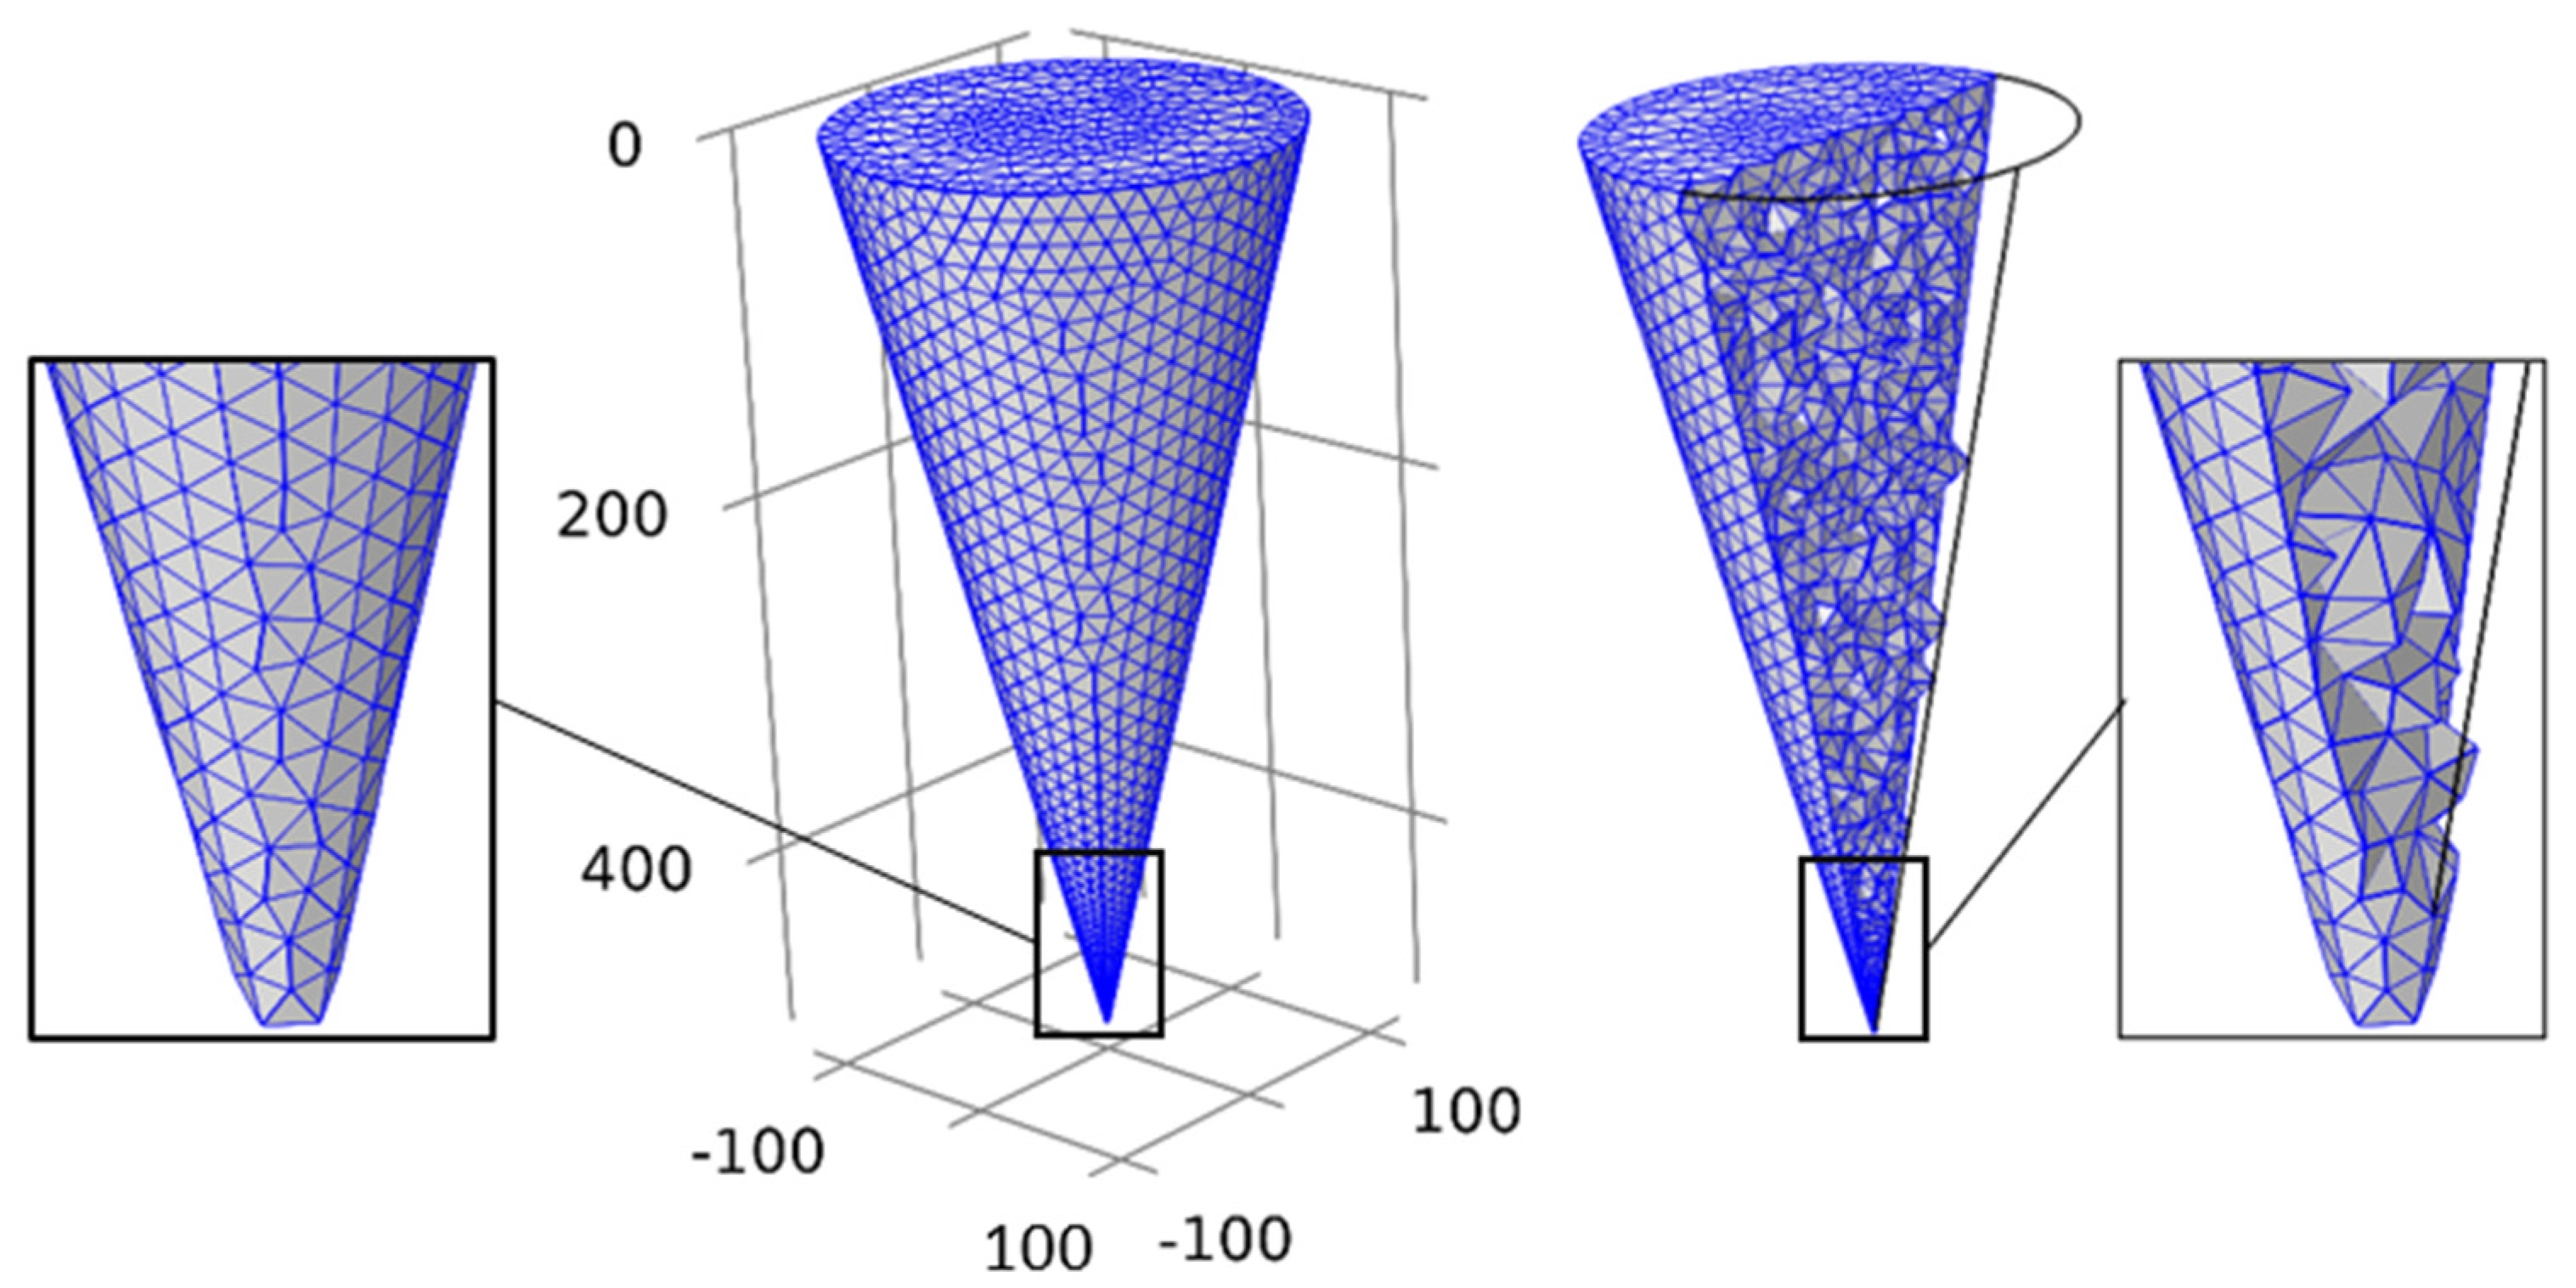
MNs can be fabricated in different shapes, such as tapered, cylindrical, and pyramids. The most commonly used MNs are the tapered ones [9]. Here, a tapered MN was chosen as the computational domain, and the drug diffusion was investigated inside its body. To this aim, we adopted a finite element approach and conducted the simulation with the aid of COMSOL Multiphysics® software. First, a 3D tapered volume was constructed as the MN body. The model was divided into many small elements, and the mass transfer equation was solved in each element. Figure 2 shows the mesh generation of the MN. The independence of the mesh was checked. For a sample MN with a height of 500 µm and base diameter of 250 µm, the generated mesh consisted of about 34,000 elements using finer mesh in the software.

2.1. Governing equation and boundary conditions

The drug diffusion inside the MN body was simulated with the transport of diluted species. In that phase, the body of the MN is saturated with ISF, and there is not any flow inside the MN body. Hence, the effect of the convection on the drug release can be ignored. Also, it is assumed that a drug reaction occurs when the drug reaches the tissue cells or blood capillaries. Therefore, no reaction is considered inside the microneedle body. Using those assumptions, the governing equation of the time-dependent diffusion can be derived as follows [29]:
d c d t + · J = 0 ,
And, Fick’s first law:
J = D c ,
where c(x,y,z,t) is the sample drug concentration (meloxicam) [mol/m3], t is time [s], represents the gradient operator, J is the total flux [m2/s], and D is the diffusion coefficient [m2/s].
Meloxicam is chosen as the sample drug. The diffusion coefficient of meloxicam is considered as D s = 1.5 × 10 9 [m2/s] [29]. To simulate drug diffusion, the uniform drug concentration is assumed through the MN at the initial time C 0 = c x . y . z . 0 = 1.43 × 10 4 mol/m3 [29]. The drug transfers the adjacent tissue due to diffusion. Here, the adjacent tissue to the MN is modeled as the sink that adsorbs the drug,   c x . y . z . t W a l l = 0 .

3. Results and Discussion

3.1. Drug diffusion inside the tapered MN

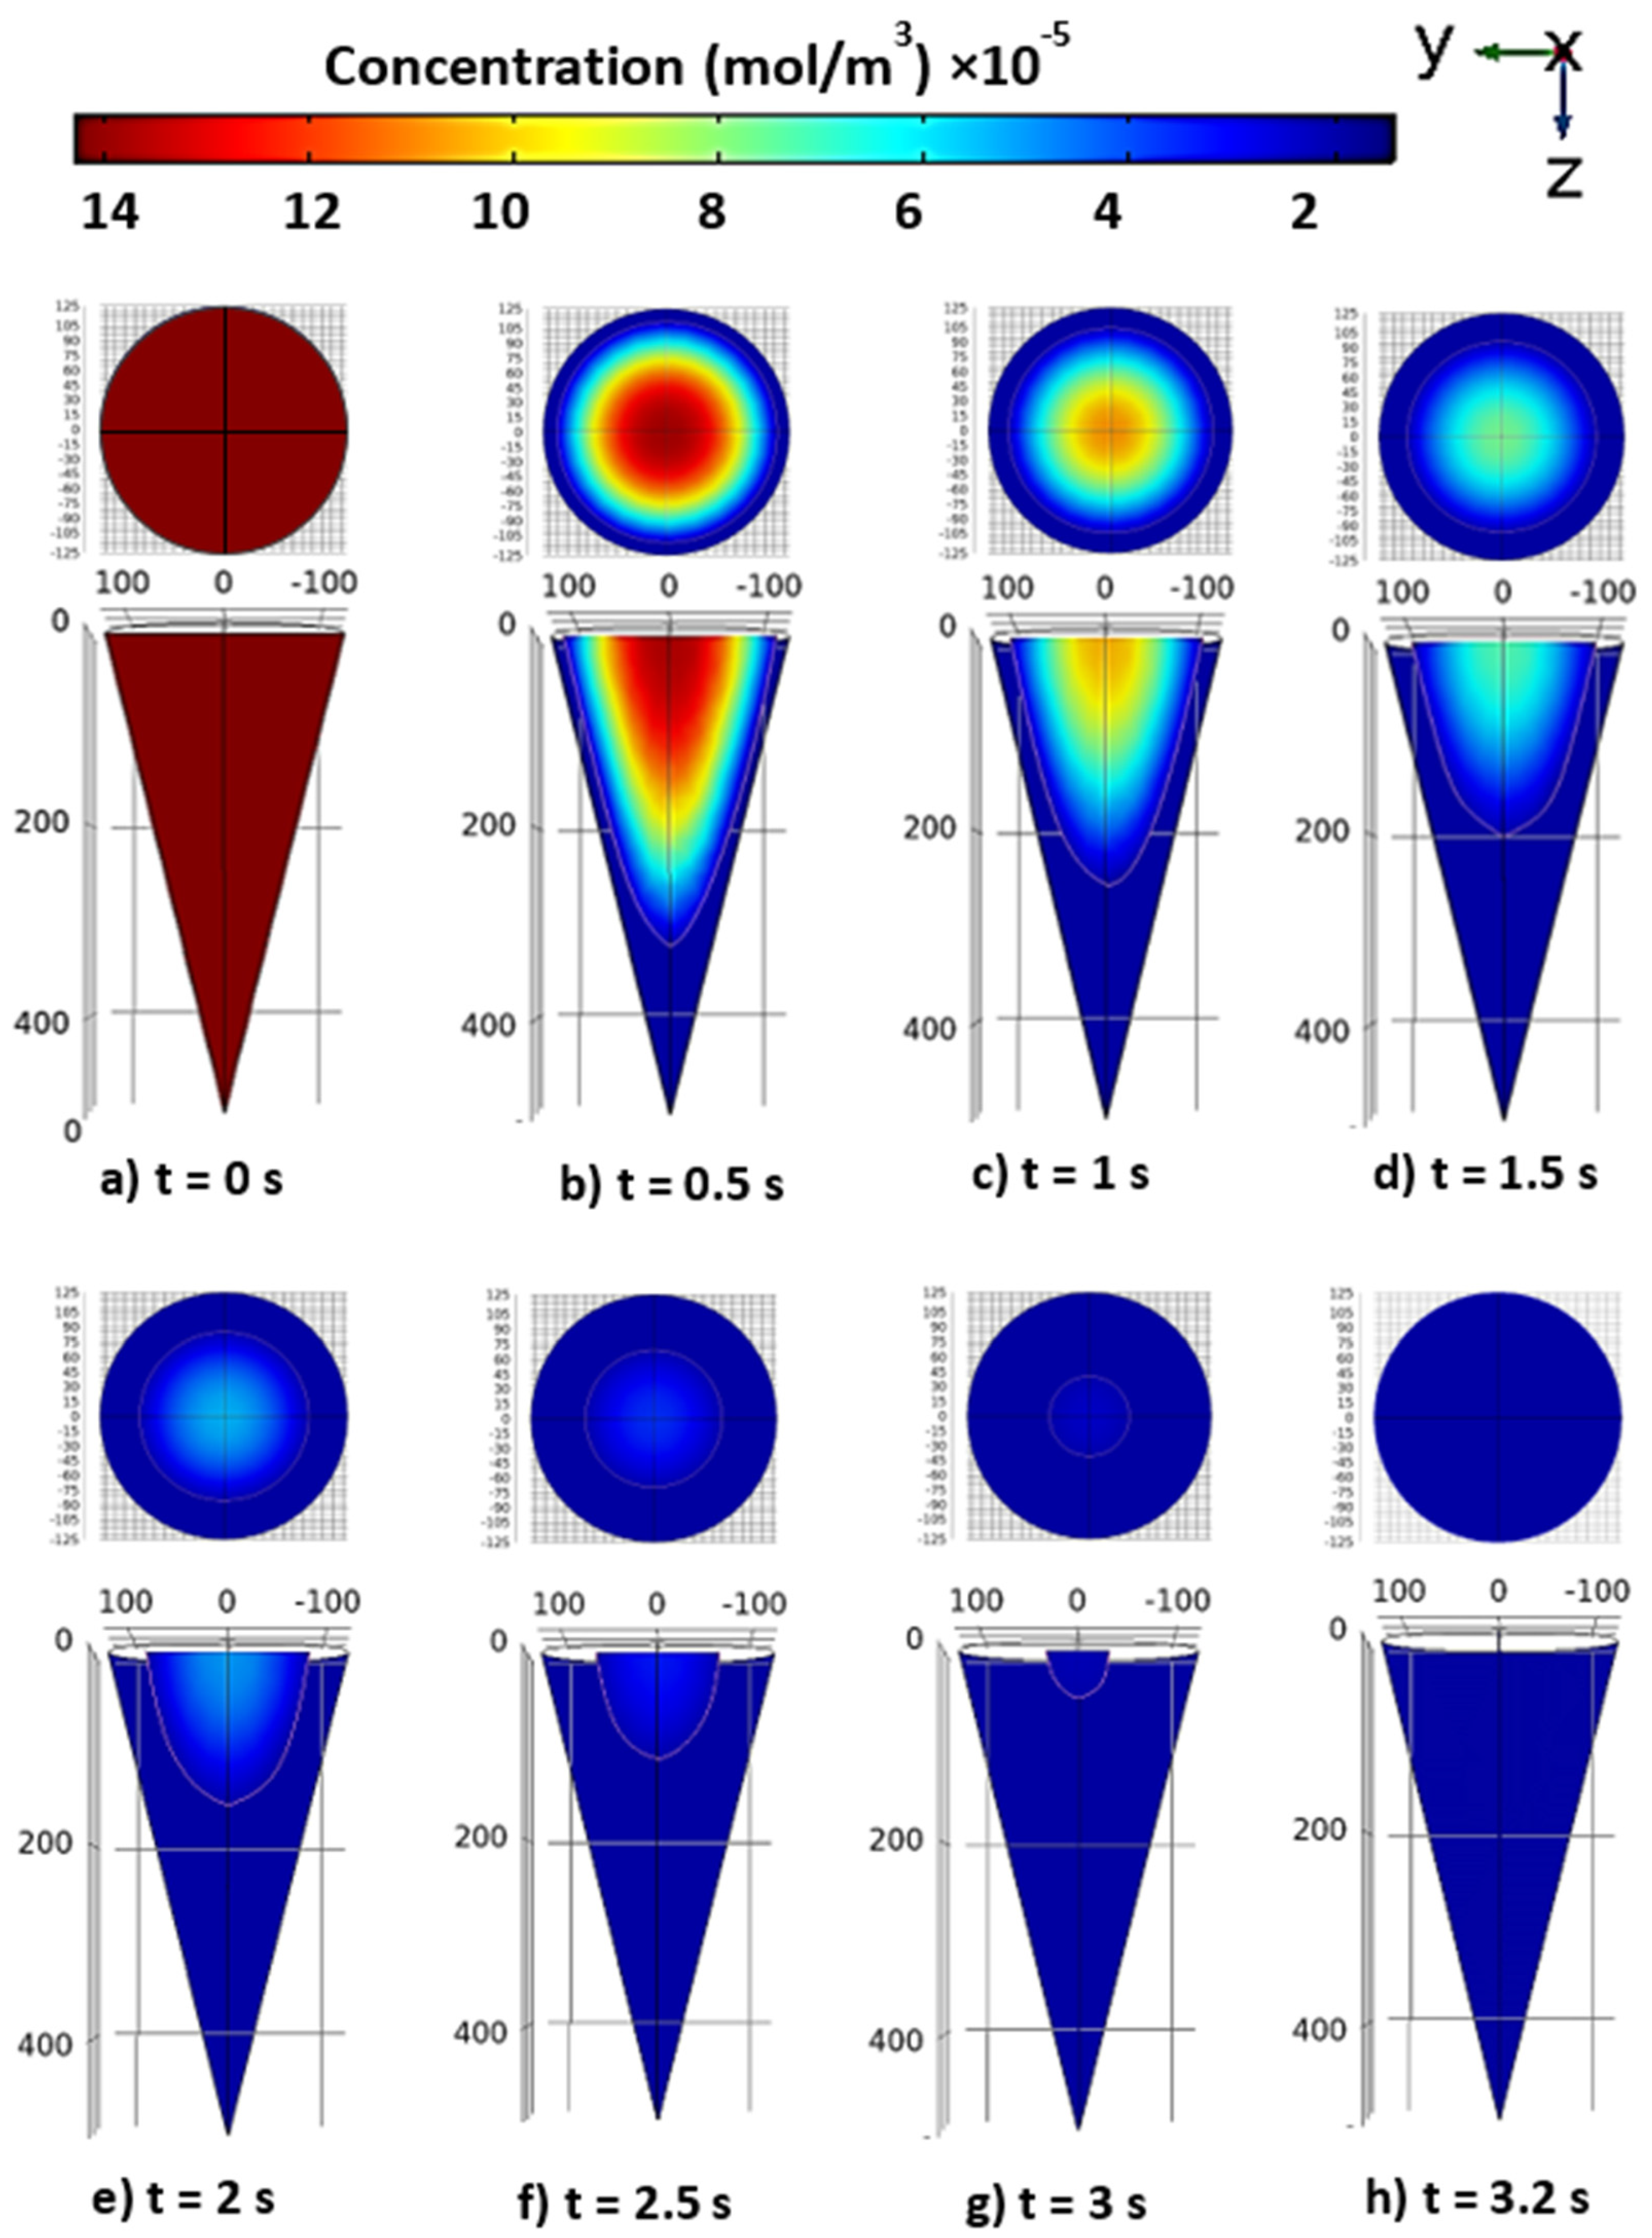
Drug diffusion inside the MN body was simulated to study the variation of the drug concentration inside the MN over time. The drug penetrates the skin from the exterior surfaces of the MN. As the drug concentration of the surface elements decreases, drug diffusion occurs inside the MN body. Figure 3 shows the contours of the drug concentration inside a sample MN at different time intervals. Contours were plotted in the base plane and the middle slice of the sample. The base plane is a circle with a diameter of 250 µm, and the middle slice is a triangle with a height of 500 µm. The color of each region represents the drug concentration in that region. At t=0 s, all the MN body has an initial drug concentration of c 0 = 1.43 × 10 4 mol/m3 as displayed in a dark-red color in Figure 3a. Over time, as the drug penetrates the skin, its concentration inside the MN body changes. Accordingly, the region near the skin becomes blue. The blue color region has a lower concentration compared to the other parts of the MN body. The changes in the color and size of the MN body due to drug penetration and diffusion over time are shown in Figure 3b-h. To better illustrate the mechanism of drug diffusion inside the MN body, those parts of the MN that reach a drug concentration lower than 10% of C0 were marked in dark blue. The remaining parts were demonstrated as colored areas according to the legend. We investigated the change in the height and base diameter of the colored region. The concentration contours showed that till t=1.5 s, the rate of the MN height reduction was higher than the base diameter reduction. Because the MN tip elements are in more contact with the skin, the diffusion rate at the MN tip is expected to be higher. At time t=2 s, when the height of the remaining body is approximately equal to the base diameter, the rate of height decreasing becomes almost the same as the base diameter decreasing, Figure 3f. These results reveal that in the tapered MN, the diffusion progress in the way that MN height and base diameter reach an equilibrium size. The sample MN disappears at 3.2 s, Figure 3h. The data show that the embedded drug in the sample MN exhibits a very quick diffusion rate.

3.3. Effects of microneedle’s height and base diameter on drug diffusion

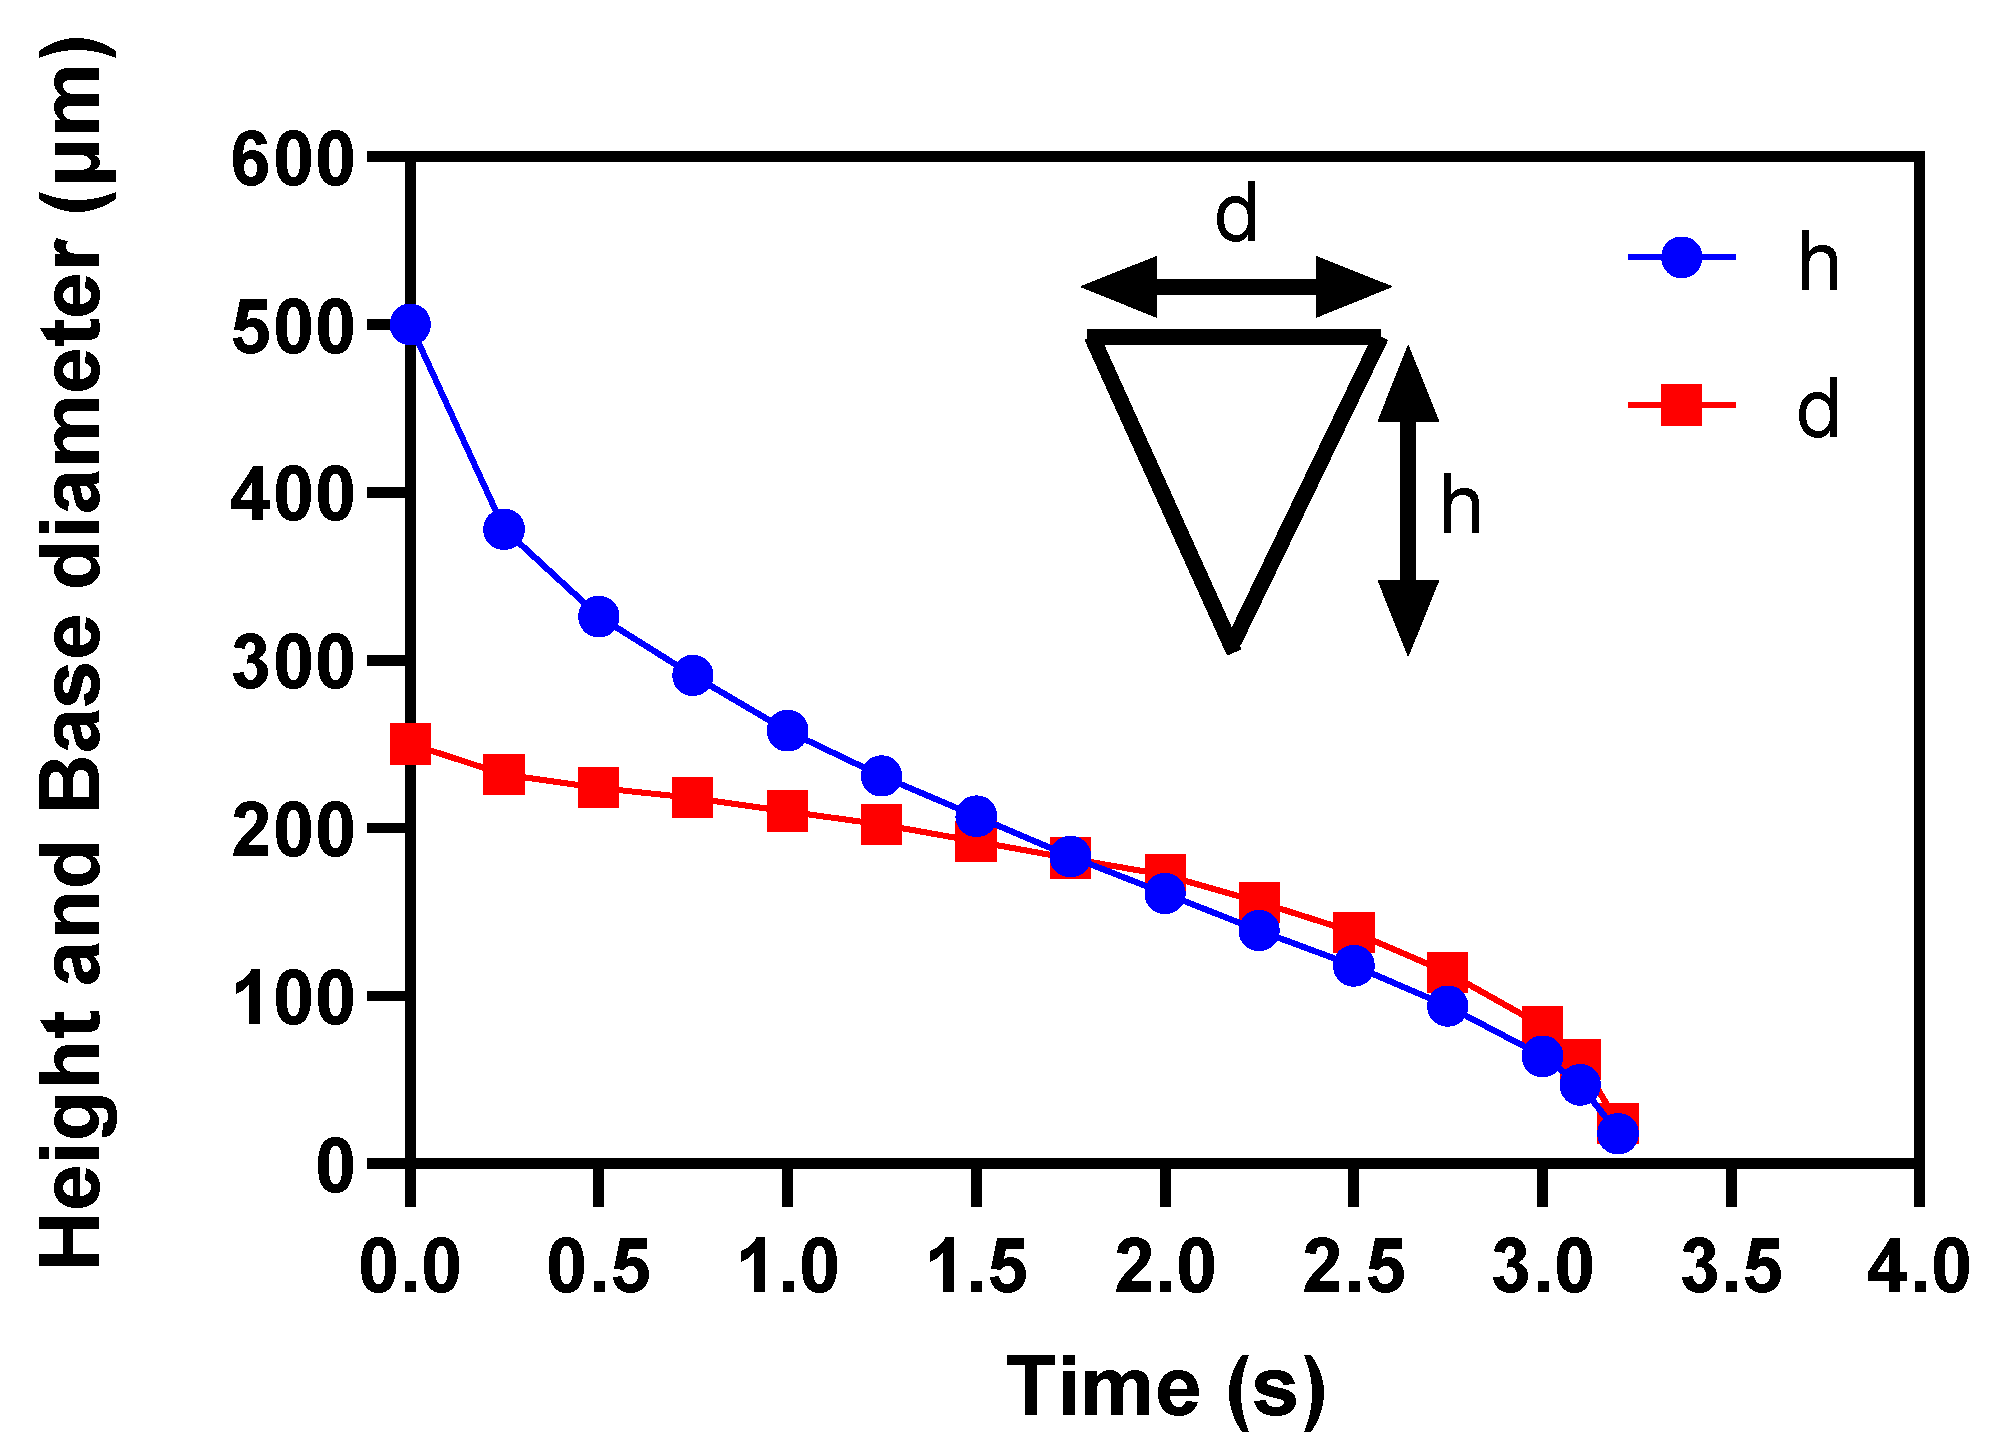
Figure 4 shows the change in the height and base diameter of the drug region of the sample MN during drug diffusion over time. In the figure, h and d are the instantaneous height and base diameter of the drug region, respectively, which are equal to the MN’s height and base diameter initially. The initial height and base diameter are d0S=250 µm and h0S=500 µm, respectively. As the drug diffused, both height and base diameter were reduced due to diffusion. The curves in Figure 4 show that at the beginning, the profile of the height reduction has a sharper slope compared with the base diameter curve. It indicates that the decrease in the height is higher than the reduction in the base diameter at first, which means drug diffusion is faster at the tip region. At t=1.75 s, both curves overlap with each other. It corresponds to the time when the height and base diameter becomes equal. After that, the reduction rate is almost the same for the height and base diameter.
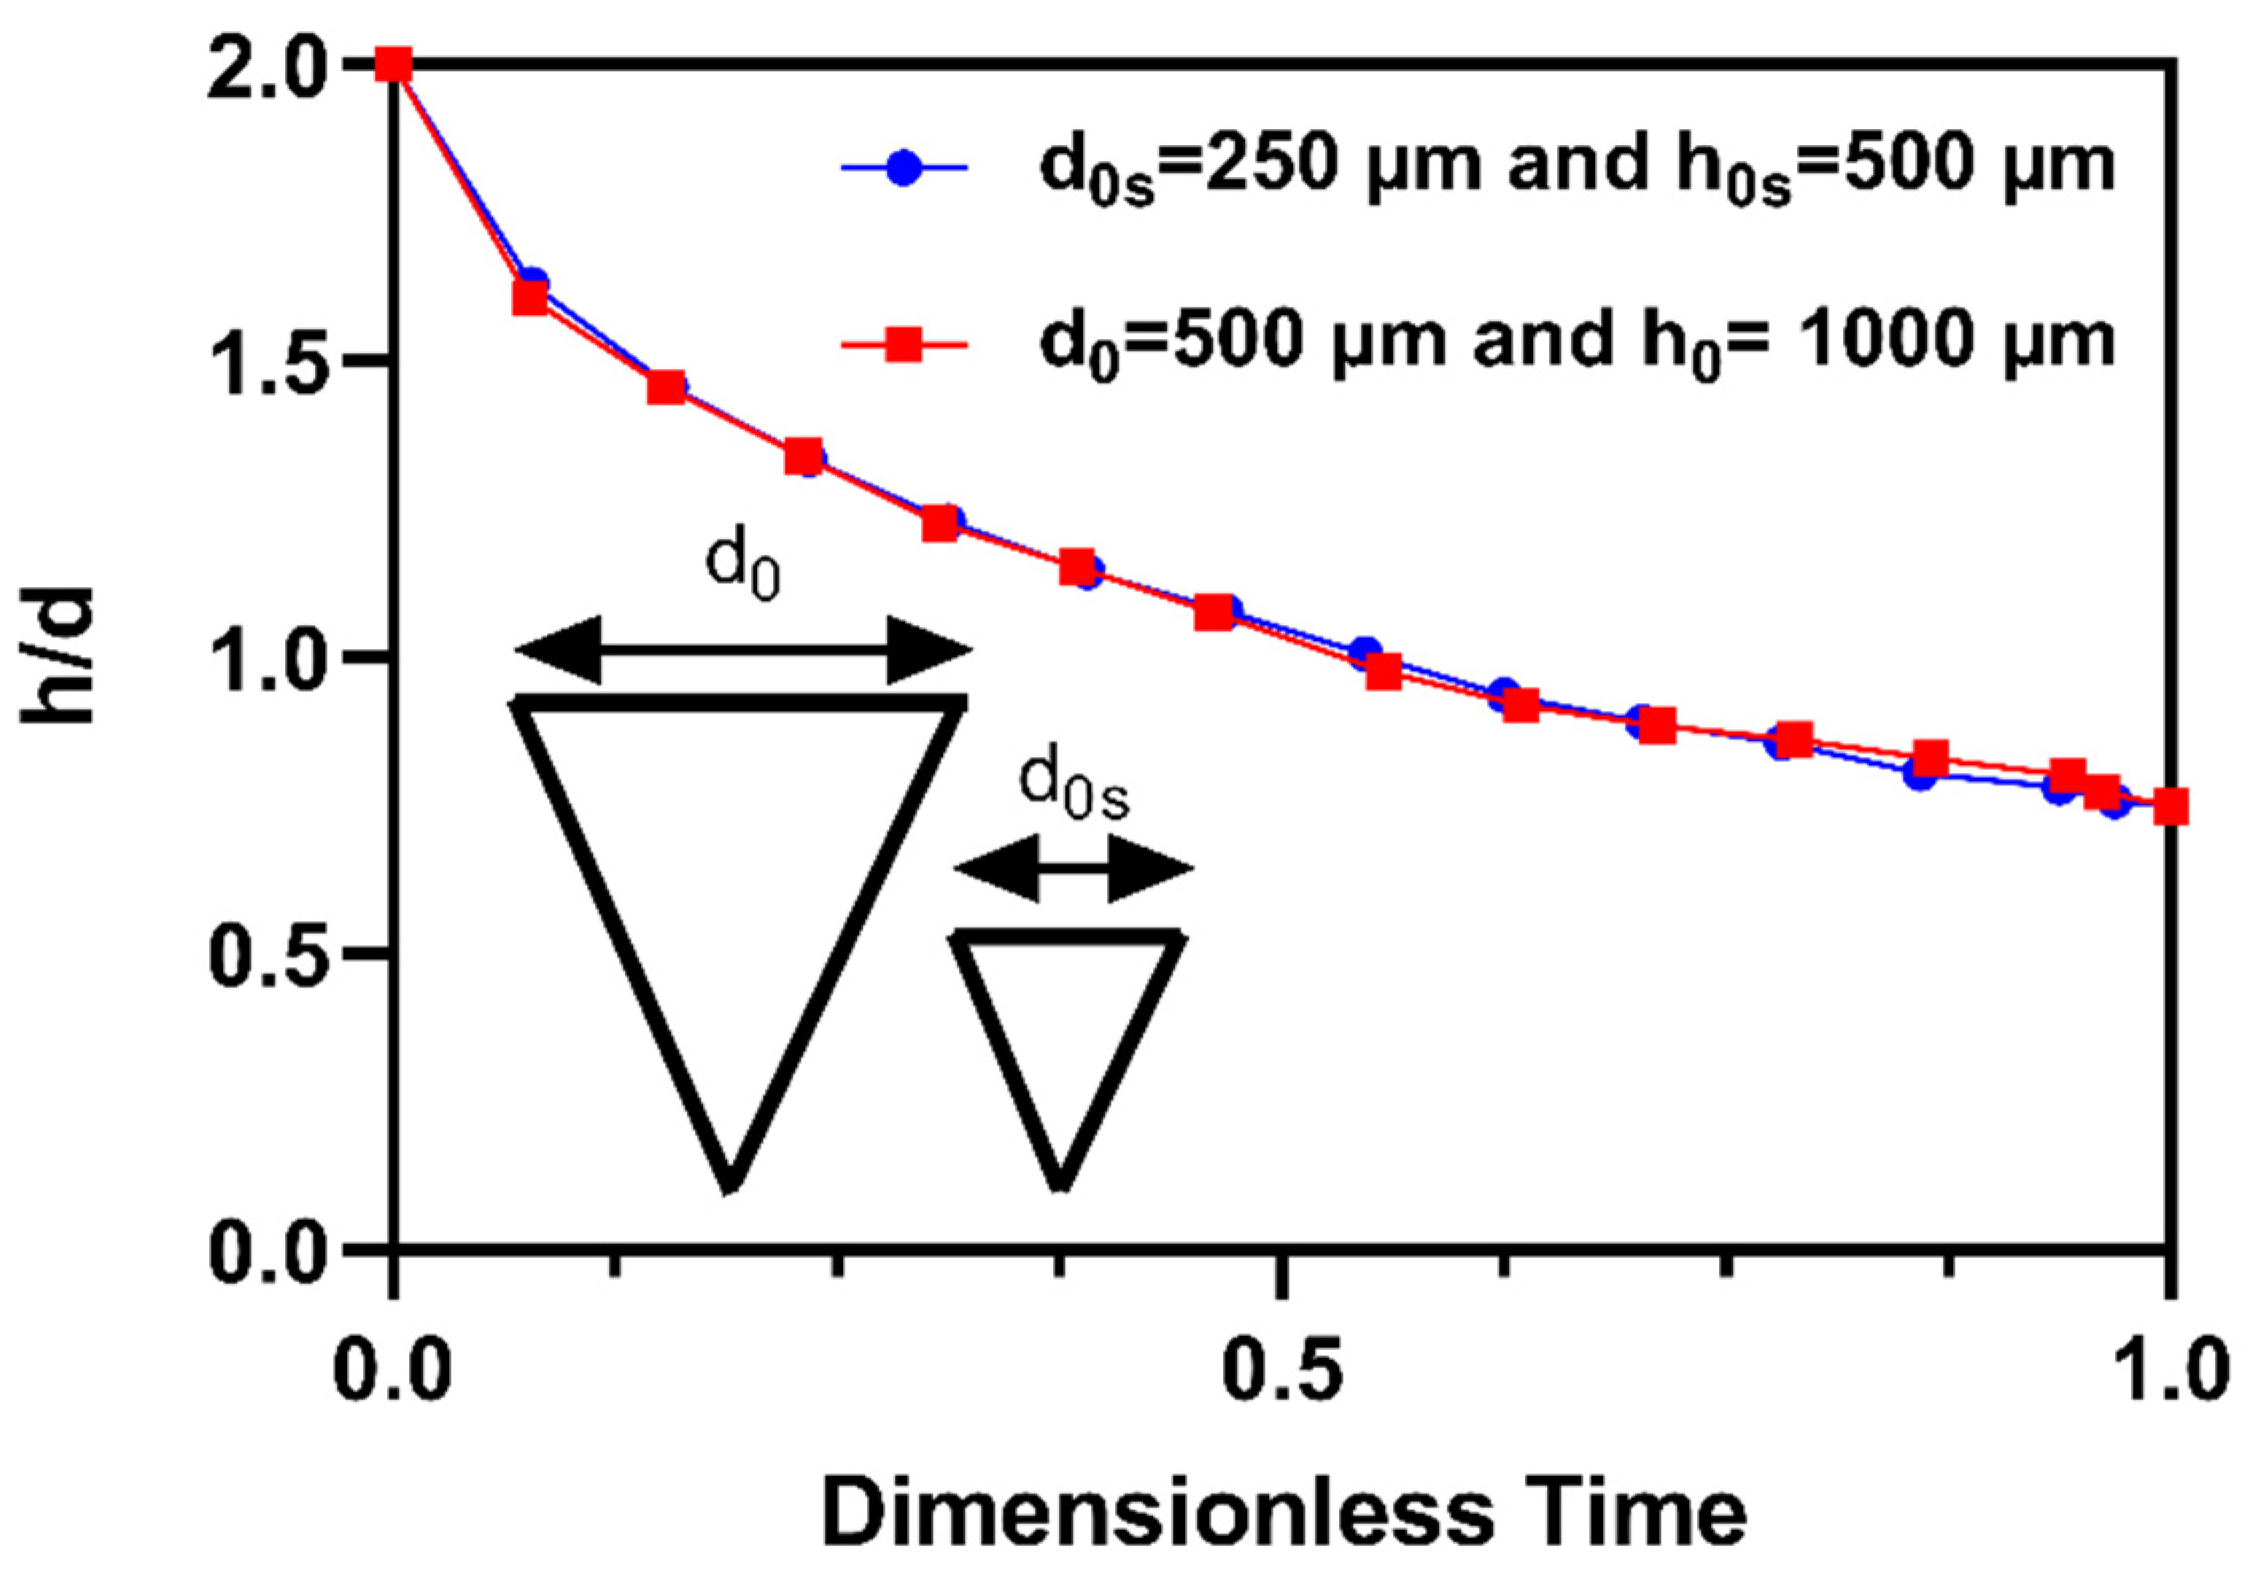
Changes in the height and base diameter during diffusion are presented in Figure 5 for another MN with a different size. Figure 5 illustrates the ratio of the instantaneous height to base diameter, h/d, is for two different cases during diffusion. Case one is an MN with d0=250 µm, and h0= 500 µm and case two is an MN with d0=500 µm and h0=1000 µm. h/d is plotted versus dimensionless time. Here, dimensionless time is defined as the time divided by the TDT. It can be seen that both graphs are superimposed on each other, thus confirming the same manner in diffusion for both cases. At t=0 s, h/d is equal to 2, which corresponds to the initial value of the height and base diameter of the MN. By starting diffusion, the value of h/d changes and reduces. In the beginning, the curve of h/d has a sharp slope while it becomes smoother over time. h/d tends to one and stays near one till total diffusion. That means an equal reduction rate of h and d at the end of the diffusion process.

3.4. Case studies

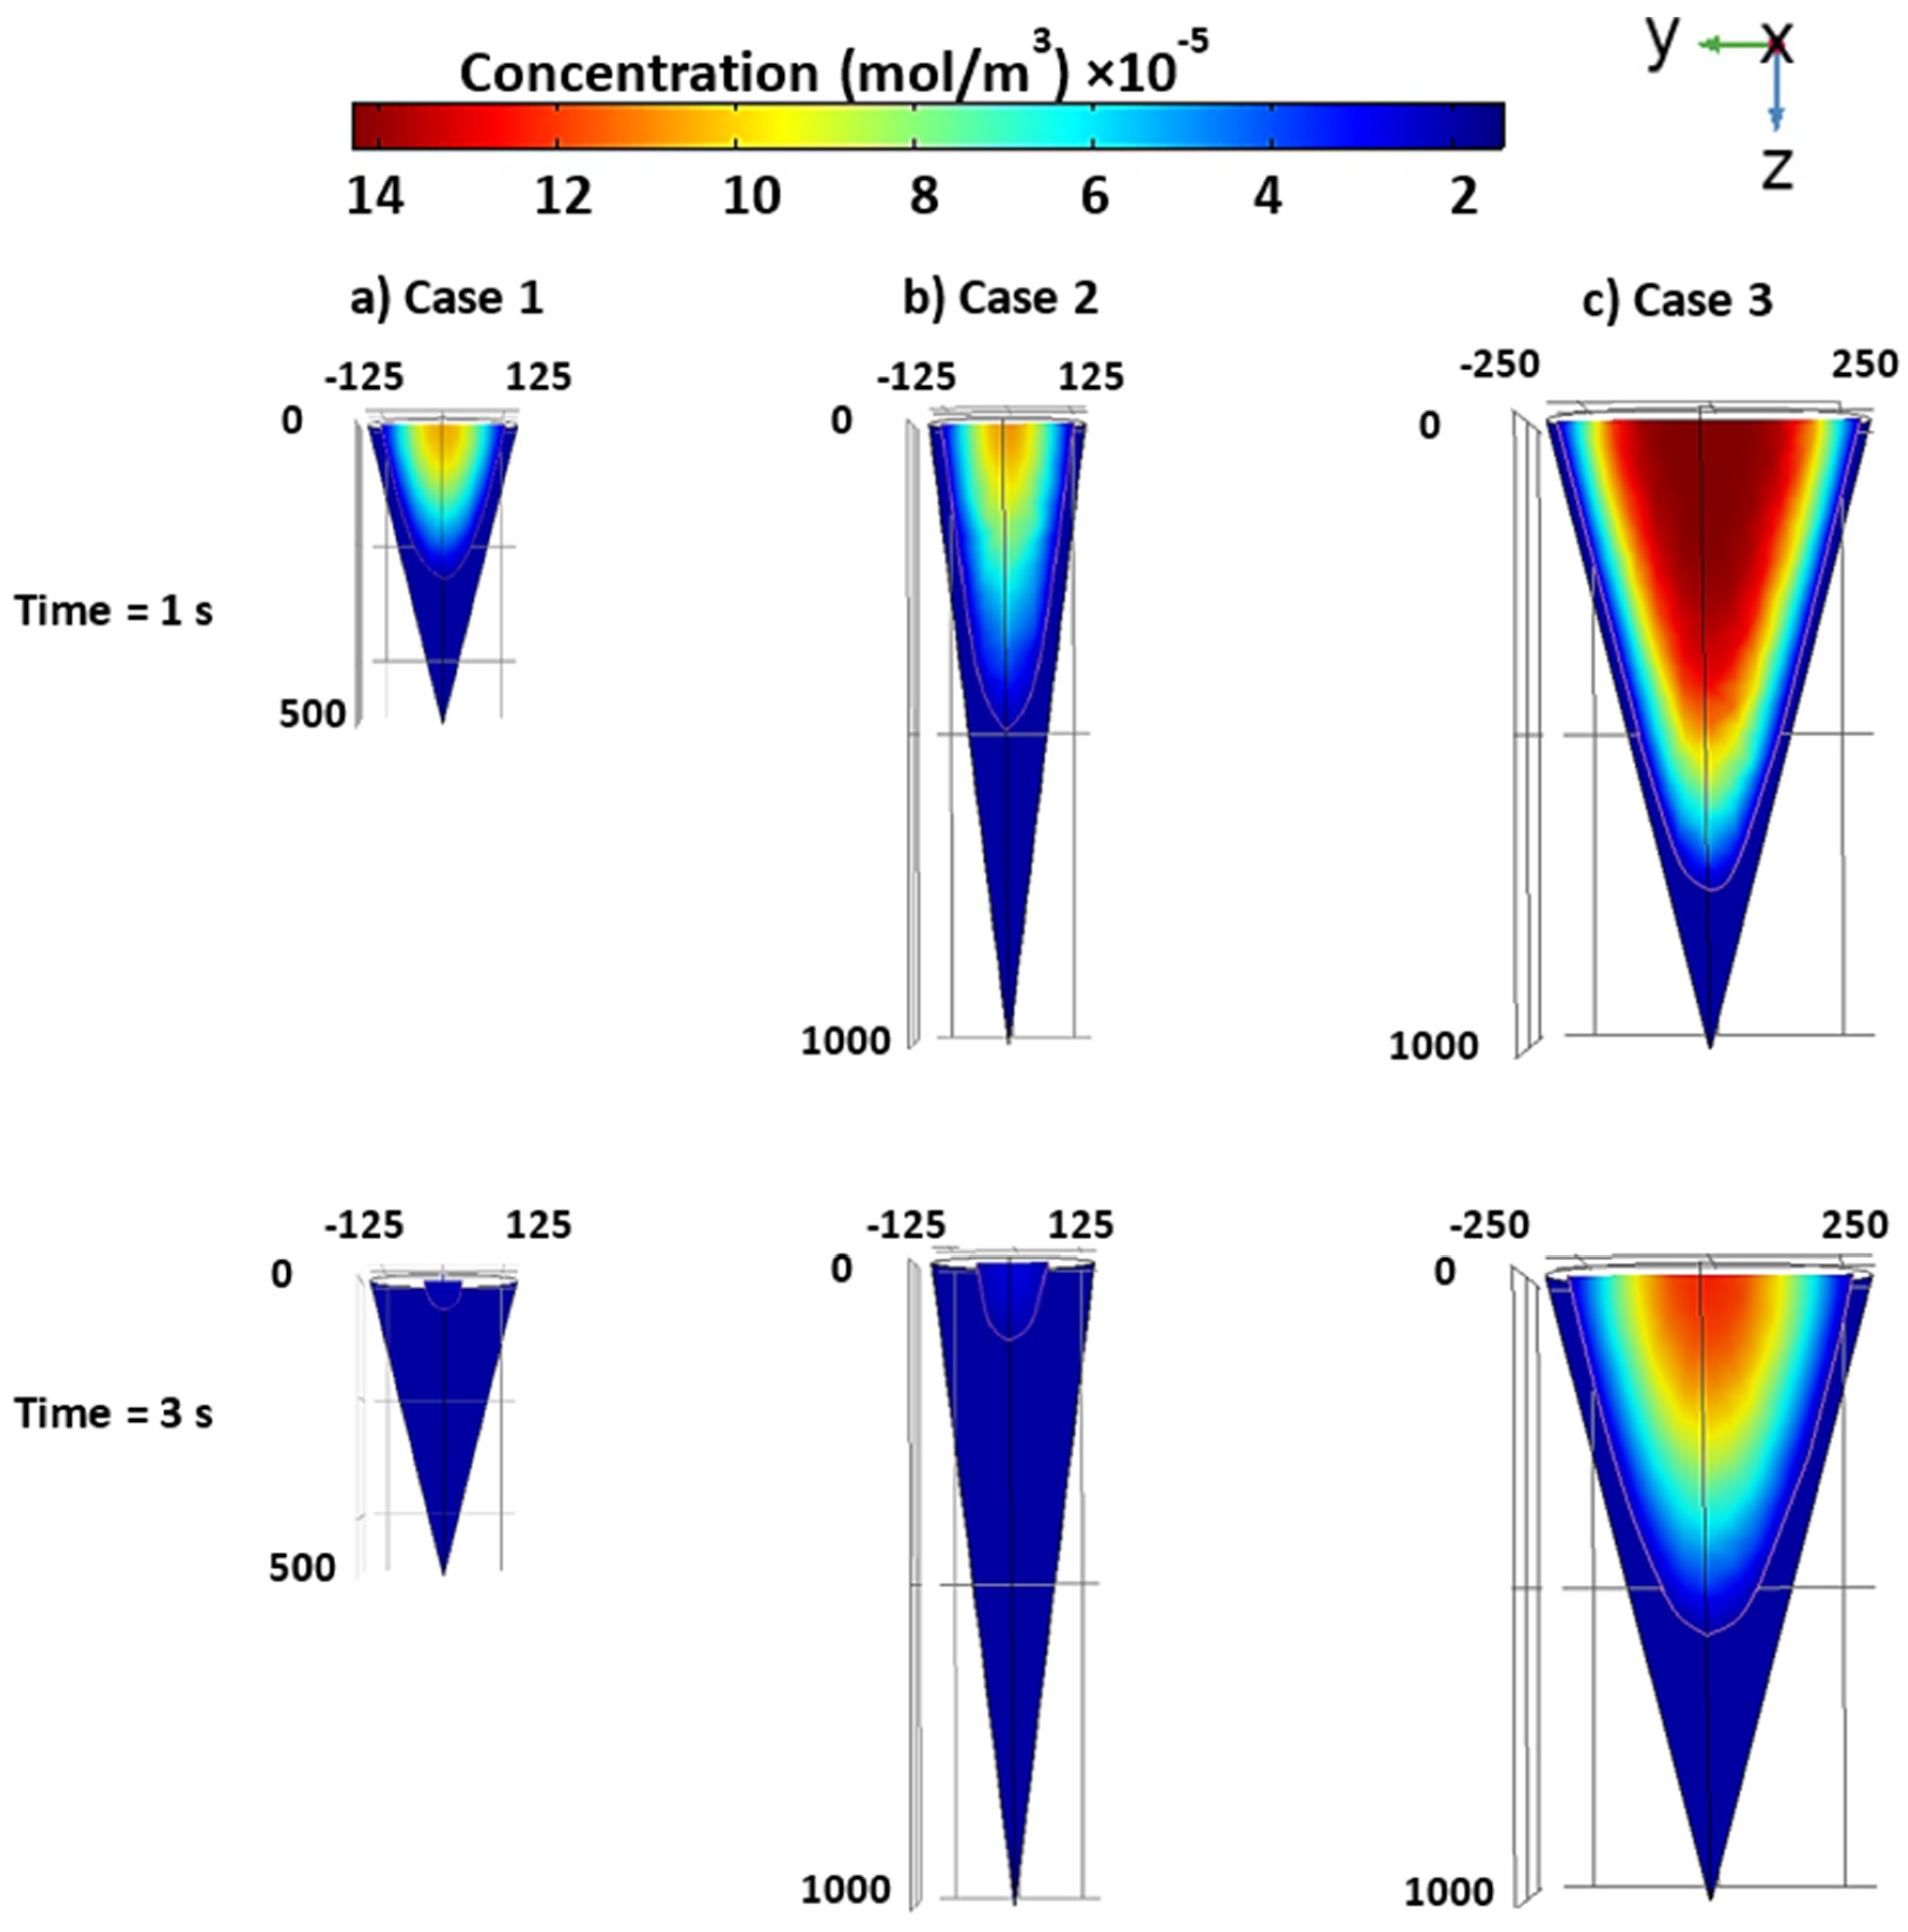
Figure 6 compares the contours of the drug diffusion inside the MN body for three different cases. Case 1 is the sample MN, with a base diameter of d0s=250 µm and a height of h0s=500 µm. Case 2 is an MN with the same base diameter but a height of two times larger (d0=d0s, h0=2h0s), and Case 3 is an MN with d0=2d0s, h0=2h0s. As shown in Figure 6a and Figure 6b, at t=1 s, the drug penetrates through the tip of the MN, and the remaining volume containing the drug is similar to a cone with a diameter of half the initial diameter in Case 1 and Case 2. At t=1 s, the shape of the remaining part of the MN of Case 2 is similar to that of Case 1 at t=0 but has a different concentration distribution. After that, the rate and the diffusion pattern of both Case 1 and Case 2 are similar. Case 1 diffuses completely at t=3.2 s, and case 2 diffuses completely only 0.4 s after that at t=3.6 s. Although the volume of the MN Case 2 is two times larger than that of Case 1, the total time of drug diffusion for Case 2 is only 5.6 percent higher than Case 1. The simulated results confirm that doubling the loaded drug by double the height of MN does not lead to double the diffusion time. In another case, Case 3, both the height and the base diameter are twice that of Case 1. The contour concentration of Case 3 in Figure 6c illustrates that at t=1 s, only 25% of the MN height diffuses while most of the interior region of the MN body has a concentration equal to or near to the initial concentration, red color. After t=3 s, MNs of Case 1 and Case 2 have a small portion of their drug with a low concentration, while the MN of Case 3 has more than half of its initial volume with a high drug concentration. TDT of the MN of Case 3 is 13.5 s. The volume of the MN of Case 3 is eight times larger than that of Case 1. However, the total diffusion time of the MN Case 3 is only 2.9 times higher than in Case 1. Those results suggested a nonlinear relation between the MN volume and TDT. Moreover, besides the MN volume, the aspect ratio of h0/d0 strongly affects the diffusion time.
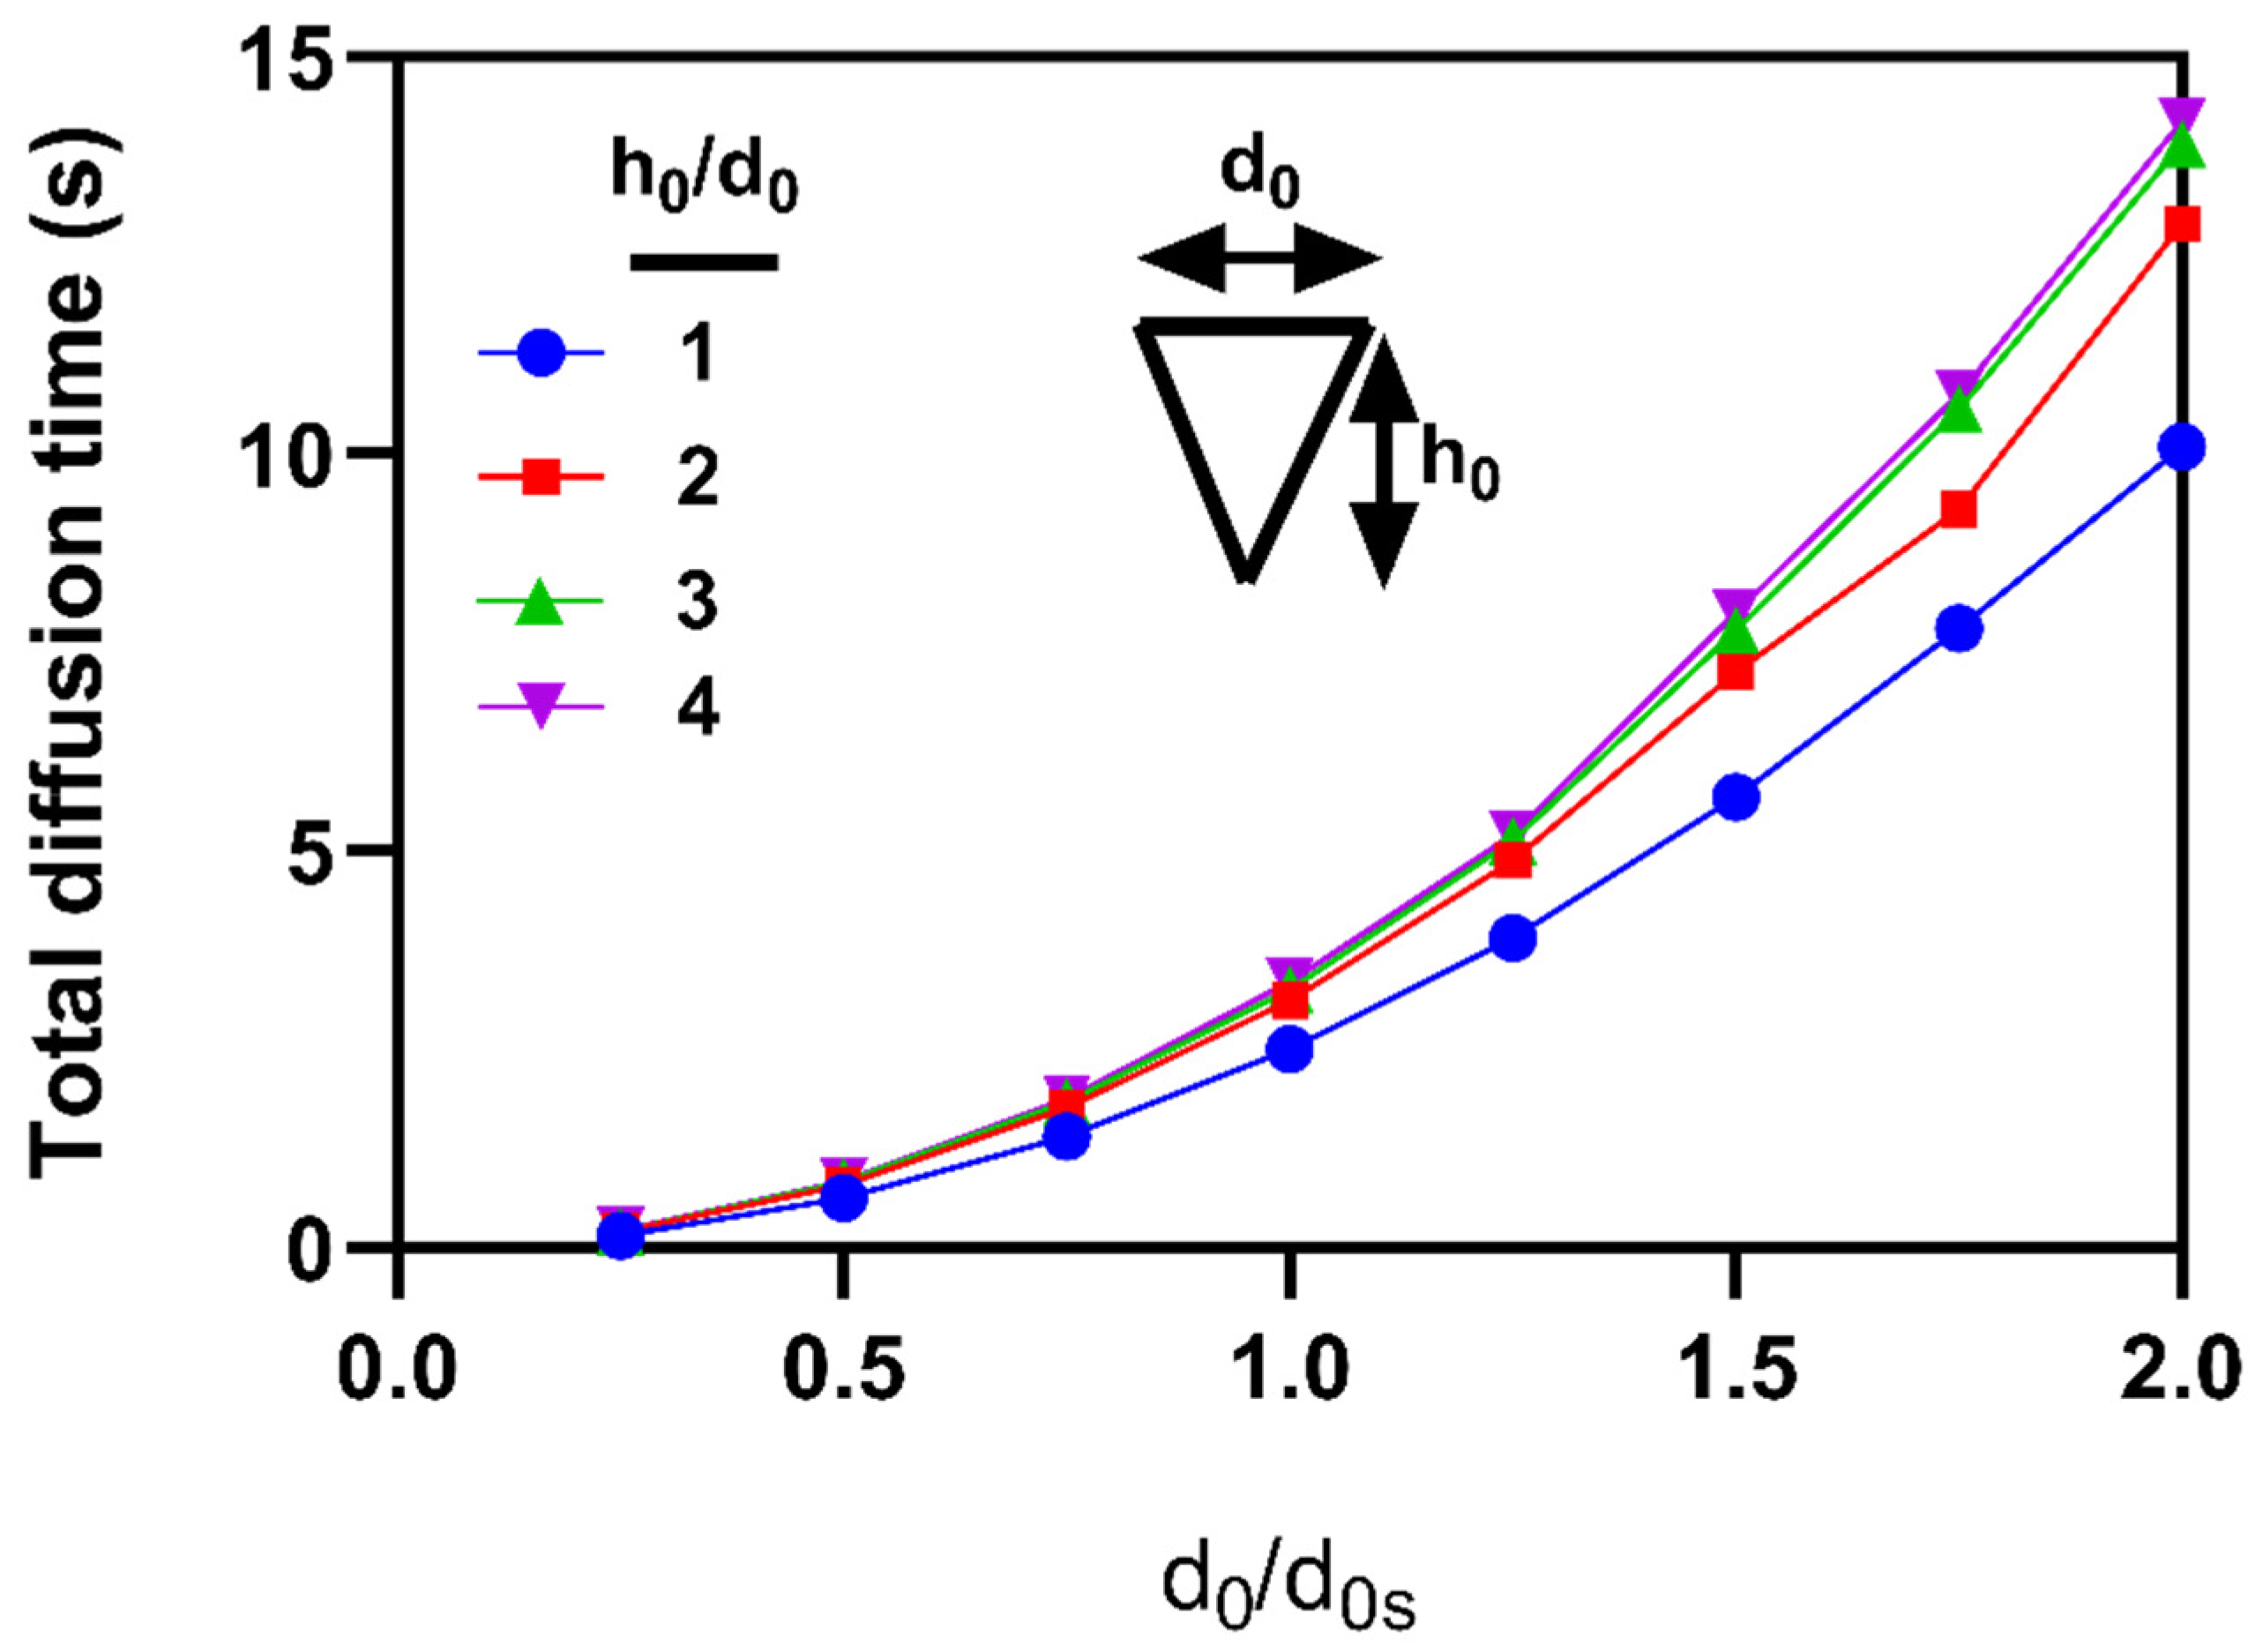
The effect of the MN volume on the diffusion time is investigated for various MNs with different sizes and the same h0/d0. Figure 7 presents the variation of TDT in terms of the base diameter for different MNs with d0/d0s= 0.25 to 2 and h0/d0=1, 2, 3, and 4, here d0s=250 µm is the initial base diameter of the MN of Case 1. As shown in Figure 7, in a constant value of h0/d0, by increasing d0, TDT increases. That increase is due to the more drug in the larger MNs with the higher base diameter. In Figure 7, all curves of TDT follow the same pattern for all values of h0/d0. As h0/d0 increases, the curves overlap with each other in cases h0/d0=3 and h0/d0=4. These data show that increasing the MN volume by increasing the height does not significantly affect TDT. At the higher aspect ratio of h0/d0, the loaded drug in the narrow tips diffuses very fast in comparison with the other parts of the MN body. Thus, it does not increase the TDT significantly. At h0/d0=1, TDT is 2.5 s for d0/d0s=1, while TDT is 10.1 s for d0/d0s=2, which is four times higher. It signifies that increasing the base diameter, while keeping h0/d0 constant, increases TDT significantly. At h0/d0=4, and d0/d0s=1, the value of TDT is 3.4 s. Therefore, increasing the height of the MN from 1 to 4 causes only a 26.5% increase in TDT. The results indicate that the influences of the base diameter and the height of the MN on the TDT are different. In addition, not only the base diameter and height but also their aspect ratio affects TDT.
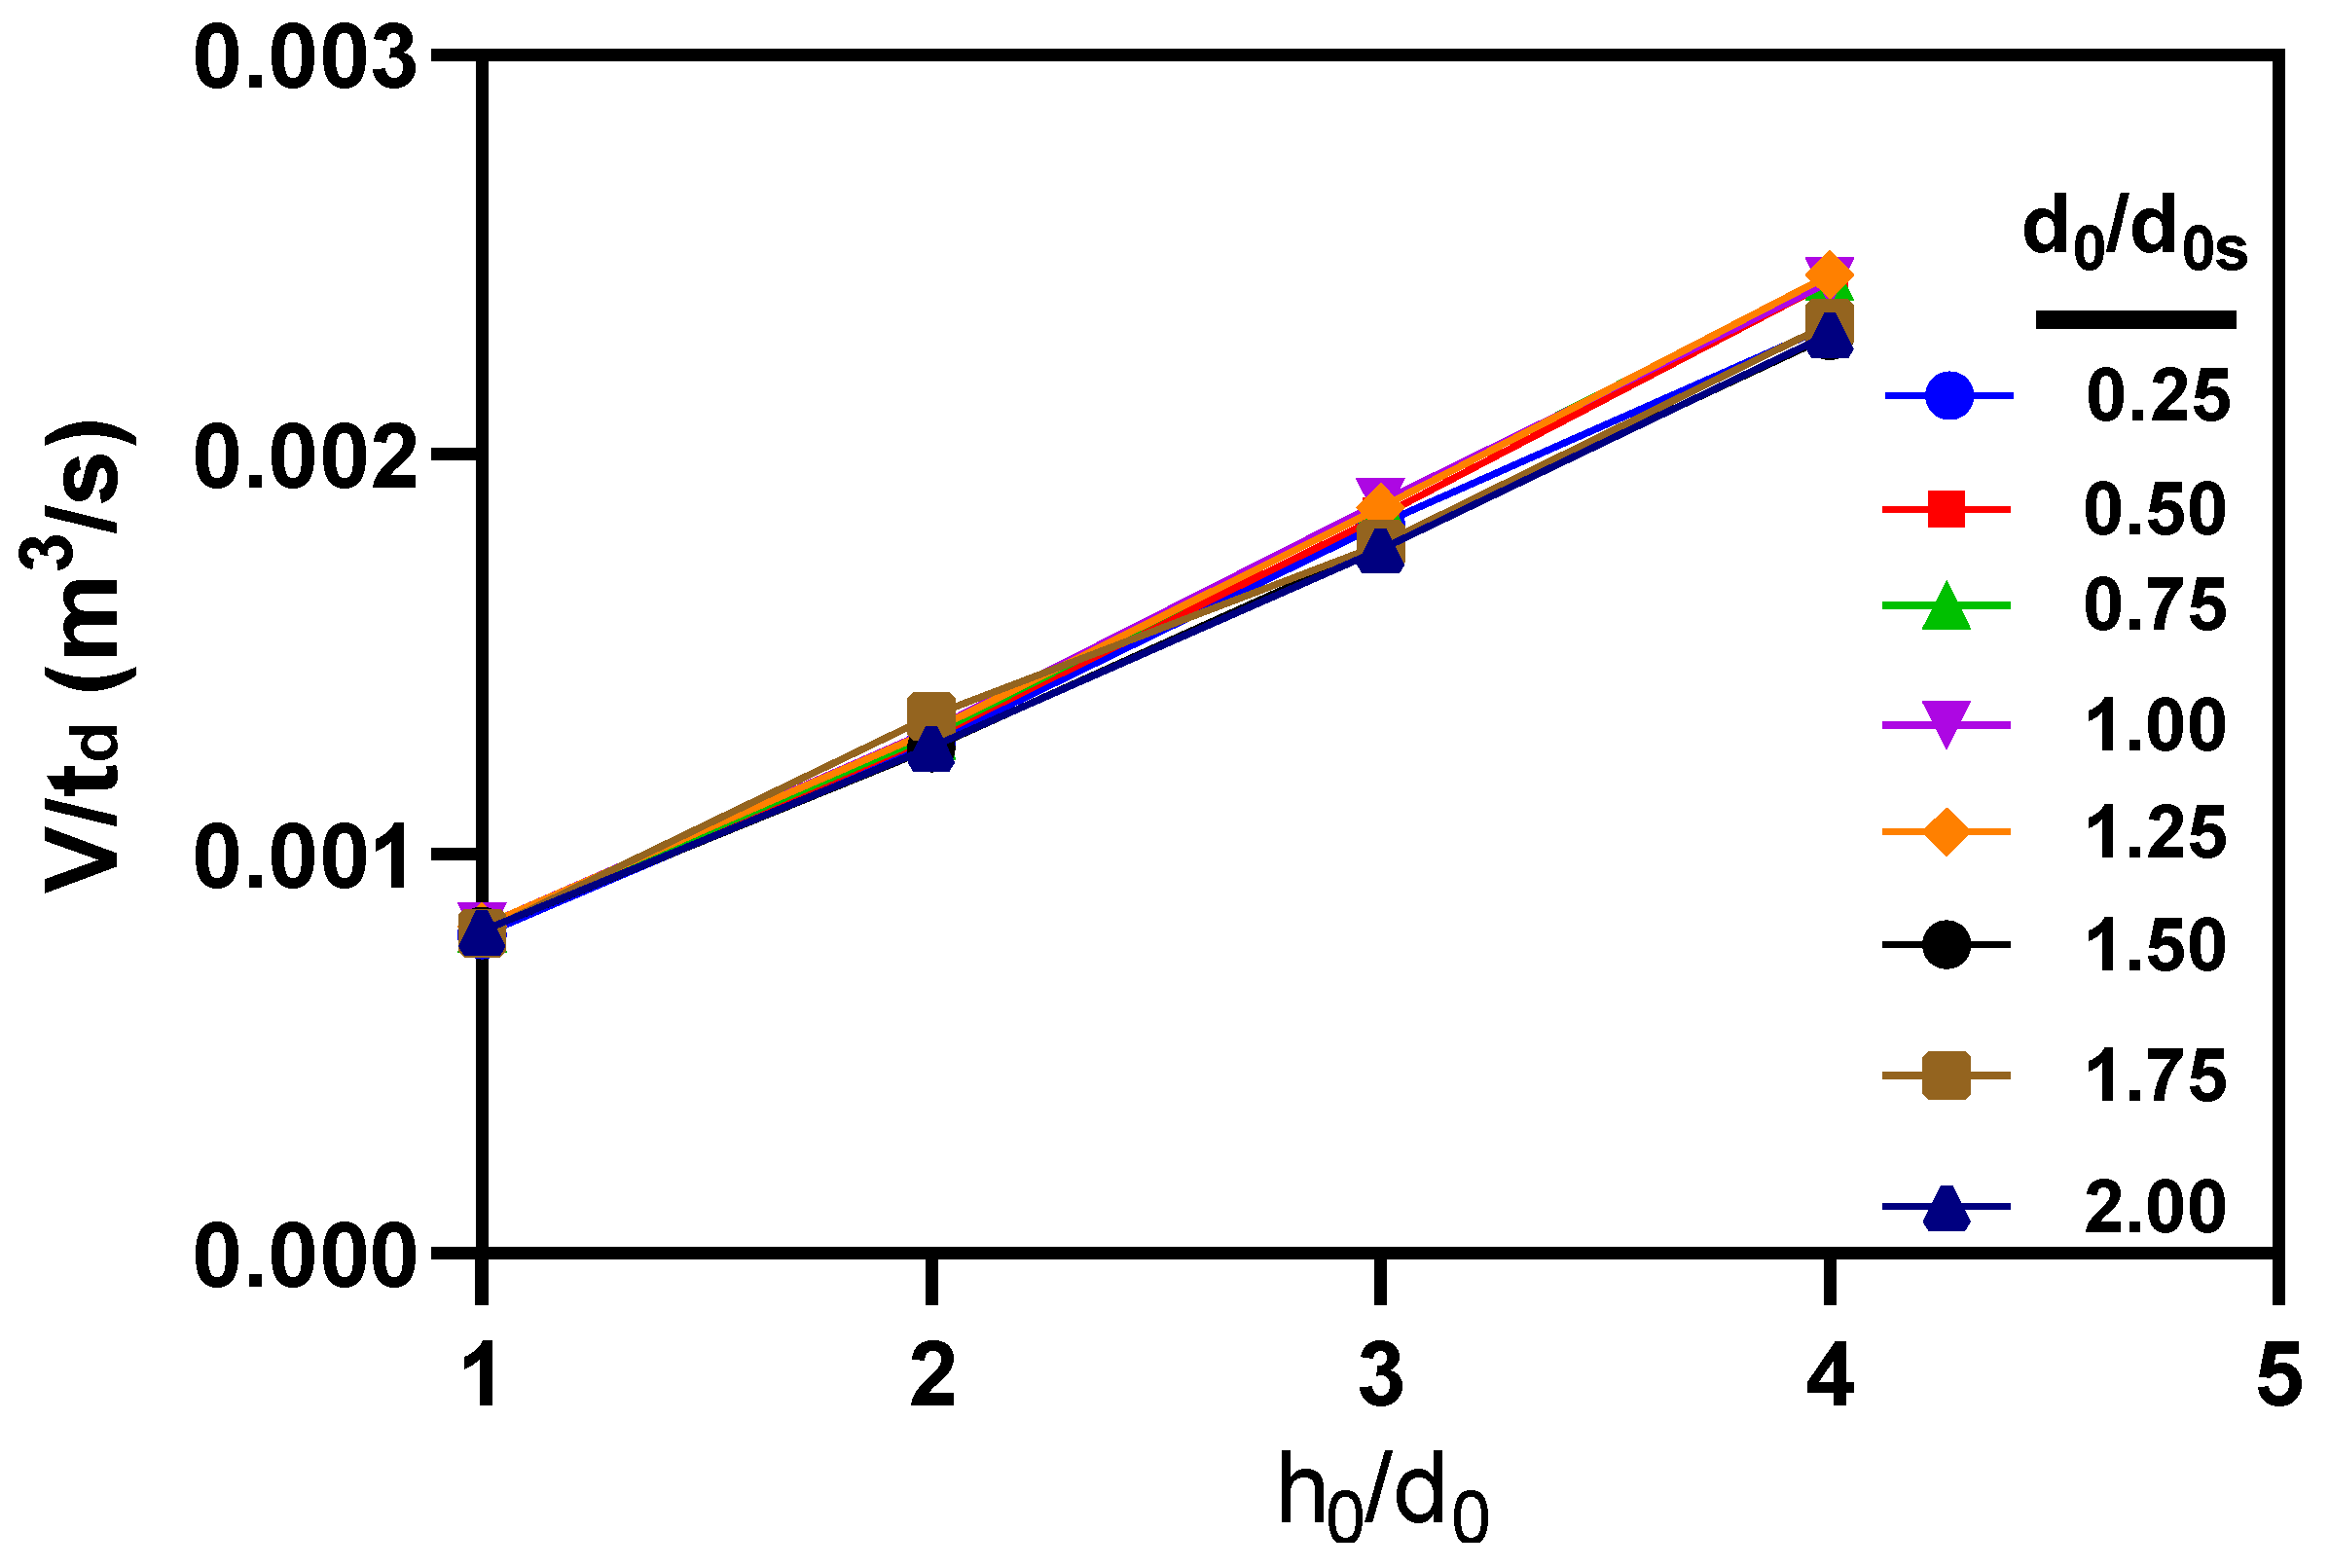
Figure 8 shows the parameter V/td in which V is the MN volume and td is the TDT. The data are plotted in different values of h0/d0 and d0/d0s. Here, h0 and d0 are the initial height and base diameter of the MN. For a given d0/d0s, the value of V/td increases linearly as the ratio of h0/d0 increases from 1 to 4. For the constant ratio of h0/d0, the value of V/td is approximately the same for all values of d0/d0s. In h0/d0= 1, the maximum difference of V/td for all values of d0/d0s from 0.25 to 2 is 1.4%, and it is 6.5% for h0/d0=4. Based on the obtained data, there is a linear relation between V/td and h0/d0 that can be obtained from data curve fitting as follow:
V t d = 0.0005 h 0 d 0 + 0.0003 ,
By rearranging Equation (3), the total diffusion time can be obtained as below.
t d = V 0.0005 h 0 d 0 + 0.0003 ,
where td is total diffusion time in second. V is volume, h0 is height, and d0 is the base diameter of the MN in a micrometer scale. Equation (4) can predict TDT for the tapered MN with an error lower than 7%. In other words, based on the simulation results, we obtain a relation for the prediction of total diffusion time by having the value of volume, height, and base diameter of the MN.

3.5. Effects of the diffusion coefficient

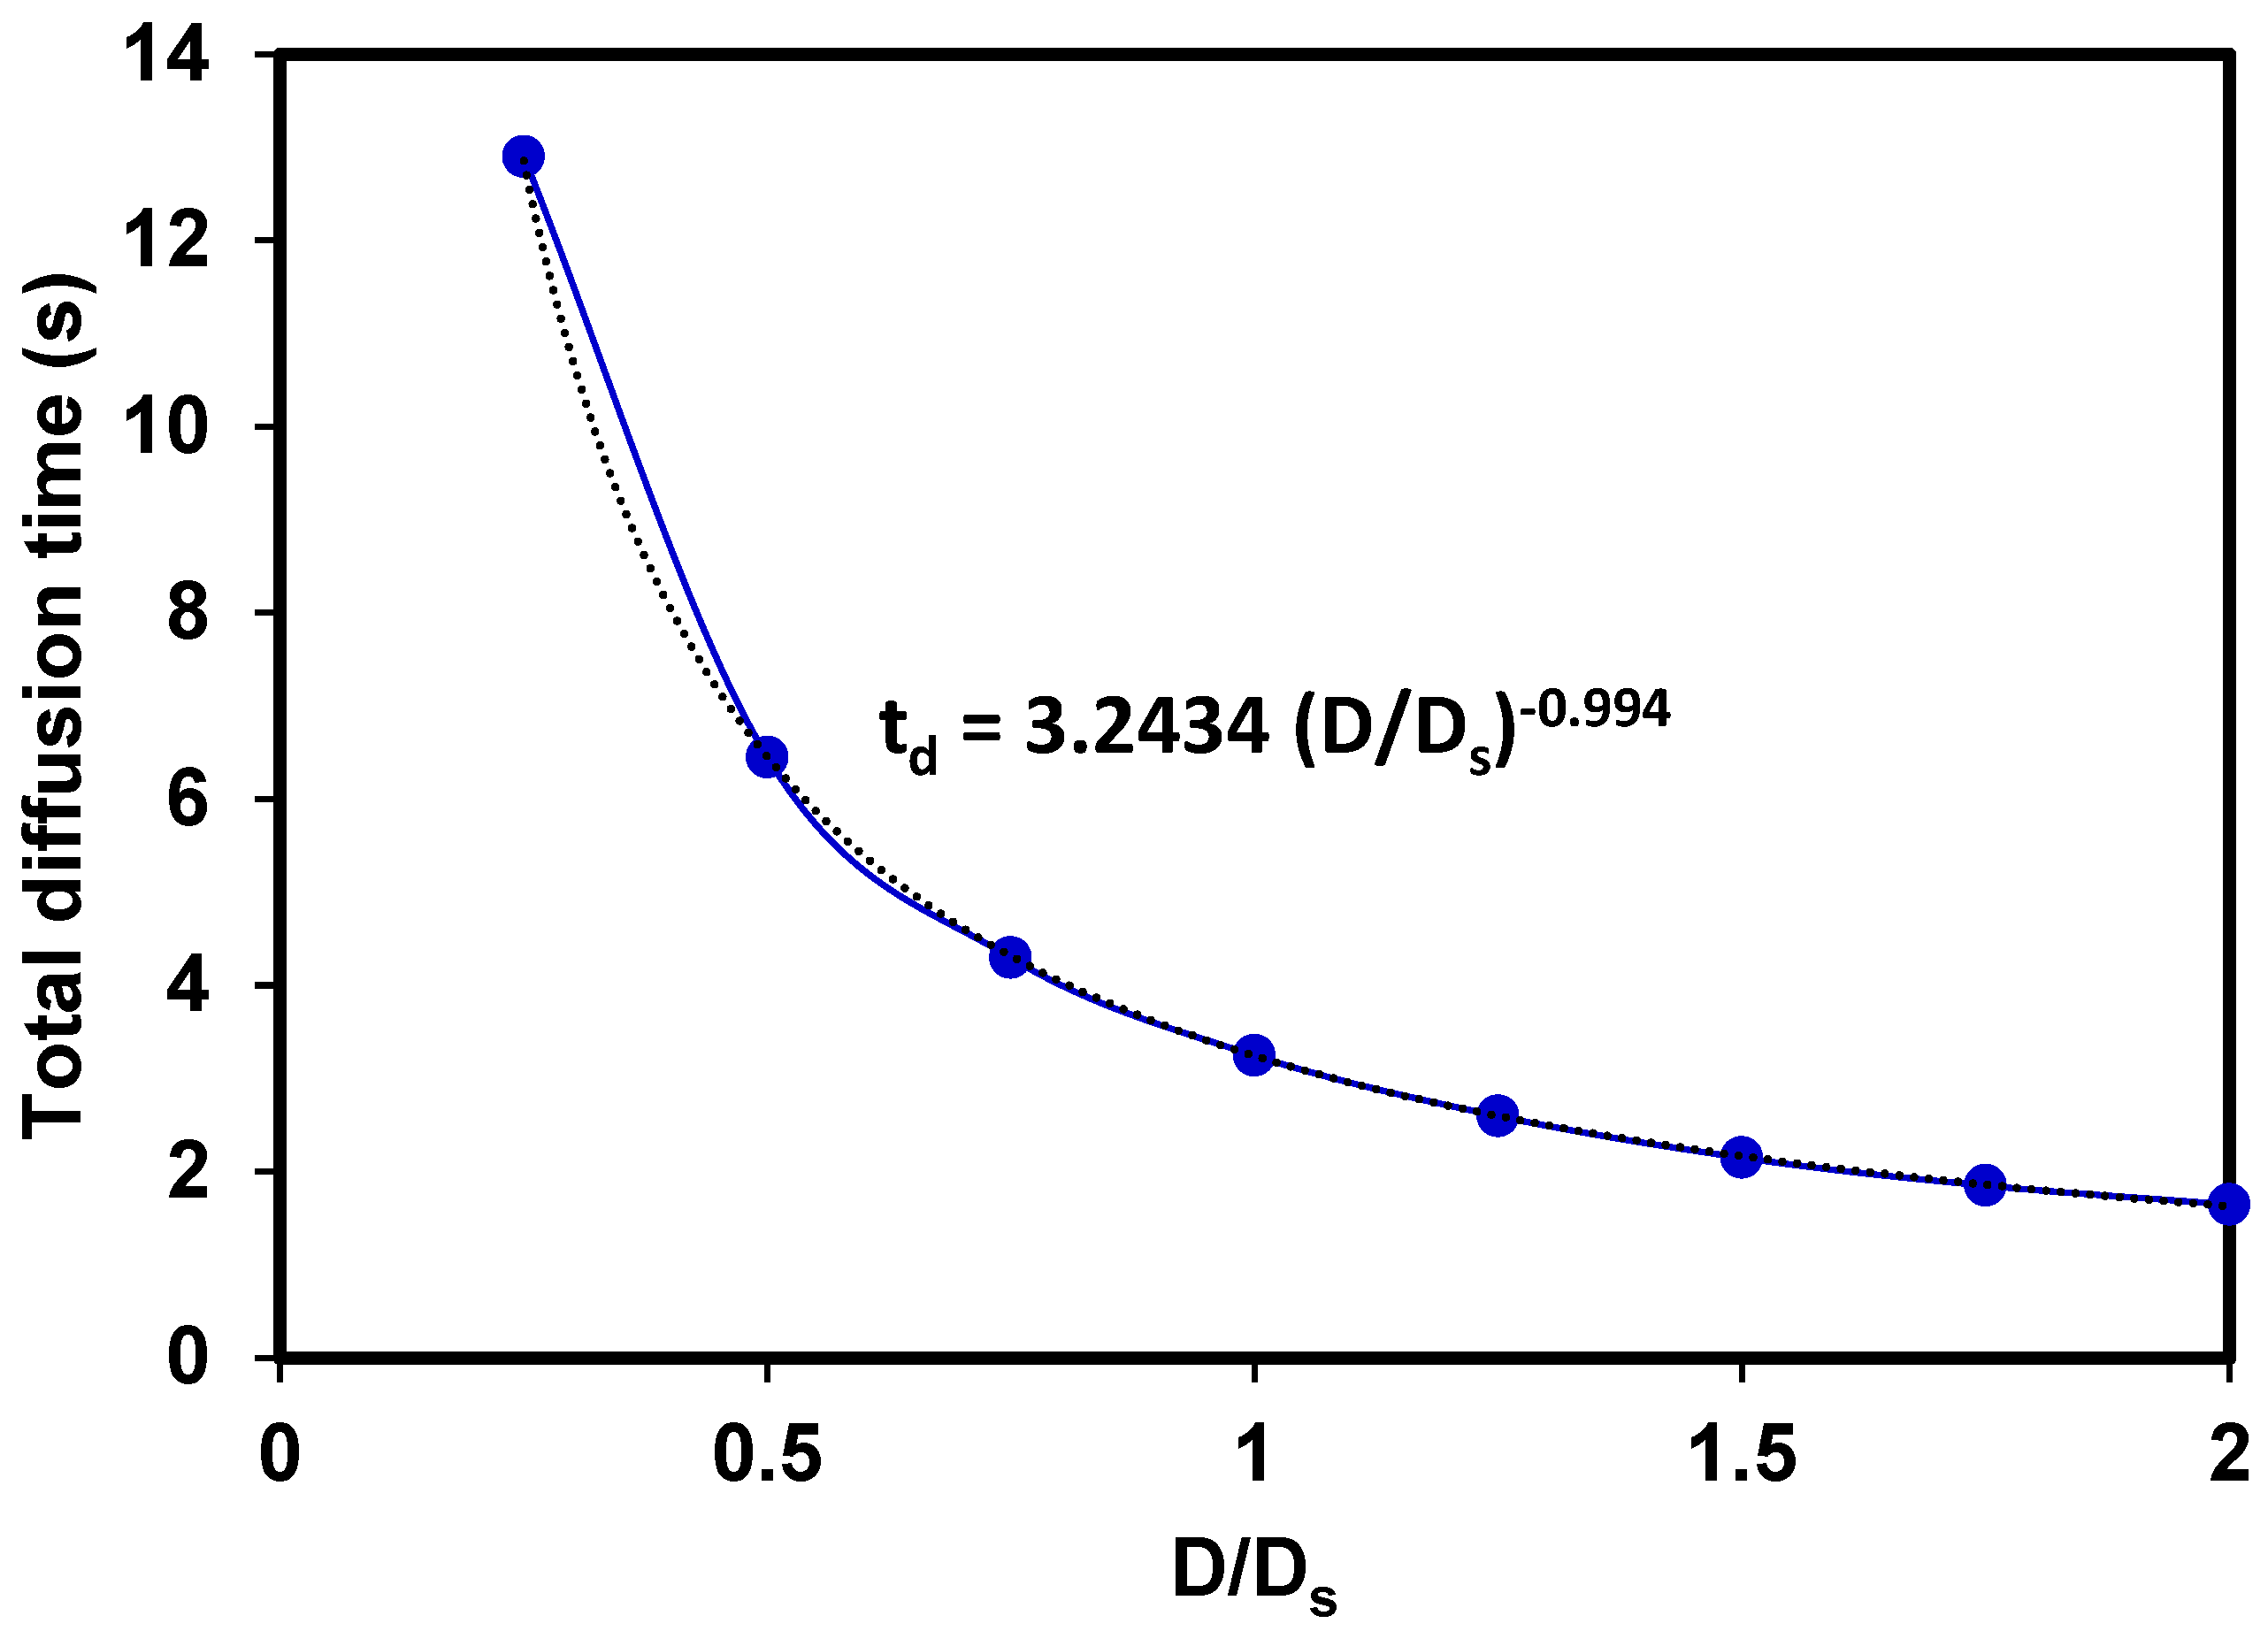
Different types of drugs have different diffusion coefficients. The effects of diffusion coefficient on TDT are investigated for a wide range of diffusion coefficients in MN Case 1. Figure 9 demonstrates TDT for D / D s = 0.25   t o   2   , where D s = 1.5 × 10 9   m 2 / s is the diffusion coefficient of meloxicam gel in a rat skin [29]. The obtained data show that the diffusion coefficient strongly affects the rate of drug diffusion in the MN. In general, increasing the diffusion coefficient leads to decreases in TDT due to faster diffusion. As shown in Figure 9, by increasing D, diffusion time decreases sharply before D / D s = 1 . After D / D s = 1 by increasing D, diffusion time decreases at a lower rate. TDT for D / D s = 0.25 .   1   a n d   2 is 12.9 s, 3.25 s and 1.65 s, respectively. The value of D / D s from 0.25 to 1 becomes four times greater, and the corresponding TDT becomes 3.97 times greater. For D / D s = 0.25   t o   2 with eight times increase in the diffusion coefficient, TDT enhances 7.82 times. The data suggested a nonlinear relation between total diffusion time and the diffusion coefficient.
A curve is fitted on the results to predict the relation between the total diffusion time and the diffusion coefficients that is obtained as below:
t d = 6 × 10 9 D 0.994 ,
where td is total diffusion time in second. D is the diffusion coefficient in m 2 / s . The power of the diffusion coefficient in Equation (5) is near to 1 and the differences can be due to the numerical error. Hence, it can be concluded that total diffusion time is proportional to the inverse of diffusion coefficient.
The results of this work give the relation to estimating the necessary time for drug diffusion from the MN body into the tissue. In a controlled drug release system, an estimation and evaluation of the drug release time from the MN is required. In the studied cases, the drug penetration is fast, and embedding the drug inside this type of HMN does not delay medication delivery. That characterization of fast drug delivery is in demand for analgesics and anti-inflammatory drugs. In cases where long-term drug delivery is of interest, regulating the drug diffusion coefficient is necessary for drug release to occur slowly over a long period.

4. Conclusions

A comprehensive simulation model is provided to predict the diffusion pattern inside the tapered hydrogel microneedle body to give more insight into drug delivery through microneedles. Different sizes of microneedles with different heights and base diameters were simulated. Diffusion is modeled for a wide range of diffusion coefficients. The results showed that the total drug diffusion time inside the microneedle was relatively short, and the drug diffused very rapidly inside the microneedle and penetrated the skin. The rate of drug diffusion from the tip of the microneedle was faster than the diffusion rate from the base plane region at the beginning of the diffusion process. The findings demonstrated that the drug diffusion progress in the way that the drug concentration reaches a semi-spherical shape. In addition to the height and the base diameter of the microneedle, their aspect ratio also affected the total diffusion time. Doubling the microneedle volume by doubling the microneedle height did not lead to double the diffusion time. The results also showed a nonlinear relation between the volume of the microneedle and total diffusion time. Based on the simulation data, a nonlinear relation was obtained for predicting the total diffusion time as a function of the height and base diameter of the microneedle. The presented equation could estimate the total diffusion time of the loaded drug with an error of less than 7%. A wide range of drug diffusion coefficients was simulated, and total diffusion time was evaluated in different microneedles. Also, the obtained data showed that diffusion time decreased very sharply as the diffusion coefficient increased. Similar relations can be developed for the other shapes of MN using the same procedures. The findings of this study can be beneficial to the optimization design of control drug-released systems.

Author Contributions

Conceptualization, H.M. and N.K.; methodology, H.M. and N.K.; software, H.M.; validation, H.M.; formal analysis, N.K..; investigation, H.M.; resources, H.M.; data curation, H.M.; writing—original draft preparation, H.M.; writing—review and editing, N.K.; visualization, H.M.; supervision, H.M. and N.K..; project administration, H.M and N.K..; funding acquisition, H.M. All authors have read and agreed to the published version of the manuscript.

Funding

This research received no external funding.

Data Availability Statement

The data presented in this study are available on request from the corresponding author. The data are not publicly available due to privacy.

Conflicts of Interest

The authors declare no conflict of interest.

References

  1. Bilal, M., et al., Microneedles in smart drug delivery. Advances in wound care, 2021. 10(4): p. 204-219. [CrossRef]
  2. Choi, S.-O. and J.-H. Park, Microneedle technologies. 2021, Springer. p. 1-2. [CrossRef]
  3. Kashaninejad, N., E. Moradi, and H. Moghadas, Chapter Two - Micro/nanofluidic devices for drug delivery, in Progress in Molecular Biology and Translational Science, A. Pandya and V. Singh, Editors. 2022, Academic Press. p. 9-39.
  4. Prausnitz, M.R., Engineering microneedle patches for vaccination and drug delivery to skin. Annual review of chemical and biomolecular engineering, 2017. 8: p. 177-200. [CrossRef]
  5. Jenkins, D., et al., High density and high aspect ratio solid micro-nanoprojection arrays for targeted skin vaccine delivery and specific antibody extraction. Rsc Advances, 2012. 2(8): p. 3490-3495. [CrossRef]
  6. Arya, J. and M.R. Prausnitz, Microneedle patches for vaccination in developing countries. Journal of Controlled Release, 2016. 240: p. 135-141. [CrossRef]
  7. Leone, M., et al., Dissolving microneedle patches for dermal vaccination. Pharmaceutical research, 2017. 34(11): p. 2223-2240. [CrossRef]
  8. Kim, E., et al., Microneedle array delivered recombinant coronavirus vaccines: Immunogenicity and rapid translational development. EBioMedicine, 2020. 55: p. 102743. [CrossRef]
  9. Queiroz, M.L.B., et al., Microneedles as an alternative technology for transdermal drug delivery systems: a patent review. Expert Opinion on Therapeutic Patents, 2020. 30(6): p. 433-452. [CrossRef]
  10. Yahyazadeh Shourabi, A., N. Kashaninejad, and M.S. Saidi, An integrated microfluidic concentration gradient generator for mechanical stimulation and drug delivery. Journal of Science: Advanced Materials and Devices, 2021. 6(2): p. 280-290. [CrossRef]
  11. Rismanian, M., M.S. Saidi, and N. Kashaninejad, A new non-dimensional parameter to obtain the minimum mixing length in tree-like concentration gradient generators. Chemical Engineering Science, 2019. 195: p. 120-126. [CrossRef]
  12. Ebadi, M., et al., A tool for designing tree-like concentration gradient generators for lab-on-a-chip applications. Chemical Engineering Science, 2020. 212: p. 115339. [CrossRef]
  13. Vu, H.H., N.-T. Nguyen, and N. Kashaninejad, Re-Entrant Microstructures for Robust Liquid Repellent Surfaces. Advanced Materials Technologies, 2023. 8(5): p. 2201836. [CrossRef]
  14. Kashaninejad, N. and N.-T. Nguyen, Microfluidic solutions for biofluids handling in on-skin wearable systems. Lab on a Chip, 2023. 23(5): p. 913-937. [CrossRef]
  15. Han, T. and D.B. Das, A new paradigm for numerical simulation of microneedle-based drug delivery aided by histology of microneedle-pierced skin. Journal of pharmaceutical sciences, 2015. 104(6): p. 1993-2007. [CrossRef]
  16. Larraneta, E., et al., Microneedle arrays as transdermal and intradermal drug delivery systems: Materials science, manufacture and commercial development. Materials Science and Engineering: R: Reports, 2016. 104: p. 1-32. [CrossRef]
  17. Nagarkar, R., et al., A review of recent advances in Microneedle technology for transdermal drug delivery. Journal of Drug Delivery Science and Technology, 2020: p. 101923. [CrossRef]
  18. Kashaninejad, N., et al., Microneedle Arrays for Sampling and Sensing Skin Interstitial Fluid. Chemosensors, 2021. 9(4): p. 83. [CrossRef]
  19. Choi, I.-J., et al., Live Vaccinia Virus-Coated Microneedle Array Patches for Smallpox Vaccination and Stockpiling. Pharmaceutics, 2021. 13(2): p. 209. [CrossRef]
  20. Li, X., et al., Gene-coated Microneedle Patch based on Industrialized Ultrasonic Spraying Technology with Polycation Vector to Improve Antitumor Efficacy. Journal of Materials Chemistry B, 2021. [CrossRef]
  21. Mishra, R., T.K. Maiti, and T.K. Bhattacharyya, Design and scalable fabrication of hollow SU-8 microneedles for transdermal drug delivery. IEEE Sensors Journal, 2018. 18(14): p. 5635-5644. [CrossRef]
  22. Turner, J.G., et al., Hydrogel-forming microneedles: current advancements and future trends. Macromolecular Bioscience, 2021. 21(2): p. 2000307.
  23. Kim, K.S., K. Ita, and L. Simon, Modelling of dissolving microneedles for transdermal drug delivery: theoretical and experimental aspects. European Journal of Pharmaceutical Sciences, 2015. 68: p. 137-143. [CrossRef]
  24. Ronnander, P., et al., Modelling the in-vitro dissolution and release of sumatriptan succinate from polyvinylpyrrolidone-based microneedles. European Journal of Pharmaceutical Sciences, 2018. 125: p. 54-63. [CrossRef]
  25. Olatunji, O., D.B. Das, and B. Al-Qallaf. Simulation based optimization of microneedle geometry to improve drug permeability in skin. in Proceedings of the 7th Industrial Simulation Conference. 2009. Citeseer.
  26. Machekposhti, S., et al., Biocompatible polymer microneedle for topical/dermal delivery of tranexamic acid. Journal of Controlled Release, 2017. 261: p. 87-92. [CrossRef]
  27. Ronnander, P., L. Simon, and A. Koch, Experimental and mathematical study of the transdermal delivery of sumatriptan succinate from polyvinylpyrrolidone-based microneedles. European Journal of Pharmaceutics and Biopharmaceutics, 2020. 146: p. 32-40. [CrossRef]
  28. Zoudani, E. and M. Soltani, A new computational method of modeling and evaluation of dissolving microneedle for drug delivery applications: Extension to theoretical modeling of a novel design of microneedle (array in array) for efficient drug delivery. European Journal of Pharmaceutical Sciences, 2020. 150: p. 105339. [CrossRef]
  29. Castilla-Casadiego, D.A., et al., Design, characterization, and modeling of a chitosan microneedle patch for transdermal delivery of meloxicam as a pain management strategy for use in cattle. Materials Science and Engineering: C, 2021. 118: p. 111544. [CrossRef]
  30. Yadav, P.R., et al., Mathematical modelling, simulation and optimisation of microneedles for transdermal drug delivery: trends and progress. Pharmaceutics, 2020. 12(8): p. 693. [CrossRef]
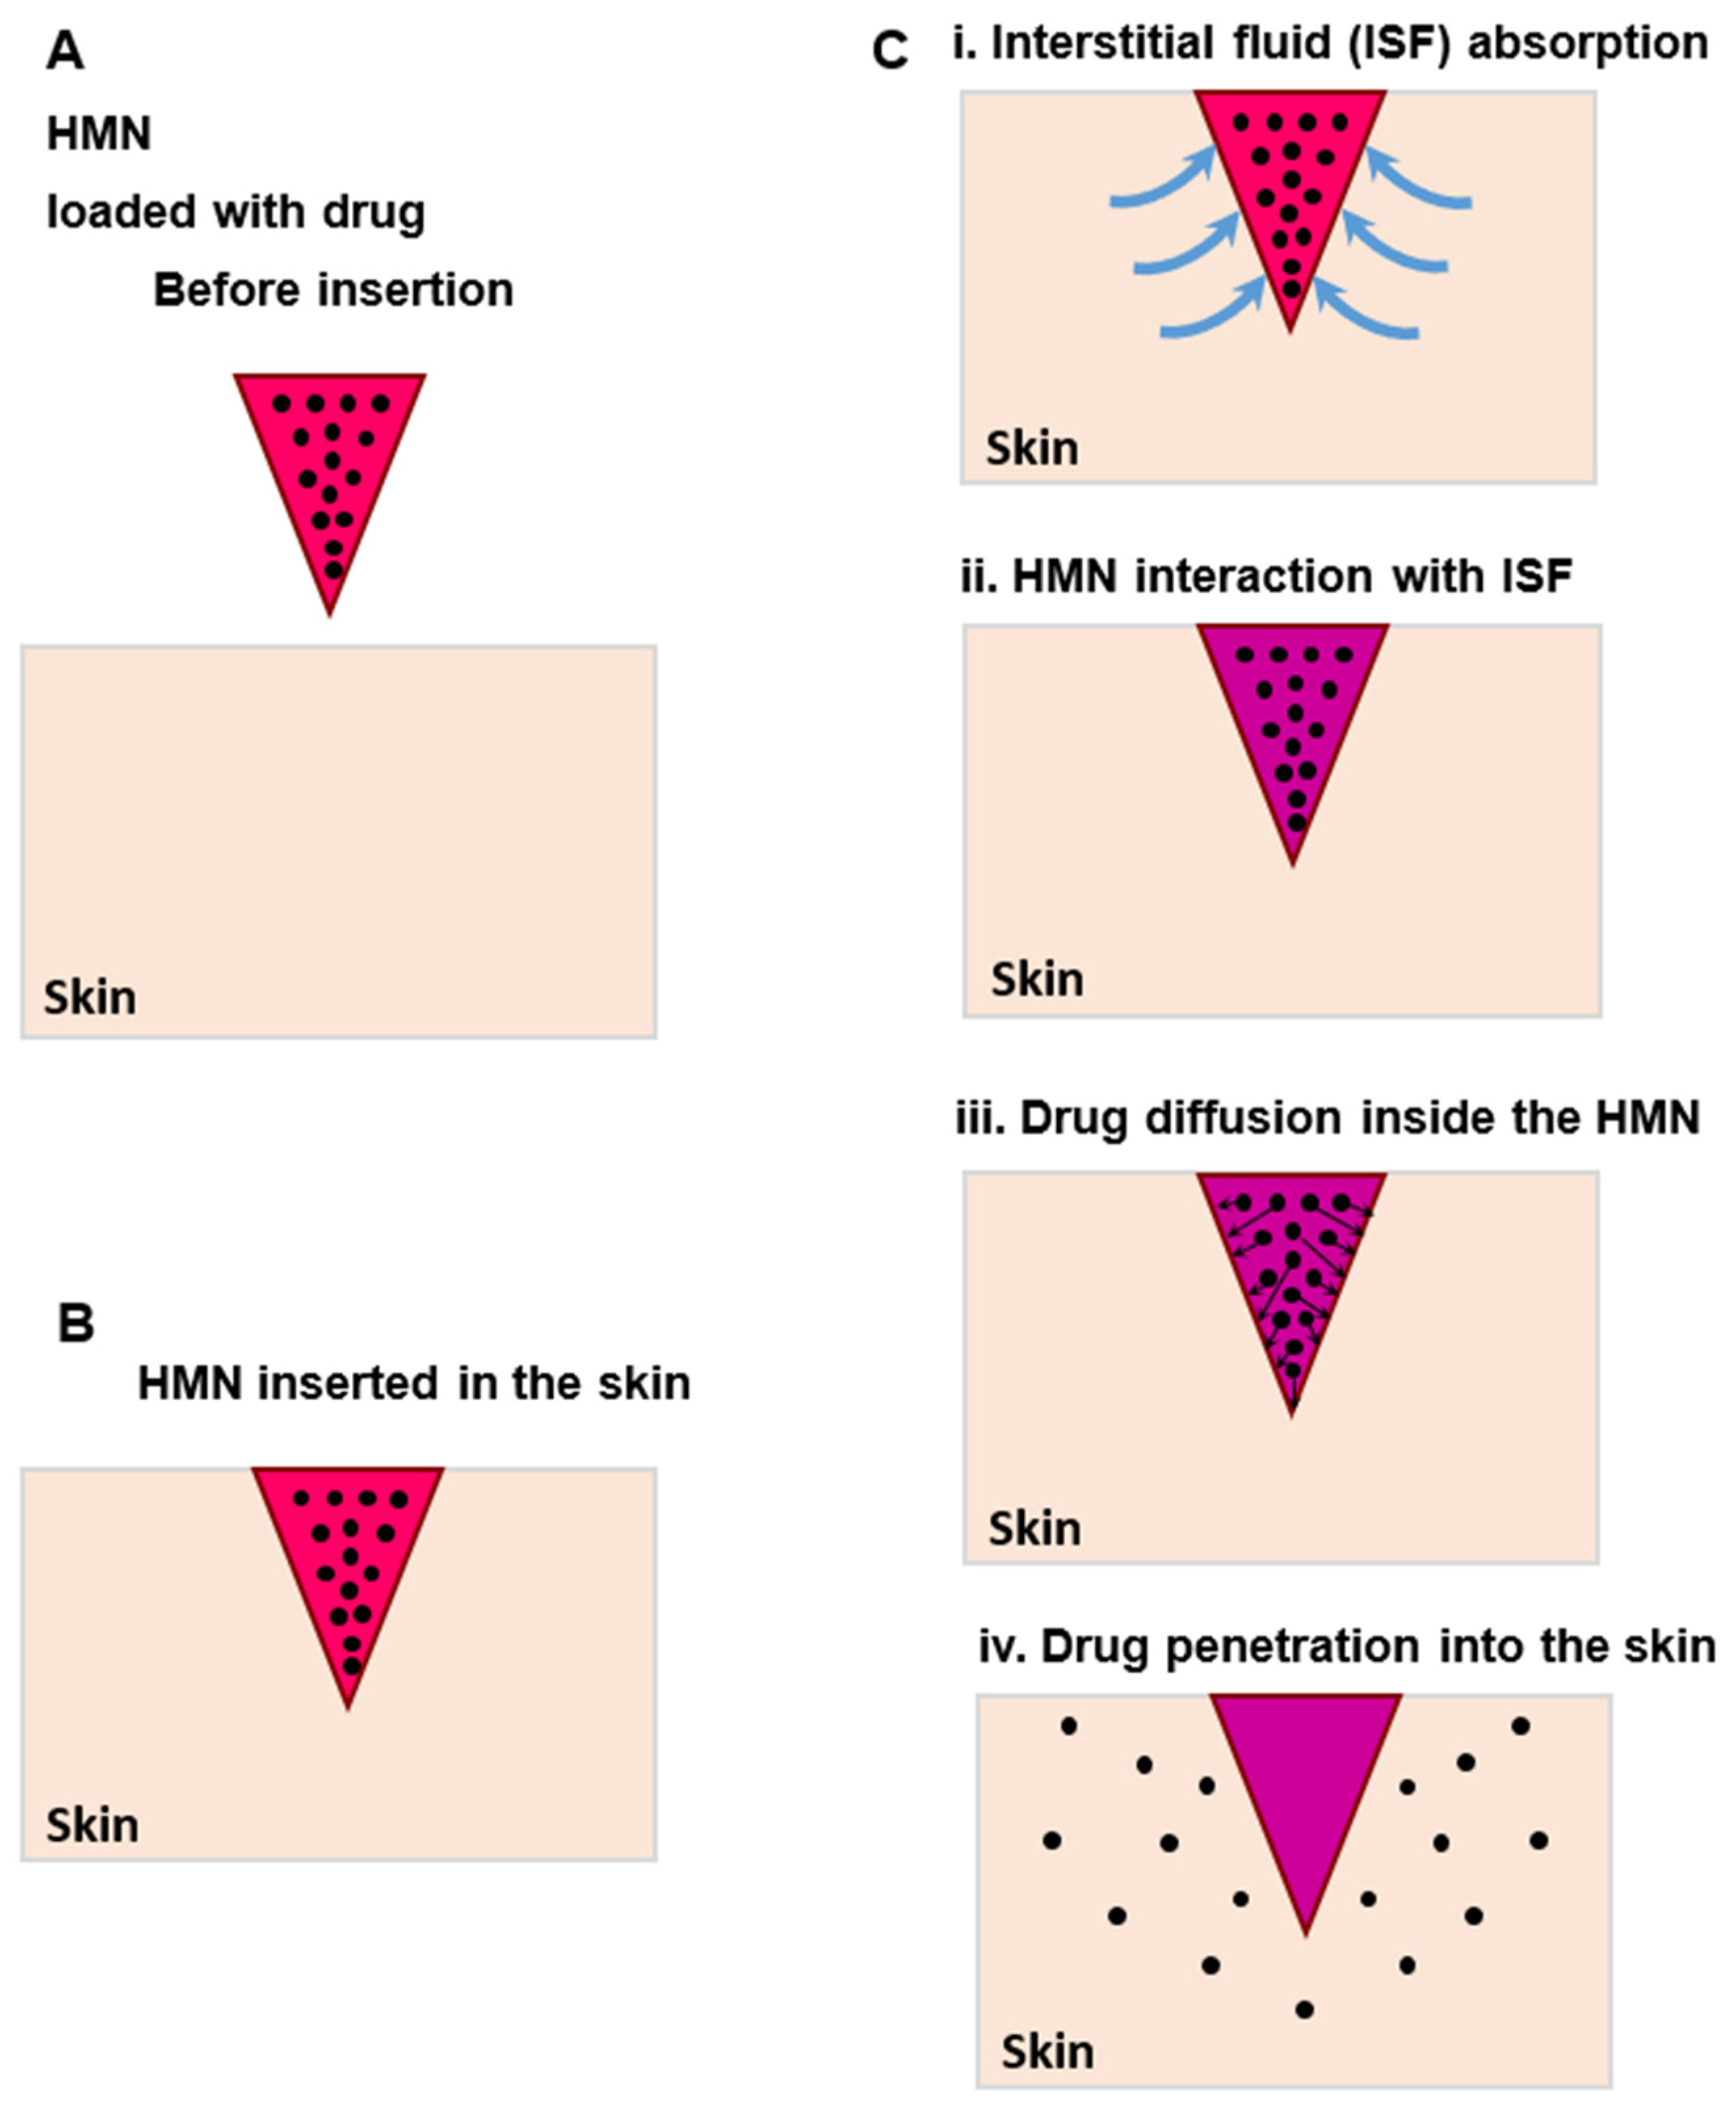
Figure 1. Drug delivery by the HMN. A) HMN loaded with the drug before insertion into the skin. B) HMN inserted into the skin. C) Drug diffusion process. i) ISF absorption, ii) HMN interaction with ISF. iii) Drug diffusion inside MN. iv) Drug penetration of the skin and diffusion into deep layers.
Preprints 70381 g001
Figure 2. The generated mesh inside the MN. A sample MN with a height of 500 µm and base diameter of 250 µm, is discretized into 34,000 elements using finer mesh in the software.
Preprints 70381 g002
Figure 3. Drug diffusion inside the tapered MN. The contours of drug concentration in the base plane and the middle slice of the sample MN are shown at different time intervals. The sample MN has a base diameter of 250 µm and a height of 500 µm. The dimensions are in µm. Those parts of the MN with the drug concentration lower than 10% of C0 are shown with the white color boundary. The remaining parts are demonstrated as the legend.
Preprints 70381 g003
Figure 4. The height and base diameter reduction of the drug region of the MN. The data is plotted for h and d, which are respectively, the instantaneous height and diameter of the drug region during drug diffusion.
Preprints 70381 g004
Figure 5. The ratio of the instantaneous height to base diameter, h/d, versus dimensionless time for two different cases during diffusion. Dimensionless time is defined as the time divided by the TDT. Case one is an MN with d0s=250 µm and h0s= 500 µm, and case two is an MN with d0=500 µm and h0=1000 µm.
Preprints 70381 g005
Figure 6. Contours of drug diffusion in MN with different aspect ratios. a) Case 1 is an MN with a base diameter of d0s=250 µm and a height of h0s=500 µm. b) Case 2 is an MN with the same base diameter but a height of two times larger (d0=d0s, h0=2h0s), and c) Case 3 is an MN with d0=2d0s, h0=2h0s.
Preprints 70381 g006
Figure 7. Total diffusion time for the MNs with h0/d0=1,2,3 and 4 for d0/d0s= 0.25 to 2. Here h0 and d0 are the initial height and base diameter of the MN.
Preprints 70381 g007
Figure 8. The parameter V/td in which V is the MN volume and td is the TDT. The data are plotted for various h0/d0, and different values of d0/d0s. Here h0 and d0 are the initial height and base diameter of the MN and d0s=250 µm is the initial base diameter of the MN of case 1.
Preprints 70381 g008
Figure 9. The effect of diffusion coefficient on total diffusion time for D / D s = 0.25   t o   2   w h e r e   D s = 1.5 × 10 9   m 2 / s   is the diffusion coefficient of meloxicam gel in a rat skin [29].
Preprints 70381 g009
Disclaimer/Publisher’s Note: The statements, opinions and data contained in all publications are solely those of the individual author(s) and contributor(s) and not of MDPI and/or the editor(s). MDPI and/or the editor(s) disclaim responsibility for any injury to people or property resulting from any ideas, methods, instructions or products referred to in the content.
Copyright: This open access article is published under a Creative Commons CC BY 4.0 license, which permit the free download, distribution, and reuse, provided that the author and preprint are cited in any reuse.
Prerpints.org logo

Preprints.org is a free preprint server supported by MDPI in Basel, Switzerland.

Subscribe

© 2024 MDPI (Basel, Switzerland) unless otherwise stated