1. Introduction
Shear thickening fluids are colloidal suspensions that exhibit an appreciable increase in viscosity when subjected to external forces. One of the most significant and intriguing characteristics of this type of fluid is the reversible process that may be witnessed when loads are no longer applied to the medium, resulting in a decrease in viscosity and a return to the liquid state [
1,
3].
Due to their characteristic behaviour, numerous studies have been undertaken to comprehend and apply their rheological features to engineering fields. These fluids have been proposed for shock wave absorption, damping systems, and structural components to enhance the performance of the systems in which they are integrated [
4,
6].
Moreover, since the beginning of the 21st century, research has been conducted on protective applications to boost their effectiveness while making them lighter and more flexible [
7,
8]. Despite its negative environmental impact, Kevlar, or aramid fibre, is the most often used material for body armour [
9] since it is non-biodegradable and takes around 400 years to degrade. Even though a tiny percentage of this fibre can be recycled or reused in other products, the constant and frequent replacement of these covers results in enormous waste. Thus, enhancing the present sustainability of the process and materials becomes necessary. Several research teams have developed what is known as Liquid armour by impregnating Kevlar textiles with non-Newtonian fluids [
5].
Lee et al. [
9] have, for the first time, incorporated STF into Kevlar fabric, thereby boosting its ballistic performance against external impacts and enhancing the flexibility of conventional body covers. Another study investigated the deformations and absorption energies of Kevlar materials subjected to impact, with or without STF treatment [
12]. The results indicate that primary yarns contribute to untreated textiles' load distribution and energy absorption. However, fabrics treated with STF transformed into a solid substance upon impact, fusing the wires into a single structure and enhancing the fabric's capacity for load bearing, energy absorption, and impact dispersion [
12]. Twaron cloth treated with STF was investigated for shock waves [
13]. The STF was produced from a suspension of nanoscale-fumed silica particles in liquid PEG (Polyethylene Glycol). Regarding shock wave protection, STF-impregnated fabric performed better than untreated and PEG-impregnated fabric. The authors of [
8] investigated multiphase STF systems for shock absorption and demonstrated that friction between wires is the principal energy absorption mechanism in tissues impregnated with STF.
Body armour built from aramid fabrics impregnated with STF and designed to withstand ballistic impacts and stab wounds was developed by [
14]. In the presence of STF, tissue sensitivity and shear stiffness both increased. Results indicated that STF impregnated in multiphase fabrics had superior ballistic performance than STF impregnated in single-phase fabrics. At the rheological level, it was also discovered that shear thickening is not a direct indicator of the tissue or STF defence capacity; tissues impregnated with multiphase STF perform better in ballistic testing, whereas single-phase STF thickening behaviour tests produce superior results.
Concerning government strategies such as the Paris Agreement or the United Nations' sustainable development goals, this research aims to combine cork grains with shear-thickening fluids to produce agglomerates exposed to compressive loads. Cork is renowned for its exceptional mechanical properties, including its excellent resistance to impact and low thermal and acoustic conductivities.
Ptak et al. [
15] investigated the mechanical behaviour of cork agglomerates subjected to high-energy impact tests and extreme temperatures (-30°C to 100°C). They determined that cork agglomerates' energy absorption capacity depended on the agglomeration density and temperature. It was proved that when density increases, so does temperature's influence. Fernandes et al. evaluated the mechanical performance of synthetic and natural cellular materials [
16]. It has been demonstrated that, in impact situations, natural cellular materials provide an excellent compromise between performance and resistance over a multitude of impacts. In addition, a Finite Element Analysis (FEA) was conducted, and the results produced were comparable to the experimental results. Santos et al. [
17] investigated how numerous parameters, such as grain size, type of binder, binder %, and agglomerate density, might impact the mechanical behaviour of agglomerated cork. Both quasi-static compression and dynamic impact tests led to results that must be considered when utilising these materials for various applications. Environmentally, cork stands out because it is a natural, reusable, recyclable substance that, like cork oaks, can absorb carbon dioxide [
18,
19].
As a hybrid heterogeneous material, cork combined with shear-thickening fluids has been the subject of several works. STFs and micro-agglomerate cork sheets were used to create and test [
6] an environmentally friendly, lightweight energy-absorbing composite. Laser-engraved laminar sheets of compacted micro-agglomerated cork were filled and sealed with a concentrated corn-starch solution. Experiments have shown that the performance of the composite is impacted not only by the shear viscosity of the fluid but also by its normal forces, the elastic response of the cork, the fluid-structure interaction, and the confinement-induced shear thickening behaviour. Gurgen et al. [
1] studied smart natural suspensions' rheology and deformation behaviour. They concluded that cork grains could be used to adjust the STF rheology, making cork a suitable additive material in eco-friendly smart suspensions. Serra et al. [
21] examined the influence of STF combined with cork material at low and high-impact energies. The results revealed that the STF performs better when utilised in bulk when entirely restricted and under high-impact energies. Cork and the impregnated fabric had the most remarkable results in low- and high-energy collisions. These samples exhibited the highest strain, impact duration, and strain values for the given amounts of absorbed energy. Moreover, these composite samples are the lightest examined, showing a reasonable balance between density and energy absorption capacity.
This work presents a novel way to combine cork grain and STF material in a homogenous way by producing cork agglomerates where the STF is dispersed in the mixture before the agglomeration and curing phase necessary to produce cork agglomerates.
2. Materials and Methods
2.1. Materials
Carel - Campos & Resende (Portugal) provided the cork grains used in the experimental phase of this article [
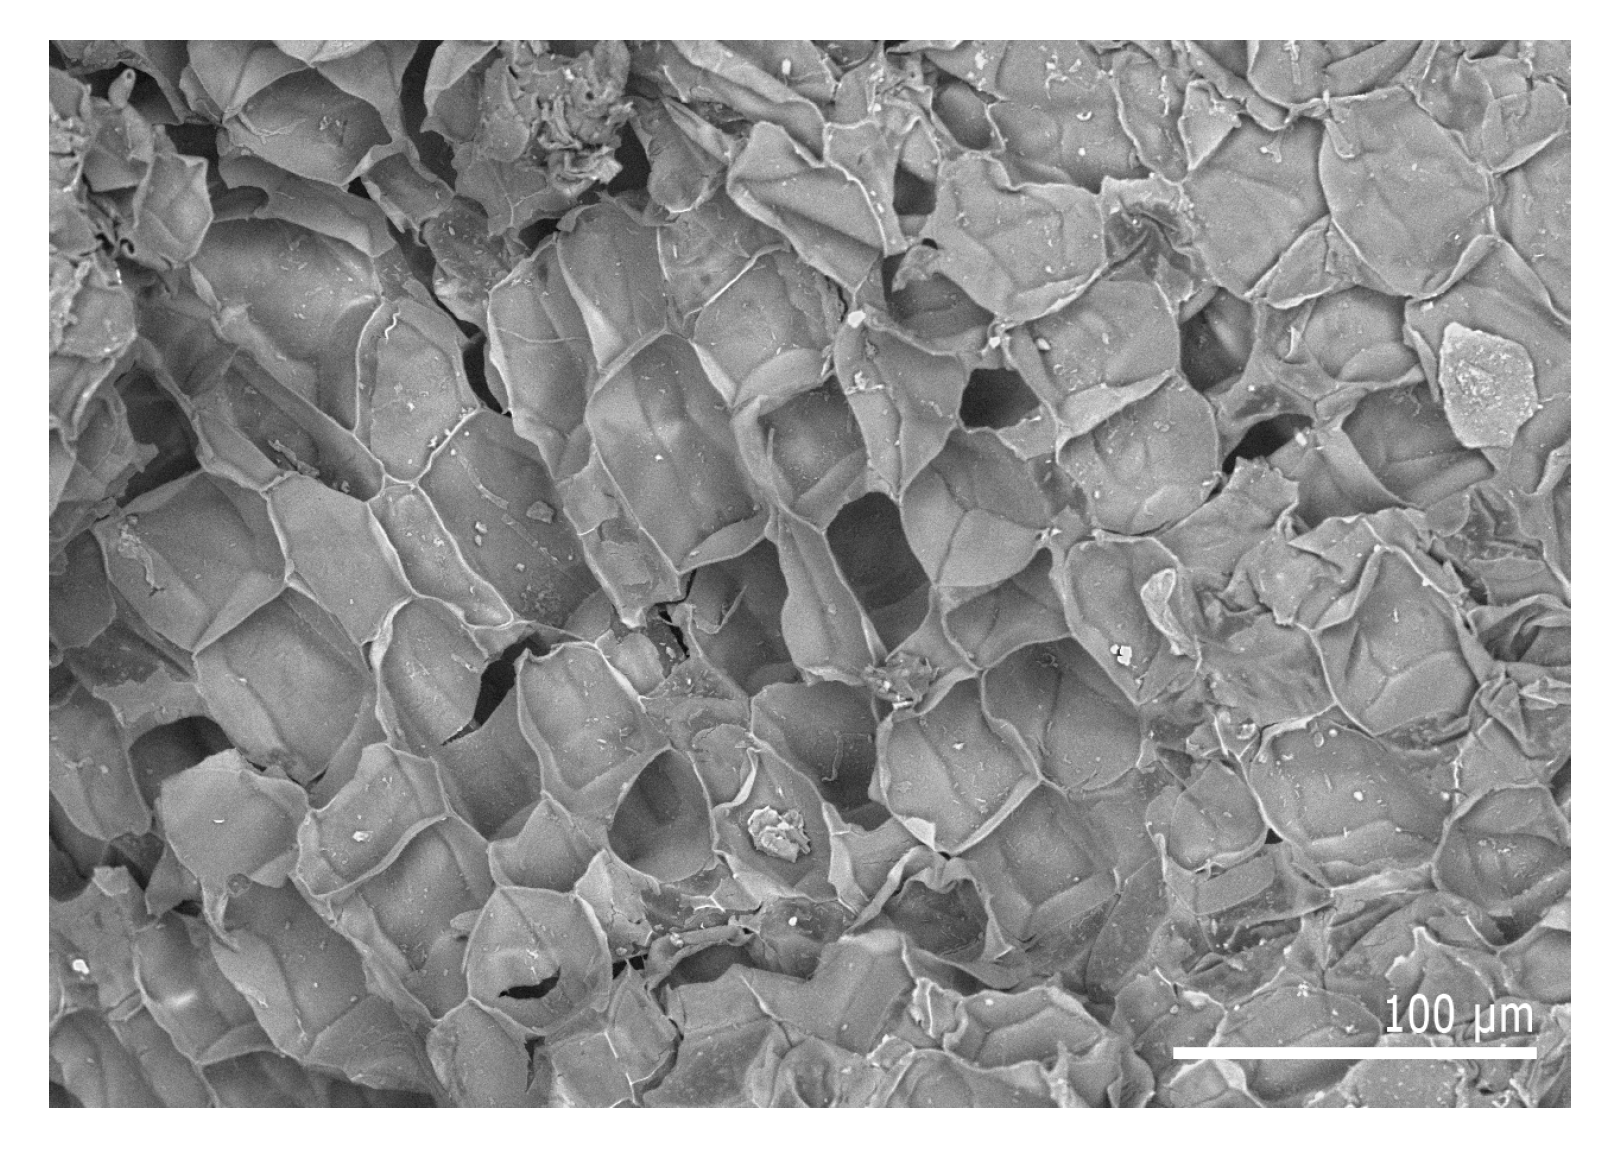
22]. Cork grains are produced after grinding the scraps from cork wine-stoppers production. The grains can have variable interval sizes, being the one chosen for this work the smallest available: from 0.5 to 1.0 mm,
Figure 1 and
Figure 2.
The shear-thickening fluid was supplied by Polyanswer (Portugal) [
23]. This company provides various solutions, from the dilatant fluid in its unprocessed form to adding it to other substances or employing it as a constituent of different polymers [
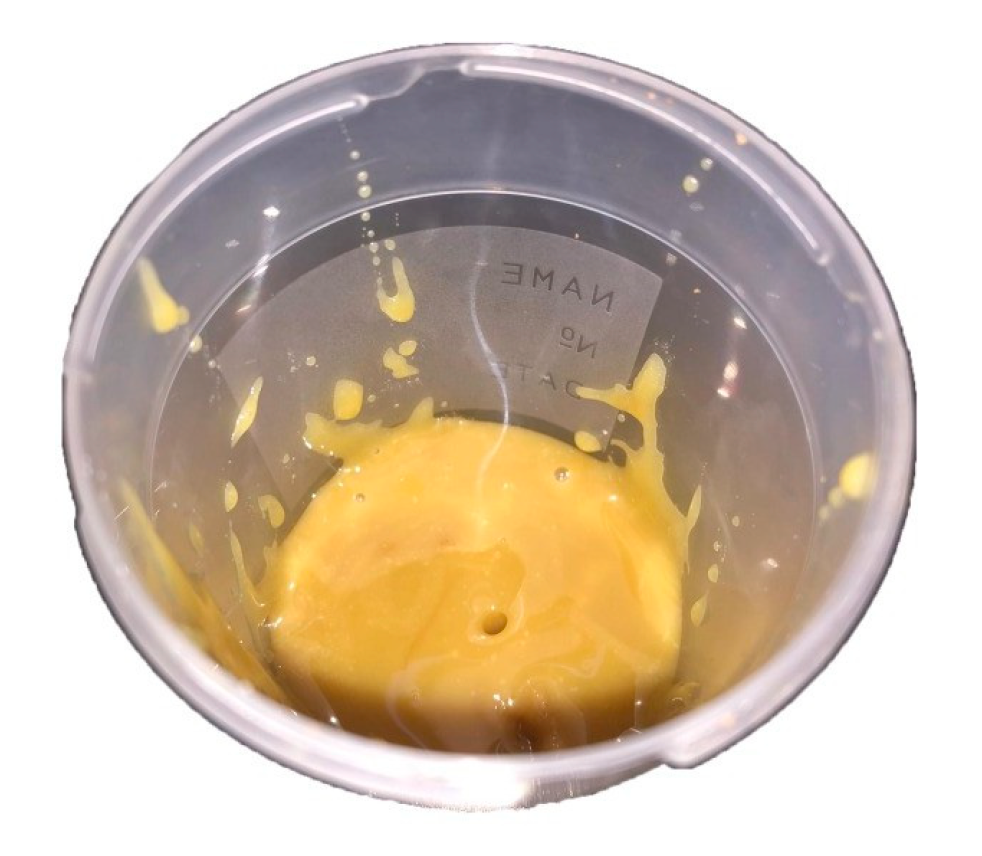
21]. This STF employed is patented under the European Patent EP3366715A1, and its constituent components are based on isocyanate, polyols, amines and acids. The dilatant fluid was used in this paper in its raw form (
Figure 3), being further combined with the binder, a diisocyanate based pre-polymers based in methylene diphenyl diisocyanate (MDI) and toluene diisocyanate (TDI), provided by Flexpur (Portugal) to assist in the agglomeration process of the cork grains [
24]. In particular, the Flexpur 280A was the item supplied. The curing phase must be chosen between 120
◦C and 140
◦C to promote the chemical reactions.
To confirm its thickening properties, and the change in viscosity as a function of temperature, the product was tested on the Thermo Scientific SNB-2-H digital viscometer, The viscosity was measured at three different temperatures. First at room temperature, 20
◦C, then at 50
◦C, and finally at 80
◦C. Initially, the fluid showed values approximating 95570 mPa.s. After the first temperature increase, the viscosity value decreased to 70850 mPa.s, and finally, at 80
◦C, the viscosity presented close to 50480 mPa.s. Additionally,
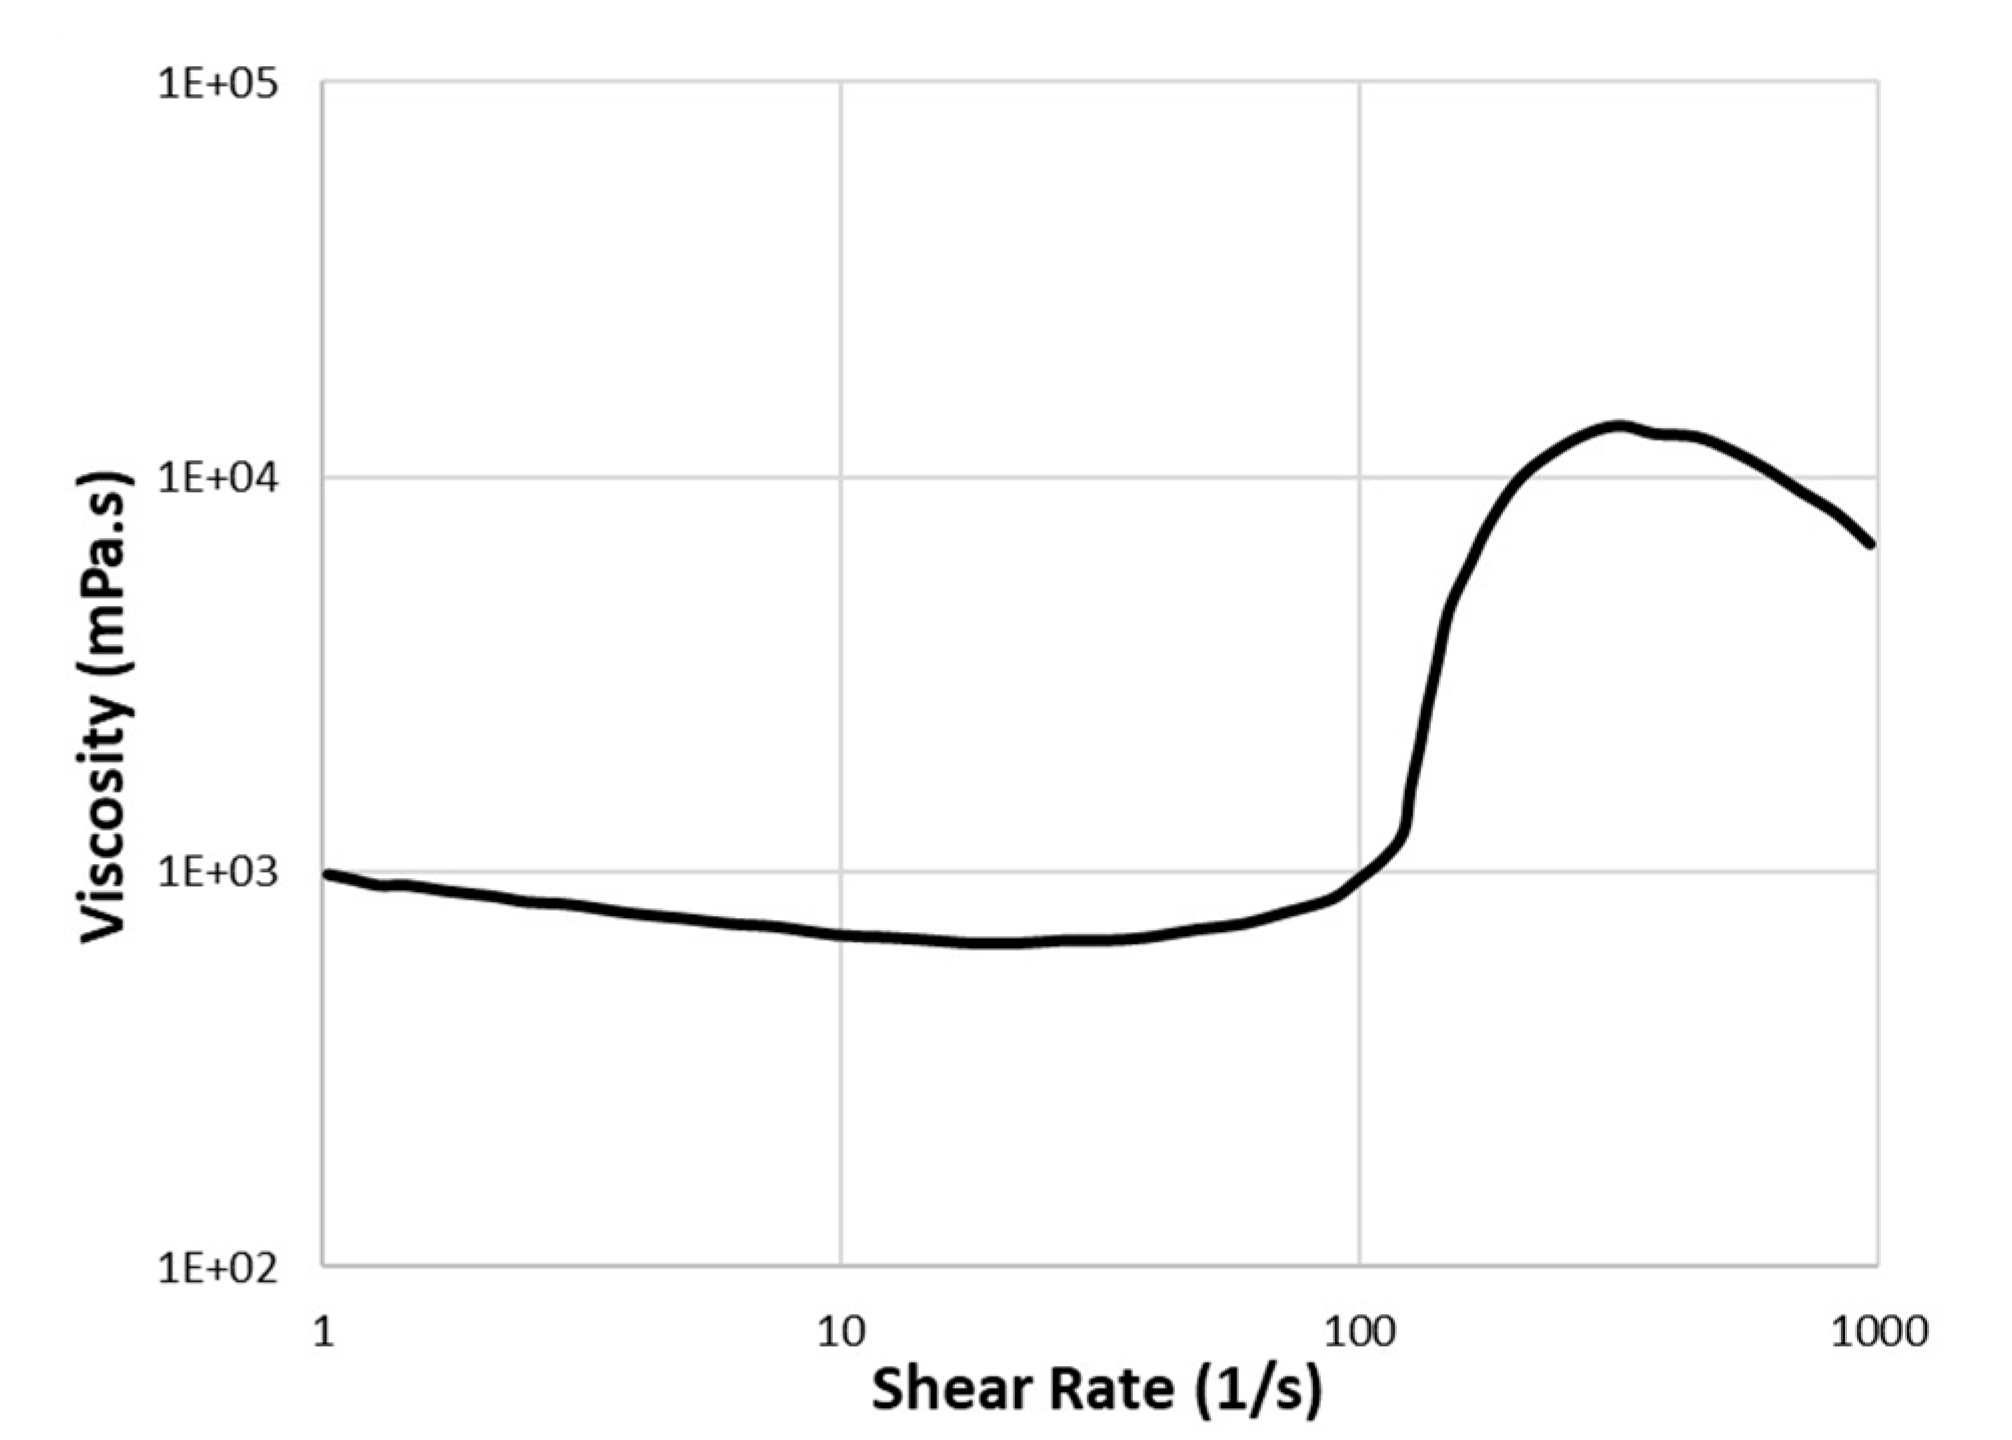
Figure 4 presents the variation of viscosity in function of the shear rate.
2.2. Samples Production
A design of experiments was developed to assess the parameter variation between the mixtures to be produced and how the percentage amount of STF, and subsequently the amount of cork, affect the outcomes of the mechanical tests. The weight percentages of STF and cork (hence) were the only materials variables subject to change, whereas the proportions of binder (10 wt.%) and water (5 wt.%), remained consistent across all samples (
Table 1). The shear-thickening fluid content varied from 0 wt.% to 30 wt.%, gradually increasing by 10 wt.% between each mixture. Above 30 wt.% of STF, the agglomerate would become a paste with no aggregation. On the other hand, the proportion of cork reduces proportionally when the shear-thickening fluid percentage rises. Therefore, between 85 wt.% and 55 wt.% of the total mass of the mixture was cork.
All the samples were designed to have a constant final density of roughly 240 kg/m3, as this paper does not evaluate the fluctuation in the samples’ densities.
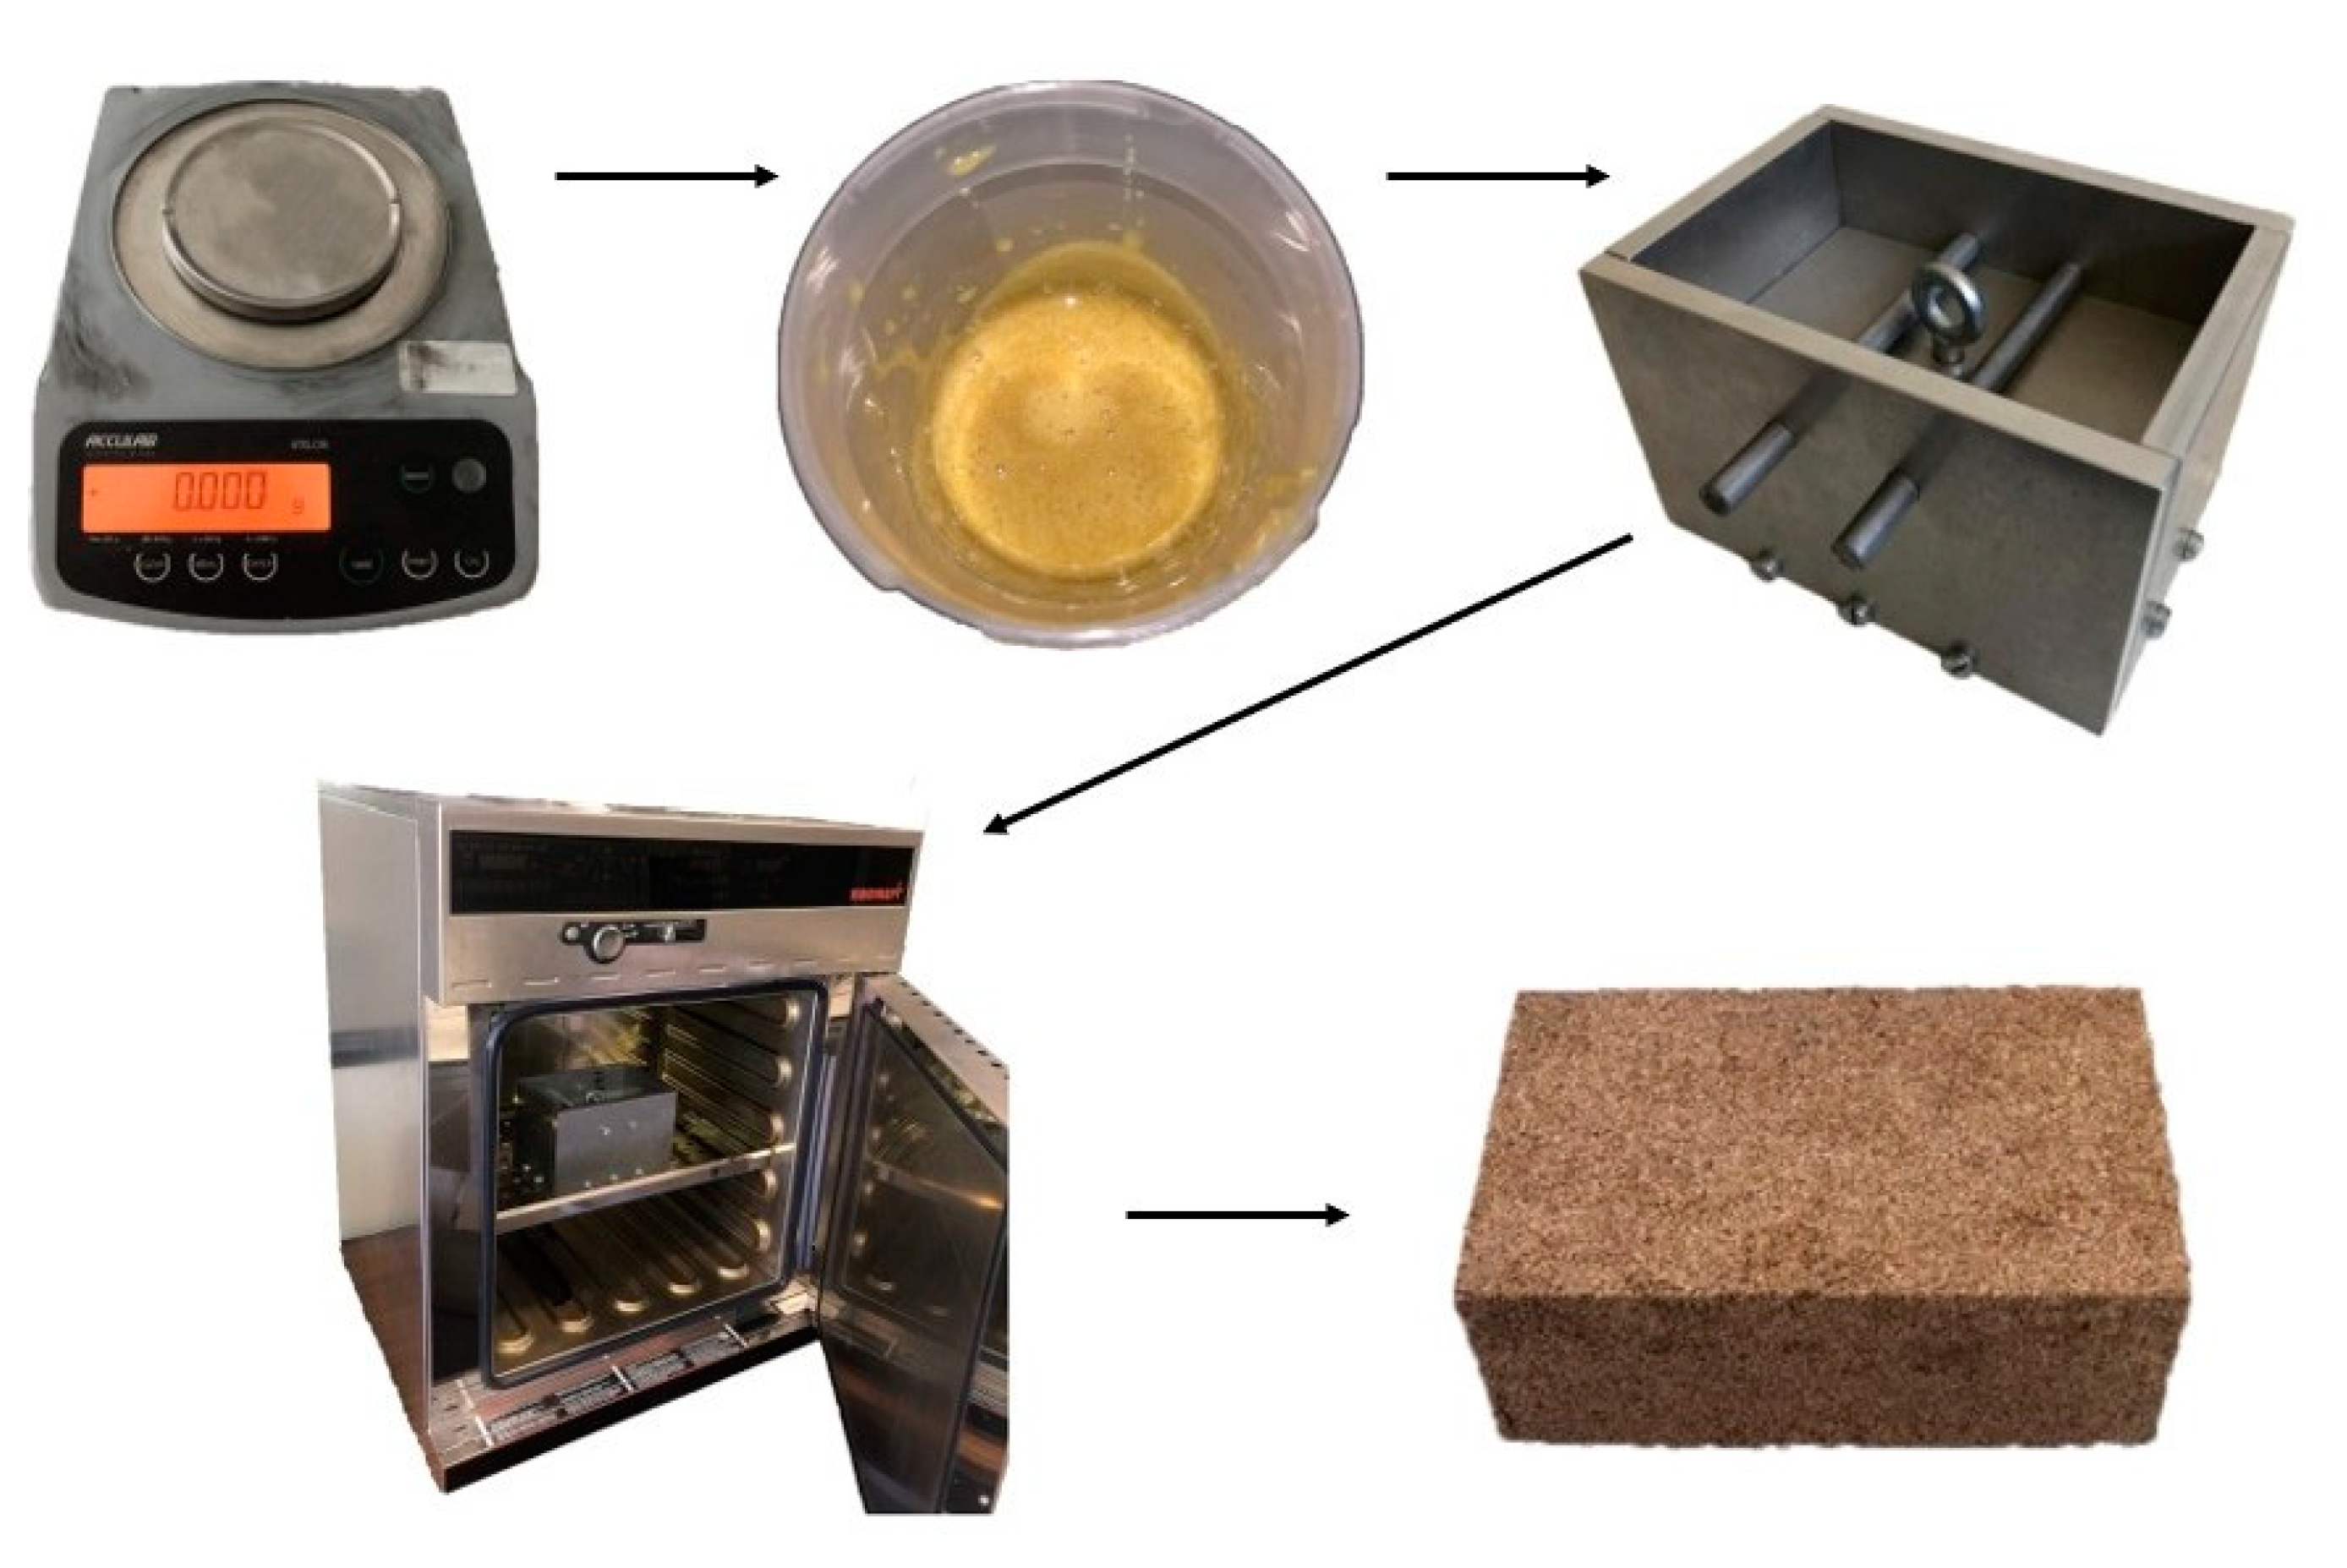
Three simple steps were required to produce blends,
Figure 5. Weighing all the materials, including cork, shear-thickening fluid, binder, and a small amount of distilled water (5 wt.%), is the first step in the procedure. The STF is then heated to 50
◦C to become less viscous, ensuring a more homogenous mixture. The cork container is filled with distilled water, shear-thickening fluid, and binder. All the components are thoroughly mixed to ensure homogeneity. The prepared mixtures were then moulded into a parallelepiped with dimensions 150×100×50 millimetres (
Figure 5).
The mixture is poured into the mould and placed under manual pressure. The mould was produced with two dowels on top of the lid to prevent it from rising and to ensure that the volume of the mixture did not vary throughout the remaining steps of the process.
The mixture was baked for two hours at 120
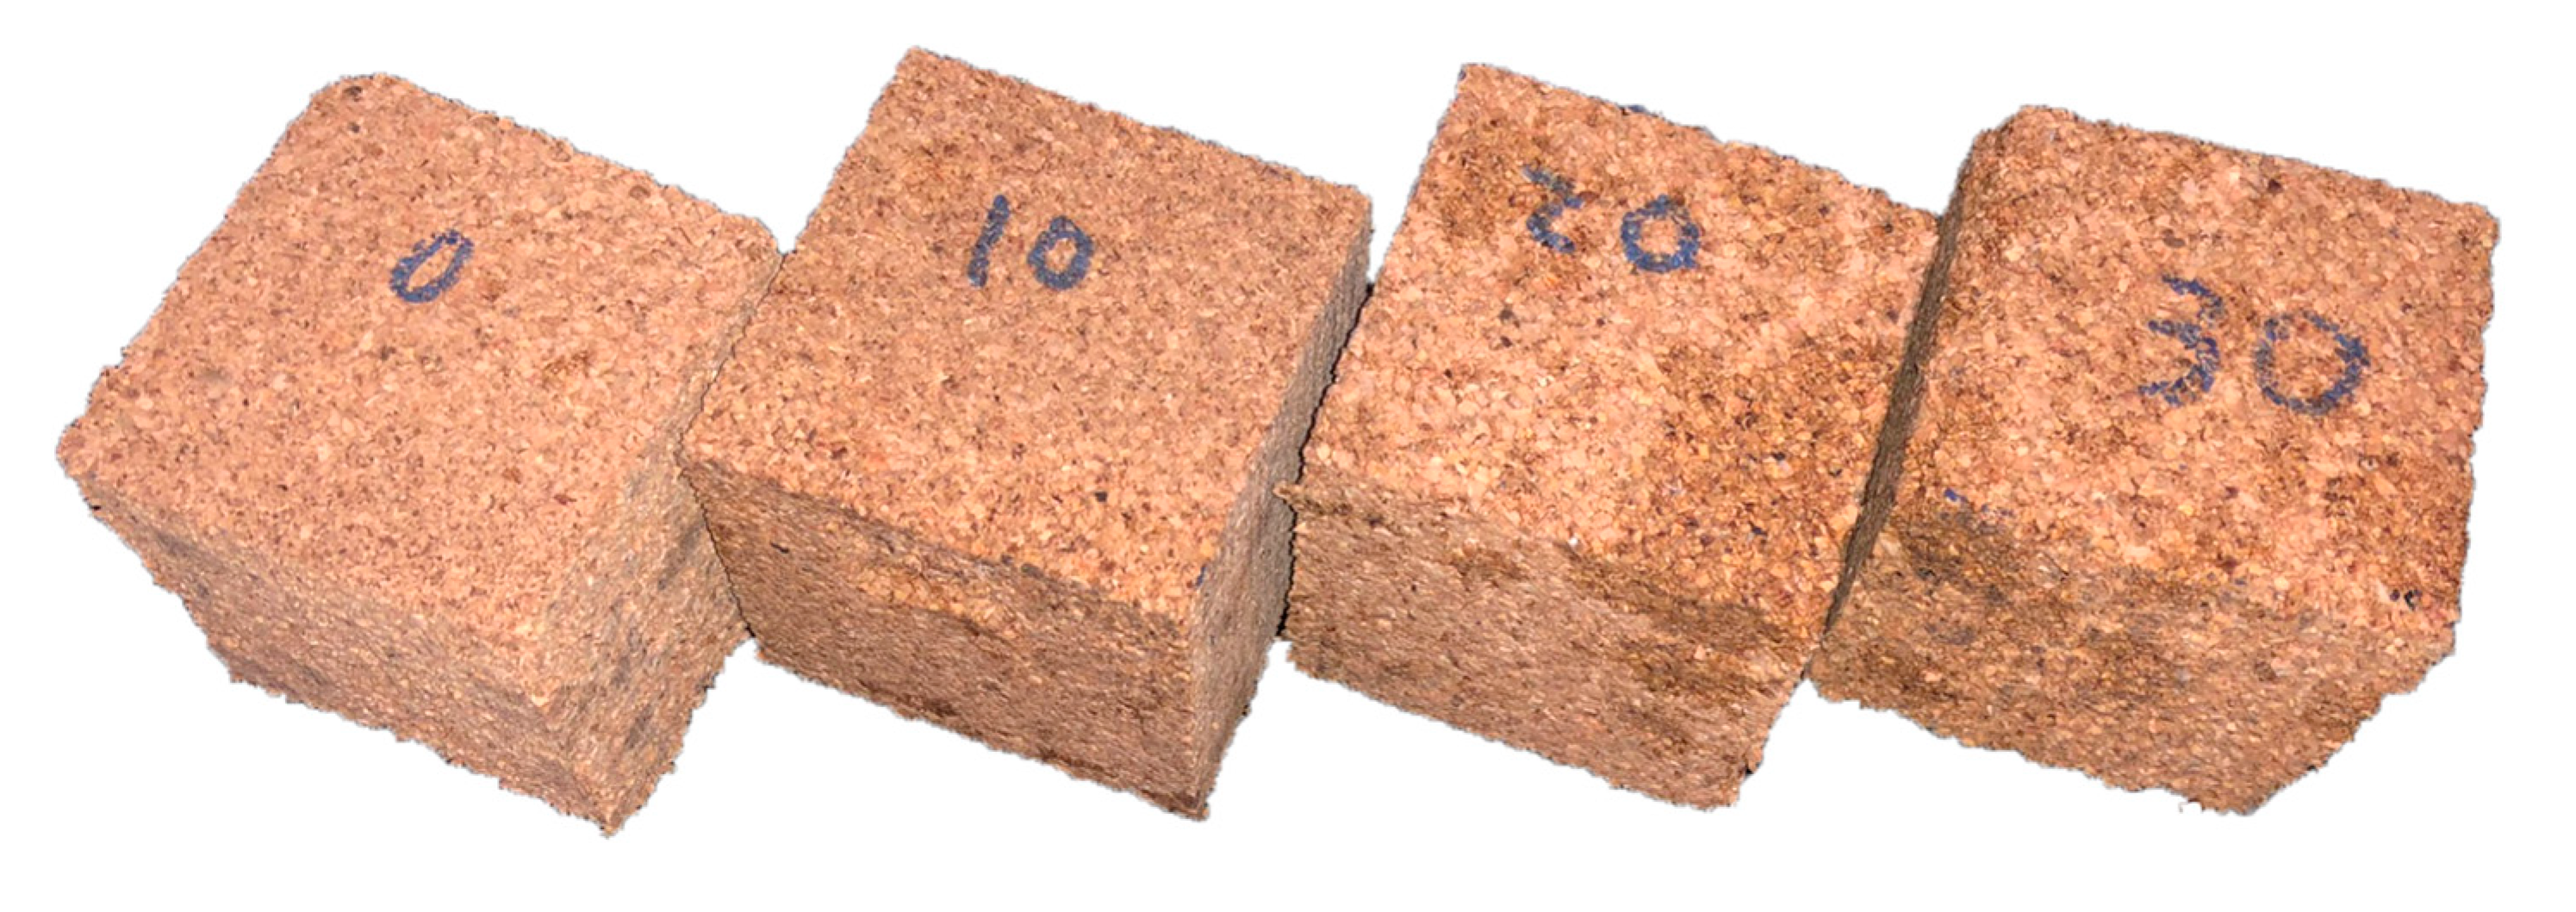
◦C in the oven. The mould was then removed from the oven, and once the mixture had cooled to room temperature, the cork samples were ready. The mixture was then split into six identical cubes, each measuring 50×50×50 millimetres (
Figure 6), to perform the tests reported in the next section. Such dimensions did not follow a specific standard. They were chosen to fit the house-made drop tower available for the impact tests and to ensure homogeneous properties given the grain size selected.
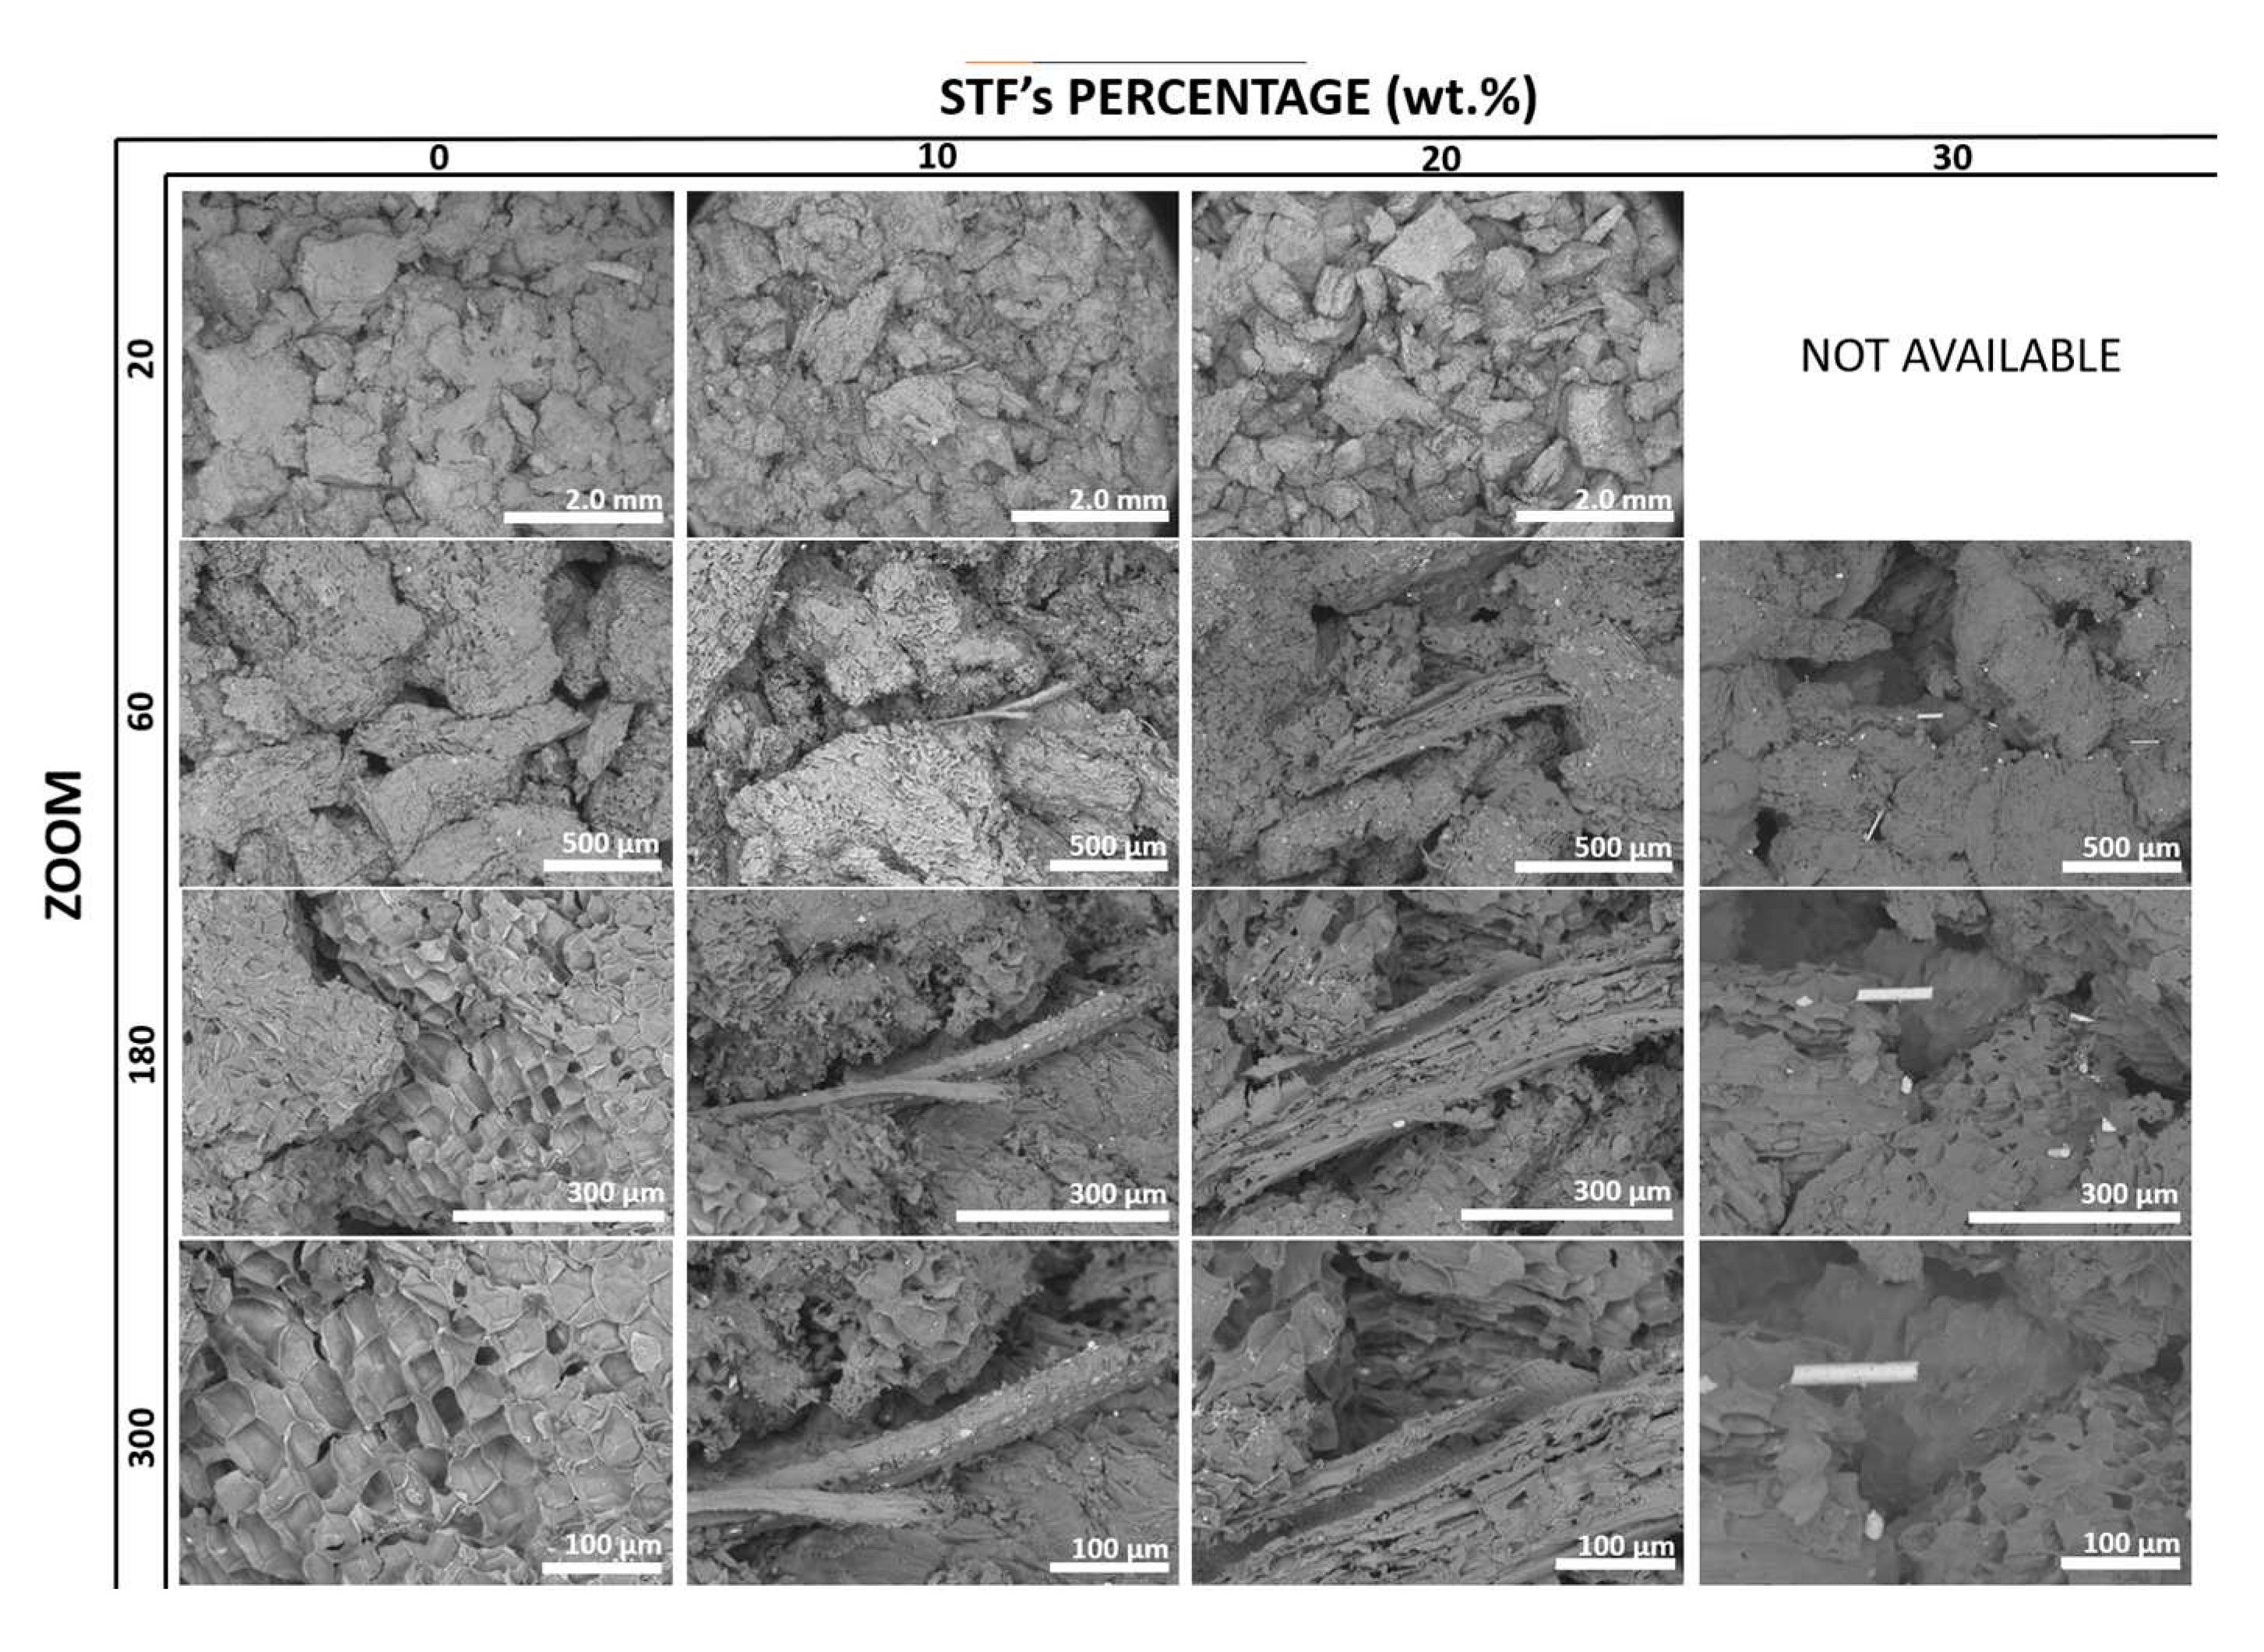
Figure 7 details the SEM images for several approximation factors showing the mixtures of cork grain and STF.
3. Experimental testing
3.1. Dynamic Impact Tests
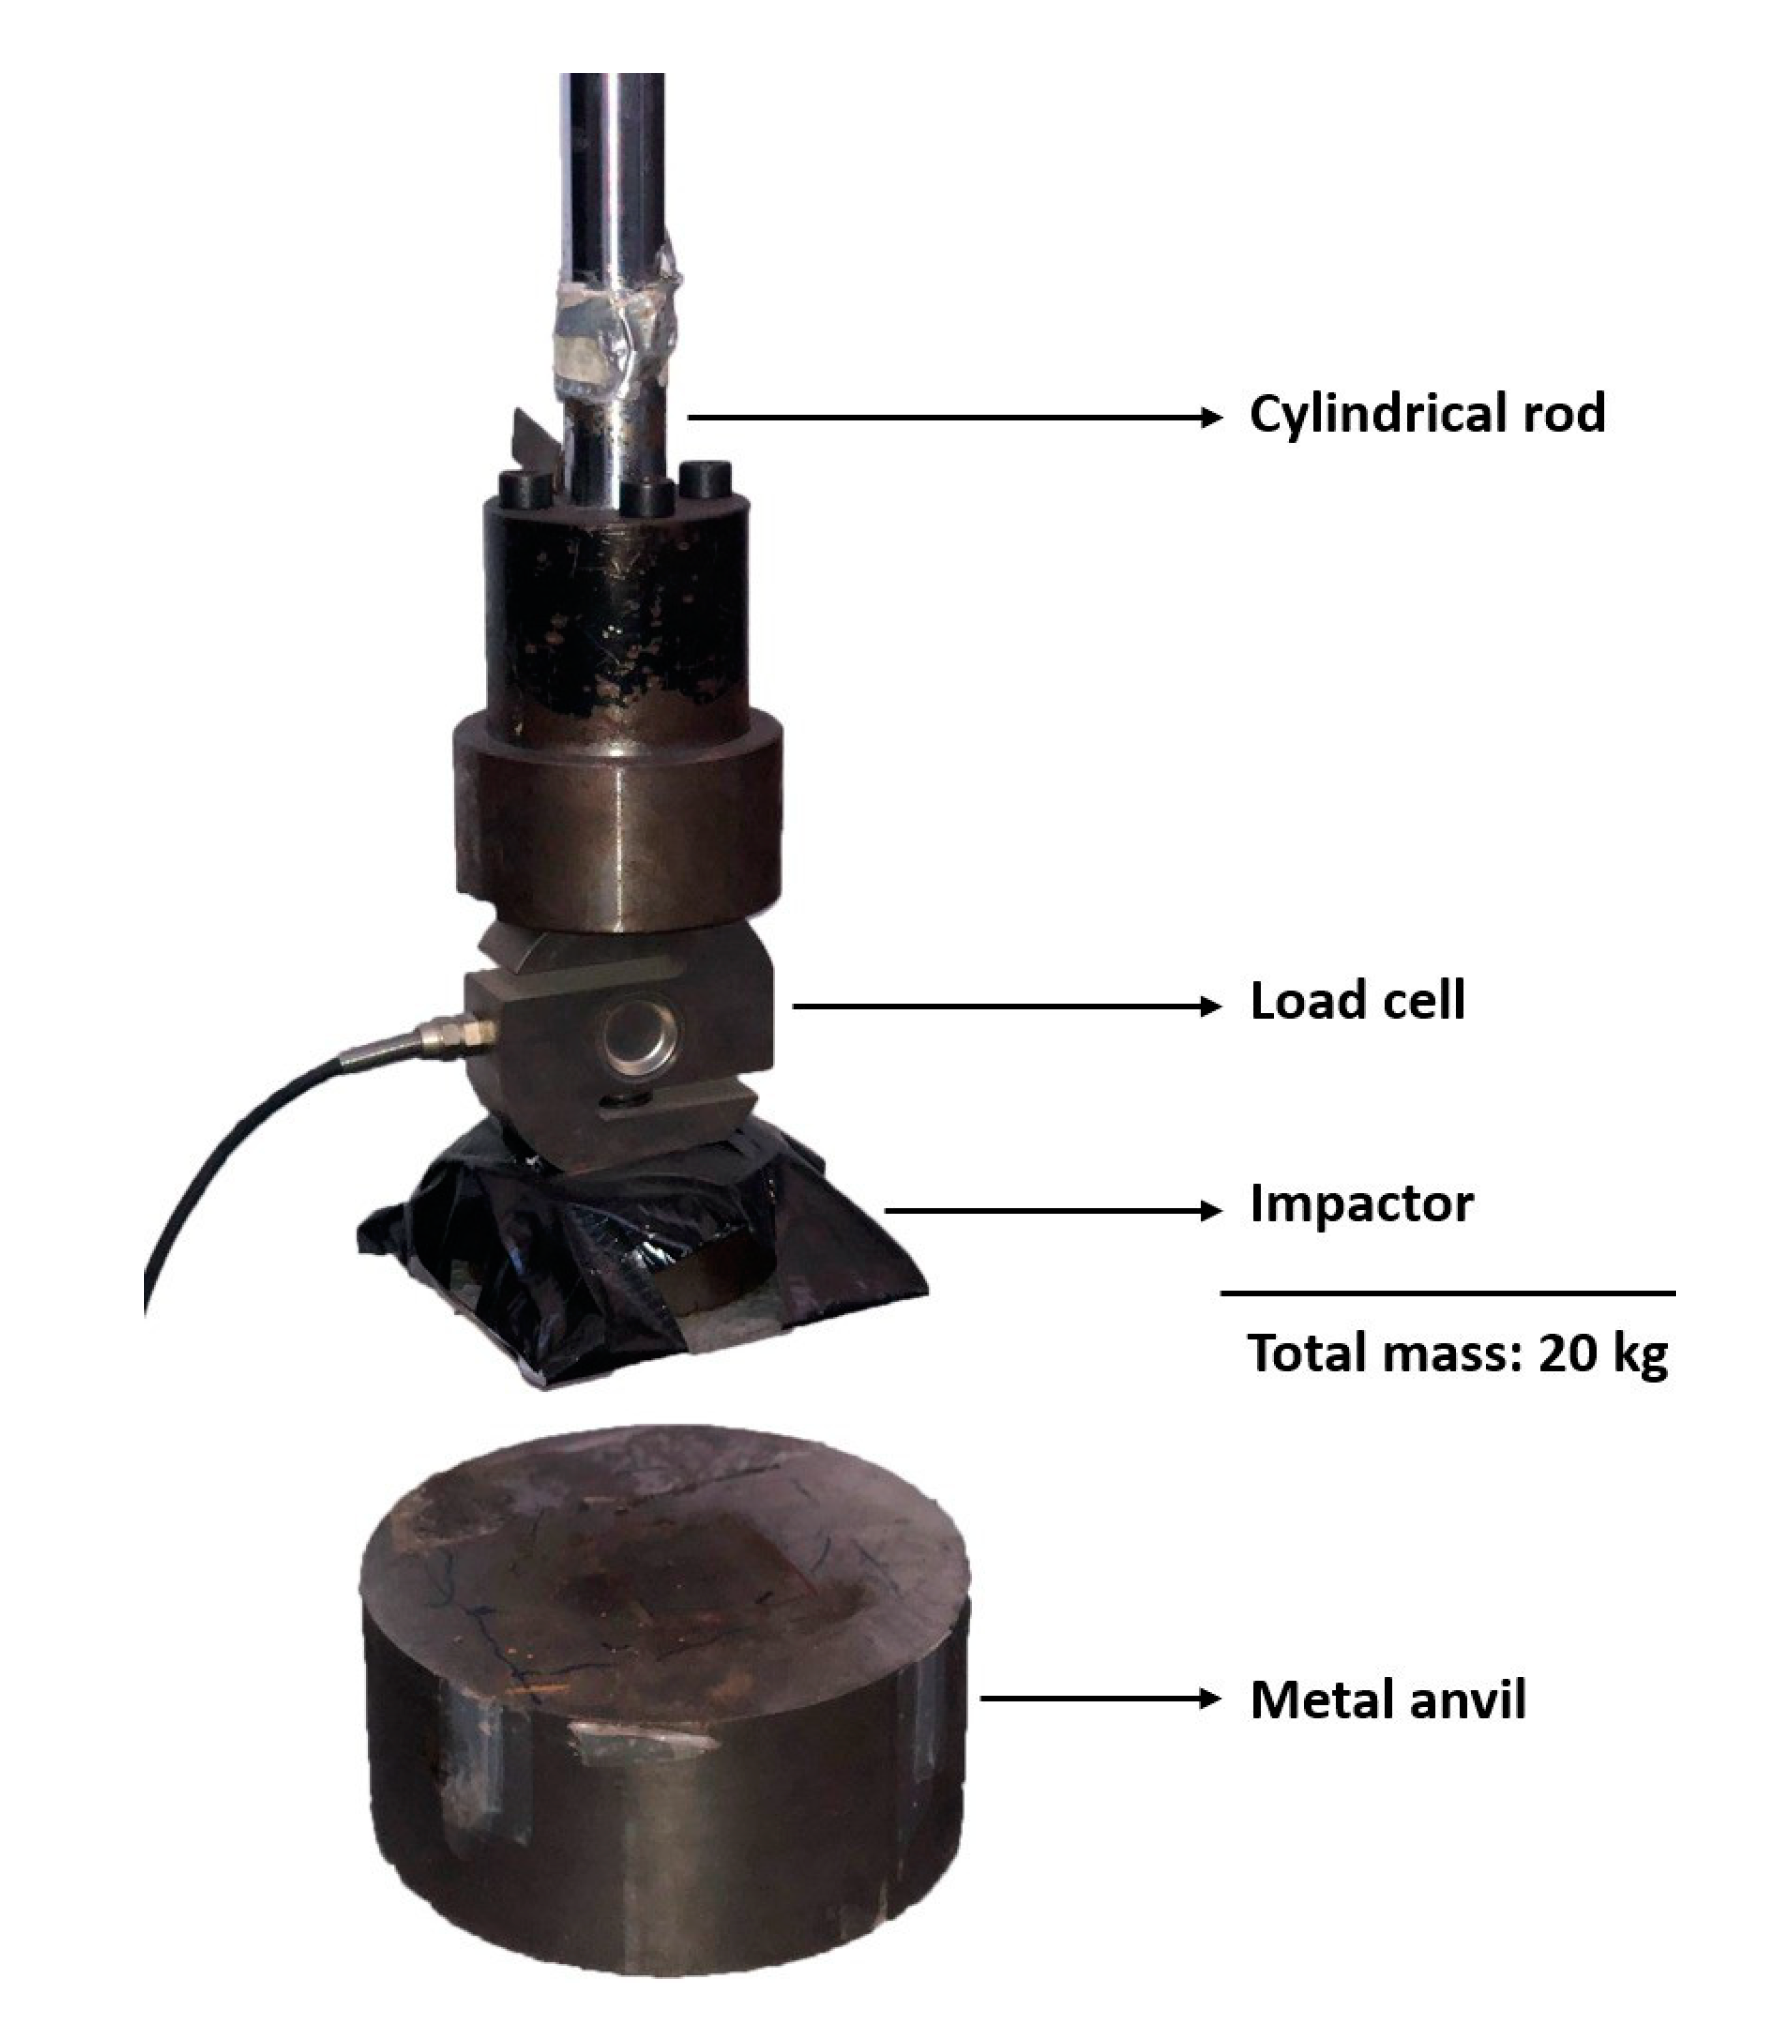
An in-house testing laboratory’s drop tower, as shown in
Figure 8, was employed to conduct the tests to assess the crashworthiness and dynamic mechanical behaviour of cork + STF samples.
The impactor, made of stainless steel, the load cell, and the cylindrical rod, which in total weighs 20kg, are depicted in
Figure 8. The samples were placed in the centre of the metal base, ensuring that all the energy was transferred to the sample. To ensure repeatability, three to five samples of each mixture were tested.
The vertical rod was positioned 510 mm from the sample to generate a potential energy of 100 J. The rod lowers freely and vertically as soon as it is released until it reaches the sample. The encoder records the system’s displacement throughout the fall, and the load cell measures the force of the impact. The NI Measurement & Automation Explorer software provides the values in conventional measurement units. Tests were conducted on several cubes of each sample to ensure repeatability.
3.2. Quasi-Static Tests
Uniaxial compression tests were performed to examine how brittle the materials behave, particularly regarding their compressive strength limit and any transverse and longitudinal expansion while the material is being tested.
A Shimadzu AGS-X 10 kN universal mechanical testing device was used for the experiments. The samples were positioned in the centre of the lower plate, and after the upper plate’s height was adjusted to fit each sample, they were pressed at a deformation rate of 1 mm/min, ensuring a quasi-static strain-rate.
A minimum of three specimens of each type were tested throughout dynamic impact testing and quasi-static tests. However, when repeatability could not be guaranteed, additional samples were evaluated.
4. Results
4.1. Impact Tests
In the following, the influence of the quantity of STF present in the samples will be determined by analysing the peak forces, the ratio between the first and second peak, the degradation of the cubes after multiple impacts, the acceleration peaks, the stress-strain curves, and their energy densities.
4.1.1. Peak Forces
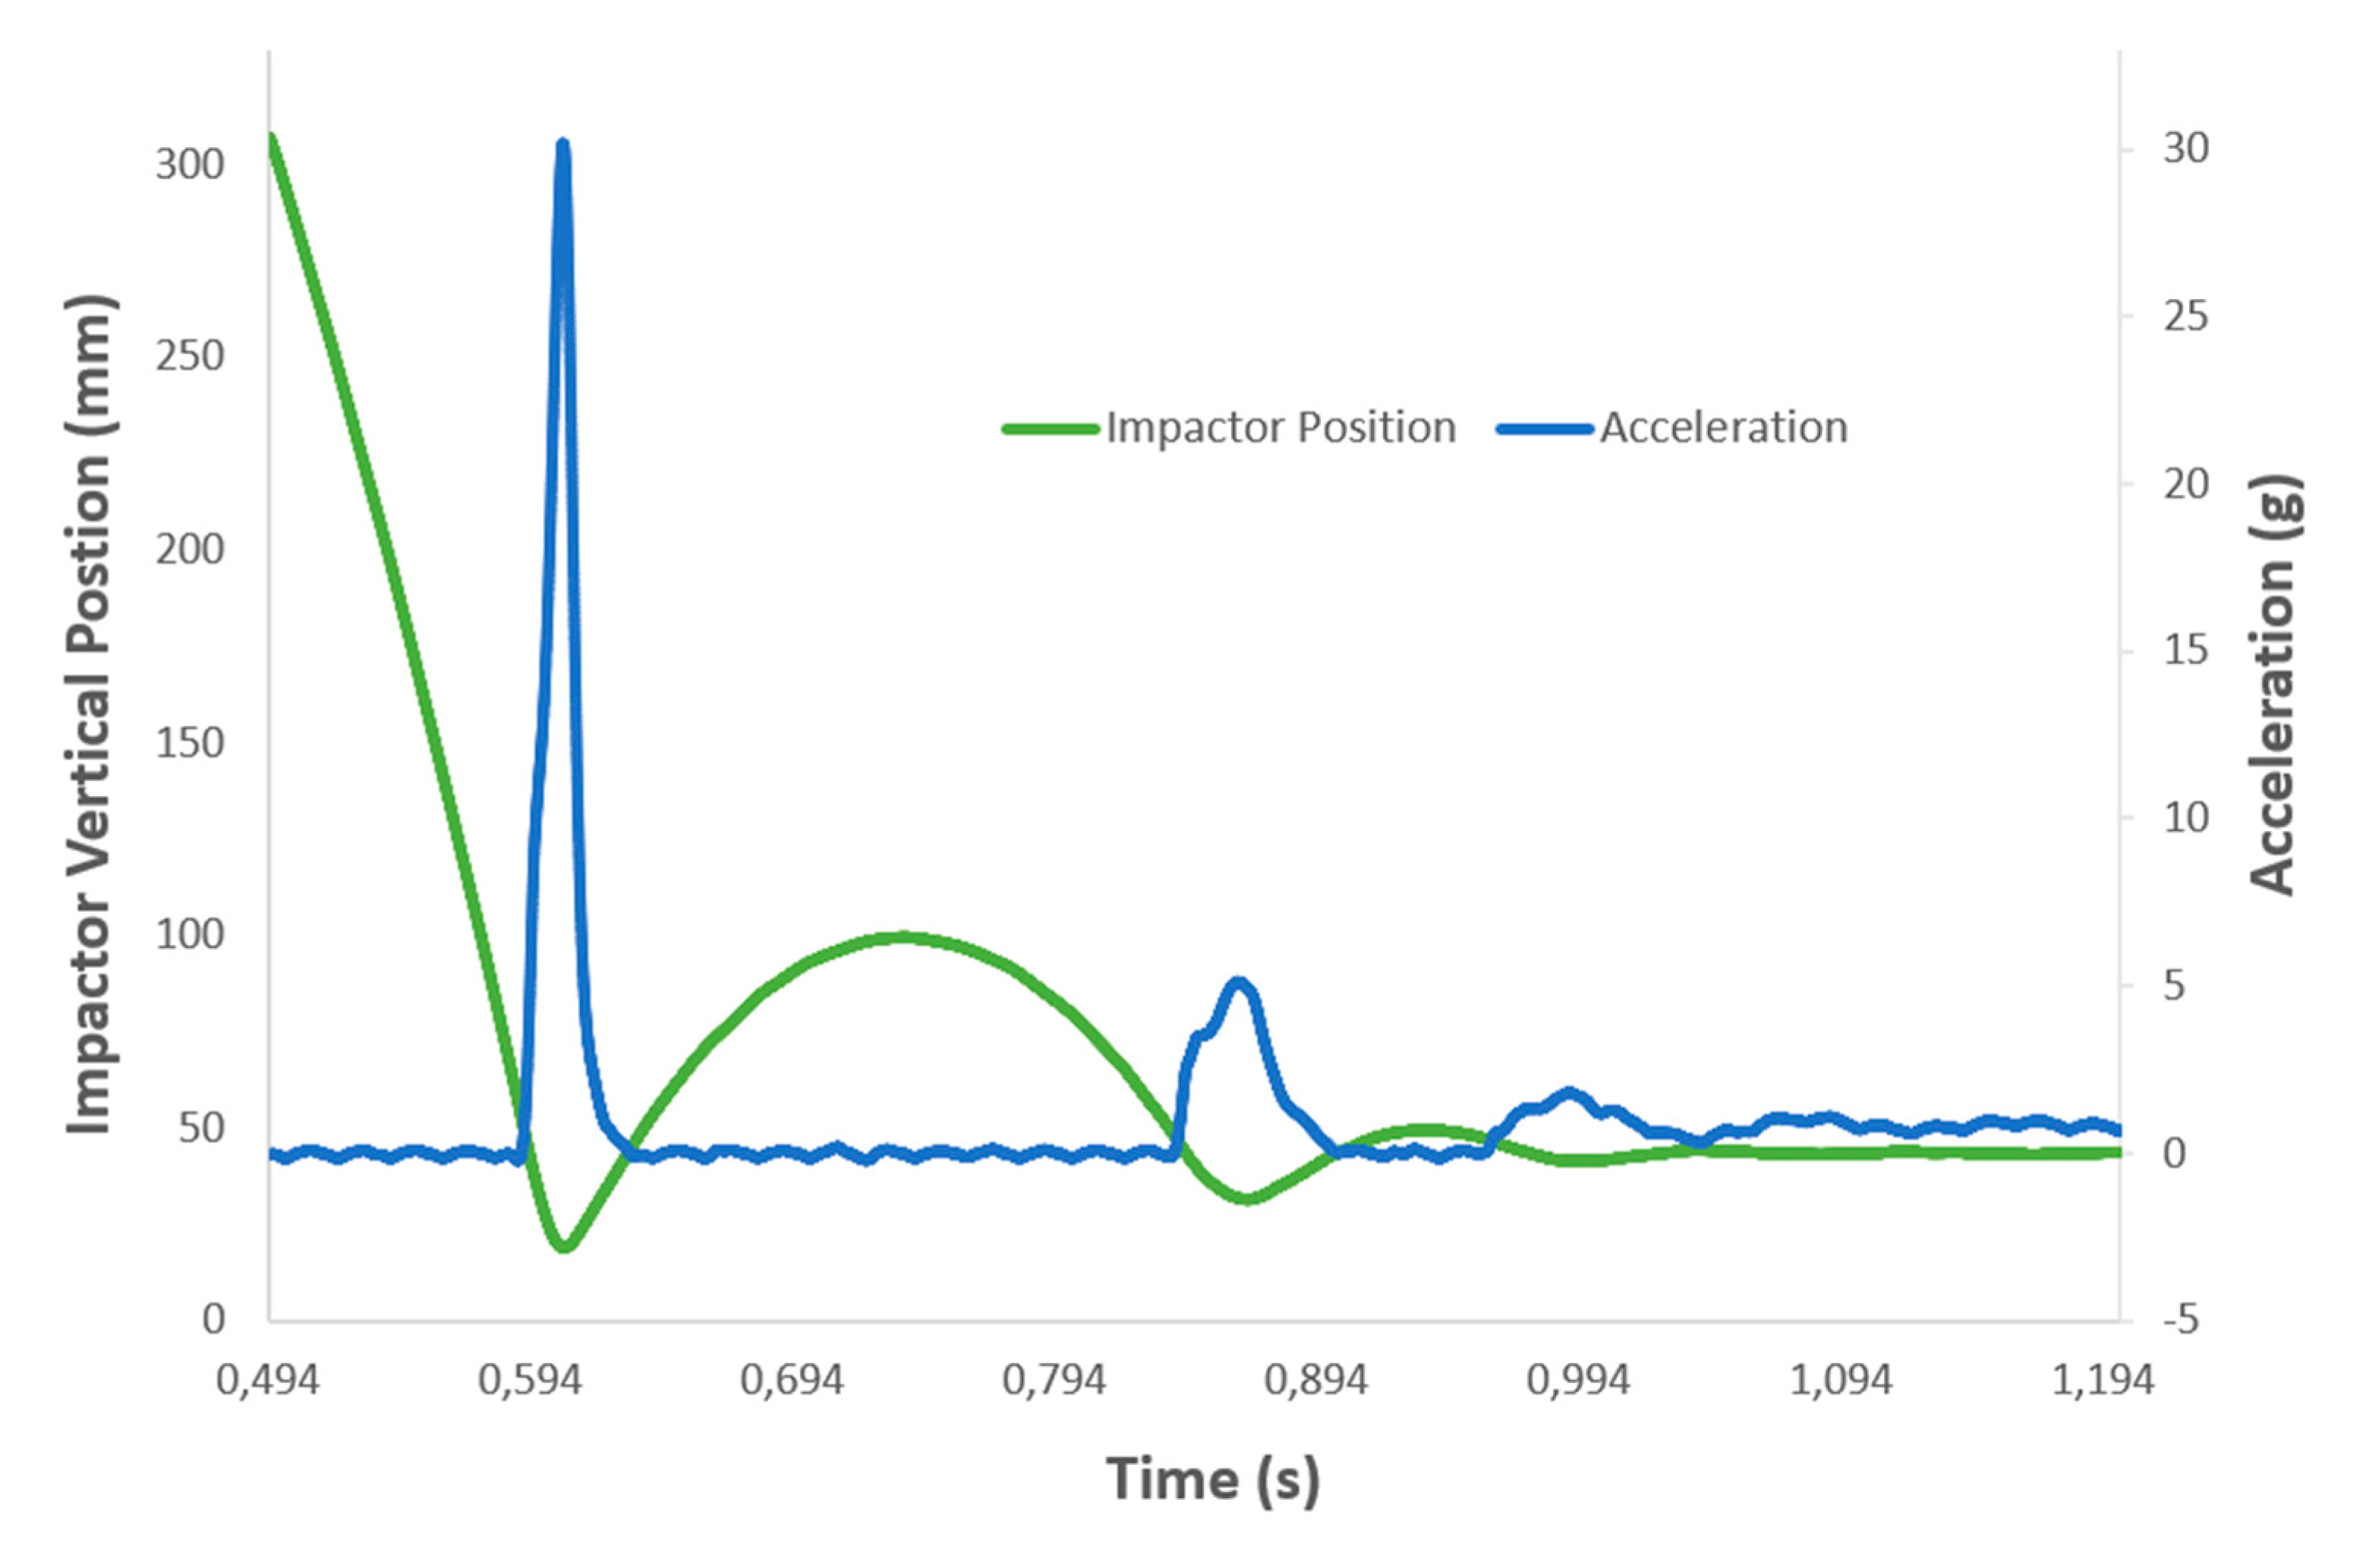
Figure 9 shows the typical output of a drop-test: it is possible to monitor forces, displacements and acceleration over time for a first impact, rebounding phase and second impact. With the force values and knowing the samples cross-section, one can calculate the stresses; from displacements, and knowing the samples initial height, one can calculate the strains. The raw data from the experiments is provided as supplementary material.
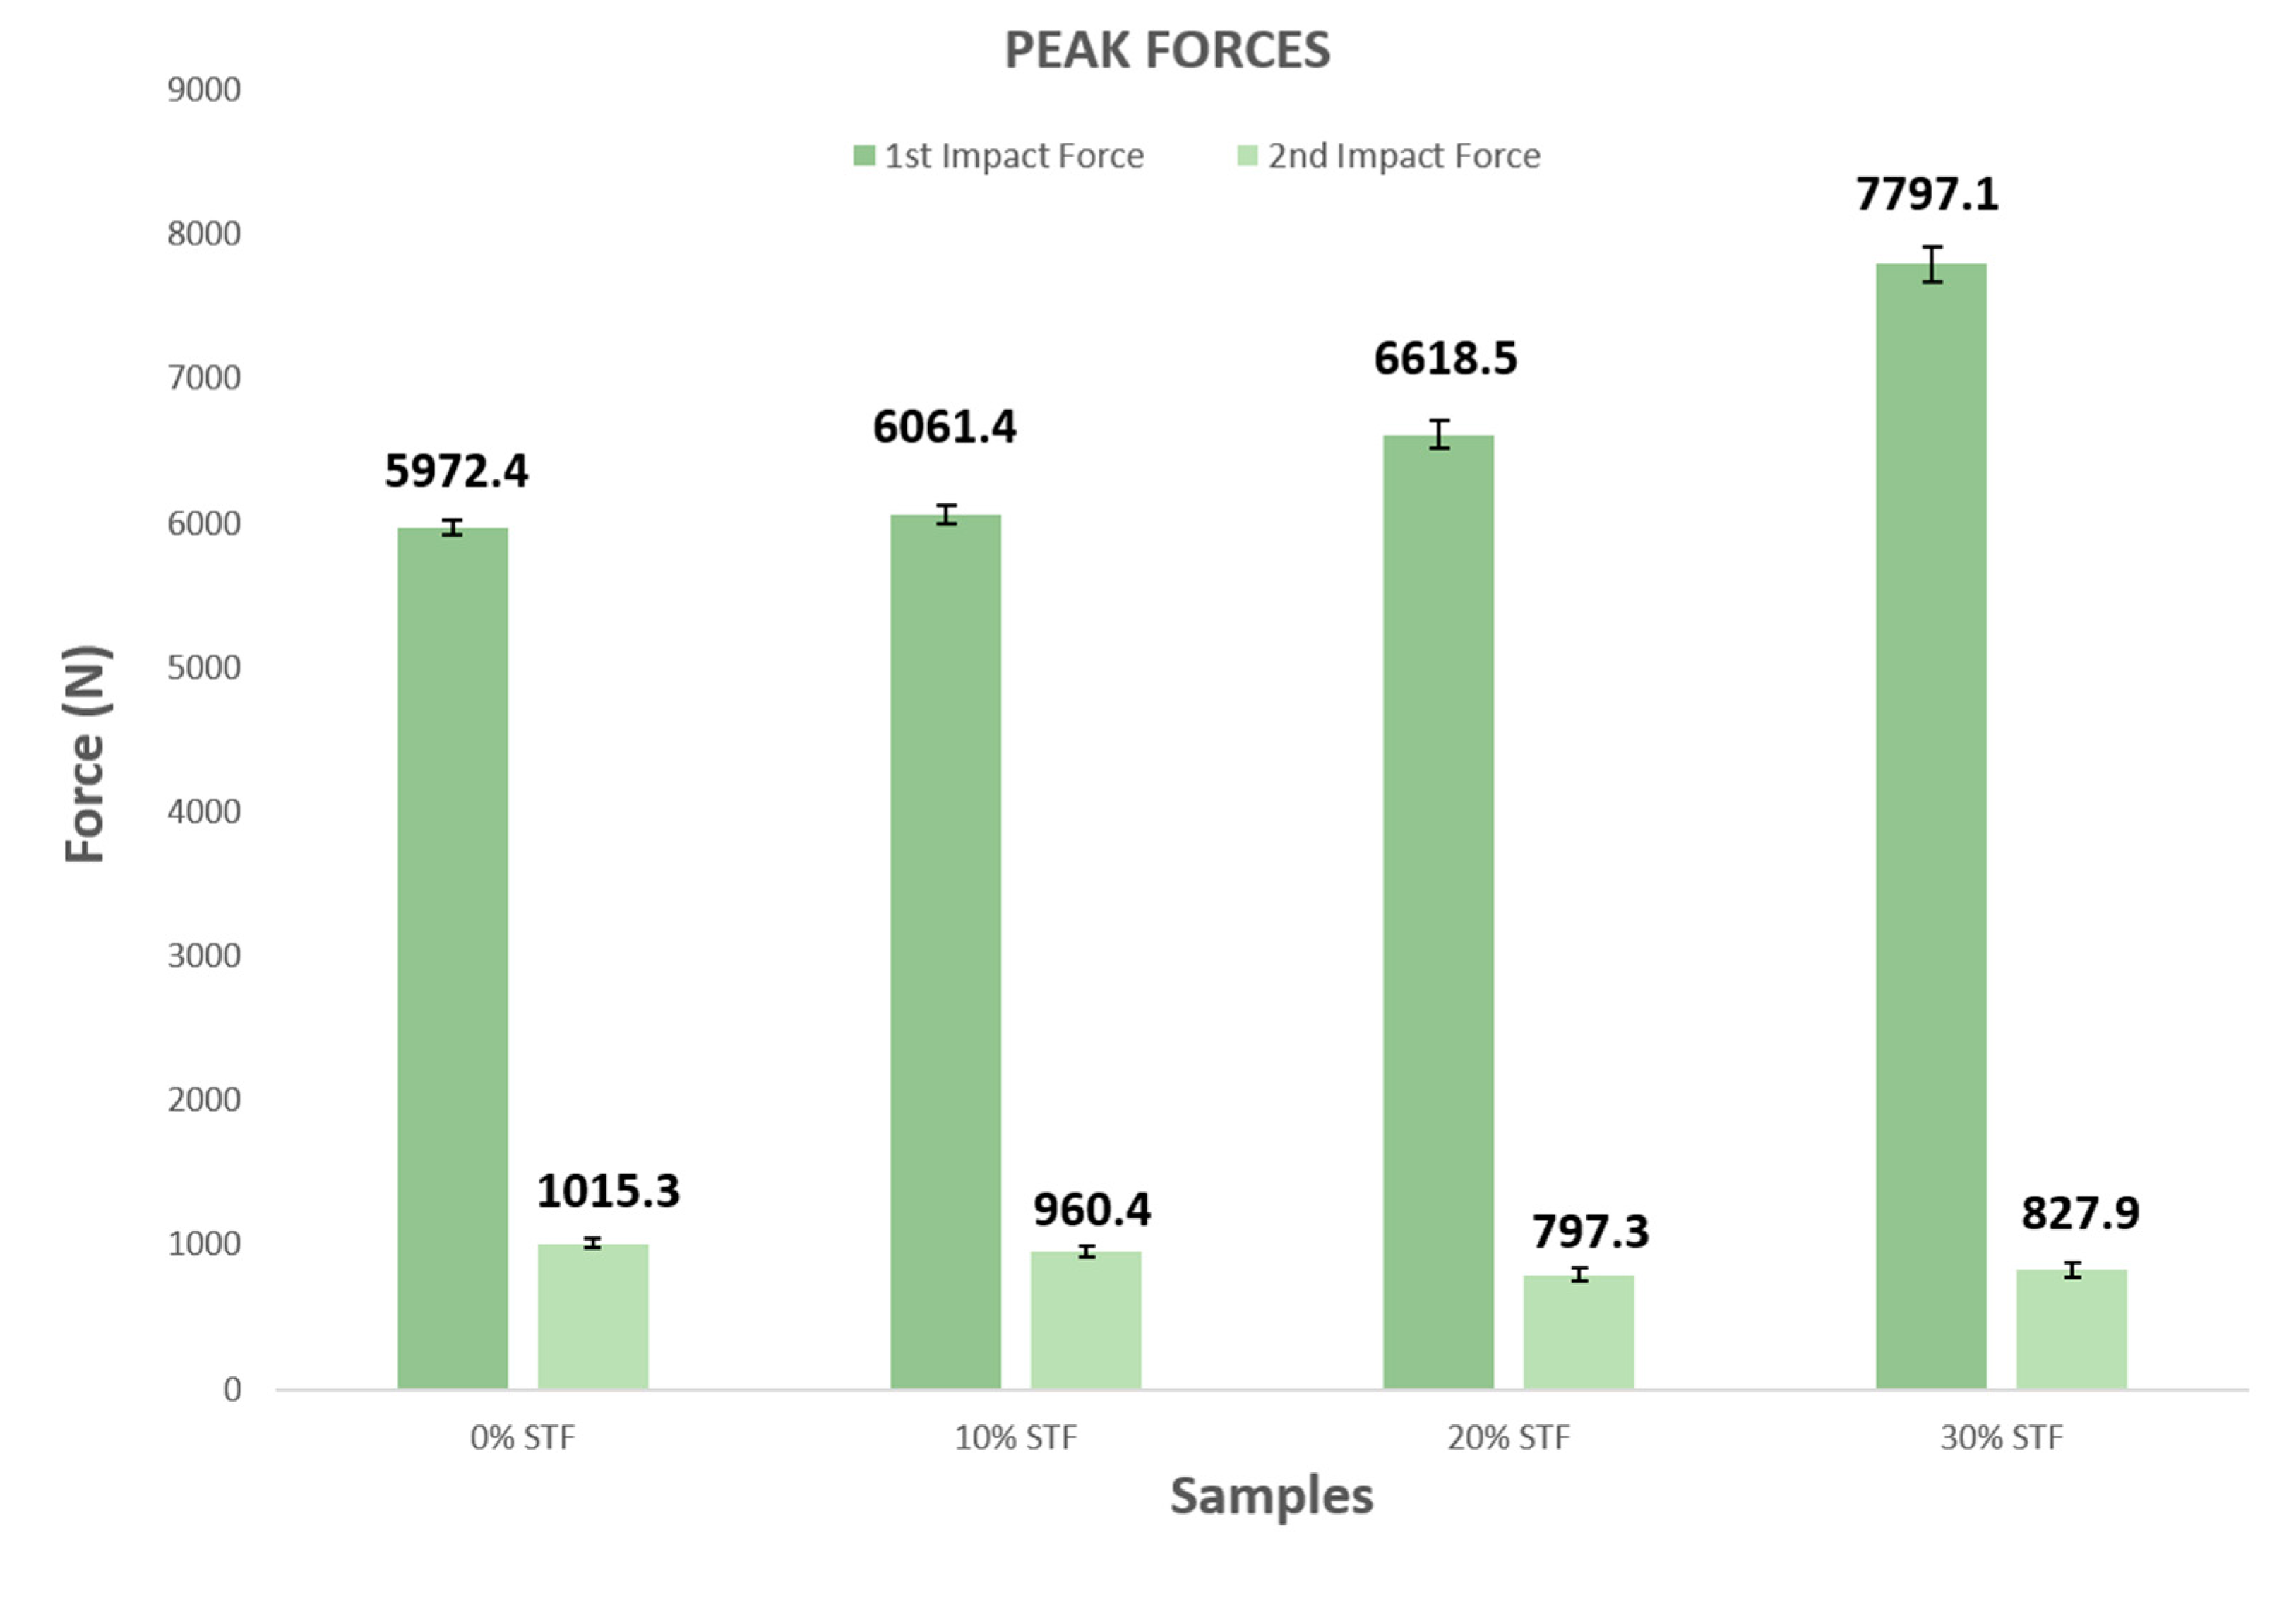
Figure 10 shows the first two peaks of each sample's force upon impact, corresponding to the first direct hit followed by a rebound and a second hit. Starting by comparing the sample without STF with the others, it can be observed that it performs well because it presents a lower force value on the first peak; this translates into good energy absorption, which is expected of a sample composed entirely of cork.
From the analysis of
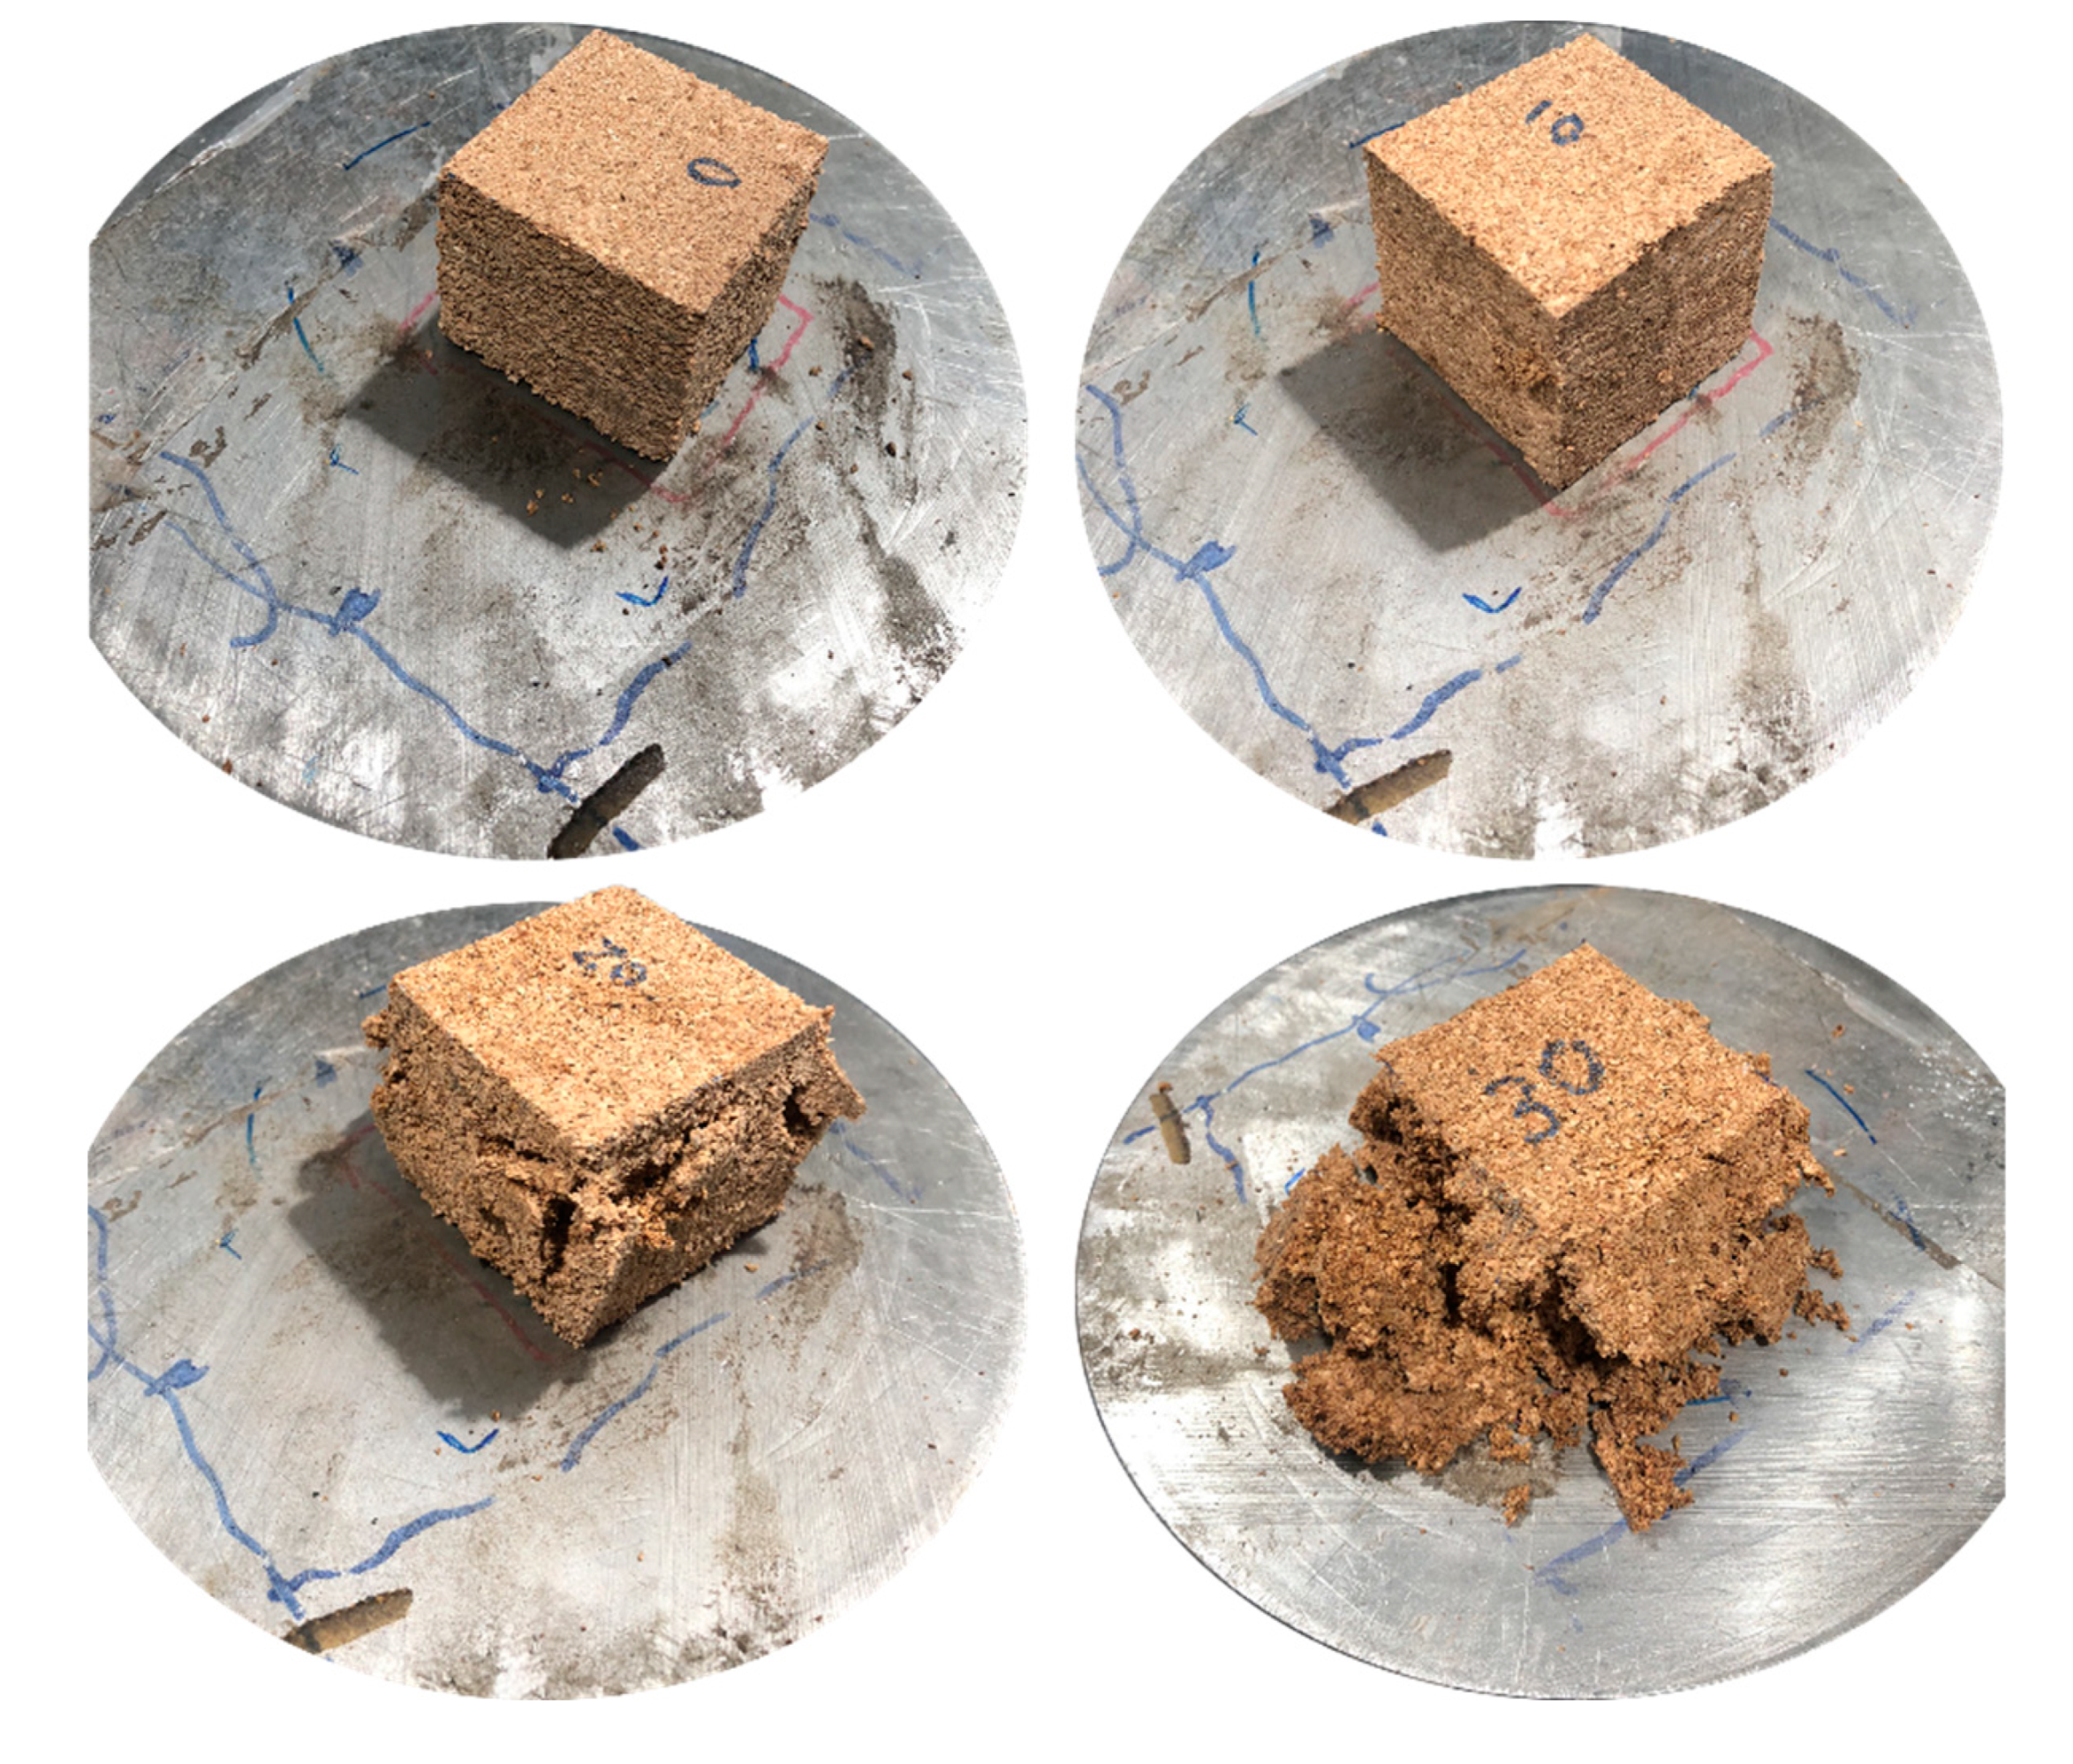
Figure 10, it is also possible to notice that as the amount of STF present in the samples increases, consequently, the value of the first force peak also amplifies, in a relationship that appears to be exponential. On the other hand, as the percentage of STF increases, the value of the second force peak tends to decrease. This behaviour translates into a more significant amount of dissipated energy as the percentage of STF increases, which is explained by the cracking that occurs in the samples, as seen in
Figure 11 and more evident as the wt.% of STF increases.
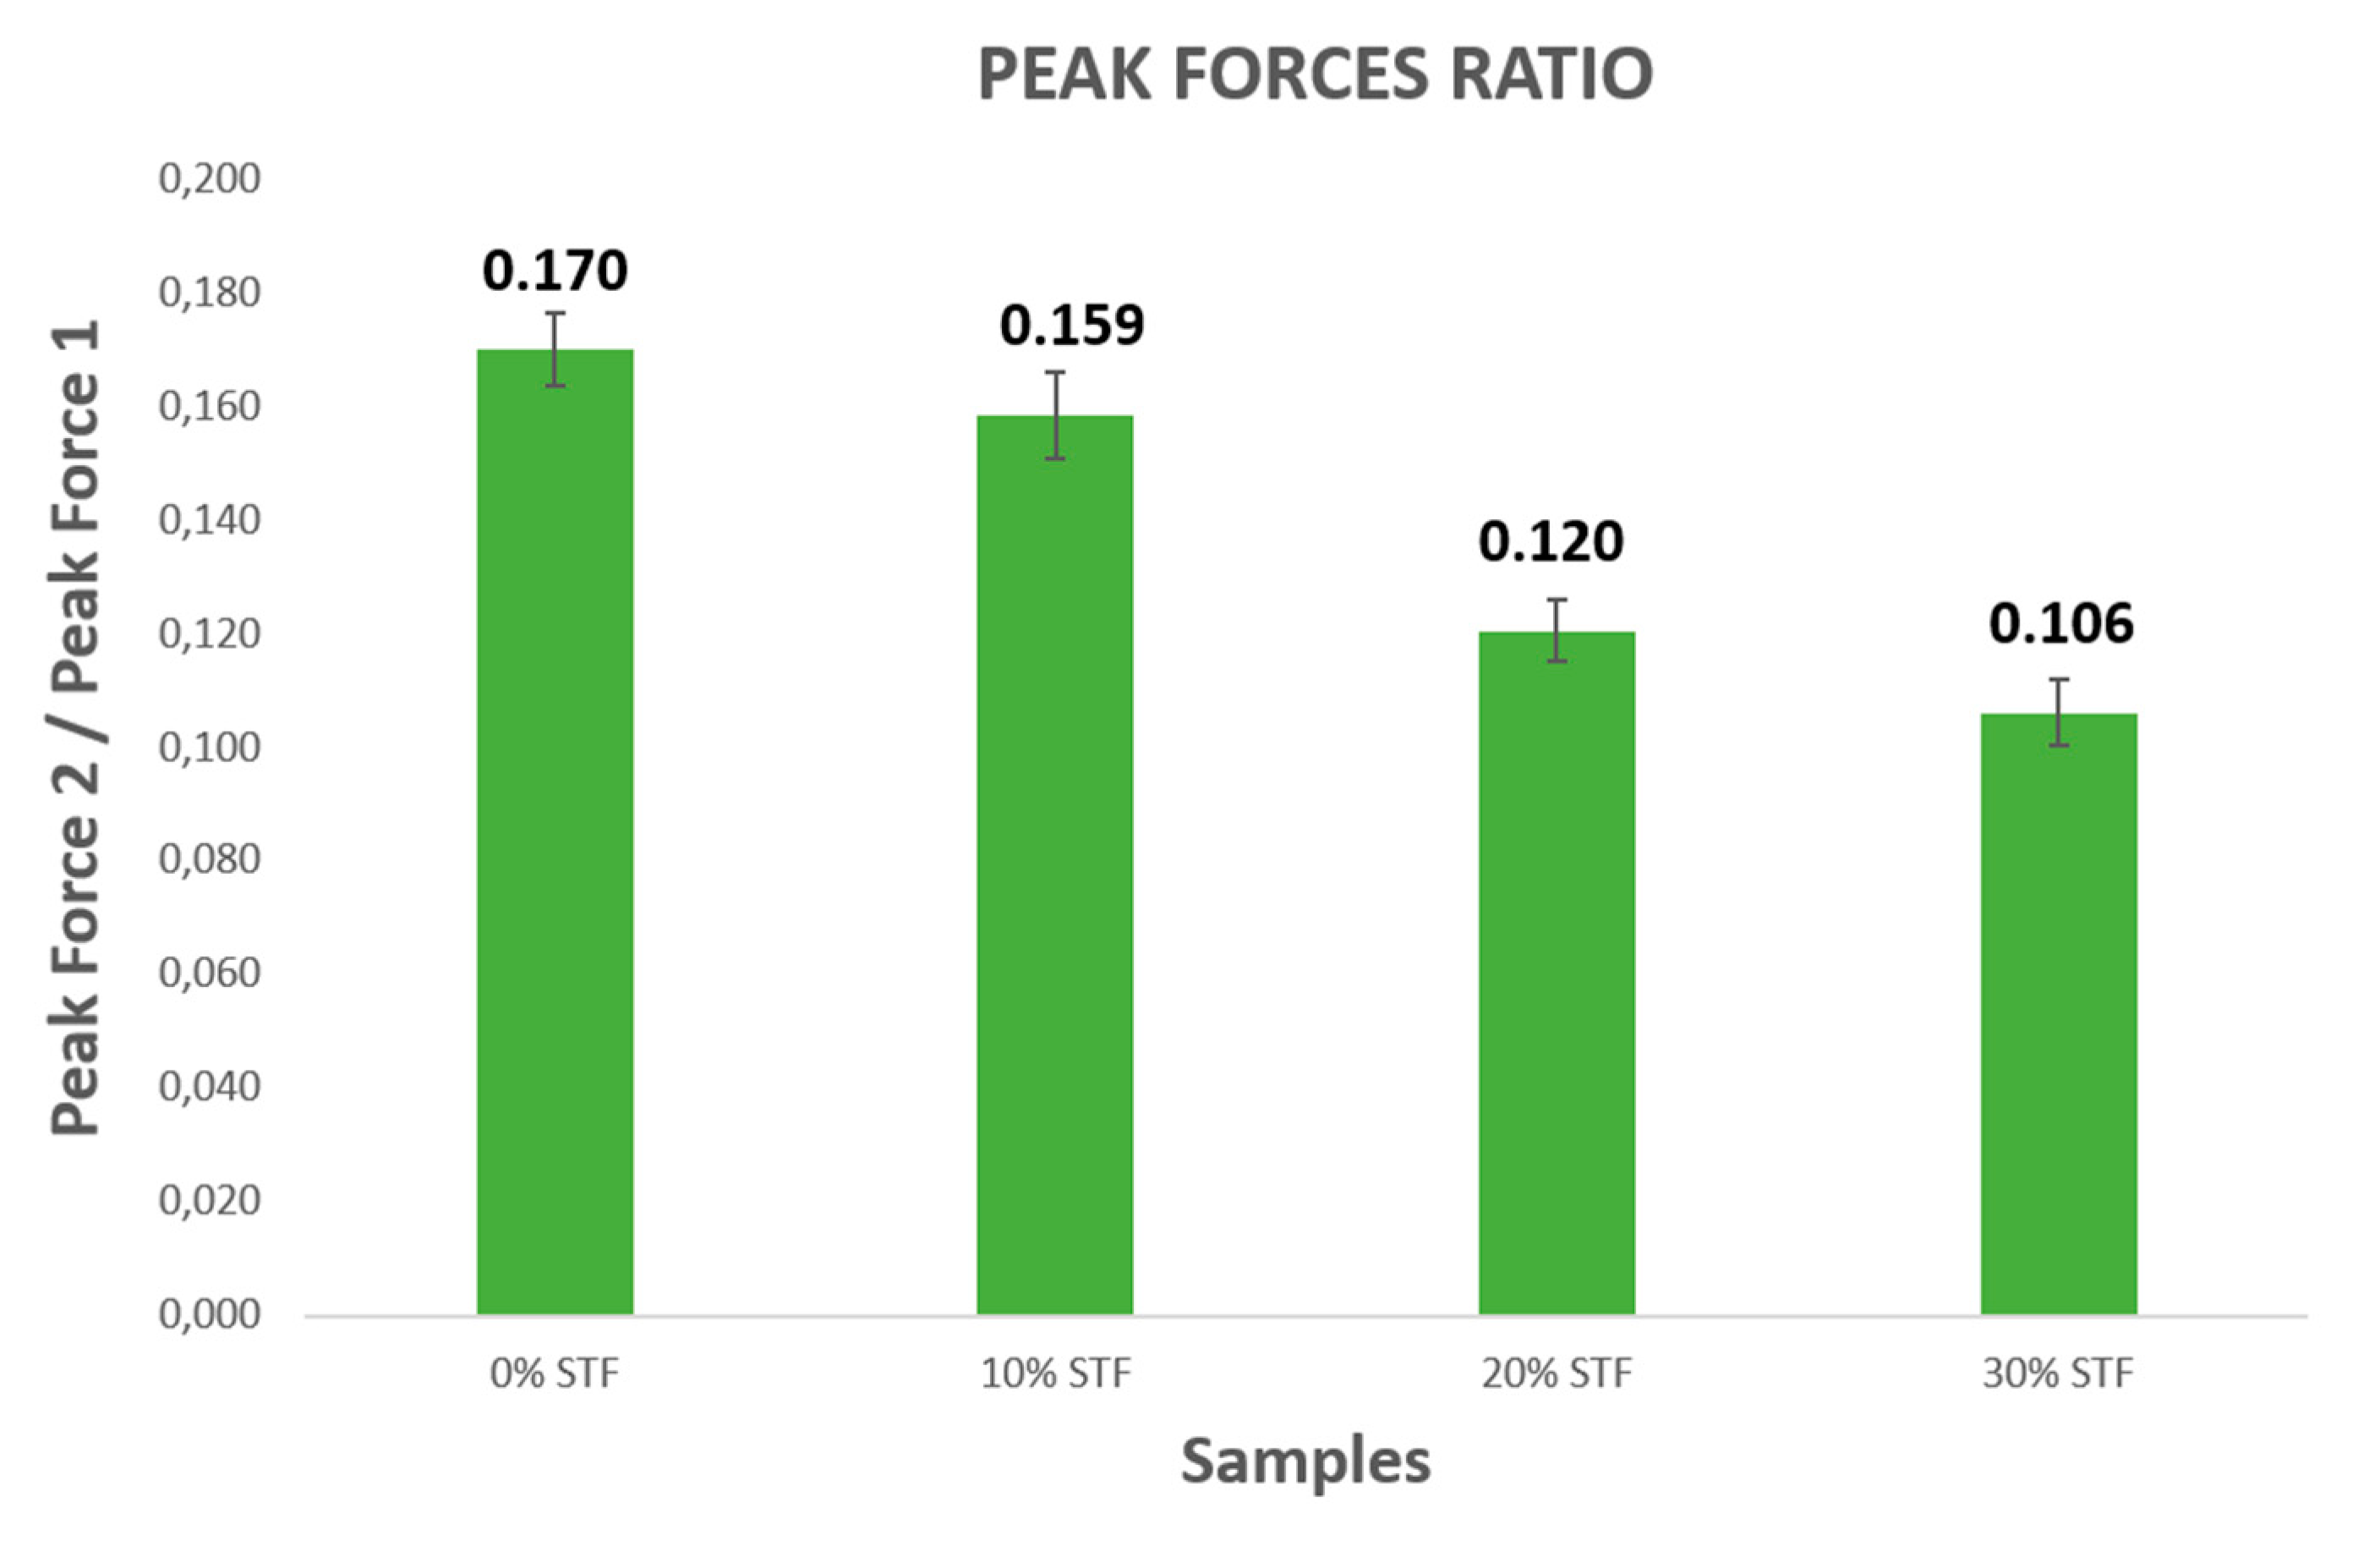
Figure 12 shows the values of the ratio between the second and the first force peaks of the samples analysed. In this case, the best samples integrate 20 wt.% and 30 wt.% of STF since they present relations with the lowest value. The ideal sample will show the most significant discrepancy between the values of the first and second force peaks. This indicates they can dissipate more energy from the first to the second impact, showing better crashworthiness properties.
4.1.2. Peak Acceleration
Similarly, observing
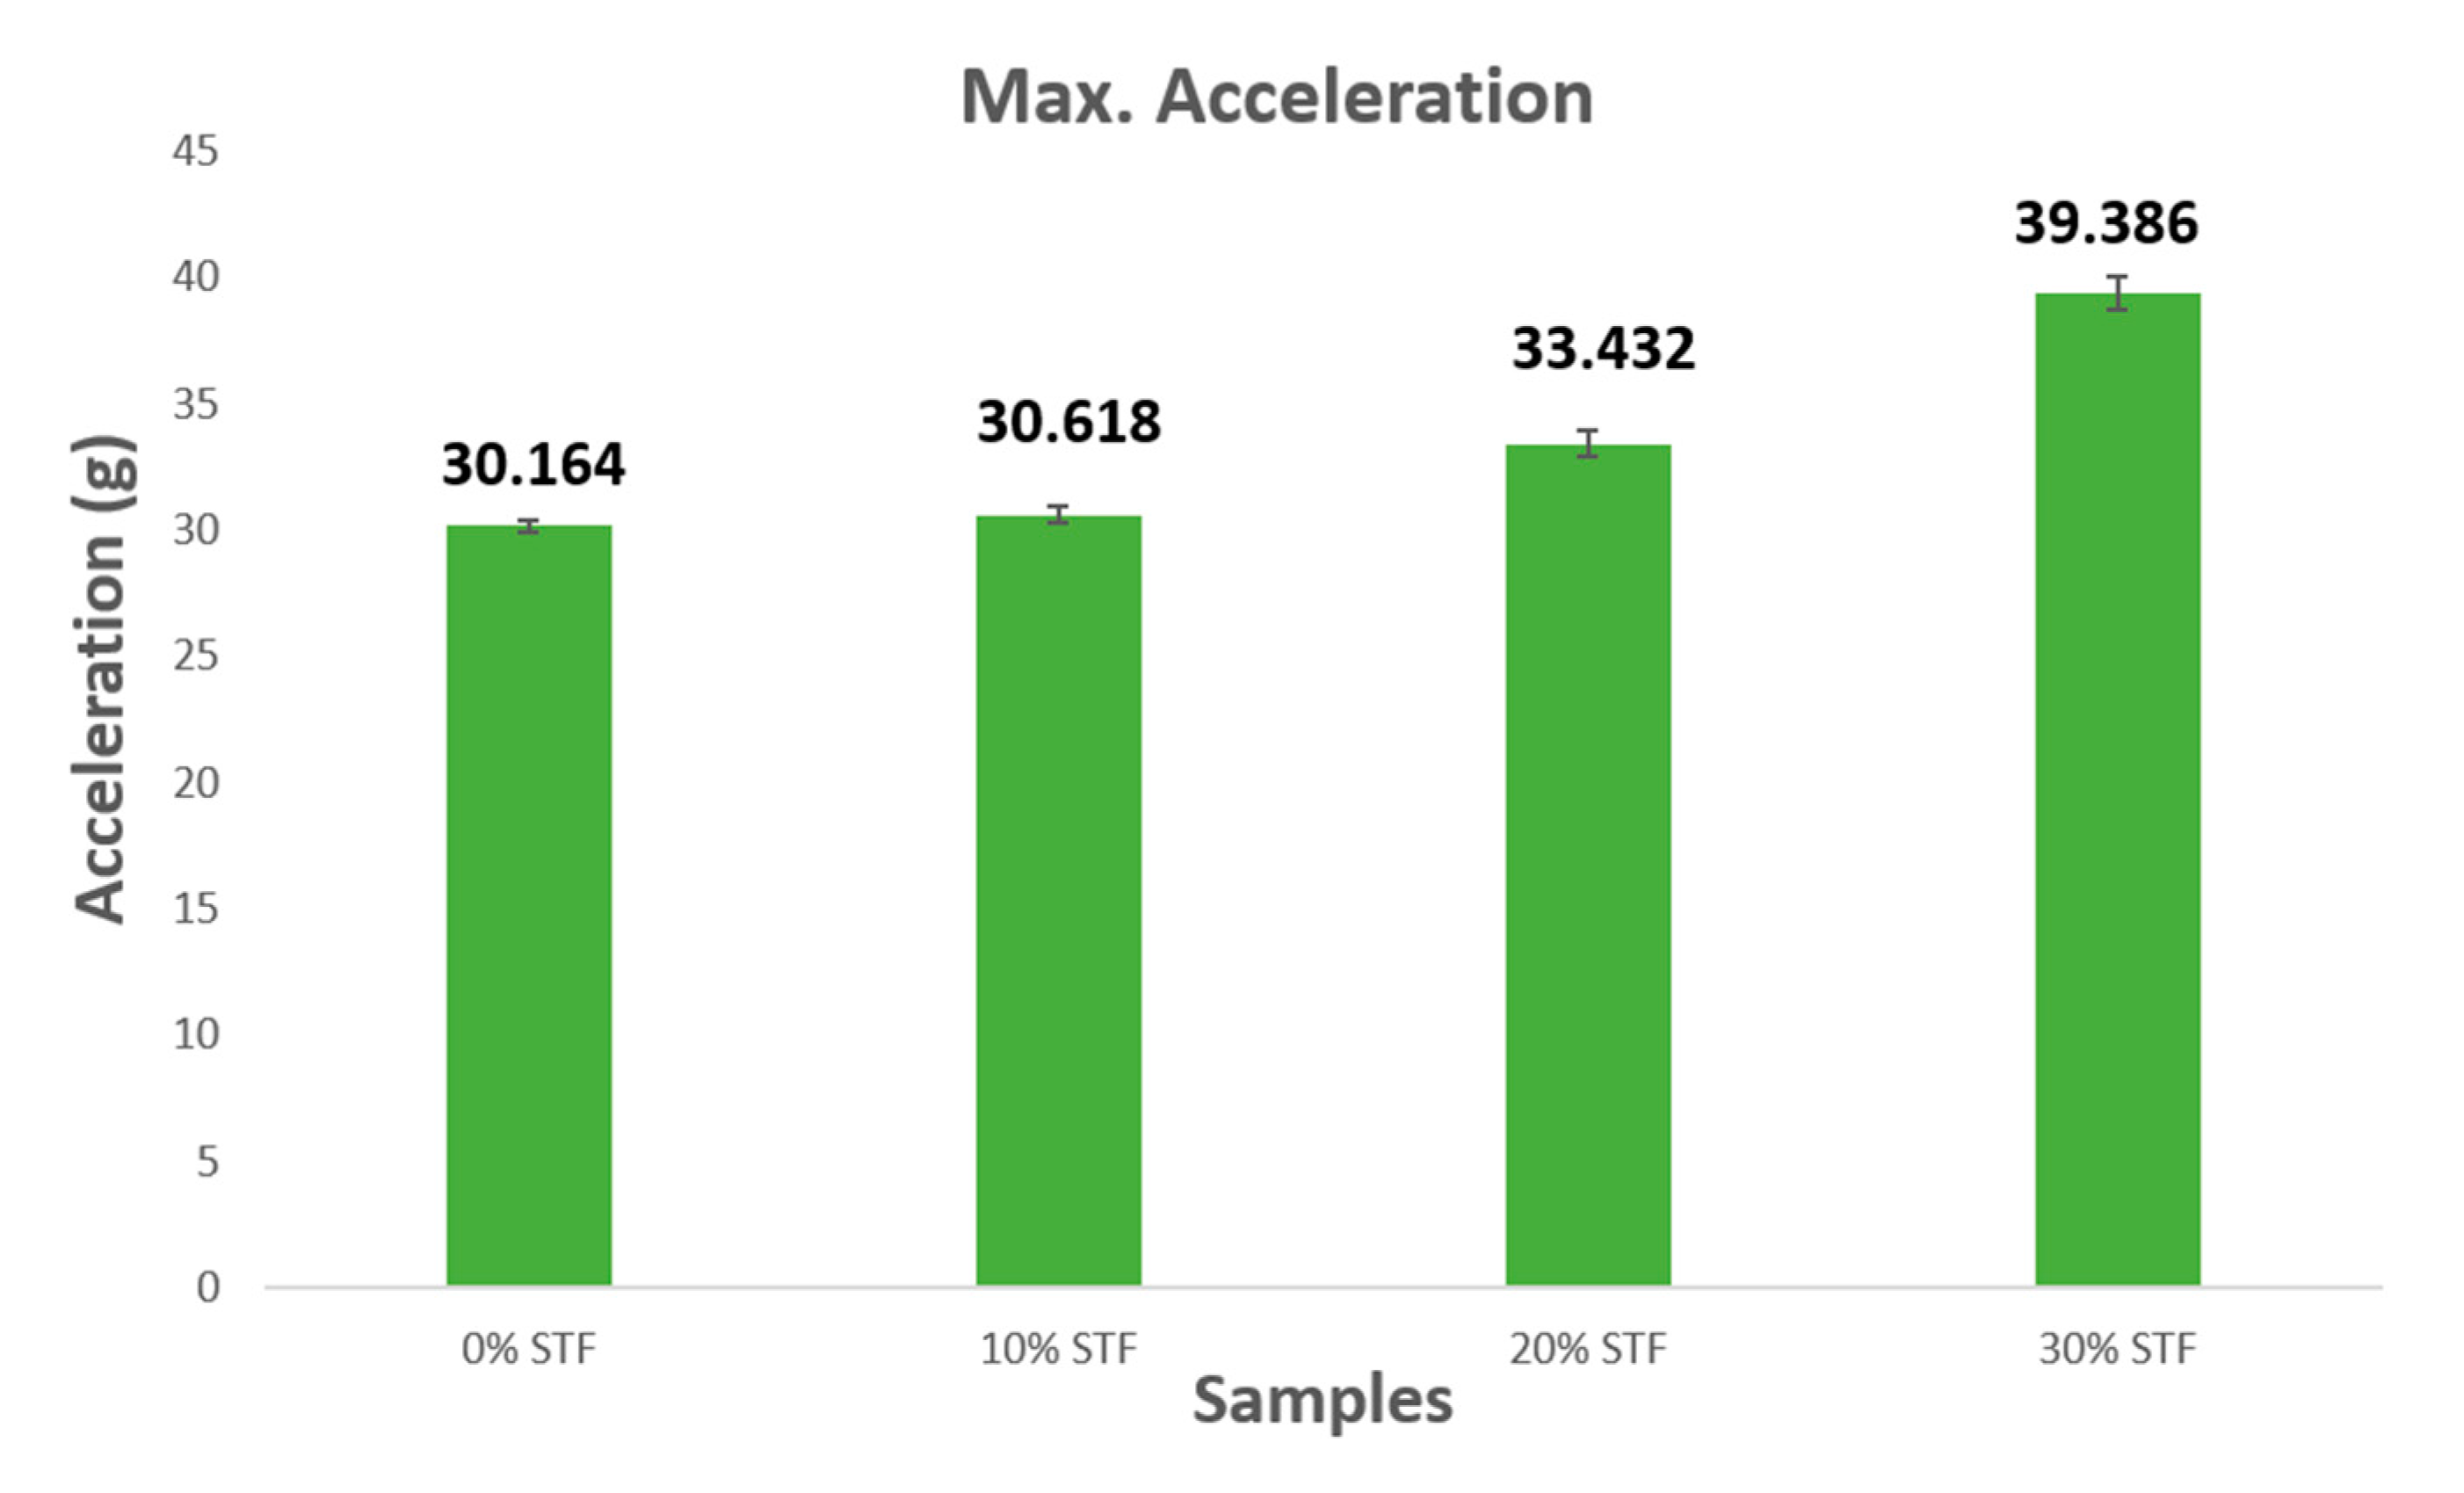
Figure 13, the first sample consisting entirely of cork presents the lowest value of acceleration in comparison with the other STF-enhanced samples. Again, this can be justified by its optimum shock absorption. Regarding the remaining samples, it is plausible to state that as the amount of cork decreases, the acceleration peaks rise, which is linked to the presence of STF. Observing the maximum acceleration values in
Figure 13, relative to the specimen without STF, a slight increase of 1.51% is noted in the sample with 10 wt.% STF, a rise of 10.84% in the specimen with 20 wt.% STF and an increment of 30.57% in the 30 wt.% STF. This predisposition to increase can be explained by the nature of the shear-thickening fluid, which becomes stiff upon impact loading.
4.1.3. Absorbed Energy Densities
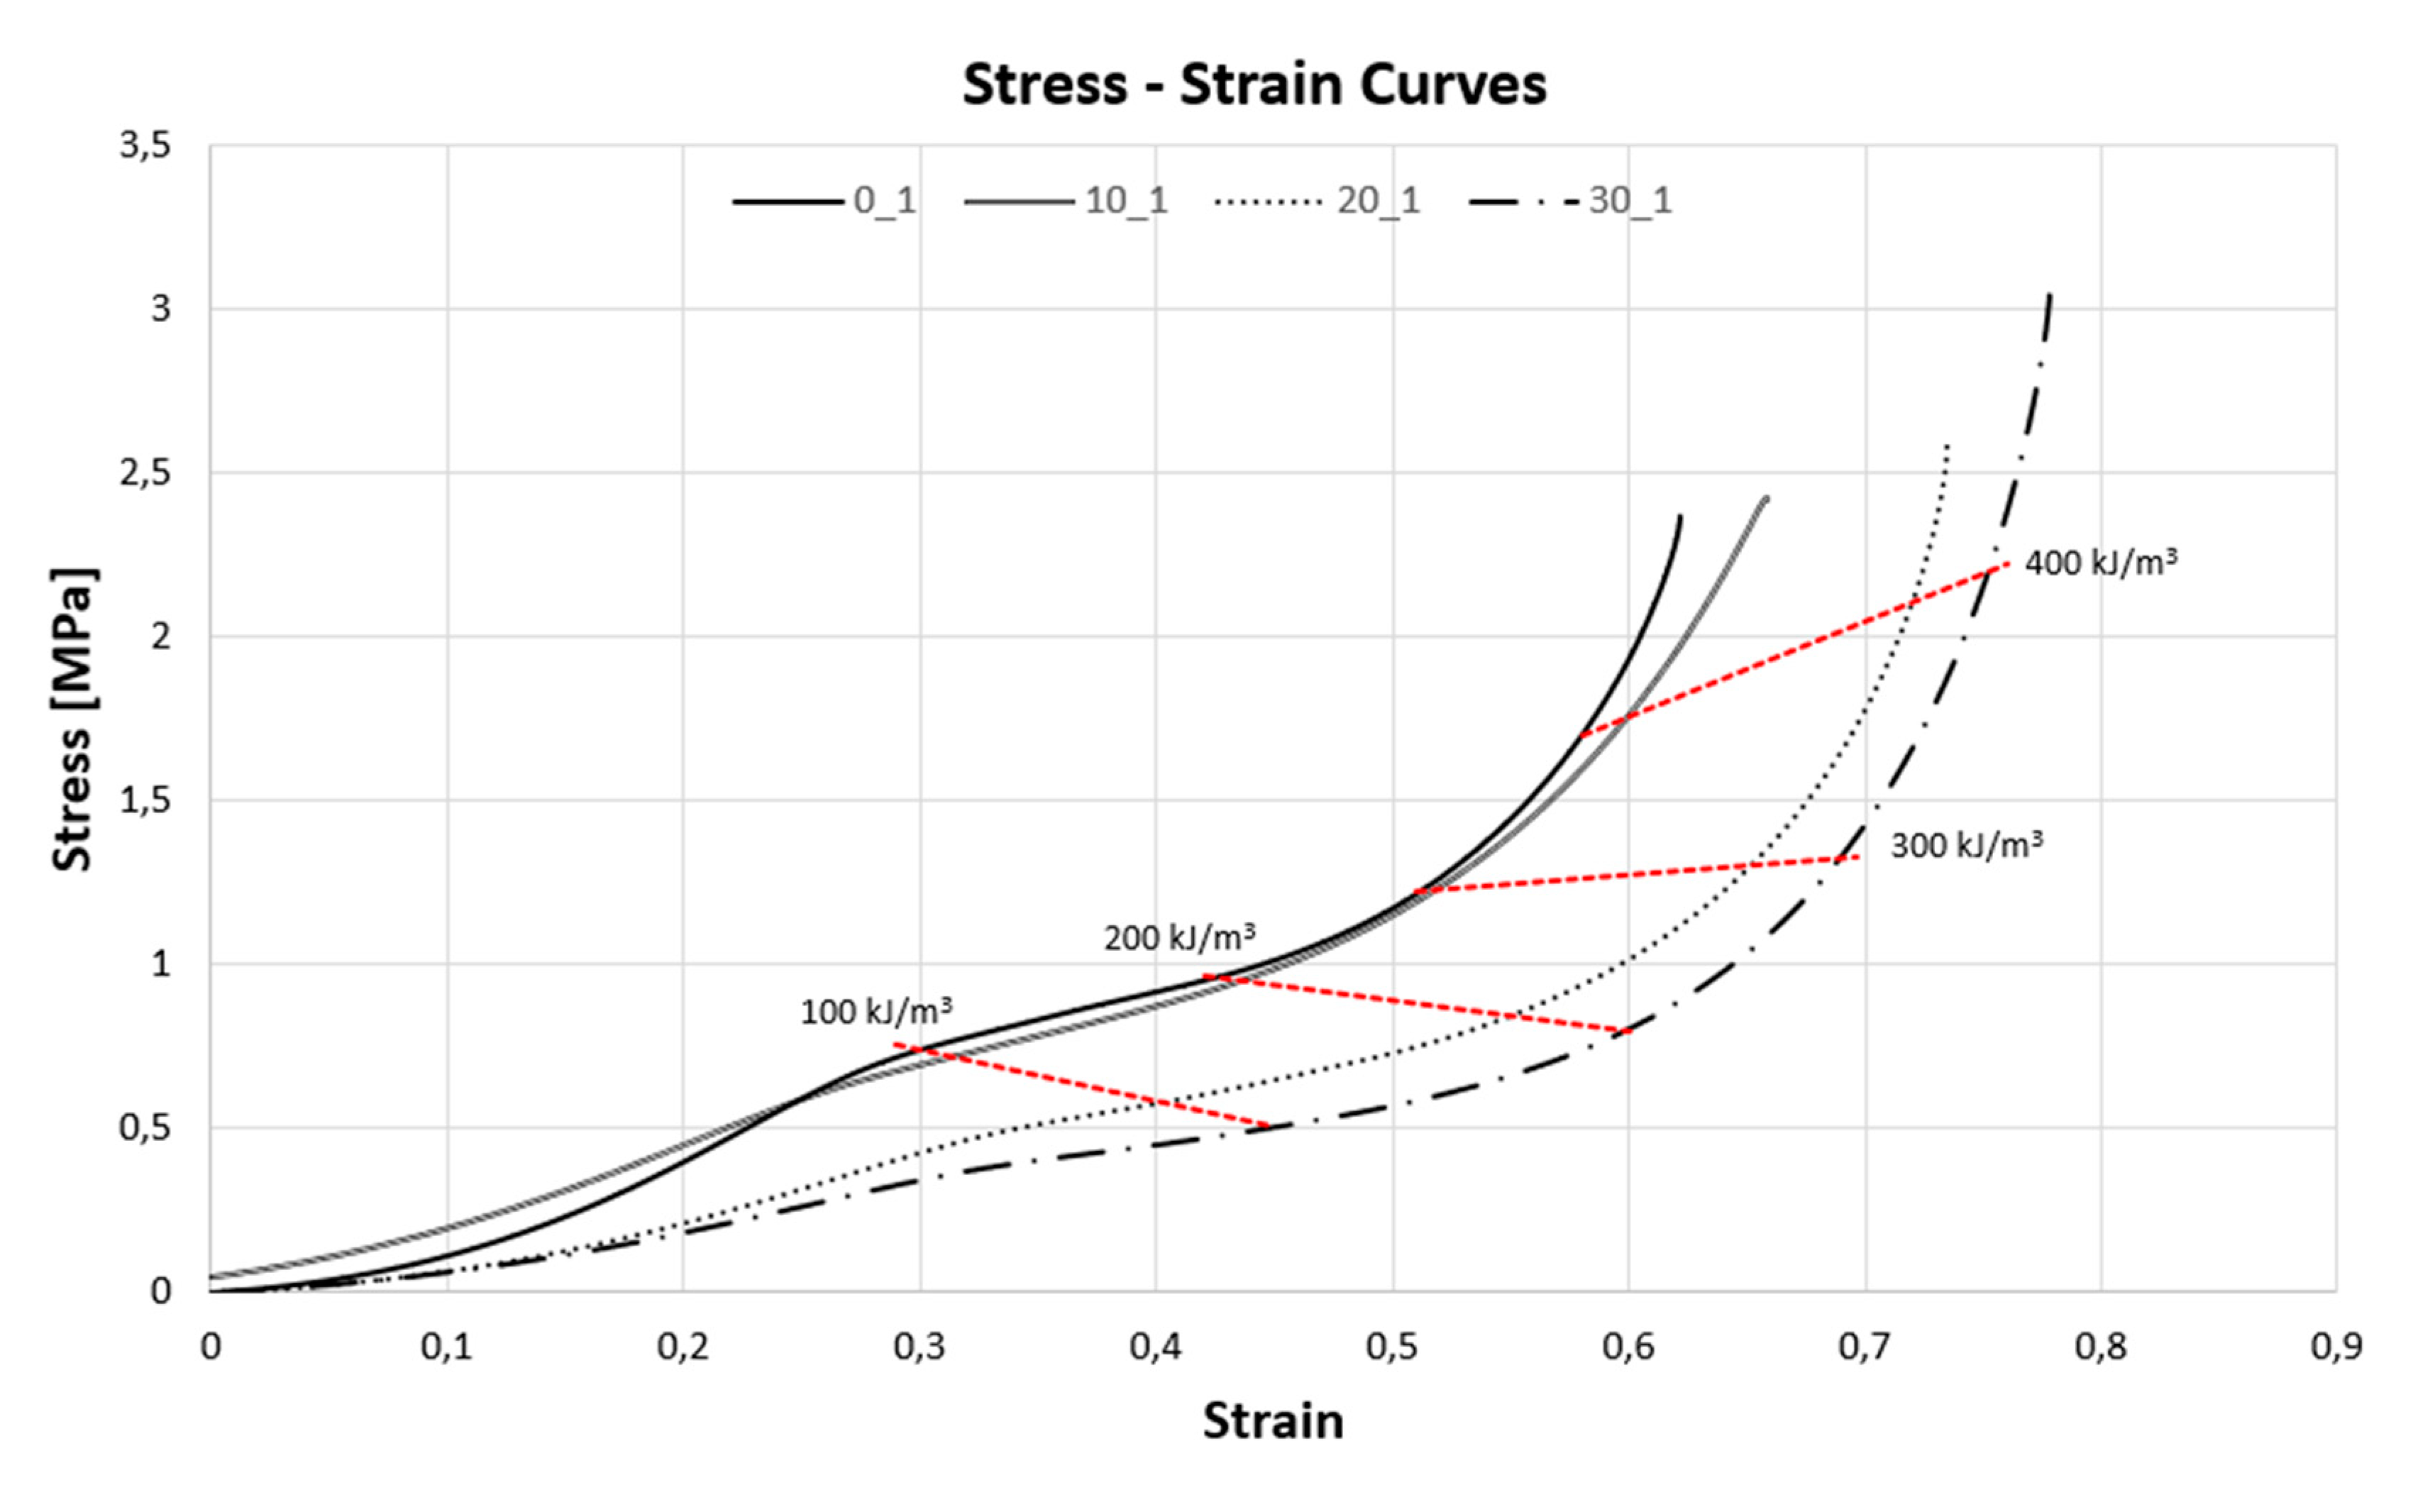
The energy absorbed by each tested specimen was calculated by resorting to the integration (equation 1) of the dynamic stress-strain curves (
Figure 14). Isocurves were plotted for distinct energy levels, allowing to understand better how a given specimen withstands the impact energy: or by large amounts of deformation under low stresses or under higher stresses and smaller deformations. Similar concepts were used in works [
16,
17].
Analysing first the stress-strain curves of
Figure 14, and starting from the first stage, the elastic linear zone, it is possible to observe that up to 10 wt.% of STF, the behaviour remains quite like the behaviour of the sample consisting only of cork. However, from the following samples, it can be witnessed that the increase in STF leads to a decrease in Young’s modulus, lowering the characteristic stress plateau found in cellular materials' response under compression. In other words, the resistance of the sample to elastic deformation decreases with the increase in the percentage of STF. Indeed, it appears that STF inclusion weakens the binding properties of the polyurethane-based glue used to agglomerate the cork grains.
Once the plateau region is reached, it is evident from the analysis of
Figure 14 that the plateau stress decreases with an increasing percentage of STF. For example, the plateau stress of the sample consisting entirely of cork is about 2.10 times higher than the yield stress of the sample with 30 wt.% STF. However, an increase in the percentage of STF generates larger plateau zones. The densification strain for a sample with 30 wt.% STF is about 0.6, whereas the same deformation for a total cork sample is about 0.5. This implies that STF-enhanced samples can provide more gentle deceleration rates while absorbing impact energy.
Finally, regarding the densification zone, it is evident that increasing the percentage of STF promotes a delay in cell crushing. Samples with a higher amount of STF were able to achieve significantly greater deformations than those of samples without and with 10 wt.% STF. Again, it appears that STF inclusion weakens the binding properties of the polyurethane-based glue used to agglomerate the cork grains leading to cracking mechanisms that will delay the onset of densification phenomena.
Four absorbed energy levels were also calculated for the different samples, being 100, 200, 300 and 400
kJ/m
3. This absorbed energy corresponds to the kinetic energy of the testing machine punch transformed into viscoelastic energy [
25].
Regarding the analysis of the energy density isocurves, it can be observed that the isocurves present a negative slope for absorbed energy values of 100 and 200 kJ/m3. This means that as the percentage of STF in the samples increases, the lower the stresses required but, the greater the strains to reach the desired energy levels. On the other hand, as the energy levels increase, especially the absorbed energy values of 300 and 400 kJ/m3, the isocurves begin to show a positive slope. This positive slope indicates that the greater the percentage of STF, the more significant the stresses and strains required to achieve the desired energy density value.
This type of graph, particularly the isocurves, allows the sample selection process to be optimised and improved if the amount of energy absorbed for a particular application is known. So, when gentle decelerations are required, the best sample presents the lowest stress to a given energy density value since a low-stress value implies a low acceleration peak value, one of the most critical parameters in this type of test. On the other hand, these specimens with 20 wt.% and 30 wt.% of STF disintegrate due to cracking, so they are not ideal for multi-impact applications.
Table 2 presents the energy absorbed by the samples for a 50% compressive strain. Again, the gradual increase in the percentage of the shear-thickening fluid in the samples leads to lower energy densities. Samples with a higher percentage of STF dissipate more significant amounts of energy due to fissuring, consequently absorbing smaller amounts of energy.
4.2. Quasi-Static Tests
The quasi-static tests were carried out to complement the knowledge obtained from the dynamic impact tests.
4.2.1. Energy Densities
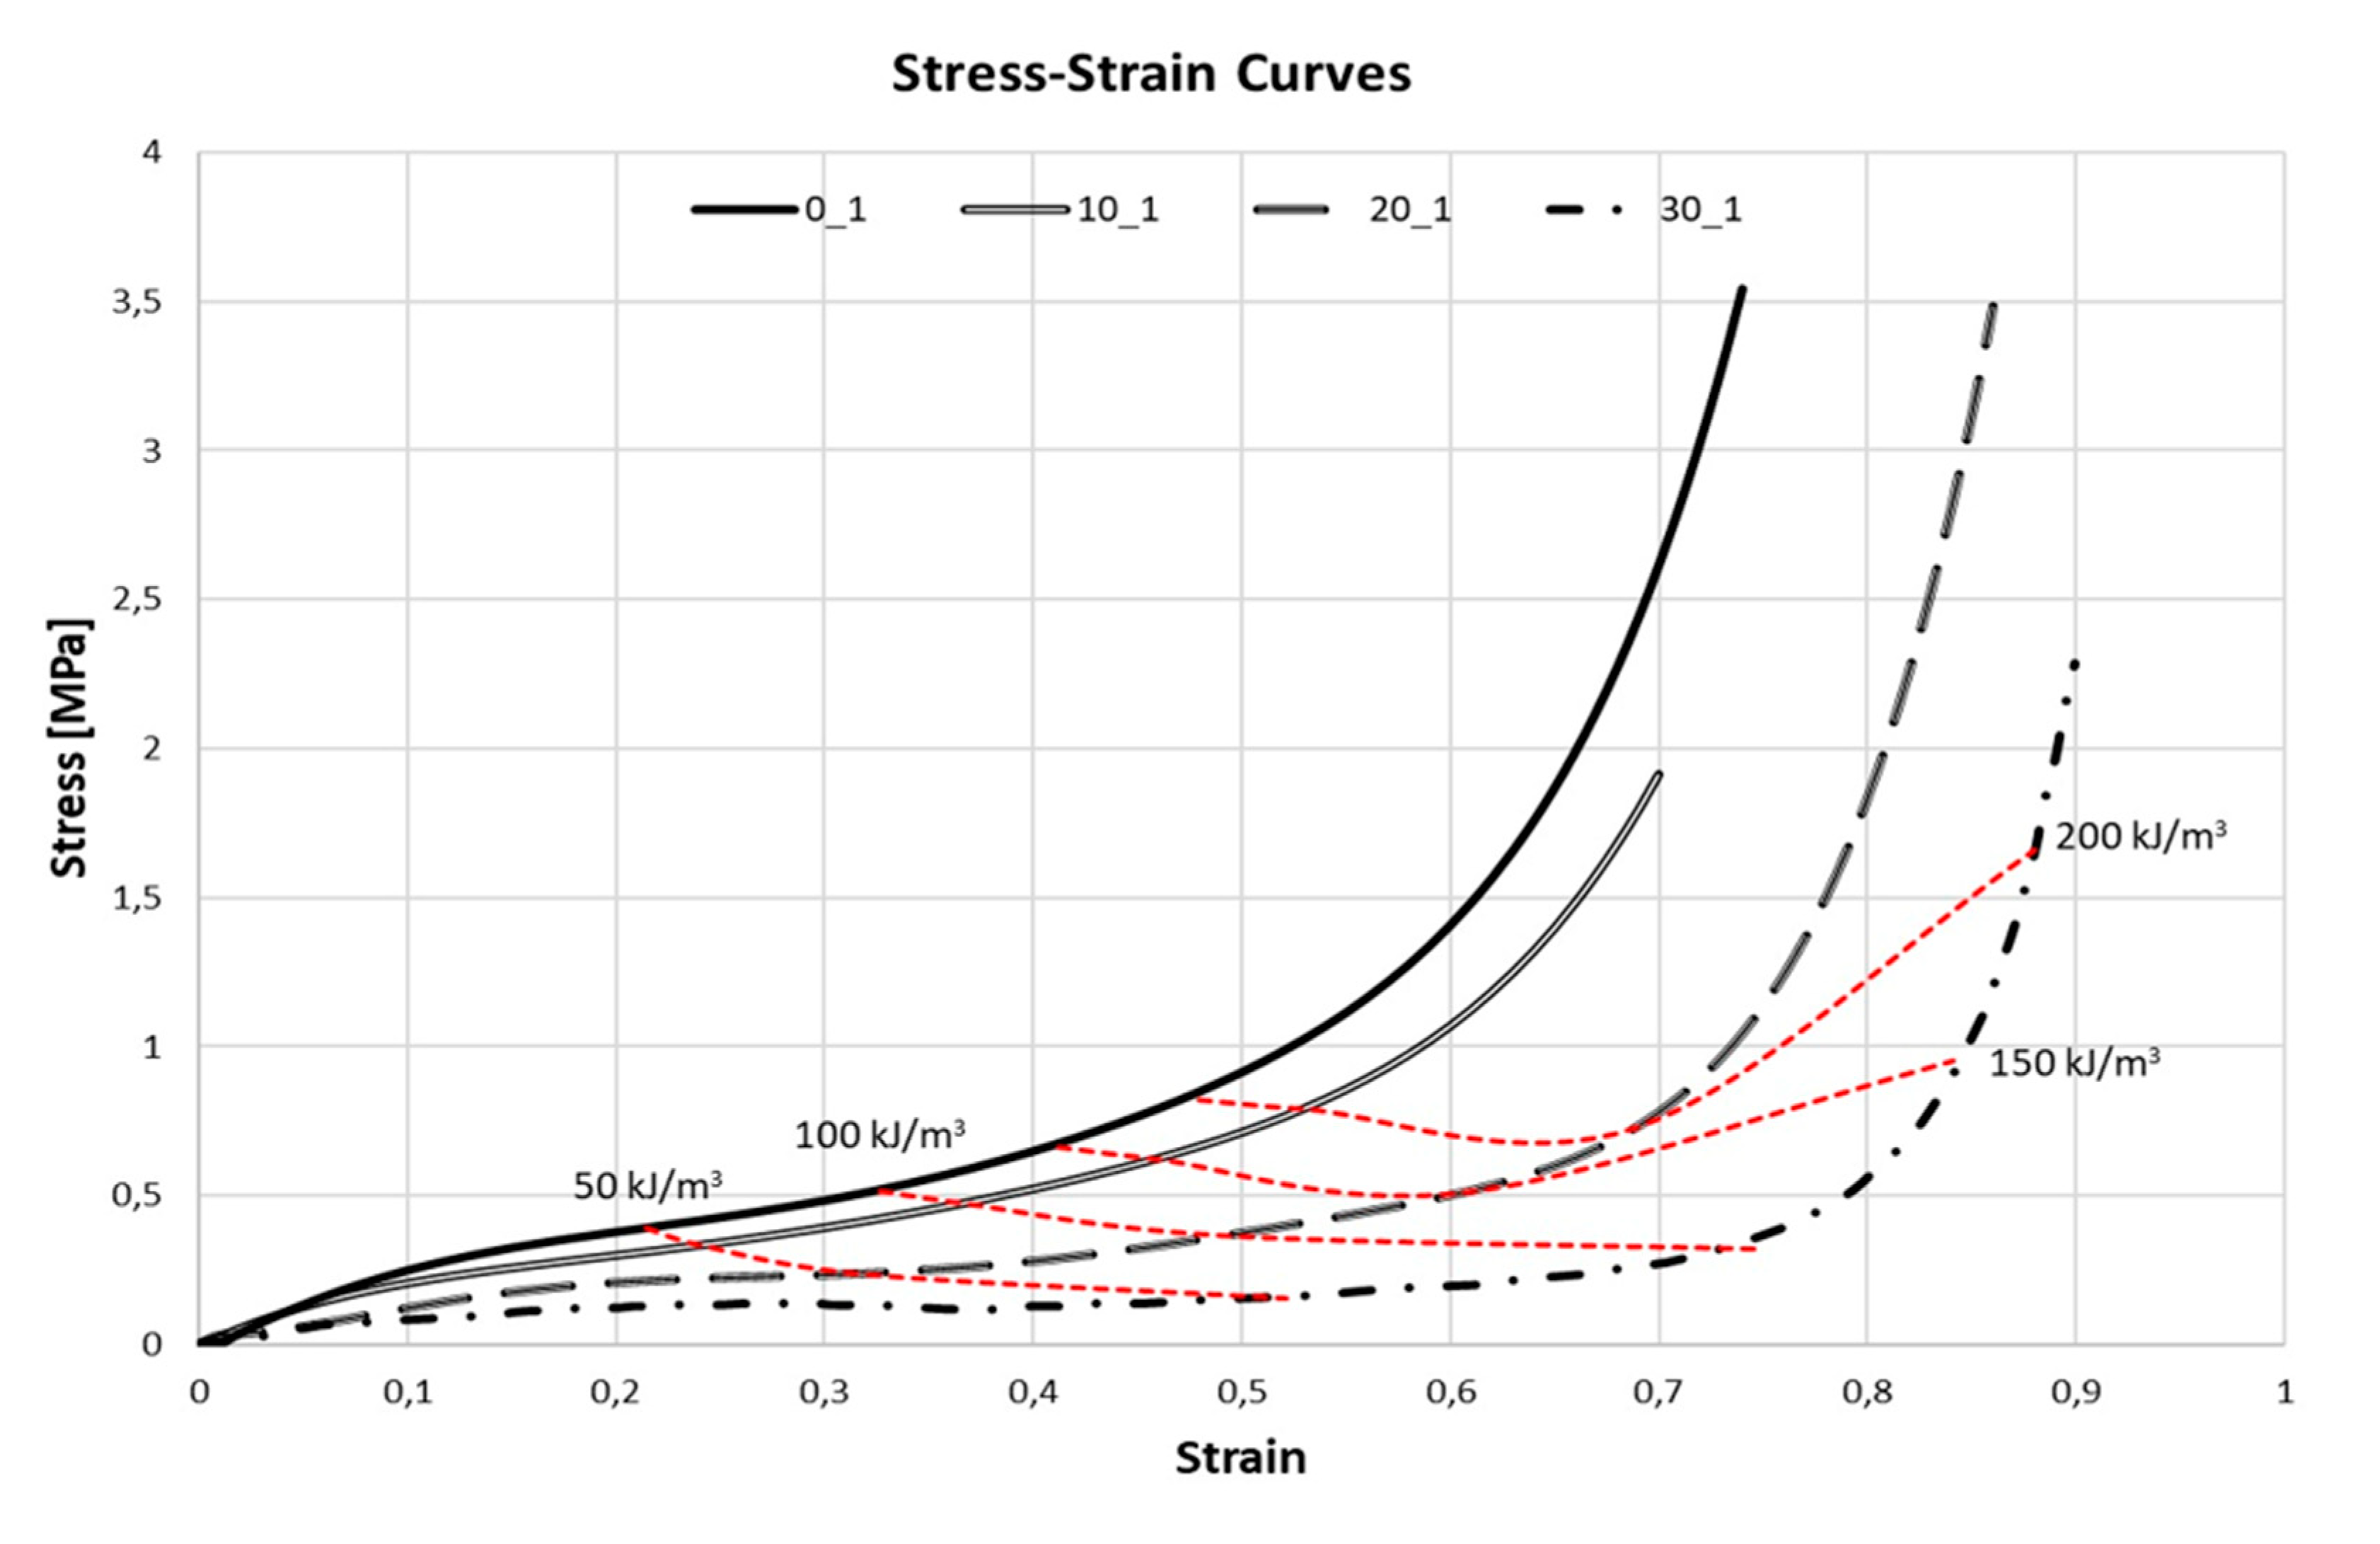
Identical to subchapter 4.1.3, the energies absorbed by the samples will be analysed and compared through their respective stress-strain curves, represented in
Figure 15. The method for calculating the absorbed energy was the same, and the range was also the same, therefore from 0 to 50% strain.
Analogously to the analysis performed for the dynamic tests, it begins with the elastic linear zone, where it is possible to observe that the increase in the percentage of STF leads to a decrease in Young’s modulus. This modest stress increase at the beginning of the stress-strain curve may result from the shear-thickening fluid not initially demonstrating its characteristic behaviour since these quasi-static tests do not cause large strains in a short time interval. On the contrary, these tests provide a reduced strain rate over a long time interval. Regarding the plateau region, it is interesting to observe that as the percentage of STF increases, the plateau is more elongated. For example, the densification deformation, the strain where the plateau region ends and the densification region begins, for a sample consisting solely of cork is around 0.6, whereas for a sample with 30 wt.% STF, this deformation is approximately 0.8.
On the other hand, the plateau stress also decreases with the increase in the percentage of STF. More elongated plateau zones are attractive for some applications where more prolonged and less sudden energy absorption mechanisms are desired. Again, it may be related to the weakening of the binder due to STF addition.
Regarding the densification region, it is possible to state that increasing the percentage of STF in the samples leads to a delay in the densification stages.
Four values of absorbed energy density were calculated for the different samples, 50, 100, 150 and 200 kJ/m3. Some samples could not surpass the 200 kJ/m3 level, so this value was set as the upper-bound. Interestingly, the shape of the isocurves for the quasi-static tests is slightly different from the shape for the dynamic tests. While the isocurves of the dynamic tests could be approximated to straight lines, the isocurves of the quasi-static tests present a more parabolic nature. However, for the absorbed energy values of 50 and 100 kJ/m3, it is possible to approximate the isocurves to straight lines with a negative slope, simplifying the analysis. A negative slope reflects that as the percentage of STF increases, the smaller the stresses required, the larger the strains to reach the cogitated energy values.
The energy density isocurves are essential tools in the material selection process. Depending on the engineering application, the product designer may choose a material that shows the lowest stress for a certain energy level (helmets to avoid injuries) or a material that shows higher stresses for smaller deformations. It depends on the function desired.
Finally, through
Table 3, it is possible to corroborate, once again, that increasing the weight percentage of STF in the samples leads to lower energy densities. The sample containing 10 wt.% of STF has a relatively acceptable absorbed energy value, compatible with the cork sample. Increasing STF wt.% will drastically reduce such values. Furthermore,
Table 4 depicts each sample's estimated average Young's modulus for dynamic and quasi-static tests. A detailed examination of
Table 4 supports the notion that as the amount of STF rises, the elastic modulus lowers, lowering the stress plateau often observed in cellular materials.
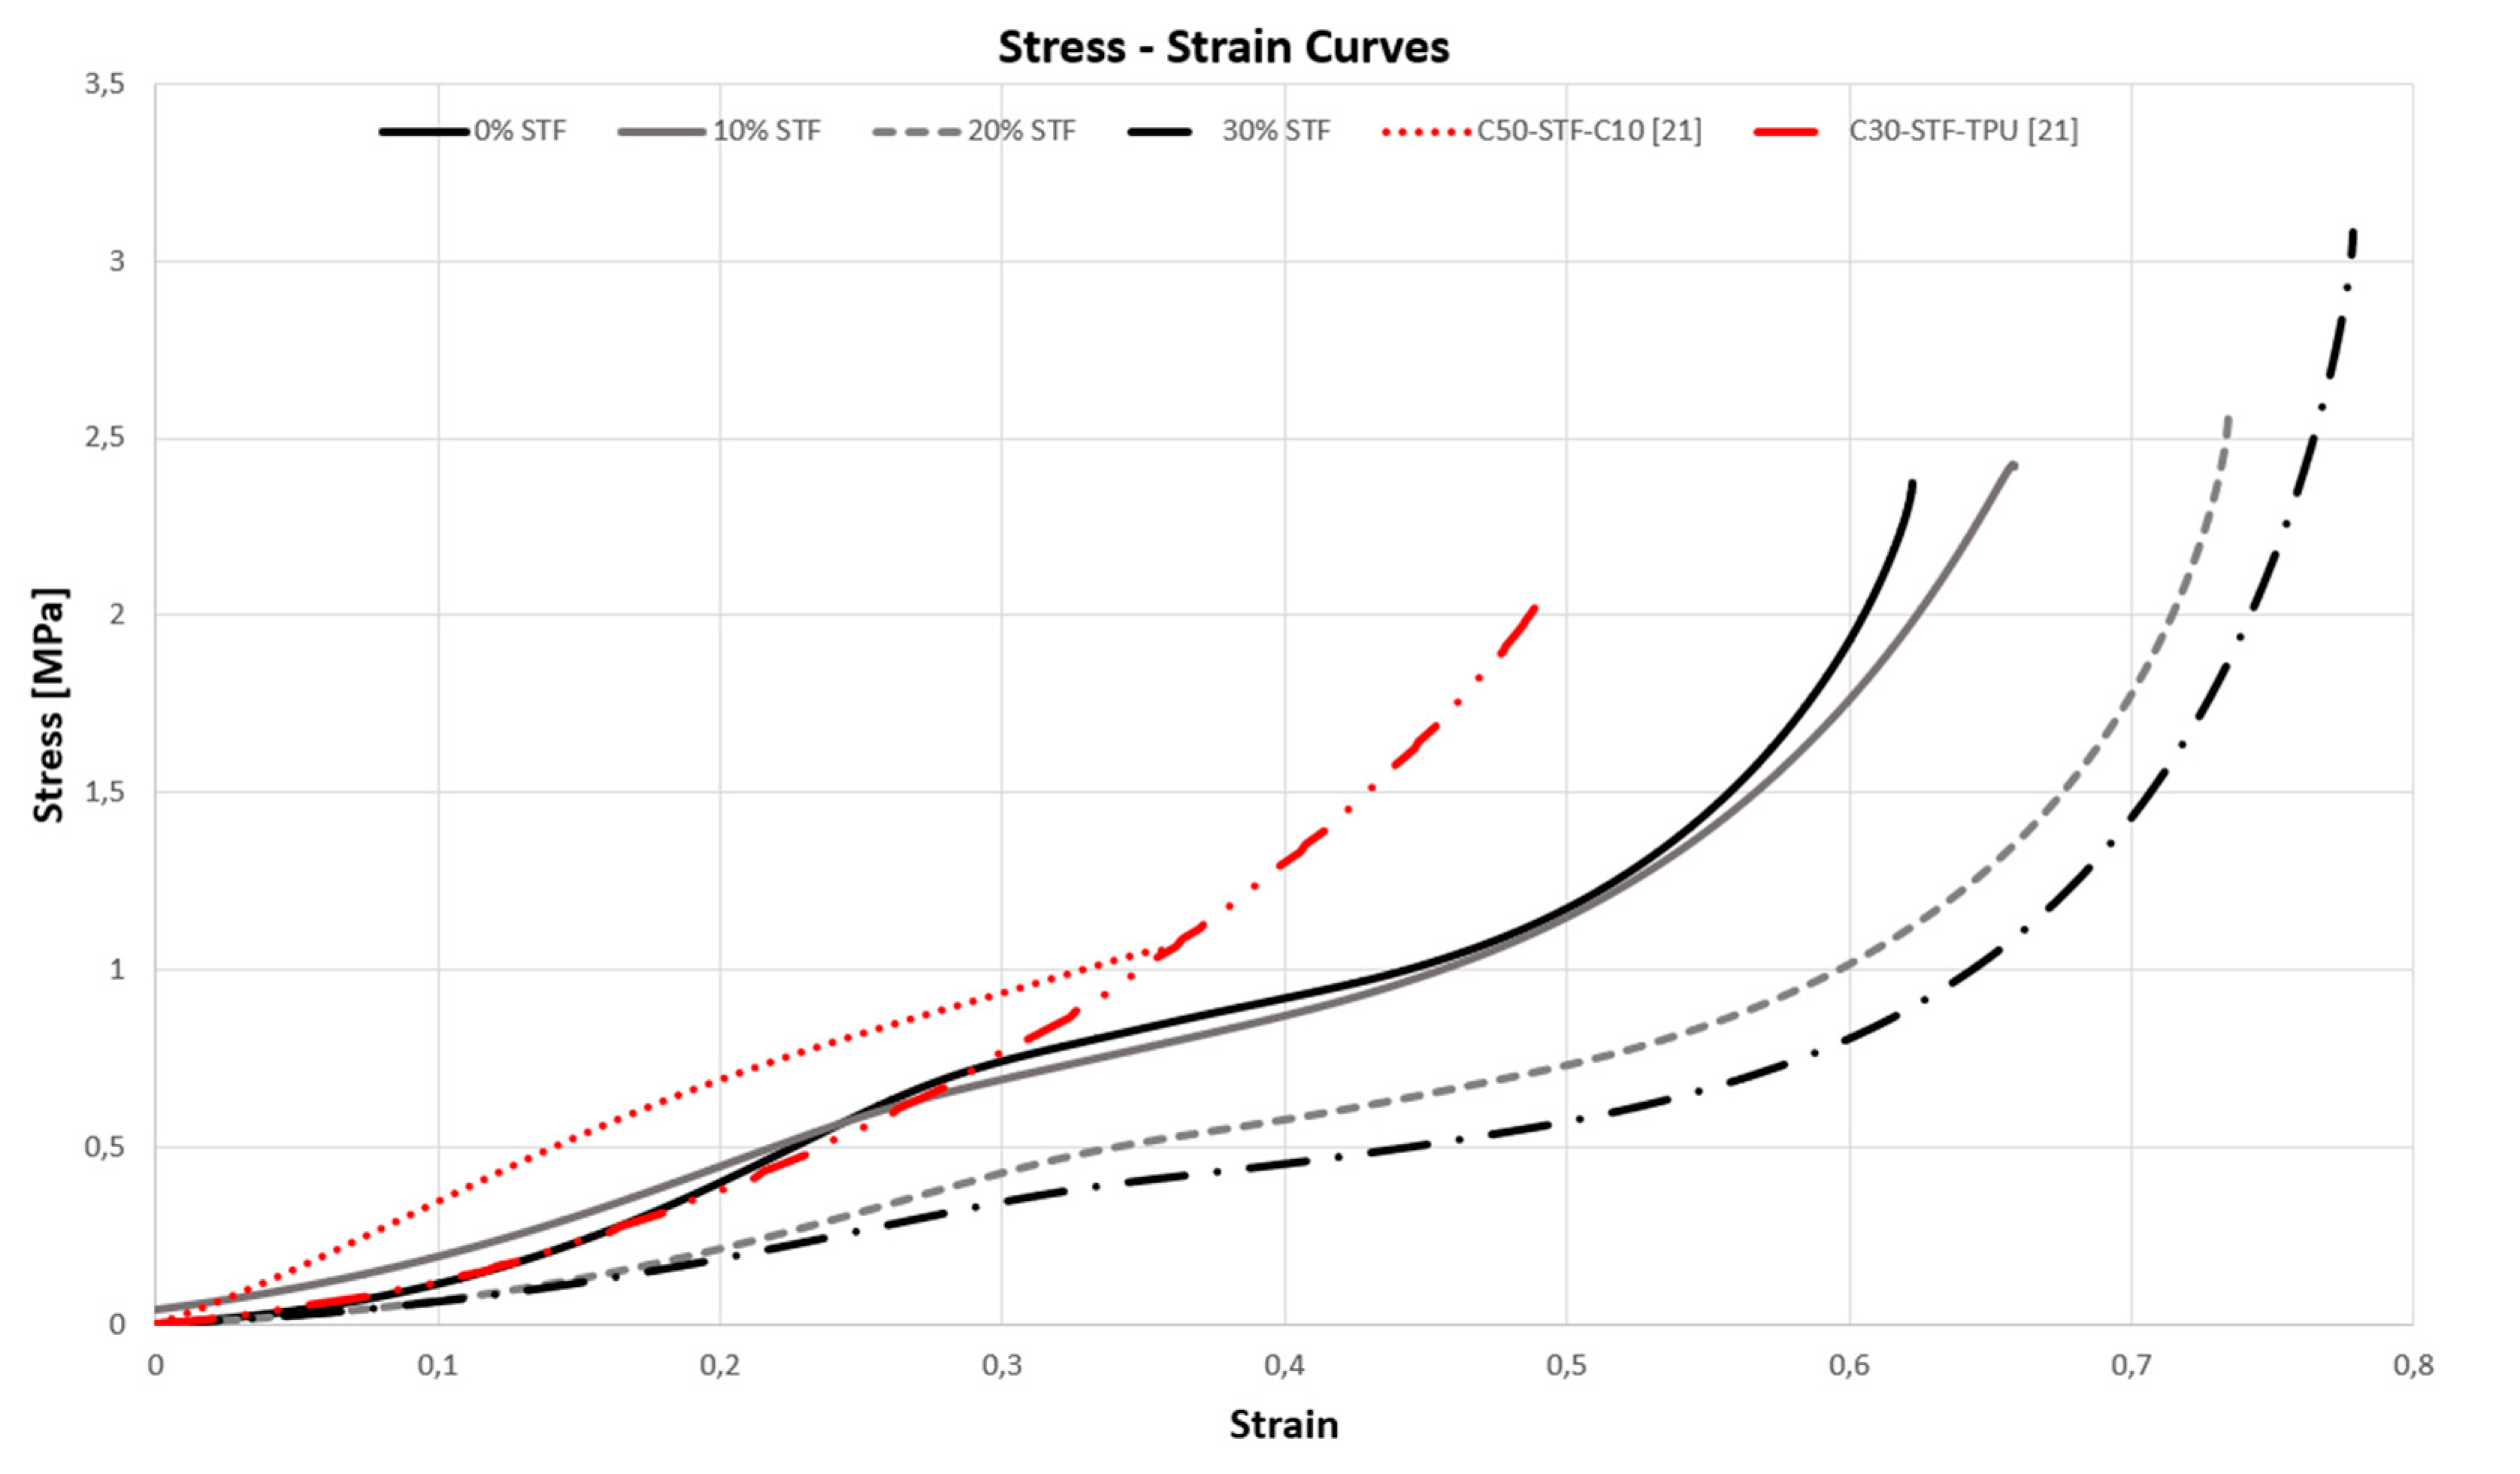
Figure 16 compares the mechanical behaviour of materials manufactured in this study with a homogenous inclusion of STF to samples impregnated heterogeneously with STF in the work of Serra et al. [
21]. The C50-STF-C10 sample consists of a 50 mm cube of cork agglomerate, a layer of STF, and a 10 mm cork agglomerate slice. In contrast, the C30-STF-TPU sample consists of a 30 mm cube of cork agglomerate, a layer of STF, and a 1 mm layer of TPU (Thermoplastic Polyurethane). Even though the dimensions of the samples from the two works are not identical, it is possible to detect that a homogeneous inclusion of STF in the cork agglomerate before moulding and curing permits much higher stresses and deformations. In addition, the new method of integrating STF into cork agglomerates produces compression stress-strain curves significantly more akin to those of cellular materials than the heterogeneous inclusion method.
5. Conclusions
Dynamic and static mechanical testing has allowed a complete study of cork agglomerates enhanced with shear-thickening fluids. Such tests improved the knowledge about their mechanical properties and the characteristics that influence them, namely the weight percentage of STF.
Throughout the experimental part, the disaggregation of the samples with a higher percentage of STF, namely those of 20 wt.% and 30 wt.%, was notorious in the impact and quasi-static tests. An important conclusion can be drawn from this. It is necessary and crucial that the amount of fluid used is adjusted to an optimal value. In other words, it is imperial that this quantity lies between a minimum value, which maintains the structural integrity of the sample, and a maximum value, which does not damage and overshadow its mechanical properties.
As far as impact tests are concerned, although the aforementioned samples have deagglomerated, it should be noted that samples with 10 wt.% could withstand loads of not only the first but also the second impact without showing macroscopic fissuring or any visible consequences. This proves that respecting the amount of fluid and structural integrity makes it possible to produce samples capable of withstanding multiple impacts, with more significant minimisation of damage to the user and far more sustainable than those currently used in body safety applications.
Cork, a cellular material, has a typical behaviour under compression. It was confirmed that even with the impregnation of the shear thickening fluid, the final sample also presents the same representative stress-strain curve, where the three distinct regions can be observed: elastic linear region, plateau region and densification region. This study made it clear that the sample's mechanical properties can be modified for a specific purpose by changing the amount of STF present. In short, a higher percentage of fluid results in a lower stress plateau and a later densification stage. The opposite happens when decreasing the percentage of fluid, i.e., the stress plateau increases, and the densification stage is accelerated.
The energy densities of the samples were evaluated, both in dynamic and quasi-static tests. Both tests confirmed that the presence of a shear-thickening fluid reduces the energy absorbed since it decreases the modulus of elasticity, the plateau stress, and, consequently, the area under the stress-strain curve. On the other hand, the presence of a shear-thickening fluid allows energy absorption under lower stresses and gentler deceleration rates. Compared to the heterogenous combination of cork and STF, the homogeneous mixture herein presented provides gentler decelerations upon impact.
Given the current need to find sustainable materials to replace their synthetic equivalents, this study provides necessary information on the adaptability of cork agglomerates with STF for specific purposes.
Acknowledgments
The present study was developed in the scope of the Project “Agenda ILLIANCE” [C644919832-00000035 | Projeto n.º46 ], financed by PRR – Plano de Recuperação e Resiliência under the Next Generation EU from the European Union and also by National Funds by FCT – Fundação para a Ciência e a Tecnologia, I.P., in the scope of the project 2022.04022.PTDC.
References
- Gürgen, S.; de Sousa, R.J.A. Rheological and deformation behavior of natural smart suspensions exhibiting shear thickening properties, Archives of Civil and Mechanical Engineering 20 (2020). [CrossRef]
- Lee, Y.S.; Wagner, N.J. Dynamic properties of shear thickening colloidal suspensions, Rheologica Acta 42 (2003) 199–208. [CrossRef]
- Barnes, H.A. Shear-Thickening (“Dilatancy”) in Suspensions of Nonaggregating Solid Particles Dispersed in Newtonian Liquids, Journal of Rheology 33 (1989) 329-366. [CrossRef]
- Fischer, C.; Braun, S.A.; Bourban, P.E.; Michaud, V.; Plummer, C.J.; Månson, J.A. Dynamic properties of sandwich structures with integrated shear-thickening fluids, Smart Materials and Structures 15 (2006) 1467-1475. [CrossRef]
- Pinto, F.; Meo, M. Design and Manufacturing of a Novel Shear Thickening Fluid Composite (STFC) with Enhanced out-of-Plane Properties and Damage Suppression, Applied Composite Materials 24 (2017) 643-660. [CrossRef]
- F. J. Galindo-Rosales, S. Martínez-Aranda, L. Campo-Deanõ, CorkSTFμfluidics – A novel concept for the development of eco-friendly lightweight energy absorbing composites, Materials & Design 82 (2015) 326-334. [CrossRef]
- N. J. Wagner, J. F. Brady, Shear thickening in colloidal dispersions, Physics Today 62 (2009) 27–32. [CrossRef]
- S. Gürgen, M. C. Kuşhan, W. Li, Shear thickening fluids in protective applications: A review, Progress in Polymer Science 75 (2017) 48-72. [CrossRef]
- Y. S. Lee, E. D. Wetzel, N. J. Wagner, The ballistic impact characteristics of Kevlar® woven fabrics impregnated with a colloidal shear thickening fluid, Journal of Materials Science 38 (2003) 2825–2833. [CrossRef]
- M. A. Abtew, F. Boussu, P. Bruniaux, Dynamic impact protective body armour: A comprehensive appraisal on panel engineering design and its prospective materials, Defence Technology 17 (2021) 2027-2049. [CrossRef]
- N. J. Wagner, J. M. Houghton, B. A. Schiffman, D. P. Kalman, E. D. Wetzel, N. J. Wagner, Hypodermic needle puncture of shear thickening fluid (STF)-treated fabrics, 2007. URL: https://www.researchgate.net/publication/264872569.
- Majumdar, B. S. Butola, A. Srivastava, An analysis of deformation and energy absorption modes of shear thickening fluid treated kevlar fabrics as soft body armour materials, Materials and Design 51 (2013) 148–153. [CrossRef]
- E. E. Haro, A. G. Odeshi, J. A. Szpunar, The energy absorption behavior of hybrid composite laminates containing nano-fillers under ballistic impact, International Journal of Impact Engineering 96 (2016) 11–22. [CrossRef]
- W. Na, H. Ahn, S. Han, P. Harrison, J. K. Park, E. Jeong, W. R. Yu, Shear behavior of a shear thickening fluid-impregnated aramid fabrics at high shear rate, Composites Part B: Engineering 97 (2016) 162–175. [CrossRef]
- P. Kaczynski, M. Ptak, J. Wilhelm, F. A. O. Fernandes, R. J. A. de Sousa, High-energy impact testing of agglomerated cork at extremely low and high temperatures, International Journal of Impact Engineering 126 (2019) 109-116. [CrossRef]
- F. A. O. Fernandes, R. T. Jardin, A. B. Pereira, R. J. A. de Sousa, Comparing the mechanical performance of synthetic and natural cellular materials, Materials & Design 82 (2015) 335-341. [CrossRef]
- P. T. Santos, S. Pinto, P. A. A. P. Marques, A. B. Pereira, R. J. A. de Sousa, Agglomerated cork: A way to tailor its mechanical properties, Composite Structures 178 (2017) 277-287. [CrossRef]
- R. Garcia, M. F. Júlio, L. M. Ilharco, A cork–silica xerogel nanocomposite with unique properties, Journal of Sol-Gel Science and Technology 83 (2017) 567–573. [CrossRef]
- J. Zhuang, S. H. Ghaffar, M. Fan, J. Corker, Restructure of expanded cork with fumed silica as novel core materials for vacuum insulation panels, Composites Part B: Engineering 127 (2017) 215–221. [CrossRef]
- S. Gürgen, F. A. O. Fernandes, R. J. A. de Sousa, M. C. Kuşhan, Development of Eco-friendly Shock-absorbing Cork Composites Enhanced by a Non-Newtonian Fluid, Applied Composite Materials 28 (2021) 165-179. [CrossRef]
- G. F. Serra, F. A. O. Fernandes, R. J. A. de Sousa, E. Noronha, M. Ptak, New hybrid cork-STF (Shear thickening fluid) polymeric composites to enhance head safety in micro-mobility accidents, Composites Structures 301 (2022) 1138-1161. [CrossRef]
- Carel, Carel. http://carel.pt/, 2014. URL: http://carel.pt/.
- Polyanswer, Polyanswer. http://polyanswer.com/, 2016. URL: http://polyanswer.com/.
- Flexpur, Flexpur. https://www.flexpur.pt/, 2013. URL: https://www.flexpur.pt/.
- L. J. Gibson, M. F. Ashby, Cellular Solids: Structure and Properties, Second Edition (2014) 1–510. [CrossRef]
Figure 1.
Production of cork grains from scraps of wine stoppers by the grinding process.
Figure 1.
Production of cork grains from scraps of wine stoppers by the grinding process.
Figure 2.
SEM image of the sample composed entirely of cork at a magnification of 300.
Figure 2.
SEM image of the sample composed entirely of cork at a magnification of 300.
Figure 3.
Shear-thickening fluid.
Figure 3.
Shear-thickening fluid.
Figure 4.
Viscosity variation in function of the shear rate.
Figure 4.
Viscosity variation in function of the shear rate.
Figure 5.
Sample production schematic procedure.
Figure 5.
Sample production schematic procedure.
Figure 6.
Samples were prepared with 0, 10, 20 and 30 wt.% of STF fluid.
Figure 6.
Samples were prepared with 0, 10, 20 and 30 wt.% of STF fluid.
Figure 7.
SEM images of the samples produced with 0, 10, 20 and 30 wt.% of STF.
Figure 7.
SEM images of the samples produced with 0, 10, 20 and 30 wt.% of STF.
Figure 9.
Drop test output.
Figure 9.
Drop test output.
Figure 10.
Comparison of the peak forces of the various samples.
Figure 10.
Comparison of the peak forces of the various samples.
Figure 11.
Samples after impact tests with the respective percentage indication of STF.
Figure 11.
Samples after impact tests with the respective percentage indication of STF.
Figure 12.
Comparative graph of the peak force ratios of the various samples.
Figure 12.
Comparative graph of the peak force ratios of the various samples.
Figure 13.
Maximum acceleration values.
Figure 13.
Maximum acceleration values.
Figure 14.
Stress-strain curves of the different samples.
Figure 14.
Stress-strain curves of the different samples.
Figure 15.
Stress-strain curves of the different samples.
Figure 15.
Stress-strain curves of the different samples.
Figure 16.
Stress-strain curves with both homogeneous and heterogeneous [
21] inclusion of STF on cork agglomerates.
Figure 16.
Stress-strain curves with both homogeneous and heterogeneous [
21] inclusion of STF on cork agglomerates.
Table 1.
Samples weight percentage distribution.
Table 1.
Samples weight percentage distribution.
| Samples |
STF wt.% |
Cork wt.% |
Binder wt.% |
Water wt.% |
Density (kg/m3) |
| 0_x |
0 |
85 |
10 |
5 |
240 |
| 10_x |
10 |
75 |
10 |
5 |
240 |
| 20_x |
20 |
65 |
10 |
5 |
240 |
| 30_x |
30 |
55 |
10 |
5 |
240 |
Table 2.
Results of the absorbed energy density of the samples at 50% compressive strain
Table 2.
Results of the absorbed energy density of the samples at 50% compressive strain
| Sample |
Energy Density (kJ/m3) |
| 0_x |
273.525 |
| 10_x |
248.353 |
| 20_x |
164.029 |
| 30_x |
132.268 |
Table 3.
The energy density of the samples at 50% compressive strain.
Table 3.
The energy density of the samples at 50% compressive strain.
| Sample |
Energy Density (kJ/m3) |
| 0_x |
217.258 |
| 10_x |
177.367 |
| 20_x |
102.963 |
| 30_x |
46.8443 |
Table 4.
Estimated average Young’s modulus of the samples.
Table 4.
Estimated average Young’s modulus of the samples.
| Sample |
Mean E (MPa) [Dynamic] Mean E (MPa) [Static] |
| 0_x |
2.851 2.433 |
| 10_x |
2.429 2.309 |
| 20_x |
1.467 1.422 |
| 30_x |
0.963 1.138 |
|
Disclaimer/Publisher’s Note: The statements, opinions and data contained in all publications are solely those of the individual author(s) and contributor(s) and not of MDPI and/or the editor(s). MDPI and/or the editor(s) disclaim responsibility for any injury to people or property resulting from any ideas, methods, instructions or products referred to in the content. |
© 2023 by the authors. Licensee MDPI, Basel, Switzerland. This article is an open access article distributed under the terms and conditions of the Creative Commons Attribution (CC BY) license (http://creativecommons.org/licenses/by/4.0/).

