Preprint
Article

Expert System Integrating Rule-Based Reasoning to Voltage Control in PV-Rich Low Voltage Electric Distribution Networks

Altmetrics

Downloads

153

Views

55

Comments

0

This version is not peer-reviewed

Submitted:

03 April 2023

Posted:

03 April 2023

You are already at the latest version

Alerts
Abstract
Nowadays, in low voltage (LV) electric distribution networks (EDNs), the Distribution Network Operators (DNOs) are encountering a high number of connected small-scale distributed generation units, mainly photovoltaic (PV) prosumers. The irregular behavior of the prosumers, together with the uncertainty degree of the requested and injected powers associated with all end-users from the LV EDN, can cause voltage variations with violations of the allowable limits. In this context, the paper developed an efficient and resilient expert system integrating the rule-based reasoning applied to the On-load Tap Changer (OLTC)-fitted transformer to improve the efficiency of the voltage control in the PV-rich LV EDNs. An in-depth analysis based on 75 scenarios, resulting from the combinations of three indicators: the penetration degree of the PV prosumers, consumption evolution associated with the consumers, and energy production of the PV systems, has been performed to demonstrate the efficiency of the proposed expert system in an LV EDN from a rural area belonging to a Romanian DNO. The success rate of the expert system has been 86.7% (65 out of 75 scenarios didn't have voltage issues, all values being between the allowable limits in 100% of the time slots associated with the analyzed period). For the other scenarios (representing 13.3%), the values have been inside the range [-10%, +10%] at least 95% of the time slots, according to the European Power Quality Standard, and for the rest of the time slots up to 100% being very close to the upper and lower limits of the range, with highly mitigating of the voltage variations.
Keywords: 
Subject: Engineering  -   Energy and Fuel Technology

1. Introduction

1.1. Motivation

The reduction of centralized power plants' energy production has been attributed to the emergence of distributed generation in the electric distribution networks (EDNs), particularly at the low voltage (LV) level [1]. The increasing number of photovoltaic systems (PV) installed at the consumers (called prosumers) connected to the LV EDNs is expected to increase annually due to their various economic and technical advantages, besides the fact that they can help also reduce greenhouse gas emissions. However, they are not fully prepared to integrate a very high number of PV prosumers with a variable character due to the one hand, the topologies of LVEDNs, and on the other hand, the ageing technical infrastructure [2].
The voltage quality, represented by exceeding the admissible limits indicated in the power quality standards, has been identified by the DNOs as one of the main factors that can decrease the hosting capacity to accommodate the growing number of PV prosumers [3,4]. The reverse power flows from the LV EDN to the common couple point (CCP), identified through the electric distribution substation (EDS), ensures the connection between the MV and LVEDNs and represent the reason for various voltage issues, leading to uncertainties on the voltage level of the nodes [5,6].
The DNOs should develop new strategies to address these issues and increase the penetration degree of PV prosumers. An overview of the strategies to improve the voltage quality emphasizes that most of them belong to the passive LV EDNs (without the renewable energy sources integrated) associated with replacing the No-Load Tap Changing (NLTC)-fitted MV/LV transformers and reducing the cable impedances because one of the most common factors contributing to this issue is the excessive ratio between resistance and reactance of the LV EDNs. However, these strategies are characterized by an expensive cost and are only partially efficient from a technical point of view in the active LV AEDNs (integrating the renewable energy sources) [1], [7]. On the other hand, the high-frequency solar ramping caused by the rapid emergence and evolution of clouds can lead to over-voltages in the LV EDNs [2].
Thus, the high intermittency degree of these sources could be a burden for the DNOs in the voltage control from the LV EDNs as long as they do not develop strategies to remove the voltage violations when a high number of PV prosumers are integrated, in the conditions in which the voltage control band is usually between 0.9 to 1.1 p.u. of the rated voltage. Due to the increasing number of PV systems and the complexity of the LV EDNs, developing the new strategy will require more advanced voltage control technologies [1]. These strategies should also use the latest technologies, such as smart devices/equipment that can process the data and help to identify the optimal solution [8]. The advanced technologies integrated into some equipment represented by automatic voltage regulators [9,10], energy storage systems [11,12], capacitor banks [13,14], or load balancing devices [15,16], but in a small percentage, especially in the pilot networks, can be observed in the LV EDSs. However, before they can be implemented widely and in correlation with each other, the DNOs should thoroughly analyse the cost-benefit of these technologies. One of the most efficient devices to ensure the resilience of voltage control, which demonstrated its performance at the High Voltage (HV) level, is represented by the On-Load Tap Changer fitted to the MV/LV distribution transformers [17,18,19,20,21]. Although the maximum hosting capacity of the LV EDNs supplied from an EDS with an OLTC-fitted transformer has not been clearly defined, the DNOs must develop efficient strategies to increase as much as possible the limit threshold. By doing so, DNOs can grow their technical and economic benefits using these advanced technologies.
Regarding the efficient use of the OLTC-fitted distribution transformers in PV-rich LV EDNs, researchers seek to identify new Artificial Intelligence-based solutions to improve voltage control [22,23]. According to them, the penetration degree of PV prosumers quantified through the hosting capacity of the LV EDN, can grow and can be supported by the current technical infrastructure.

1.2. Literature Review

Most of the studies which evaluated the effects of PV prosumers focused on the different aspects of the voltage profile from the LV EDNs, see Figure 1. However, the results depended on the test EDNs (for example, IEEE EDNs) or real LV EDNs associated with the pilot projects of different DNOs used in the simulations and the working assumptions considered.
Various definitions regarding the penetration degree of the prosumers from an LV EDN have been given in the literature. The first definition refers to the ratio of roof space needed to install the PV panels to the total surface available [20]. Another definition considers the ratio of annual energy from PV systems to the total energy consumption [21]. Some researchers have attempted to define it concerning the transformer capacity [24], while others have calculated it as the ratio of installed PV peak capacity to the maximum load of the feeder [1].
Some definitions have even replaced the "maximum load of feeder" with "minimum load of feeder" [25], considering the ratio between the actual PV output and the active power load. But, the most accessible, clear, and easy-to-understand definition refers to the number of PV prosumers from the end-users connected in the LV EDNs [19,26].
The studies differ, depending on the factors that influence the design and operation of LV EDNs, such as the type of network (rural/urban or aerial/underground), the weather conditions, the generation/load profiles, and the capacity and spread of PV prosumers. Since the results of these studies depend on the analysed LV AEDN, their extension to other networks or areas is difficult. It suggests that further studies must include the multiple aspects of voltage control.
Regarding the MV/LV distribution transformers, these can be fitted with an OLTC to keep the voltage level as constant as possible, inside the allowable limits, in all nodes of the LVEDNs. The device changes the transformer's turn ratio in predefined steps (9, 17, or 35 positions), which leads to voltage changes on the secondary (low voltage) side. An automatic voltage regulator (AVR) is also commonly used to control the device. Its control methodology includes the step-by-step principle based on a command sent to the OLTC to move it with a tap up or down, depending on the case. The OLTC uses this signal to maintain a constant voltage level when the current value deviates from its set reference (by more than the dead band associated with the insensitivity degree) [17]. Since OLTCs have been configured considering the voltage drop along the passive LV EDN, an increase in the voltage level due to the reverse power flows could occur due to injected powers by the small-scale renewable energy sources (prosumers).
Rogers et al. [18] present a comparison between three technologies (classic, semiconductor, and hybrid) considering five features: tap-to-tap time, operation count, fault robustness, capital cost, and conduction losses. The hybrid technology has been identified from the other two technologies by the way it eliminated the disadvantages and emphasized the advantages of each of them, reaching the following performances: tap-to-tap time between 20 and 50 ms, operation count of more than 107, high robustness (semiconductors must withstand fault current for no longer than 20 ms), a low capital cost, and negligible conduction losses (mechanical contact only). A hybrid OLTC is an electronic device containing both power semiconductor and mechanical switching elements to provide a balanced performance across various metrics. Compared to traditional OLTCs, which rely on only mechanical components, the hybrid OLTCs have a high tolerance to network faults and low conduction losses. This OLTC type uses a low-rated power electronic circuit to bypass the main current path and switch to an alternate thyristor-based path when needed.
Many voltage controls have been developed based on various technologies, among which the most important are the Constant Voltage (CV) method and the Line-Drop Compensation (LDC) method.
The CV method [27,28] is represented by fixing the tap position for all time slots regardless of the load variation, being widely used by the DNOs through the power transformers with off-load tap changers to prevent voltage issues in the LVEDNs. However, it is not easy to identify the optimal solution due to the variations in the load and the PV penetration degree.
The LDC method [28,29,30] solves the decreased voltage issues based on the devices used to measure the voltage and the total current placed at the LV side of the EDS. The current measured is multiplied by the impedance calculated against a virtual load centre (VLC). The voltage of the VLC is computed using the difference against the voltage of the LV bus of the EDS. The OLTC modifies the tap to ensure that the voltage of the VLC remains at the same value as the reference voltage. It also uses a time delay and dead band to prevent sudden voltage changes. In the case of the active LVEDNs, the voltage control becomes more complicated, being difficult to respond to the effects of PV as they only consider the load's influence. As the PV capacity increases, the value of the current at the LV side of the EDS decreases. The small voltages can occur in the phase where only consumers are connected.
The DNOs' challenges are to bring the EDNs into the active area by integrating Artificial Intelligence techniques (expert systems, fuzzy logic, clustering, neural networks, etc.) and real-time communication solutions. This concept has led to the development of various approaches to solve many technical issues (including the voltage control) from the power system.
A comprehensive control system for Korea's power system has been presented for ultra-high networks by Lee et al. [31], where the control capabilities are more numerous than at the low voltage level. It utilized an expert system, which integrated a numerical subsystem containing power flow software to obtain a sensitivity matrix. The tree space of this parameter depends on the variable sensitivity of different power sources.
An expert system that can control the voltage level of a 20 kV EDN using the supervisory control and data acquisition (SCADA) system has been proposed by Pimpa and Premrudeepreechacharn [32]. This system can reduce the multiple voltage violations in the EDS and detect abnormal conditions at the buses from the EDN. The expert system focused on shunt reactive compensating devices and transformer tap change to select the most effective control for keeping the bus voltage in the entire system within limits. The weak point of this system is represented by a lack of distributed generation sources in the distribution network (this is a passive EDN). An expert system using the fuzzy logic-based remote monitoring system for a low-voltage network has been proposed in [33] to provide real-time monitoring of the over-voltage and under-voltage conditions at the end-users. The system is designed based on a Proteus simulator to communicate with devices that measure the voltage in passive LV EDNs, without the prosumers connected.
Mariaraja et al. [34] proposed an expert system for the reconfiguration process of an EDN using a hybrid Fuzzy-Flower Pollination Algorithm. This system can perform optimization in abnormal and normal operating conditions. Chen and Zhang developed an expert system that can reduce the frequency of the HVDC transmission system's integrated switching modules (IGBTs) using a modified Modular Multilevel Converter integrating a modified voltage balancing method [35]. They used the nearest level control for a 51-level modular multilevel converter. A simulation platform has been developed in SIMULINK - Matlab. Perera et al. proposed an optimal design and control method for an energy hub consisting of a battery bank, wind turbines, and solar photovoltaic panels [36]. Their structure can analyse the power flows in various components of an expert system, such as wind turbines and solar photovoltaic panels. The optimal operating regime is also determined considering the cost of electricity generated by renewable energy sources and the battery bank's state of charge.
Bennett et al. developed a hybrid expert system to handle the complexity of the LV network demand [37]. It combines a set of modules, such as clustering, correlation, and neural network, to forecast and analyse future energy demand. Faia et al. [38] proposed a case-based reasoning method integrated into the management application of the energy resources of residential buildings. The application can analyse the energy consumption database, identifying the optimal reduction level.
Kirgizov et al. presented in [39] a solution based on the real-time data collected from the distribution networks for the reactive power compensation. The suggested solution, integrated into an expert system, uses fuzzy logic and heuristic algorithms. The priority of the devices/equipment needing the reactive power compensation is determined based on fuzzy logic. The application allows the expert to take the appropriate steps to establish the optimal location of the devices.
Chelaru and Grigoras proposed in [40] a system expert-based decision-making framework to help the DNOs identify the most appropriate replacement transformer fleet solution according to the different priority categories. The expert system determines the order of the ageing transformers in a replacement ranking.

1.3. Main Contributions

The studies having as the research topic the decision-making tools integrating expert systems presented in the literature highlighted various approaches that solve different technical issues from the EDNs at various voltage levels. However, very few references refer to voltage control in the LV EDNs, which uses an expert system, and these with applications in the passive LV EDNs.
In this context, the authors propose an efficient and resilient voltage control solution based on an expert system to remove the over-voltage and under-voltage issues in the PV-rich LV AEDNs. The main contributions are the following:
  • Developing an expert system, including rule-based reasoning, with the main advantages: the "fast-scanning" of the input data, identification of voltage issues that come up, determination of a solution associated with the tap position of the OLTC that does not violate the voltage constraints in the PV-rich LV EDN based on the deviations between the reference voltage and the voltages recorded in the nodes in each time slot recognizing the excesses of the allowable limits, regardless of the power flow's direction. The main characteristics of the proposed system are efficiency and resilience. Efficiency has associated with the ability to meet the demands of the end-users regarding voltage quality. Regarding the second characteristic, it covers the capacity to respond to sudden voltage variations due to the intermittent regime of the PV prosumers.
  • Designing a data management framework including a real-time query procedure that uploads data from the smart metering and network data systems and saves them in two partitions (static and dynamic) from the knowledge database. The design allows a high speed of data processing.
  • Performing an in-depth analysis in a real LV EDN belonging to a Romanian DNO based on more scenarios characterized by the three indicators: penetration degree of the PV prosumers, consumption evolution associated with the consumers, and energy production of the PV systems installed to the prosumers. The number of combinations between the possible values of the three indicators led to 75 scenarios that cover all spectrums of the operating regimes of the LV EDNs.

1.4. Paper Organization

The paper includes the following sections: Section 2 presents the materials and methods used to develop the structure of the proposed expert system, including rule-based reasoning; Section 3 corresponds to the case study where an in-depth scenario-based analysis has been performed in an LV AEDN from a rural area from the east of Romania; and Section 4 retains the discussions and conclusions, also highlighting the limits of the proposed approach and the future work.

2. Materials and Methods

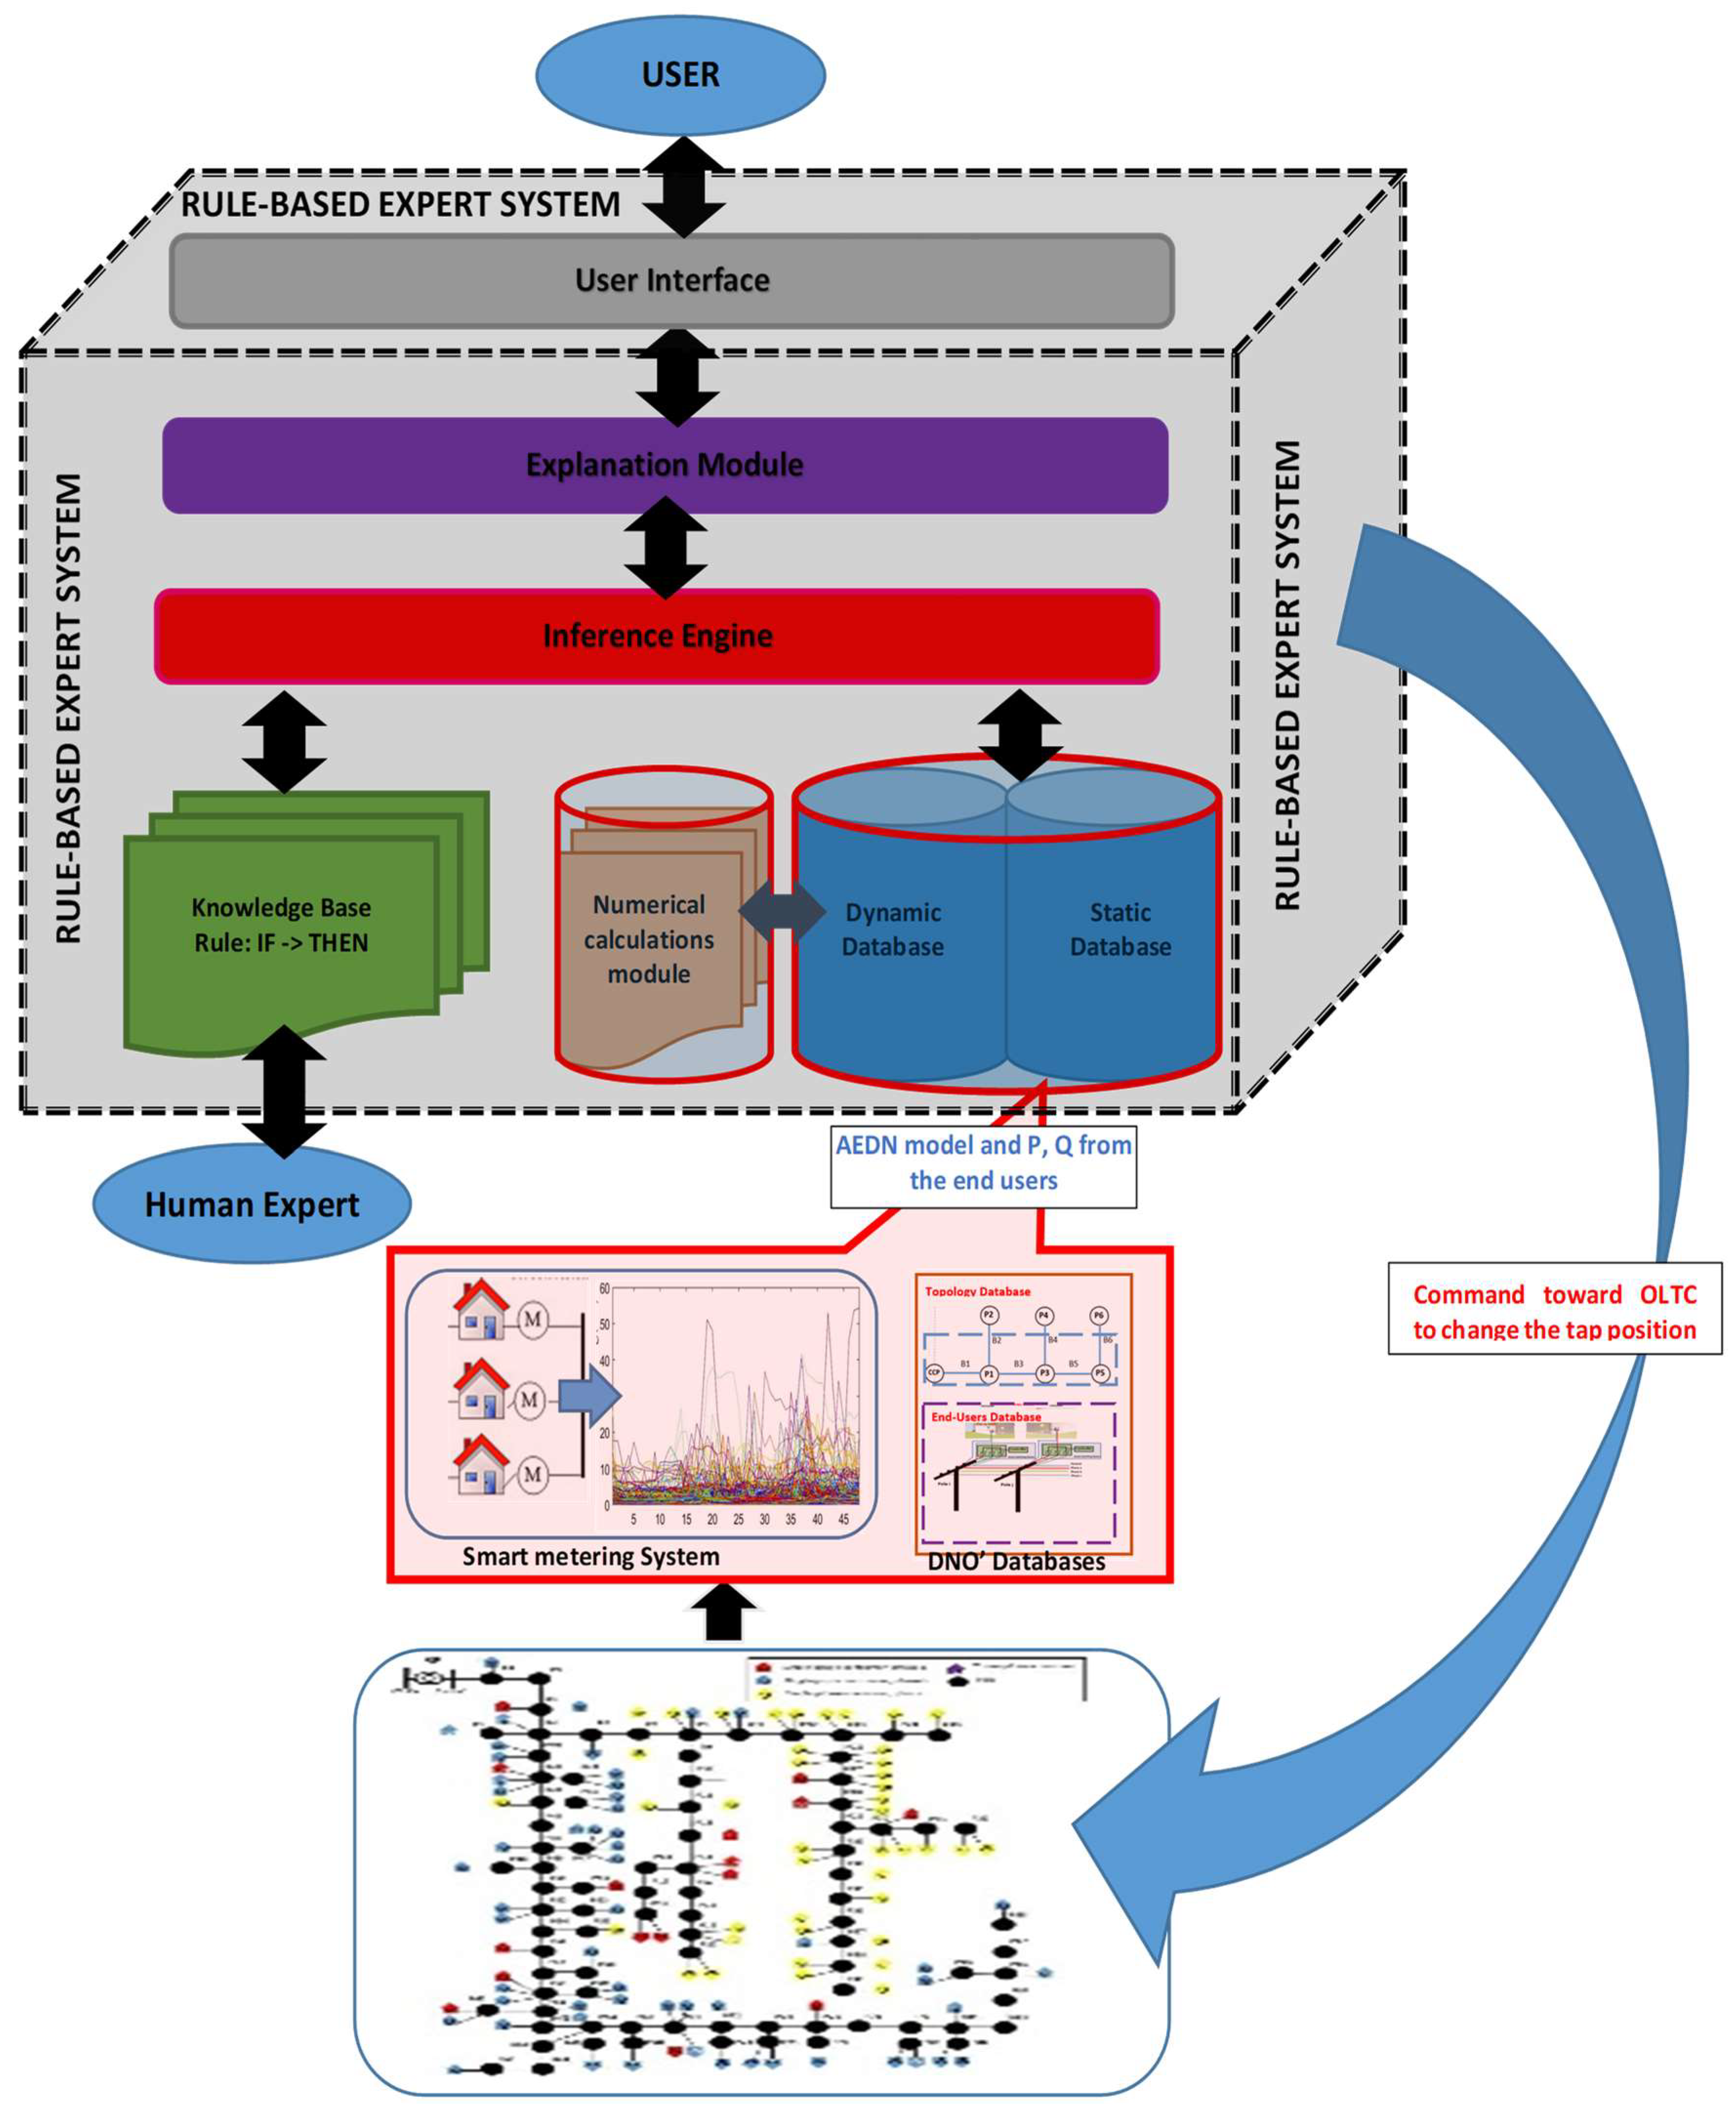
A rule-based expert system (RBES) is an Artificial Intelligence component that uses knowledge-based rules to perform an activity [41]. Their design is similar to an advanced computer program that tries to mimic the capabilities of a human expert by collecting knowledge sources used to perform an objective in a particular domain [38,41]. Thus, knowledge is taken from the human expert and converted into a production rule set representing the domain knowledge. Their main components are the following: knowledge base module, inference engine, decision-making module, explanation facilities, and user interface.
Figure 2. The structure of the proposed RBES used in the voltage control from the LV AEDNs.
Preprints 70479 g002
The knowledge database of the proposed expert system includes two categories: the rule base and the database. The rule base stores rules and facts, while the second, divided into static and dynamic partitions, is associated with recording the immutable facts. The static partition of the database contains information on the features of the LV AEDNs regarding:
  • line sections characterized by the input and end nodes, type (aerial/underground), cross-sections of the phase, and neutral conductors;
  • MV/LV distribution transformers from the EDSs characterized by rated power, performance standards identified through the commissioning year, tap changer type (NLTC/OLTC), and tap positions;
  • reactive power compensation devices identified through the installed capacity, type (capacitor banks or static VAR compensator) and their locations;
  • energy storage systems are identified through the installed capacity and their locations.
  • end-users characterized by type (single-phase/three-phase), the location in the AEDNs (the connection pillars), the connection phase (for single-phase end-users);
  • energy generation systems installed to the prosumers characterized by the installed capacity.
The RBES uses the data communication between the smart meters installed at all end-users and the data concentrator installed in the MV/LV EDS. These data form the dynamic database of the RBES, together with the outcomes of the steady-state calculations, represented by the values of the voltage from the nodes:
  • upper and lower allowable limits of the voltages imposed by the quality power standards;
  • information from the smart metering system associated with the injected/requested powers by the end-users (prosumers/consumers) at the fixed time slots (depending on setting the sampling step of the smart meters), the annual energy production/consumption;
  • values of the nodal voltages, power flows, and power losses resulted from the steady-state calculations performed with a performance algorithm characterized by fast convergence and reduced calculation time considering the topology of the AEDNs identified through the data recorded in the static database at the request of the inference engine.
The inference engine accesses the data that, through the rule-based motivation, decide whether to modify or not the tap position of OLTC such that all voltages are inside the allowable limits fixed by the DNO. In the RBES, an IF-THEN production rule set represents the domain knowledge, and data are associated with a fact set about the current situation. The data and rules are then compared with the facts in the database. When the conditions of the rule match a fact, the system fires the rule and its active component is executed. A code that has the following syntax,
"IF conditions, THEN actions."
belongs to each rule.
The rule-based reasoning method, integrated into the inference engine and used to analyse the data, is based on the following approach. The knowledge base contains the rules designed to guide the system in performing its task (suitable voltage level according to the power quality performance standard). Thus, the expert system has the goal and the inference engine attempts to find the evidence to prove it. First, the knowledge base is interrogated to find rules that might lead to the desired solution. Such rules must have the goal in their THEN (action) parts. If such a rule is found and the part of the condition associated with IF matches data in the database, then the rule is fired, and the goal is proved.
The information collected during a time slot s by smart meters (active and reactive powers) installed to the end-users (prosumers and consumers) is sent to the data concentrator from the EDS level through the communication system. The data belong to an operation regime of the AEDN where the tap position of the OLTC, identified by the variable α, corresponds to the previous time slot (s-1), with s = 1, …, S, S representing the analysed period.
The RBRS establishes the tap position of the OLTC starting with the time slot s, s = 1, …, S, based on the data obtained from the steady-state calculations performed with a fast algorithm [42] using the tap position from the time slot (s-1), α(s-1), and the information from the database (static and dynamic). The next step confirms that the data are available to determine the extreme values (minimum and maximum) of the voltage at the level of LV AEDN.
V s , α ( s 1 ) min   = min γ { γ a , γ b , γ c } { V e , s , α ( s 1 ) { γ } } , V s , α ( s 1 ) max = max γ { γ a , γ b , γ c } { V e , s , α ( s 1 ) { γ } }   e = 1 , ... , NE ,     s = 1 , ... , S ,   α = 1 , , A
where:
γ – the index used to identify one of the three phases γ a , γb , γc};
NE – the variable referring to the total number of the nodes from the AEDNs;
e – the index associated with a certain node from the AEDN;
A – the upper tap of OLTC;
α – the index corresponding with the tap position in a certain time slot;
S – the total number of the time slots defined in the analysed period;
s – the time slot identified in the analysed period S;
V e , s , α ( s 1 ) ( γ ) – the voltage on the phase, γ, γ a , γb , γc} calculated in each node e, e = 1, …, NE, for the time slot s, s = 1, …, S, and the tap position α associated with the time slot s-1;
V s , α ( s 1 ) min , V s , α ( s 1 ) max – the extreme values of the voltages from the AEDN (regardless of the phase) determined from the time slot s, and the tap position α associated with the time slot (s-1).
The voltage control in each time slot s refers to an iterative process having the stop criterion associated with the extreme values (minimum and maximum) of the voltage at the level of AEDN, which must be between allowable limits:
V s , α ( s 1 ) min   V a min , V s , α ( s 1 ) max   V a max ,   s = 1 , ... , S ,   α = 1 , , A
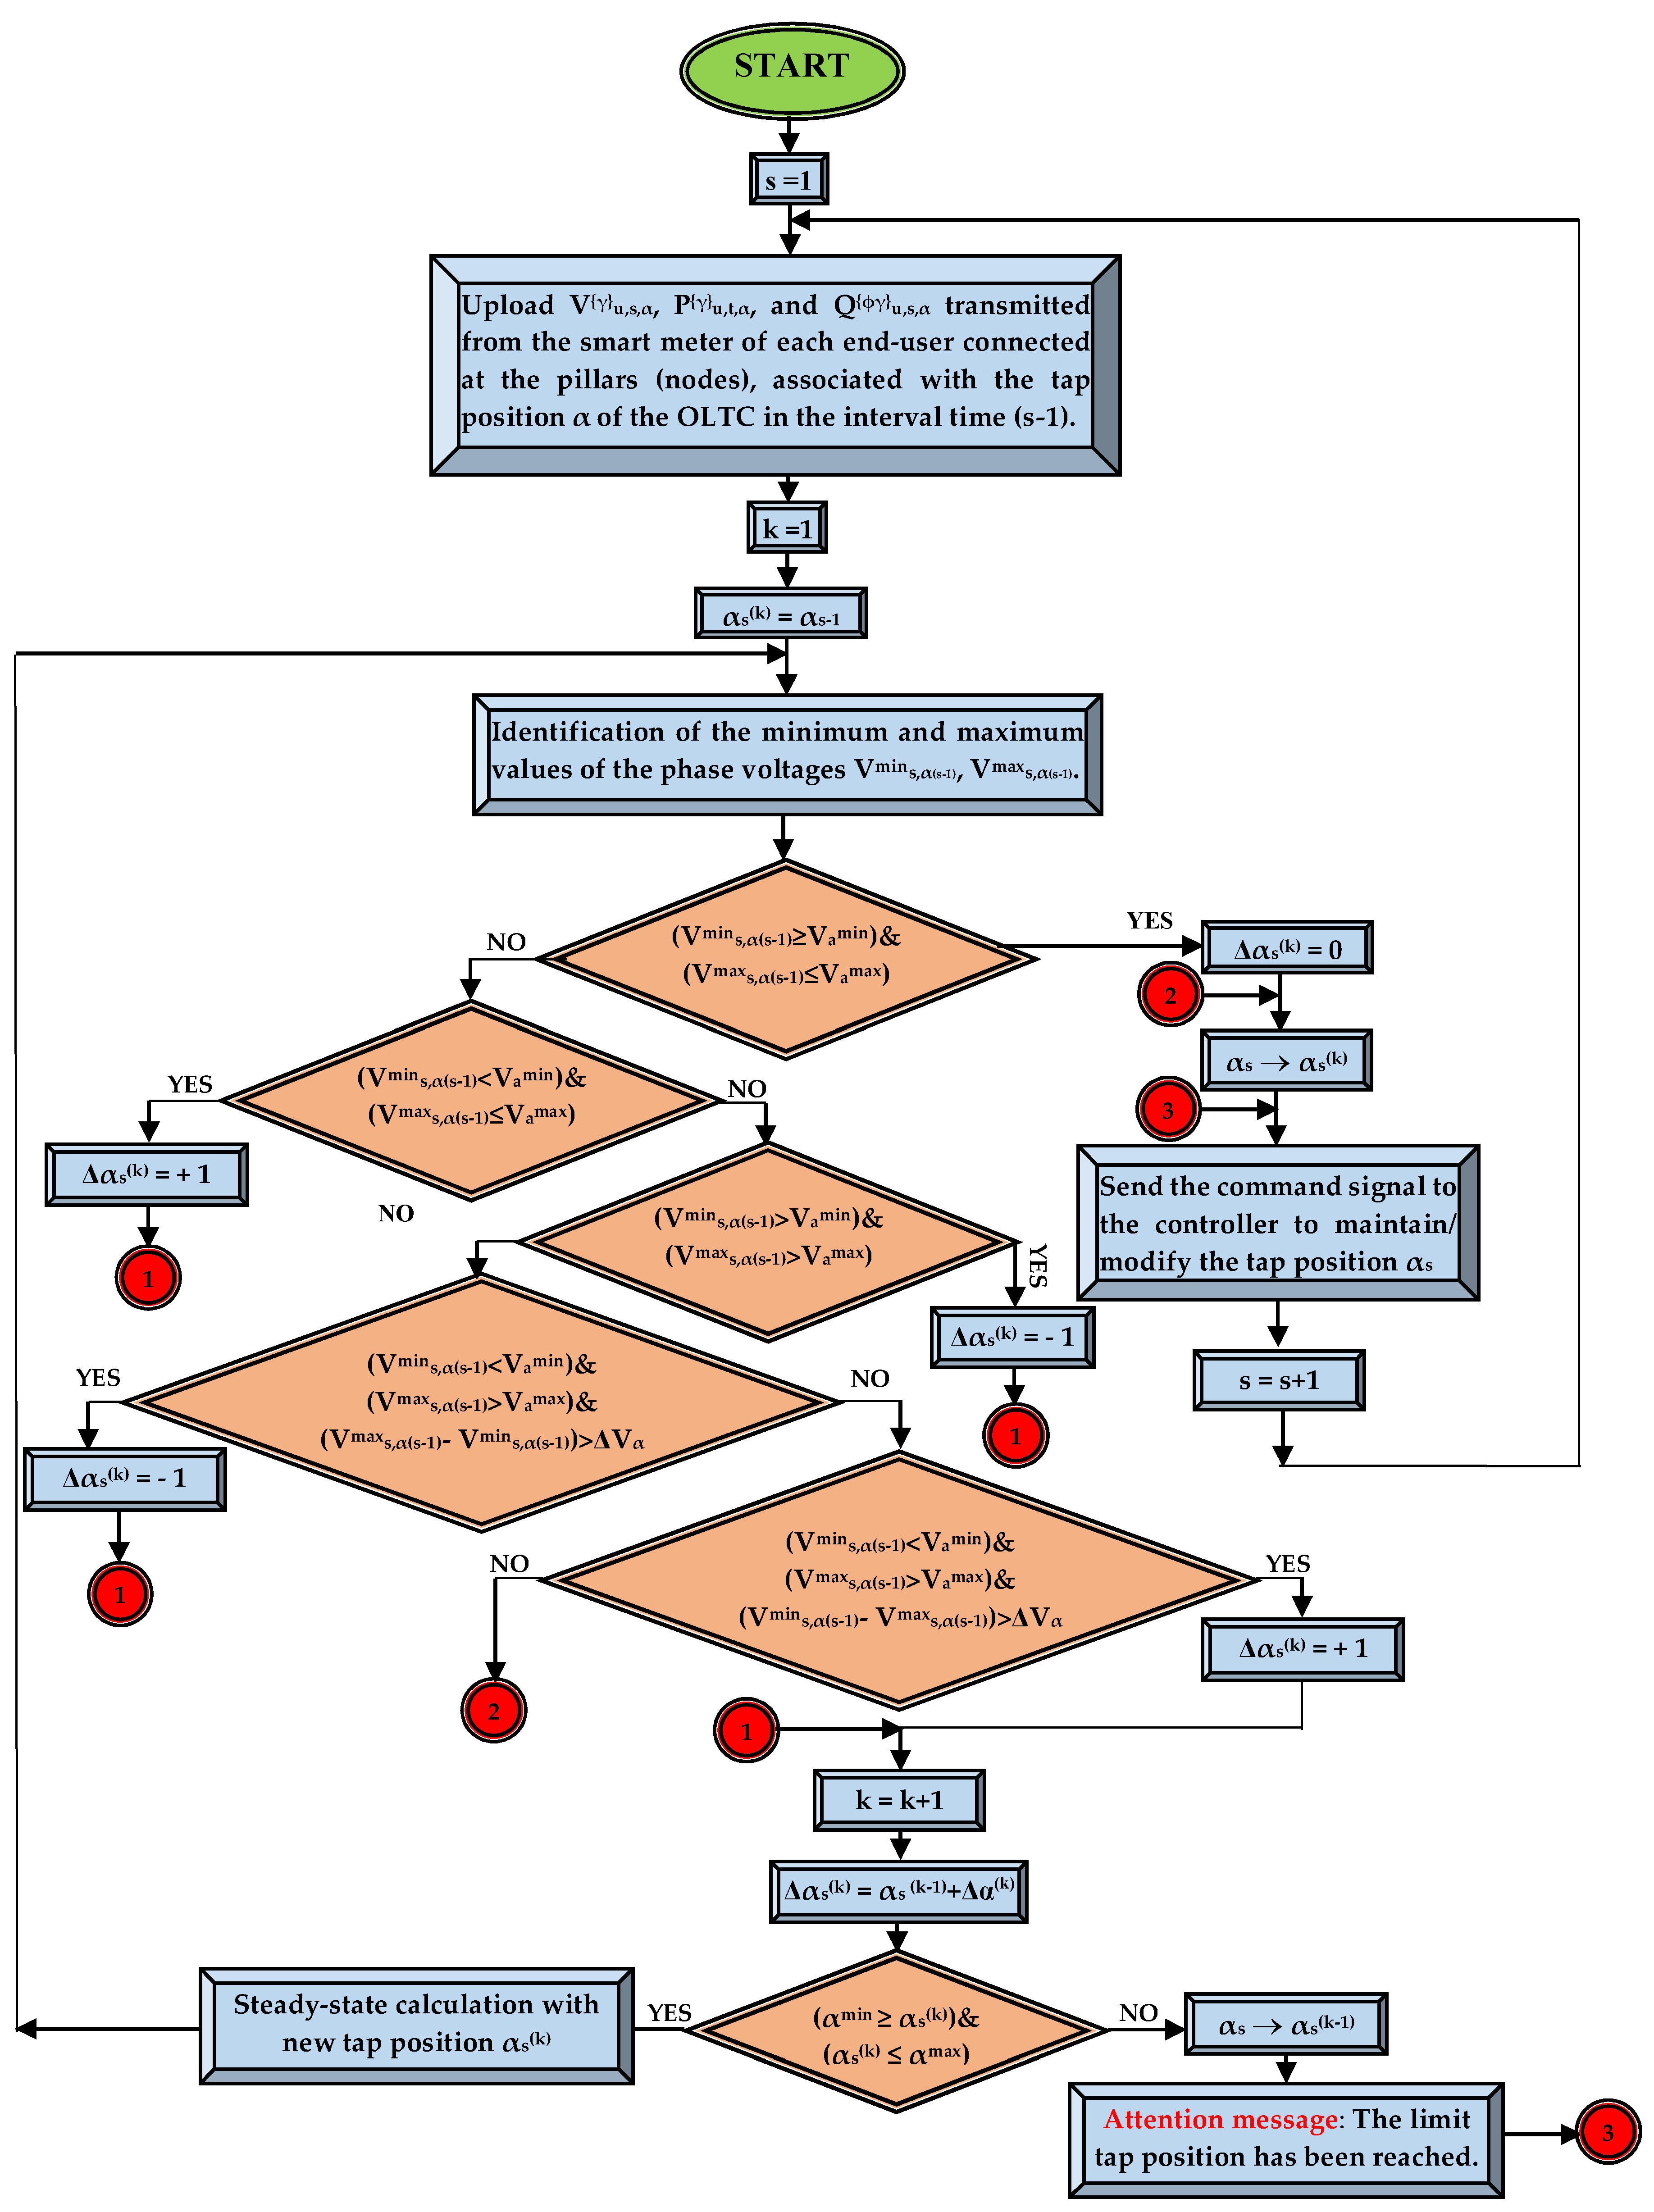
If the extreme values Vmins,α(s-1), Vmaxs,α(s-1) exceed the allowable limits (Vmina and Vmaxa) specified in the power quality performance standard, then the tap position is modified with a step Δαs(k) in each iteration k of the time slot s based on the following rules [26,43]:
IF   { ( V s , α ( s 1 ) min < V a min )   A N D     ( V s , α ( s 1 ) max V a max ) } T H E N Δ α s ( k ) = α ( s 1 ) + 1
I F   { ( V s , α ( s 1 ) min V a min )   A N D     ( V s , α ( s 1 ) max > V a max ) } T H E N Δ α s ( k ) = α ( s 1 ) 1
I F   { ( V s , α ( s 1 ) min < V a min )   A N D   ( V s , α ( s 1 ) max > V a max )   A N D   ( ( V s , α ( s 1 ) max V s , α ( s 1 ) min ) > Δ V α ) } T H E N Δ α s ( k ) = α ( s 1 ) 1
I F { ( V s , α ( s 1 ) min < V a min )   A N D   ( V s , α ( s 1 ) max > V a max )   A N D   ( Δ V s , α ( s 1 ) min Δ V s , α ( s 1 ) max > Δ V α ) } T H E N Δ α s ( k ) = α ( s 1 ) + 1
where:
Δ V s , α ( s 1 ) min = V a min V s , β ( k ) max ,   s = 1 , , S ,   α = 1 , A
Δ V s , α ( s 1 ) max = V s , α ( s 1 ) max V a max ,   s = 1 , , S ,   α = 1 , A
ΔVα represents the voltage changes per tap.
But, the tap position can be modified if the constraints regarding the dead band (DB) of the OLTC are satisfied [44]:
( V s , α ( s 1 ) max V r V r ) > D B ; ( V r V s , α ( s 1 ) min V r ) > D B ; s = 1 , , S ,   α = 1 , A
where: Vr is reference voltage.
When the voltage deviation exceeds DB (having value ΔVα/2), the tap position can be changed. The use of the deadband can avoid the effects of unnecessary tap-changing operations.
Figure 3 presents the flow chart of the voltage control using rule-based reasoning.
The user can ask the expert system how it reaches a particular conclusion through the explanation facilities, which allows one to understand the reasoning behind the decision. The RBES can provide a credible and effective solution based on a clear explanation of its analysis and guidance. The proposed guidance is systematic, evaluating the effects of the voltage control on the operation of the LV AEDN, avoiding conflicts between the rules. Although these components represent the core of the RBES, additional parts could be integrated. One of these is the external interface that allows the RBES to interact with other programs and data files used commonly by the DNOs (smart metering, SCADA, Demand Management System).
The main characteristics of the proposed RBES are efficiency and resilience. Efficiency is the ability to meet the demands of the end-users regarding voltage quality. Regarding the second characteristic, it covers the capacity of the RBES to respond to harmful events associated with sudden voltage variations due to the intermittent regime of the small-scale renewable sources (prosumers).

3. Results

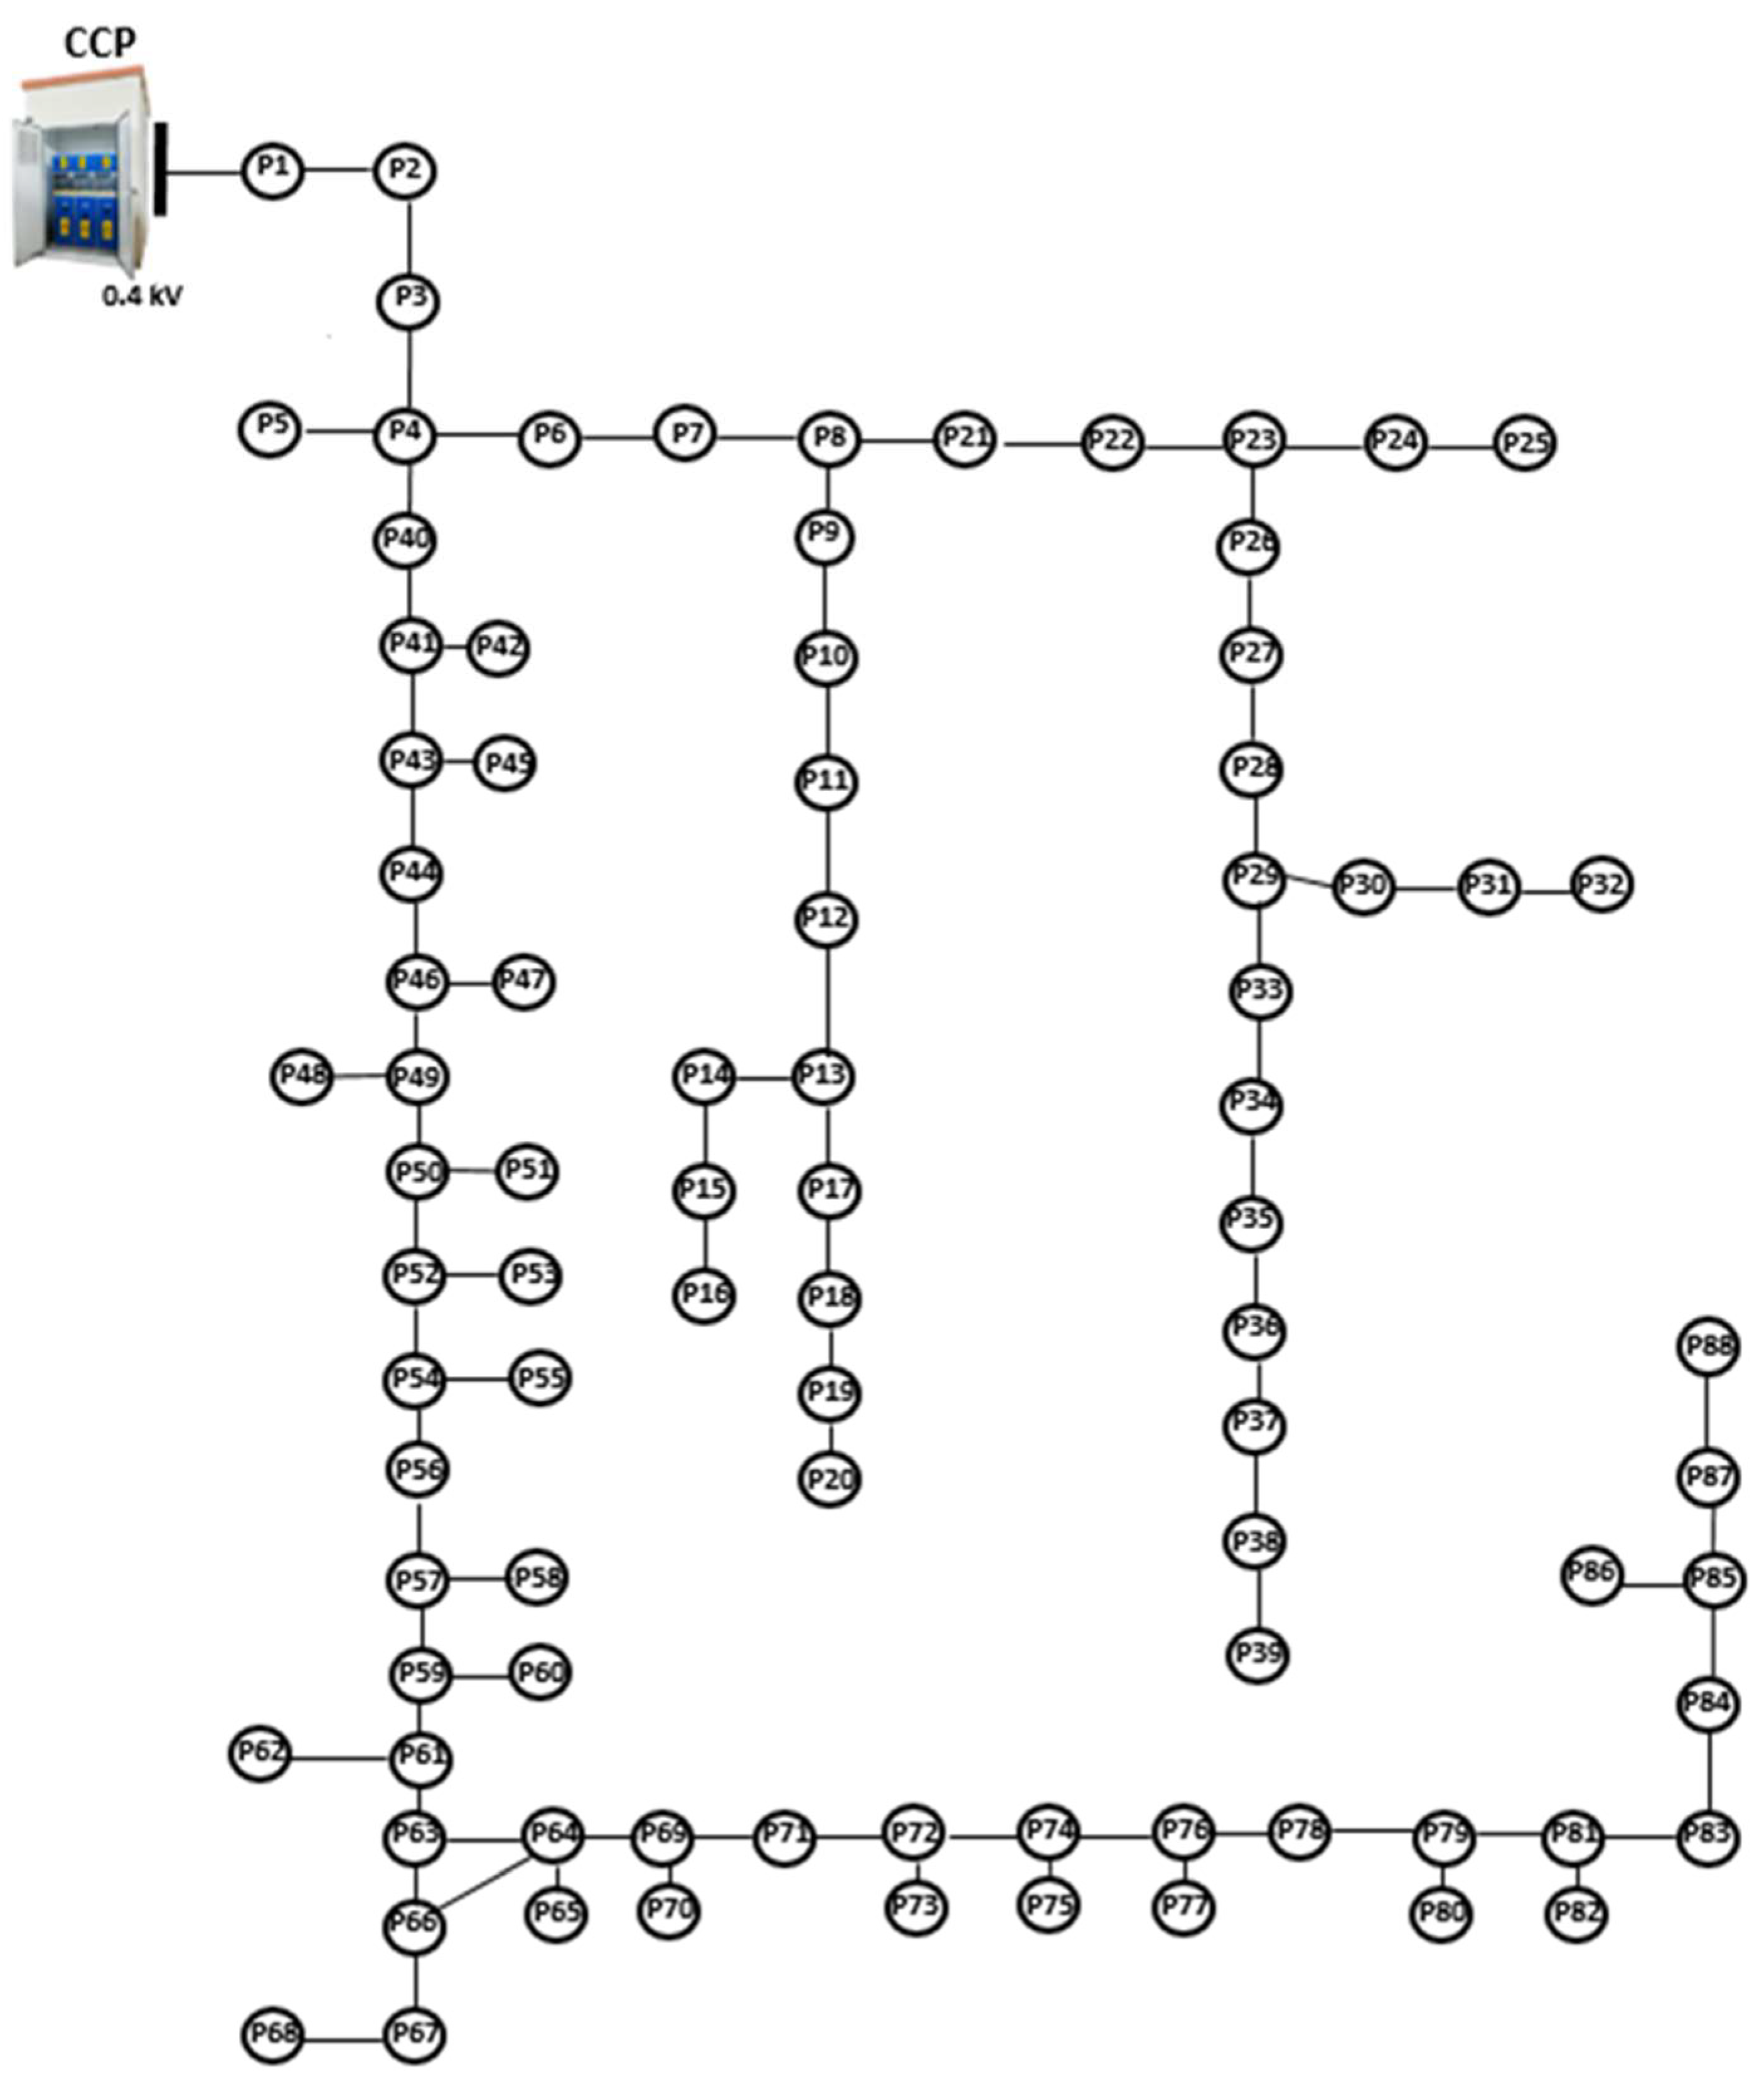
The proposed RBES has been tested considering an aerial LV EDN supplied by an EDS whose MV bus (20 kV) represents the CCP with the network of a Romanian DNO that carries out its distribution service in the respective area. Figure 4 shows the structure of the test LV EDN.
The EDS contains an MV/LV (20/0.4 kV) distribution transformer, having the following technical features associated with a Tier 2 transformer [45]:
  • rated power, Sr = 250 kVA;
  • load power loss, ΔPl = 2.35 kW;
  • no-load power loss, ΔPnl = 0.27 kW;
  • OLTC with 9 taps (tapping range ±10%), where the median tap is 5, voltage step 2.5%, and the number of tap operations without maintenance is 700,000 [43].
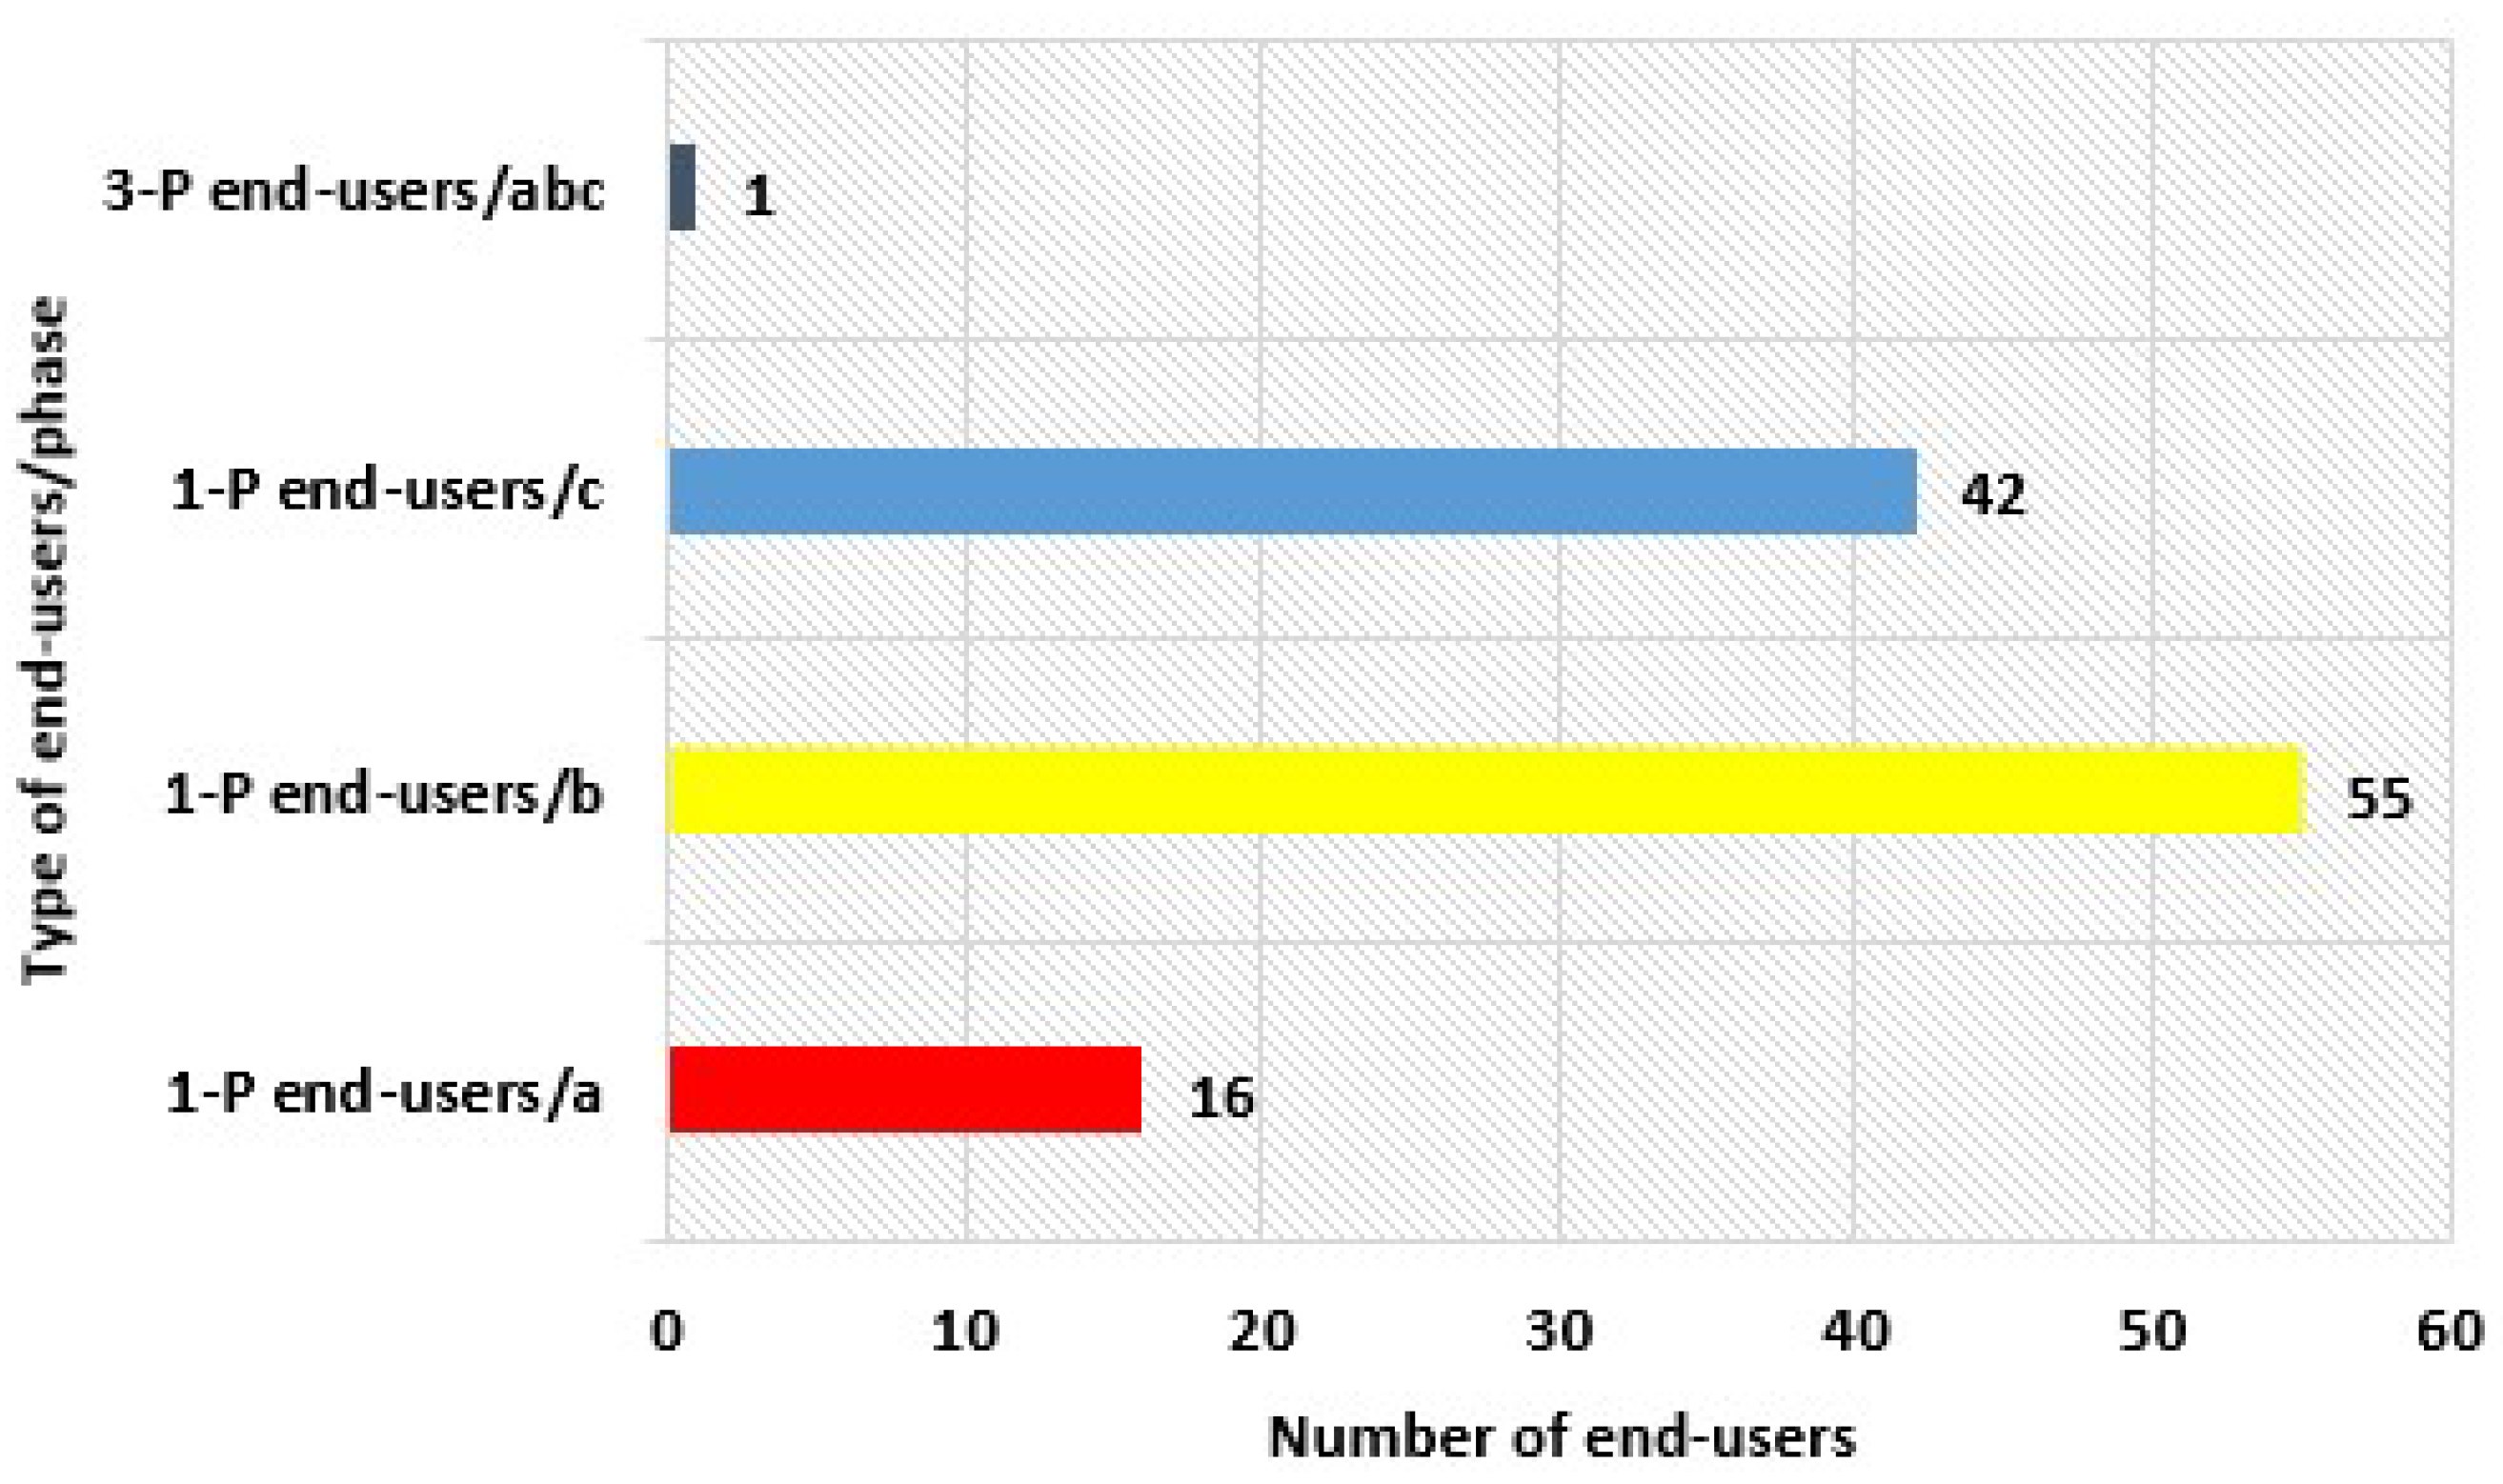
The LV EDNs is an aerial network with four conductors (three phases and a neutral) having detailed features in Table 1, to which 114 end-users are connected at the three phases and presenting the distribution from Figure 5.
The total length of the network is 3.52 km having two types of conductors (classical and stranded). The sections with the classical conductor have 3.4 km, representing 96.6% of the total length). The most common cross-section is 50 mm2 (mainly on the trunk of the network, P1 – P88), representing 62.5%, followed by 35 mm2 and 25 mm2 (found on the lateral branch, P4 – P39).
All end-users are integrated into the Smart Metering System, and the data regarding the consumed active and reactive powers are available. The sampling step set for all smart meters to send this information to the data concentrator is 60 minutes.
Localization of the network is in an area where the solar potential is very high, so it is expected that the number of consumers who want to become PV prosumers will increase a lot, considering the situation in Romania. According to the last report of the Romanian Energy Regulatory Authority (RERA) published in 2022 [46], the prosumers increased more than 6 times in 2021, from 2134 to 13,596. On the other hand, the reports of the RERA regarding the evolution of energy consumption from 2020 – 2022 [47] highlighted a decrease at the residential consumer level by approximately 10%. This decrease was due to two factors associated with the pandemic crisis and geopolitical (the war in Ukraine and the energy crisis).
In this context, more scenarios have been considered characterized by the following indicators: penetration degree, PD, PD {0%, 10%, 20%, 30%, 40, and 50%}; consumption evolution, CEC, CEC {-10%, - 5%, 0%, +5%, +10%}; and energy production of the PV systems from the month which includes the analysed day, EPPV, EPPV { m EP PV - 2 x σ EP PV , m EP PV , m EP PV + 2 x σ EP PV }, where m EP PV and σ EP PV represent the mean and standard deviation of the energy production (EP) associated with a PV system from the geographical area where the LV EDN is located, having a certain installed capacity for a month from a year (in our case, June). Knowing the values m EP PV and σ EP PV , EPPV with probability (confidence level) 0.95 belonging to the interval [ m EP PV - 2 x σ EP PV , m EP PV + 2 x σ EP PV ] (confidence interval) has been considered. This means that, in almost all cases, the frequency will not go beyond the specified interval. Even in 5% of cases, the errors will be minor [48].
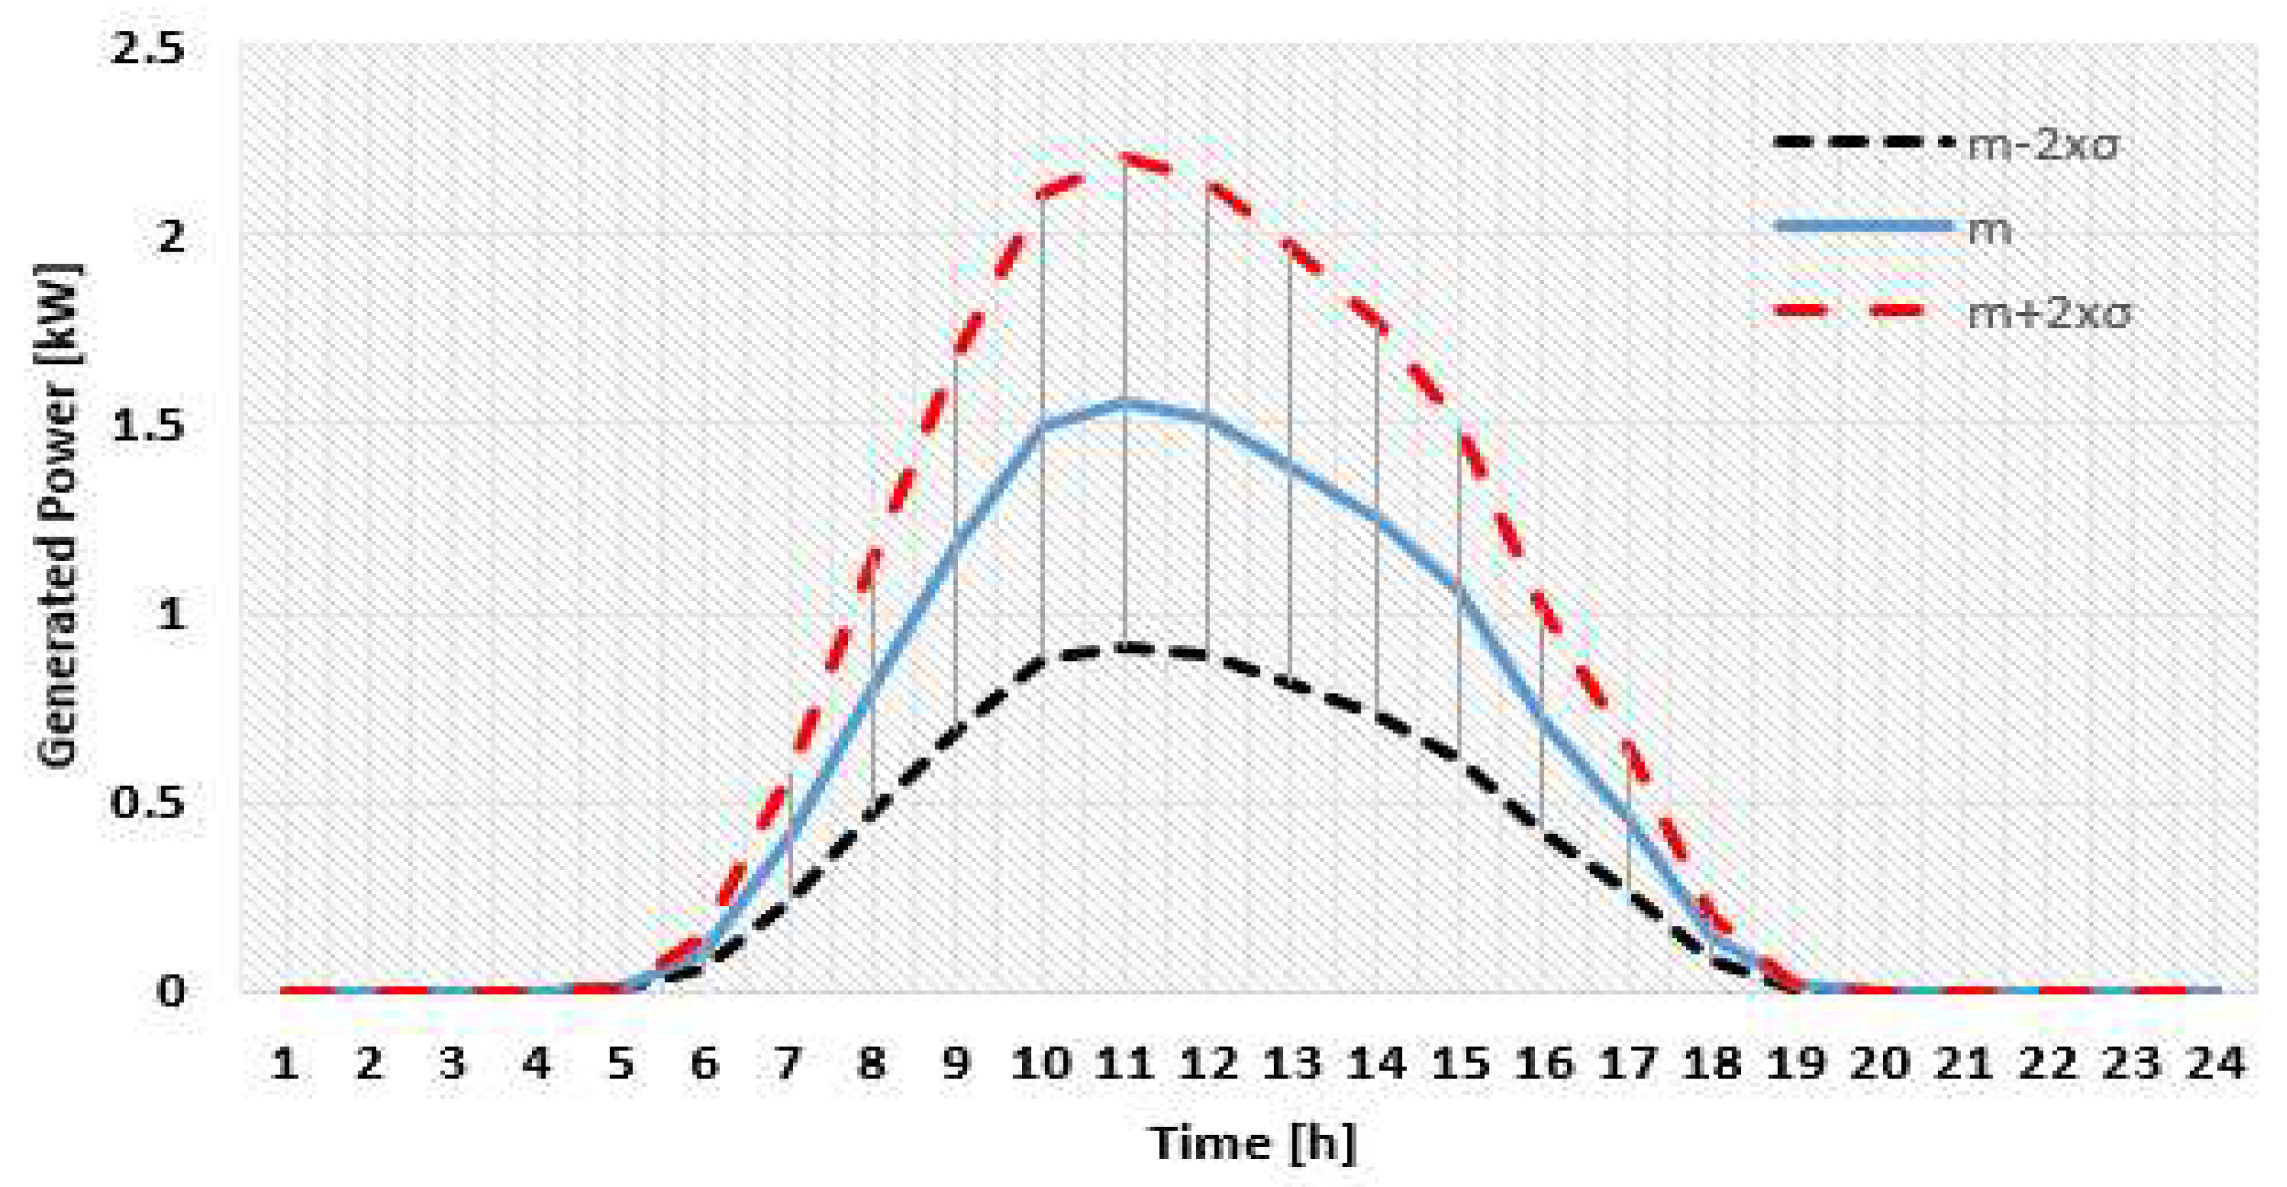
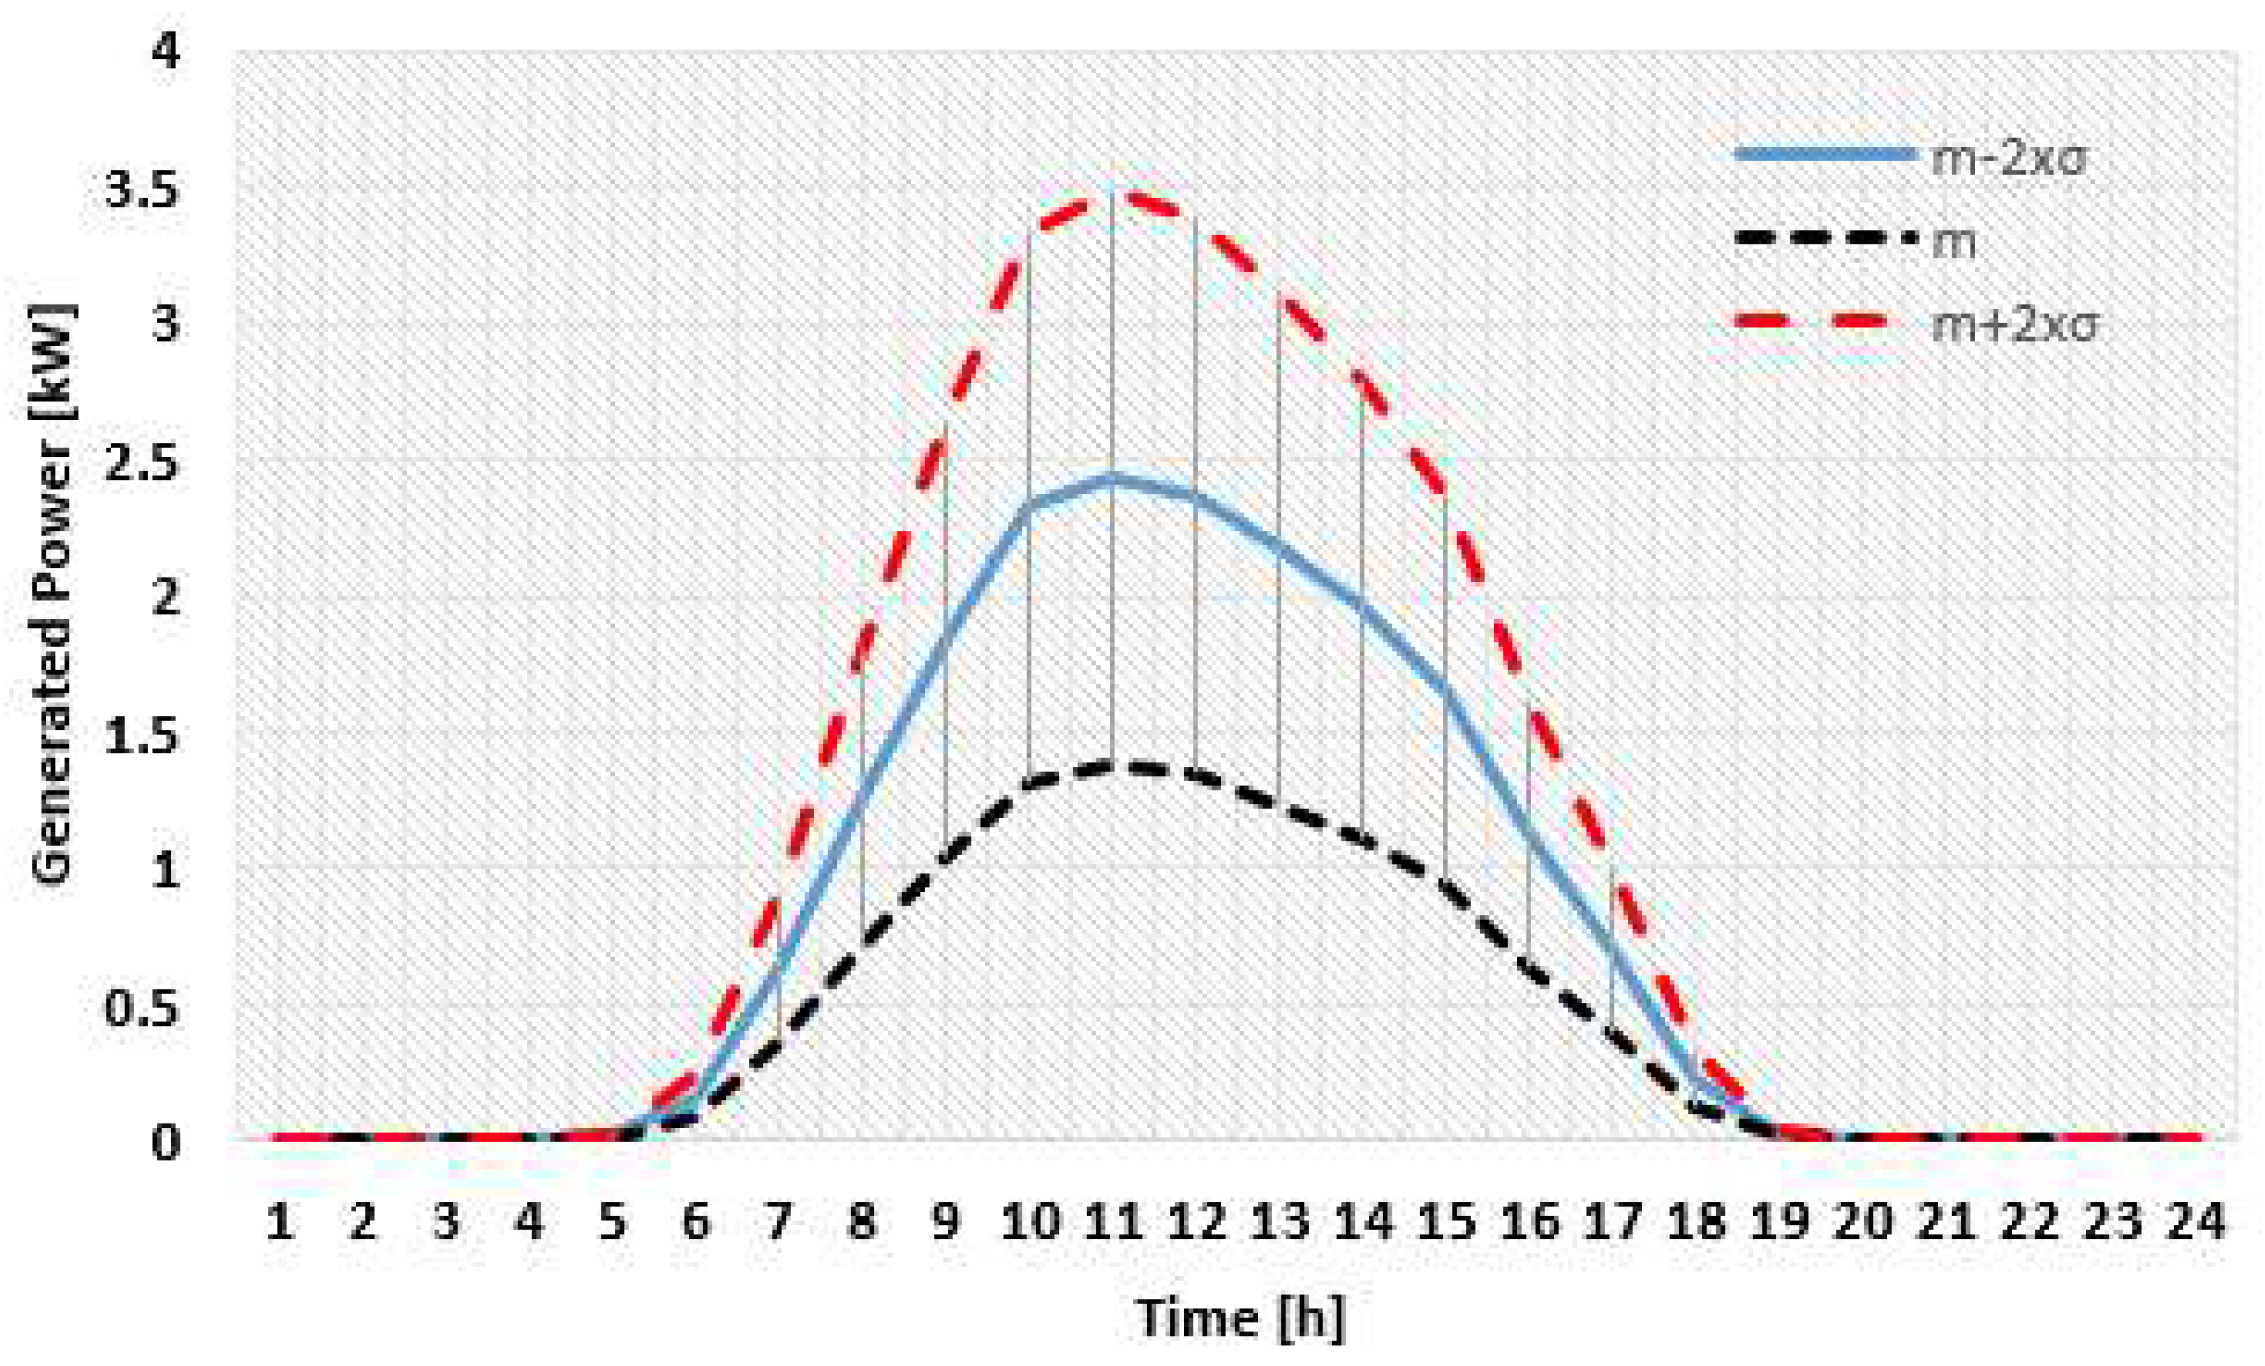
The study analysed the penetration degrees considering the assumption that the consumers with the highest energy consumption are qualified and selected to become prosumers, maintaining their connection phase. Table A1 from Appendix A presents the allocation of the end-users, classified as consumers and prosumers, at each pillar associated with the five penetration degrees, PD {0%, 10%, 20%, 30%, 40, and 50%}. Considering the energy consumptions uploaded from the SMS, the PV systems have been sized (having the installed capacities of 3 and 5 kWp ) based on the generation profiles from the geographical location of the LV EDN uploaded from the PVGIS tool [49]. Another assumption refers to prosumers who do not have energy storage systems, representing the current situation in Romania. Figure 6 and Figure 7 present the generation profiles of the two PV systems (3 and 5 kWp), m EP PV - 2 x σ EP PV (low energy production), m EP PV (average energy production) and m EP PV + 2 x σ EP PV (high energy production), determined for June and used in the analysed scenarios.
The number of the scenarios (SC) obtained from the combinations between the three indicators is NSC = PD x CEC x EPPV = 5 x 5 x 3 = 75, see Table 2, to which is added the base scenario (S0), represented by the current situation where PD = 0, CEC = 0, and EPPV = 0.
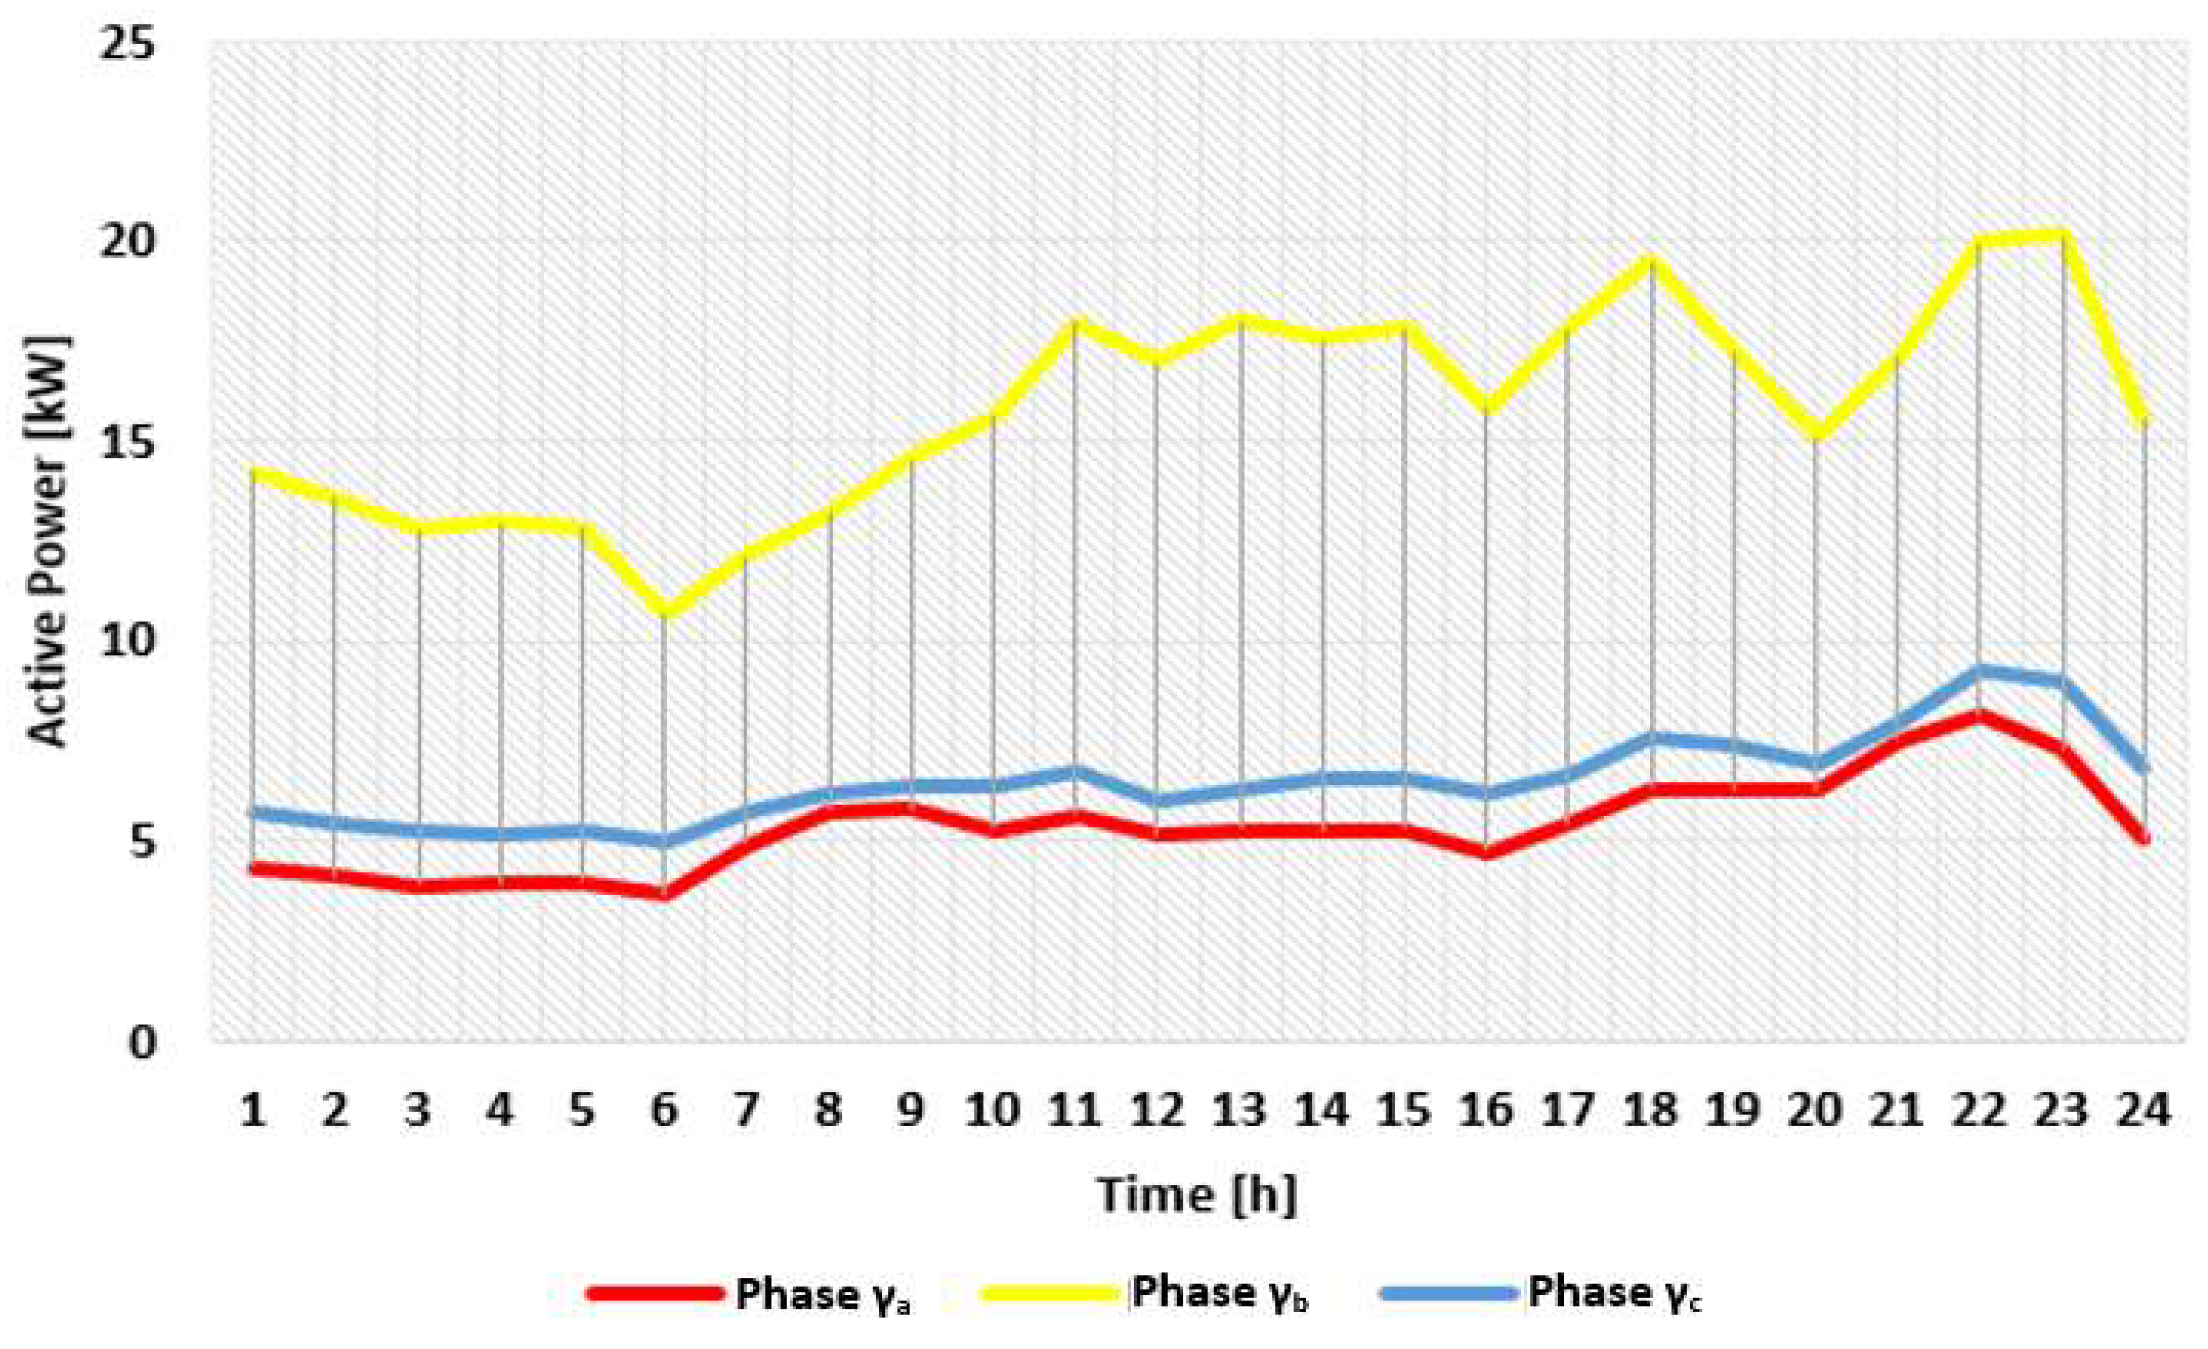
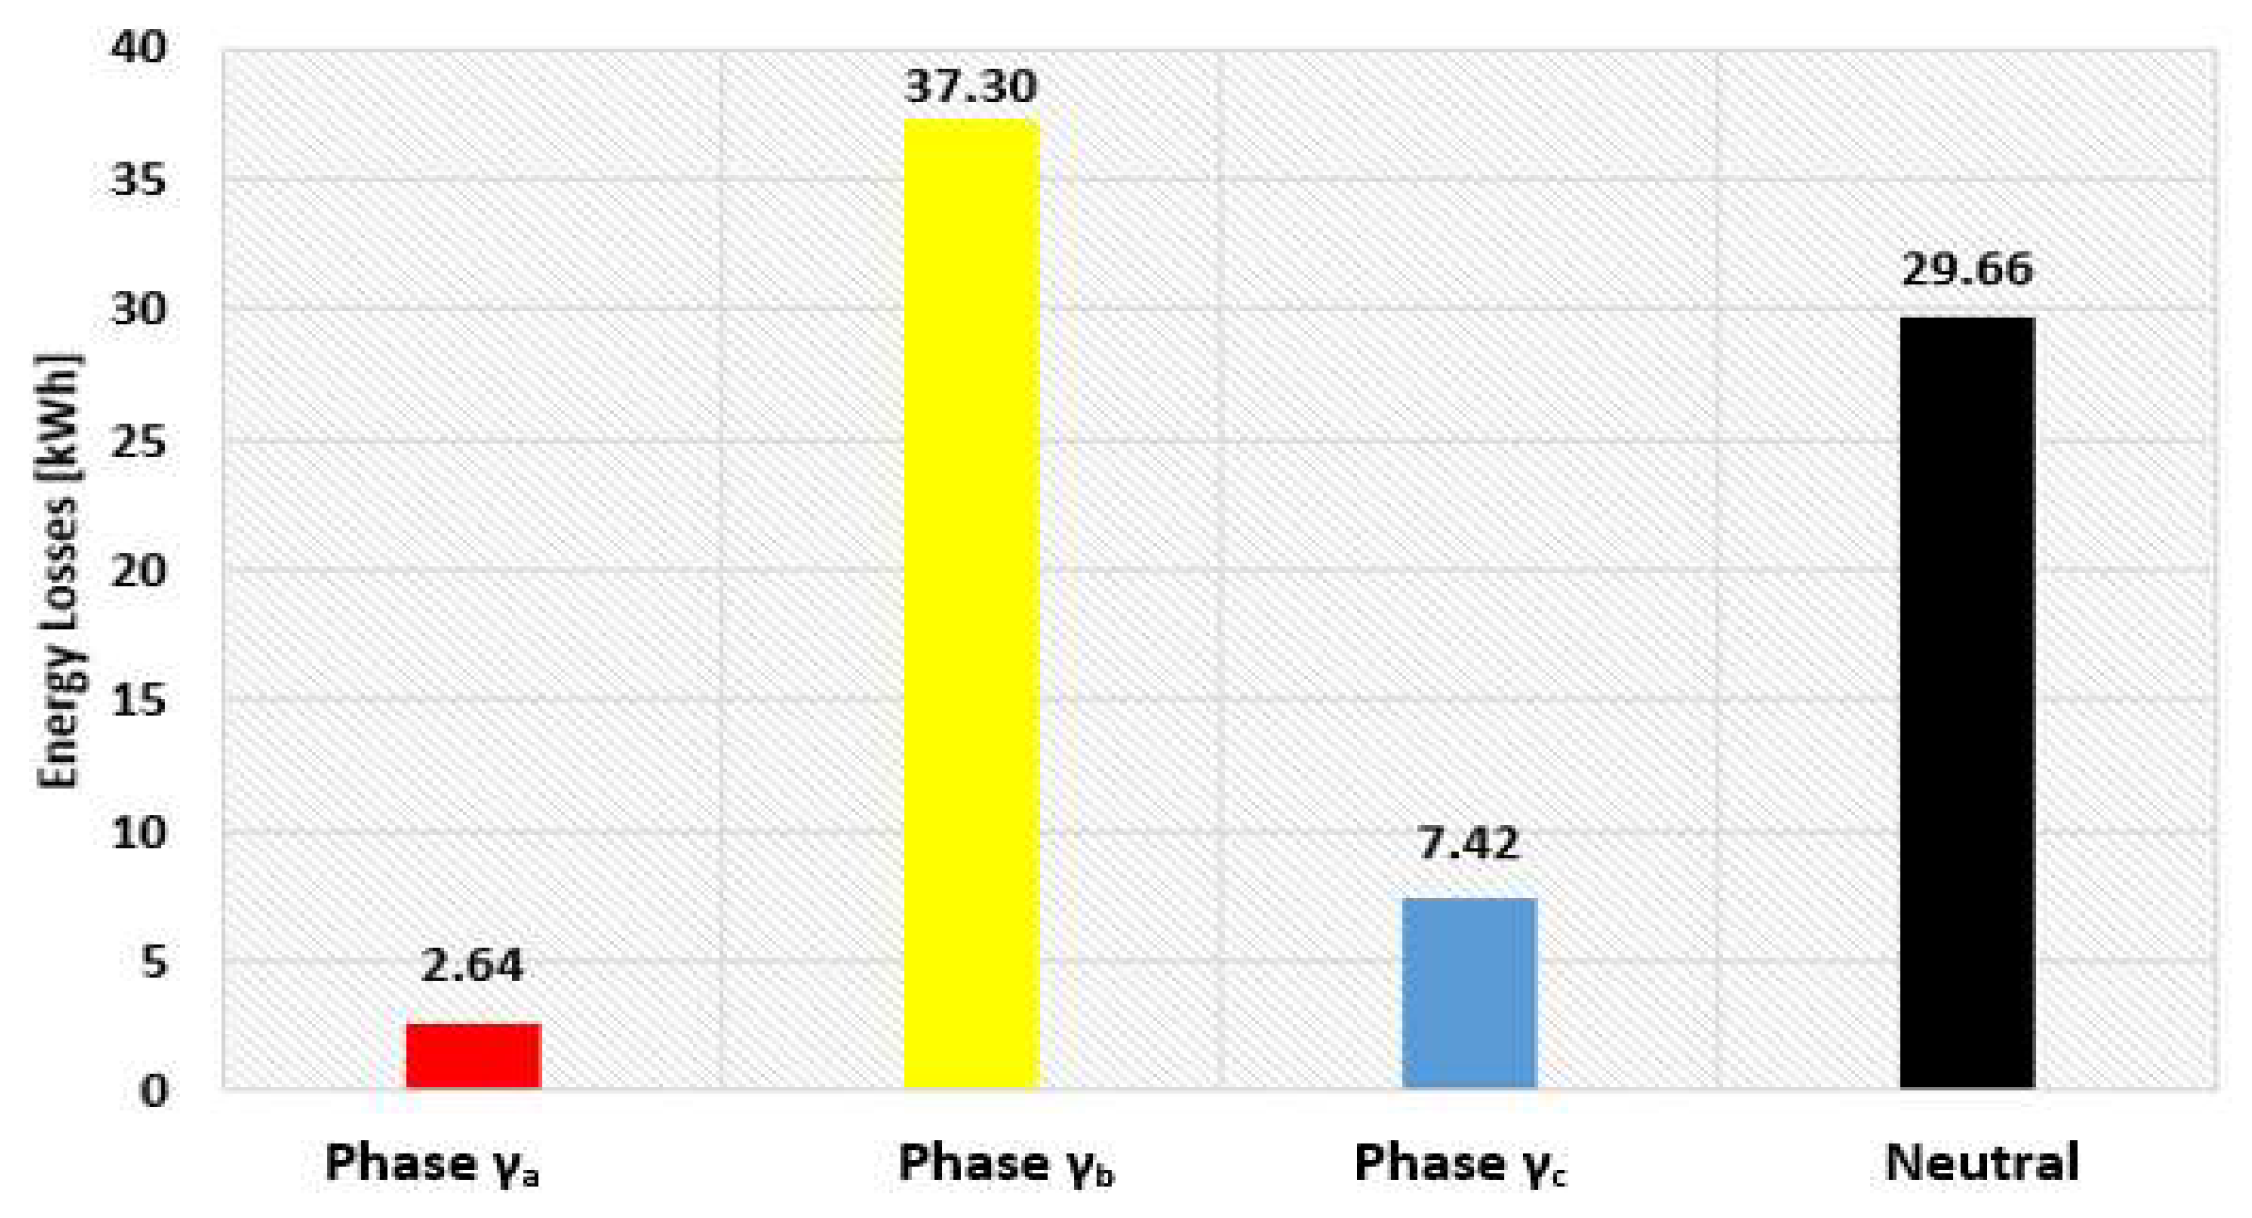
The MV side of the EDS represents in our study the slack node used in the steady-state calculations, but all results will refer only to the low voltage part to highlight the impact of RBES on the AEDN. Figure 8 presents the aggregation of the active powers at the LV level (0.4 kV) of the EDS for the analysed day from June associated with scenario S0 in the case study. In this scenario, the OLTC operates on tap αs = 8 regardless of the time slot s, s = 1, …, 24. The high differences between loads of the three phases can be observed, with an unfavourable effect on the energy losses in the LV AEDN due to the pronounce unbalance degree reflected on the additional circulations in the neutral conductor, see Figure 9.
The highest energy losses are in the conductor from the phase γb (48.4%), followed by neutral (38.5%), phase γc (9.6%), and phase γa (3.4%), where the values have been reported to the total energy losses (77.03 kWh). The energy losses contain only the component associated with the losses in conductors. However, the LV EDNs with the high unbalance degree represents a common feature of the Romanian distribution system, indicating that the DNO should solve the unbalance issue before integrating prosumers that could cause additional issues, as will be presented in the following.
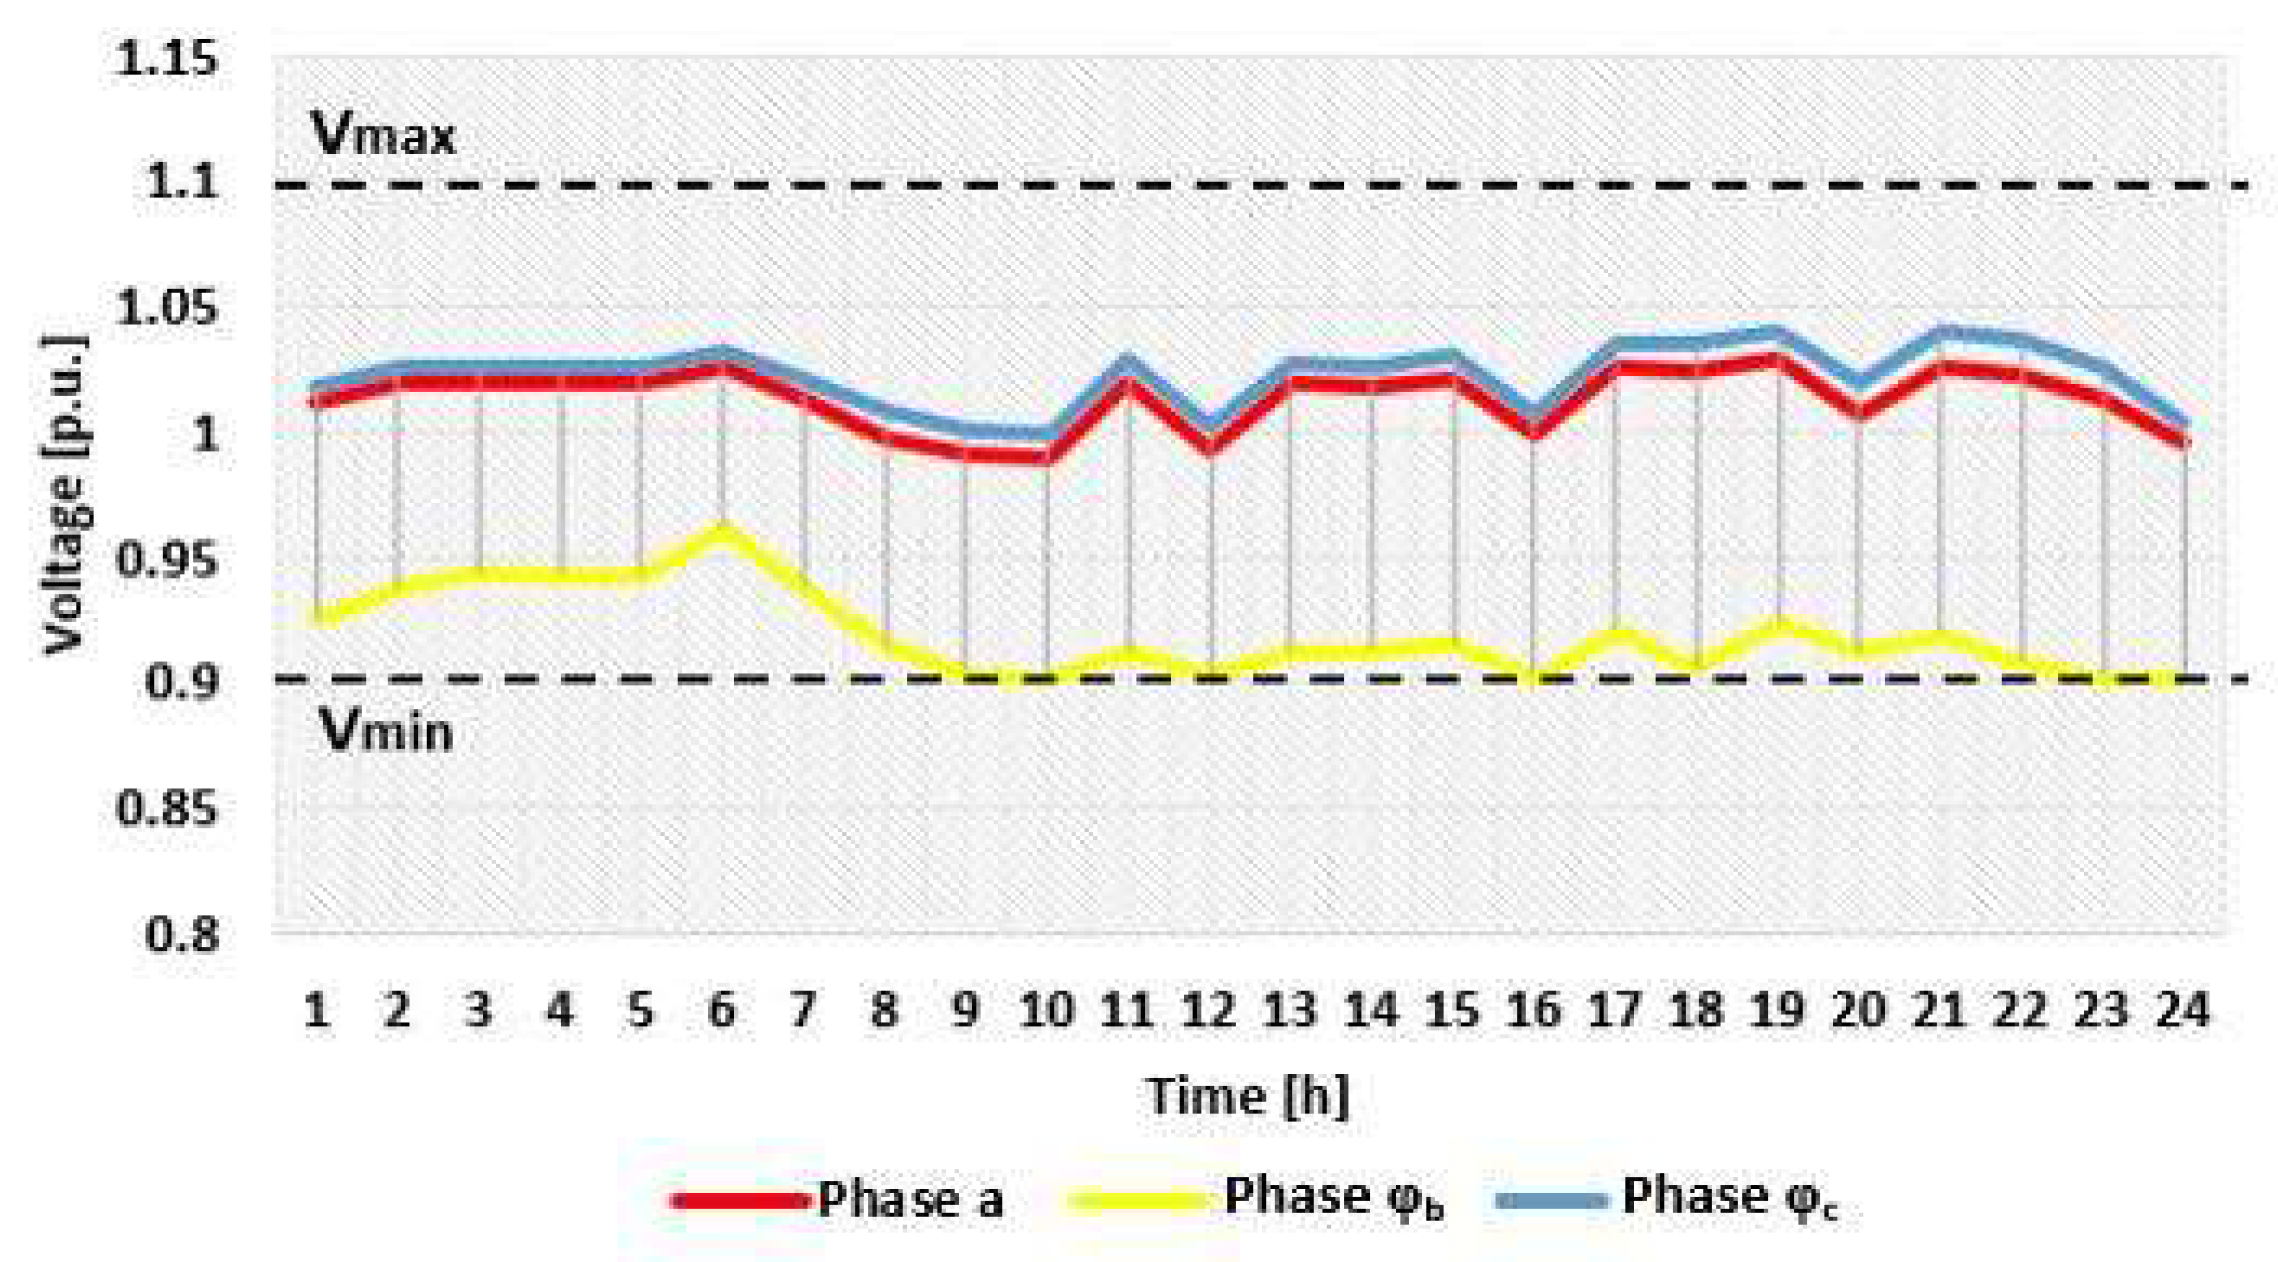
Regarding the voltage quality, all phase voltages at the pillar level have values inside the allowable range [-10%, +10%] according to the European Standard EN 50160 [50], even if the OLTC has a constant tap position, α = 8. Figure 10 presents the phase voltage variation in the analysed period, where more values are very close to the lower limit value (0.9).
In the next step, operating the LV EDN without using the RBES in the OLTC-based voltage control in all scenarios presented in Table 1 has been considered.
Table 3 and Table 4 present the results associated with the minimum and maximum phase voltages and total energy losses obtained after performing the steady-state calculations, where the tap position of OLTC has been considered constant, α = 8, for all time slices, s = 1, …, S, in all scenarios presented in Table 2 and identified by the values of PD, EPPV, and CEC. The following notations have been used for the indicator EPPV: low energy production - EPLPV (EPLPV = m EP PV - 2 x σ EP PV ), average energy production – EPAPV (EPAPV = m EP PV ), and high energy production – EPHPV (EPHPV = m EP PV + 2 x σ EP PV ).
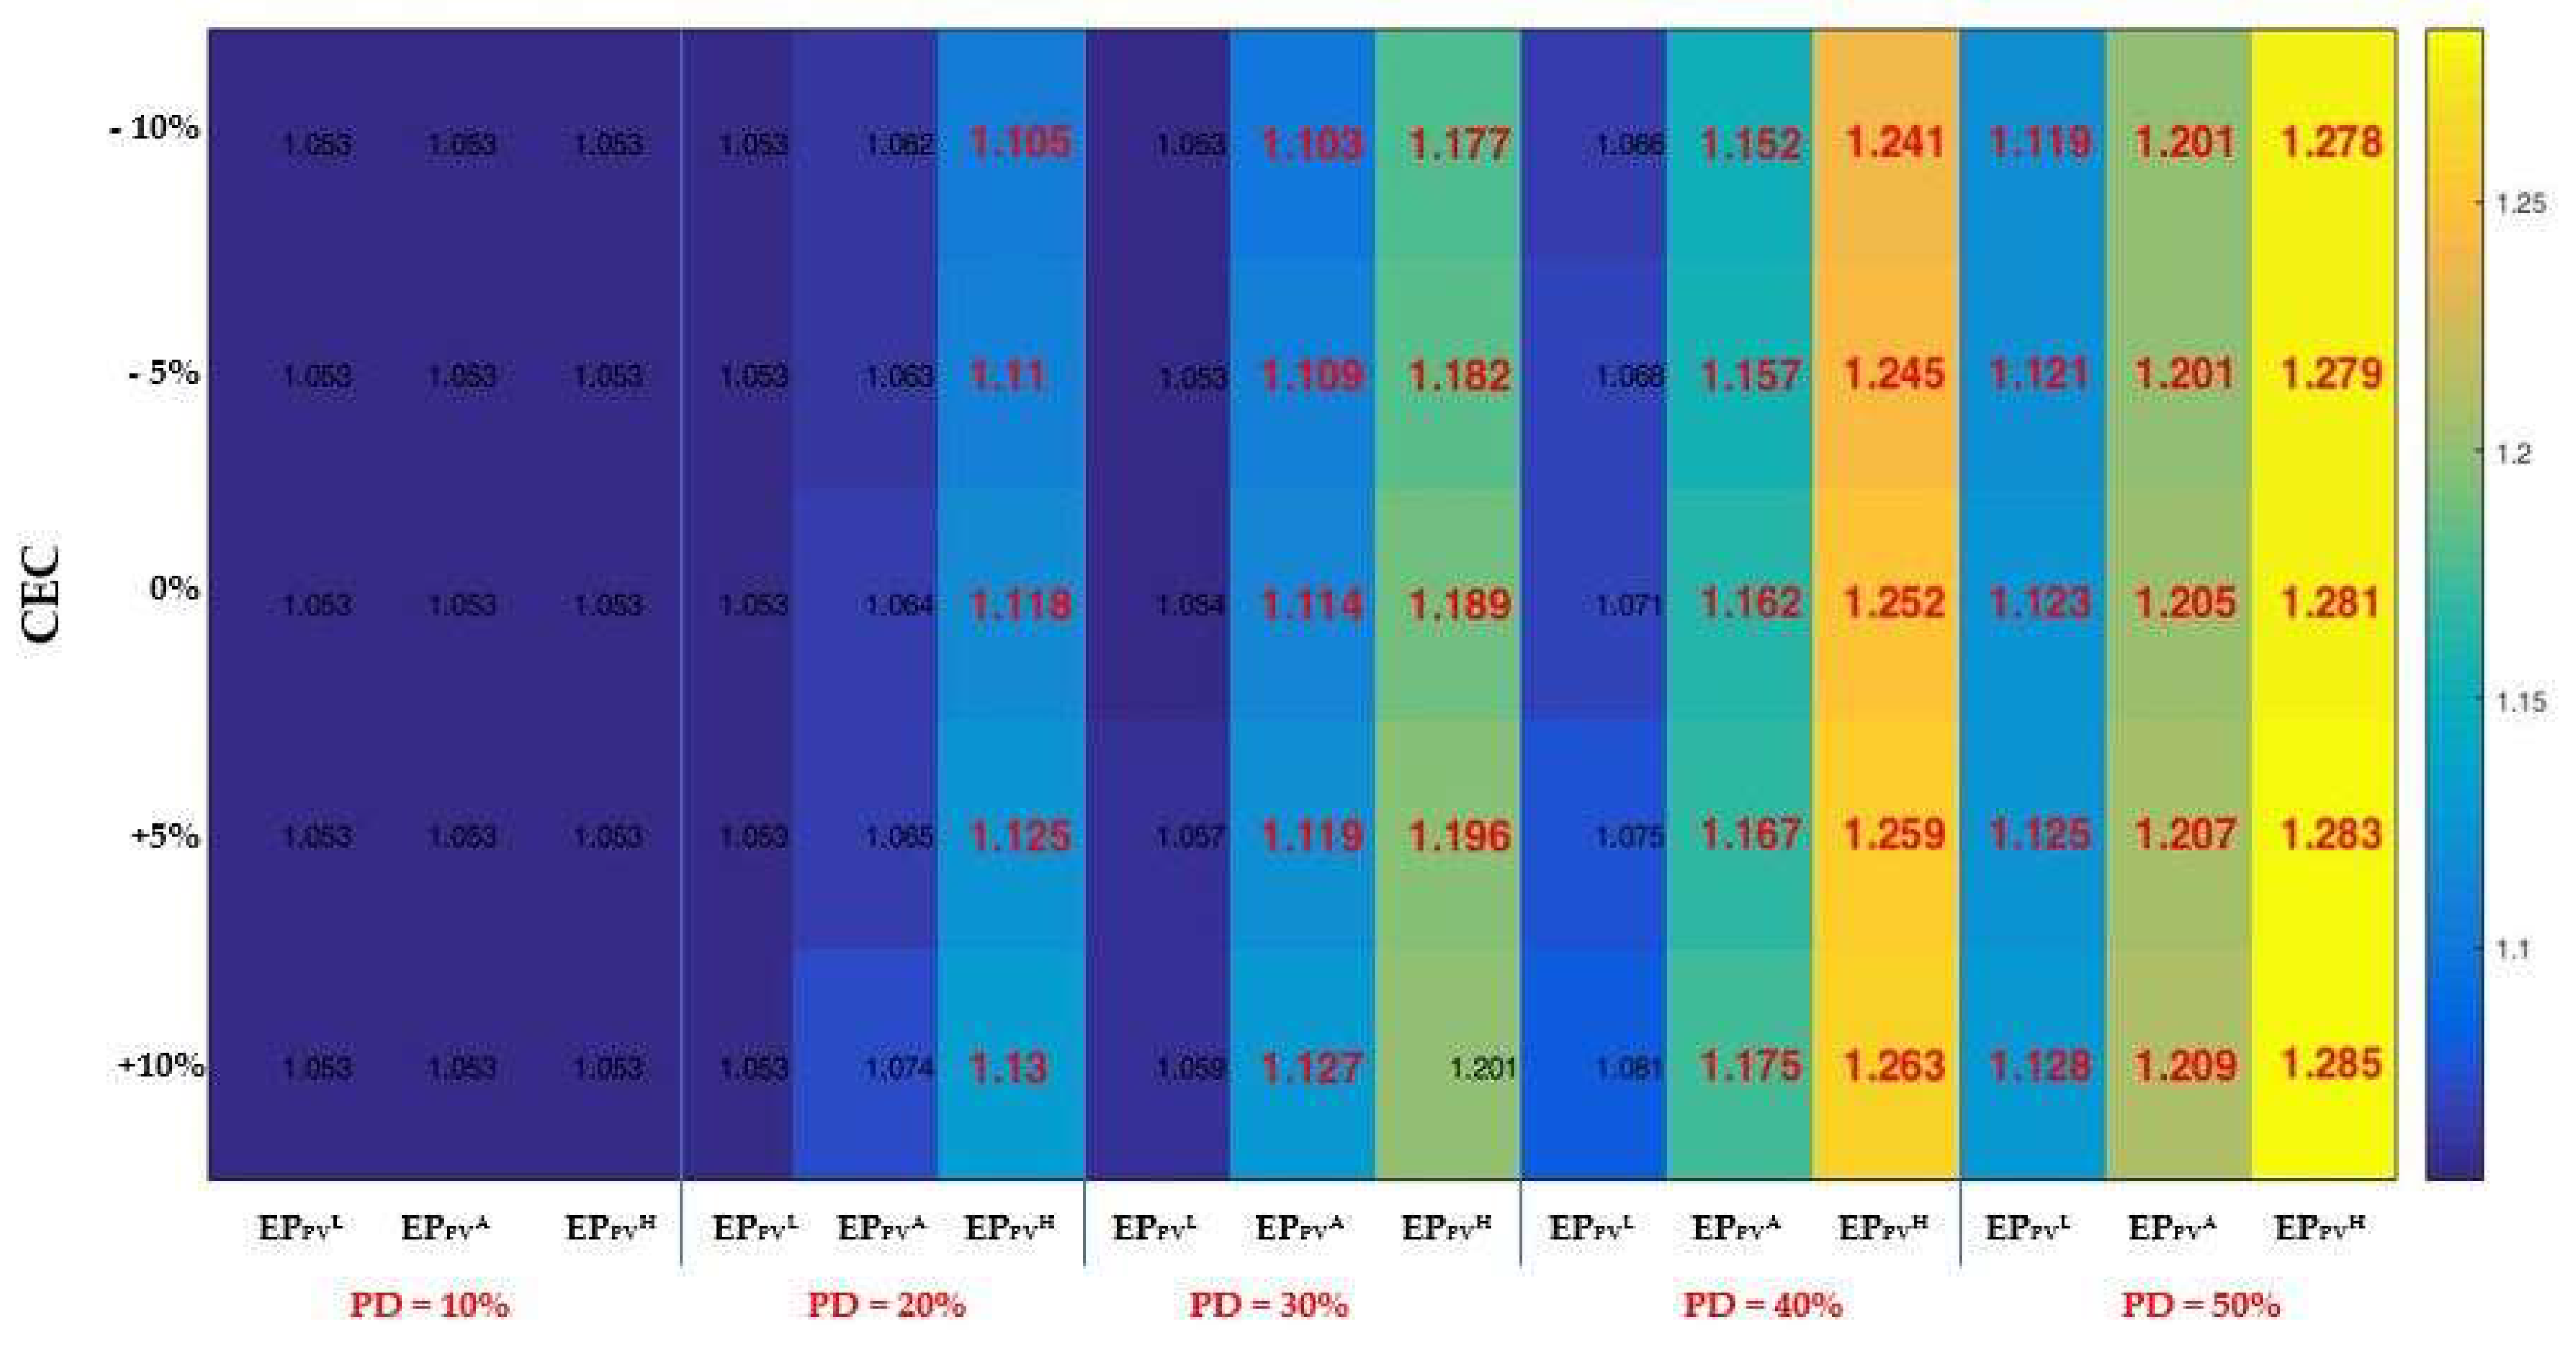
The analysis of results presented in Table 3 highlighted that in 40 scenarios (53.3%) from the total number, the phase voltage exceeded the upper allowable value (1.1 p.u.). All values over 1.1 p.u. are highlighted in the table in bold. These situations have been recorded in the phases γa and γc where the requested power of the consumers has been small, and the injected power of the prosumers has been high, which led to increases between 0.005 p.u. (scenario S30, with PD = 20%, CEC = 10 %, and EPHPV) and 0.185 p.u. (scenario with PD = 50%, CEC = - 10 %, and EPHPV).
Regarding the energy losses, the values are lower for 58 scenarios (77.33% of the total number) than in the base scenario, S0 (ΔW = 77.03 kWh). The higher values, highlighted with bold font in the table, have been recorded for PD = 40%, 50%, EPHPV, and all considered possibilities of CEC, CEC {-10, -5, 0, 5, 10}. Also, the energy losses decrease on the columns top-down (from the smaller to higher CEC) and increase on the rows left to right (from the lower to higher PD and EPPV), aspects usually encountered in the LV EDNs. The minimum energy losses correspond to scenarios S31 – S35 with a PD = 30%, all values of CEC, CEC {-10, -5, 0, 5, 10}, and EPLPV.
A scenarios-based voltage quality matrix can be available to the DNO, indicating possible future values of the maximum phase voltage in the LV EDNs and highlighting worst scenarios (red colour and larger font size) such that the best corrective measures are considered, see Figure 11. The matrix presents rows associated with the CEC possibilities that go top-down (from small to high) and columns with various alternatives for the EPPV and PG that follow one another from left to right.
It is clear that if the RBES-based voltage control, which uses the advantages of the OLTC, is not used, the DNO can have issues with the integration in the LV EDN of an increasing number of prosumers correlated with changes in energy consumption that may occur at the level of consumers.
Thus, the results have been obtained by applying the proposed RBES-based voltage control for the scenarios with the voltage issues identified in the previous step. Table 5 and Table 6 present the data associated with these scenarios in bold font. For the scenarios without voltage issues, the maximum voltage corresponds to the steady state without applying the RBES-based voltage control.
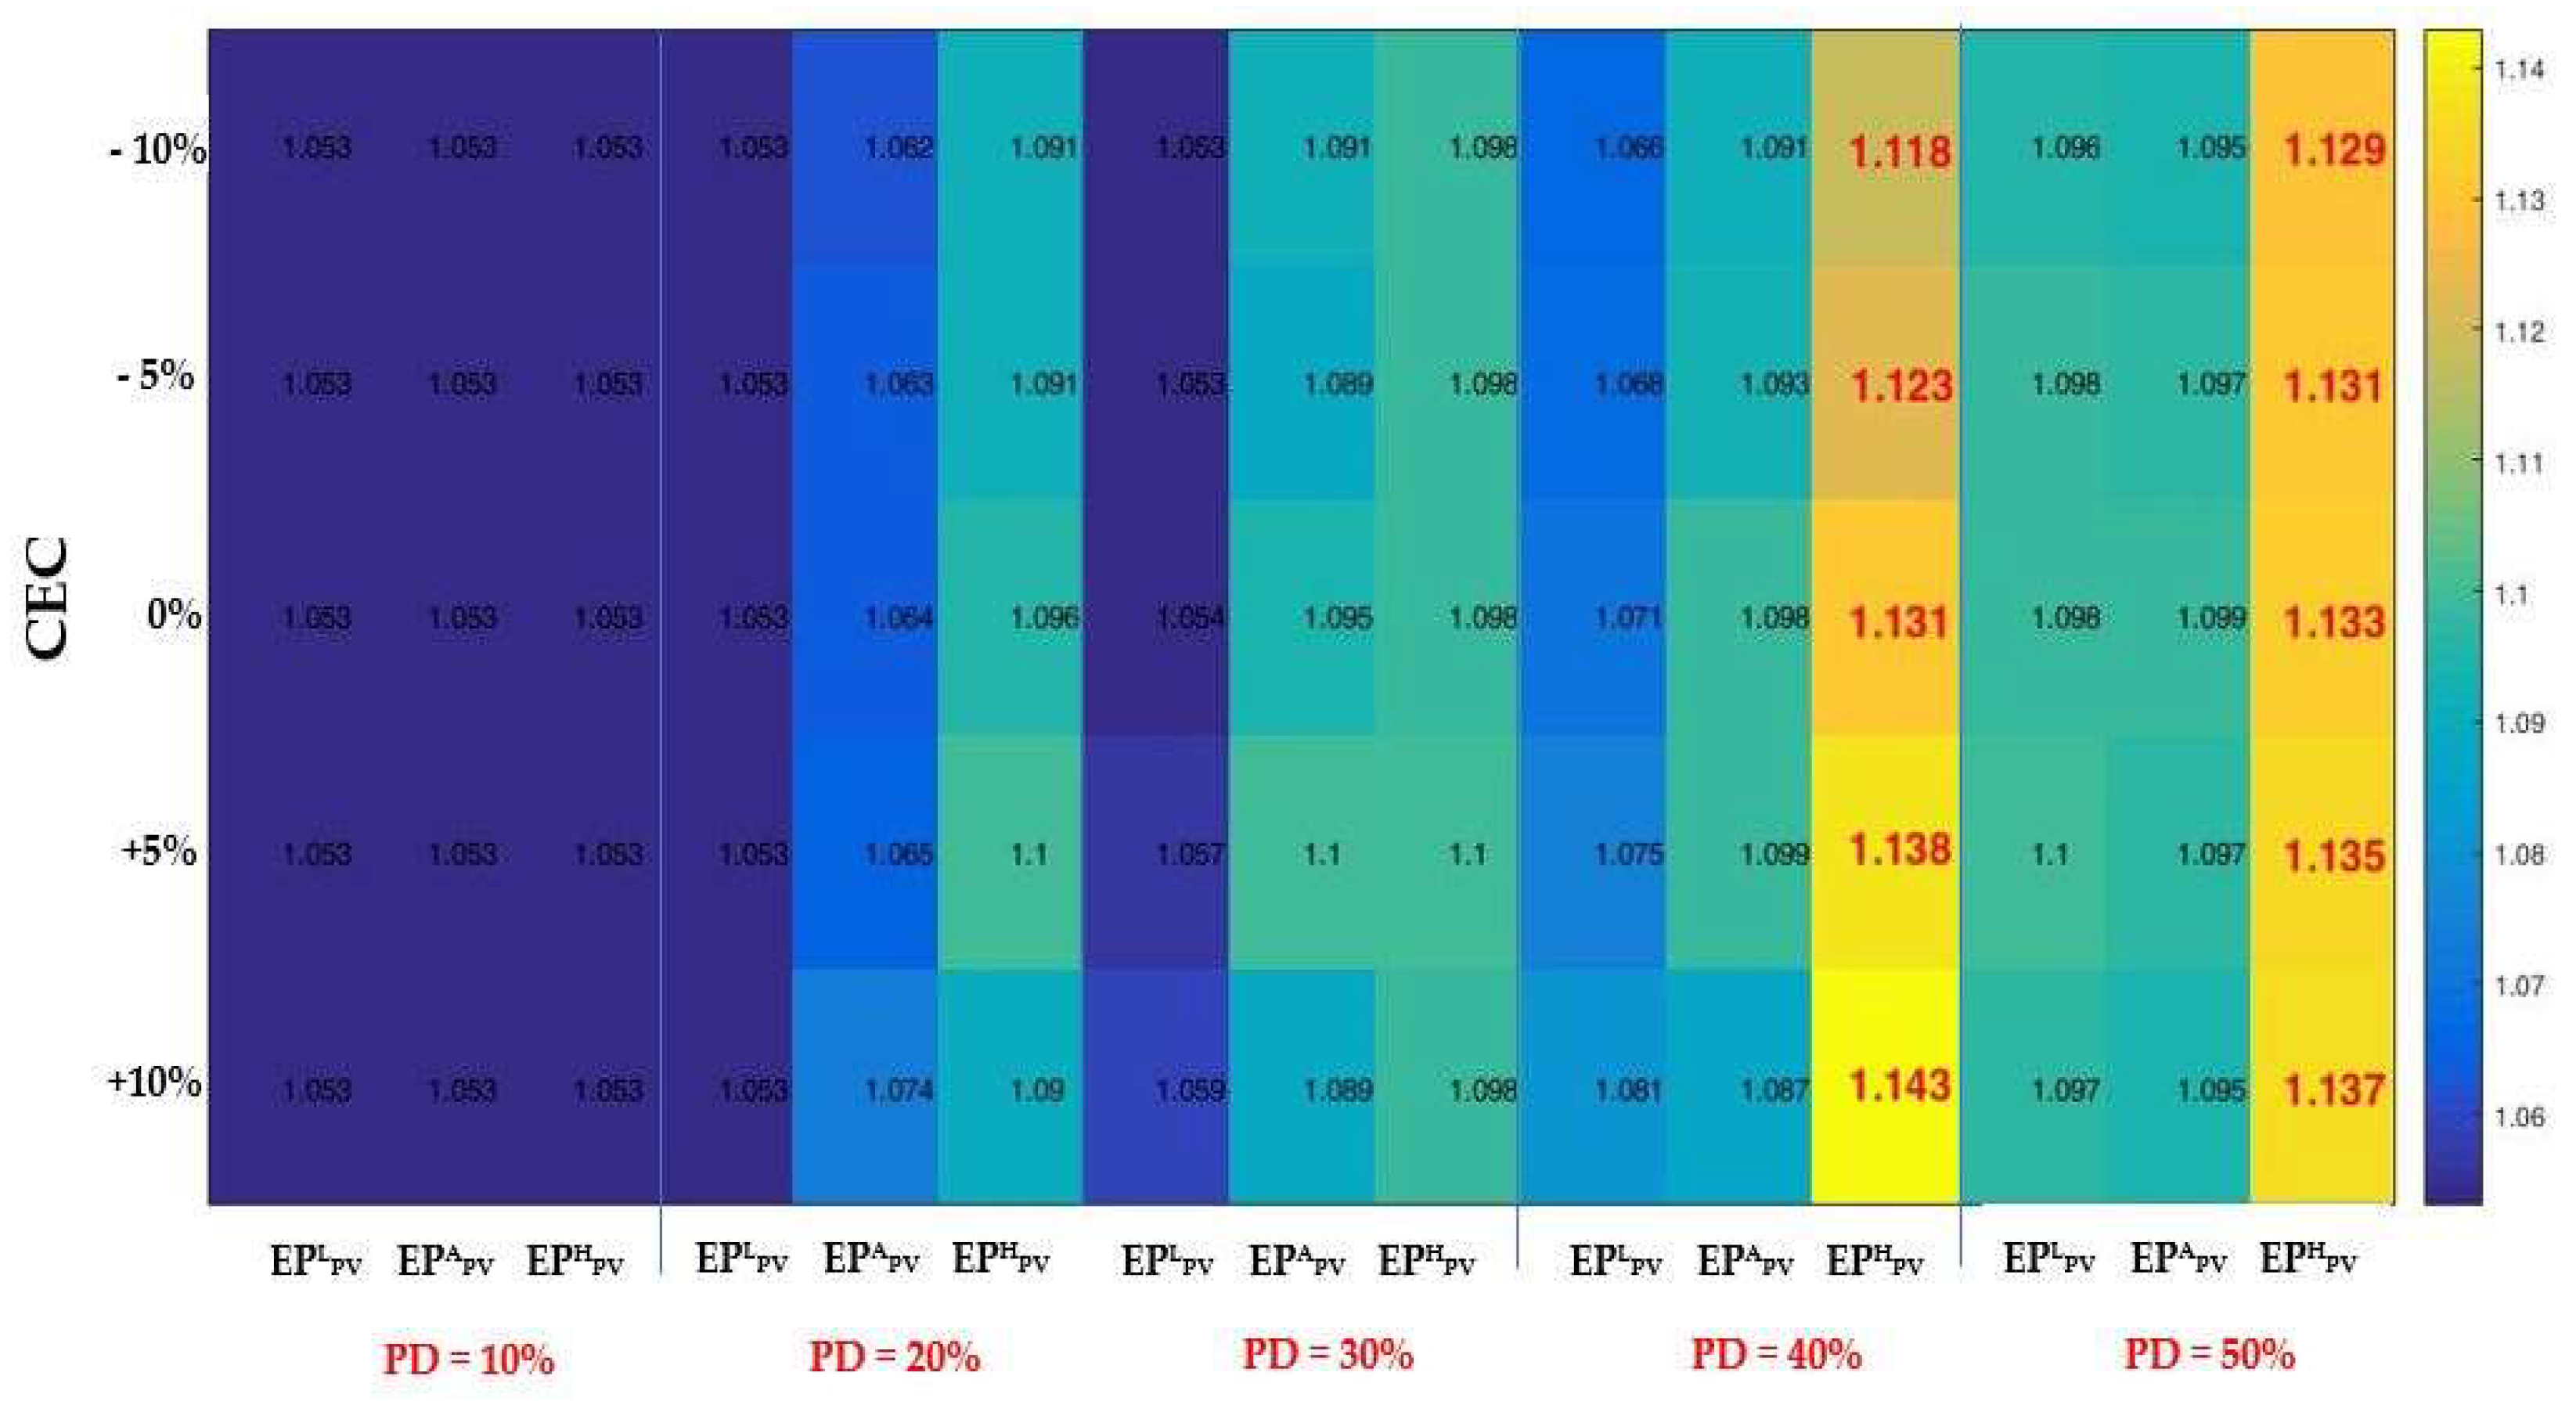
The voltage issues have been removed for 30 of 40 scenarios where the maximum values of the phase voltage exceeded the upper allowable limit.
The remaining scenarios with voltage issues, (S56 – S60, and S71 – S75), identified with red colour and bold font in Table 5 and the scenarios-based voltage quality matrix represented in Figure 12, are associated with PD {40%, 50%}, EPHPV, and CEC {-10%, -5%, 0%, 5%, 10%}, even if the maximum value of the phase voltage has been reduced with the values between 0.12 p.u (scenario S56, PD = 40%, EPHPV, and CEC = -10%), which means 9.5%, and 0.15 p.u. (scenario S75, PD = 50%, EPHPV, and CEC = +10%), which means 11.6%. But, at least 95% of the time slots, the voltages have been inside the range [-10%, +10%], according to the European Power Quality Standard.
The energy losses in the conductors for the scenarios (S26 – S30), where PD = 20%, EPHPV, and CEC {-10%, -5%, 0%, 5%, 10%}, and (S36 – S40), where PD = 30%, EPAPV, and CEC {-10%, -5%, 0%, 5%, 10%}, are slightly lower between 0.21% (S26 and S36) and 5.16% (S30). For all others scenarios (S41 – S45 and S51 – S75) the values are higher, especially for S56 – S60, where PD = 40%, EPHPV, and CEC {-10%, -5%, 0%, 5%, 10%}, and S71 – S75, where PD = 50%, EPHPV, and CEC {-10%, -5%, 0%, 5%, 10%}. Also, the last scenarios have voltage issues (as previously emphasized) corresponding to the largest energy amount injected by the prosumers in the network.
Regarding these scenarios, another voltage quality index is used to quantify the unallowable voltage variations, see Table 7. This index calculates with relation (10) shows the percentage of the time slots in which the phase voltage deviations exceed the allowable limits.
U V D = e = 1 N E s = 0 S ( γ { γ a , γ b , γ c } ( | V e , s { γ } V r V r | ) ) N γ N E S
where the signification of all variables has been indicated in Section 2.
The values of UVD from Table 7 indicated that the phase voltages in the nodes (at the pillar level) of the LV EDN for all 10 scenarios are outside the range [-10%, +10], in a percentage between 1.73% and 4.98%. Higher percentages, between 4.49% and 4.98 %, have been recorded for scenarios S71 – S75. In these conditions, the DNOs should be very careful and take additional measures to improve the voltage level in the LV EDN, and one of them can be the phase load balancing [51], taking into account the higher unbalance degree emphasized in the base scenario, S0.
The obtained results have been compared with an efficient method, which proved its effectiveness in voltage control, having the same assumptions as in the proposed RBES. The control voltage has been treated as a multi-objective problem where the optimal tap positions of the OLTC in each time slot are determined to minimize the energy losses and voltage deviations in the presence of technical constraints associated with the operating of the LV EDN [6].
Table 8 presents the errors associated with the energy losses between the two methods calculated with the relation:
δ Δ W = ( Δ W M M W R B E S Δ W M M )   100   ,   [ % ]
where: ΔWMM represents the energy losses calculated with the multiobjective method (MM) and ΔWRBED corresponds to the energy losses determined with the proposed RBES.
The analysis of the data highlighted that the energy losses are slightly smaller in the case of RBES compared with the MM method, with differences between 0.85 % (PD = 50%, EPAPV, and CEC = 10%) and 3.54% (PD = 20%, EPAPV, and CEC = - 10%). The similar values of the maximum phase voltage have been obtained in 47 scenarios (62.7%) highlighted through null values of the errors, see Table 9. However, the maximum values are slightly higher in the other scenarios (28) for the RBES compared with the MM method, between 0.08% (PD = 10%, EPLPV, and CEC = -10%) and 2.62% (PD = 40%, EPLPV, and CEC = -10%). Also, the voltage issues have not been solved fully for scenarios S56 – S60 and S71 – S75, but at least 95% of the time slots, the voltages have been inside the range [-10%, +10%], according to the European Power Quality Standard, and for the rest of the time slots up to 100% have been very close to the limits of the range.
The highest differences have been identified at the level of the optimization variables (the tap positions). A comparison between methods has been made only for the scenarios with voltage issues highlighted with bold font in the tables. The total number of tap position changes is higher in the MM method than in the RBES, which makes RB more efficient, see Table 10. Table A2 and A3 from Appendix A presents the tap position changes for the two methods.

4. Discussions and conclusions

The voltage quality, represented by exceeding the admissible limits indicated in the performance standards, has been identified by the DNOs as one of the main factors that can decrease the hosting capacity to accommodate the growing number of PV prosumers. The reverse power flows from the LV EDN toward the EDS ensure the connection between the MV and LVEDNs and represent the reason for various voltage issues, leading to uncertainties on the voltage level of the nodes. Thus, new methodologies should be developed to solve the voltage issues caused by PV prosumers based on the devices integrated into the EDN.
One of the most efficient devices to ensure the resilience of voltage control, which demonstrated its performance at the HV level, is represented by the OLTC, which equips the MV/LV distribution transformers. One of the most challenging issues in the operation of the OLTC in the LV EDNs is the determination of the optimal tap position, which leads to a fit 95% of the time between the admissible limits of the phase voltage in all nodes following the performance standards, in conditions when the reverse power flows can occur.
In these conditions, an efficient expert system, including rule-based reasoning (RBES), has been developed having as the advantages: the "fast-scanning" of the input data, identification of voltage issues that come up, determination of a solution associated with the tap position of an OLTC that does not violate the voltage constraints in the PV-rich network based on the deviations between the reference voltage and the voltages recorded in the nodes in each time slot recognizing the excesses of the allowable limits, regardless of the power flow's direction. These advantages offer RBES efficiency and resilience. Efficiency is associated with their ability to meet the demands of the end-users regarding voltage quality, and resilience characterizes by the response to harmful events represented by sudden voltage variations due to the intermittent regime of the small-scale renewable sources (prosumers).
Testing the RBES has been done considering an aerial LV EDN supplied by an EDS whose MV bus (20 kV) represents the CCP with the network of a Romanian DNO that carries out its distribution service in the respective area. More scenarios (75) have been considered in the case study, characterized by the combinations between the penetration degree, PD, PD {0%, 10%, 20%, 30%, 40, and 50%}; consumption evolution, CEC, CEC {-10%, - 5%, 0%, +5%, +10%}; and energy production of the PV systems from the month which includes the analyzed day, low energy production EPLPV – (EPLPV = m EP PV - 2 x σ EP PV ), average energy production – EPAPV (EPAPV = m EP PV ), and high energy production – EPHPV (EPHPV = m EP PV + 2 x σ EP PV ), where m EP PV and σ EP PV represent the mean and standard deviation of the energy production (EP) associated with a PV system from the geographical area of the LV EDN.
The success rate of the RBES has been 86.7% (65 out of 75 scenarios didn't have the voltage issues anymore. For the remaining scenarios (S56 – S60, and S71 – S75) associated with PD {40%, 50%}, EPHPV, and CEC {-10%, -5%, 0%, 5%, 10%}, the voltage has been mitigated being close to the upper allowable limit, but at least 95% of the time slots has been inside the range [-10%, +10%], according to the European Power Quality Standard.
The comparison with an efficient method demonstrated the efficiency of the RBES, quantified through smaller energy losses and the total number of tap position changes. Even under these conditions, the implementation of RBES in the real application integrated into the LV EDNs depends on the speed and sampling step of the data transmission from the smart meters installed to the end-users and the performance of the processing module from the data concentrator at the EDS level.
The authors work now on an improved variant of the RBES, which includes a opanimization process associated with phase load balancing to remove the voltage issues for higher penetration degrees, as observed in the case study.

Author Contributions

Conceptualization, G.G. and V.D.; methodology, G.G. and V.D.; software, G.G.; validation, G.G. and V.D.; formal analysis, V.D..; investigation, G.G. and V.D.; resources, G.G.; data curation, G.G.; writing—original draft preparation, G.G. and V.D.; writing—review and editing, G.G.; visualization, G.G. and V.D.; supervision, G. G.; project administration, G.G.; funding acquisition, G.G.. All authors have read and agreed to the published version of the manuscript.

Funding

This research received no external funding.

Conflicts of Interest

The authors declare no conflict of interest.

Appendix A

Table A1. The allocation of the end-users at each pillar associated with the five penetration degrees.
Pillar 0% 10% 20% 30% 40% 50% Pillar 0% 10% 20% 30% 40% 50%
C P C P C P C P C P C P C P C P C P C P C P C P
P1 1 0 1 0 1 0 1 0 1 0 1 0 P41 3 0 3 0 3 0 3 0 2 1 2 1
P3 2 0 2 0 1 1 1 1 0 2 0 2 P42 2 0 2 0 2 0 2 0 2 0 2 0
P4 1 0 1 0 1 0 1 0 0 1 0 1 P43 1 0 1 0 1 0 1 0 1 0 1 0
P5 1 0 1 0 1 0 1 0 0 1 0 1 P45 2 0 1 1 1 1 1 1 1 1 1 1
P6 1 0 1 0 1 0 1 0 1 0 1 0 P46 1 0 1 0 1 0 1 0 1 0 1 0
P7 2 0 2 0 2 0 2 0 2 0 2 0 P47 5 0 3 2 2 3 2 3 0 5 0 5
P8 2 0 2 0 2 0 1 1 1 1 1 1 P48 1 0 1 0 1 0 1 0 1 0 1 0
P10 1 0 1 0 1 0 1 0 1 0 0 1 P51 1 0 0 1 0 1 0 1 0 1 0 1
P11 2 0 2 0 2 0 2 0 1 1 1 1 P52 2 0 2 0 2 0 2 0 2 0 2 0
P12 1 0 1 0 0 1 0 1 0 1 0 1 P53 1 0 1 0 1 0 1 0 0 1 0 1
P13 2 0 2 0 2 0 2 0 2 0 2 0 P55 1 0 1 0 1 0 1 0 1 0 1 0
P16 2 0 2 0 2 0 1 1 1 1 0 2 P56 1 0 1 0 1 0 1 0 1 0 1 0
P19 2 0 2 0 1 1 1 1 1 1 1 1 P58 1 0 1 0 0 1 0 1 0 1 0 1
P20 2 0 2 0 2 0 2 0 2 0 2 0 P59 3 0 2 1 0 3 0 3 0 3 0 3
P21 2 0 2 0 2 0 2 0 2 0 1 1 P60 2 0 2 0 2 0 2 0 2 0 2 0
P22 2 0 2 0 2 0 2 0 2 0 1 1 P61 2 0 2 0 1 1 0 2 0 2 0 2
P23 2 0 2 0 2 0 2 0 2 0 1 1 P62 2 0 2 0 1 1 1 1 1 1 1 1
P24 1 0 1 0 1 0 1 0 1 0 1 0 P63 1 0 1 0 1 0 0 1 0 1 0 1
P25 1 0 1 0 1 0 1 0 1 0 1 0 P65 1 0 1 0 1 0 1 0 1 0 1 0
P26 4 0 4 0 4 0 3 1 3 1 1 3 P68 1 0 1 0 1 0 1 0 1 0 1 0
P27 3 0 3 0 2 1 2 1 2 1 0 3 P69 1 0 1 0 1 0 0 1 0 1 0 1
P28 3 0 3 0 3 0 3 0 3 0 2 1 P71 4 0 4 0 3 1 3 1 3 1 3 1
P30 3 0 1 2 1 2 1 2 0 3 0 3 P72 1 0 1 0 1 0 1 0 1 0 1 0
P31 1 0 1 0 1 0 1 0 1 0 0 1 P73 1 0 1 0 1 0 1 0 1 0 1 0
P32 2 0 2 0 2 0 2 0 1 1 1 1 P75 2 0 2 0 2 0 2 0 2 0 2 0
P33 2 0 2 0 2 0 1 1 1 1 1 1 P76 1 0 1 0 1 0 1 0 0 1 0 1
P34 1 0 1 0 1 0 1 0 1 0 1 0 P77 1 0 1 0 1 0 0 1 0 1 0 1
P35 1 0 1 0 1 0 1 0 1 0 1 0 P80 2 0 2 0 2 0 2 0 2 0 2 0
P36 2 0 2 0 2 0 2 0 2 0 1 1 P81 1 0 0 1 0 1 0 1 0 1 0 1
P37 2 0 2 0 1 1 0 2 0 2 0 2 P82 2 0 1 1 1 1 1 1 1 1 1 1
P38 3 0 3 0 3 0 2 1 2 1 2 1 P85 1 0 1 0 1 0 1 0 1 0 1 0
P39 1 0 1 0 1 0 1 0 1 0 1 0 P86 2 0 2 0 2 0 2 0 1 1 1 1
P40 2 0 0 2 0 2 0 2 0 2 0 2 P88 1 0 1 0 1 0 1 0 1 0 1 0
*C – consumer; P - prosumer
Table A2. The tap position changes of the OLTC (RBES-based method).
CEC
[%]
PD [%]
10 20 30 40 50
EPLPV EPAPV EPHPV EPLPV EPAPV EPHPV EPLPV EPAPV EPHPV EPLPV EPAPV EPHPV EPLPV EPAPV EPHPV
m EP PV -   2 x σ EP PV m EP PV m EP PV + 2 x σ EP PV m EP PV -   2 x σ EP PV m EP PV m EP PV + 2 x σ EP PV m EP PV -   2 x σ EP PV m EP PV m EP PV + 2 x σ EP PV m EP PV -   2 x σ EP PV m EP PV m EP PV + 2 x σ EP PV m EP PV -   2 x σ EP PV m EP PV m EP PV + 2 x σ EP PV
-10 0 0 0 0 0 4 0 4 10 0 8 14 4 13 14
-5 0 0 0 0 0 4 0 4 12 0 10 14 4 13 14
0 0 0 0 0 0 3 0 3 11 0 7 13 7 11 13
5 0 0 0 0 0 3 0 3 9 0 7 13 5 11 13
10 0 0 0 0 0 7 0 7 13 0 11 17 9 15 17
Table A3. The additional tap position changes of the OLTC (MM-based method).
CEC
[%]
PD [%]
10 20 30 40 50
EPLPV EPAPV EPHPV EPLPV EPAPV EPHPV EPLPV EPAPV EPHPV EPLPV EPAPV EPHPV EPLPV EPAPV EPHPV
m EP PV -   2 x σ EP PV m EP PV m EP PV + 2 x σ EP PV m EP PV -   2 x σ EP PV m EP PV m EP PV + 2 x σ EP PV m EP PV -   2 x σ EP PV m EP PV m EP PV + 2 x σ EP PV m EP PV -   2 x σ EP PV m EP PV m EP PV + 2 x σ EP PV m EP PV -   2 x σ EP PV m EP PV m EP PV + 2 x σ EP PV
-10 0 0 0 0 0 8 0 8 14 0 12 14 10 14 14
-5 0 0 0 0 0 8 0 8 14 0 12 14 8 14 14
0 0 0 0 0 0 7 0 7 13 0 11 13 7 13 13
5 0 0 0 0 0 7 0 7 11 0 11 13 7 13 13
10 0 0 0 0 0 11 0 11 15 0 13 17 11 17 17

References

  1. Spertino, F.; Ciocia, A.; Mazza, A.; Nobile, M.; Russo, A.; Chicco, G. Voltage Control in Low Voltage Grids with Independent Operation of On-Load Tap Changer and Distributed Photovoltaic Inverters. Electric Power Systems Research 2022, 211, 108187. [CrossRef]
  2. Li, C.; Disfani, V,; Pecenak, Z.; Mohajeryami, S.; Kleissl, J. Optimal OLTC Voltage Control Scheme to Enable High Solar Penetrations. Electric Power Systems Research 2018, 160, 318-326. [CrossRef]
  3. Yuan, J.; Weng, Yang; Tan, Chin-Woo. Determining Maximum Hosting Capacity for PV Systems in Distribution Grids. International Journal of Electrical Power & Energy Systems 2022, 135, 107342. [CrossRef]
  4. Fatima, S.; Püvi, V.; Lehtonen, M. Review on the PV Hosting Capacity in Distribution Networks. Energies 2020, 13, 4756. [CrossRef]
  5. Majeed, I.B.; Nwulu, N.I. Impact of Reverse Power Flow on Distributed Transformers in a Solar-Photovoltaic-Integrated Low-Voltage Network. Energies 2022, 15, 9238. [CrossRef]
  6. Noroc, L.; Grigoras, G.; Dandea, V.; Chelaru, E.; and Neagu, B An Efficient Voltage Control Methodology in LV Networks Integrating PV Prosumers Using Distribution Transformers with OLTC. . In Proceedings of the IEEE 20th International Power Electronics and Motion Control Conference (PEMC), Brasov, Romania, 25 – 28 September 2022.
  7. Sarimuthu, C.; Ramachandaramurthy, V.; Agileswari, K.R.; Mokhlis, H. A Review on Voltage Control Methods Using On-Load Tap Changer Transformers for Networks with Renewable Energy Sources. Renewable and Sustainable Energy Reviews 2016, 62(C), 1154-1161. [CrossRef]
  8. Belaid, Y.N.; Coudray, P.; Sanchez-Torres, J.; Fang, Y.; Zeng, Z. et al.. Resilience Quantification of Smart Distribution Networks-A Bird’s Eye View Perspective. Energies 2021, 14, 2888. [CrossRef]
  9. Bedawy, A.; Yorino, N.; Mahmoud, K.; Management of Voltage Regulators in Unbalanced Distribution Networks Using Voltage/Tap Sensitivity Analysis. In Proceedings of the International Conference on Innovative Trends in Computer Engineering, Aswan, Egypt, 19 - 21 February 2018.
  10. Liu, Y.; Guo, L.; Lu, C.; Chai, Y. Gao, S.; Xu, B. A Fully Distributed Voltage Optimization Method for Distribution Networks Considering Integer Constraints of Step Voltage Regulators. IEEE Access 2019, 7, 60055-60066. [CrossRef]
  11. Li, X.; Wang, L; Yan, N.; Ma, R. Cooperative Dispatch of Distributed Energy Storage in Distribution Network with PV Generation Systems. IEEE Transactions on Applied Superconductivity 2021, 31, 1-4. [CrossRef]
  12. Wang, S.; Gao, S.; Niu, X.; Chen, J. The influence of multi-level energy storage on the access of distributed renewable energy. In Proceedings of the 5th Asia Conference on Power and Electrical Engineering (ACPEE), Chengdu, China, 4 – 7 June 2020.
  13. Leghari, Z.H.; Kumar, M.; Shaikh, P.H.; Kumar, L.; Tran, Q.T. A Critical Review of Optimization Strategies for Simultaneous Integration of Distributed Generation and Capacitor Banks in Power Distribution Networks. Energies 2022, 15, 8258. [CrossRef]
  14. Sadeghian, O.; Oshnoei, A.; Kheradmandi, M.; Mohammadi-Ivatloo, B. Optimal Placement of Multi-Period-Based Switched Capacitor in Radial Distribution Systems. Computers & Electrical Engineering 2020, 82, 106549. [CrossRef]
  15. Grigoraș, G.; Noroc, L.; Chelaru, E.; Scarlatache, F.; Neagu, B.-C.; Ivanov, O.; Gavrilaș, M. Coordinated Control of Single-Phase End-Users for Phase Load Balancing in Active Electric Distribution Networks. Mathematics 2021, 9, 2662. [CrossRef]
  16. Tenti, P.; Caldognetto, T. Integration of Local and Central Control Empowers Cooperation among Prosumers and Distributors towards Safe, Efficient, and Cost-Effective Operation of Microgrids. Energies 2023, 16, 2320. [CrossRef]
  17. Soe, N.N; Lwin, K.S.; Advance OLTC Control for Improving Power System Voltage Stability. International Journal of Scientific Engineering and Technology Research 2014, 3, 2487-2493.
  18. Rogers, D., Green, T. Silversides, R. A Low-Wear Onload Tap Changer Diverter Switch for Frequent Voltage Control on Distribution Networks. IEEE Transactions on Power Delivery 2013, 99, 1-10. [CrossRef]
  19. Procopiou A. T.; Ochoa, L.F. Voltage Control in PV-Rich LV Networks Without Remote Monitoring, IEEE Trans. Power Syst. 2017, 32, 1224–1236. [CrossRef]
  20. Heinrich, C.; Fortenbacher, P.; Fuchs, A. Andersson, G. PV Integration Strategies for Low Voltage Networks. In Proceedings of the IEEE Int. Energy Conf. (ENERGYCON), Leuven, Belgium, April 2016.
  21. Weisshaupt, M.J.; Schlatter, B.; Korba, P.; Kaffe, E.; Kienzle, F. Evaluation of Measures to Operate Urban Low Voltage Grids Considering Future PV Expansion. IFAC-Papers-On-Line 2016, 49, 336–341. [CrossRef]
  22. Feng, F.; Liu, Y.; Zhang, J. A Taxonomical Review on Recent Artificial Intelligence Applications to PV Integration into Power Grids. International Journal of Electrical Power & Energy Systems 2021, 132, 107176. [CrossRef]
  23. Rohit Trivedi, Shafi Khadem, Implementation of Artificial Intelligence Techniques in Microgrid Control Environment: Current Progress and Future Scopes. Energy and AI 2022, 8, 100147. [CrossRef]
  24. Mulenga, E., Bollen, M.; Etherden, N. Limits Set By Component Loadability on Solar Power Integration in Distribution Networks, Electric Power Systems Research 2022, 209, 107951. [CrossRef]
  25. Bendík, J.; Cenký, M.; Cintula, B.; Beláń, A.; Eleschová, Ž.; Janiga, P. Stochastic Approach for Increasing the PV Hosting Capacity of a Low-Voltage Distribution Network. Processes 2023, 11, 9. [CrossRef]
  26. Noroc, L.; Grigoras, G.; Chelaru, E.; Dandea, V.; Neagu, B. Voltage Control Strategy Using the Rule-Based Reasoning in LV Distribution Networks with PV Penetration Integrating OLTC-Fitted Transformer, In Proceedings of the International Conference and Exposition on Electrical And Power Engineering (EPE), Iasi, Romania, 29-22 October 2022.
  27. Cipcigan, L.M.; Taylor, P.C. Taylor Investigation of The Reverse Power Flow Requirements of High Penetrations Of Small-Scale Embedded Generation. IET Renew. Power Gener. 2007, 1, 160–166. [CrossRef]
  28. Yoon, K.-H.; Shin, J.-W.; Nam, T.-Y.; Kim, J.-C.; Moon, W.-S. Operation Method of On-Load Tap Changer on Main Transformer Considering Reverse Power Flow in Distribution System Connected with High Penetration on Photovoltaic System. Energies 2022, 15, 6473. [CrossRef]
  29. Neagu B. C.; Grigoras, G. Optimal Voltage Control in Power Distribution Networks Using an Adaptive On-Load Tap Changer Transformers Techniques," In Proceedings of the International Conference on Electromechanical and Energy Systems (SIELMEN), Craiova, Romania, 9 – 11 October 2019.
  30. Nakamura, M.; Yoshizawa, S.; Ishii, H. et al. Advanced Voltage Control Method for Improving the Voltage Quality of Low-Voltage Distribution Networks with Photovoltaic Penetrations. Energy Inform 2021, 4 (Suppl 2), 31.
  31. Lee, H.; Yu, W.; Oh, J.; Kim, H.; Kim, J. Development of an Intelligent Voltage Control System for Bulk Power Systems. Appl. Sci. 2021, 11, 9233. [CrossRef]
  32. Pimpa C. and Premrudeepreechacharn, S. Voltage control in power system using expert system based on SCADA system, In Proceeding of the 2002 IEEE Power Engineering Society Winter Meeting. Conference Proceedings, New York, NY, USA, 27 - 31 January 2002.
  33. Enemuo, F.O.; Chukwura O.I. An Enhanced Scheme for Detecting Under-Voltage and Over-Voltage Using Fuzzy Logic Based System in a Low Voltage Grid Network. International Research Journal of Engineering and Technology 2018, 5, 1334 - 1338.
  34. Mariaraja, P.; Manigandan, T.; Thiruvenkadam, S. An Expert System for Distribution System Reconfiguration through Fuzzy Logic and Flower Pollination Algorithm. Measurement and Control 2018, 51, 371-382. [CrossRef]
  35. Chen Y. and Zhang X., Voltage Balancing Method on Expert System for 51-Level MMC in High Voltage Direct Current Transmission. Mathematical Problems in Engineering 2016, 2016, 2968484.
  36. Perera, A. T. D.; Mauree, D.; Scartezzini J. -L.; Nik, V. M. Optimum Design and Control of Grid Integrated Electrical Hubs Considering Lifecycle Cost and Emission, In Proceedings of the 2016 IEEE International Energy Conference (ENERGYCON), Leuven, Belgium, 4 - 8 April 2016.
  37. Bennett, C.; Stewart, R.; Lu, J.W. Forecasting Low Voltage Distribution Network Demand Profiles Using a Pattern Recognition Based Expert System. Energy 2014, 67, 200-212. [CrossRef]
  38. Faia, R.; Pinto, T.; Abrishambaf, O.; Fernandes, F.; Vale, Z.; Corchado, J.M. Case Based Reasoning with Expert System and Swarm Intelligence to Determine Energy Reduction in Buildings Energy Management, Energy and Buildings 2017, 155, 269-281. [CrossRef]
  39. Kirgizov, A. K.; Dmitriev, S.A.; Safaraliev, M. Kh.; Pavlyuchenko, D. A.; Ghulomzoda, A. H.; Ahyoev, J. S. Expert System Application for Reactive Power Compensation in Isolated Electric Power Systems, International Journal of Electrical and Computer Engineering 2021, 11, 3682-3691. [CrossRef]
  40. Chelaru E. and Grigoraş G. Decision Support System to Determine the Replacement Ranking of the Aged Transformers in Electric Distribution Networks, 2020 12th International Conference on Electronics, Computers and Artificial Intelligence (ECAI), Bucharest, Romania, 25 – 27 June 2020.
  41. Grosan, C. and Abraham, A. Rule-Based Expert Systems. In: Intelligent Systems. Springer, Berlin, Heidelberg, 2011; Volume 17, pp. 149 – 185.
  42. Grigoras, G. and Neagu, B., Smart meter data-based three-stage algorithm to calculate power and energy losses in low voltage distribution networks, Energies 2019, 12, 3008. [CrossRef]
  43. Efkarpidis, N., Wijnhoven, T., Gonzalez, C. et. al., Coordinated voltage control scheme for Flemish LV distribution grids utilizing OLTC transformers and D-STATCOM's, In Proceedings of the IET Conference on Developments in Power System Protection, Copenhagen, Denmark, 31 March – 3 April 2014.
  44. Ciocia, A., Boicea, V., Chicco, G., Di Leo, P., Mazza, A., Pons, E., Spertino, F., Hadj-Said, N. Voltage Control in Low-Voltage Grids Using Distributed Photovoltaic Converters and Centralized Devices. IEEE Trans. on Ind. Appl. 2019, 55, 225 - 237. [CrossRef]
  45. Siemens, EU Requirements for Transformers Ecodesign Directive from the European Commission Tier 2 - July 1st, 2021, Available on-line: https://assets.siemens-energy.com/siemens/assets/api/uuid:796c2680-c8bb-4186-b338-245865d85a45/ ecodesignleaflet.pdf.
  46. Romanian Energy Regulatory Authority, "Report on monitoring the activities of prosumators in 2021 (in Romanian), 2022, Available on-line: www.anre.ro.
  47. Romanian Energy Regulatory Authority, Reports on the results of monitoring electricity markets (in Romanian), 2022, available on-line: www.anre.ro.
  48. Currel G. and Dowman A. Essential Mathematics and Statistics, 2nd ed., Publisher: John Wiley & Sons, Chichester, United Kingdom, 2009; pp. 211 – 242.
  49. Photovoltaic Geographical Information System - PVGIS, Available on-line: https://re.jrc.ec.europa.eu/pvg_tools/en/.
  50. Eurelectric, Power Quality in European Electricity Supply Networks, 2nd ed., Network of Experts for Standardization, 2003.
  51. Grigoras, G., Noroc, L., Chelaru, E., Scarlatache, F., Neagu, B.C., Ivanov, O., Gavrilas, M. Coordinated control of single-phase end-users for phase load balancing in active electric distribution networks. Mathematics 2021, 9, 2662. [CrossRef]
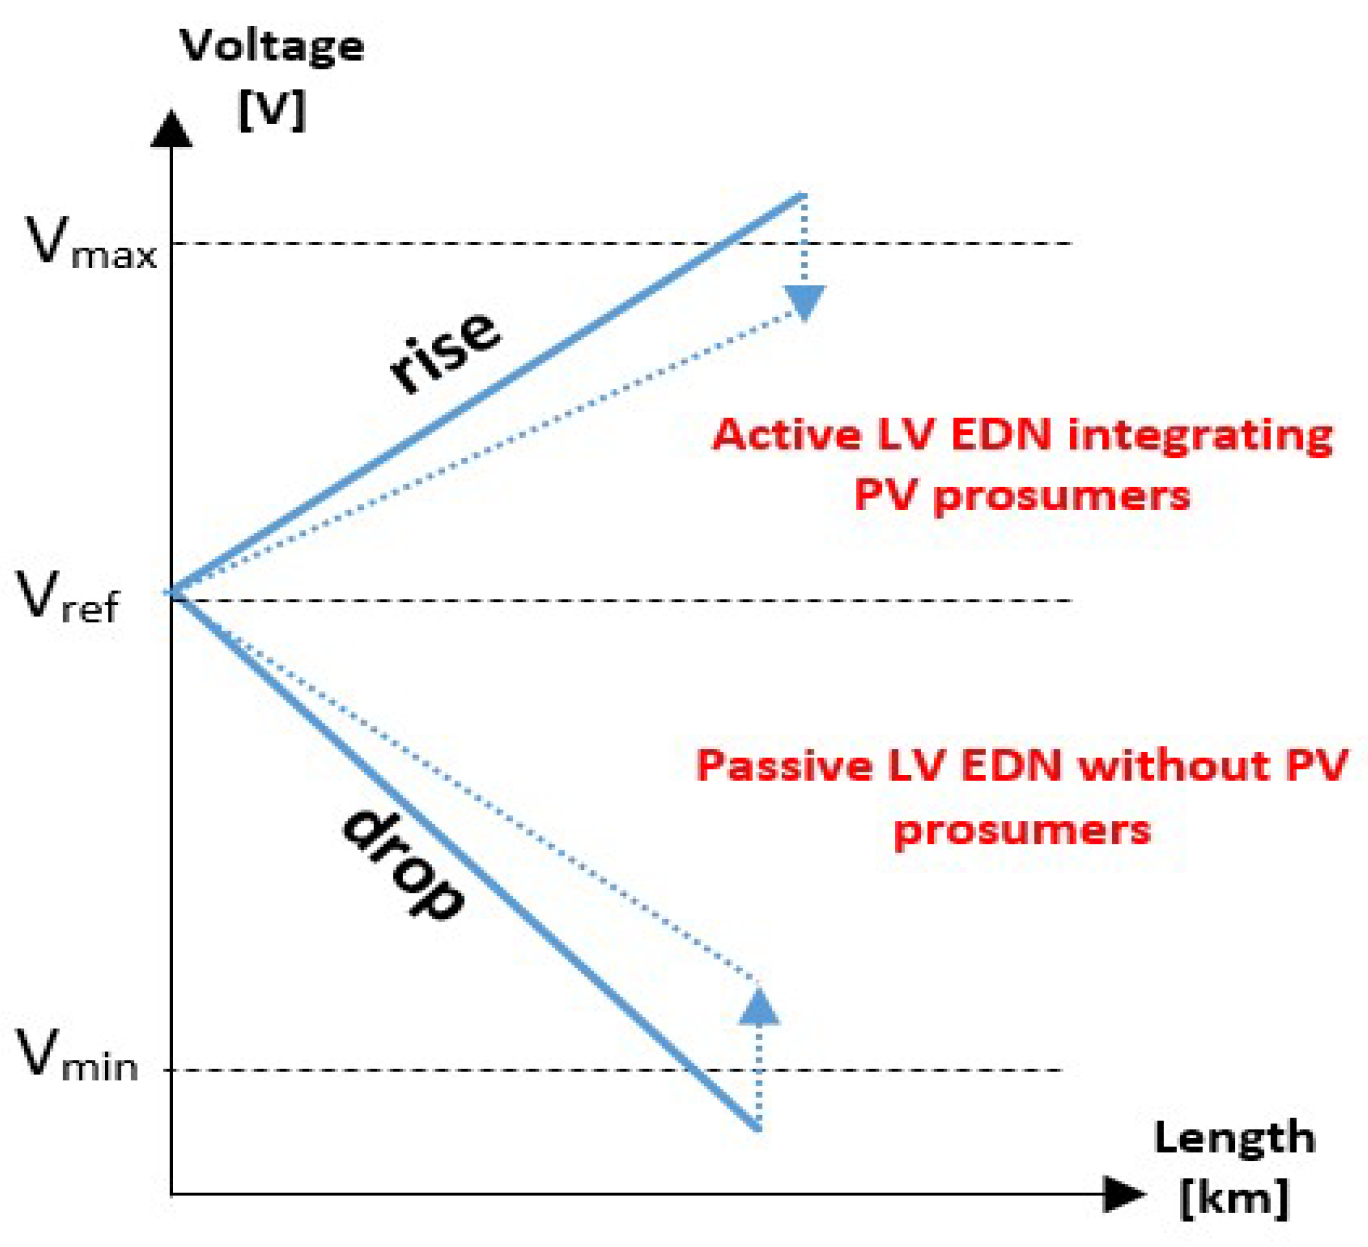
Figure 1. The evolution of the voltage in the LV EDNs without and with PV prosumers integrated.
Preprints 70479 g001
Figure 3. The flow chart of the voltage control using the rule-based reasoning.
Preprints 70479 g003
Figure 4. The test 88-bus LV EDN.
Preprints 70479 g004
Figure 5. The allocation of the end-users at the phases of the test 88-bus LV EDN.
Preprints 70479 g005
Figure 6. The generation profiles of the PV system with 3 kWp installed powers with the probability that EC of 0.95 (low, mean, and high energy production).
Preprints 70479 g006
Figure 7. The generation profiles of the PV system with 5 kWp installed powers with the probability that EC of 0.95 ((low, mean, and high energy production).
Preprints 70479 g007
Figure 8. The aggregation of the active powers at the LV level (0.4 kV) of the EDS for the analysed day from June associated with scenario S0.
Preprints 70479 g008
Figure 9. The energy losses in the conductors of the LV AEDN in the analysed period (24 hours).
Preprints 70479 g009
Figure 10. The phase voltages at the level of the end pillar (P88).
Preprints 70479 g010
Figure 11. The scenarios-based voltage quality matrix indicating possible future values of the maximum phase voltage recorded for each scenario associated with the LV EDN.
Preprints 70479 g011
Figure 12. The scenarios-based voltage quality matrix indicating possible future values of the maximum phase voltage recorded for each scenario identified associated with the LV EDN, with applying RBES.
Preprints 70479 g012
Table 1. The technical features of the test 88-bus LV EDN.
Type of
section
Conductor Type of conductor Length [km]
Cross-section of phase conductor Number of phases Cross-section of neutral conductor
1 50 3 50 C* 2.08
2 50 3 50 S** 0.12
3 35 3 35 C* 0.68
4 35 1 35 C* 0.28
5 25 1 25 C* 0.28
6 25 1 16 C* 0.08
* C – classical conductor (aluminium conductor steel-reinforced cable)
**S - Stranded conductor
Table 2. The analyzed scenarios (SA) with the features of the three indicators.
SC PD
[%]
EPPV
[kWh]
CEC
[%]
SC PD
[%]
EPPV
[kWh]
CEC
[%]
SC PD
[%]
EPPV
[kWh]
CEC
[%]
S1 10 m EP PV - 2 x σ EP PV -10% S26 10 m EP PV -10% S51 10 m EP PV + 2 x σ EP PV -10%
S2 10 m EP PV - 2 x σ EP PV -5% S27 10 m EP PV -5% S52 10 m EP PV + 2 x σ EP PV -5%
S3 10 m EP PV - 2 x σ EP PV 0% S28 10 m EP PV 0% S53 10 m EP PV + 2 x σ EP PV 0%
S4 10 m EP PV - 2 x σ EP PV +5% S29 10 m EP PV +5% S54 10 m EP PV + 2 x σ EP PV +5%
S5 10 m EP PV - 2 x σ EP PV +10% S30 10 m EP PV +10% S55 10 m EP PV + 2 x σ EP PV +10%
S6 20 m EP PV - 2 x σ EP PV -10% S31 20 m EP PV -10% S56 20 m EP PV + 2 x σ EP PV -10%
S7 20 m EP PV - 2 x σ EP PV -5% S32 20 m EP PV -5% S57 20 m EP PV + 2 x σ EP PV -5%
S8 20 m EP PV - 2 x σ EP PV 0% S33 20 m EP PV 0% S58 20 m EP PV + 2 x σ EP PV 0%
S9 20 m EP PV - 2 x σ EP PV +5% S34 20 m EP PV +5% S59 20 m EP PV + 2 x σ EP PV +5%
S10 20 m EP PV - 2 x σ EP PV +10% S35 20 m EP PV +10% S60 20 m EP PV + 2 x σ EP PV +10%
S11 30 m EP PV - 2 x σ EP PV -10% S36 30 m EP PV -10% S61 30 m EP PV + 2 x σ EP PV -10%
S12 30 m EP PV - 2 x σ EP PV -5% S37 30 m EP PV -5% S62 30 m EP PV + 2 x σ EP PV -5%
S13 30 m EP PV - 2 x σ EP PV 0% S38 30 m EP PV 0% S63 30 m EP PV + 2 x σ EP PV 0%
S14 30 m EP PV - 2 x σ EP PV +5% S39 30 m EP PV +5% S64 30 m EP PV + 2 x σ EP PV +5%
S15 30 m EP PV - 2 x σ EP PV +10% S40 30 m EP PV +10% S65 30 m EP PV + 2 x σ EP PV +10%
S16 40 m EP PV - 2 x σ EP PV -10% S41 40 m EP PV -10% S66 40 m EP PV + 2 x σ EP PV -10%
S17 40 m EP PV - 2 x σ EP PV -5% S42 40 m EP PV -5% S67 40 m EP PV + 2 x σ EP PV -5%
S18 40 m EP PV - 2 x σ EP PV 0% S43 40 m EP PV 0% S68 40 m EP PV + 2 x σ EP PV 0%
S19 40 m EP PV - 2 x σ EP PV +5% S44 40 m EP PV +5% S69 40 m EP PV + 2 x σ EP PV +5%
S20 40 m EP PV - 2 x σ EP PV +10% S45 40 m EP PV +10% S70 40 m EP PV + 2 x σ EP PV +10%
S21 50 m EP PV - 2 x σ EP PV -10% S46 50 m EP PV -10% S71 50 m EP PV + 2 x σ EP PV -10%
S22 50 m EP PV - 2 x σ EP PV -5% S47 50 m EP PV -5% S72 50 m EP PV + 2 x σ EP PV -5%
S23 50 m EP PV - 2 x σ EP PV 0% S48 50 m EP PV 0% S73 50 m EP PV + 2 x σ EP PV 0%
S24 50 m EP PV - 2 x σ EP PV +5% S49 50 m EP PV +5% S74 50 m EP PV + 2 x σ EP PV +5%
S25 50 m EP PV - 2 x σ EP PV +10% S50 50 m EP PV +10% S75 50 m EP PV + 2 x σ EP PV +10%
Table 3. The maximum value of the phase voltage obtained after performing the steady-state calculations in the analysed scenarios characterized by the features of the three indicators (PD, EPV, and CEC) without applying RBES.
CEC
[%]
PD [%]
10 20 30 40 50
EPLPV EPAPV EPHPV EPLPV EPAPV EPHPV EPLPV EPAPV EPHPV EPLPV EPAPV EPHPV EPLPV EPAPV EPHPV
m EP PV -   2 x σ EP PV m EP PV m EP PV + 2 x σ EP PV m EP PV -   2 x σ EP PV m EP PV m EP PV + 2 x σ EP PV m EP PV -   2 x σ EP PV m EP PV m EP PV + 2 x σ EP PV m EP PV -   2 x σ EP PV m EP PV m EP PV + 2 x σ EP PV m EP PV -   2 x σ EP PV m EP PV m EP PV + 2 x σ EP PV
-10 1.053 1.053 1.053 1.053 1.074 1.130 1.059 1.127 1.201 1.081 1.175 1.263 1.128 1.209 1.285
-5 1.053 1.053 1.053 1.053 1.065 1.125 1.057 1.119 1.196 1.075 1.167 1.259 1.125 1.207 1.283
0 1.053 1.053 1.053 1.053 1.064 1.118 1.054 1.114 1.189 1.071 1.162 1.252 1.123 1.205 1.281
5 1.053 1.053 1.053 1.053 1.063 1.110 1.053 1.109 1.182 1.068 1.157 1.245 1.121 1.201 1.279
10 1.053 1.053 1.053 1.053 1.062 1.105 1.053 1.103 1.177 1.066 1.152 1.241 1.119 1.201 1.278
Table 4. The total energy losses in the conductors calculated in the analysed scenarios characterized by the features of the three indicators (PD, EPV, and CEC) without applying RBES.
CEC
[%]
PD [%]
10 20 30 40 50
EPLPV EPAPV EPHPV EPLPV EPAPV EPHPV EPLPV EPAPV EPHPV EPLPV EPAPV EPHPV EPLPV EPAPV EPHPV
m EP PV -   2 x σ EP PV m EP PV m EP PV + 2 x σ EP PV m EP PV -   2 x σ EP PV m EP PV m EP PV + 2 x σ EP PV m EP PV -   2 x σ EP PV m EP PV m EP PV + 2 x σ EP PV m EP PV -   2 x σ EP PV m EP PV m EP PV + 2 x σ EP PV m EP PV -   2 x σ EP PV m EP PV m EP PV + 2 x σ EP PV
-10 39.4 42.5 48.0 41.8 42.8 48.2 39.4 47.6 70.8 40.0 62.0 107.5 46.1 85.4 157.1
-5 44.4 48.5 54.3 46.6 48.3 51.9 44.2 51.3 73.0 44.1 64.7 108.5 49.9 87.6 157.4
0 50.0 54.9 61.2 51.8 54.4 56.2 49.5 55.2 75.8 48.7 67.6 110.2 54.1 90.0 158.2
5 56.1 61.3 68.5 57.1 60.9 60.9 55.1 59.4 79.0 53.6 70.9 112.1 58.7 92.8 159.5
10 62.2 68.3 76.2 62.9 65.6 67.8 61.5 64.0 82.3 59.3 74.5 114.3 64.0 95.9 161.0
Table 5. The maximum value of the phase voltage obtained after performing the steady-state calculations in the analyzed scenarios characterized by the features of the three indicators (PD, EPV, and CEC) with applying RBES.
CEC
[%]
PD [%]
10 20 30 40 50
EPLPV EPAPV EPHPV EPLPV EPAPV EPHPV EPLPV EPAPV EPHPV EPLPV EPAPV EPHPV EPLPV EPAPV EPHPV
m EP PV -   2 x σ EP PV m EP PV m EP PV + 2 x σ EP PV m EP PV -   2 x σ EP PV m EP PV m EP PV + 2 x σ EP PV m EP PV -   2 x σ EP PV m EP PV m EP PV + 2 x σ EP PV m EP PV -   2 x σ EP PV m EP PV m EP PV + 2 x σ EP PV m EP PV -   2 x σ EP PV m EP PV m EP PV + 2 x σ EP PV
-10 1.053 1.053 1.053 1.053 1.074 1.090 1.059 1.089 1.098 1.081 1.087 1.143 1.097 1.095 1.137
-5 1.053 1.053 1.053 1.053 1.065 1.100 1.057 1.100 1.100 1.075 1.099 1.138 1.100 1.097 1.135
0 1.053 1.053 1.053 1.053 1.064 1.096 1.054 1.095 1.098 1.071 1.098 1.131 1.098 1.099 1.133
5 1.053 1.053 1.053 1.053 1.063 1.091 1.053 1.089 1.098 1.068 1.093 1.123 1.098 1.097 1.131
10 1.053 1.053 1.053 1.053 1.062 1.091 1.053 1.091 1.098 1.066 1.091 1.118 1.096 1.095 1.129
Table 6. The total energy losses in the conductors calculated in the analyzed scenarios characterized by the features of the three indicators (PD, EPV, and CEC) by applying RBES.
CEC
[%]
PD [%]
10 20 30 40 50
EPLPV EPAPV EPHPV EPLPV EPAPV EPHPV EPLPV EPAPV EPHPV EPLPV EPAPV EPHPV EPLPV EPAPV EPHPV
m EP PV -   2 x σ EP PV m EP PV m EP PV + 2 x σ EP PV m EP PV -   2 x σ EP PV m EP PV m EP PV + 2 x σ EP PV m EP PV -   2 x σ EP PV m EP PV m EP PV + 2 x σ EP PV m EP PV -   2 x σ EP PV m EP PV m EP PV + 2 x σ EP PV m EP PV -   2 x σ EP PV m EP PV m EP PV + 2 x σ EP PV
-10 39.4 42.5 48.0 41.8 42.8 48.1 39.4 47.5 77.4 40.0 65.8 127.8 46.6 95.5 191.3
-5 44.4 48.5 54.3 46.6 48.3 51.7 44.2 51.1 78.6 44.1 67.8 128.0 49.9 97.1 190.5
0 50.0 54.9 61.2 51.8 54.4 55.6 49.5 54.6 80.3 48.7 69.1 128.5 53.7 97.9 190.0
5 56.1 61.3 68.5 57.1 60.9 60.2 55.1 58.7 82.6 53.6 72.1 129.9 58.1 100.2 190.6
10 62.2 68.3 76.2 62.9 65.6 64.3 61.5 62.7 84.9 59.3 75.1 130.0 62.8 102.5 190.5
Table 7. The values of UVD, in [%], calculated for the scenarios S56 - S60 and S71 - S75. (EPHPV = m EP PV + 2 x σ EP PV ).
PD [%] CEC [%]
-10 -5 0 5 10
40 2.86 / S57 2.48 / S56 2.11 / S58 1.87 / S59 1.73 / S60
50 4.98 / S71 4.91 / S72 4.71 / S73 4.60 / S74 4.49 / S75
Table 8. The errors between the energy losses calculated with the MM method and RBES, in [%].
CEC
[%]
PD [%]
10 20 30 40 50
EPLPV EPAPV EPHPV EPLPV EPAPV EPHPV EPLPV EPAPV EPHPV EPLPV EPAPV EPHPV EPLPV EPAPV EPHPV
m EP PV -   2 x σ EP PV m EP PV m EP PV + 2 x σ EP PV m EP PV -   2 x σ EP PV m EP PV m EP PV + 2 x σ EP PV m EP PV -   2 x σ EP PV m EP PV m EP PV + 2 x σ EP PV m EP PV -   2 x σ EP PV m EP PV m EP PV + 2 x σ EP PV m EP PV -   2 x σ EP PV m EP PV m EP PV + 2 x σ EP PV
-10 2.50 2.85 2.96 2.84 3.54 2.87 3.19 3.32 1.60 3.46 2.05 0.00 3.04 1.04 0.00
-5 2.18 2.10 2.10 2.08 2.78 2.99 2.29 3.60 1.56 3.02 2.28 0.00 2.90 1.02 0.00
0 1.89 1.77 1.64 1.75 2.31 2.68 1.91 2.60 1.61 2.14 2.05 0.00 2.18 1.16 0.00
5 1.50 1.78 1.68 1.77 2.19 2.60 1.84 2.50 1.41 2.10 1.77 0.00 2.31 0.94 0.00
10 1.34 1.61 1.47 1.79 1.84 2.32 1.60 2.21 1.38 1.80 1.50 0.00 2.08 0.85 0.00
Table 9. The errors between maximum values of the phase voltage calculated with the MM method and RBES, in [%].
CEC
[%]
PD [%]
10 20 30 40 50
EPLPV EPAPV EPHPV EPLPV EPAPV EPHPV EPLPV EPAPV EPHPV EPLPV EPAPV EPHPV EPLPV EPAPV EPHPV
m EP PV -   2 x σ EP PV m EP PV m EP PV + 2 x σ EP PV m EP PV -   2 x σ EP PV m EP PV m EP PV + 2 x σ EP PV m EP PV -   2 x σ EP PV m EP PV m EP PV + 2 x σ EP PV m EP PV -   2 x σ EP PV m EP PV m EP PV + 2 x σ EP PV m EP PV -   2 x σ EP PV m EP PV m EP PV + 2 x σ EP PV
-10 0.08 0.08 0.08 0.08 1.98 0.53 0.62 0.91 0.35 2.62 0.00 0.00 1.35 0.00 0.00
-5 0.00 0.00 0.00 0.00 0.00 1.83 0.00 2.27 0.00 0.85 1.68 0.00 1.85 0.00 0.00
0 0.00 0.00 0.00 0.00 0.00 1.68 0.00 1.57 0.00 0.17 0.17 0.00 1.87 0.00 0.00
5 0.00 0.00 0.00 0.00 0.00 1.23 0.00 1.11 0.00 0.24 0.24 0.00 1.89 0.00 0.00
10 0.00 0.00 0.00 0.00 0.00 0.00 0.00 0.00 0.44 0.00 0.00 0.00 0.45 0.00 0.00
Table 10. The additional tap position changes of the OLTC (MM vs. RBES).
CEC
[%]
PD [%]
10 20 30 40 50
EPLPV EPAPV EPHPV EPLPV EPAPV EPHPV EPLPV EPAPV EPHPV EPLPV EPAPV EPHPV EPLPV EPAPV EPHPV
m EP PV -   2 x σ EP PV m EP PV m EP PV + 2 x σ EP PV m EP PV -   2 x σ EP PV m EP PV m EP PV + 2 x σ EP PV m EP PV -   2 x σ EP PV m EP PV m EP PV + 2 x σ EP PV m EP PV -   2 x σ EP PV m EP PV m EP PV + 2 x σ EP PV m EP PV -   2 x σ EP PV m EP PV m EP PV + 2 x σ EP PV
-10 0 0 0 0 0 4 0 4 4 0 4 0 6 1 0
-5 0 0 0 0 0 4 0 4 2 0 2 0 4 1 0
0 0 0 0 0 0 4 0 4 2 0 4 0 0 2 0
5 0 0 0 0 0 4 0 4 2 0 4 0 2 2 0
10 0 0 0 0 0 4 0 4 2 0 2 0 2 2 0
Disclaimer/Publisher’s Note: The statements, opinions and data contained in all publications are solely those of the individual author(s) and contributor(s) and not of MDPI and/or the editor(s). MDPI and/or the editor(s) disclaim responsibility for any injury to people or property resulting from any ideas, methods, instructions or products referred to in the content.
Copyright: This open access article is published under a Creative Commons CC BY 4.0 license, which permit the free download, distribution, and reuse, provided that the author and preprint are cited in any reuse.
Prerpints.org logo

Preprints.org is a free preprint server supported by MDPI in Basel, Switzerland.

Subscribe

© 2024 MDPI (Basel, Switzerland) unless otherwise stated