Submitted:
04 April 2023
Posted:
05 April 2023
You are already at the latest version
Abstract
Keywords:
1. Introduction
2. Materials and methods
2.1. Chemicals and reagents
2.2. Experimental animals
2.3. Maintenance of Dalton’s lymphoma (DL) in vivo
2.4. Experimental groups
2.5. Cell culture and treatments
2.6. Immunofluorescence for CD63
2.7. Immunohistochemistry for CD63
2.8. Isolation of exosomes
2.9. Electron microscopy
2.10. Dynamic light scattering (DLS)
2.11. Western blotting
2.12. Liquid chromatography-mass spectrometry (LC-MS) analysis
2.13. Exosome uptake assay
2.14. Morphological analysis
2.15. Phagocytic assay
2.16. Reactive oxygen species (ROS) detection
2.17. Nitrite estimation
2.18. RNA extraction and real-time quantitative PCR
2.19. Statistical analysis
3. Results
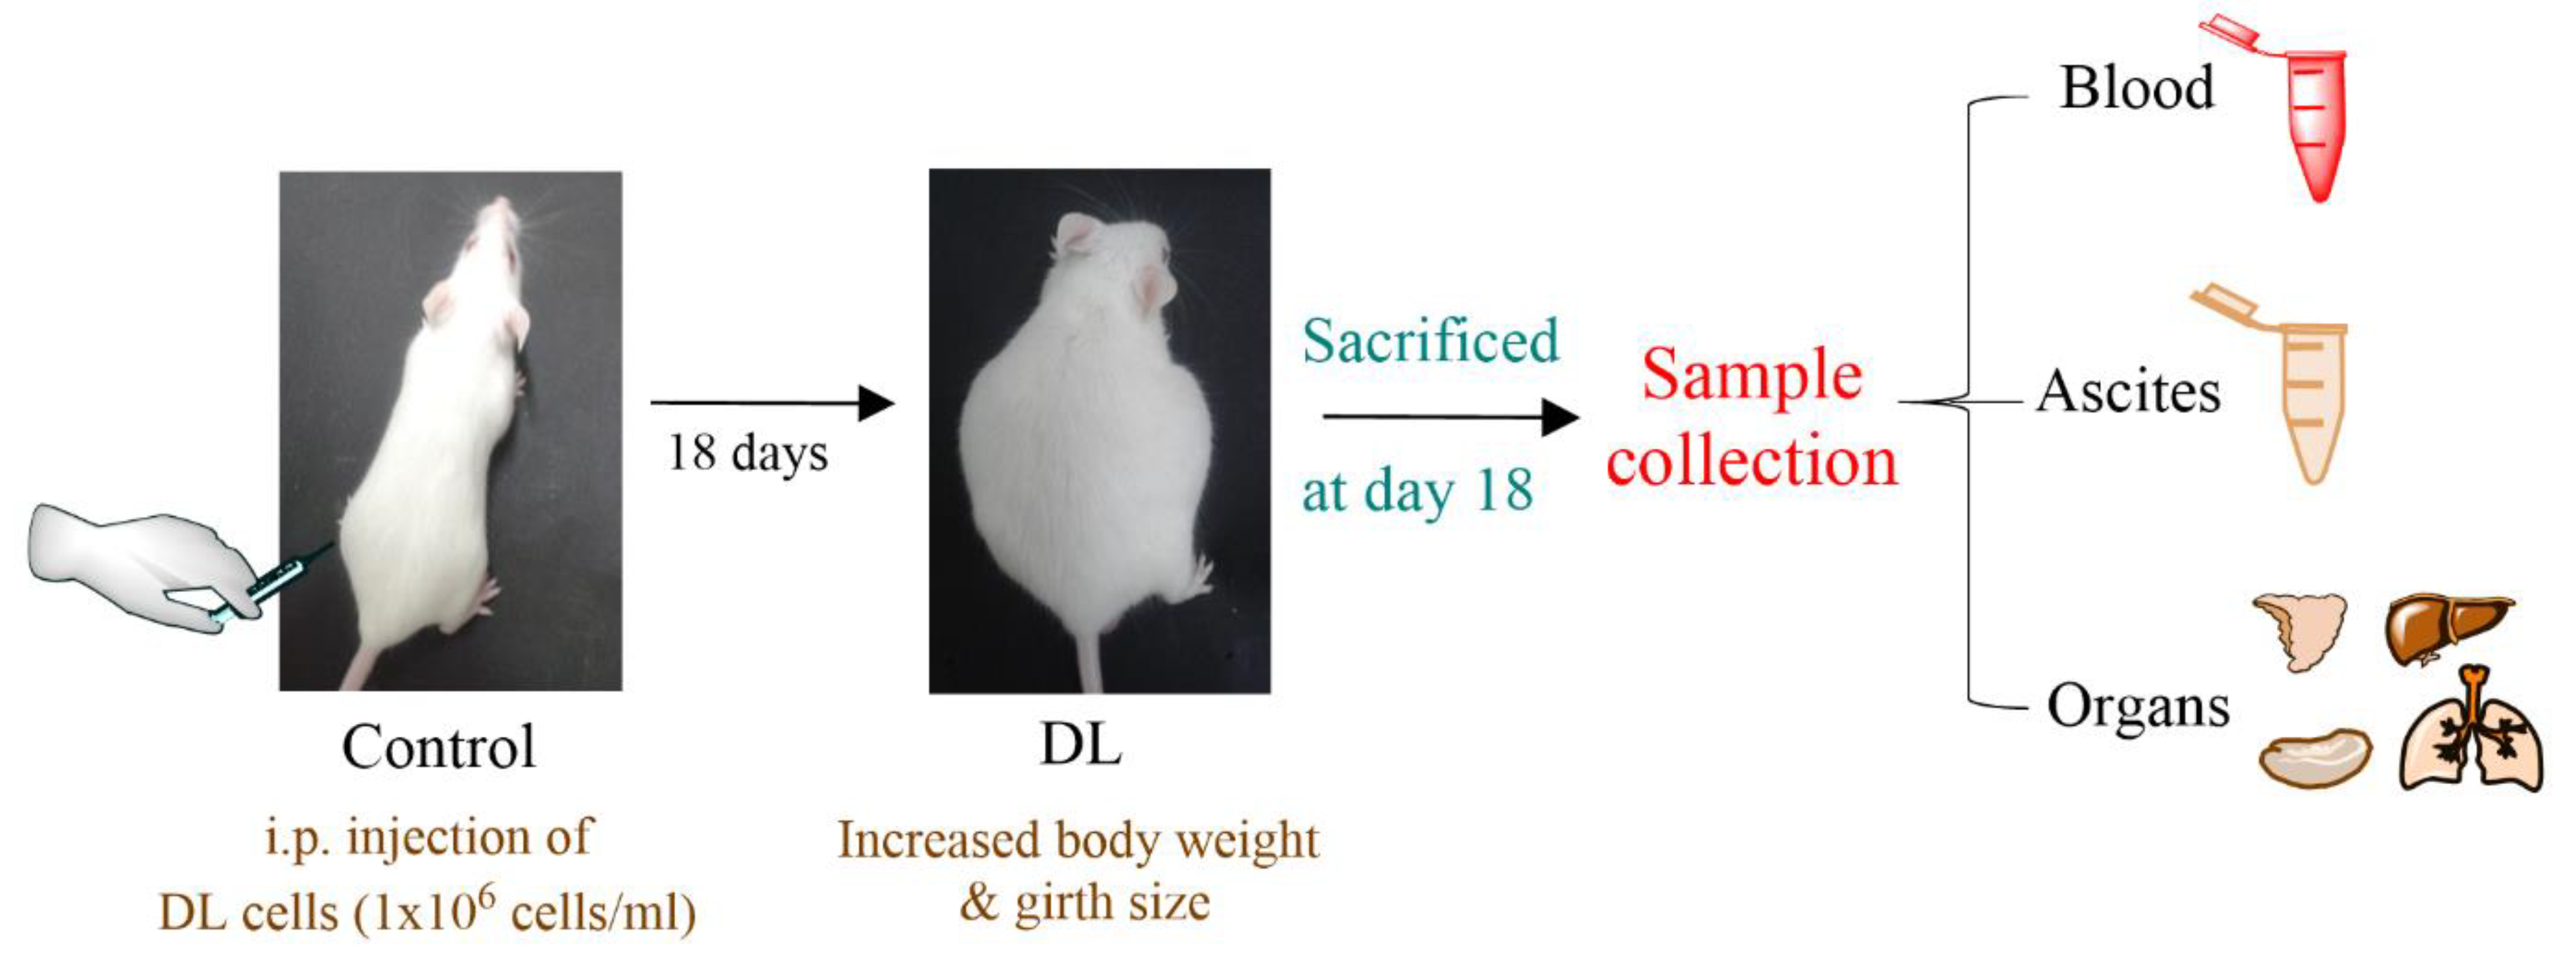
3.1. Experimental design
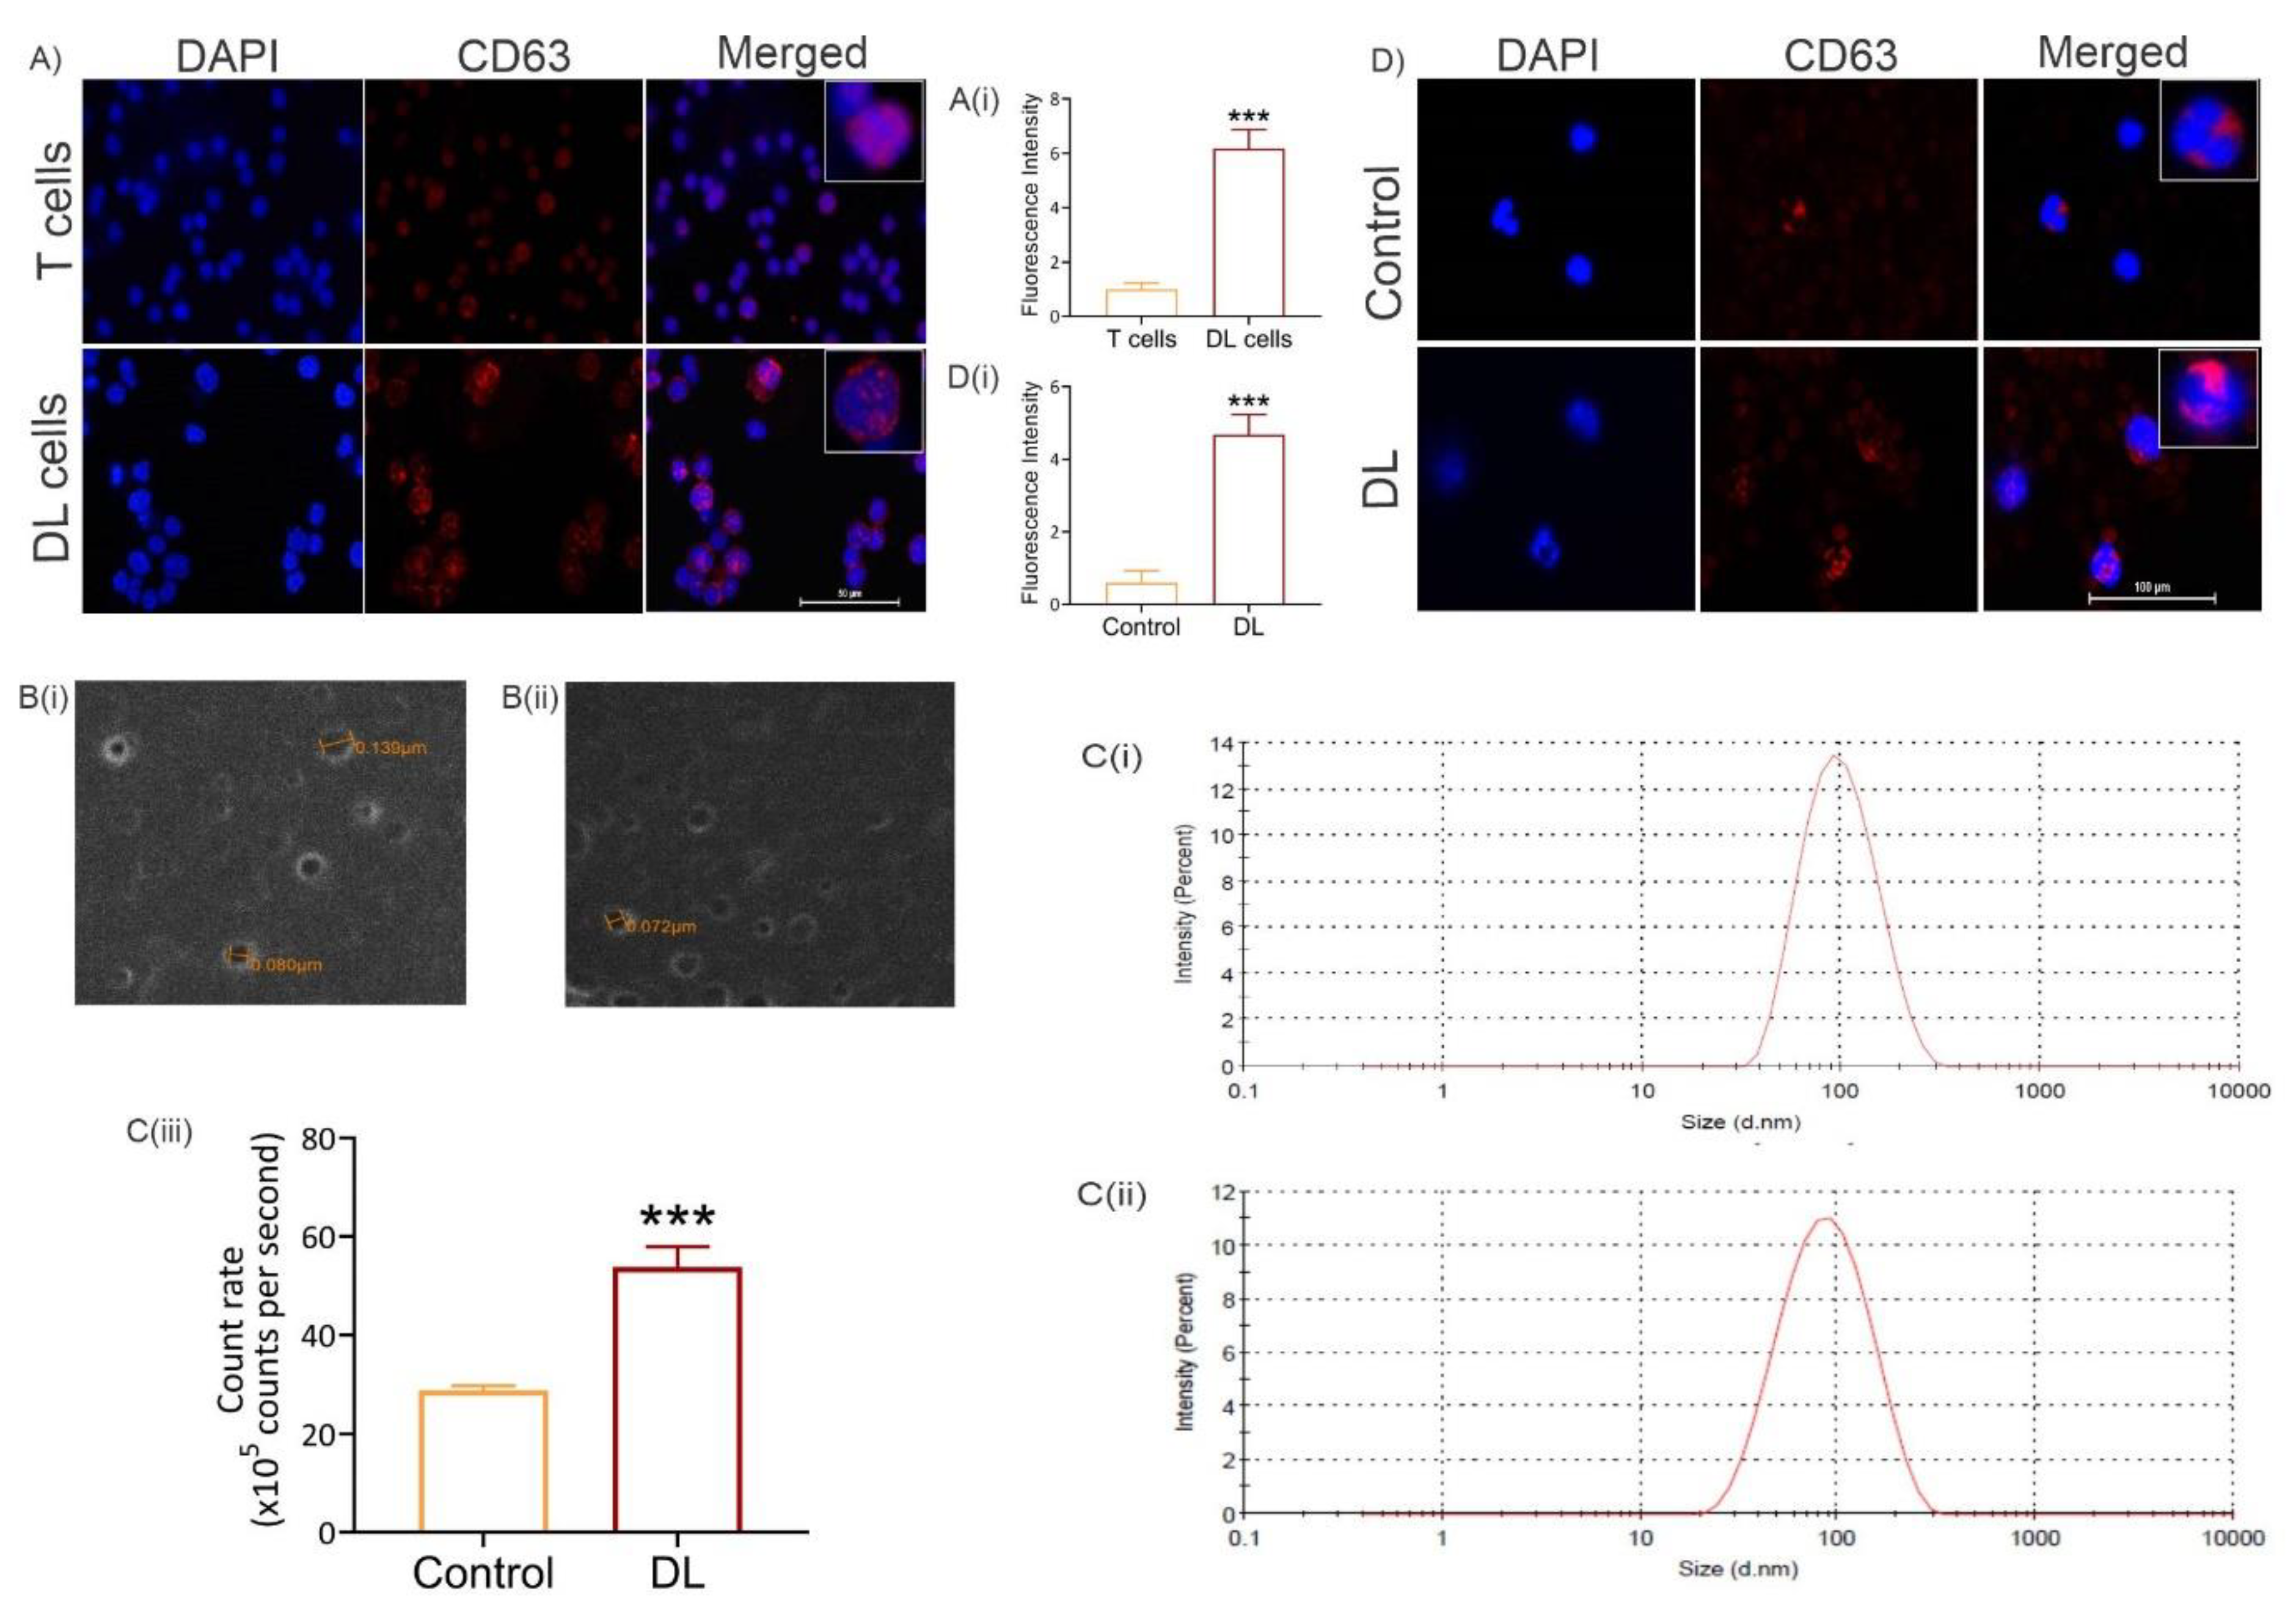
3.2. Exosome level increases in tumor cells and in peripheral blood of tumor-bearing mice
3.3. Exosome level increases systemically in tumor-bearing hosts
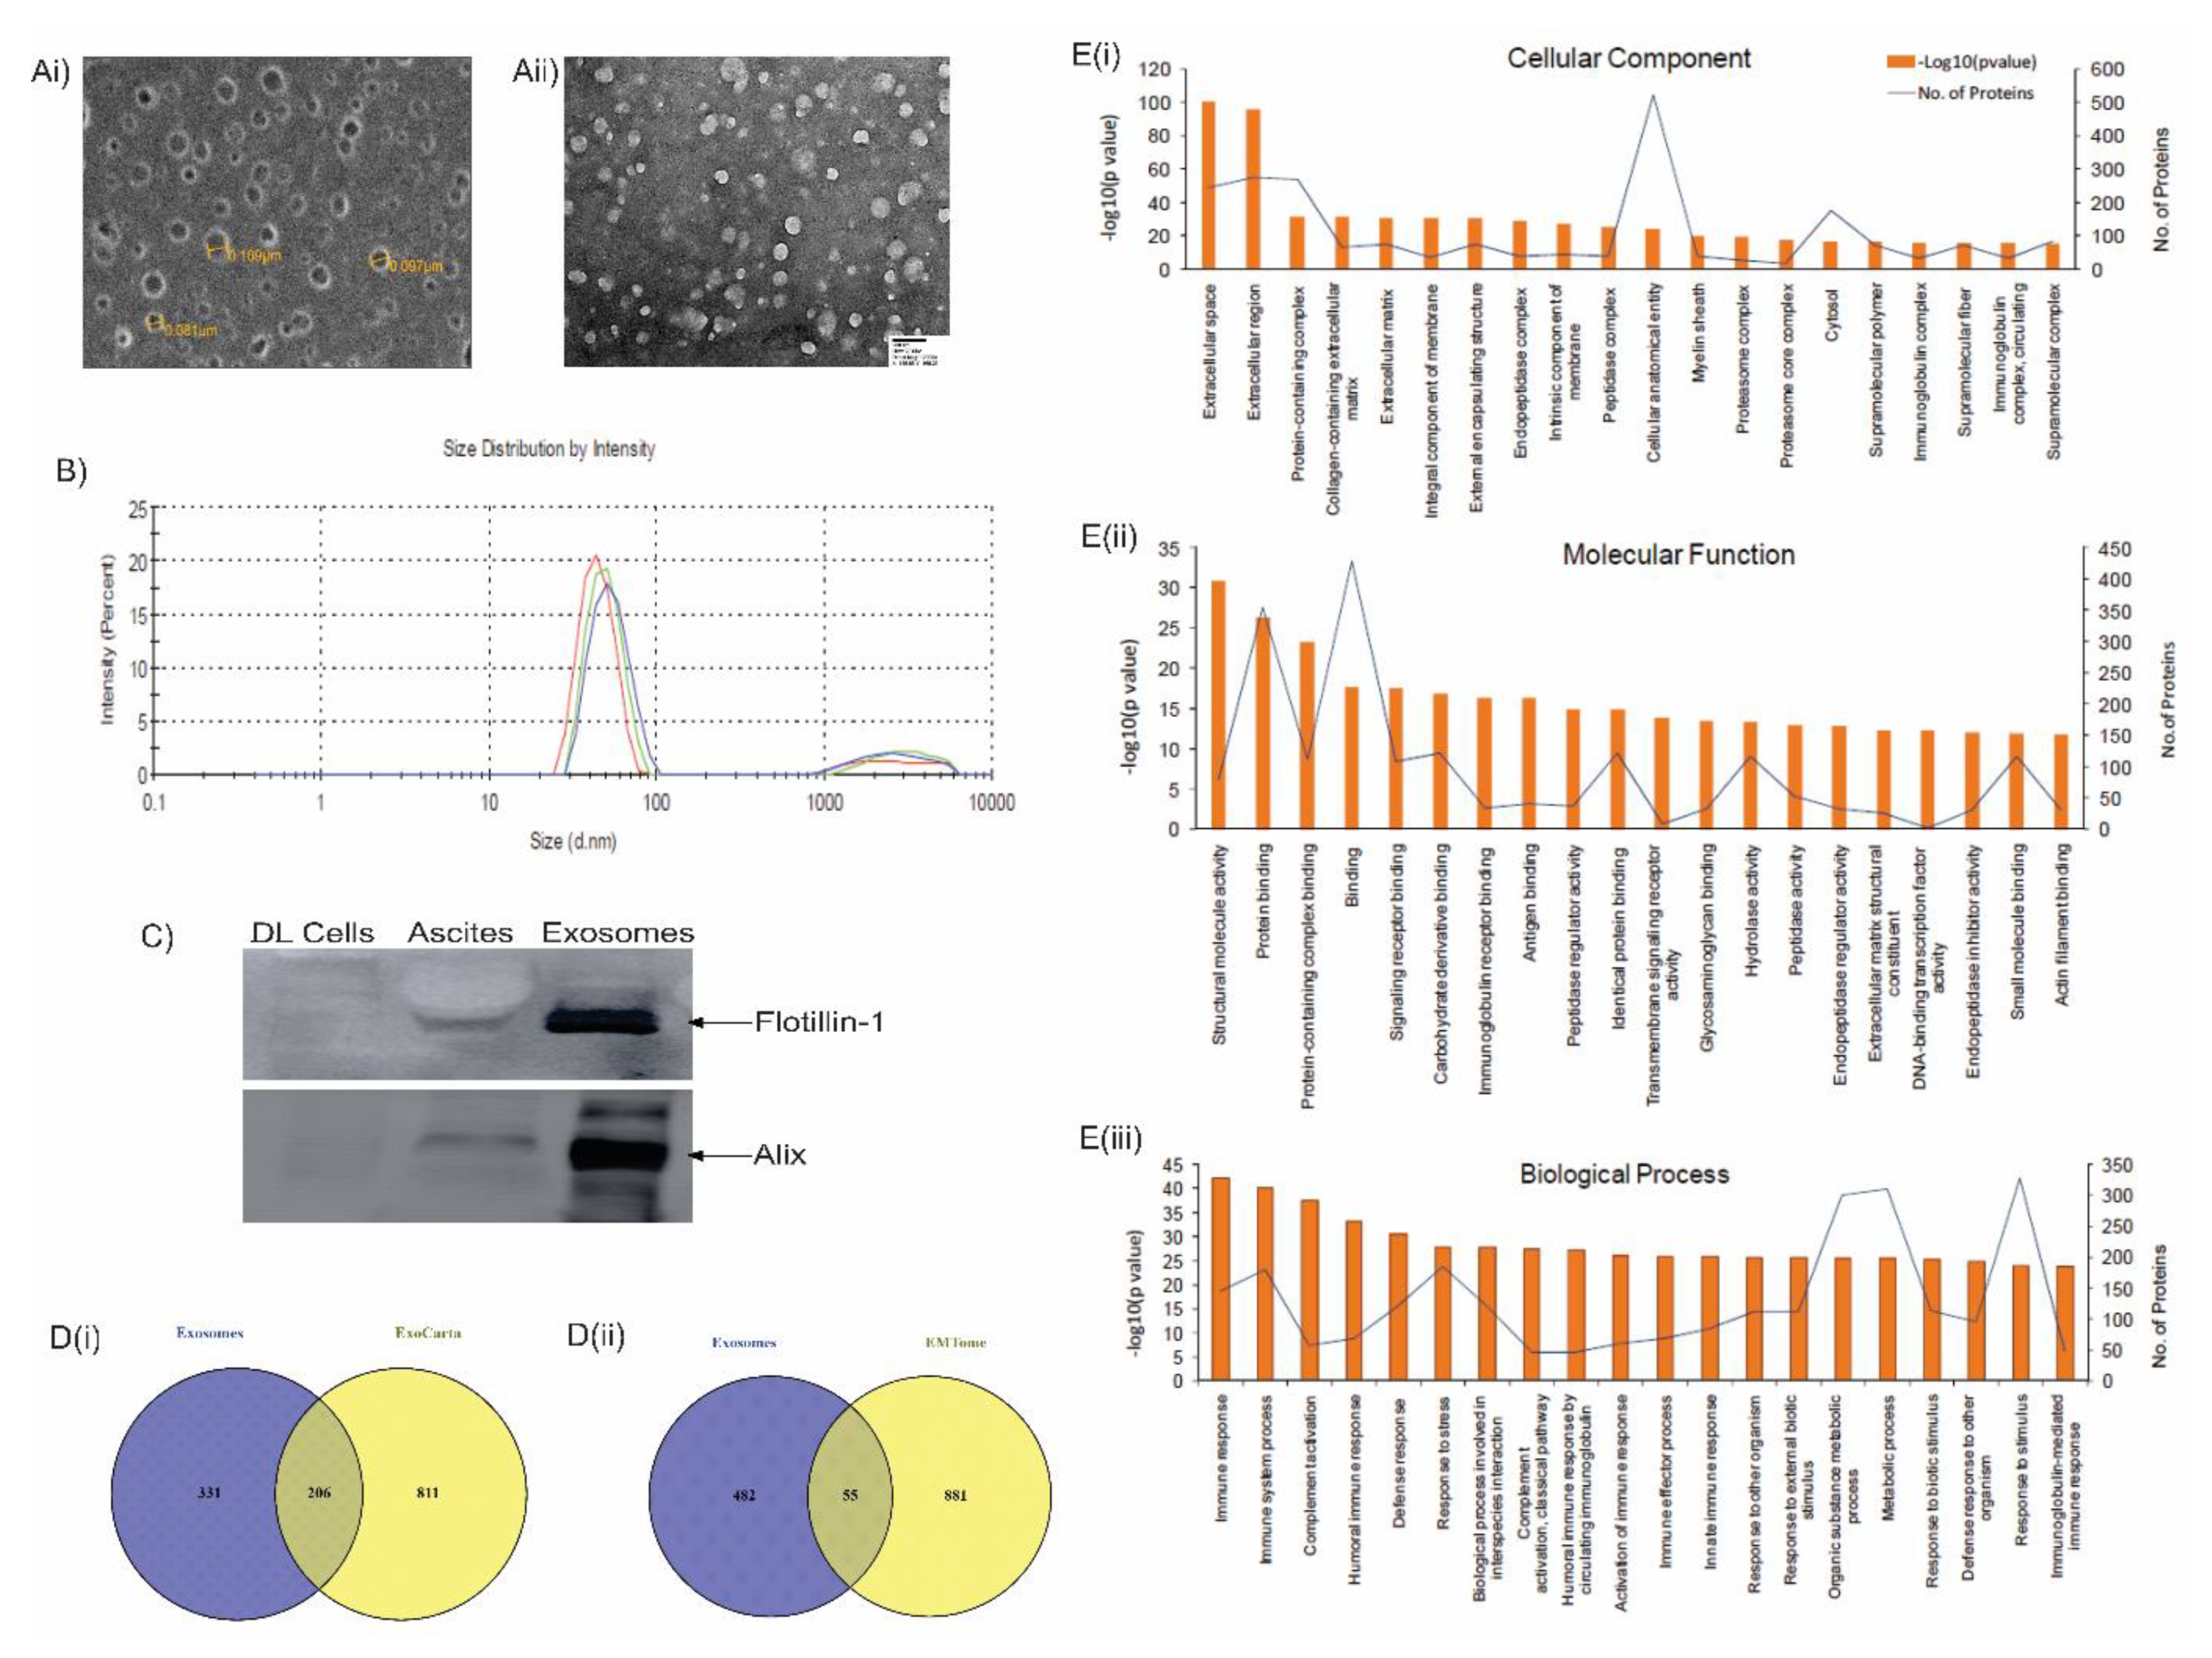
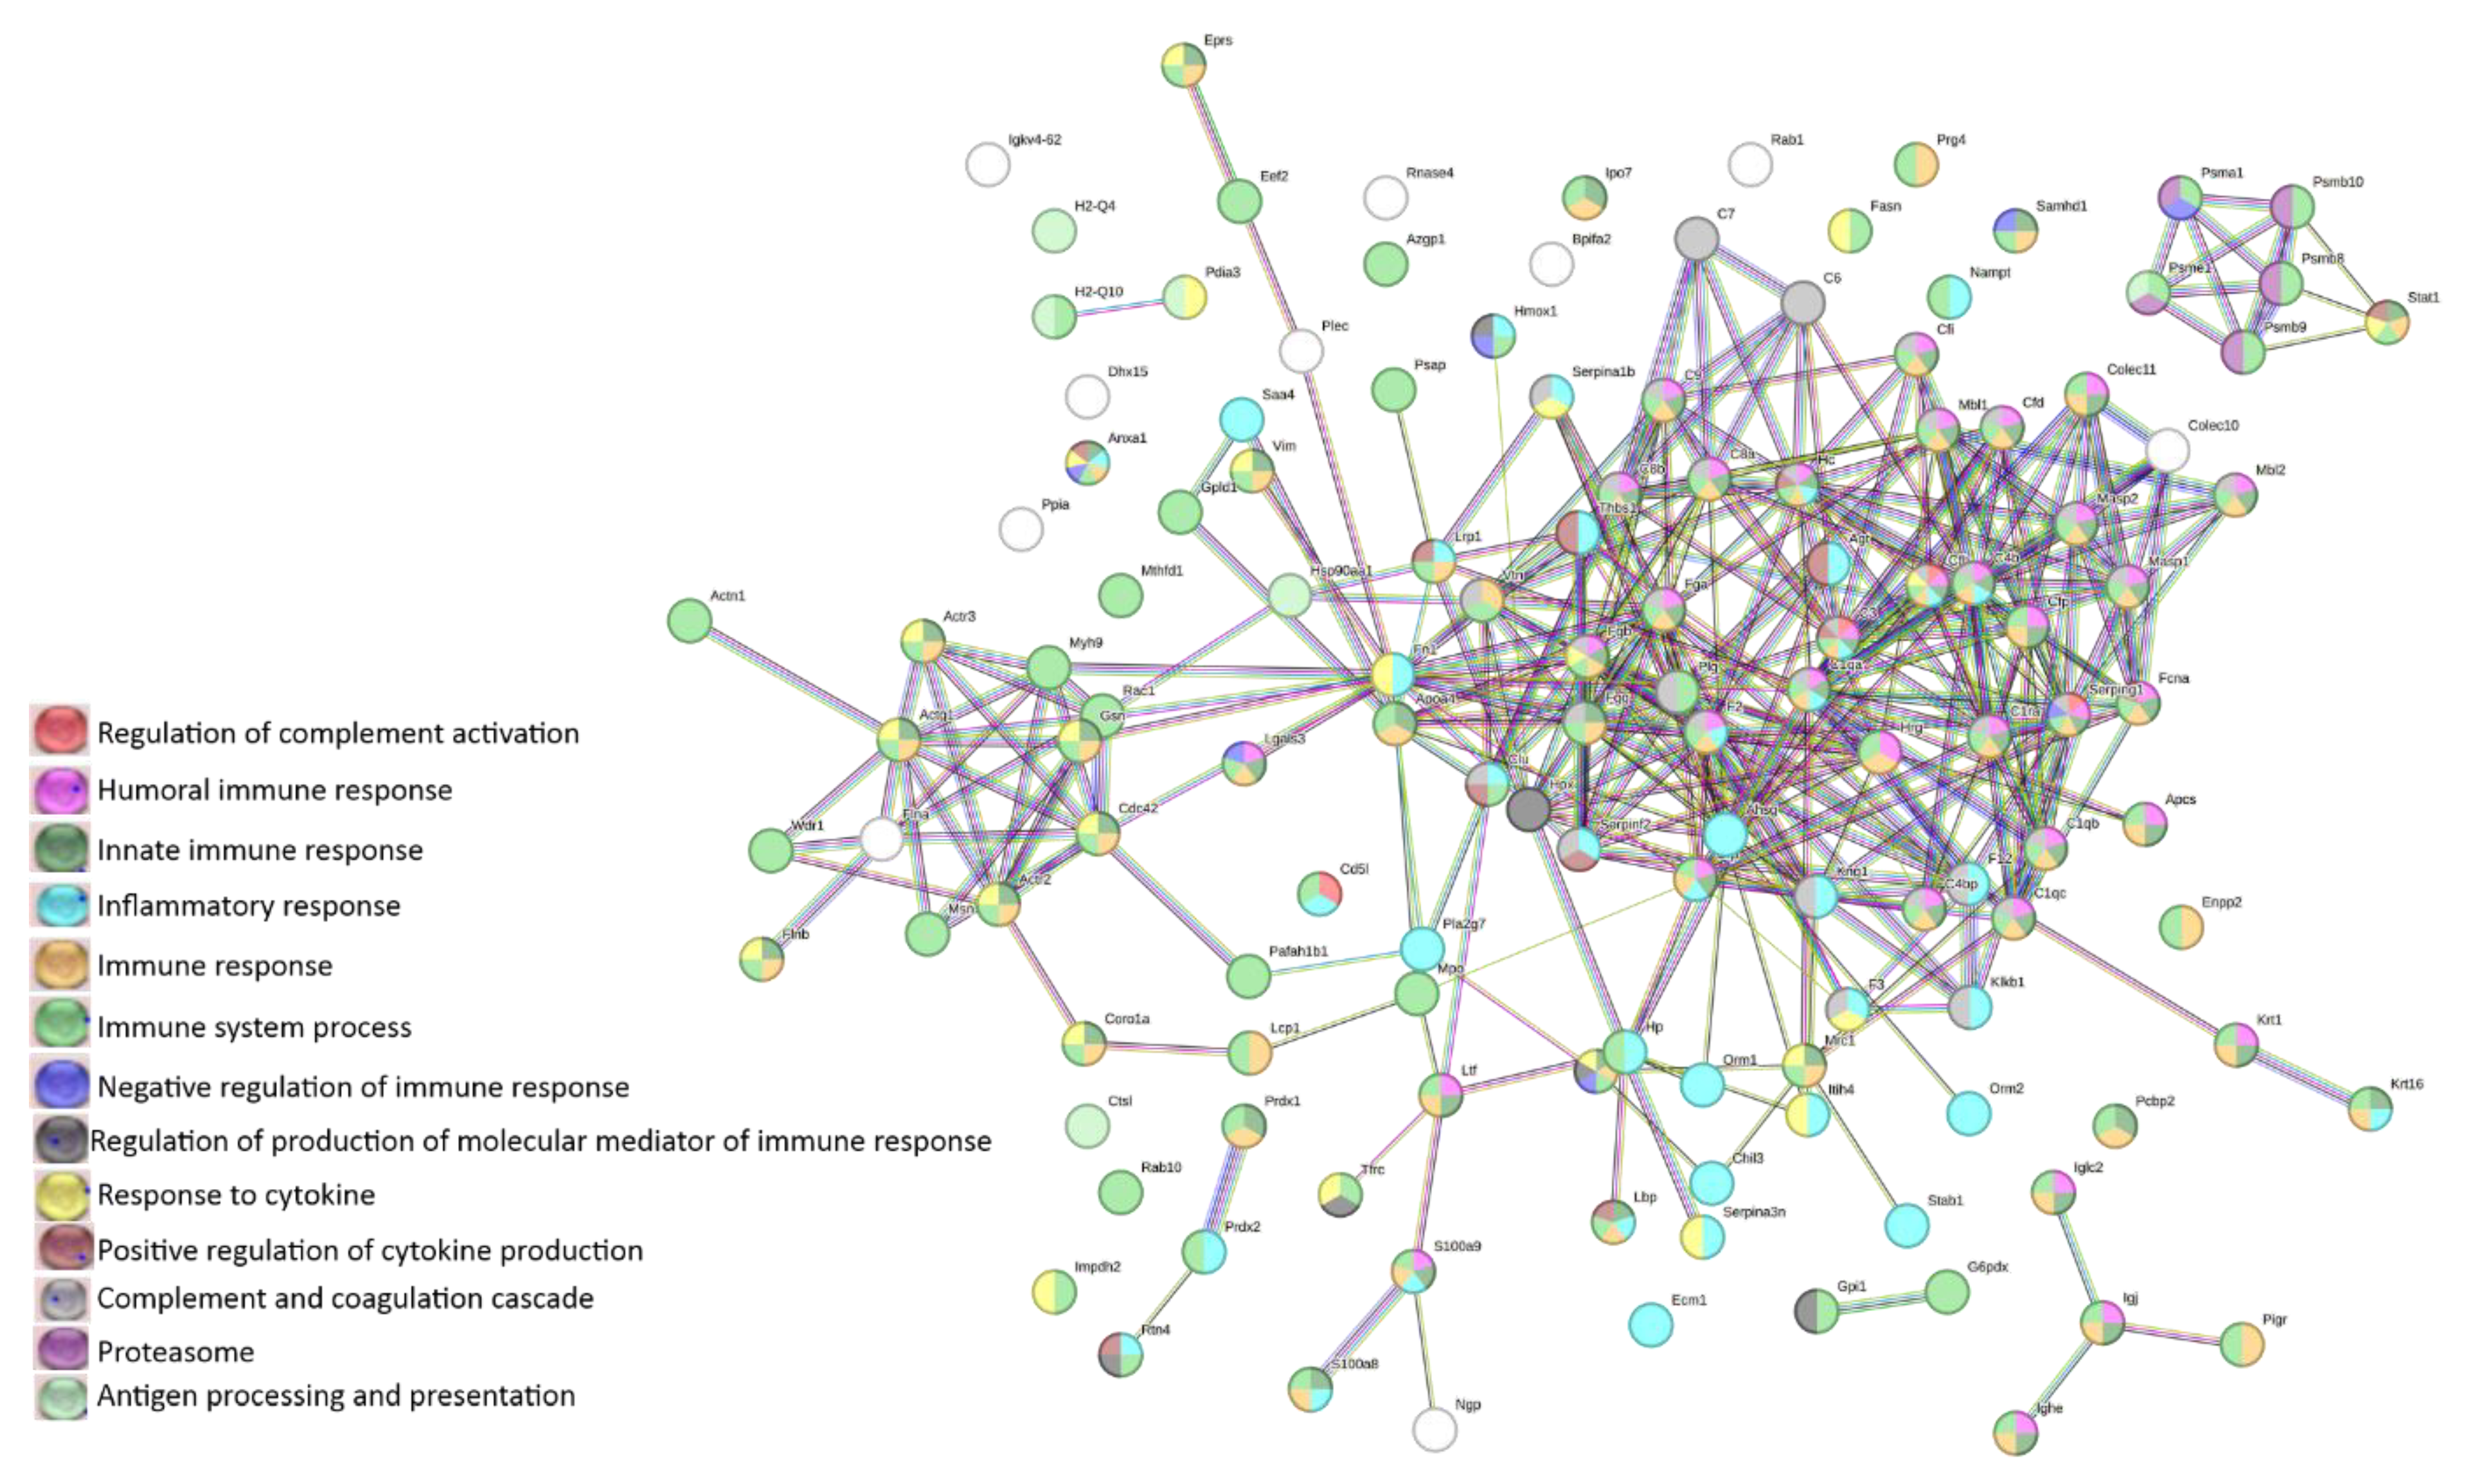
3.4. LC-MS analysis of lymphoma-derived exosomes reveals presence of immunomodulatory proteins
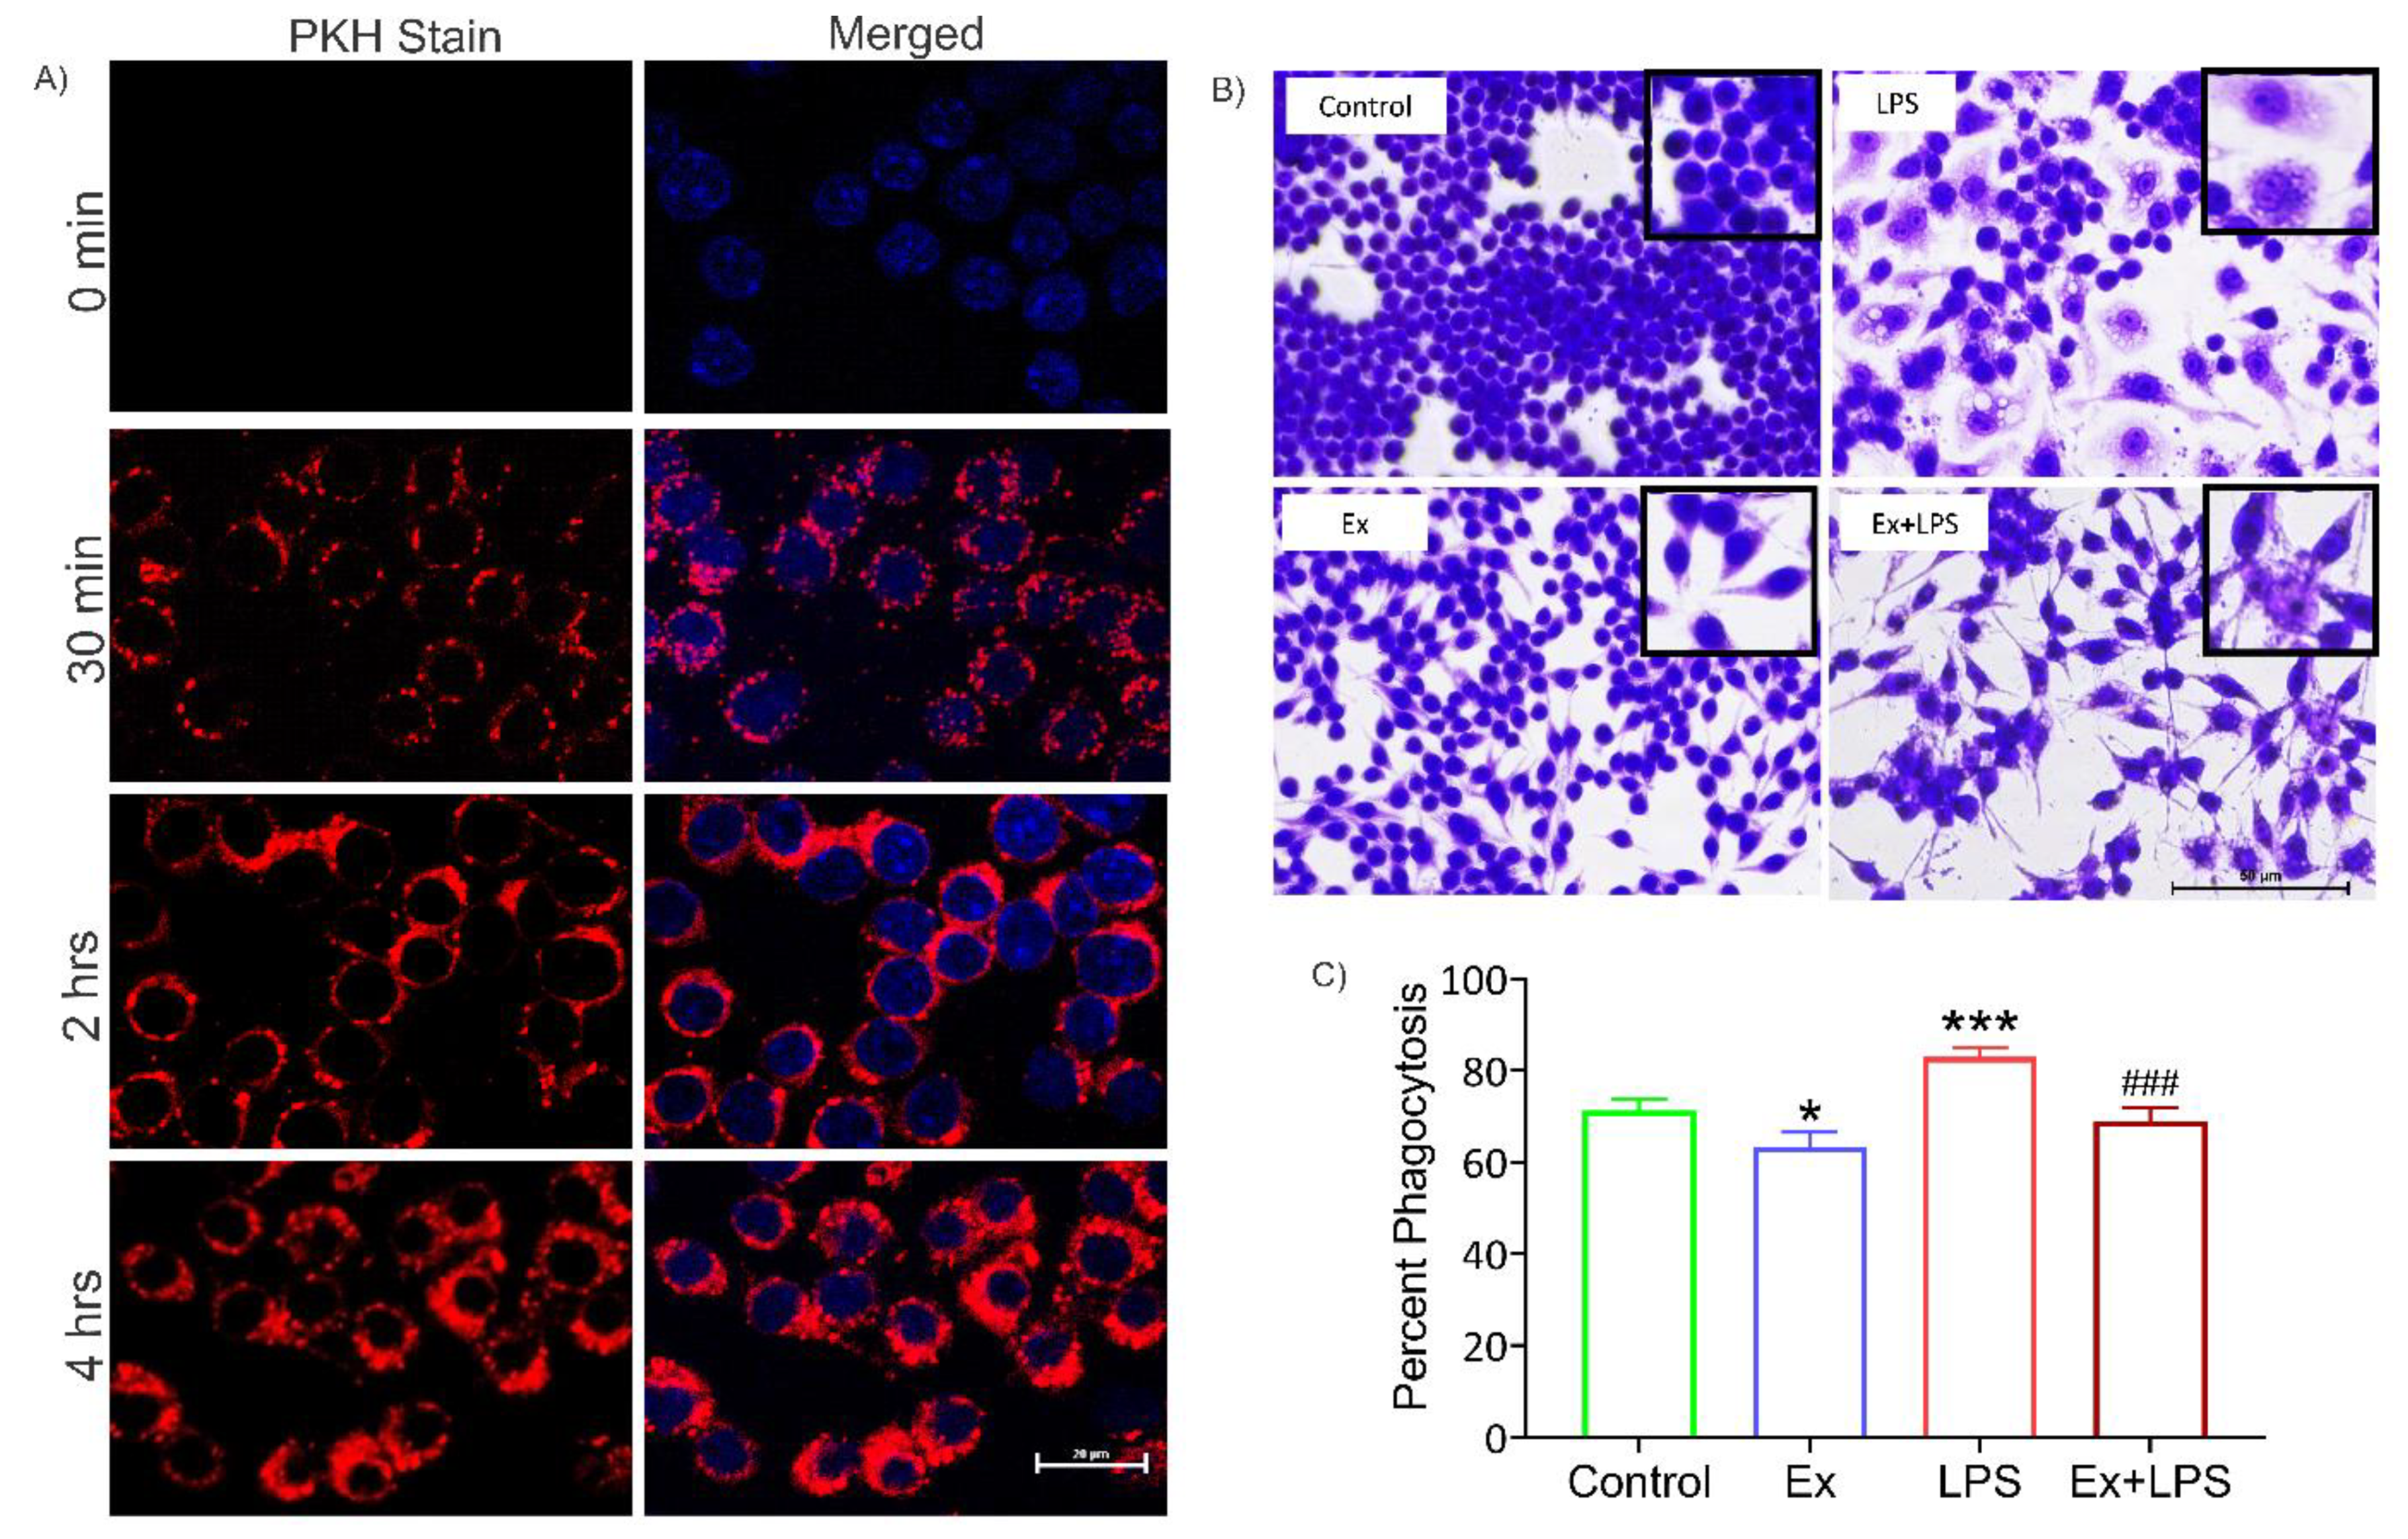
3.5. Alteration in macrophage morphology and their reduced phagocytic activity upon uptake of lymphoma-derived exosomes
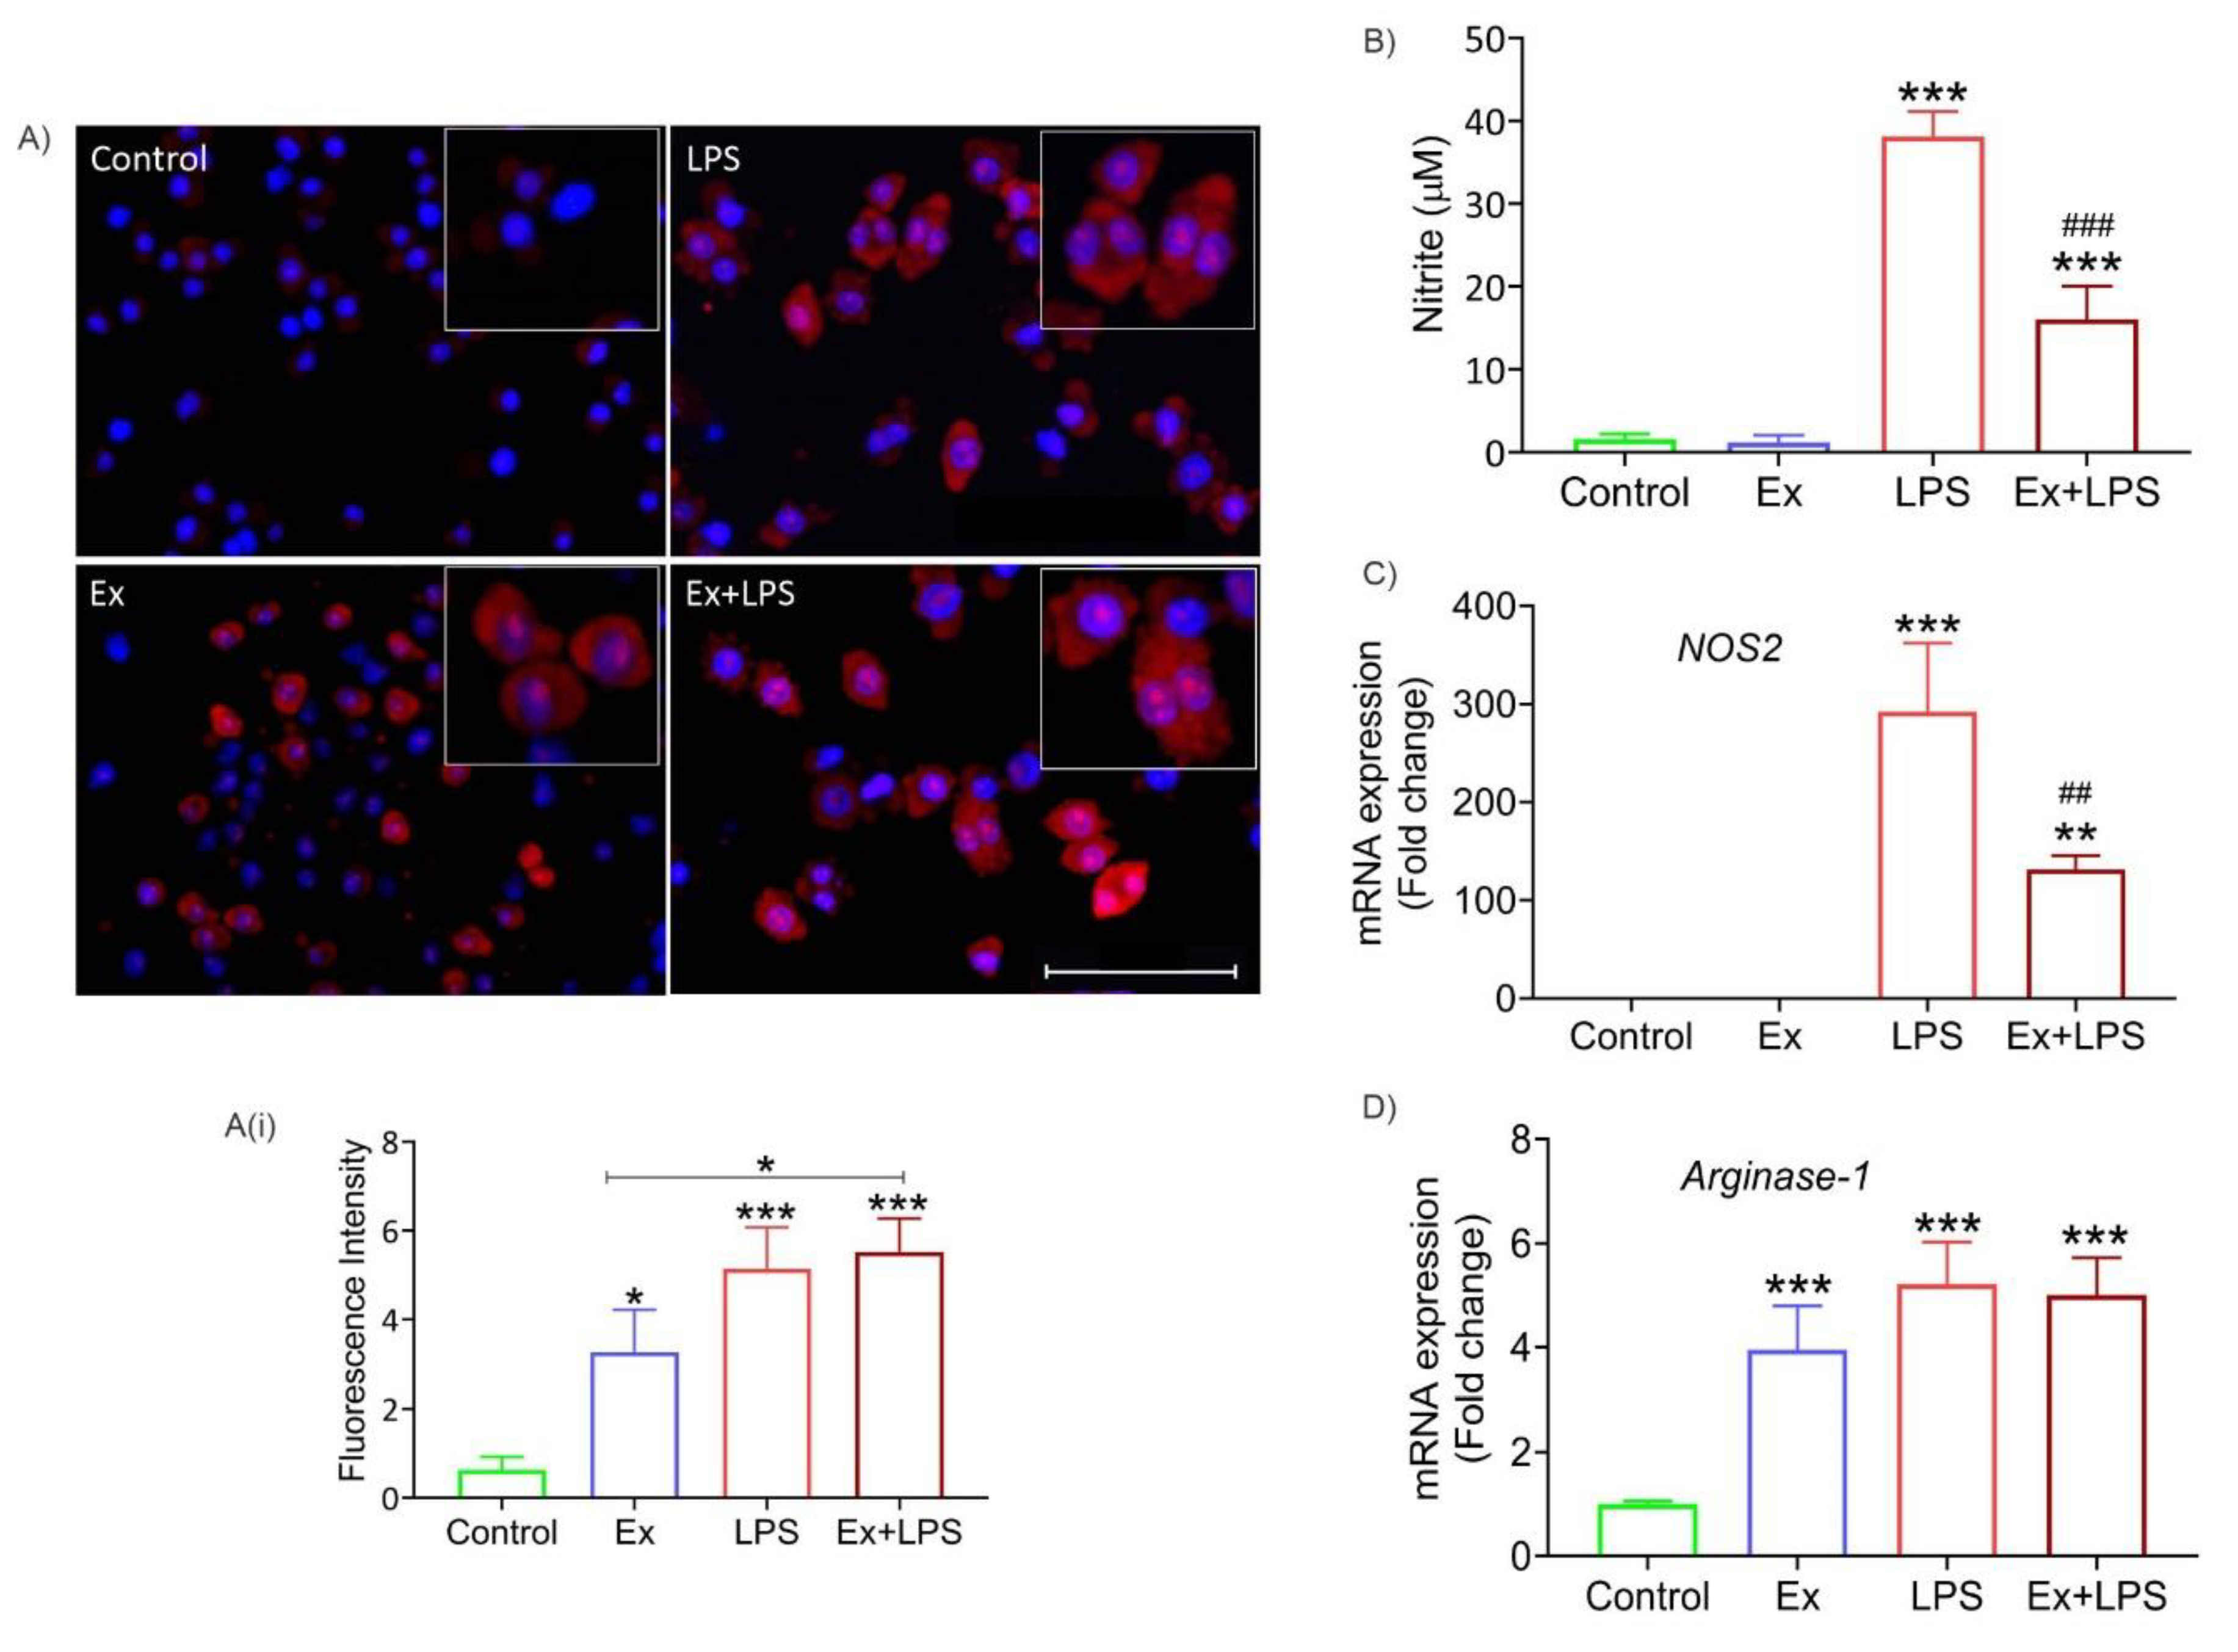
3.6. Lymphoma-derived exosomes increase ROS levels and arginase-1 expression (M2 marker) in macrophages
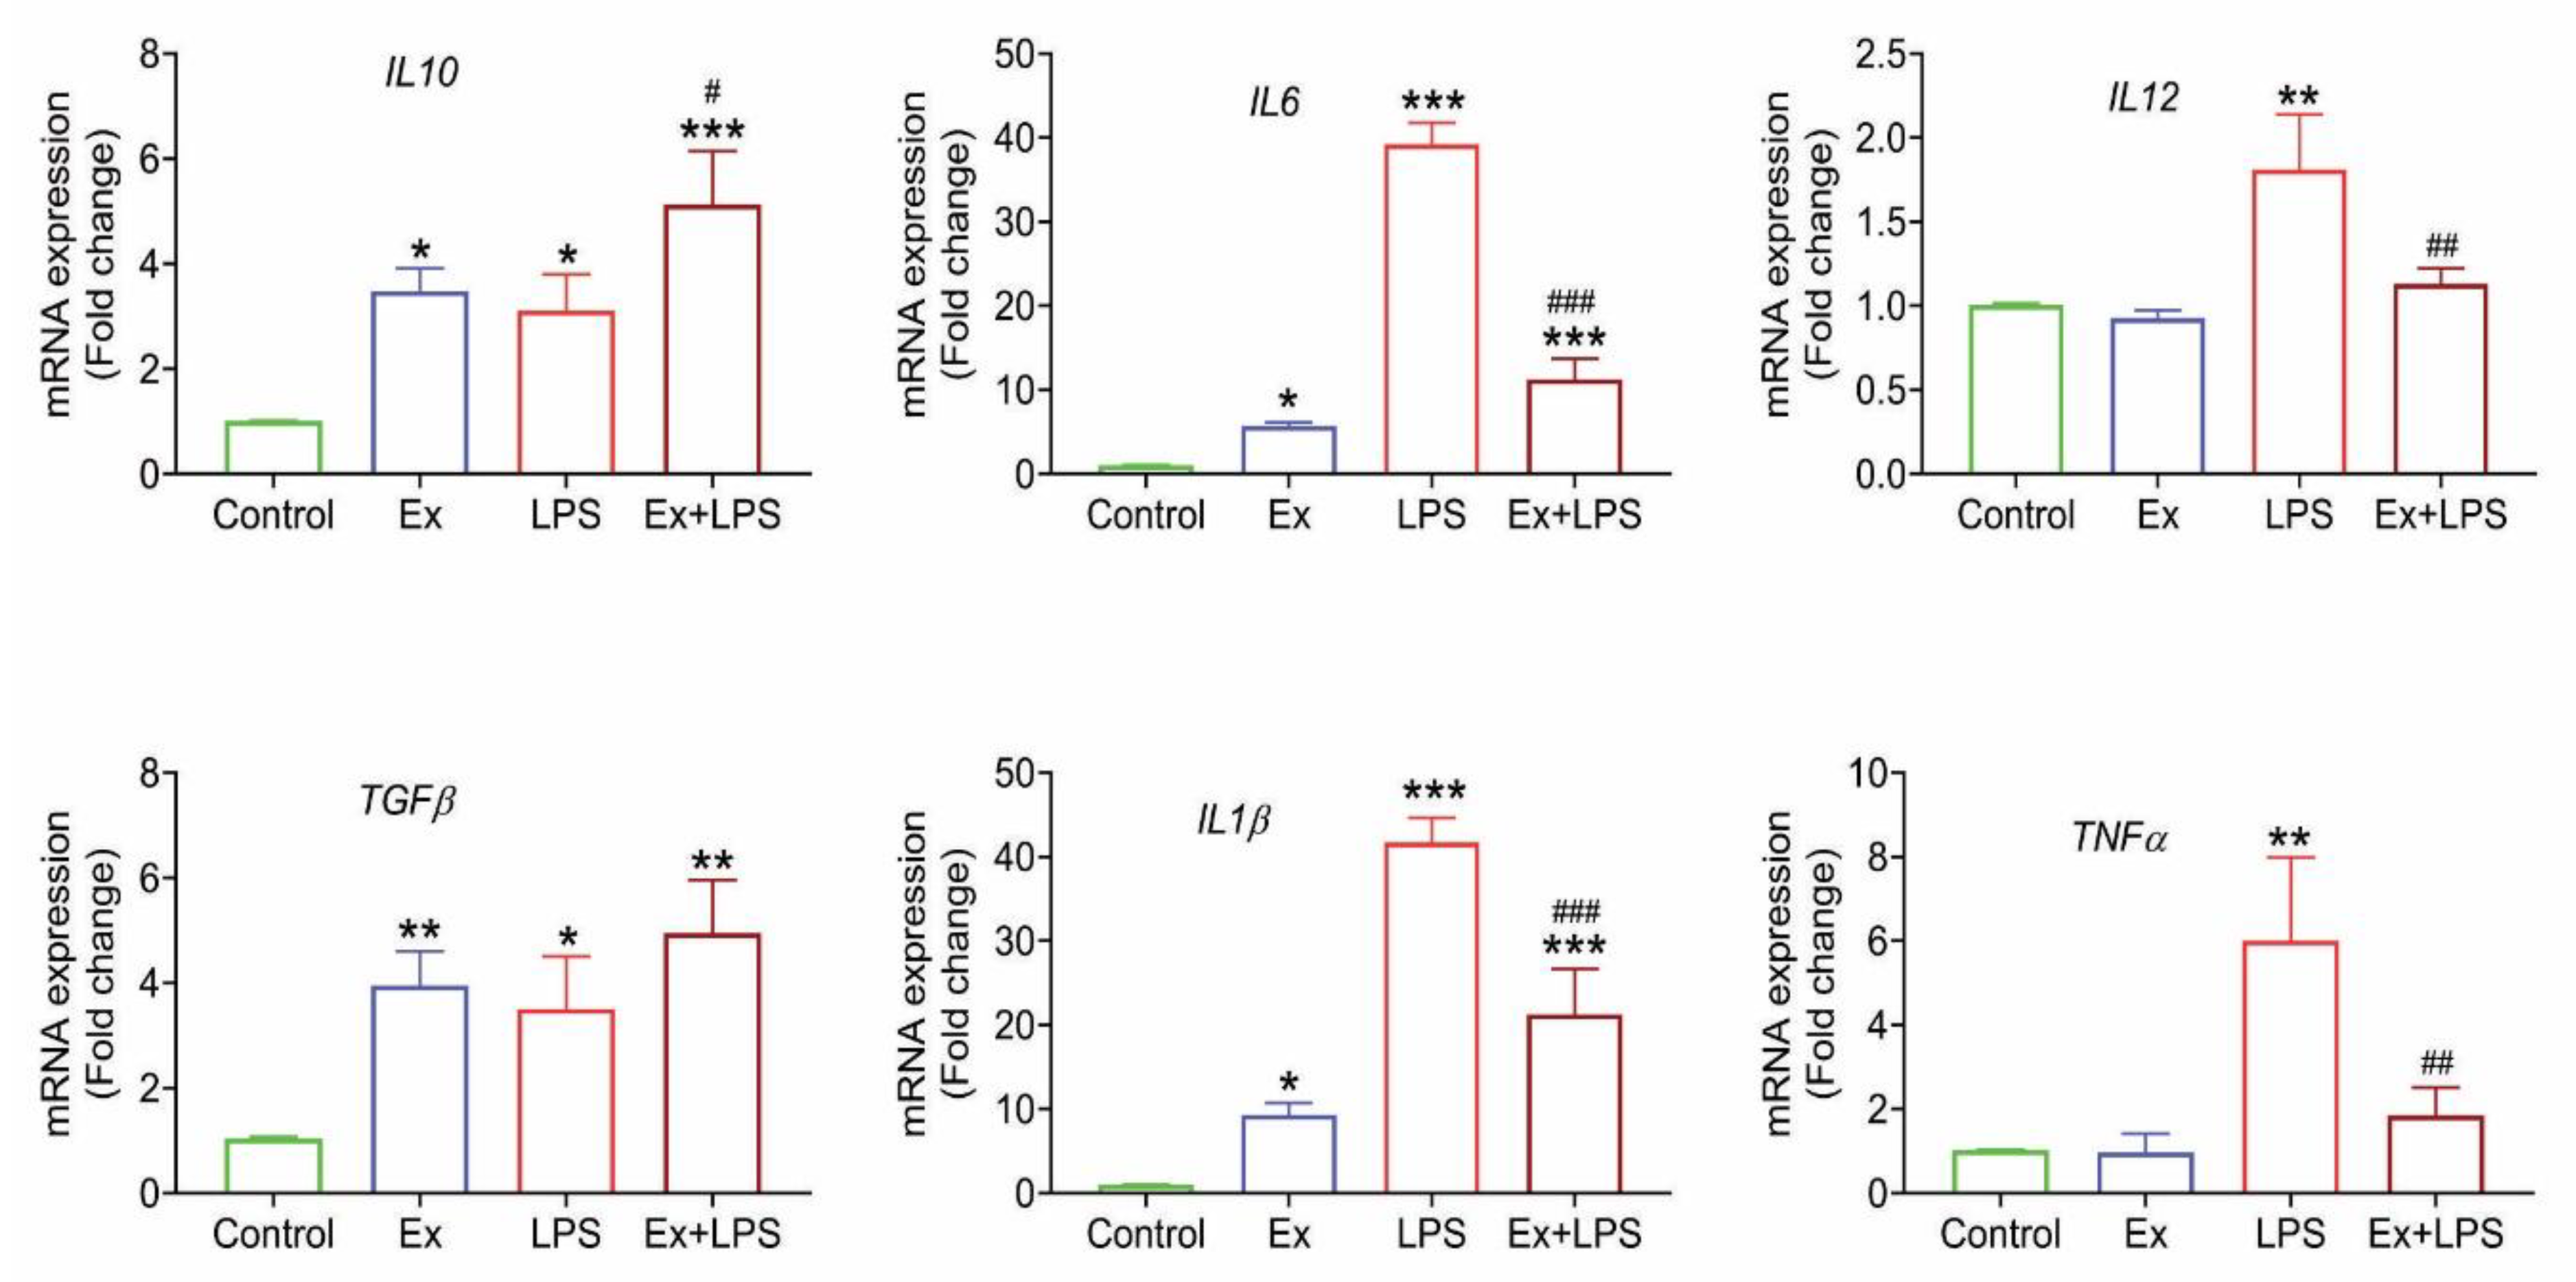
3.6. Lymphoma-derived exosomes induce an M2-specific cytokine profile in macrophages
4. Discussion
5. Conclusion
Funding
Author’s Contributions
Acknowledgments
Conflicts of Interest
References
- Li, X.; Corbett, A.L.; Taatizadeh, E.; Tasnim, N.; Little, J.P.; Garnis, C.; et al. Challenges and opportunities in exosome research—Perspectives from biology, engineering, and cancer therapy. APL bioengineering. 2019, 3, 011503. [Google Scholar] [CrossRef] [PubMed]
- Atay, S.; Godwin, A.K. Tumor-derived exosomes: A message delivery system for tumor progression. Communicative & integrative biology. 2014, 7, e28231. [Google Scholar] [CrossRef]
- Willms, E.; Johansson, H.J.; Mäger, I.; Lee, Y.; Blomberg, K.E.M.; Sadik, M.; et al. Cells release subpopulations of exosomes with distinct molecular and biological properties. Scientific reports. 2016, 6, 1–12. [Google Scholar] [CrossRef] [PubMed]
- Soung, Y.H.; Nguyen, T.; Cao, H.; Lee, J.; Chung, J. Emerging roles of exosomes in cancer invasion and metastasis. BMB reports. 2016, 49, 18. [Google Scholar] [CrossRef] [PubMed]
- Piao, Y.J.; Kim, H.S.; Hwang, E.H.; Woo, J.; Zhang, M.; Moon, W.K. Breast cancer cell-derived exosomes and macrophage polarization are associated with lymph node metastasis. Oncotarget. 2018, 9, 7398. [Google Scholar] [CrossRef]
- Chen, Q.; Li, Y.; Liu, Y.; Xu, W.; Zhu, X. Exosomal non-coding RNAs-mediated crosstalk in the tumor microenvironment. Frontiers in cell and developmental biology. 2021, 9, 646864. [Google Scholar] [CrossRef]
- Syeda, S.; Rawat, K.; Shrivastava, A. Pharmacological Inhibition of Exosome Machinery: An Emerging Prospect in Cancer Therapeutics. Current Cancer Drug Targets. 2022, 22, 560–76. [Google Scholar] [CrossRef]
- Costa-Silva, B.; Aiello, NM.; Ocean, AJ.; Singh, S.; Zhang, H.; Thakur, BK.; et al. Pancreatic cancer exosomes initiate pre-metastatic niche formation in the liver. Nature cell biology. 2015, 17, 816–26. [Google Scholar] [CrossRef]
- Chow, A.; Zhou, W.; Liu, L.; Fong, MY.; Champer, J.; Van Haute, D.; et al. Macrophage immunomodulation by breast cancer-derived exosomes requires Toll-like receptor 2-mediated activation of NF-κB. Scientific reports. 2014, 4, 1–11. [Google Scholar] [CrossRef]
- Wang, J.; De Veirman, K.; Faict, S.; Frassanito, MA.; Ribatti, D.; Vacca, A.; et al. Multiple myeloma exosomes establish a favourable bone marrow microenvironment with enhanced angiogenesis and immunosuppression. The Journal of pathology. 2016, 239, 162–73. [Google Scholar] [CrossRef]
- Gabrusiewicz, K.; Li, X.; Wei, J.; Hashimoto, Y.; Marisetty, AL.; Ott, M.; et al. Glioblastoma stem cell-derived exosomes induce M2 macrophages and PD-L1 expression on human monocytes. Oncoimmunology. 2018, 7, e1412909. [Google Scholar] [CrossRef]
- Szczepanski, M.J.; Szajnik, M.; Welsh, A.; Whiteside, T.L.; Boyiadzis, M. Blast-derived microvesicles in sera from patients with acute myeloid leukemia suppress natural killer cell function via membrane-associated transforming growth factor-β1. Haematologica. 2011, 96, 1302–9. [Google Scholar] [CrossRef]
- Zhang, X.; Shi, H.; Yuan, X.; Jiang, P.; Qian, H.; Xu, W. Tumor-derived exosomes induce N2 polarization of neutrophils to promote gastric cancer cell migration. Molecular cancer. 2018, 17, 1–16. [Google Scholar] [CrossRef]
- Chalmin, F.; Ladoire, S.; Mignot, G.; Vincent, J.; Bruchard, M.; Remy-Martin, J-P.; et al. Membrane-associated Hsp72 from tumor-derived exosomes mediates STAT3-dependent immunosuppressive function of mouse and human myeloid-derived suppressor cells. The Journal of clinical investigation. 2010, 120, 457–71. [Google Scholar] [CrossRef]
- Szajnik, M.; Czystowska, M.; Szczepanski, M.J.; Mandapathil, M.; Whiteside, T.L. Tumor-derived microvesicles induce, expand and up-regulate biological activities of human regulatory T cells (Treg). PloS one. 2010, 5, e11469. [Google Scholar] [CrossRef]
- Rath, M.; Müller, I.; Kropf, P.; Closs, E.I.; Munder, M. Metabolism via arginase or nitric oxide synthase: two competing arginine pathways in macrophages. Frontiers in immunology. 2014, 5, 532. [Google Scholar] [CrossRef] [PubMed]
- Sousa, S.; Brion, R.; Lintunen, M.; Kronqvist, P.; Sandholm, J.; Mönkkönen, J.; et al. Human breast cancer cells educate macrophages toward the M2 activation status. Breast cancer research. 2015, 17, 1–14. [Google Scholar] [CrossRef] [PubMed]
- Zhou, J.; Tang, Z.; Gao, S.; Li, C.; Feng, Y.; Zhou, X. Tumor-associated macrophages: recent insights and therapies. Frontiers in oncology. 2020, 10, 188. [Google Scholar] [CrossRef]
- Pritchard, A.; Tousif, S.; Wang, Y.; Hough, K.; Khan, S.; Strenkowski, J.; et al. Lung tumor cell-derived exosomes promote M2 macrophage polarization. Cells. 2020, 9, 1303. [Google Scholar] [CrossRef] [PubMed]
- Qiu, S.; Xie, L.; Lu, C.; Gu, C.; Xia, Y.; Lv, J.; et al. Gastric cancer-derived exosomal miR-519a-3p promotes liver metastasis by inducing intrahepatic M2-like macrophage-mediated angiogenesis. Journal of Experimental & Clinical Cancer Research. 2022, 41, 1–20. [Google Scholar] [CrossRef]
- Riabov, V.; Gudima, A.; Wang, N.; Mickley, A.; Orekhov, A.; Kzhyshkowska, J. Role of tumor associated macrophages in tumor angiogenesis and lymphangiogenesis. Frontiers in physiology. 2014, 5, 75. [Google Scholar] [CrossRef] [PubMed]
- Xiao, M.; Zhang, J.; Chen, W.; Chen, W. M1-like tumor-associated macrophages activated by exosome-transferred THBS1 promote malignant migration in oral squamous cell carcinoma. Journal of Experimental & Clinical Cancer Research. 2018, 37, 1–15. [Google Scholar] [CrossRef]
- Chen, Q.; Li, Y.; Gao, W.; Chen, L.; Xu, W.; Zhu, X. Exosome-Mediated Crosstalk Between Tumor and Tumor-Associated Macrophages. Frontiers in Molecular Biosciences. 2021, 977. [Google Scholar] [CrossRef] [PubMed]
- Ham, S.; Lima, LG.; Chai, E.P.Z.; Muller, A.; Lobb, RJ.; Krumeich, S.; et al. Breast cancer-derived exosomes alter macrophage polarization via gp130/STAT3 signaling. Frontiers in immunology. 2018, 9, 871. [Google Scholar] [CrossRef] [PubMed]
- Linton, SS.; Abraham, T.; Liao, J.; Clawson, GA.; Butler, PJ.; Fox, T.; et al. Tumor-promoting effects of pancreatic cancer cell exosomes on THP-1-derived macrophages. PLoS One. 2018, 13, e0206759. [Google Scholar] [CrossRef]
- Bardi, G.T.; Smith, M.A.; Hood, J.L. Melanoma exosomes promote mixed M1 and M2 macrophage polarization. Cytokine. 2018, 105, 63–72. [Google Scholar] [CrossRef]
- Rawat, K.; Syeda, S.; Shrivastava, A. A novel role of Tinospora cordifolia in amelioration of cancer-induced systemic deterioration by taming neutrophil infiltration and hyperactivation. Phytomedicine. 2023, 108, 154488. [Google Scholar] [CrossRef]
- Kumari, R.; Rawat, K.; Kumari, A.; Shrivastava, A. Amelioration of Dalton’s lymphoma–induced angiogenesis by melatonin. Tumor Biology. 2017, 39, 1010428317705758. [Google Scholar] [CrossRef] [PubMed]
- Koiri, R.; Mehrotra, A.; Trigun, S. Dalton’s lymphoma as a murine model for understanding the progression and development of t-cell lymphoma and its role in drug discovery. Int j immunother cancer res. 2017, 3, 1–6. [Google Scholar]
- Rawat, K.; Syeda, S.; Shrivastava, A. Hyperactive neutrophils infiltrate vital organs of tumor bearing host and contribute to gradual systemic deterioration via upregulated NE, MPO and MMP-9 activity. Immunology Letters. 2022, 241, 35–48. [Google Scholar] [CrossRef]
- Kalluri, R. The biology and function of exosomes in cancer. The Journal of clinical investigation. 2016, 126, 1208–15. [Google Scholar] [CrossRef] [PubMed]
- Konoshenko, M.; Sagaradze, G.; Orlova, E.; Shtam, T.; Proskura, K.; Kamyshinsky, R.; et al. Total blood exosomes in breast cancer: Potential role in crucial steps of tumorigenesis. International Journal of Molecular Sciences. 2020, 21, 7341. [Google Scholar] [CrossRef] [PubMed]
- Sun, J.; Lu, Z.; Fu, W.; Lu, K.; Gu, X.; Xu, F.; et al. Exosome-derived ADAM17 promotes liver metastasis in colorectal Cancer. Frontiers in pharmacology. 2021, 12. [Google Scholar] [CrossRef]
- Satake, T.; Suetsugu, A.; Nakamura, M.; Kunisada, T.; Saji, S.; Moriwaki, H.; et al. Color-coded imaging of the fate of cancer-cell-derived exosomes during pancreatic cancer metastases in a nude-mouse model. Anticancer Research. 2019, 39, 4055–60. [Google Scholar] [CrossRef]
- Klemke, L.; De Oliveira, T.; Witt, D.; Winkler, N.; Bohnenberger, H.; Bucala, R.; et al. Hsp90-stabilized MIF supports tumor progression via macrophage recruitment and angiogenesis in colorectal cancer. Cell death & disease. 2021, 12, 1–16. [Google Scholar] [CrossRef]
- Feng, L.; Weng, J.; Yao, C.; Wang, R.; Wang, N.; Zhang, Y.; et al. Extracellular Vesicles Derived from SIPA1high Breast Cancer Cells Enhance Macrophage Infiltration and Cancer Metastasis through Myosin-9. Biology. 2022, 11, 543. [Google Scholar] [CrossRef]
- Qinglin, D.; Zhigao, X.; Hanluo, L.; Kanghong, H.; Qifa, Y. Identification of CFHR4 Associated With Poor Prognosis of Hepatocellular Carcinoma. 2021.
- Jia, W.; Kidoya, H.; Yamakawa, D.; Naito, H.; Takakura, N. Galectin-3 accelerates M2 macrophage infiltration and angiogenesis in tumors. The American journal of pathology. 2013, 182, 1821–31. [Google Scholar] [CrossRef]
- Liu, T.; Zhu, C.; Chen, X.; Wu, J.; Guan, G.; Zou, C.; et al. Dual role of ARPC1B in regulating the network between tumor-associated macrophages and tumor cells in glioblastoma. Oncoimmunology. 2022, 11, 2031499. [Google Scholar] [CrossRef]
- Martinez-Marin, D.; Jarvis, C.; Nelius, T.; De Riese, W.; Volpert, OV.; Filleur, S. PEDF increases the tumoricidal activity of macrophages towards prostate cancer cells in vitro. PLoS One. 2017, 12, e0174968. [Google Scholar] [CrossRef]
- Zhu, Y.; Wan, N.; Shan, X.; Deng, G.; Xu, Q.; Ye, H.; et al. Celastrol targets adenylyl cyclase-associated protein 1 to reduce macrophages-mediated inflammation and ameliorates high fat diet-induced metabolic syndrome in mice. Acta Pharmaceutica Sinica, B. 2021, 11, 1200–12. [Google Scholar] [CrossRef]
- Liu, L.; Zhang, S.; Wang, Y.; Bao, W.; Zhou, Y.; Dang, W.; et al. BIG1 controls macrophage pro-inflammatory responses through ARF3-mediated PI (4, 5) P2 synthesis. Cell death & disease. 2020, 11, 1–15. [Google Scholar] [CrossRef]
- Ho, T.-C.; Yeh, S.-I.; Chen, S.-L.; Tsao, Y.-P. Integrin αv and Vitronectin Prime Macrophage-Related Inflammation and Contribute the Development of Dry Eye Disease. International Journal of Molecular Sciences. 2021, 22, 8410. [Google Scholar] [CrossRef] [PubMed]
- Weng, X.; Zhao, H.; Guan, Q.; Shi, G.; Feng, S.; Gleave, ME.; et al. Clusterin regulates macrophage expansion, polarization and phagocytic activity in response to inflammation in the kidneys. Immunology and Cell Biology. 2021, 99, 274–87. [Google Scholar] [CrossRef] [PubMed]
- Li, X.; Wang, F.; Xu, X.; Zhang, J.; Xu, G. The dual role of STAT1 in ovarian cancer: insight into molecular mechanisms and application potentials. Frontiers in Cell and Developmental Biology. 2021, 9, 636595. [Google Scholar] [CrossRef]
- Dominguez, M.; Brüne, B.; Namgaladze, D. Exploring the role of ATP-citrate lyase in the immune system. Frontiers in Immunology. 2021, 12, 632526. [Google Scholar] [CrossRef]
- Atay, S.; Roberson, C.D.; Gercel-Taylor, C.; Taylor, D.D. Ovarian cancer-derived exosomal fibronectin induces pro-inflammatory IL-1β. exosomes and microvesicles. 2013, 1, 2. [Google Scholar] [CrossRef]
- Dan, H.; Liu, S.; Liu, J.; Liu, D.; Yin, F.; Wei, Z.; et al. RACK1 promotes cancer progression by increasing the M2/M1 macrophage ratio via the NF-κB pathway in oral squamous cell carcinoma. Molecular Oncology. 2020, 14, 795–807. [Google Scholar] [CrossRef]
- Wang, S.; Sun, Z.; Zhao, W.; Wang, Z.; Wu, M.; Pan, Y.; et al. CD97/ADGRE5 Inhibits LPS Induced NF-κB Activation through PPAR-γ Upregulation in Macrophages. Mediators of Inflammation. 2016, 2016. [Google Scholar] [CrossRef]
- Pireaux, V.; Sauvage, A.; Bihin, B.; Van Steenbrugge, M.; Rousseau, A.; Van Antwerpen, P.; et al. Myeloperoxidase-Oxidized LDLs Enhance an Anti-Inflammatory M2 and Antioxidant Phenotype in Murine Macrophages. Mediators of inflammation. 2016, 2016. [Google Scholar] [CrossRef]
- Hong, J.; Qu, P.; Wuest, T.; Lin, P.C. Neutrophilic granule protein is a novel murine LPS antagonist. The Journal of Immunology 2020, 204 (1_Supplement), 60.21. [Google Scholar] [CrossRef]
- Zbinden, A.; Layland, SL.; Urbanczyk, M.; Carvajal Berrio, DA.; Marzi, J.; Zauner, M.; et al. Nidogen-1 mitigates ischemia and promotes tissue survival and regeneration. Advanced Science. 2021, 8, 2002500. [Google Scholar] [CrossRef]
- Audrito, V.; Serra, S.; Brusa, D.; Mazzola, F.; Arruga, F.; Vaisitti, T.; et al. Extracellular nicotinamide phosphoribosyltransferase (NAMPT) promotes M2 macrophage polarization in chronic lymphocytic leukemia. Blood, The Journal of the American Society of Hematology. 2015, 125, 111–23. [Google Scholar] [CrossRef]
- Tang, Y.; Lin, X.; Chen, C.; Tong, Z.; Sun, H.; Li, Y.; et al. Nucleolin Improves Heart Function During Recovery From Myocardial Infarction by Modulating Macrophage Polarization. Journal of Cardiovascular Pharmacology and Therapeutics. 2021, 26, 386–95. [Google Scholar] [CrossRef]
- Oelschlaegel, D.; Weiss Sadan, T.; Salpeter, S.; Krug, S.; Blum, G.; Schmitz, W.; et al. Cathepsin inhibition modulates metabolism and polarization of tumor-associated macrophages. Cancers. 2020, 12, 2579. [Google Scholar] [CrossRef]
- Kim, J.H.; Sun-Hee, O.; Kim, E-J.; Park, SJ.; Hong, SP.; Cheon., JH.; et al. The role of myofibroblasts in upregulation of S100A8 and S100A9 and the differentiation of myeloid cells in the colorectal cancer microenvironment. Biochemical and biophysical research communications. 2012, 423, 60–6. [Google Scholar] [CrossRef]
- Ni, Y.; Wu, G-H.; Cai, J-J.; Zhang, R.; Zheng, Y.; Liu, J-Q.; et al. Tubule-mitophagic secretion of SerpinG1 reprograms macrophages to instruct anti-septic acute kidney injury efficacy of high-dose ascorbate mediated by NRF2 transactivation. International journal of biological sciences. 2022, 18, 5168. [Google Scholar] [CrossRef] [PubMed]
- Matsusaka, K.; Fujiwara, Y.; Pan, C.; Esumi, S.; Saito, Y.; Bi, J.; et al. α1-Acid Glycoprotein Enhances the Immunosuppressive and Protumor Functions of Tumor-Associated MacrophagesAGP Enhances Protumor Function of TAM in Tumor Development. Cancer Research. 2021, 81, 4545–59. [Google Scholar] [CrossRef] [PubMed]
- Joshi, S.; Singh, AR.; Zulcic, M.; Bao, L.; Messer, K.; Ideker, T.; et al. Rac2 controls tumor growth, metastasis and M1-M2 macrophage differentiation in vivo. PloS one. 2014, 9, e95893. [Google Scholar] [CrossRef]
- Alaluf, E.; Vokaer, B.; Detavernier, A.; Azouz, A.; Splittgerber, M.; Carrette, A.; et al. Heme oxygenase-1 orchestrates the immunosuppressive program of tumor-associated macrophages. JCI insight 2020, 5. [Google Scholar] [CrossRef]
- Wen, G.; Zhang, C.; Chen, Q.; Mustafa, A.; Ye, S.; Xiao, Q. A novel role of matrix metalloproteinase-8 in macrophage differentiation and polarization. Journal of Biological Chemistry. 2015, 290, 19158–72. [Google Scholar] [CrossRef]
- Moraes, LA.; Kar, S.; Foo, SL.; Gu, T.; Toh, YQ.; Ampomah, PB.; et al. Annexin-A1 enhances breast cancer growth and migration by promoting alternative macrophage polarization in the tumour microenvironment. Scientific reports. 2017, 7, 1–12. [Google Scholar] [CrossRef]
- Ochieng, J.; Nangami, G.; Sakwe, A.; Moye, C.; Alvarez, J.; Whalen, D.; et al. Impact of Fetuin-A (AHSG) on tumor progression and type 2 diabetes. International Journal of Molecular Sciences. 2018, 19, 2211. [Google Scholar] [CrossRef] [PubMed]
- Ubil, E.; Caskey, L.; Holtzhausen, A.; Hunter, D.; Story, C.; Earp, H.S. Tumor-secreted Pros1 inhibits macrophage M1 polarization to reduce antitumor immune response. The Journal of clinical investigation. 2018, 128, 2356–69. [Google Scholar] [CrossRef] [PubMed]
- Liu, J.; Mi, J.; Liu, S.; Chen, H.; Jiang, L. PSMB5 overexpression is correlated with tumor proliferation and poor prognosis in hepatocellular carcinoma. FEBS open bio. 2022, 12, 2025–41. [Google Scholar] [CrossRef]
- Fu, W.; Hu, W.; Yi, Y-S.; Hettinghouse, A.; Sun, G.; Bi, Y.; et al. TNFR2/14-3-3ε signaling complex instructs macrophage plasticity in inflammation and autoimmunity. The Journal of clinical investigation 2021, 131. [Google Scholar] [CrossRef]
- Martinez, FO.; Helming, L.; Milde, R.; Varin, A.; Melgert, BN.; Draijer, C.; et al. Genetic programs expressed in resting and IL-4 alternatively activated mouse and human macrophages: similarities and differences. Blood, The Journal of the American Society of Hematology. 2013, 121, e57–e69. [Google Scholar] [CrossRef]
- Yu, T.; Gan, S.; Zhu, Q.; Dai, D.; Li, N.; Wang, H.; et al. Modulation of M2 macrophage polarization by the crosstalk between Stat6 and Trim24. Nature communications. 2019, 10, 4353. [Google Scholar] [CrossRef]
- Yang, X.; Pang, Y.; Zhang, J.; Shi, J.; Zhang, X.; Zhang, G.; et al. High expression levels of ACTN1 and ACTN3 indicate unfavorable prognosis in acute myeloid leukemia. Journal of Cancer. 2019, 10, 4286. [Google Scholar] [CrossRef]
- Zheng, P.; Luo, Q.; Wang, W.; Li, J.; Wang, T.; Wang, P.; et al. Tumor-associated macrophages-derived exosomes promote the migration of gastric cancer cells by transfer of functional Apolipoprotein, E. Cell death & disease. 2018, 9, 1–14. [Google Scholar]
- Steitz, AM.; Steffes, A.; Finkernagel, F.; Unger, A.; Sommerfeld, L.; Jansen, JM.; et al. Tumor-associated macrophages promote ovarian cancer cell migration by secreting transforming growth factor beta induced (TGFBI) and tenascin C. Cell death & disease. 2020, 11, 249. [Google Scholar] [CrossRef]
- Dominkuš, PP.; Stenovec, M.; Sitar, S.; Lasič, E.; Zorec, R.; Plemenitaš, A.; et al. PKH26 labeling of extracellular vesicles: Characterization and cellular internalization of contaminating PKH26 nanoparticles. Biochimica et Biophysica Acta (BBA)-Biomembranes. 2018, 1860, 1350–61. [Google Scholar] [CrossRef] [PubMed]
- Kim, E.J.; Lee, M.Y.; Jeon, Y.J. Silymarin inhibits morphological changes in LPS-stimulated macrophages by blocking NF-κB pathway. Korean J Physiol Pharmacol. 2015, 19, 211–8. [Google Scholar] [CrossRef]
- Wang, X.; Luo, X.; Chen, C.; Tang, Y.; Li, L.; Mo, B.; et al. The Ap-2α/Elk-1 axis regulates Sirpα-dependent tumor phagocytosis by tumor-associated macrophages in colorectal cancer. Signal Transduction and Targeted Therapy. 2020, 5, 35. [Google Scholar] [CrossRef] [PubMed]
- Gordon, SR.; Maute, RL.; Dulken, BW.; Hutter, G.; George, BM.; McCracken, MN.; et al. PD-1 expression by tumour-associated macrophages inhibits phagocytosis and tumour immunity. Nature. 2017, 545, 495–9. [Google Scholar] [CrossRef]
- Zhang, Y.; Choksi, S.; Chen, K.; Pobezinskaya, Y.; Linnoila, I.; Liu, Z-G. ROS play a critical role in the differentiation of alternatively activated macrophages and the occurrence of tumor-associated macrophages. Cell research. 2013, 23, 898–914. [Google Scholar] [CrossRef] [PubMed]
- Weinberg, F.; Ramnath, N.; Nagrath, D. Reactive oxygen species in the tumor microenvironment: an overview. Cancers. 2019, 11, 1191. [Google Scholar] [CrossRef]
- Chang, C.-I.; Liao, J.C.; Kuo, L. Macrophage arginase promotes tumor cell growth and suppresses nitric oxide-mediated tumor cytotoxicity. Cancer research. 2001, 61, 1100–6. [Google Scholar]
- Maji, S.; Chaudhary, P.; Akopova, I.; Nguyen, PM.; Hare, RJ.; Gryczynski, I.; et al. Exosomal Annexin II Promotes Angiogenesis and Breast Cancer MetastasisExosomal Anx II in Angiogenesis and Metastasis. Molecular Cancer Research. 2017, 15, 93–105. [Google Scholar] [CrossRef]
- Beckham, CJ.; Olsen, J.; Yin, P-N.; Wu, C-H.; Ting, H-J.; Hagen, FK.; et al. Bladder cancer exosomes contain EDIL-3/Del1 and facilitate cancer progression. The Journal of urology. 2014, 192, 583–92. [Google Scholar] [CrossRef]
- Rahman, M.A.; Barger, J.F.; Lovat, F.; Gao, M.; Otterson, G.A.; Nana-Sinkam, P. Lung cancer exosomes as drivers of epithelial mesenchymal transition. Oncotarget. 2016, 7, 54852. [Google Scholar] [CrossRef]
- Peinado, H.; Alečković, M.; Lavotshkin, S.; Matei, I.; Costa-Silva, B.; Moreno-Bueno, G.; et al. Melanoma exosomes educate bone marrow progenitor cells toward a pro-metastatic phenotype through MET. Nature medicine. 2012, 18, 883–91. [Google Scholar] [CrossRef] [PubMed]
- Parada, N.; Romero-Trujillo, A.; Georges, N.; Alcayaga-Miranda, F. Camouflage strategies for therapeutic exosomes evasion from phagocytosis. Journal of Advanced Research. 2021, 31, 61–74. [Google Scholar] [CrossRef] [PubMed]
- Möller, A.; Lobb, R.J. The evolving translational potential of small extracellular vesicles in cancer. Nature Reviews Cancer. 2020, 20, 697–709. [Google Scholar] [CrossRef] [PubMed]
- Wang, Y.; Yin, K.; Tian, J.; Xia, X.; Ma, J.; Tang, X.; et al. Granulocytic Myeloid-Derived suppressor cells promote the stemness of colorectal cancer cells through exosomal S100A9. Advanced Science. 2019, 6, 1901278. [Google Scholar] [CrossRef] [PubMed]
- Liu, W.; Li, L.; Rong, Y.; Qian, D.; Chen, J.; Zhou, Z.; et al. Hypoxic mesenchymal stem cell-derived exosomes promote bone fracture healing by the transfer of miR-126. Acta Biomaterialia. 2020, 103, 196–212. [Google Scholar] [CrossRef]
- Zhang, W.; Zhou, X.; Yao, Q.; Liu, Y.; Zhang, H.; Dong, Z. HIF-1-mediated production of exosomes during hypoxia is protective in renal tubular cells. American Journal of Physiology-Renal Physiology. 2017, 313, F906–F13. [Google Scholar] [CrossRef]
- Giusti, I.; Delle Monache, S.; Di Francesco, M.; Sanità, P.; D’Ascenzo, S.; Gravina, GL.; et al. From glioblastoma to endothelial cells through extracellular vesicles: messages for angiogenesis. Tumor Biology. 2016, 37, 12743–53. [Google Scholar] [CrossRef]
- Clayton, A.; Mitchell, J.P.; Linnane, S.; Mason, M.D.; Tabi, Z. Human tumor-derived exosomes down-modulate NKG2D expression. The Journal of Immunology. 2008, 180, 7249–58. [Google Scholar] [CrossRef]
- Ding, X.-Q.; Wang, Z.-Y.; Xia, D.; Wang, R.-X.; Pan, X.-R.; Tong, J.-H. Proteomic profiling of serum exosomes from patients with metastatic gastric cancer. Frontiers in oncology. 2020, 10, 1113. [Google Scholar] [CrossRef]
- McWhorter, F.Y.; Wang, T.; Nguyen, P.; Chung, T.; Liu, W.F. Modulation of macrophage phenotype by cell shape. Proceedings of the National Academy of Sciences. 2013, 110, 17253–8. [Google Scholar] [CrossRef]
- Hu, W.; Song, X.; Yu, H.; Sun, J.; Zhao, Y. Released exosomes contribute to the immune modulation of cord blood-derived stem cells. Frontiers in Immunology. 2020, 11, 165. [Google Scholar] [CrossRef] [PubMed]
- Klasen, S.; Hammermann, R.; Fuhrmann, M.; Lindemann, D.; Beck, KF.; Pfeilschifter, J.; et al. Glucocorticoids inhibit lipopolysaccharide-induced up-regulation of arginase in rat alveolar macrophages. British journal of pharmacology. 2001, 132, 1349–57. [Google Scholar] [CrossRef] [PubMed]
- Landskron, G.; De la Fuente, M.; Thuwajit, P.; Thuwajit, C.; Hermoso, M.A. Chronic inflammation and cytokines in the tumor microenvironment. Journal of immunology research. 2014, 2014. [Google Scholar] [CrossRef] [PubMed]
- Yang, L.; Dong, Y.; Li, Y.; Wang, D.; Liu, S.; Wang, D.; et al. IL-10 derived from M2 macrophage promotes cancer stemness via JAK1/STAT1/NF-κB/Notch1 pathway in non-small cell lung cancer. International Journal of Cancer. 2019, 145, 1099–110. [Google Scholar] [CrossRef]
- Wolf-Dennen, K.; Gordon, N.; Kleinerman, E.S. Exosomal communication by metastatic osteosarcoma cells modulates alveolar macrophages to an M2 tumor-promoting phenotype and inhibits tumoricidal functions. Oncoimmunology. 2020, 9, 1747677. [Google Scholar] [CrossRef] [PubMed]
- Jiang, Z.; Zhang, Y.; Zhang, Y.; Jia, Z.; Zhang, Z.; Yang, J. Cancer derived exosomes induce macrophages immunosuppressive polarization to promote bladder cancer progression. Cell Communication and Signaling. 2021, 19, 1–13. [Google Scholar] [CrossRef]
- Lee, A.-J.; Cho, K.-J.; Kim, J.-H. MyD88–BLT2-dependent cascade contributes to LPS-induced interleukin-6 production in mouse macrophage. Experimental & molecular medicine. 2015, 47, e156. [Google Scholar] [CrossRef]
- Radharani, N.; Yadav, AS.; Nimma, R.; Kumar, T.; Bulbule, A.; Chanukuppa, V.; et al. Tumor-associated macrophage derived IL-6 enriches cancer stem cell population and promotes breast tumor progression via Stat-3 pathway. Cancer cell international. 2022, 22, 1–19. [Google Scholar] [CrossRef]

| Gene | Forward | Reverse |
|---|---|---|
| Arginase-1 | CTTAGAGATTATCGGAGCGCCT | AAGTTTTTCCAGCAGACCAGC |
| NOS2 | ACAACAGGAACCTACCAGCTC | TACAGTTCCGAGCGTCAAAGA |
| IL6 | CTTCTTGGGACTGATGCTGGT | GCCATTGCACAACTCTTTTCTCA |
| IL10 | TGAGGCGCTGTCATCGATTT | TGGCCTTGTAGACACCTTGG |
| IL1β | GCCACCTTTTGACAGTGATGAG | ATGTGCTGCTGCGAGATTTG |
| IL12 | TGTGGAATGGCGTCTCTGTC | AGTTCAATGGGCAGGGTCTC |
| TGFβ | ATGCTAAAGAGGTCACCCGC | ACTGCTTCCCGAATGTCTGA |
| TNFα | ACGCTGATTTGGTGACCAGG | CCCGTAGGGCGATTACAGTC |
| β-actin | CTTCTTGGGTATGGAATCCTG | GTAATCTCCTTCTGCATCCTG |
| Fibronectin |
|---|
| Lymphocyte cytosolic protein 1 |
| Complement factor H |
| Sulfhydryl oxidase 1 |
| Filamin α |
| Vimentin |
| Moesin |
| Alpha actinin 1α |
| Keratin 5 |
| Keratin 15 |
| Xanthine dehydrogenase/oxidase |
| Epidermal growth factor receptor |
| Serine protease HTRA1 |
| Nidogen-1 |
| Keratin 8 |
| Protein S100-A9 |
| Platelet-activating factor acetylhydrolase |
| Fibrillar collagen NC1 domain-containing protein |
| Collagen α-1(I) chain |
| Keratin 19 |
| Keratin 14 |
| Junction plakoglobin |
| Keratin 16 |
| Transforming growth factor-β-induced (TGFβi) |
| Fibulin-1 |
| Laminin subunit Ƴ-2 |
| Fibrillar collagen NC1 domain-containing protein |
| Protein S100-A8 |
| Extracellular matrix protein 1 |
| Desmoplakin |
| Ectonucleotide pyrophosphatase 2 |
| Laminin B1 |
| Filamin-β |
| Coronin |
| D-3-phosphoglycerate dehydrogenase |
| ZnMc domain-containing protein (MMP3) |
| Fibulin-2 |
| Periostin isoform M2 |
| Procollagen-lysine 5-dioxygenase |
| Kallikrein related-peptidase 10 |
| Basement membrane-specific heparan sulfate proteoglycan core protein |
| Procollagen C-endopeptidase enhancer 1 |
| Decorin |
| Low density lipoprotein receptor-related protein 1 |
| Guanine nucleotide-binding protein subunit β-4 |
| Thrombospondin 1 |
| Prolyl 3-hydroxylase 2 |
| Collagen, type IV, α2 |
| Platelet-activating factor acetylhydrolase IB subunit α |
| Heme oxygenase (biliverdin-producing) (HMOX1) |
| Neuropilin 1 |
| Doublecortin like kinase 1 |
| Protein-glutamine Ƴ-glutamyltransferase 2 |
| Collagen, type VI, α3 |
| Signal transducer and activator of transcription (STAT1) |
| Proteins affecting recruitment of macrophages | References |
| Heat shock protein 90α (Hsp90α) | [35] |
| Myosin-9 (Myh9) | [36] |
| Complement factor H-related 4 (CFHR4) | [37] |
| Galectin 3 | [38] |
| Actin-related protein 2/3 complex subunit | [39] |
| Proteins associated with M1 macrophage polarization | References |
| Pigment epithelium-derived factor | [40] |
| Adenylyl cyclase-associated protein | [41] |
| ADP-ribosylation factor 3 | [42] |
| Vitronectin | [43] |
| Clusterin | [44] |
| Signal transducer and activator of transcription 1 (STAT1) | [45] |
| ATP-citrate synthase | [46] |
| Proteins associated with M2 macrophage polarization | References |
| Fibronectin | [47] |
| Receptor of activated protein C kinase 1 | [48] |
| Adhesion G protein-coupled receptor E5 | [49] |
| Myeloperoxidase | [50] |
| Neutrophilic granule protein | [51] |
| Nidogen 1 | [52] |
| Nicotinamide phosphoribosyl transferase | [53] |
| Nucleolin | [54] |
| Cathepsin B | [55] |
| Protein S100A8 | [56] |
| Plasma protease C1 inhibitor | [57] |
| α-1-acid glycoprotein | [58] |
| Protein S100A9 | [56] |
| Ras-related C3 botulinum toxin substrate 2 | [59] |
| Heme oxygenase | [60] |
| ZnMc domain-containing protein | [61] |
| Annexin | [62] |
| α-2-HS-glycoprotein | [63] |
| Vitamin K-dependent protein S | [64] |
| Procathepsin L | [55] |
| Nidogen | [52] |
| Proteasome subunit β5 | [65] |
| 14-3-3 protein € | [66] |
| Arginase 1 | [67] |
| Macrophage mannose receptor 1 (Mrc1) | [67] |
| Chitinase-like protein 3 | [68] |
| Protein-glutamine Ƴ-glutamyltransferase 2 (Tgm2) | [67] |
| α actinin 1 A | [69] |
| Vacuolar protein sorting-associated protein 35 (Vps35) | [67] |
| Apolipoprotein E (ApoE) | [70] |
| Cytoplasmic FMR1-interacting protein (Cyfip1) | [71] |
| Transferrin receptor protein 1 | [71] |
| Transforming growth factor-beta-induced protein (TGFβi) | [71] |
| Lipoprotein lipase | [71] |
| Lipopolysaccharide binding protein | [71] |
Disclaimer/Publisher’s Note: The statements, opinions and data contained in all publications are solely those of the individual author(s) and contributor(s) and not of MDPI and/or the editor(s). MDPI and/or the editor(s) disclaim responsibility for any injury to people or property resulting from any ideas, methods, instructions or products referred to in the content. |
© 2023 by the authors. Licensee MDPI, Basel, Switzerland. This article is an open access article distributed under the terms and conditions of the Creative Commons Attribution (CC BY) license (http://creativecommons.org/licenses/by/4.0/).


