Submitted:
07 April 2023
Posted:
10 April 2023
You are already at the latest version
Abstract
Keywords:
1. Introduction
2. Experimental
2.1. Materials
2.2. Adiabatic Calorimetry
2.3. Differential Scanning Calorimetry
2.4. Powder X-ray diffraction
2.5. High-pressure differential thermal analysis
3. Results
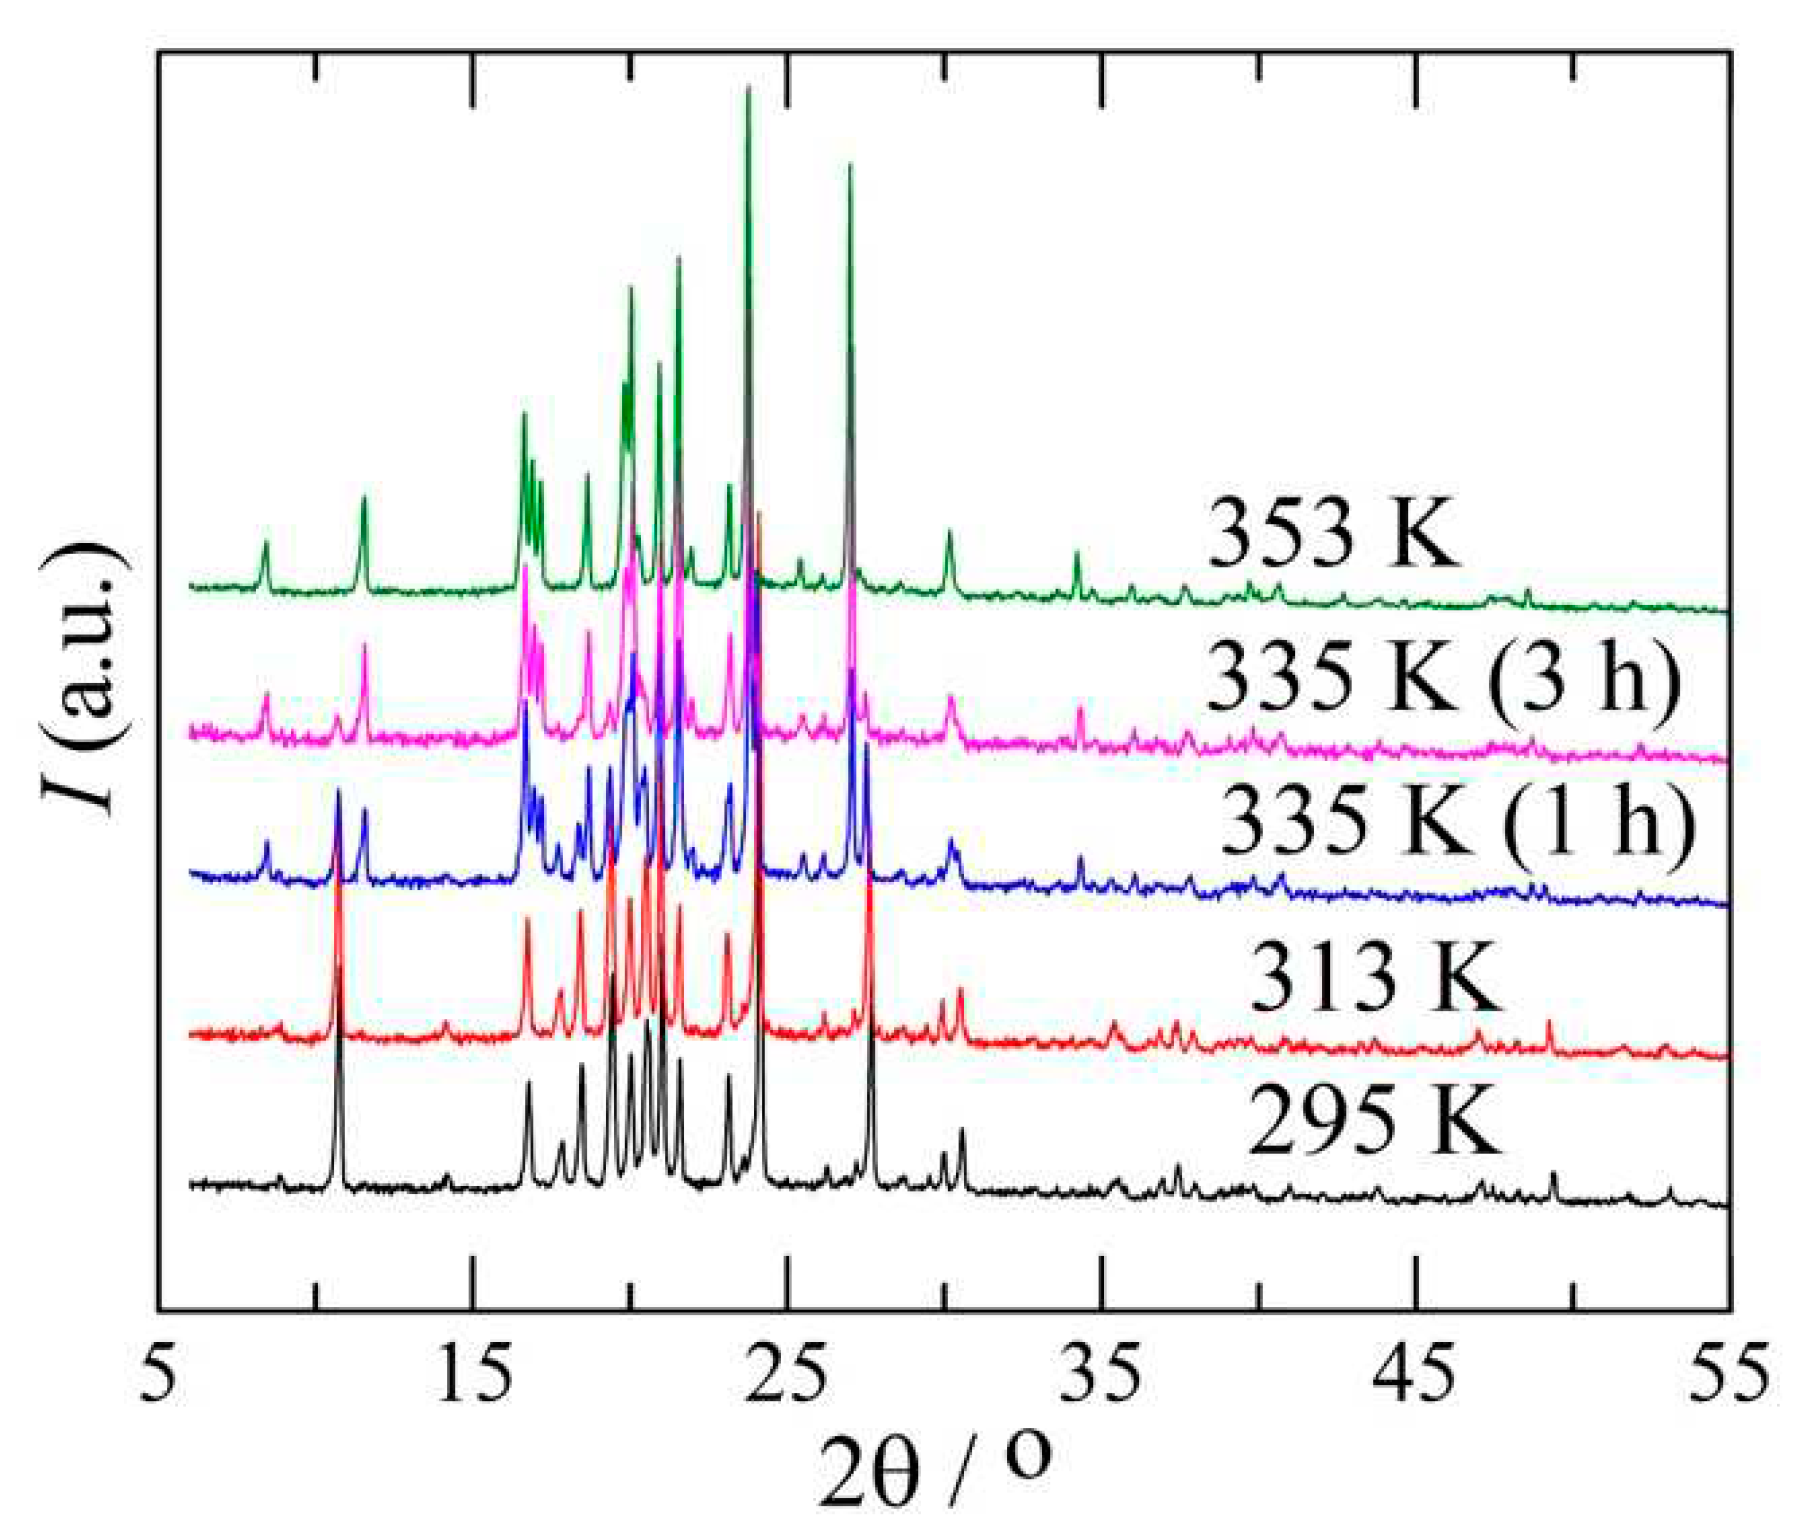
3.1. The I→II transformation
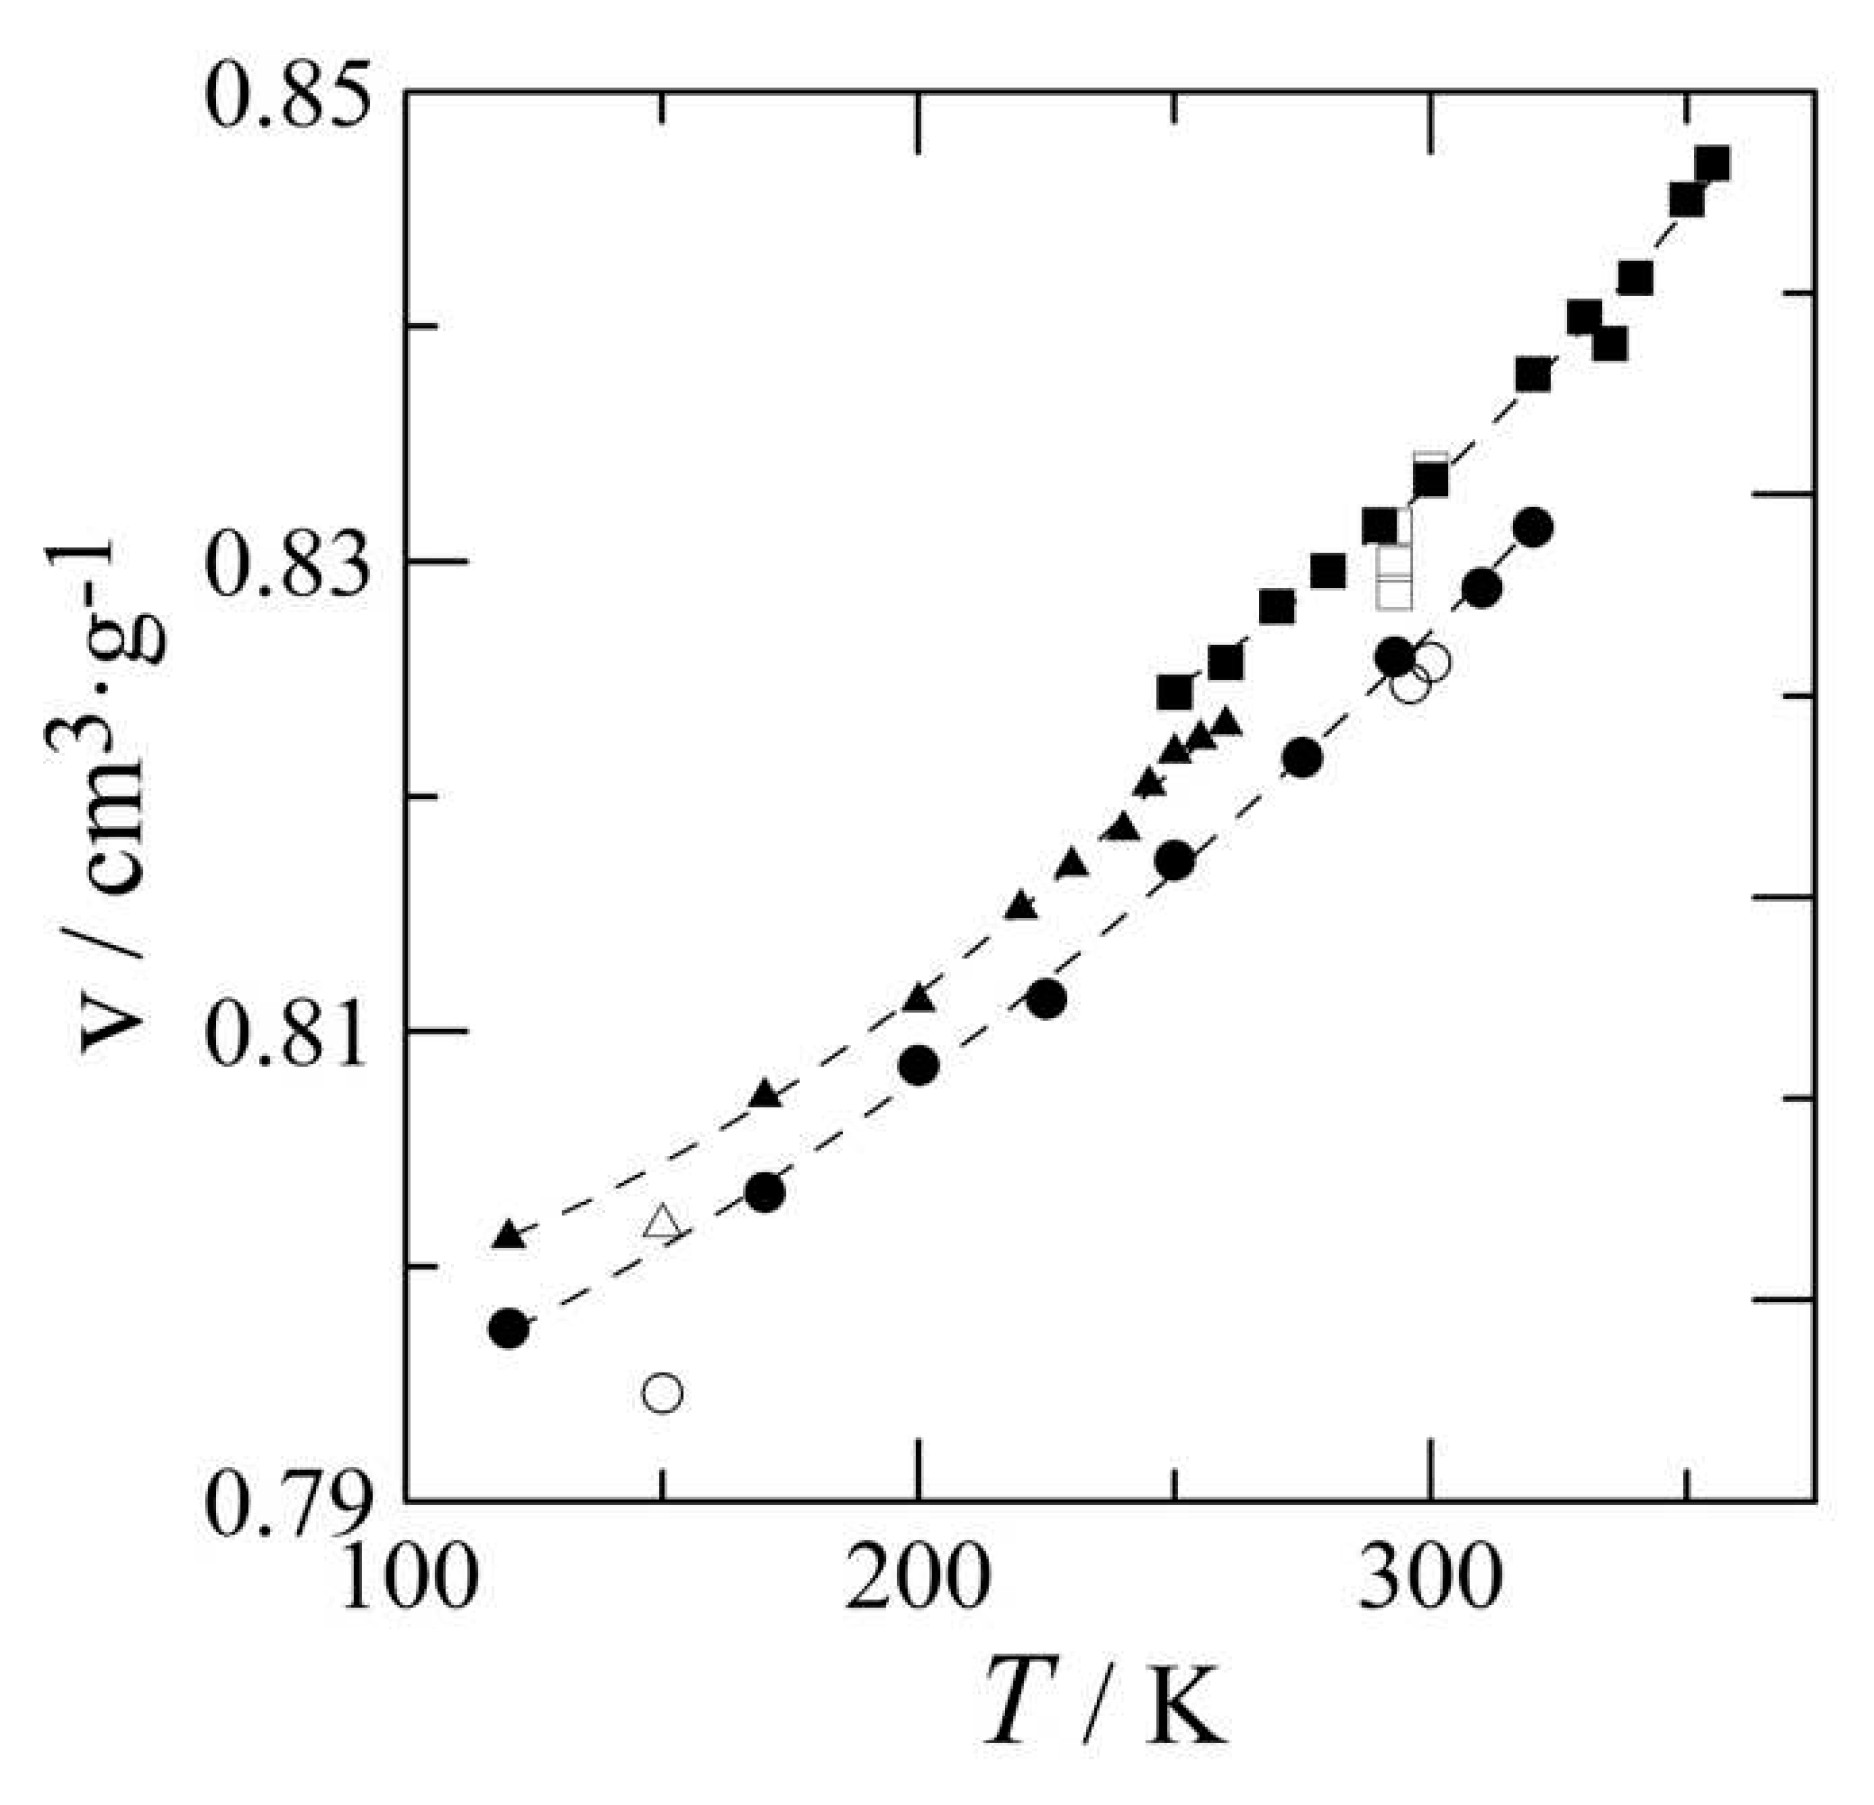
3.2. The thermal expansion of benzocaine
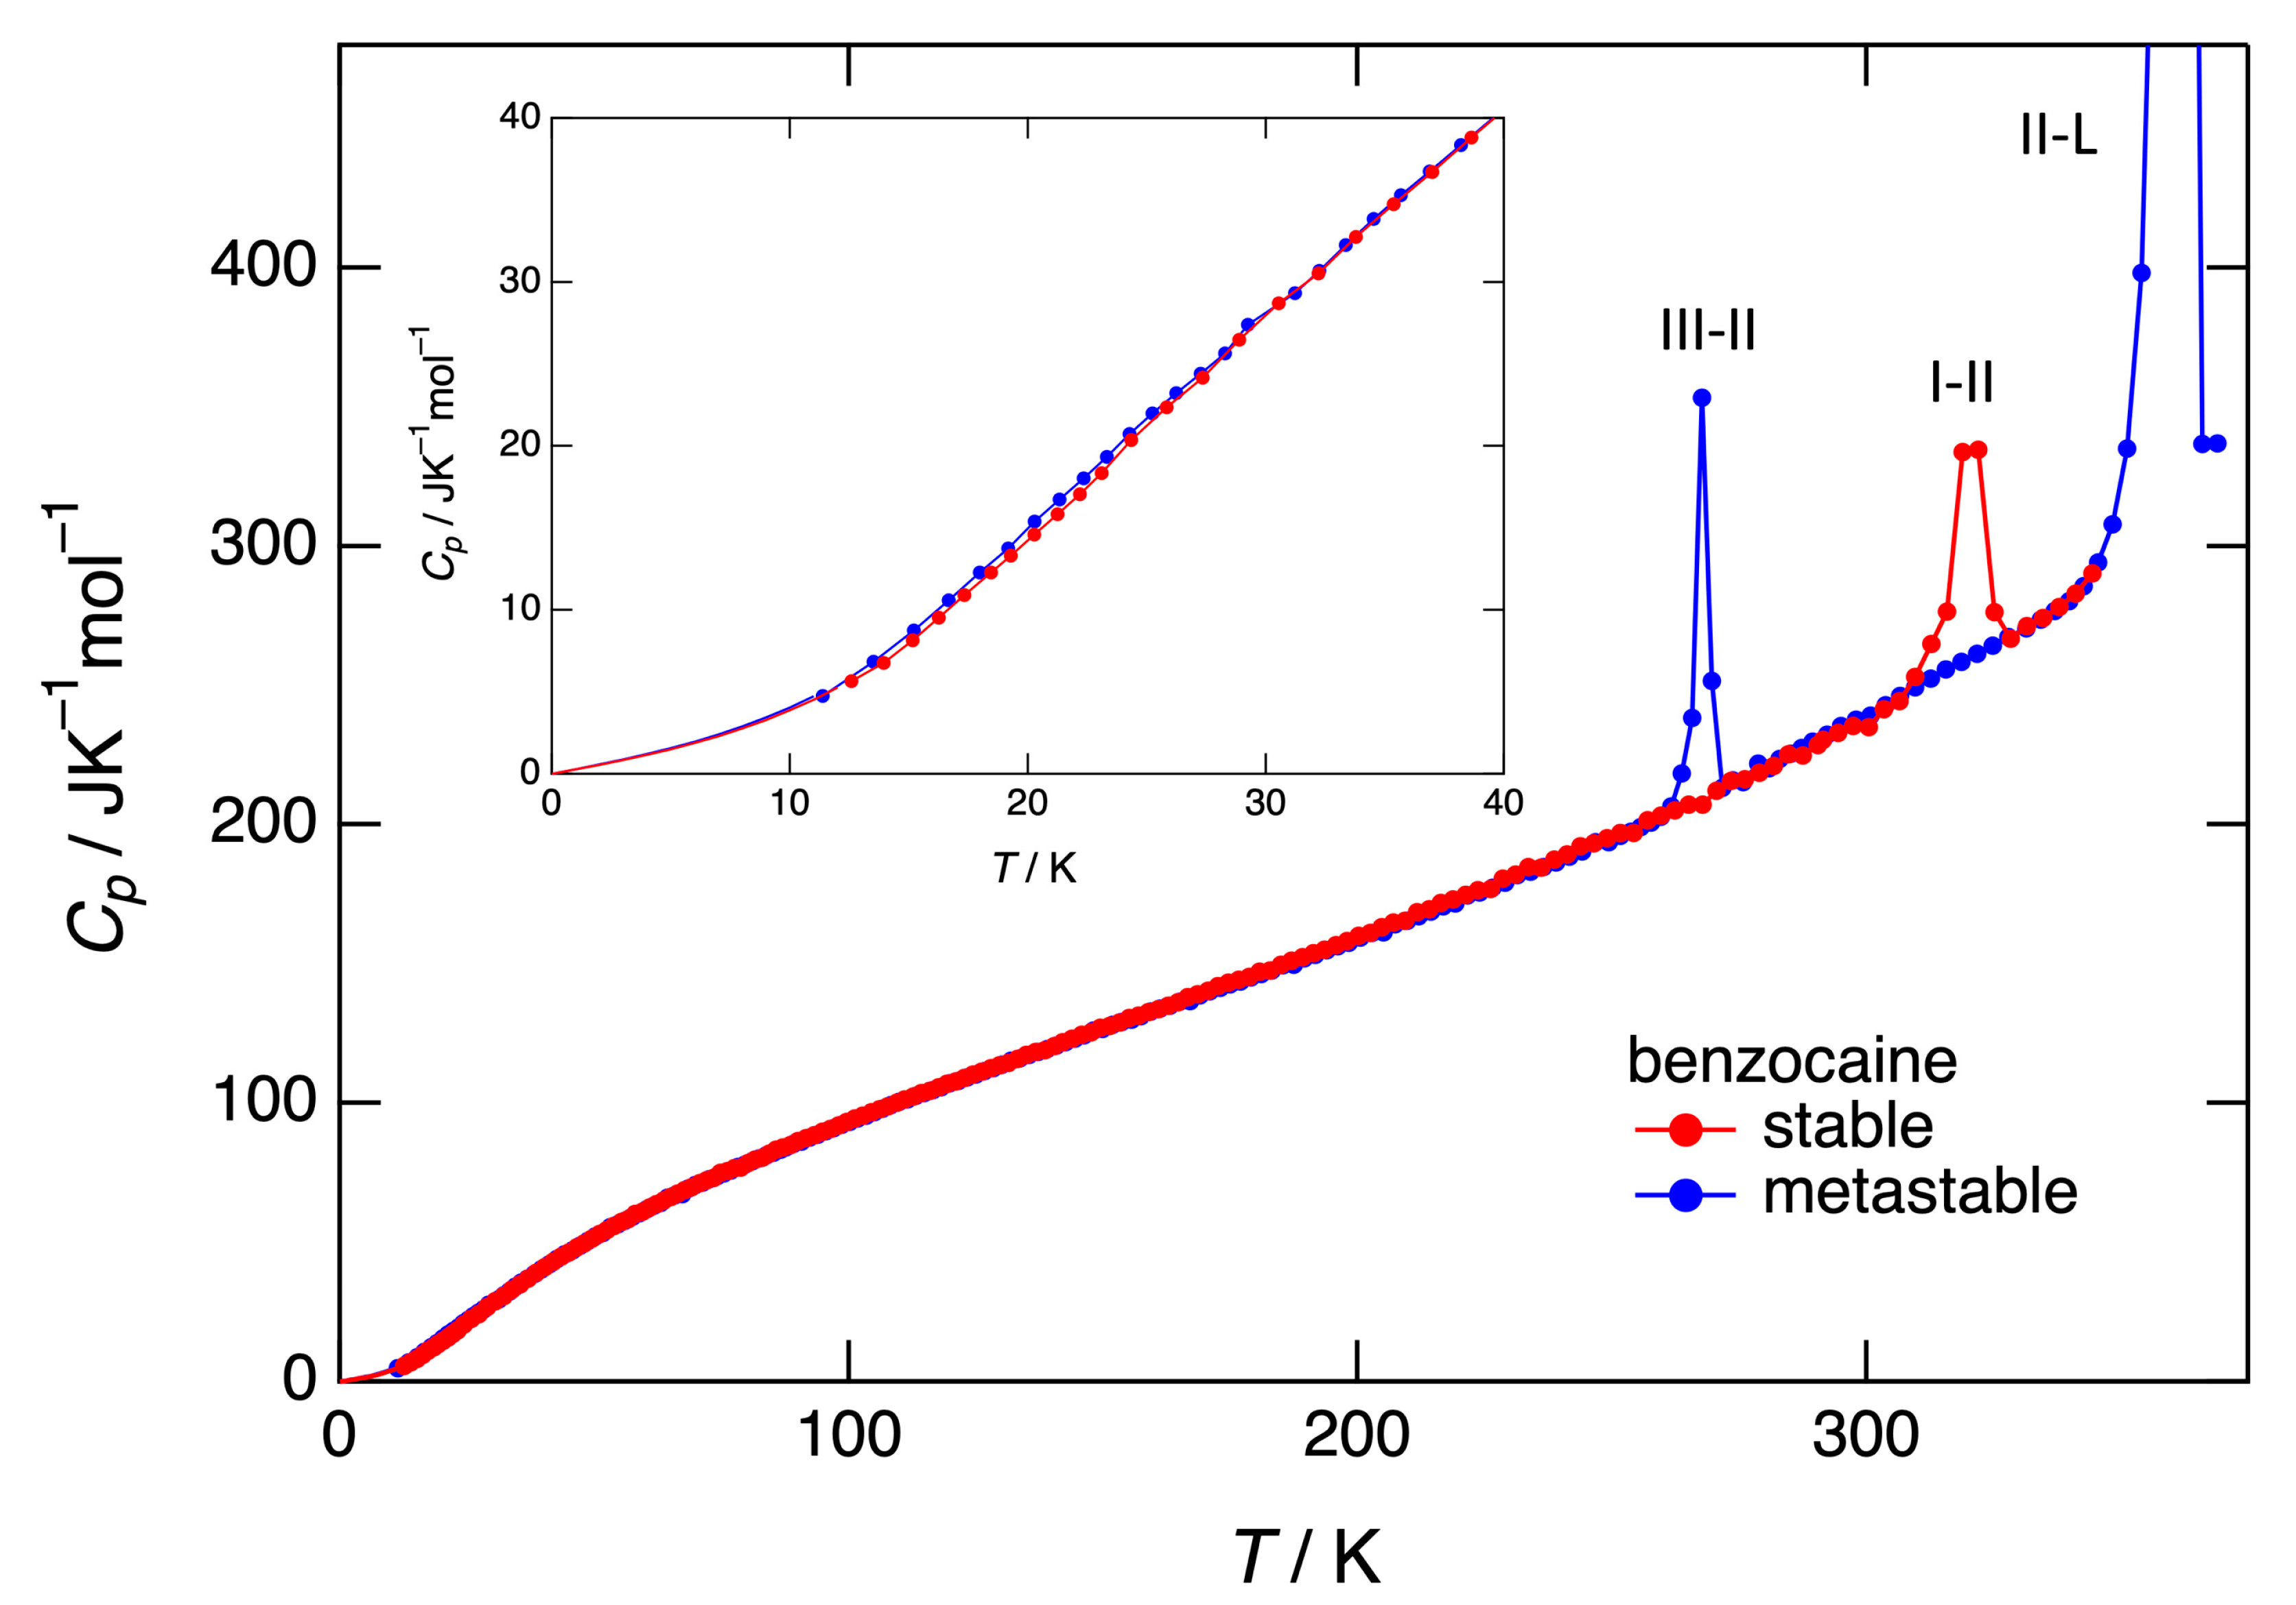
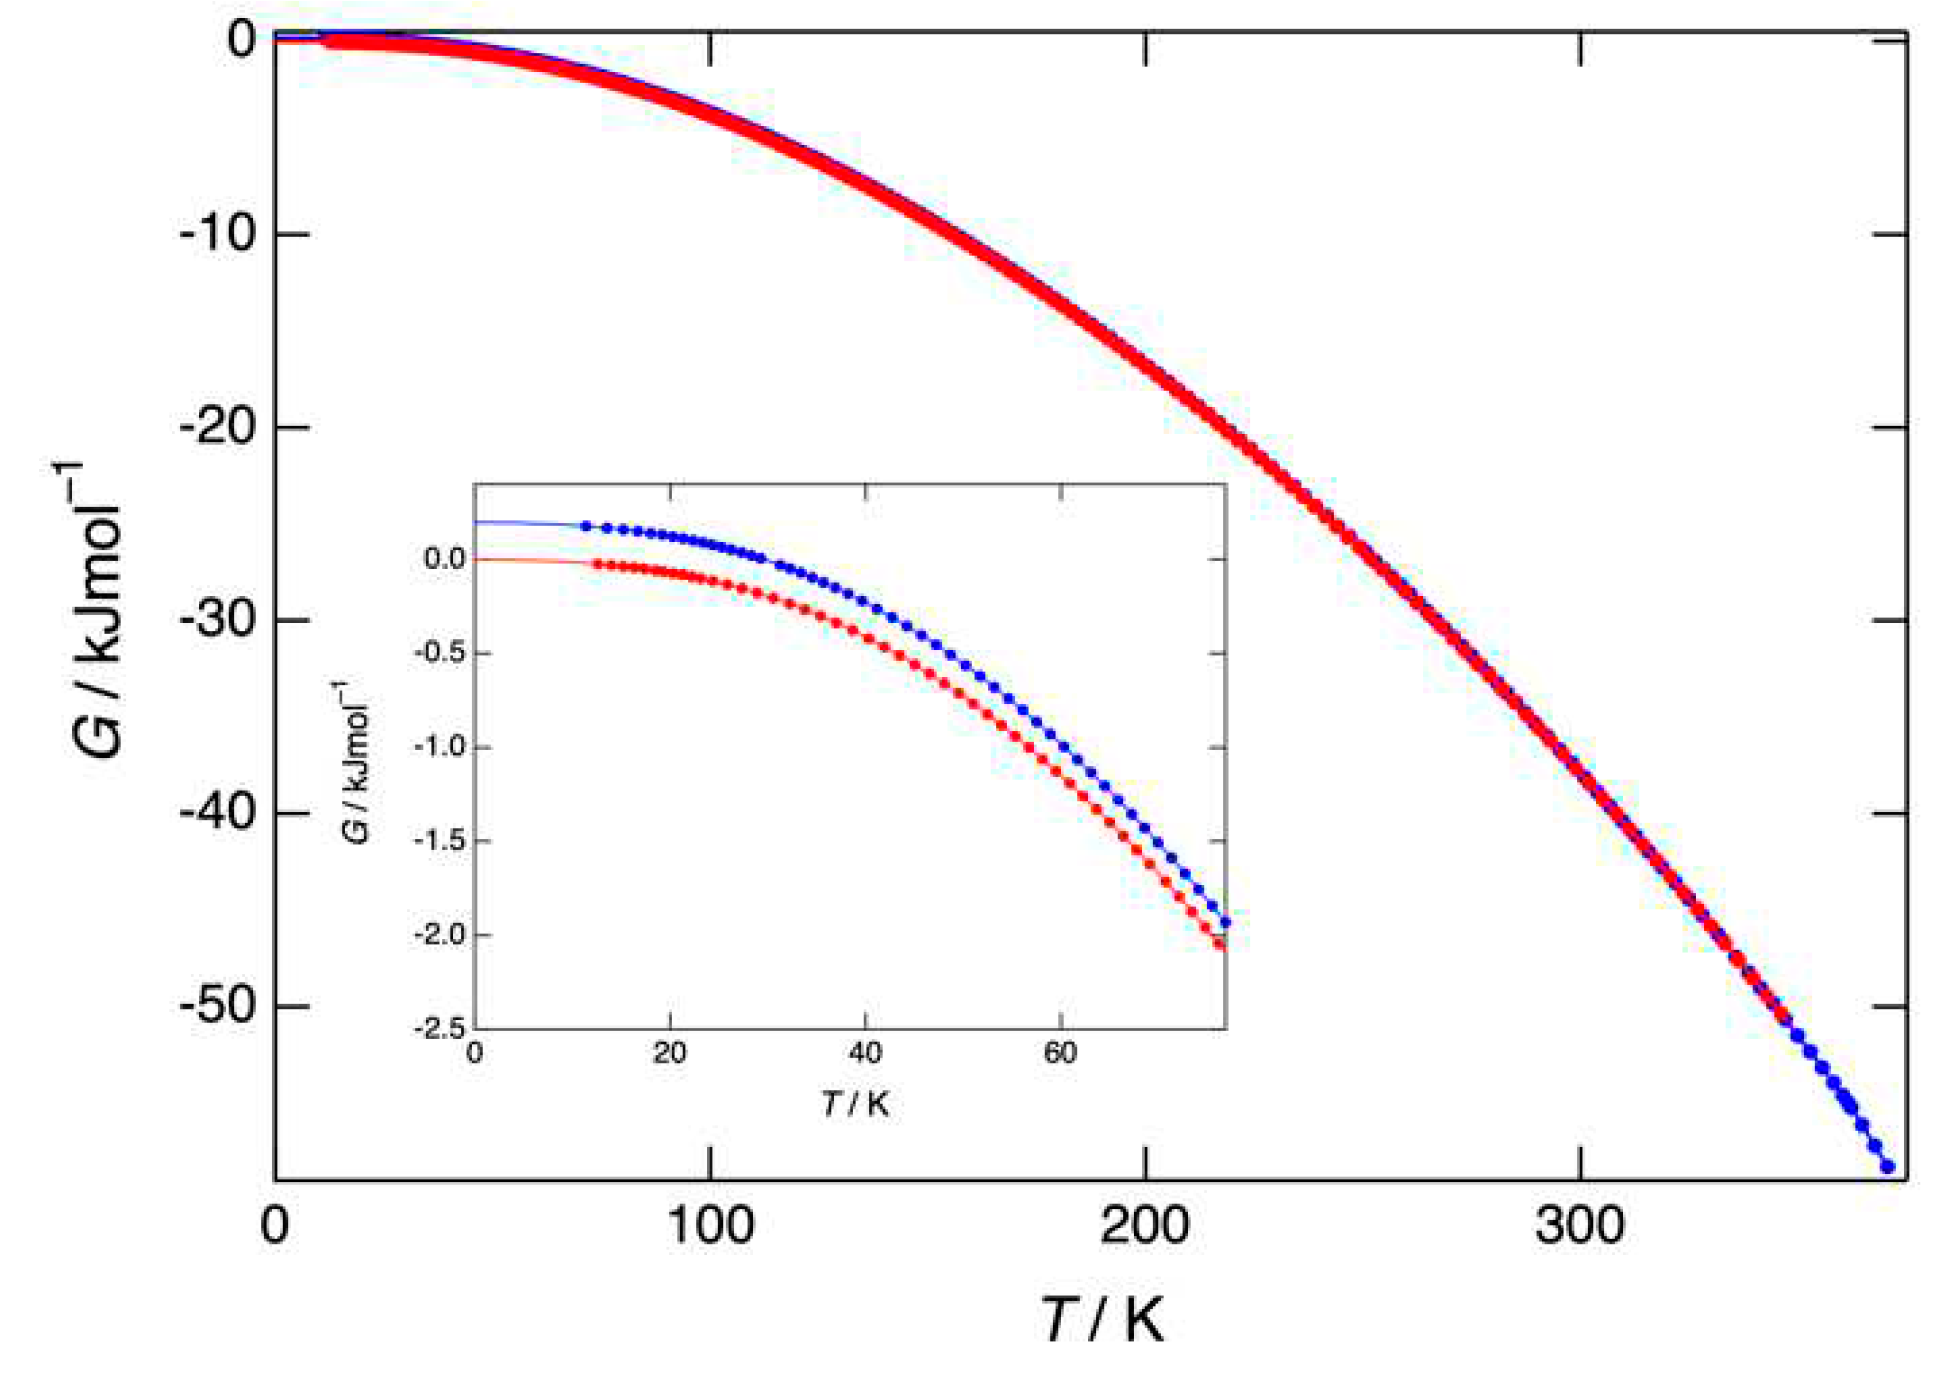
3.3. Heat capacity, entropy, enthalpy, and Gibbs free energy obtained by adiabatic calorimetry
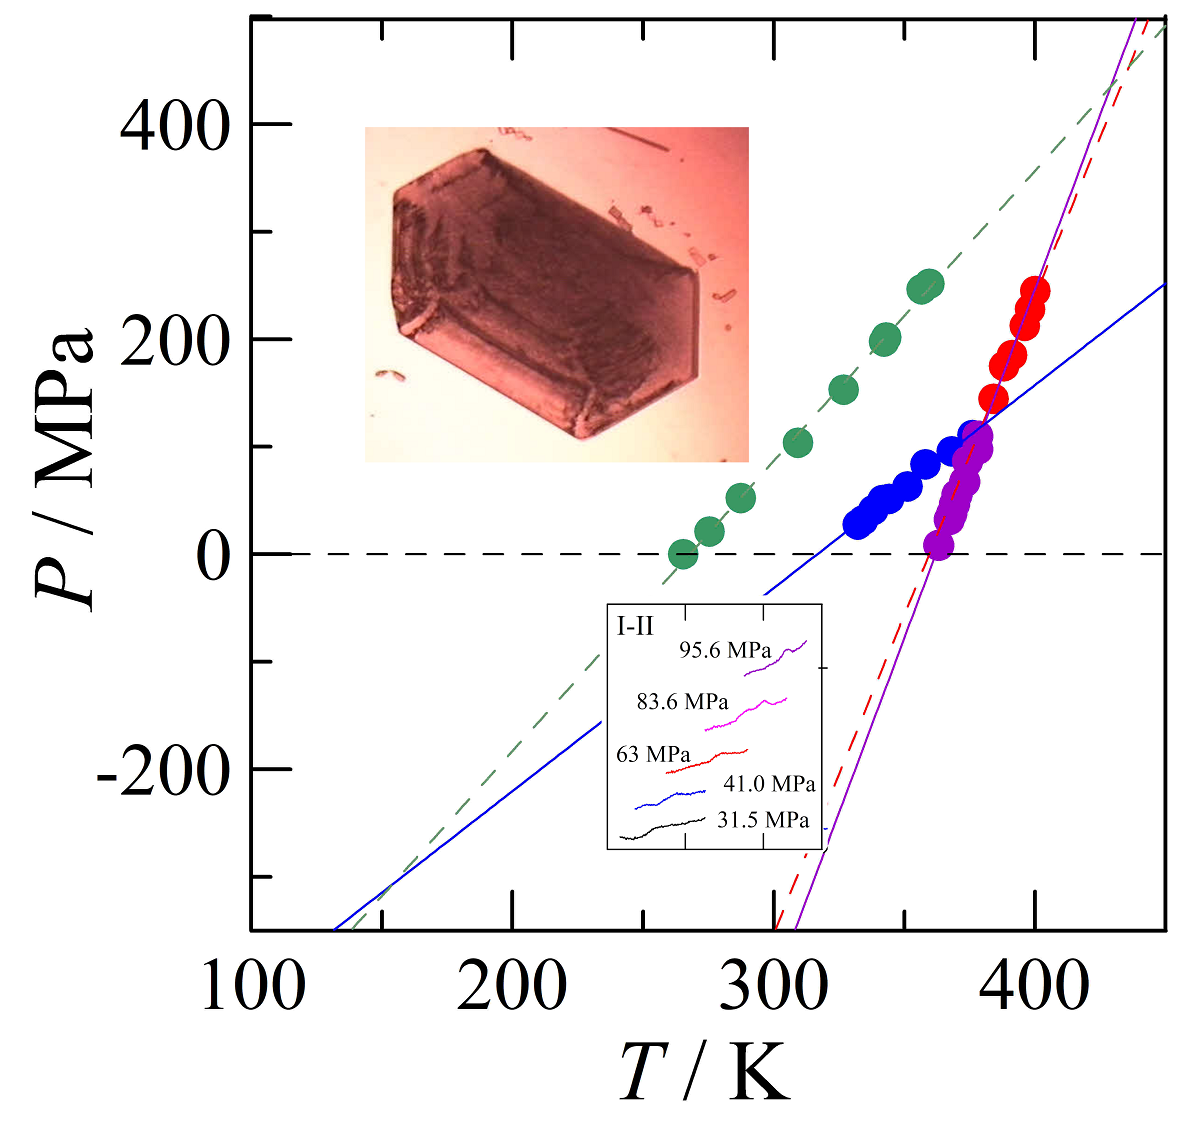
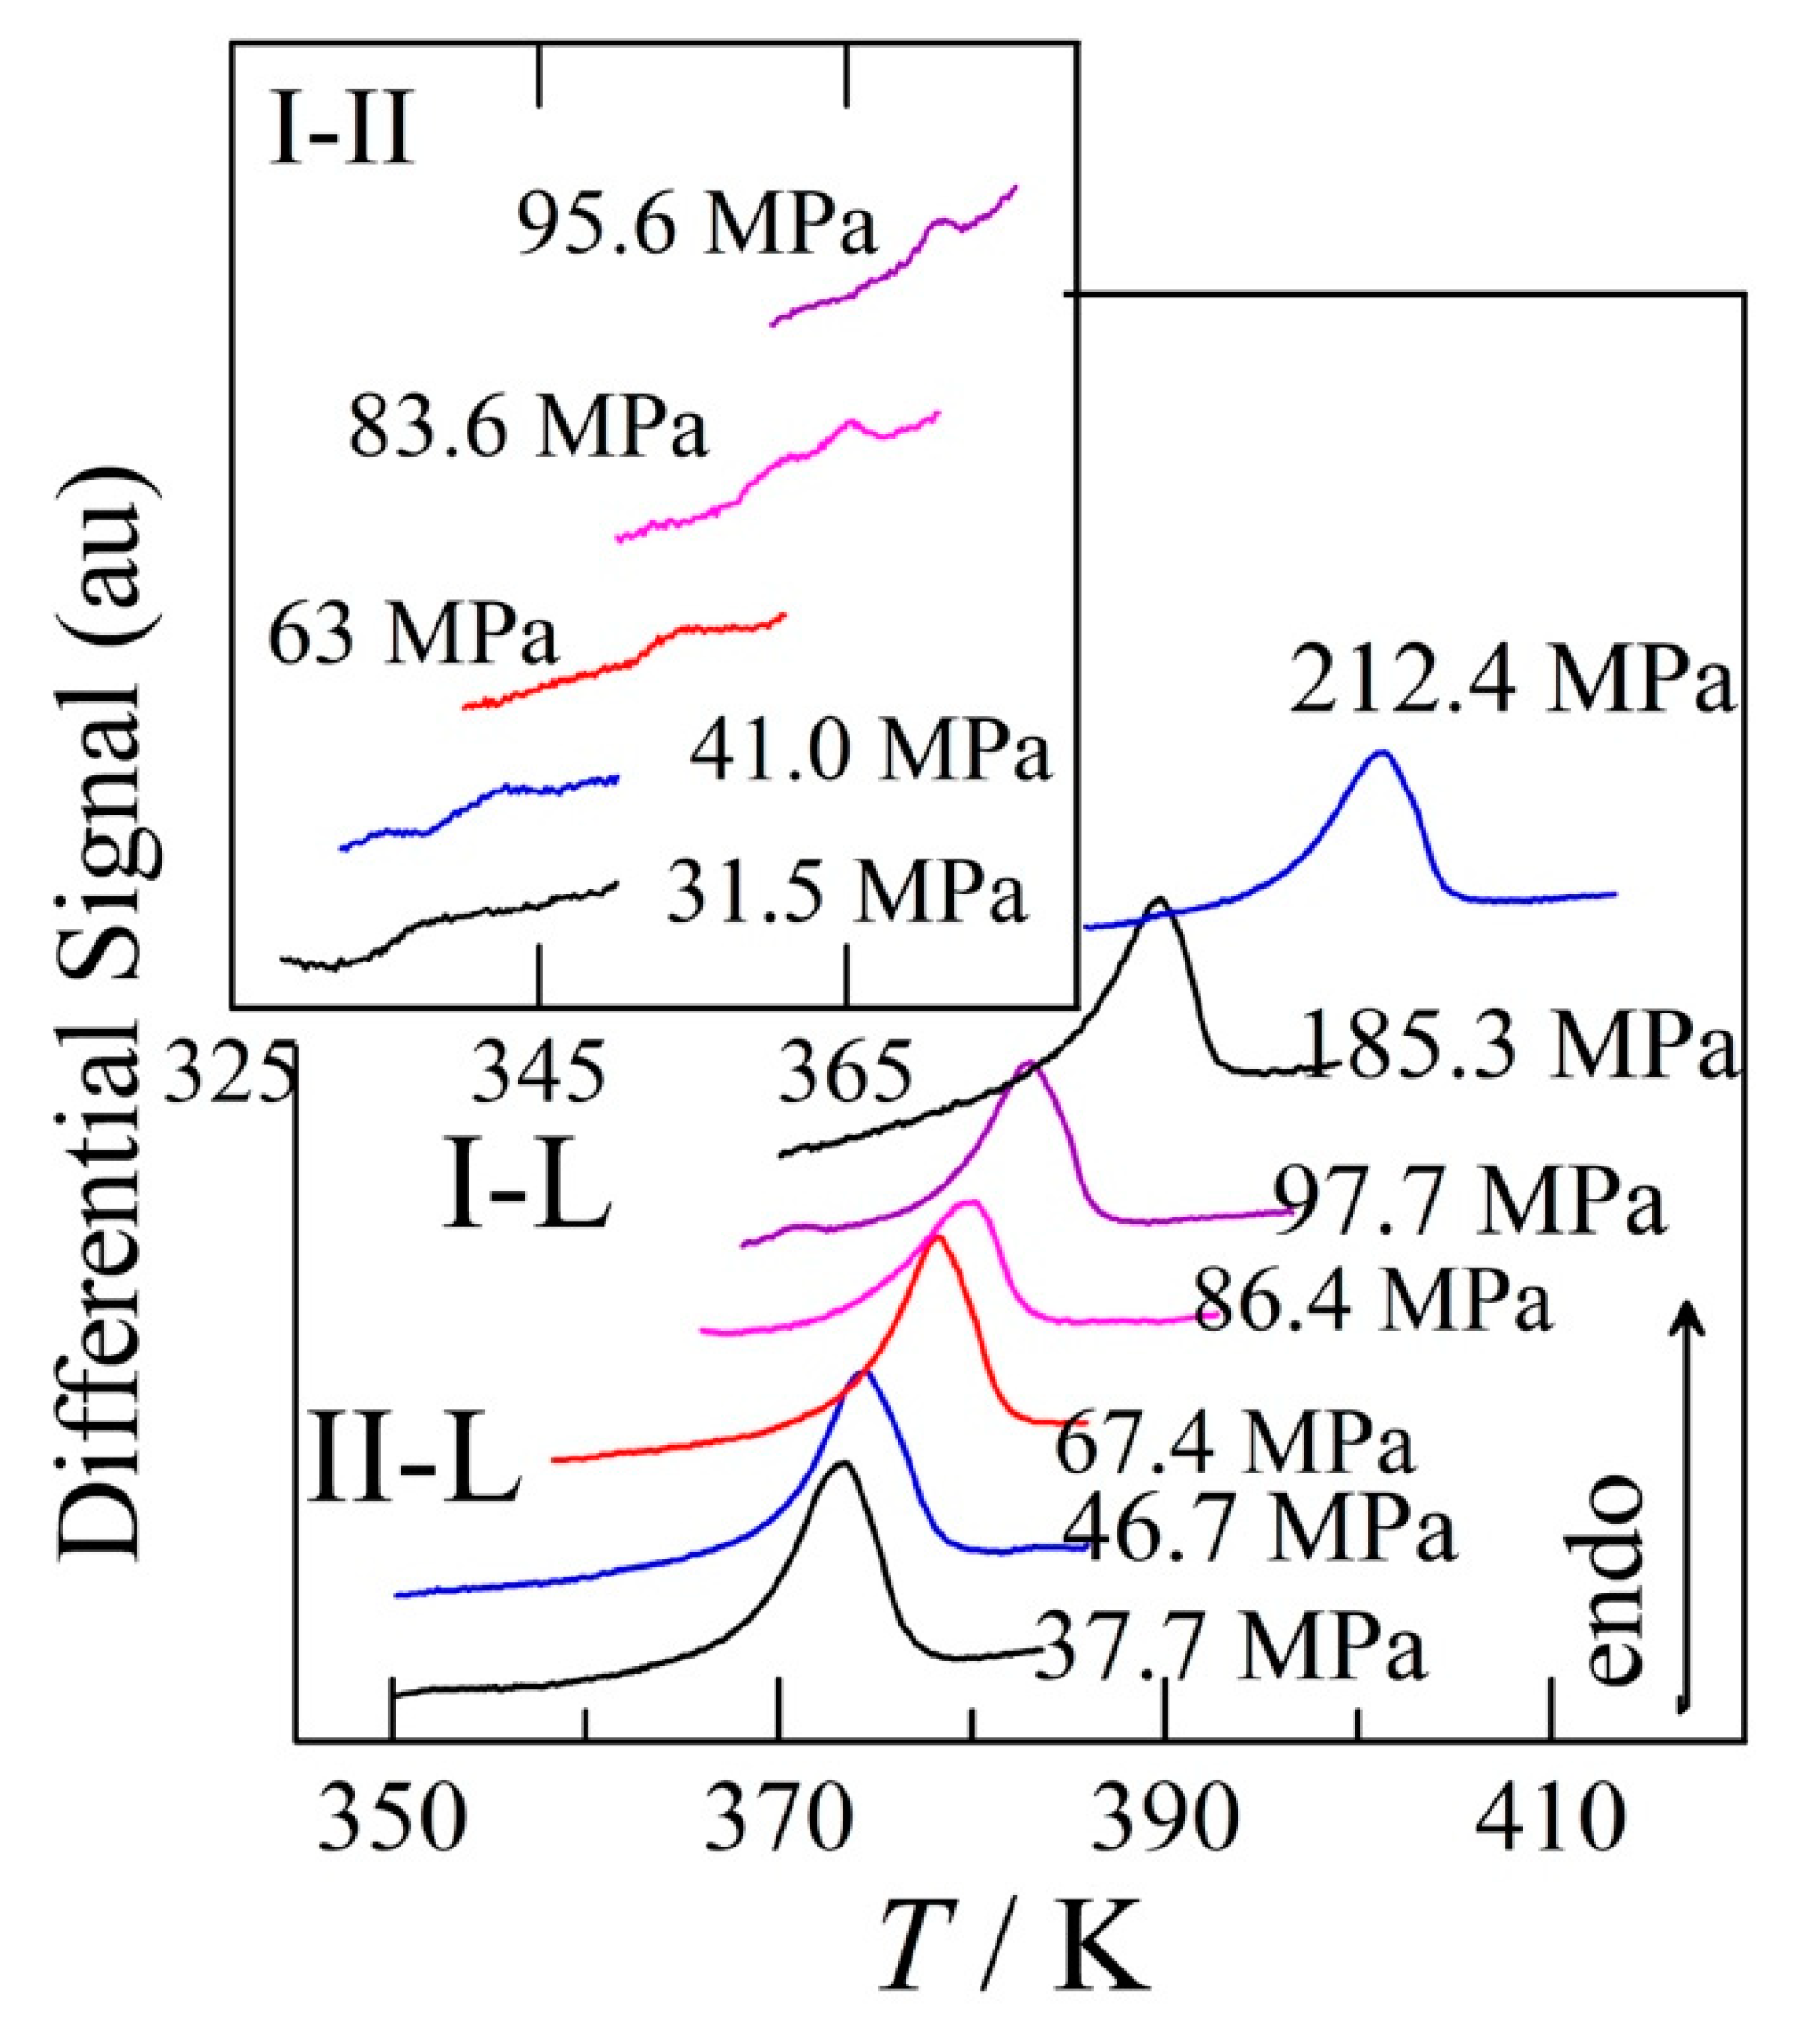
3.4. Transition temperatures obtained under pressure
4. Discussion
4.1. Stability of benzocaine under ordinary pressure, adiabatic versus DSC
4.2. Construction of the pressure-temperature phase diagram
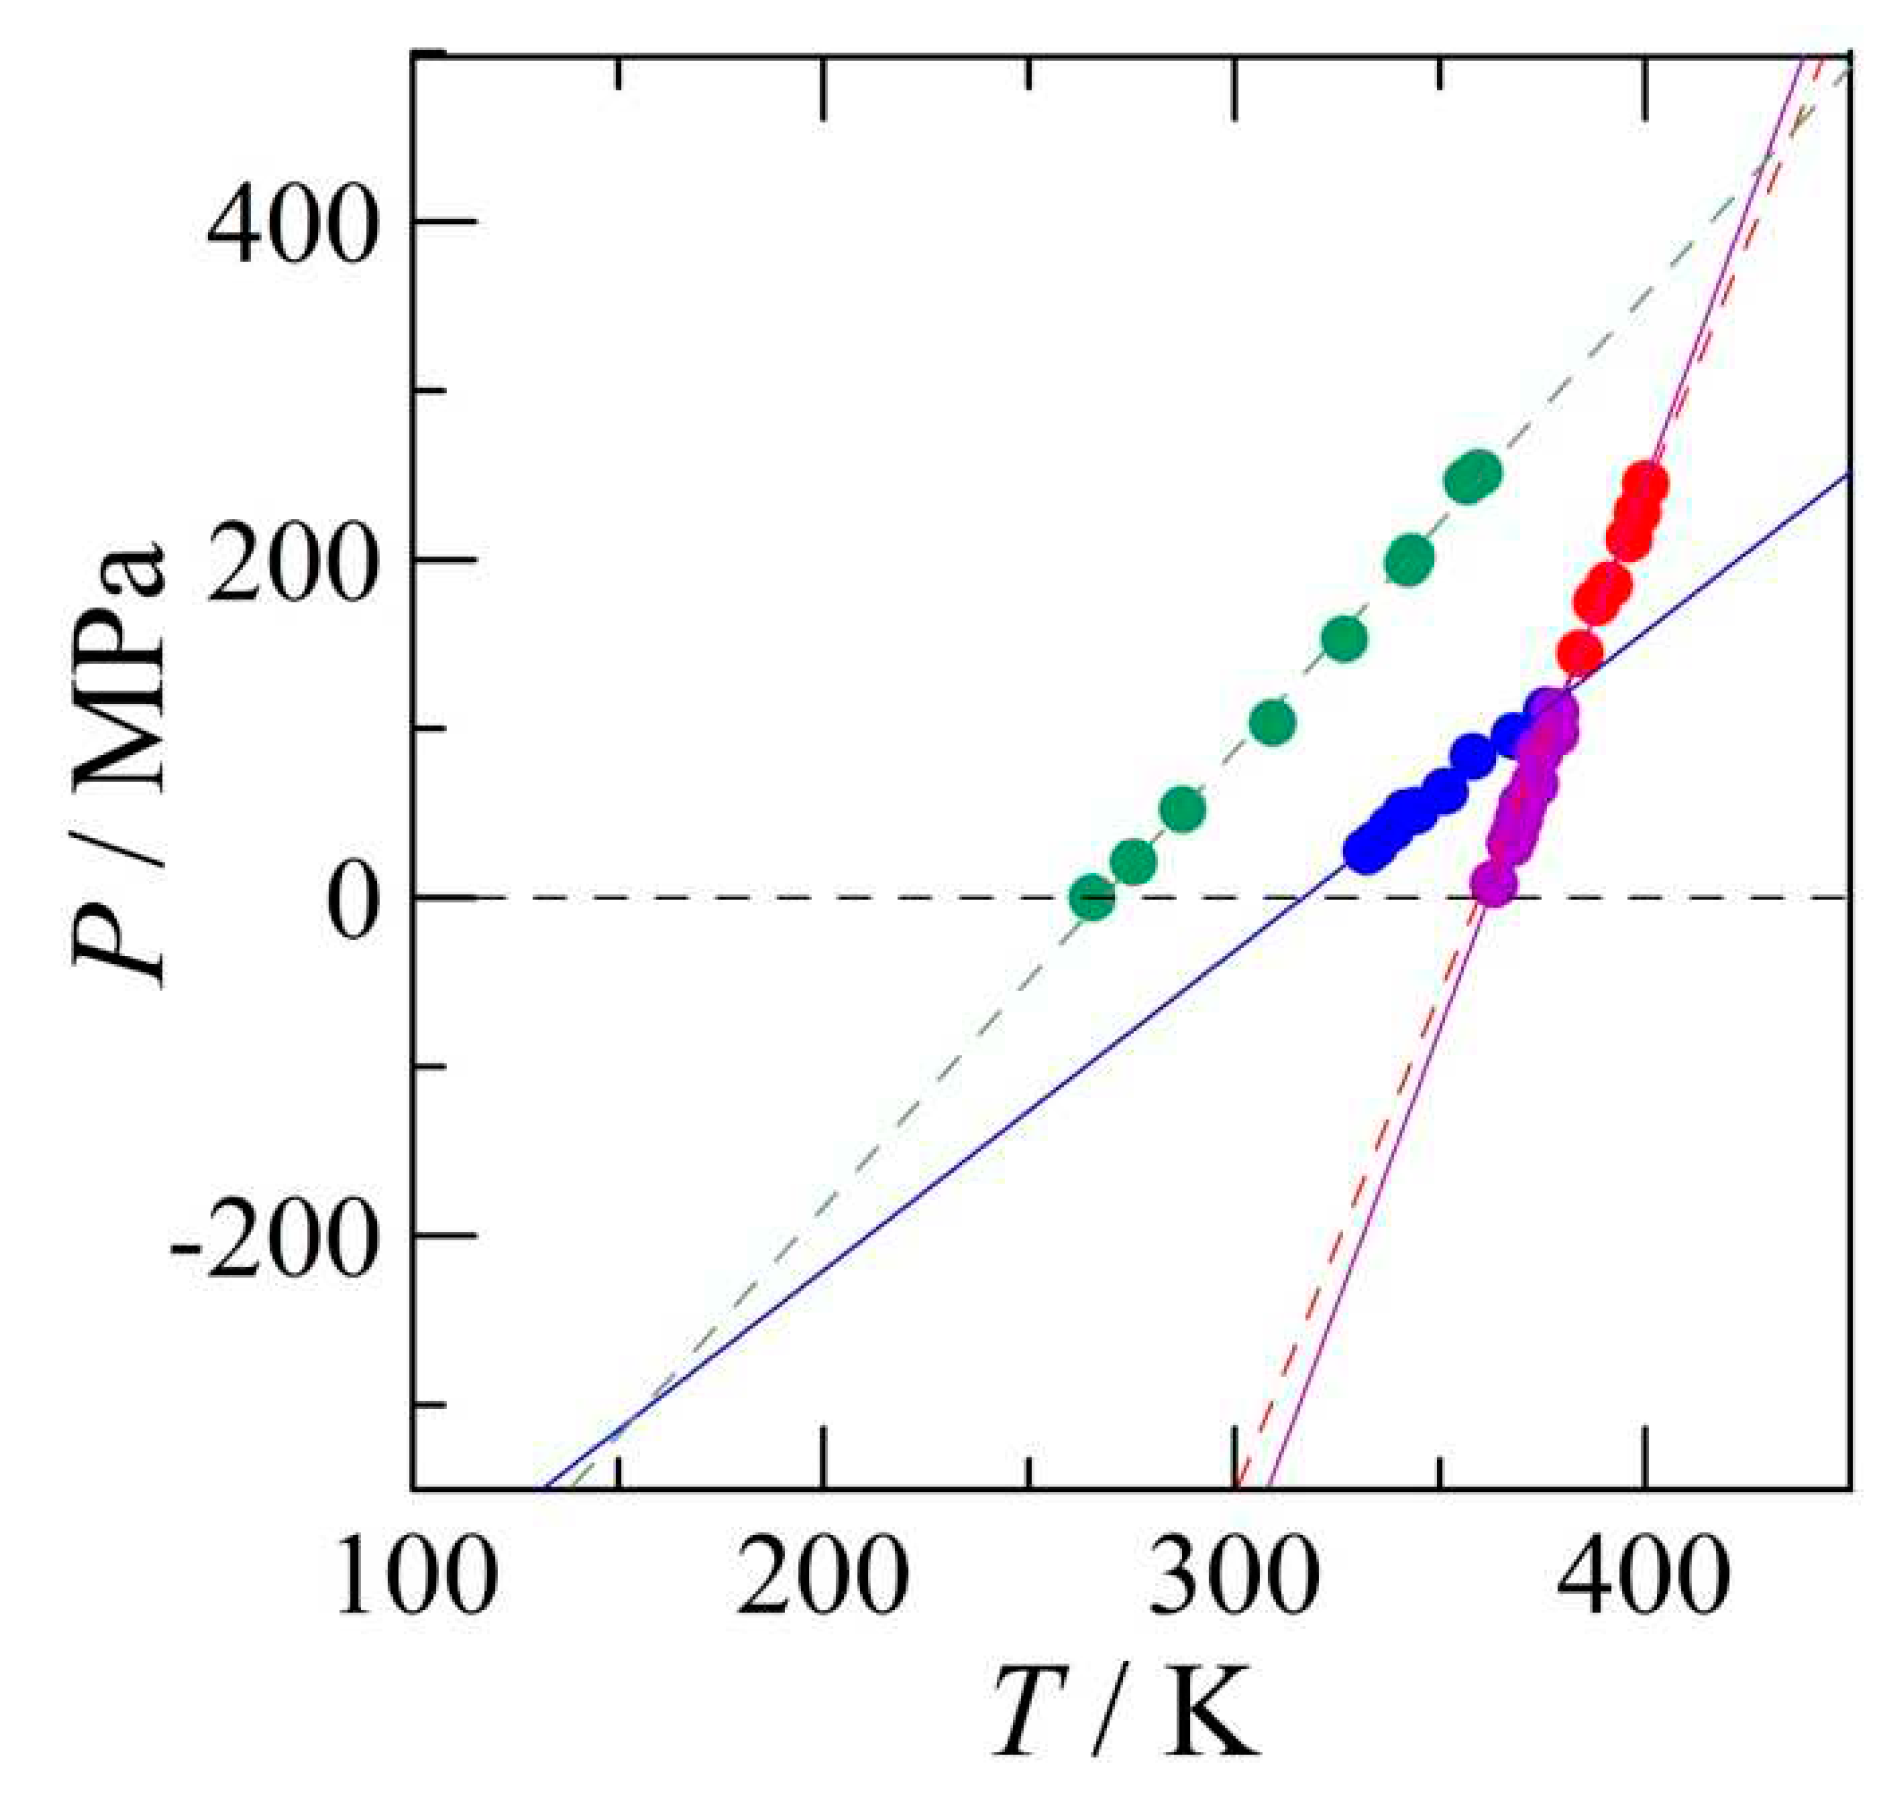
4.2.1. High-pressure data and its triple points
4.2.2. The positions of the I-III and the III-L equilibria
4.2.3. The pressure-temperature phase diagram
5. Conclusions
Supplementary Materials
Acknowledgements
References
- Gana, I.; Barrio, M.; Do, B.; Tamarit, J.-L.; Céolin, R.; Rietveld, I. B. , Benzocaine polymorphism: Pressure-temperature phase diagram involving forms II and III. Int. J. Pharm. 2013, 456, 480–488. [Google Scholar] [CrossRef]
- Bakhuis Roozeboom, H. W. , Die heterogenen Gleichgewichte vom Standpunkte der Phasenlehre. Erstes Heft: Die Phasenlehre - Systeme aus einer Komponente. ed.; Friedrich Vieweg und Sohn: Braunschweig, 1901; Vol. 1. [Google Scholar]
- Reilly, A. M.; Cooper, R. I.; Adjiman, C. S.; Bhattacharya, S.; Boese, A. D.; Brandenburg, J. G.; Bygrave, P. J.; Bylsma, R.; Campbell, J. E.; Car, R.; Case, D. H.; Chadha, R.; Cole, J. C.; Cosburn, K.; Cuppen, H. M.; Curtis, F.; Day, G. M.; DiStasio Jr, R. A.; Dzyabchenko, A.; van Eijck, B. P.; Elking, D. M.; van den Ende, J. A.; Facelli, J. C.; Ferraro, M. B.; Fusti-Molnar, L.; Gatsiou, C.-A.; Gee, T. S.; de Gelder, R.; Ghiringhelli, L. M.; Goto, H.; Grimme, S.; Guo, R.; Hofmann, D. W. M.; Hoja, J.; Hylton, R. K.; Iuzzolino, L.; Jankiewicz, W.; de Jong, D. T.; Kendrick, J.; de Klerk, N. J. J.; Ko, H.-Y.; Kuleshova, L. N.; Li, X.; Lohani, S.; Leusen, F. J. J.; Lund, A. M.; Lv, J.; Ma, Y.; Marom, N.; Masunov, A. E.; McCabe, P.; McMahon, D. P.; Meekes, H.; Metz, M. P.; Misquitta, A. J.; Mohamed, S.; Monserrat, B.; Needs, R. J.; Neumann, M. A.; Nyman, J.; Obata, S.; Oberhofer, H.; Oganov, A. R.; Orendt, A. M.; Pagola, G. I.; Pantelides, C. C.; Pickard, C. J.; Podeszwa, R.; Price, L. S.; Price, S. L.; Pulido, A.; Read, M. G.; Reuter, K.; Schneider, E.; Schober, C.; Shields, G. P.; Singh, P.; Sugden, I. J.; Szalewicz, K.; Taylor, C. R.; Tkatchenko, A.; Tuckerman, M. E.; Vacarro, F.; Vasileiadis, M.; Vazquez-Mayagoitia, A.; Vogt, L.; Wang, Y.; Watson, R. E.; de Wijs, G. A.; Yang, J.; Zhu, Q.; Groom, C. R. , Report on the sixth blind test of organic crystal structure prediction methods. Acta Crystallogr. B 2016, 72, 439–459. [Google Scholar]
- Addicoat, M.; Adjiman, C. S.; Arhangelskis, M.; Beran, G. J. O.; Bowskill, D.; Brandenburg, J. G.; Braun, D. E.; Burger, V.; Cole, J.; Cruz-Cabeza, A. J.; Day, G. M.; Deringer, V. L.; Guo, R.; Hare, A.; Helfferich, J.; Hoja, J.; Iuzzolino, L.; Jobbins, S.; Marom, N.; McKay, D.; Mitchell, J. B. O.; Mohamed, S.; Neumann, M.; Nilsson Lill, S.; Nyman, J.; Oganov, A. R.; Piaggi, P.; Price, S. L.; Reutzel-Edens, S.; Rietveld, I.; Ruggiero, M.; Ryder, M. R.; Sastre, G.; Schon, J. C.; Taylor, C.; Tkatchenko, A.; Tsuzuki, S.; van den Ende, J.; Woodley, S. M.; Woollam, G.; Zhu, Q. , Crystal structure evaluation: calculating relative stabilities and other criteria: general discussion. Faraday Discuss. 2018. [Google Scholar] [CrossRef]
- Sun, G.; Liu, X.; Abramov, Y. A.; Nilsson Lill, S. O.; Chang, C.; Burger, V.; Broo, A. , Current State-of-the-art In-house and Cloud-Based Applications of Virtual Polymorph Screening of Pharmaceutical Compounds: A Challenging Case of AZD1305. Cryst. Growth Des. 2021, 21, 1972–1983. [Google Scholar] [CrossRef]
- Neumann, M. A.; van de Streek, J.; Fabbiani, F. P. A.; Hidber, P.; Grassmann, O. , Combined crystal structure prediction and high-pressure crystallization in rational pharmaceutical polymorph screening. Nat. Commun. 2015, 6, 7793–7799. [Google Scholar] [CrossRef]
- Baaklini, G.; Dupray, V.; Coquerel, G. , Inhibition of the spontaneous polymorphic transition of pyrazinamide γ form at room temperature by co-spray drying with 1,3-dimethylurea. Int. J. Pharm. (Amsterdam, Neth.) 2015, 479, 163–170. [Google Scholar] [CrossRef]
- Smets, M. M. H.; Baaklini, G.; Tijink, A.; Sweers, L.; Vossen, C. H. F.; Brandel, C.; Meekes, H.; Cuppen, H. M.; Coquerel, G. , Inhibition of the Vapor-Mediated Phase Transition of the High Temperature Form of Pyrazinamide. Cryst. Growth Des. 2018, 18, 1109–1116. [Google Scholar] [CrossRef]
- Li, K.; Gbabode, G.; Barrio, M.; Tamarit, J.-L.; Vergé-Depré, M.; Robert, B.; Rietveld, I. B. , The phase relationship between the pyrazinamide polymorphs α and γ. Int. J. Pharm. 2020, 580, 119230. [Google Scholar]
- Li, K.; Gbabode, G.; Vergé-Depré, M.; Robert, B.; Barrio, M.; Itié, J.-P.; Tamarit, J.-L.; Rietveld, I. B. , The pressure–temperature phase diagram of tetramorphic pyrazinamide. CrystEngComm 2022, 24, 5041–5051. [Google Scholar] [CrossRef]
- Patyk-Kazmierczak, E.; Kazmierczak, M. , A new high-pressure benzocaine polymorph - towards understanding the molecular aggregation in crystals of an important active pharmaceutical ingredient (API). Acta Crystallogr. B 2020, 76, 56–64. [Google Scholar]
- Lynch, D. E.; McClenaghan, I. , Monoclinic form of ethyl 4-aminobenzoate (benzocaine). Acta Crystallogr. E 2002, 58, O708–O709. [Google Scholar] [CrossRef]
- Chan, E. J.; Rae, A. D.; Welberry, T. R. , On the polymorphism of benzocaine; a low-temperature structural phase transition for form (II). Acta Crystallogr. B 2009, 65, 509–515. [Google Scholar] [CrossRef]
- Chan, E. J.; Welberry, T. R. , Precursor effects of the orthorhombic to monoclinic phase transition in benzocaine form (II) revealed by X-ray diffuse scattering. Acta Crystallogr. B 2010, 66, 260–270. [Google Scholar] [CrossRef]
- Patel, M. A.; AbouGhaly, M. H. H.; Chadwick, K. , The discovery and investigation of a crystalline solid solution of an active pharmaceutical ingredient. Int. J. Pharm. 2017, 532, 166–176. [Google Scholar] [CrossRef]
- Baptista, A. , Radiocrystallographic study of organic substances. III. Benzocaine. Anais da Academia Brasileira de Ciencias 1968, 40, 67–70. [Google Scholar]
- Sinha, B. K.; Pattabhi, V. , Crystal-Structure of Benzocaine-a Local-Anesthetic. P Indian as-Chem Sci 1987, 98, 229–234. [Google Scholar] [CrossRef]
- Rietveld, I. B.; Ceolin, R. , Rotigotine: Unexpected Polymorphism with Predictable Overall Monotropic Behavior. J. Pharm. Sci. 2015, 104, 4117–4122. [Google Scholar] [CrossRef]
- Céolin, R.; Rietveld, I. B. , The topological pressure-temperature phase diagram of ritonavir, an extraordinary case of crystalline dimorphism. Ann. Pharm. Fr. 2015, 73, 22–30. [Google Scholar] [CrossRef]
- Bauer, M.; Lacoulonche, F.; Ceolin, R.; Barrio, M.; Khichane, I.; Robert, B.; Tamarit, J. L.; Rietveld, I. B. , On the dimorphism of prednisolone: The topological pressure-temperature phase diagram involving forms I and II. Int. J. Pharm. 2022, 624, 122047. [Google Scholar] [CrossRef]
- Tsukushi, I.; Yamamuro, O.; Sadanami, K.; Nishizawa, M.; Matsuo, T.; Takeda, K. , Construction of a top-loading adiabatic calorimeter and enthalpy relaxation of glassy (1,3-propanediol)0.5(1,2-propanediamine)0.5. Rev. Sci. Instrum. 1998, 69, 179–184. [Google Scholar] [CrossRef]
- Würflinger, A. , Differential thermal-analysis under high-pressure IV. Low-temperature DTA of solid-solid and solid-liquid transitions of several hydrocarbons up to 3 kbar. Ber. Bunsen-Ges. Phys. Chem. 1975, 79, 1195–1201. [Google Scholar] [CrossRef]
- Yu, L. , Inferring Thermodynamic Stability Relationship of Polymorphs from Melting Data. J. Pharm. Sci. 1995, 84, 966–974. [Google Scholar] [CrossRef]
- Riecke, E. , Spezielle Fälle von Gleichgewichterscheinungen eines aus mehreren Phasen zusammengesetzten Systemes. Z. Phys. Chem. (Munich) 1890, 6, 411–429. [Google Scholar] [CrossRef]
- ACDLabs Advanced Chemistry Development (ACD/Labs) Software, V11.02; ACD/Labs.
- Ceolin, R.; Allouchi, H.; Rietveld, I. B. , On the dimorphism and the pressure-temperature state diagram of gestodene, a steroidal progestogen contraceptive. Ann Pharm Fr 2020, 78, 303–309. [Google Scholar] [CrossRef]
- Ceolin, R.; Rietveld, I.-B. , X-ray crystallography, an essential tool for the determination of thermodynamic relationships between crystalline polymorphs. Ann. Pharm. Fr. 2016, 74, 12–20. [Google Scholar] [CrossRef]
- Toscani, S.; de Oliveira, P.; Céolin, R. , Phenomenology of polymorphism IV. The trimorphism of ferrocene and the overall metastability of its triclinic phase. J. Solid State Chem. 2002, 164, 131–137. [Google Scholar] [CrossRef]
- Toscani, S.; Céolin, R.; Ter Minassian, L.; Barrio, M.; Veglio, N.; Tamarit, J.-L.; Louër, D.; Rietveld, I. B. , Stability hierarchy between piracetam forms I, II, and III from experimental pressure-temperature diagrams and topological inferences. Int. J. Pharm. 2016, 497, 96–105. [Google Scholar] [CrossRef]
- Nicolai, B.; Barrio, M.; Lloveras, P.; Polian, A.; Itie, J. P.; Tamarit, J. L.; Rietveld, I. B. , A thermodynamically consistent phase diagram of a trimorphic pharmaceutical, l-tyrosine ethyl ester, based on limited experimental data. Phys Chem Chem Phys 2018, 20, 24074–24087. [Google Scholar] [CrossRef]
- Barrio, M.; de Oliveira, P.; Céolin, R.; Lopez, D. O.; Tamarit, J. L. , Polymorphism of 2-methyl-2-chloropropane and 2,2-dimethylpropane (neopentane): Thermodynamic evidence for a high-pressure orientationally disordered rhombohedral phase through topological p-T diagrams. Chem. Mater. 2002, 14, 851–857. [Google Scholar] [CrossRef]

| Code (QQQAXG) |
Form | T /K | Vcell /Å3 | vspec /cm3 g-1 | reference |
|---|---|---|---|---|---|
| 02 | I | 150 | 871.9 | 0.7946 | 12 |
| 04 | I | 300 | 906.0 | 0.8257 | 13 |
| 06 | I | 300 | 906.0 | 0.8257 | 14 |
| 09 | I | 296 | 905.0 | 0.8248 | 15 |
| 00 | II | 293 | 910.6 | 0.8299 | 16 |
| 01 | II | 293 | 909.2 | 0.8287 | 17 |
| 05 | II | 300 | 915.0 | 0.8339 | 13 |
| 07 | II | 300 | 915.0 | 0.8339 | 14 |
| 10 | II | 293 | 912.4 | 0.8315 | 15 |
| 03 | III | 150 | 1759.9 | 0.8020 | 13 |
| 08 | III | 150 | 1759.9 | 0.8020 | 14 |
| Peaks I→II | Fusion | ||||||
|---|---|---|---|---|---|---|---|
| Sample | Mass /mg | T /K | ∆H /Jg-1 | T /K | ∆H /Jg-1 | T /K | ∆H /Jg-1 |
| TA instruments | |||||||
| 1 | 3.84 | 316.8 | 0.67 | 340.2 | 1.09 | 362.6 | 132.9 |
| 2 | 3.11 | 341.6 | 0.89 | 362.6 | 137.5 | ||
| 3 | 7.89 | 317.0 | 1.70 | 362.8 | 127.4 | ||
| 4 | 1.66 | 340.0 | 1.86 | 362.6 | 129.9 | ||
| 5 | 2.42 | 342.4 | 2.63 | 362.6 | 134.4 | ||
| 6 | 3.70 | 318.0 | 0.03 | 344.2 | 1.54 | 362.6 | 133.5 |
| 7 | 4.44 | 317.6 | 0.50 | 339.2 | 0.61 | 362.6 | 131.0 |
| Perkin Elmer | |||||||
| 8 | 2.46 | 321.0 | 0.76 | 339.6 | 2.24 | 359.8 | 129.9 |
| 9 | 2.08 | 316.2 | 0.62 | 332.6 | 1.97 | 361.4 | 127.5 |
| 10 | 2.15 | 336.2 | 0.90 | 361.8 | 131.5 | ||
| 11 | 2.42 | 343.8 | 1.67 | 361.4 | 133.1 | ||
| Equilibrium |
T /K |
∆S /J g-1 K-1 |
∆H /J g-1 |
|---|---|---|---|
| III-II | 266.0 | 0.010225 | 2.7194 |
| I-II | 319.5 | 0.011938 | 3.8146 |
| II-l | 361.0 | 0.369514 | 133.412 |
| Triple point | Temperature /K |
Pressure /Pa |
|
|---|---|---|---|
| I-II-III | 154.0 | -307×106 | metastable |
| III-II-v | 267.8 | 0.012 | metastable |
| I-II-v | 316.6 | 2.4 | stable |
| I-III-l | 326.1 | -198×106 | supermetastable |
| III-l-v | 358.3 | 78 | supermetastable |
| I-l-v | 359.5 | 83 | metastable |
| II-l-v | 362.0 | 95 | stable |
| I-II-l | 380.1 | 120×106 | stable |
| III-II-l | 428.9 | 435×106 | metastable |
| I-III-v | 639.3 | 7.4×10⁶ | supermetastable |
Disclaimer/Publisher’s Note: The statements, opinions and data contained in all publications are solely those of the individual author(s) and contributor(s) and not of MDPI and/or the editor(s). MDPI and/or the editor(s) disclaim responsibility for any injury to people or property resulting from any ideas, methods, instructions or products referred to in the content. |
© 2023 by the authors. Licensee MDPI, Basel, Switzerland. This article is an open access article distributed under the terms and conditions of the Creative Commons Attribution (CC BY) license (http://creativecommons.org/licenses/by/4.0/).


