1. Introduction
Experimental in situ measurements of sea surface parameters are extremely important for sea state monitoring, forecasting and marine safety. While significant wave heights and characteristic periods are recognized as essential for many problems of wave forecasting [see [
1], marine safety [e.g. [
2], calibration of satellite altimeters [
3,
4] etc., spectral characteristics measured by wave buoys are of special value both for operational needs and for fundamental studies of ocean environment [e.g. [
5,
6]. Being an inherently point-wise tool, wave buoys, with their capability to measure wave field directionality and energy distribution in wave scales, can provide information on wave field at large distances from their location. Potentially, partitioning of the experimentally obtained spectra [
7] allows one for identifying positions and physical characteristics of wave sources, e.g. distant storms [e.g. [
8]. Thus, long enough measurements of even single wave buoy can provide essential information on the dynamics of rather large water area.
Waves in the Black Sea region can be regarded as well-studied. The numerical modelling with WaveWatchIII, WAM and SWAN [e.g. [
10,
11,
12,
13,
14,
15], etc.] reflects general features of wave dynamics in the whole area of the Black Sea. [
16] studied climate variations of wave parameters at the inlet of Novorossiysk bay using DHI MIKE 21 SW spectral wave model. Field measurements were carried out in the nearshore of the cities of Anapa, Novorossiysk, Gelendzhik, and Sochi [e.g. [
17,
18,
19,
20,
21], etc.] at 5-10 km distances. Shorter distances are critical because of intensive navigation near the cities. The steep bottom slope in the area (8-10 km) limits longer distances. There are fewer works on wind spectra in the Black Sea [e.g. [
22,
23], etc.]. The data of the NATO TU-WAVES Project obtained with the DATAWELL buoy for 1996-2003 years represent a unique long-term record that provide a solid basis for studies of climate variability and extreme events in the area affected by strong off-shore winds (bora) (data are available at [
24]).
The Utrish buoy data of this study can be regarded as a specific case because of very short distances from the coast. Attempts to assess the quality of wave models [
25,
26,
27,
28] with this data showed a deficiency of the models and the necessity of special tuning of both wind and wave blocks for the near-shore conditions. Wave modeling in inner water bodies also faces these problems [
29,
30]. One can see a similar deficiency in understanding wave physics at very short fetches in experimental studies [e.g. [
31,
32,
33].
In this paper, we present an analysis of wave buoy measurements in the North-Eastern Black Sea near-shore (Caucasian coast) for about one year period of 2020-2021. Rather short distances from the mountainous coast (600 and 1500 meters) impose specific difficulties in getting the data, its analysis and interpretation. Wind speed measurements at the site were not carried out because of technical issues of the gauge installation in the harsh sea state conditions of the nearshore. The corresponding parameters, wind speed and direction, have been extrapolated from the nearest sites of the Anapa weather station and the numerical model (reanalysis) about 10 km off the buoy. The wind shading by the coastal orography requires an accurate account in this case. The dominating mixed sea state in the area under study also contributes to uncertainties in the analysis and interpretation. Possible effects of wave refraction on the coastal currents and bathymetry are found to be quite weak but still observable in the wave buoy records. In our study all the listed problems are resolved by synthesising experimental data from different sources, model data and theoretical knowledge of dynamics of wind-driven seas. The synthesis of different approaches is essential for the study.
The experimental site is located at the natural reserve Utrish [
9]. The issues of coastal environment safety, climate changes, minimising risks of near-shore navigation become additional challenges.
The paper is aiming to fill the gap in understanding wave physics at very short distances from the coast by analyzing the unique data of the Utrish wave buoy. The existing concepts of wind-driven seas are based on the idea of a balance of different physical mechanisms. Empirical laws of wave growth for integral parameters, significant wave height and characteristic period, play an important role in providing a reference for new experimental studies and verification of the forecasting models. More detailed consideration of spectral distributions gives another reference in wave studies: widely-used parameterizations of wave spectra [e.g. JONSWAP spectrum [
34]. The idea of shape-invariance of wave spectra [
35] appears quite naturally but cannot find its explanation within conventional concept of wind-wave balance. Further development of the idea within the theory of weak turbulence leads to the concept of self-similarity of wave growth [e.g. [
36,
37] under certain physical conditions of the concept validity. The very first question of our study is whether these conditions can be realized at relatively short spatial and temporal scales of the experimental near-shore site? The synthesis of available experimental data and theoretical analysis allows one to propose answers to this question.
The paper is organized as follows. In Sect. 2, we overview available data on wind and wave conditions in the study area. The experimental setup and the collected data structure are described. Basic theoretical relationships for dimensionless parameters of sea waves are presented following the similarity approach by Kitaigorodskii [
38]. The recent idea to use wave spectra for retrieval wind speed characteristics [
39] is treated within the recent advances of the weak turbulence theory [
40].
Sect. 3 presents data analysis within two paradigms. The conventional approach based on wind speed scaling allows one to relate results with previously established semi-empirical relationships between dimensionless wave height and period. The recent results of the theory of weak turbulence provide estimates of energy spectral fluxes that do not imply empirical parameters and, thus, give new essential physical results.
The discussion section summarizes the study results and overviews the prospects of further studies.
2. Materials and Methods
In this section, we present the description of experimental and historical data on features of wind-wave coupling in the study area of the North-Eastern part of the Black Sea. The theoretical background is recapitulated for further synthesis of different types of data.
2.1. Study area. General description
The study area is situated in the North-Eastern part of the Black Sea (see
Figure 1a). The northern part of the Main Caucasian Ridge is an important climate-forming factor that controls the land-sea exchange of air masses. An extreme manifestation of the complex air circulation system in this area is known as the Novorossiysk bora [
18]. During these events, local winds can exceed 40 m/s with wind gusts up to 100 m/s [
41].
The coast between cities Anapa and Novorossiysk is hilly and strongly dissected (see
Figure 1a). There is an alternation of low eroded capes and pebble beaches. Low mountains in the coastal zone have heights from 320 m to
m. There is a steep cliff 30–50 meters high, which can create wind shadow. The underwater coastal slope is a rocky bench with numerous banks and depressions [
42]. Approximately one-third of the coast belongs to the Utrish reserve where the measurements were carried out. Near the buoy site the bottom forms “a bag” of relatively large depths (see
Figure 1b). From the southeastern side, this “a bag” is approached by a rocky ridge, which was discovered during a high-resolution sounding from a small vessel.
North-eastern winds dominate in this part of the Black Sea, especially in the cold seasons. In springtime, southeastern and southern winds become more frequent. Then winds change for east and south-east directions during summer time [
18,
43]. The mean wind speed in the Anapa-Novorossiysk region is about 6 m/s. As mentioned above, a distinctive feature of the Anapa-Novorossiysk-Tuapse region is a strong northeast wind, which is called bora. The number of days with bora annually is 21, most of which occur in the cold half of the year [
43].
Breeze, especially during summer, is another feature of the Caucasian coast. Breezes are usually well-expressed in stable anticyclonic weather. The coastal breeze is weaker than the sea breeze since the nighttime temperature contrast between the shore and the sea is much less than the daytime one. In the sea, the coastal breeze extends to a distance of 8-10 km [
43].
As to the wave climate in the study area, the mean significant wave height (SWH) is
m and mean wave periods are about
s that correspond to rather short waves of about 15 m. Extreme values of winter storms reach
meters for SWH and 10 s for wave period (about 150 m wavelength) [
14]. Higher waves are observed in autumn and winter and lower in summer [
14].
It should be stressed that the dominant directions of winds and waves are different [see [
18], p. 141,
Figure 3.11]. Thus, the mixed sea state appears an essential feature of the study area.
2.2. Wave buoy data
Wave data were obtained from Directional Waverider Datawell DWRG-4 operated intermittently from late January 2020 to mid-July 2021. The total operating time covered all seasons for approximately 11 months. There were two stages of the experiment (The latter are referred to as stages I and II in the text). For stage I (
) the buoy was set 600 meters offshore at 18 m depth. March 15, 2021, the buoy was relocated 1500 m offshore at 42 m depth to operate for another three months (spring - early summer) (stage II). Thus, differences in season, depth, and fetch (distance from the coast) should be accounted for when analyzing these two data subsets.
Table 1 presents general information on buoy coordinates, operation time, etc.
Datawell DWRG-4 wave buoy measures wave motions with help of the Global Positioning System (GPS) only. It can measure directional waves with periods from
to 100 s and the accuracy of the water surface elevation is 2 cm. The raw data are processed onboard by the built-in software and as a result, frequency spectra with an average direction for each frequency and directional frequency spectra are available. Specifications of the buoy are provided in
Table 2.
In this study, we used significant height, zero-crossing period
, mean wave direction angle
(off-direction measured from the North) as standard statistical information collected by the buoy and averaged for the time window 30 minutes. Frequency spectra of energy [
44] were estimated in the band
Hz for 64 logarithmically spaced frequency bins. We use below wave height for significant wave height unless otherwise stated.
2.3. Auxiliary in situ and reanalysis data
Unfortunately, as it was mentioned above, simultaneous wind speed measurements were impossible because of technical issues and specific environmental conditions of the near-shore. This is why auxiliary data have been used for the buoy data processing and interpretation.
2.3.1. Anapa weather station
The Anapa weather station about 20 km north-northwest from the experimental site (
N,
E,
Figure 1a) is the nearest to the buoy site. The station is located within the boundaries of Anapa city. It provides standard meteorological information every 3 hours, which is available in the database of Obninsk World Data Center [
45]. In this work, we used wind speed and direction measured at 10 m height above the ground.
2.3.2. Wind and wave reanalysis data
One more source of wind data was the NCEP Climate Forecast System Reanalysis (CFSR) v2 [
46]. Wind speed and direction are hourly data with less than
horizontal resolution. We took the point (
N,
E) 29 kilometers seaward from the buoy position (
Figure 1a).
Within this study wind wave parameters were calculated using the WAVEWATCH III model [
47] with wind forcing from the NCEP CFSR v2 and the source term ST6 [
48]. Nonlinear wave-wave interactions were modeled using the discrete interaction approximation [DIA, [
49]). Besides wave energy dissipation due to whitecapping, in the shallow coastal zone, the model reproduced an increase in the wave height when approaching the shore and the associated collapse upon reaching the wave steepness critical value. Standard JONSWAP parameterization [
34] is used for bottom friction. The directional resolution was
, and the frequency range of
Hz was binned in 36 bins. WAVEWATCH III model is widely used for wind wave simulation in the Black Sea [e.g. [
50,
51,
52,
53]. Implementation of the wave model used in this study has shown the root mean square error
m and correlation coefficient
. As the result, we gained the following wave parameters: wave height, wavelength, period, wave direction, and peak frequency.
2.4. Theoretical background of the data analysis
Currently, the theoretical basis for wind wave monitoring and forecasting is a statistical description in terms of spectral energy density
. The corresponding kinetic equation for wind-driven water waves, the so-called Hasselmann equation [
54]
describes changes of
in time
t and horizontal coordinate
as the result of wind generation (term
), dissipation under the action of various physical processes (
), and nonlinear interactions between waves of different scales (
). The full derivative
reflects variation with time (
), spatial dispersion due to wave propagation (
) and wave refraction in spatially inhomogeneous medium (
). The local dispersion relation for water waves
is a function of coordinate-dependent depth
and on the background current velocity
. Subscripts in (
2) denote gradients in space and wave vectors.
Directional Waverider DWRG-4 provides directional energy spectra
as a function of wave frequency and direction which is related to
by the well-known relations. The conventional physical analysis based on wind speed scaling and semi-empirical parameterizations [e.g. [
38,
68,
69] mostly relies upon local features of the spectra, say, on spectral peaks that emphasize specific directions and, thus, allows one to identify wave systems by synthesizing wind and wave data. The asymptotic theory of weak turbulence [e.g. [
40] does not address the wind speed explicitly. Spectral fluxes and the associated energy transfer between different wave scales are considered as key physical quantities and lead to the concept of non-local balance of spectral shapes [see e.g. [
35], on shape-invariance of wave spectra].
2.4.1. Similarity approach by Kitaigorodskii [38] for analysis of wind-wave coupling
The similarity approach has been proposed by Kitaigorodskii [
38] without any reference to a mathematical model before the kinetic equation for water waves was derived [
54], and exact solutions for this equation were found [
55,
56]. Despite serious doubts about the prospects of the approach specifically for wind waves [
57], Kitaigorodskii fixed many important results by constructing a series of models with a small number of “essential” physical parameters. Wave age (dimensionless wave period)
and wave pseudo-age (dimensionless wave height)
in words of Sverdrup and Munk [
1] are “essential for purpose of forecasting”. In Eqs.
4,
5 g is gravity acceleration,
T is a characteristic wave period, the spectral peak one, if otherwise stated. Wind speed
implies measurement at or extrapolation to a standard horizon 10 m.
Numerous dimensionless arguments of the problem can be constructed in a general case. First of all, these are dimensionless time
and dimensionless distance (fetch) of wave evolution
. The experimental setup does not allow for operating time and fetch explicit dependencies. At the same time, one can hypothesize a relationship between wave age
a and pseudo-age
following consideration of Kitaigorodskii in his classic paper [see comments to Eqs. 6-8 [
38].
The ratio between wave age and pseudo-age is usually approximated by power law dependencies
Semi-empirical Toba [
58] law states
and the constant
in terms of a wind speed
(
where
is friction velocity) and a spectral peak period. A consistent theoretical analysis of the Hasselmann equation [
54] solutions, confirmed by the results of numerical simulations [
59,
60] and experimantal results [
35,
56] showed dependence of dimensionless parameters
on the stage of wave development, i.e. on wave age
a. For young waves, at
, the dependence is steeper,
), and
for waves close to the fully-developed sea [
37,
61,
62]. In this way, we get dependence (
6) for treatment experimental results on integral parameters of wave field.
2.4.2. Theory of wave turbulence for the analysis of wind-wave coupling
Kitaigorodskii [
38] was the first who draw attention to wave spectra as indicators of dynamical features of random wave field. The Phillips asymptotic spectral shape
(
is universal Phillips’ constant [
63]) has been treated as one related to the state of fully developed sea [see Eq. 5 and further consideration [
38], “steady wave motion” in words of Kitaigorodskii. For the “unsteady wave motion” (the corresponding section title) an alternative asymptotic solution has been also derived from principles of dimensional analysis
Consistent mathematical interpretations of this spectral shape have been proposed in theoretical works [
55,
64]. Experimental estimates of ranges where solutions (
7,
8) have been realized were carried out two decades later [e.g. [
65,
66,
67,
68,
69]. Generally, the spectral shape follows dependency
(
8) in a range
. At higher frequencies wave spectra keep steeper law
(
7). ⪅
While the very existence of the spectrum
is generally recognized, its physical interpretation by different authors may vary significantly. Kitaigorodskii [
38] obtained this dependence within the dimensional analysis; however, he connected it with a relatively high-frequency range, where dissipation dominates. On the contrary, Toba [
58], Toba [
64] associated the
exponent with wave generation and determined the corresponding factor proportional to the friction velocity. In the classic work [
70], Phillips obtained the spectrum (
8) as a result of the balance between wind generation, wave dissipation, and nonlinear interactions. Under some additional assumptions the Phillips’ result is similar to Toba [
64]. The constancy of the Toba’s coefficient
corresponds to the constancy of wave steepness.
The angle brackets mean averaging over the selected frequency range.
The theory of wave turbulence [
71,
72] proposes an alternative treatment of the equilibrium range where the spectrum (
8) holds. The dominance of wave-wave interactions in this range provides a balance of fluxes rather than a static balance of all the constituents (wind input, wave dissipation, wave-wave interactions) for every frequency [
73,
74]. Two stationary solutions of the conservative kinetic equation (no sources, no sinks) that realise constant spectral fluxes form a basis of analytical results.
The so-called Kolmogorov-Zakharov direct cascade solution [
55]
realises the physical idea of Kolmogorov developed for the strong hydrodynamical turbulence [
75]: the energy coming to a frequency from large scale motions is compensated by the energy leakage to smaller scales. The Kolmogorov-Zakharov constant
can be obtained analytically [
76]. The exponent
of the constant energy flux
P comes from the power of nonlinearity in the kinetic equation (
1).
For deep water waves, there is another, inverse, cascade solution [
56,
77,
78]
with constant flux
Q of wave action and the corresponding Kolmogorov-Zakharov constant
and the exponent
. The wave action transfers from short to long waves according to (
11). Sometimes it is treated as a mechanism of wave spectra downshifting. Such a treatment is not correct: the corresponding flux of energy is plain zero in this case. The energy flux to longer waves occurs when the spectra exponent is less than
[e.g. [
79].
The direct cascade solution (
10) gives a new vision of the experimentally-based dependence (
8): the linear dependence of the pre-exponent on wind speed looks like an approximation of the physically essential quantity of energy flux
P. With the approximation relations (
8,
10) can be used for solving a sort of inverse problem of retrieval characteristics of wind-wave coupling from wave spectral parameters.
3. Results
Data presented in the above section have their specific advantages and shortcomings. The goal of our work is to construct a consistent scheme of wind-wave coupling in the study area based on existing concepts of sea wave dynamics.
One can specify two general approaches. We regard the similarity approach based on the wind speed scaling as a conventional one. An advantage of the approach is its transparent physical meaning: wind speed can be measured (e.g. the Anapa weather station) or derived from a numerical model.
An alternative approach of wave turbulence refers to spectral fluxes which direct estimates are not straightforward and require accurate interpretation of spectral distributions. General description precedes the physical analysis within the two concepts mentioned above.
3.1. Utrish buoy time series for near-shore wave dynamics
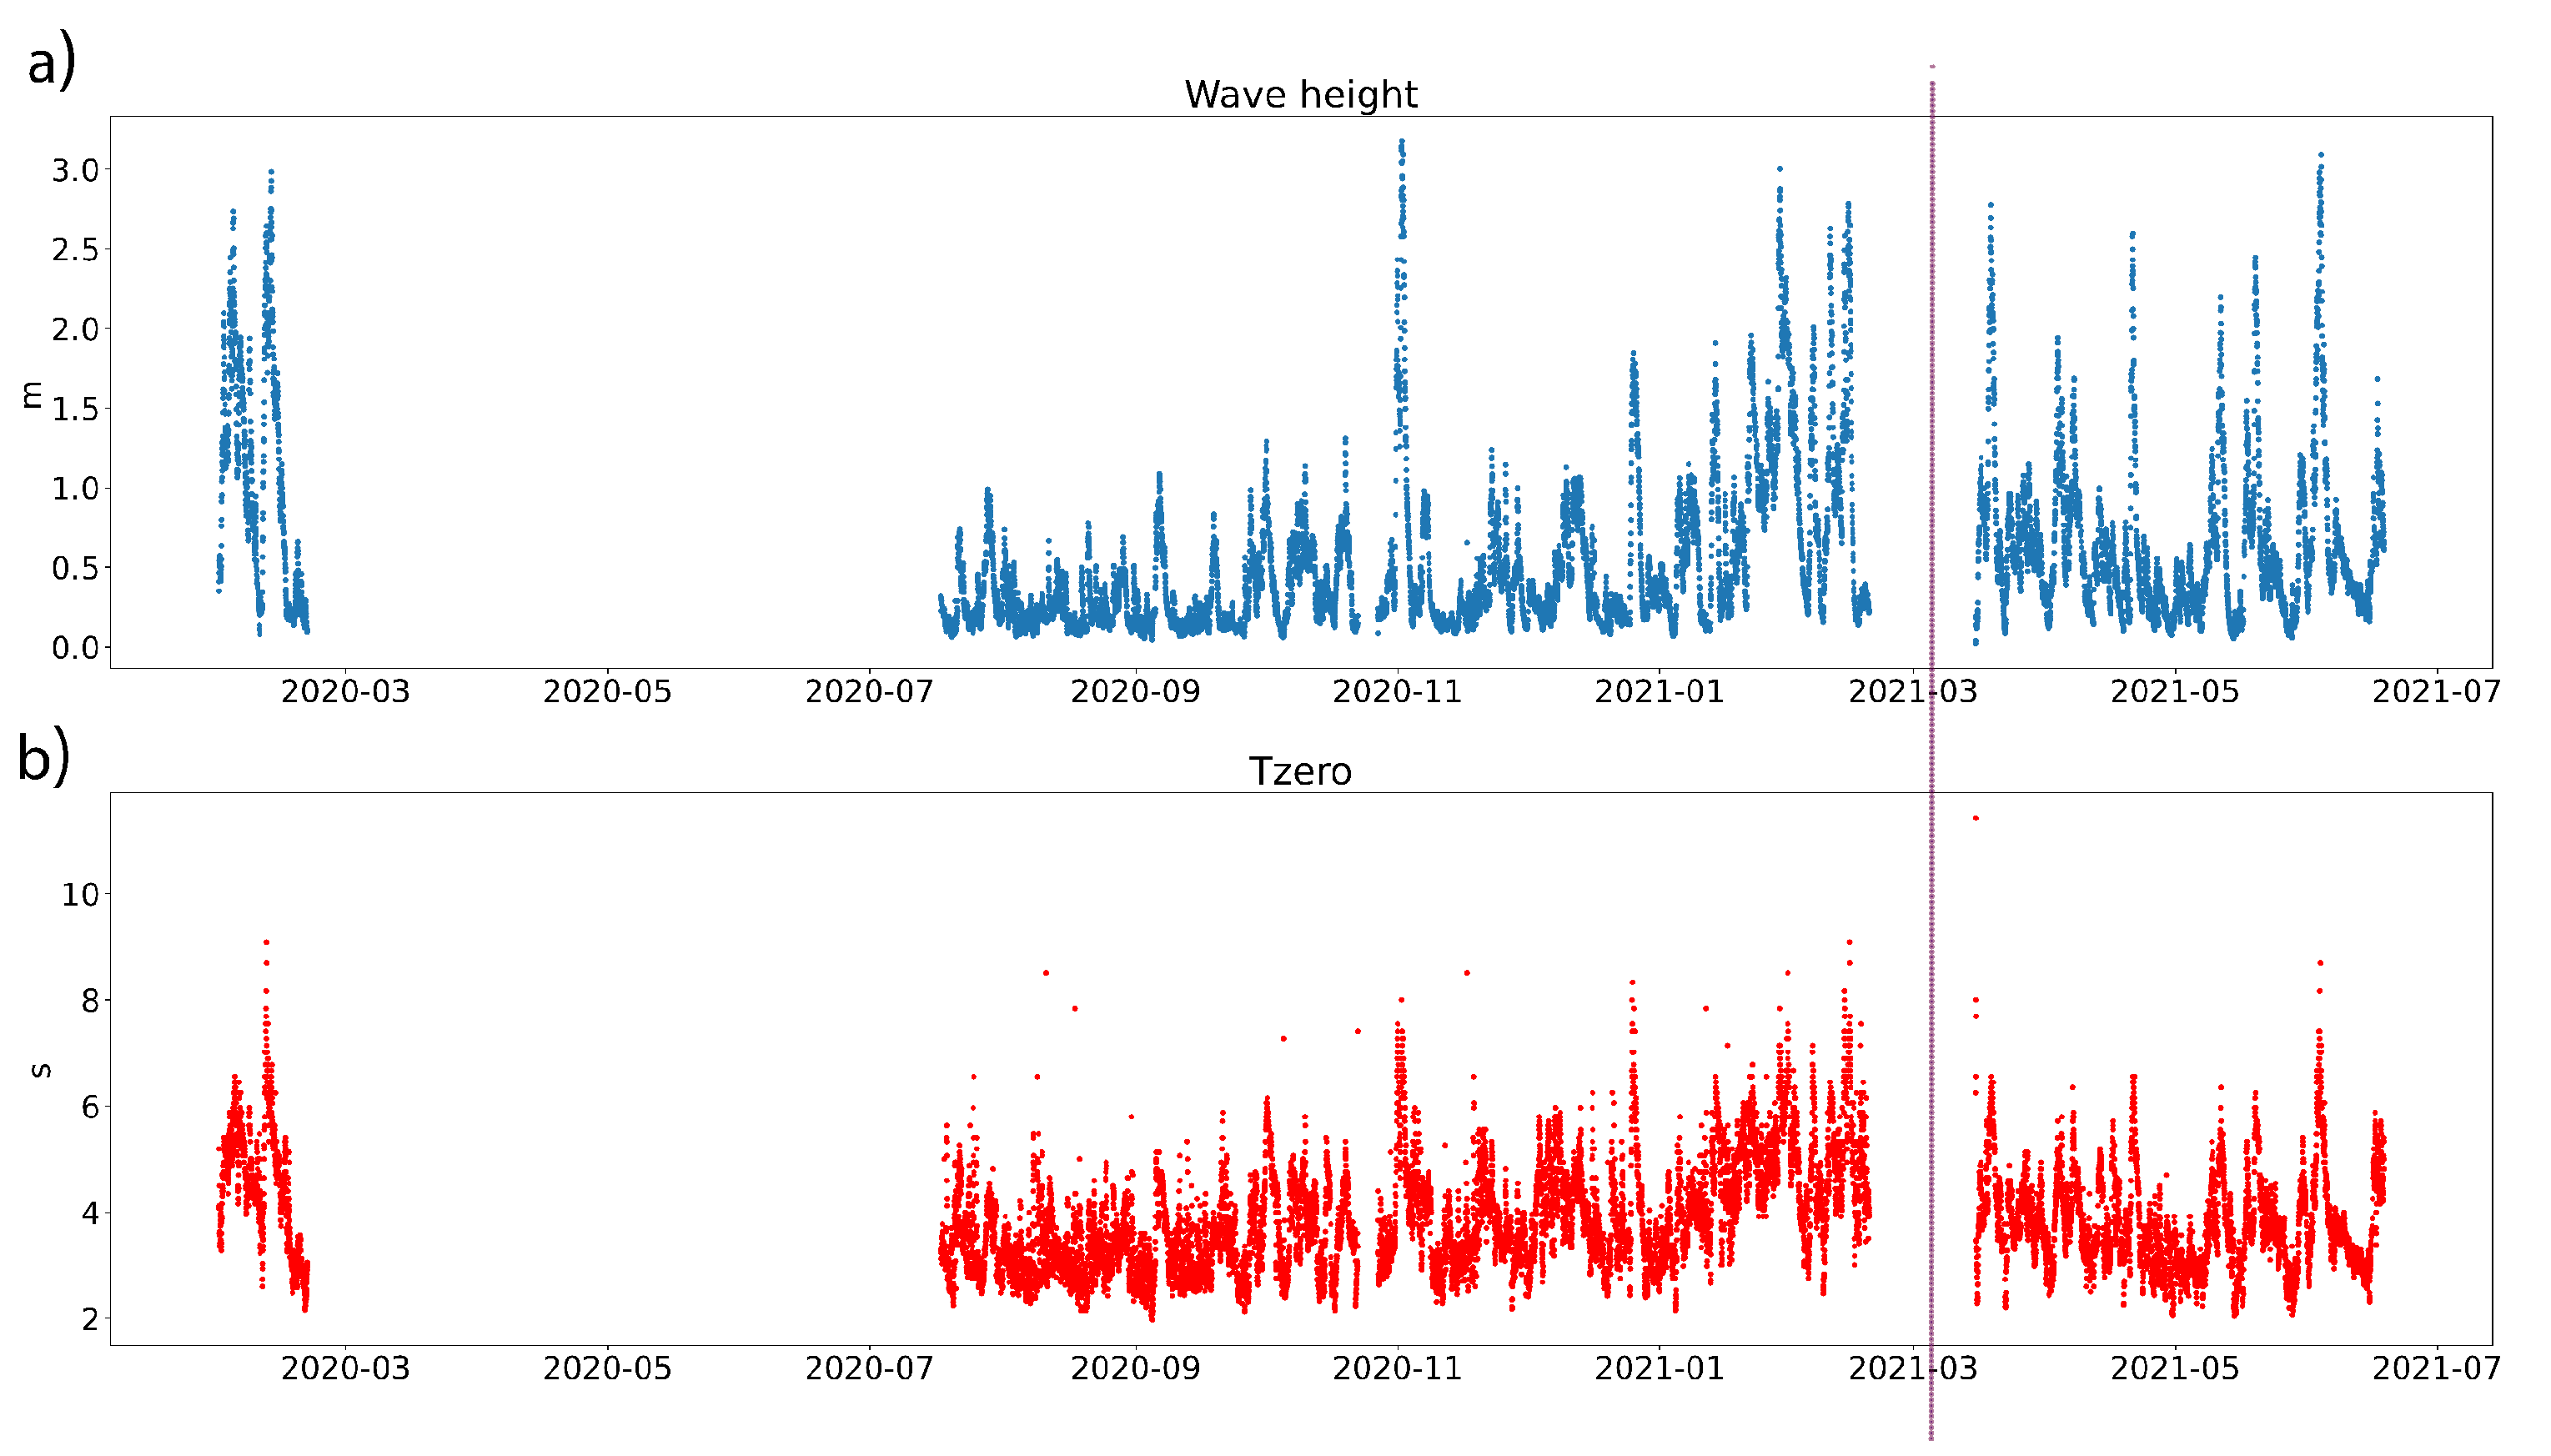
Wave heights and periods measured by the buoy for the full experimental period are shown in
Figure 2. Waves less than
m height dominate: they make more than 60%. Waves higher than
m account for less than
. The maximum wave height of 3.18 m was recorded on November 2, 2020. Zero-crossing periods
s predominate which is consistent with earlier measurements in this area. A deeper comparison of inter-annual and seasonal wave statistics with the buoy data is meaningless because of the buoy relocation (stages I and II) and the lack of data for March-July 2020.
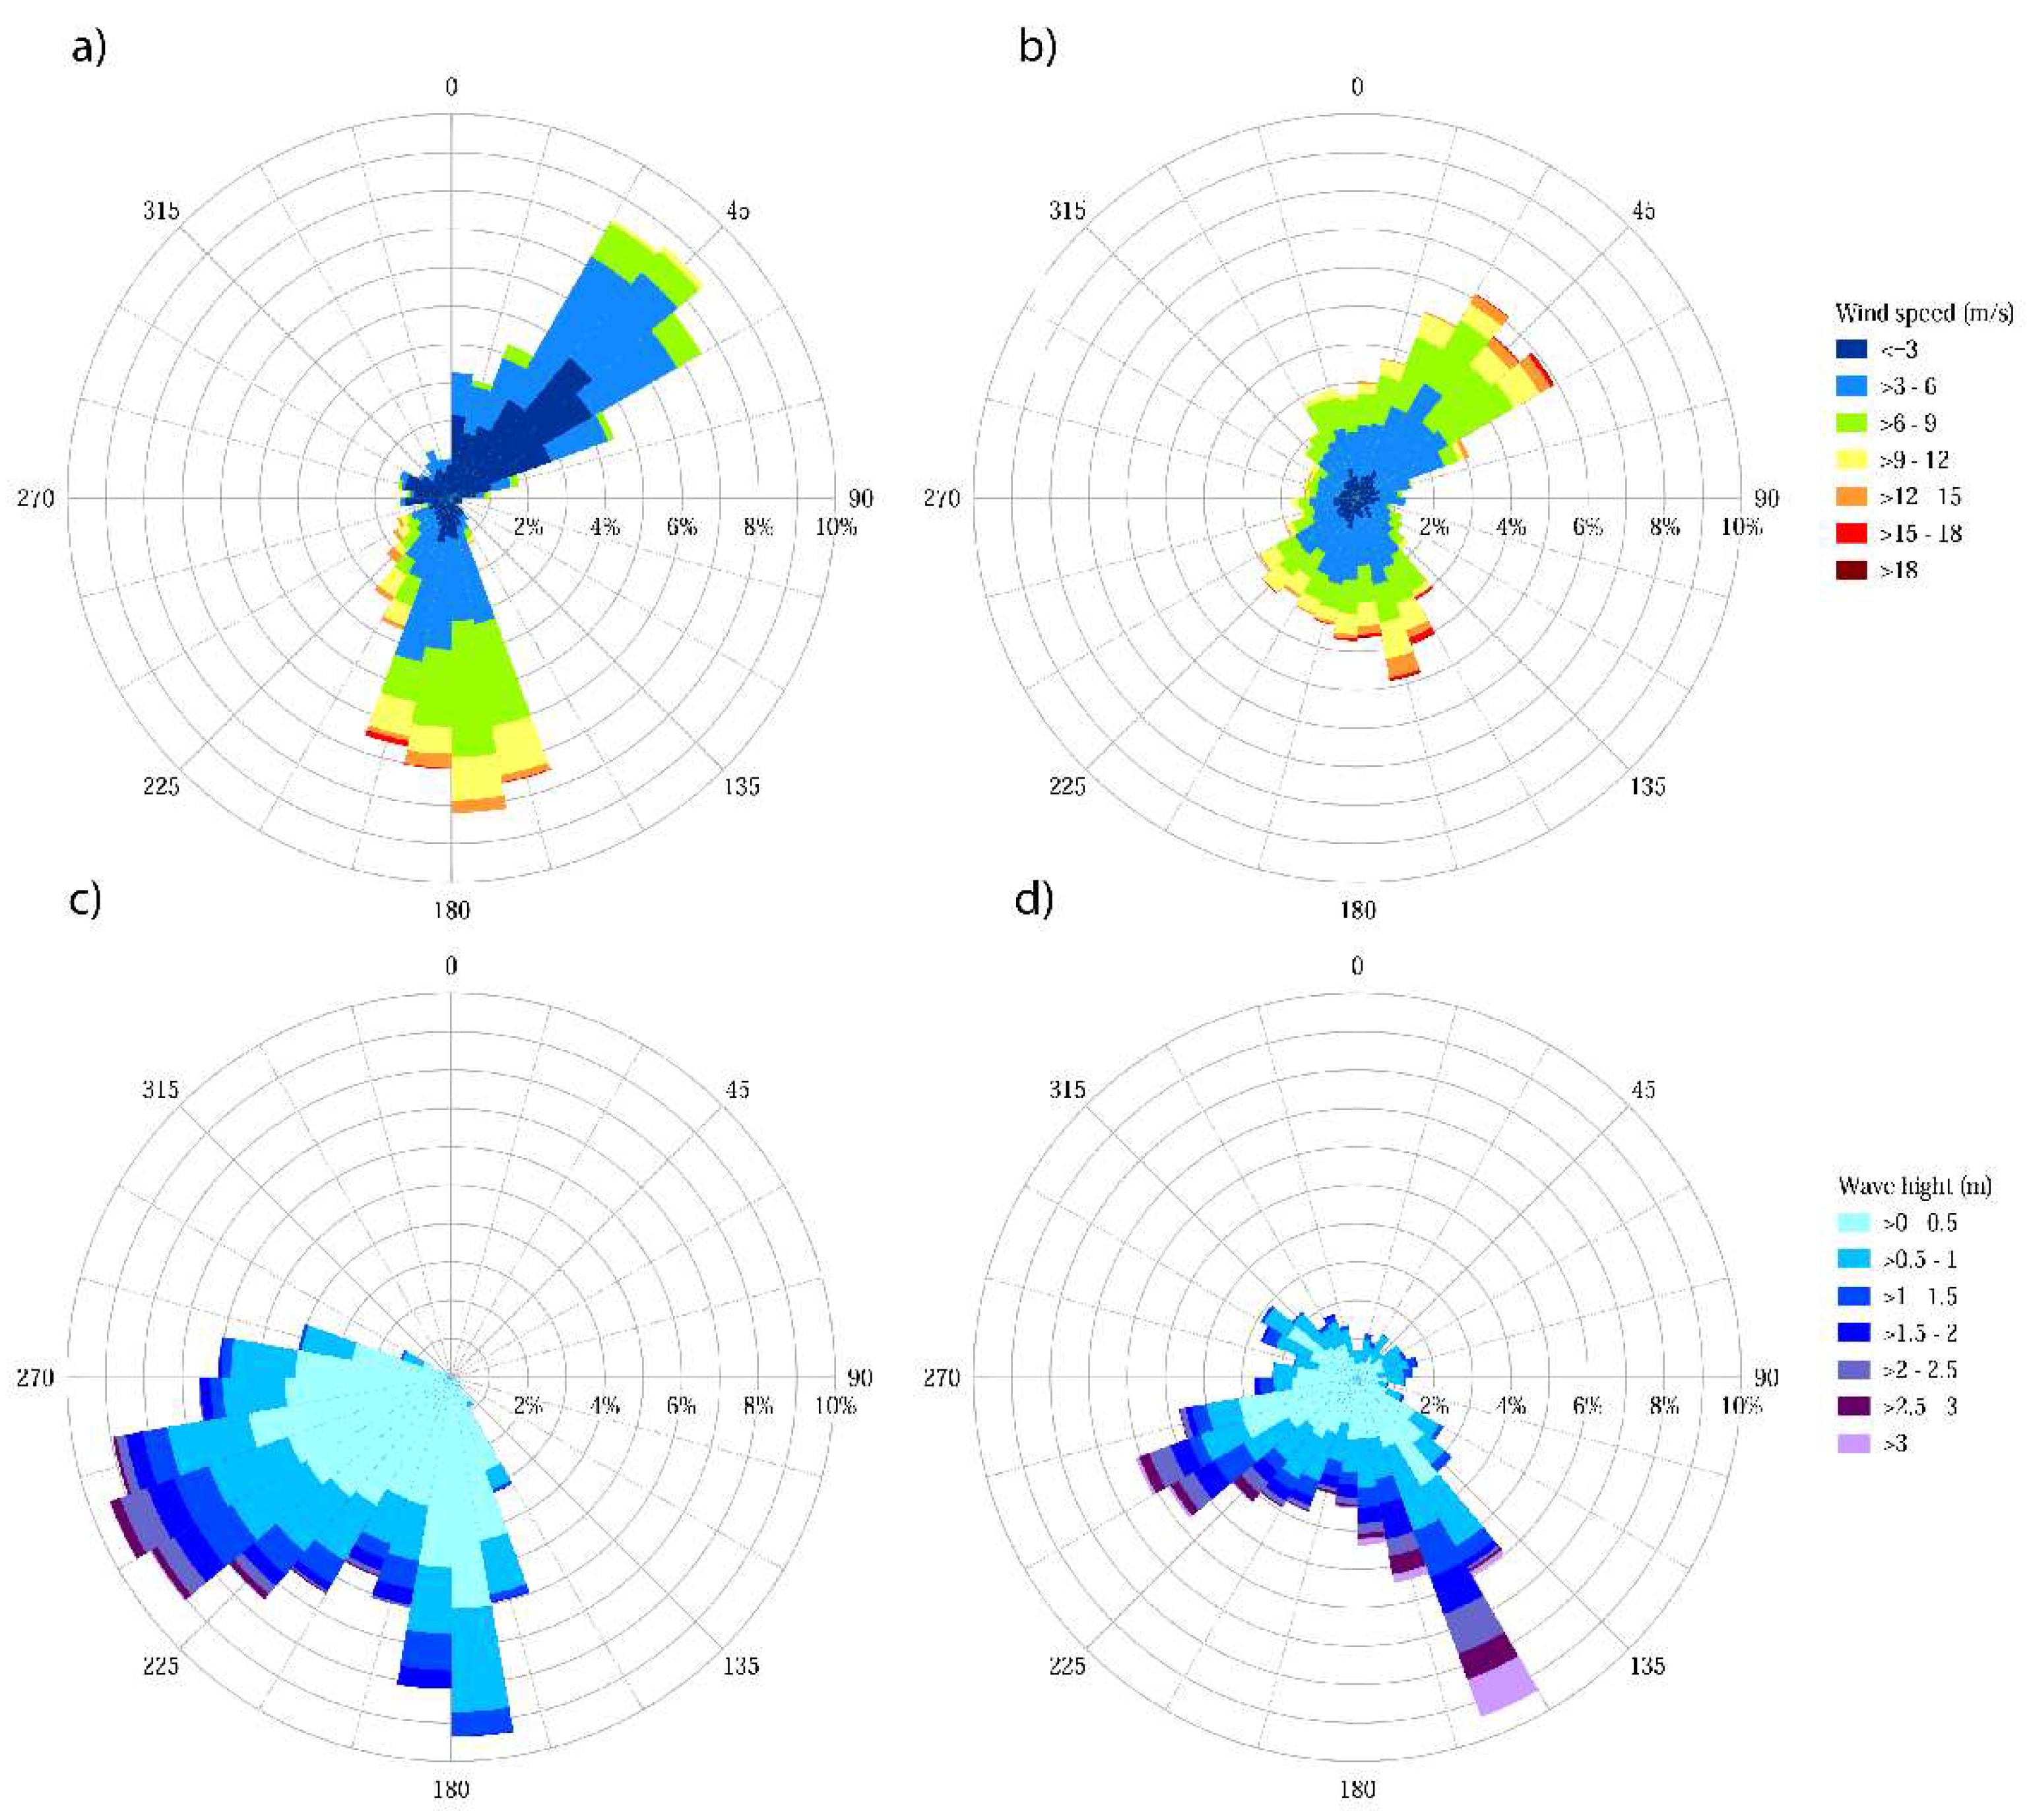
Wind and wave directions measured and calculated at different sites (Anapa, reanalysis, and buoy (see
Figure 1) are shown in
Figure 3.
The wind directions at Anapa station (
Figure 3a) were concentrated in two narrow sectors. The northeast (from the shore) winds had the highest frequency, but their speeds were low, mainly up to 6 m/s with extremes of 9-12 m/s. Less frequent southern winds were stronger and sometimes exceeded 15 m/s. This is a typical annual pattern for winds at the Anapa station [
18].
The probability distributions of wind speed and direction in the reanalysis point are shown in
Figure 3b for January 2020 - June 2021. These distributions are more smooth as compared to the ones in the Anapa station. Nevertheless, two general directions prevail:
(i) , i.e., from the coast, and
(ii), i.e., southern winds. Generally, wind speeds are up to 10 m/s, but sometimes can exceed 18 m/s.
Figure 3c shows buoy wave height and mean-over-spectrum defined as follows
The lower integration limit filters out wavelengths of more than 180 m, which are rare in the Black Sea. The high-frequency cutoff
Hz (about 6 m) partially solves the problem of poor measurements of short waves by the buoy of the size
m. Waves came from the sea (
). The off-shore sector was not even visible in the diagram. Southwest waves were on average higher than waves from other directions while the southern waves were more frequent.
Finally,
Figure 3d shows the wave direction from the reanalysis. There were very few cases of offshore waves. The southeastern waves were the most frequent and highest.
It is noticeable that Anapa wind directions and reanalysis wind directions do not coincide exactly but they have some patterns in common. The same is true for waves: directions from reanalysis and buoy measurements show similarities in general directions. However, the main wind and wave directions differ significantly. The same was marked in references [e.g. [
18]; the difference may indicate mixed sea.
3.1.1. Directionality of wind and waves as a key feature of wave dynamics
The above
Figure 3 shows visible differences in patterns of wind speed and wave height probability. Partially, this inconsistency could be related to experimental uncertainties due to the mismatch of wind and wave measurements. Another essential part of these differences should be carefully analyzed and associated with certain physical mechanisms of wind-wave coupling and wave transformation in the near-shore.
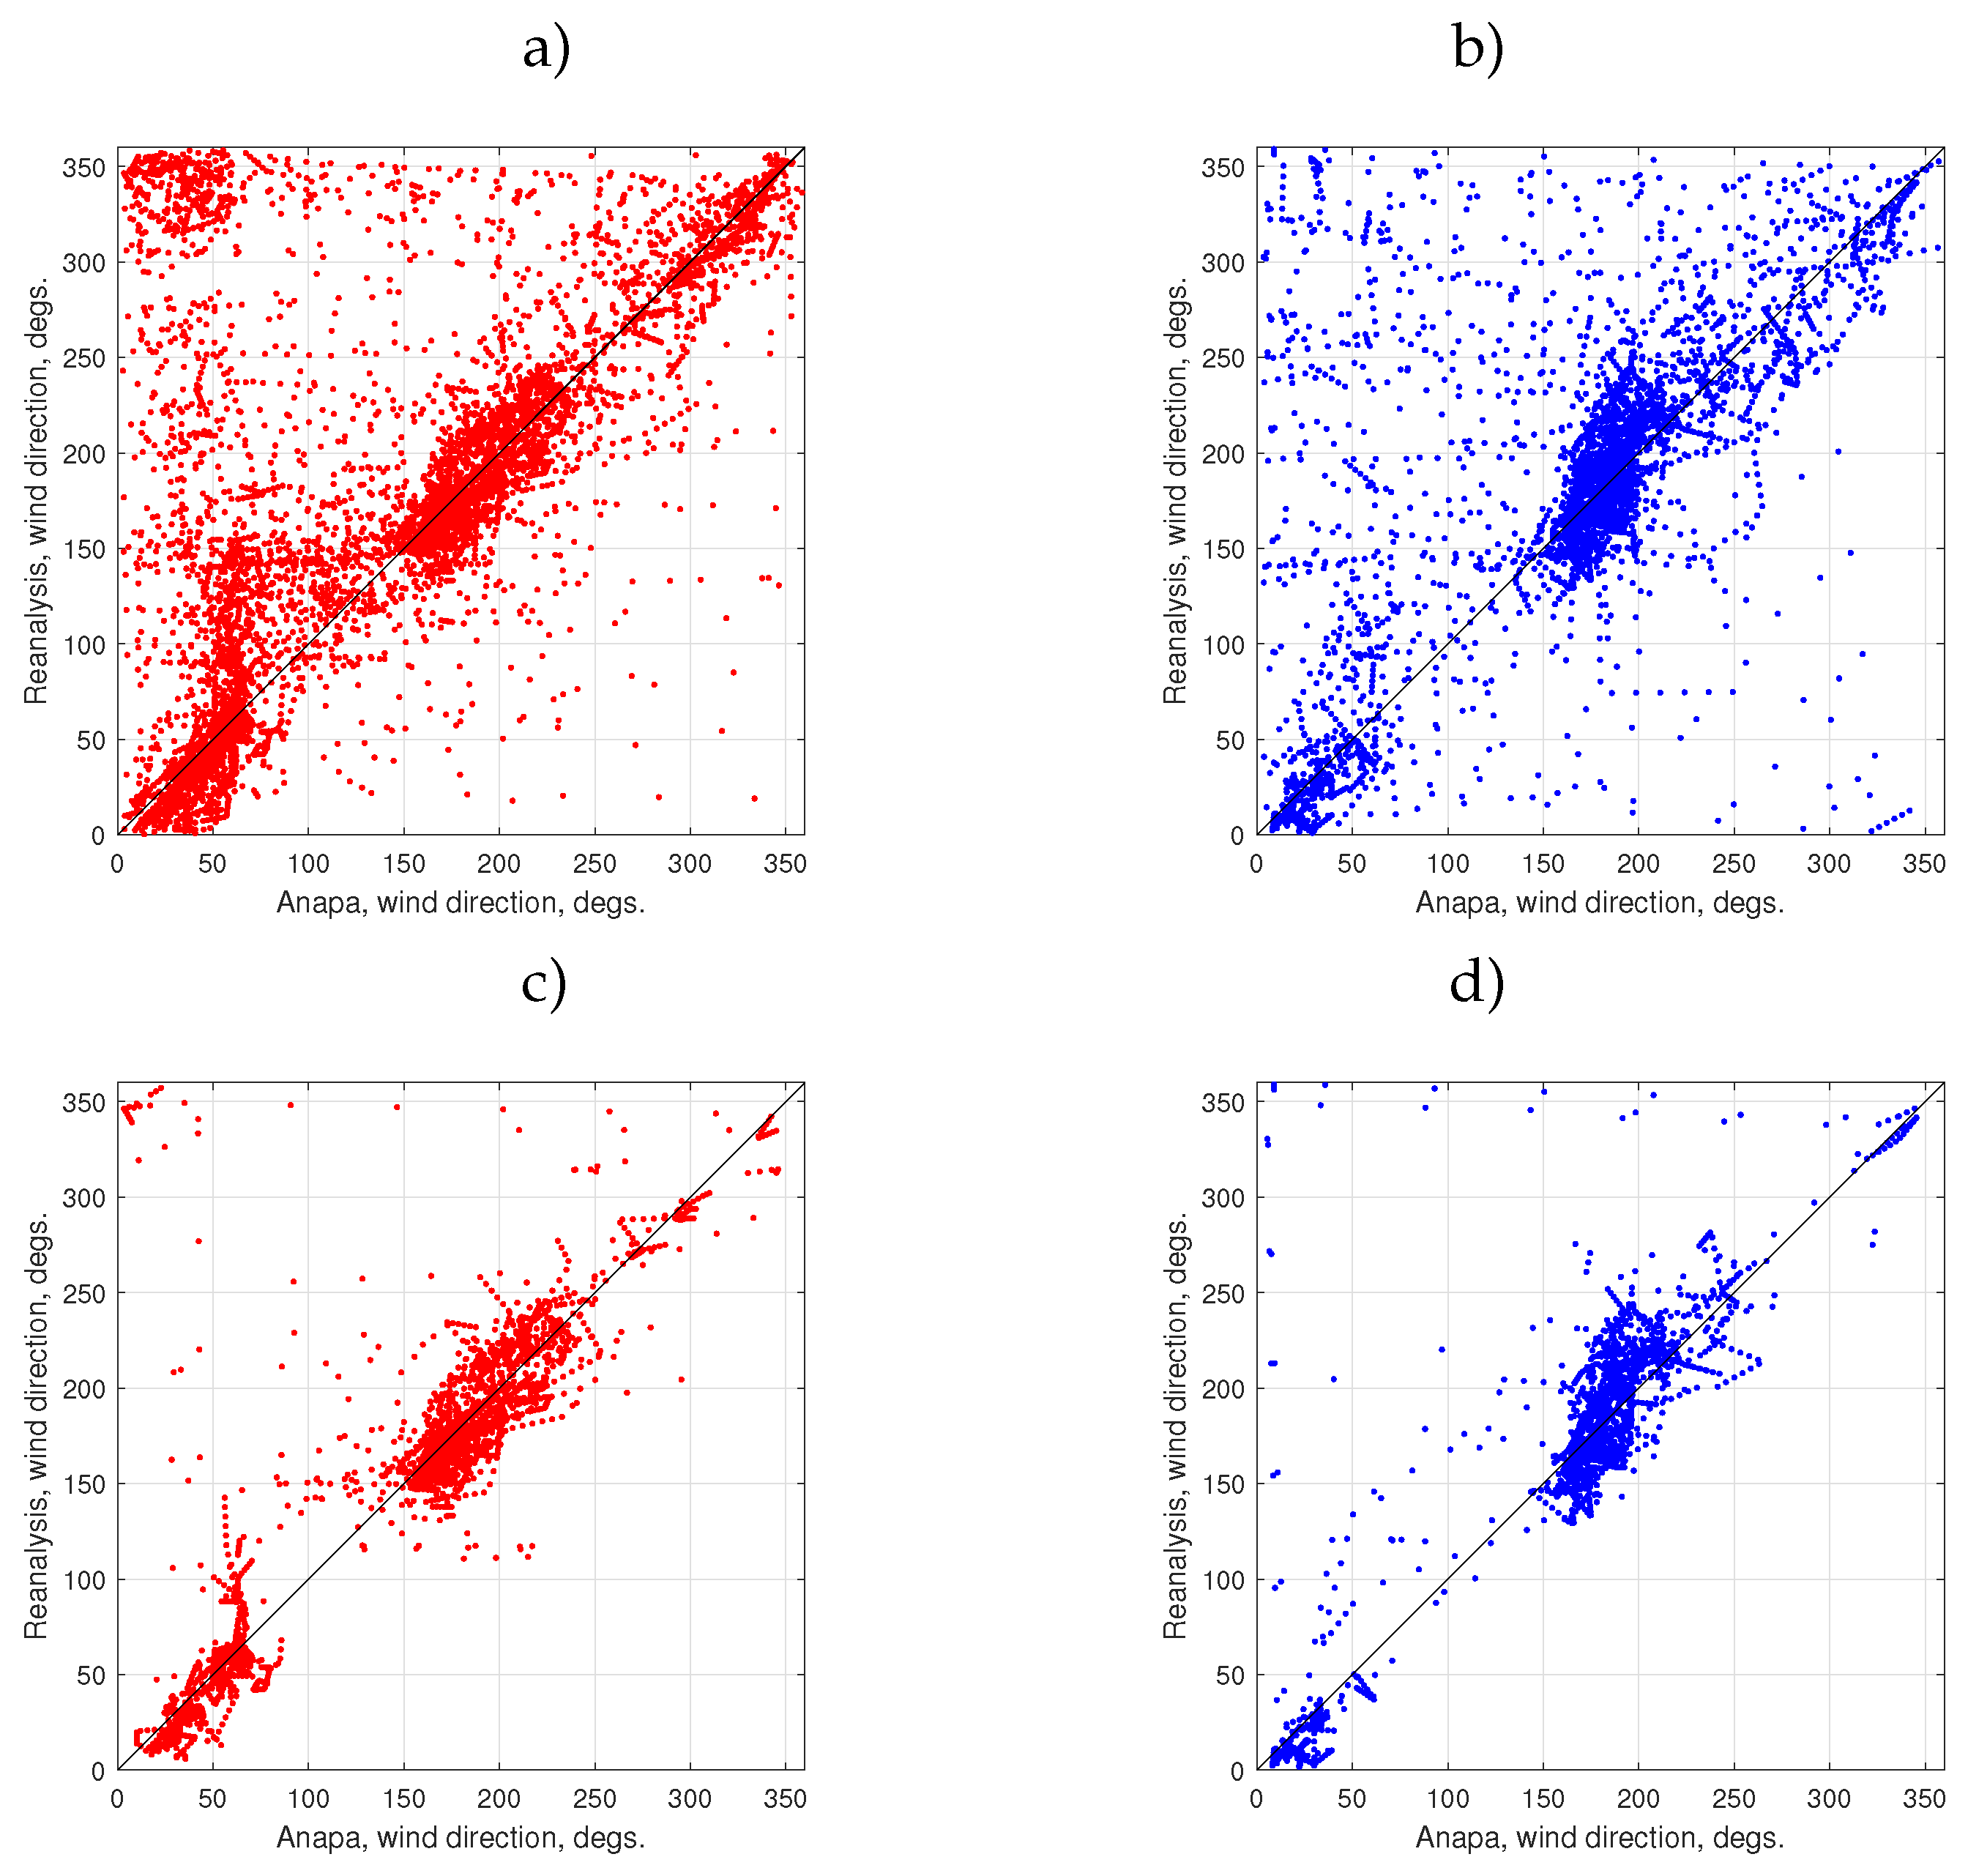
Figure 4 compares wind directions from the Anapa weather station and the reanalysis data for two experimental stages. Two datasets show high correspondence in the whole range of angles. The gap at
corresponds to the direction from the coast. This gap becomes “cleaner” when setting a lower threshold for wind speed
m/s (see
Figure 4c,d. Unexpectedly, the shadow from the near-shore relief appears deeper for stronger winds. The airflow over the coast is smoother for milder winds and intrudes into the sea for longer distances. Another explanation of the effect of on-shore and off-shore weak winds is the presence of daily sea breezes [
43].
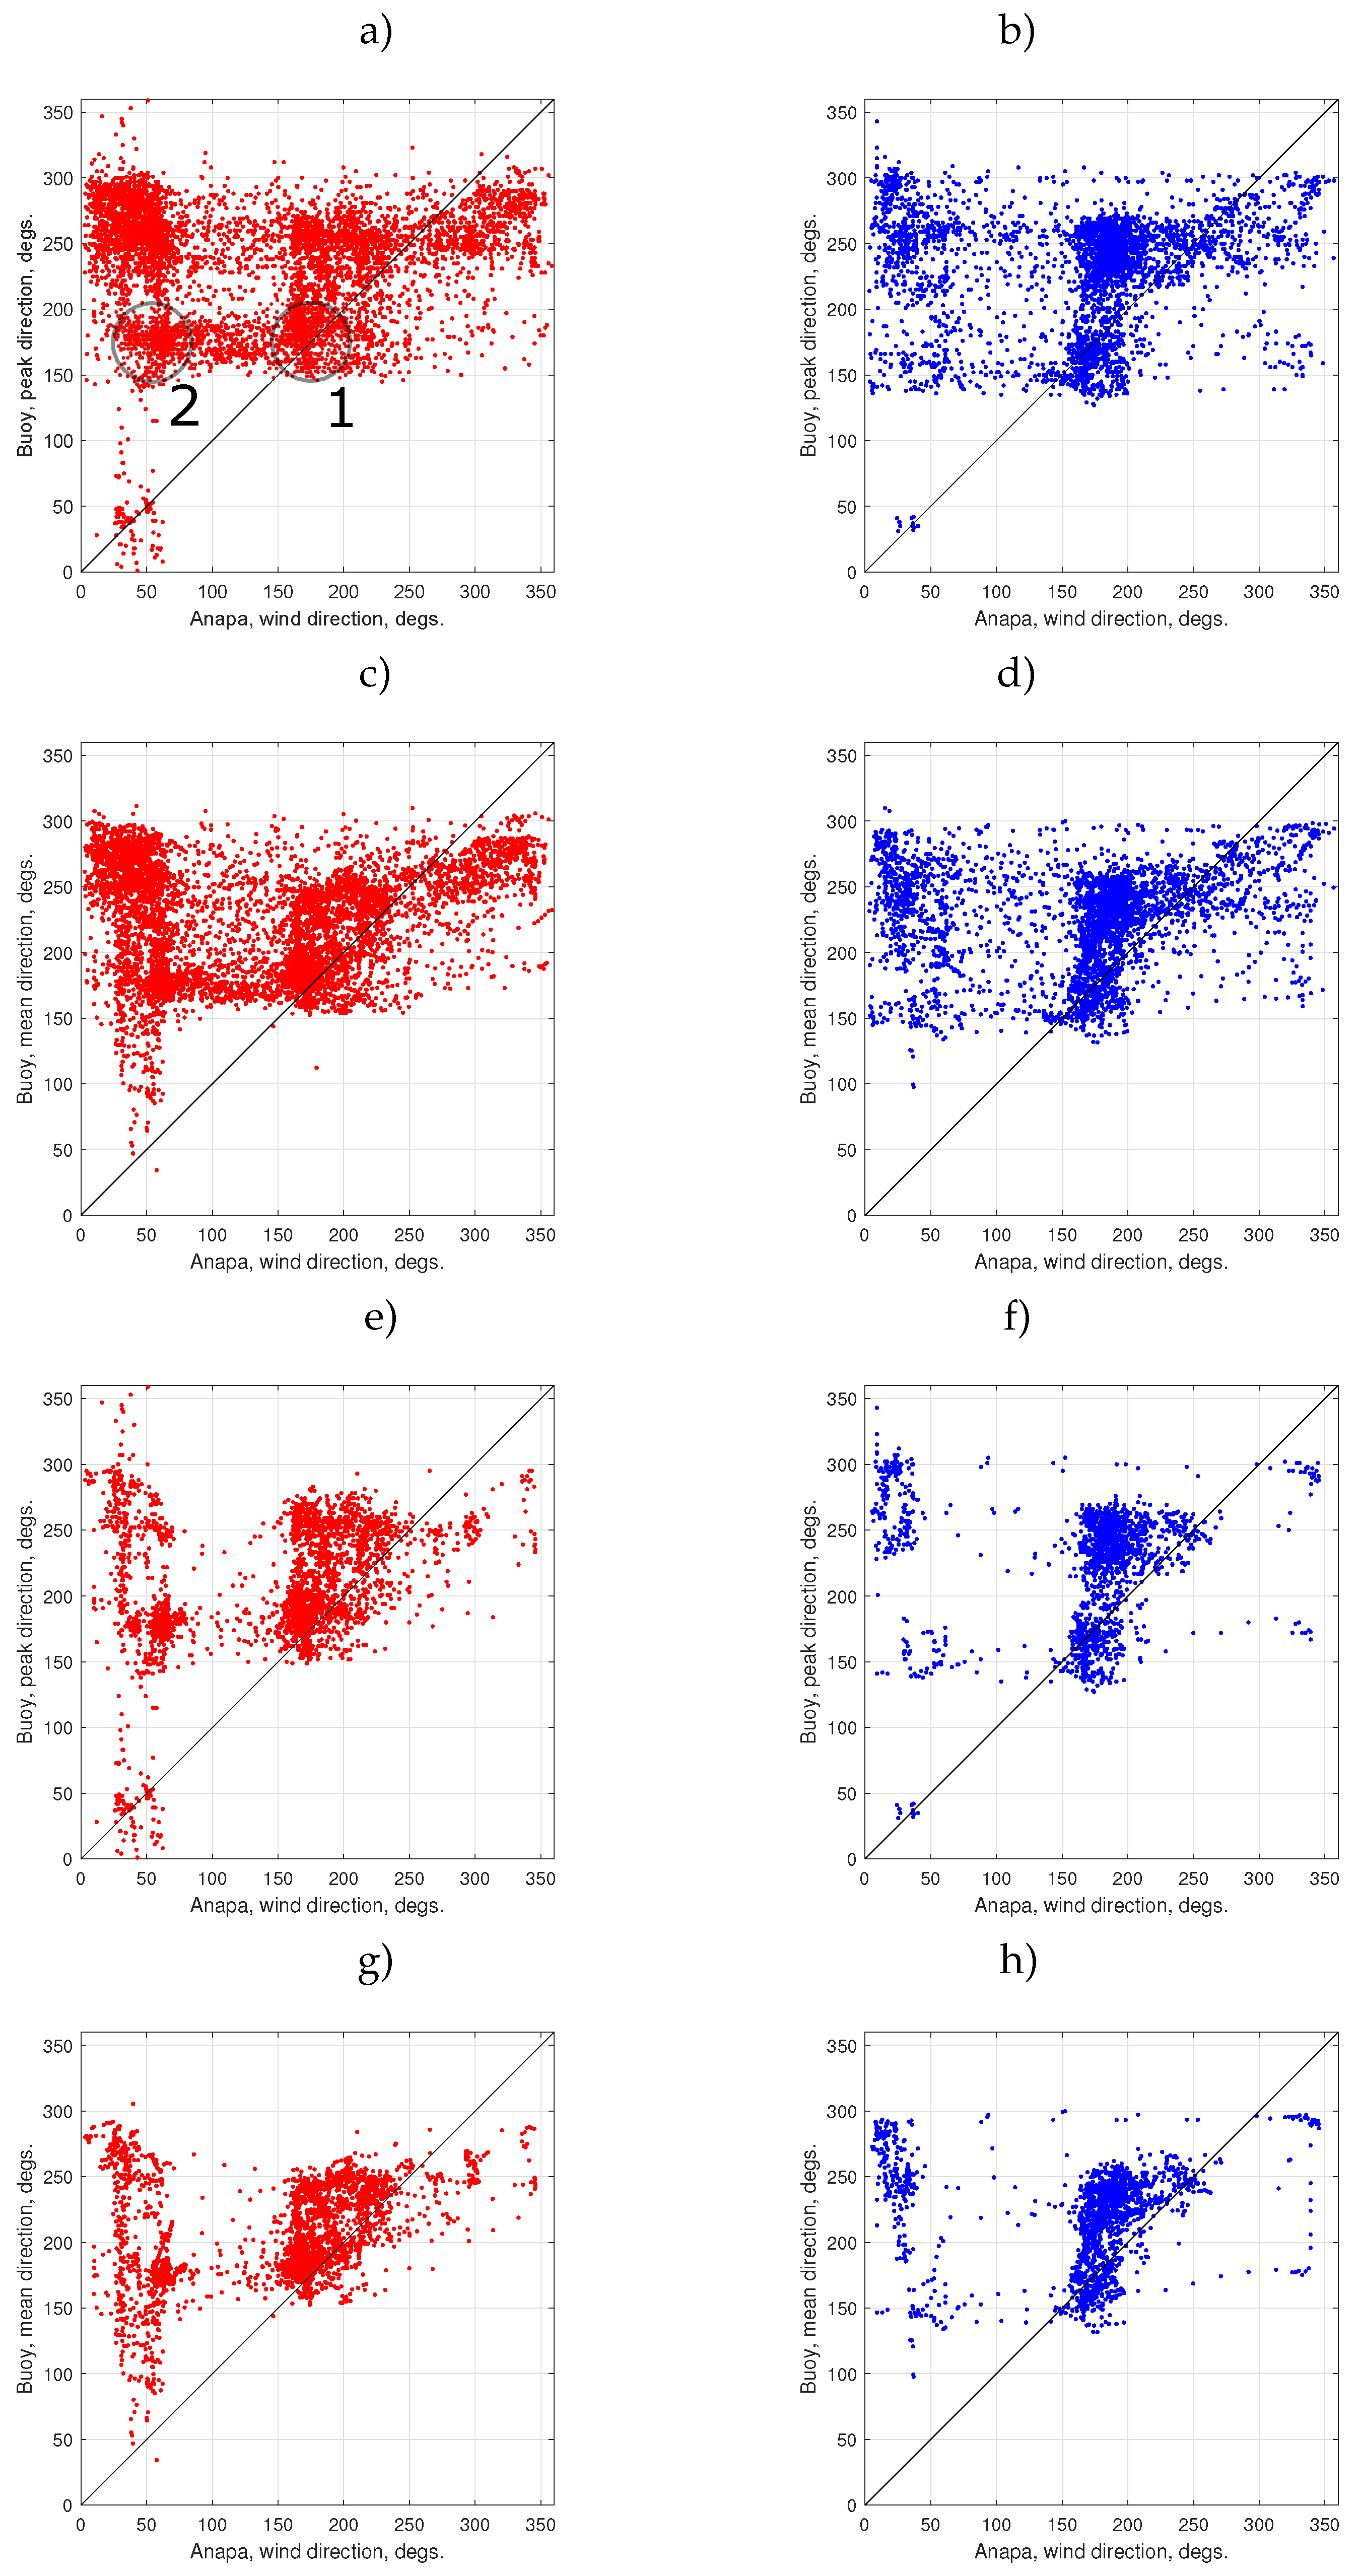
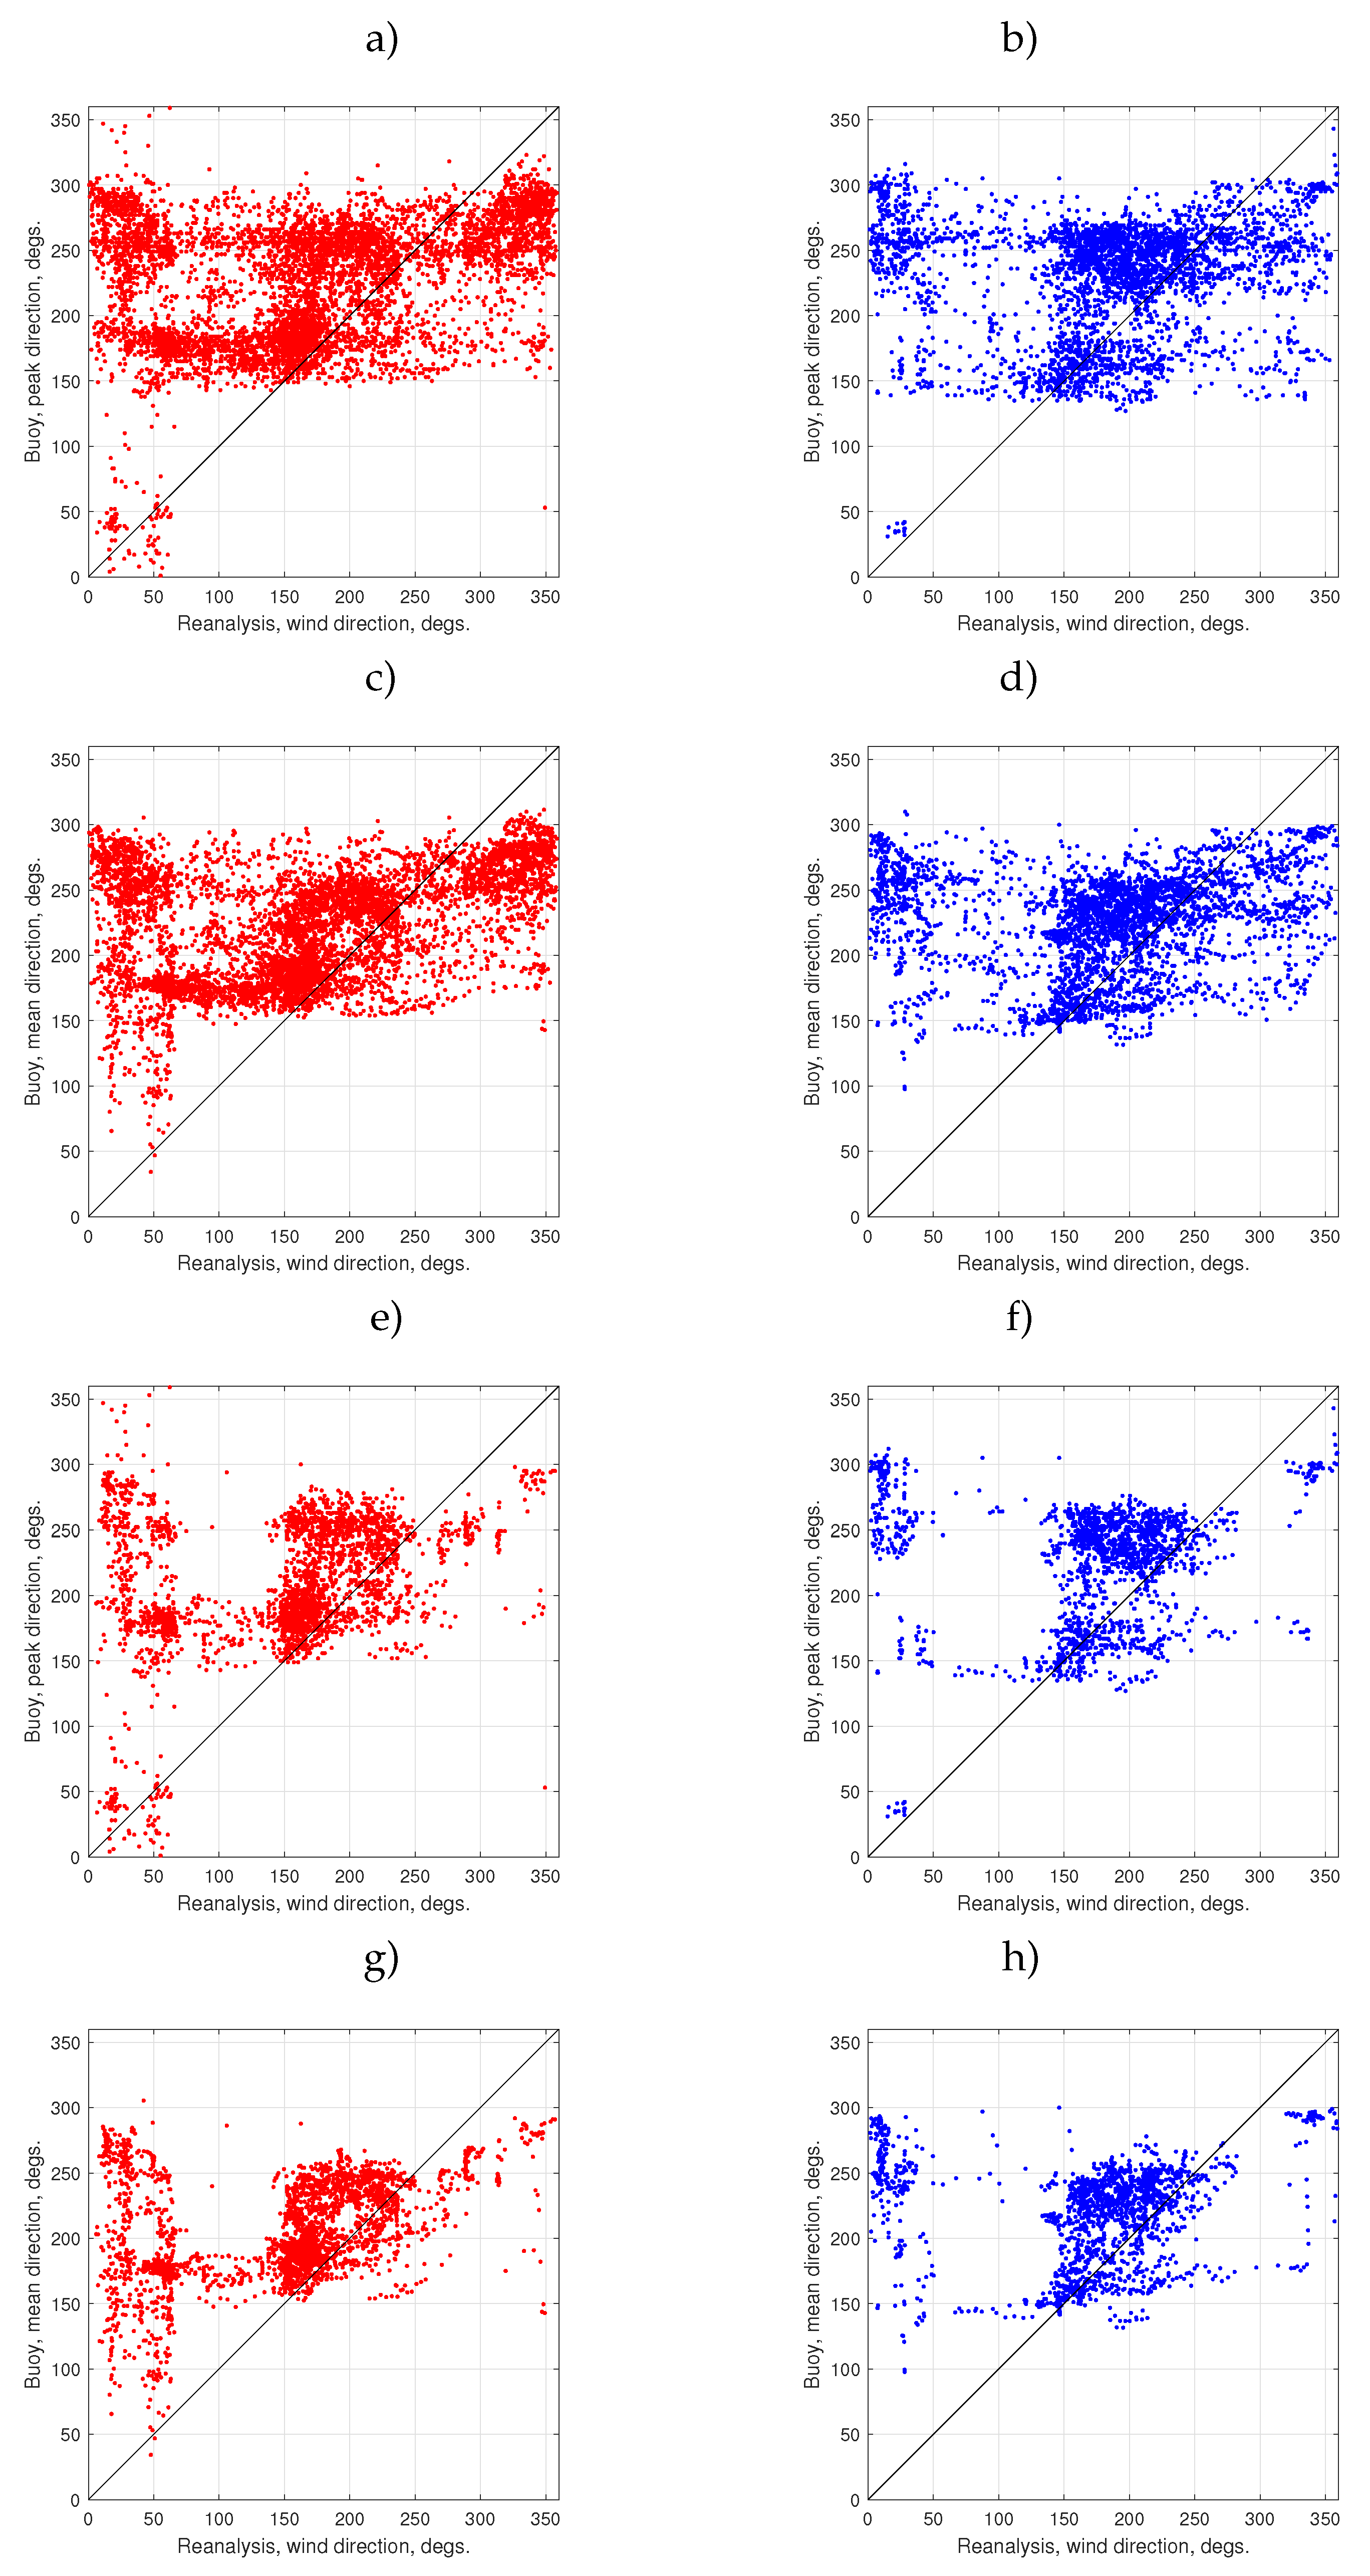
Wave directions measured by the buoy and wind directions are essentially different (
Figure 5 and
Figure 6). Waves propagating from the coast are almost absent both for spectral peak (panels
a,b,e,f) and mean-over-spectrum (panels
c,d,g,h) directions. While two main clusters are strongly localized near the dominant winds (north-eastern and southern) the distributions of wave directions are essentially wider. Additionally, buoy data show a secondary clustering with a “valley” near
, especially for peak directions. Clustering for the Anapa station winds in
Figure 5 is more pronounced than one for reanalysis in
Figure 6.
The wind and wave directions mismatch in
Figure 5 and
Figure 6 can be interpreted as merging different wave systems [
80,
81]. Rapid switching between two dominating wind directions leads to the occurrence of a mixed sea state in the area. The scatterplots in
Figure 5 and
Figure 6 clearly show this switching as a mirroring of the southern wind direction cluster with stronger winds (circle 1 in
Figure 5a) to the northeastern direction of waves (circle 1 in
Figure 5a). As a result, the former wind-generated along-wind waves become swell co-existing with the new-born wind-driven waves of the north-eastern direction. Such a scheme can explain the deviation of the resulting wave directions to the right relative to the instant wind.
We should draw attention to the effect of wind speed. Panels e,f,g,h in
Figure 5 and
Figure 6 show the same scatter plots for winds higher than 4 m/s. One can see the same effect of “wiping out” of directions from the coast as in
Figure 4: a gap in the range
becomes free of waves which are mostly associated with the sea breeze.
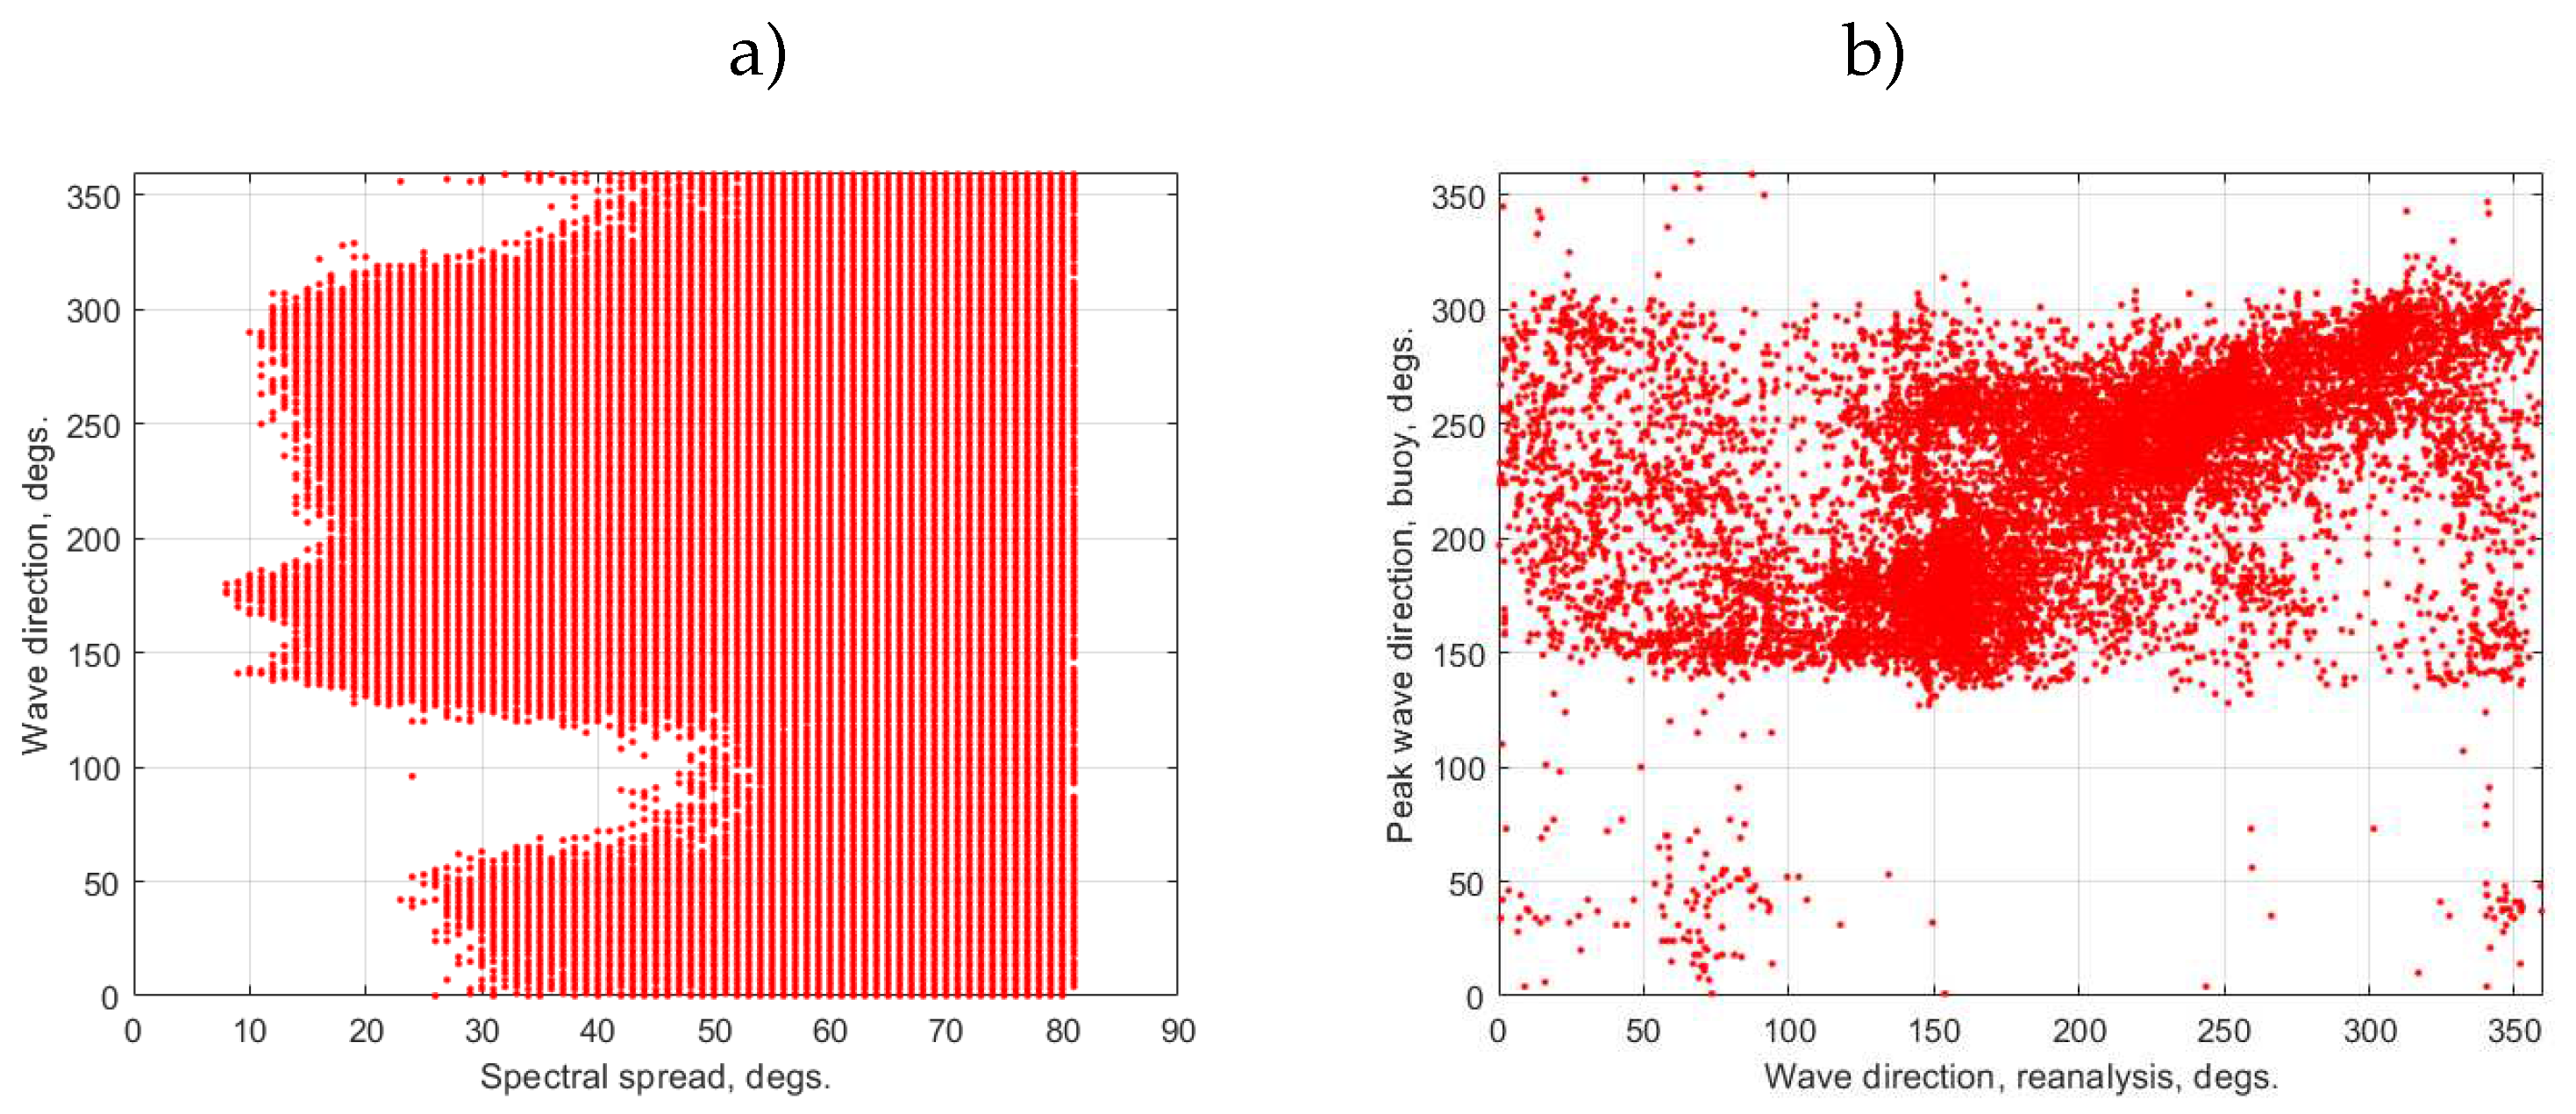
The occurrence of the mixed sea can be indirectly confirmed by analysis of the spectral width of the wave spectra. In our study, the spectral spread provided by buoy data and the results of the Wavewatch III simulations has been used.
Buoy data provides directional spread and direction as a function of frequency.
Figure 7 shows the wave direction vs spread for the range
Hz. Spectra are significantly wider in the “gap”, i.e. for the coast-shadowed directions where we suspect pronounced breeze. One more piece of evidence of the mixed sea state can be likely found when comparing wave directions measured by the buoy and calculated at the point of reanalysis. The pattern in
Figure 7b differs from one of the buoy-to-wind (
Figure 5 and
Figure 6). The “gap” of the coast shadow in the reanalysis wave direction is less pronounced relative to the buoy but is visibly deeper than for the wind (
Figure 5 and
Figure 6). Beyond the coast shadow (
) the directions of the buoy and reanalysis are close to each other but differ, sometimes, significantly from the reanalysis wind direction. The pronounced clustering of wind directions near two dominant directions in
Figure 5 and
Figure 6 is absent for wave directions. The seaward swell starts to play an important role and determine the directionality of wave fields. One can hypothesize that the seaward swell can effectively absorb the wind-driven waves as described, e.g. in [
90,
91]. The results of the reanalysis are counter-intuitive, in a sense: at a relatively far distance from the coast wave field clearly shows features of the mixed sea similar to those in the near-shore.
3.2. Conventional analysis. Wind speed, wave heights and periods as essential physical parameters
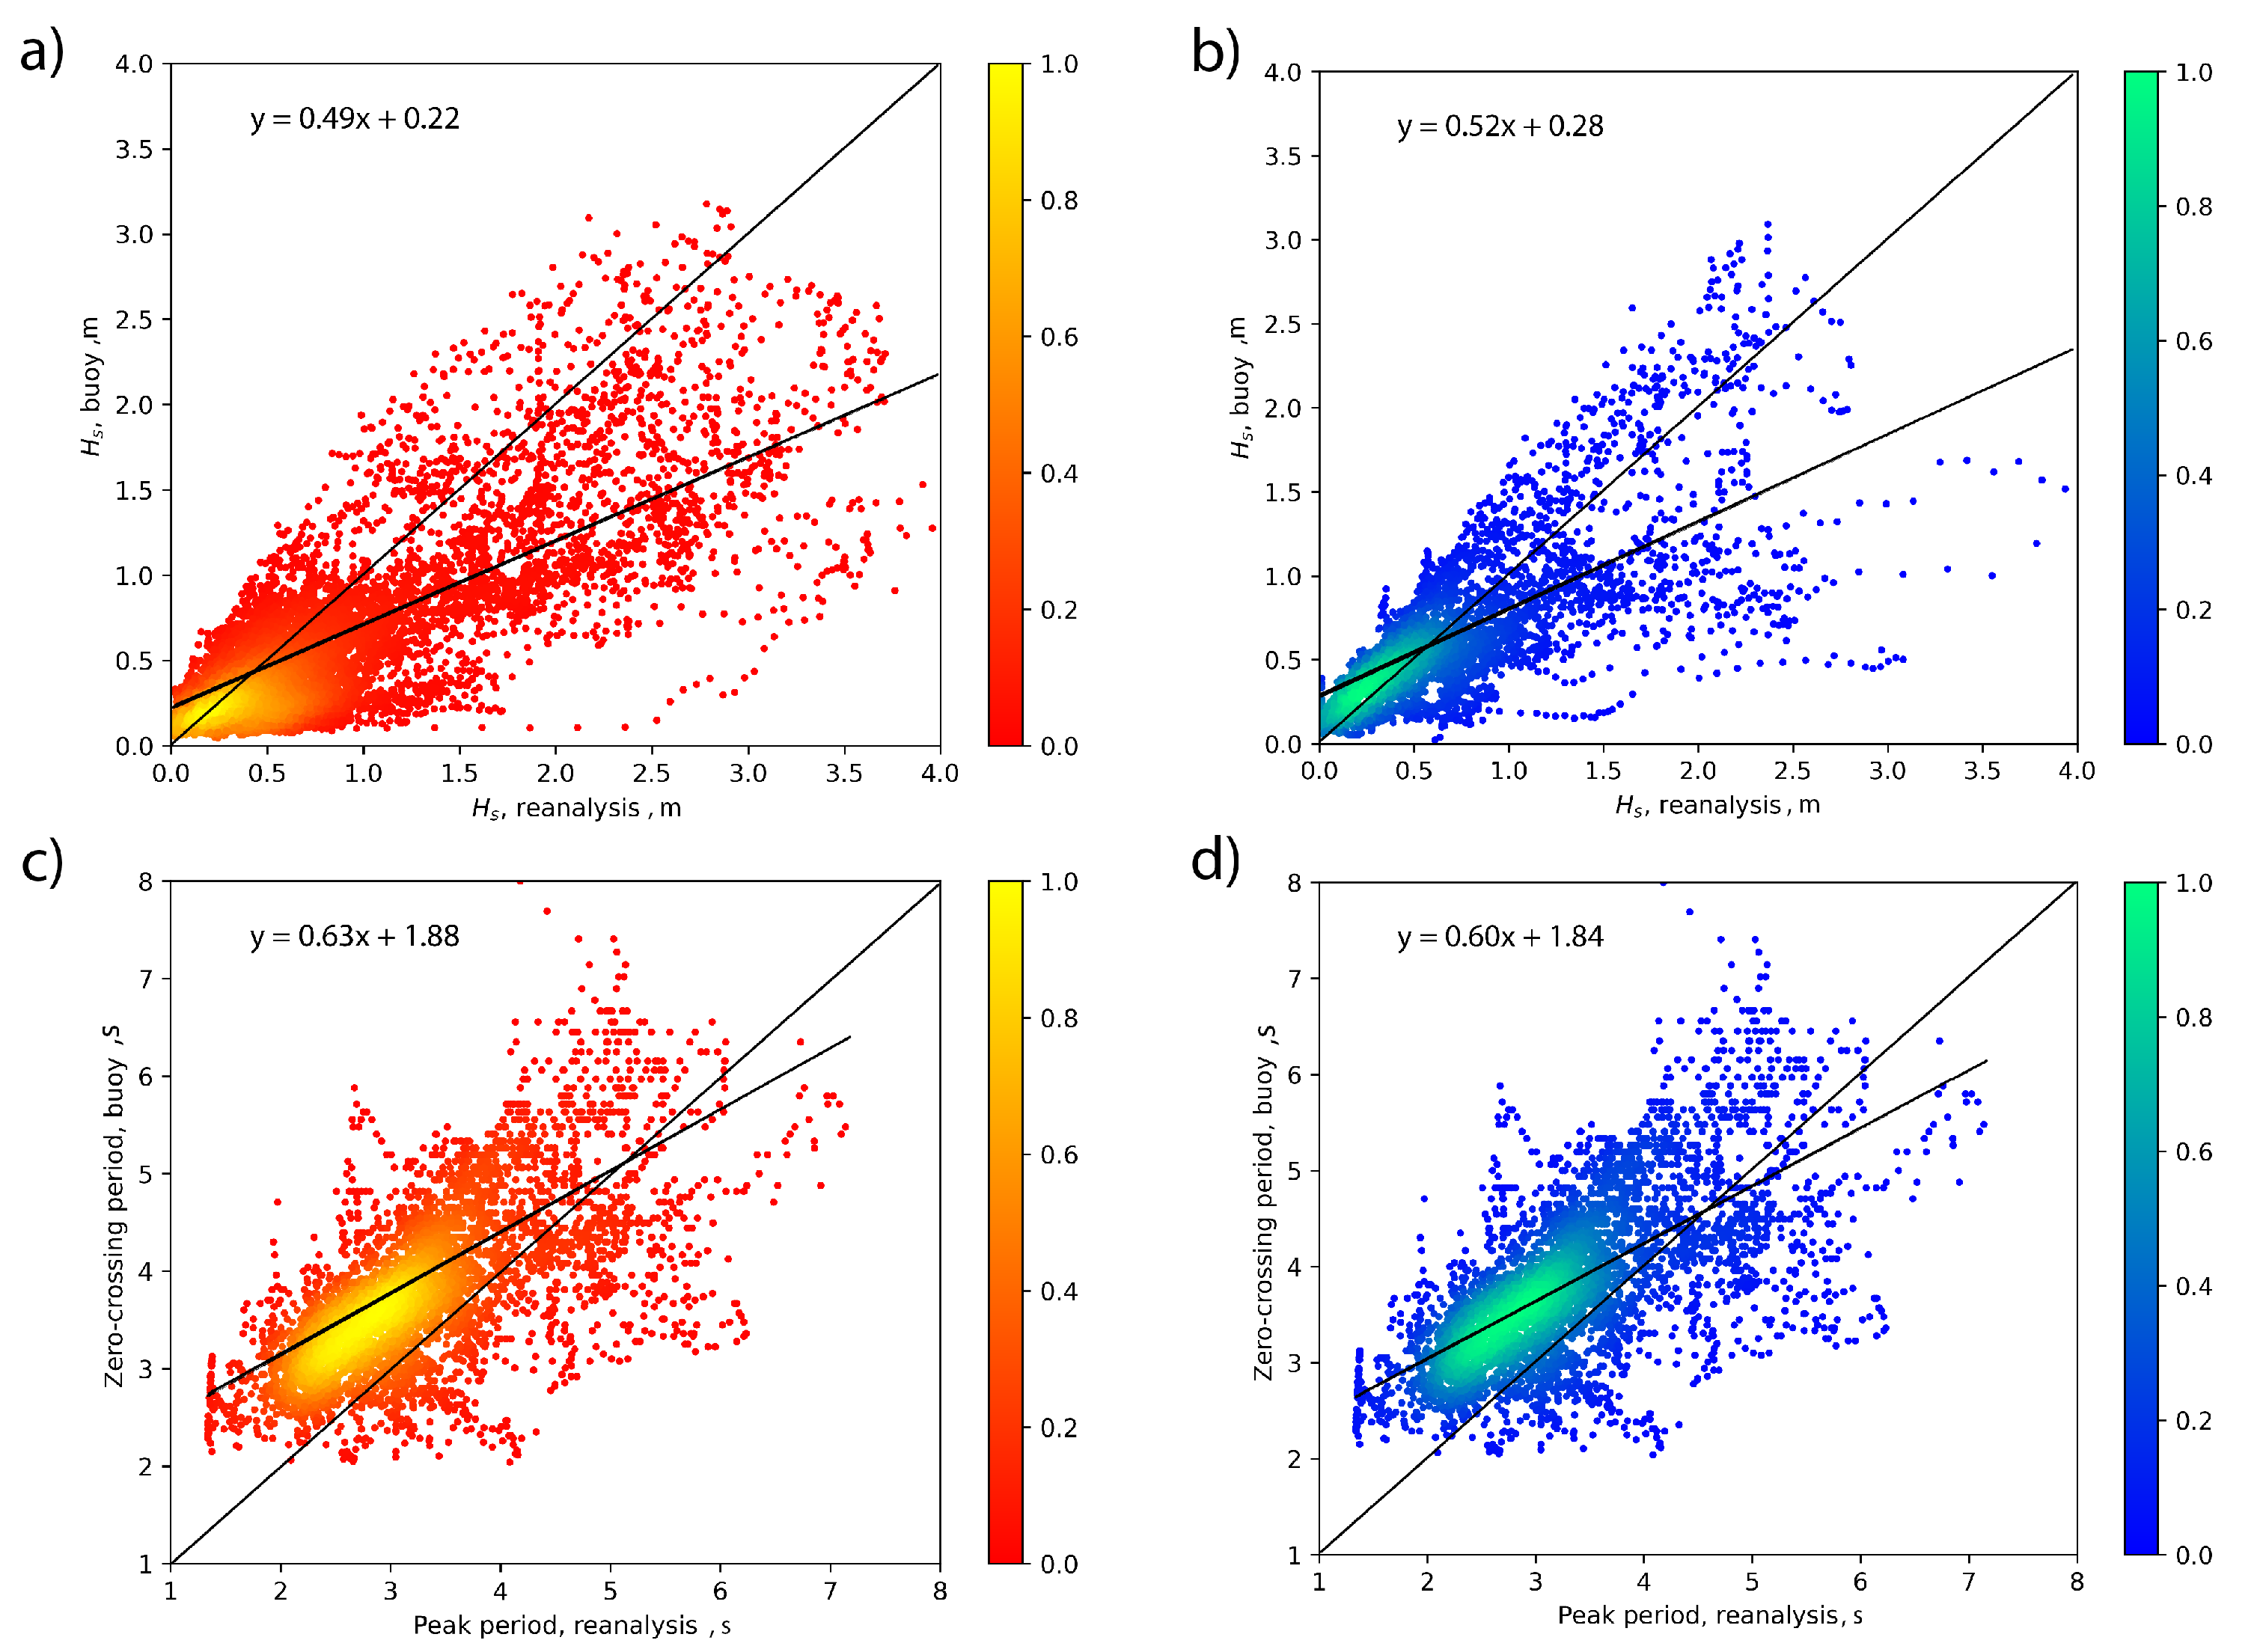
One can extend the mostly qualitative diagnostics given above by quantitative consideration within the conventional concept of wind-wave coupling. The reanalysis data provide a complete set of physical variables: wind speed and wave parameters (heights, periods).
Figure 8 shows the comparison of wave heights and periods measured by the buoy and calculated in the reanalysis point with the WaveWatch III model. Generally, buoy wave heights are lower as illustrated by the linear fit equations. It is not the case of wave periods when deviations change their signature in the operational range. Thus, the transformation of waves in frequency can be regarded as weak. There are probably no essential effects of the interaction of waves with currents and bottom depth. The decay of wave energy in the near-shore can be likely related to the reduction of wind input.
Dimensional analysis, developed by Kitaigorodskii [
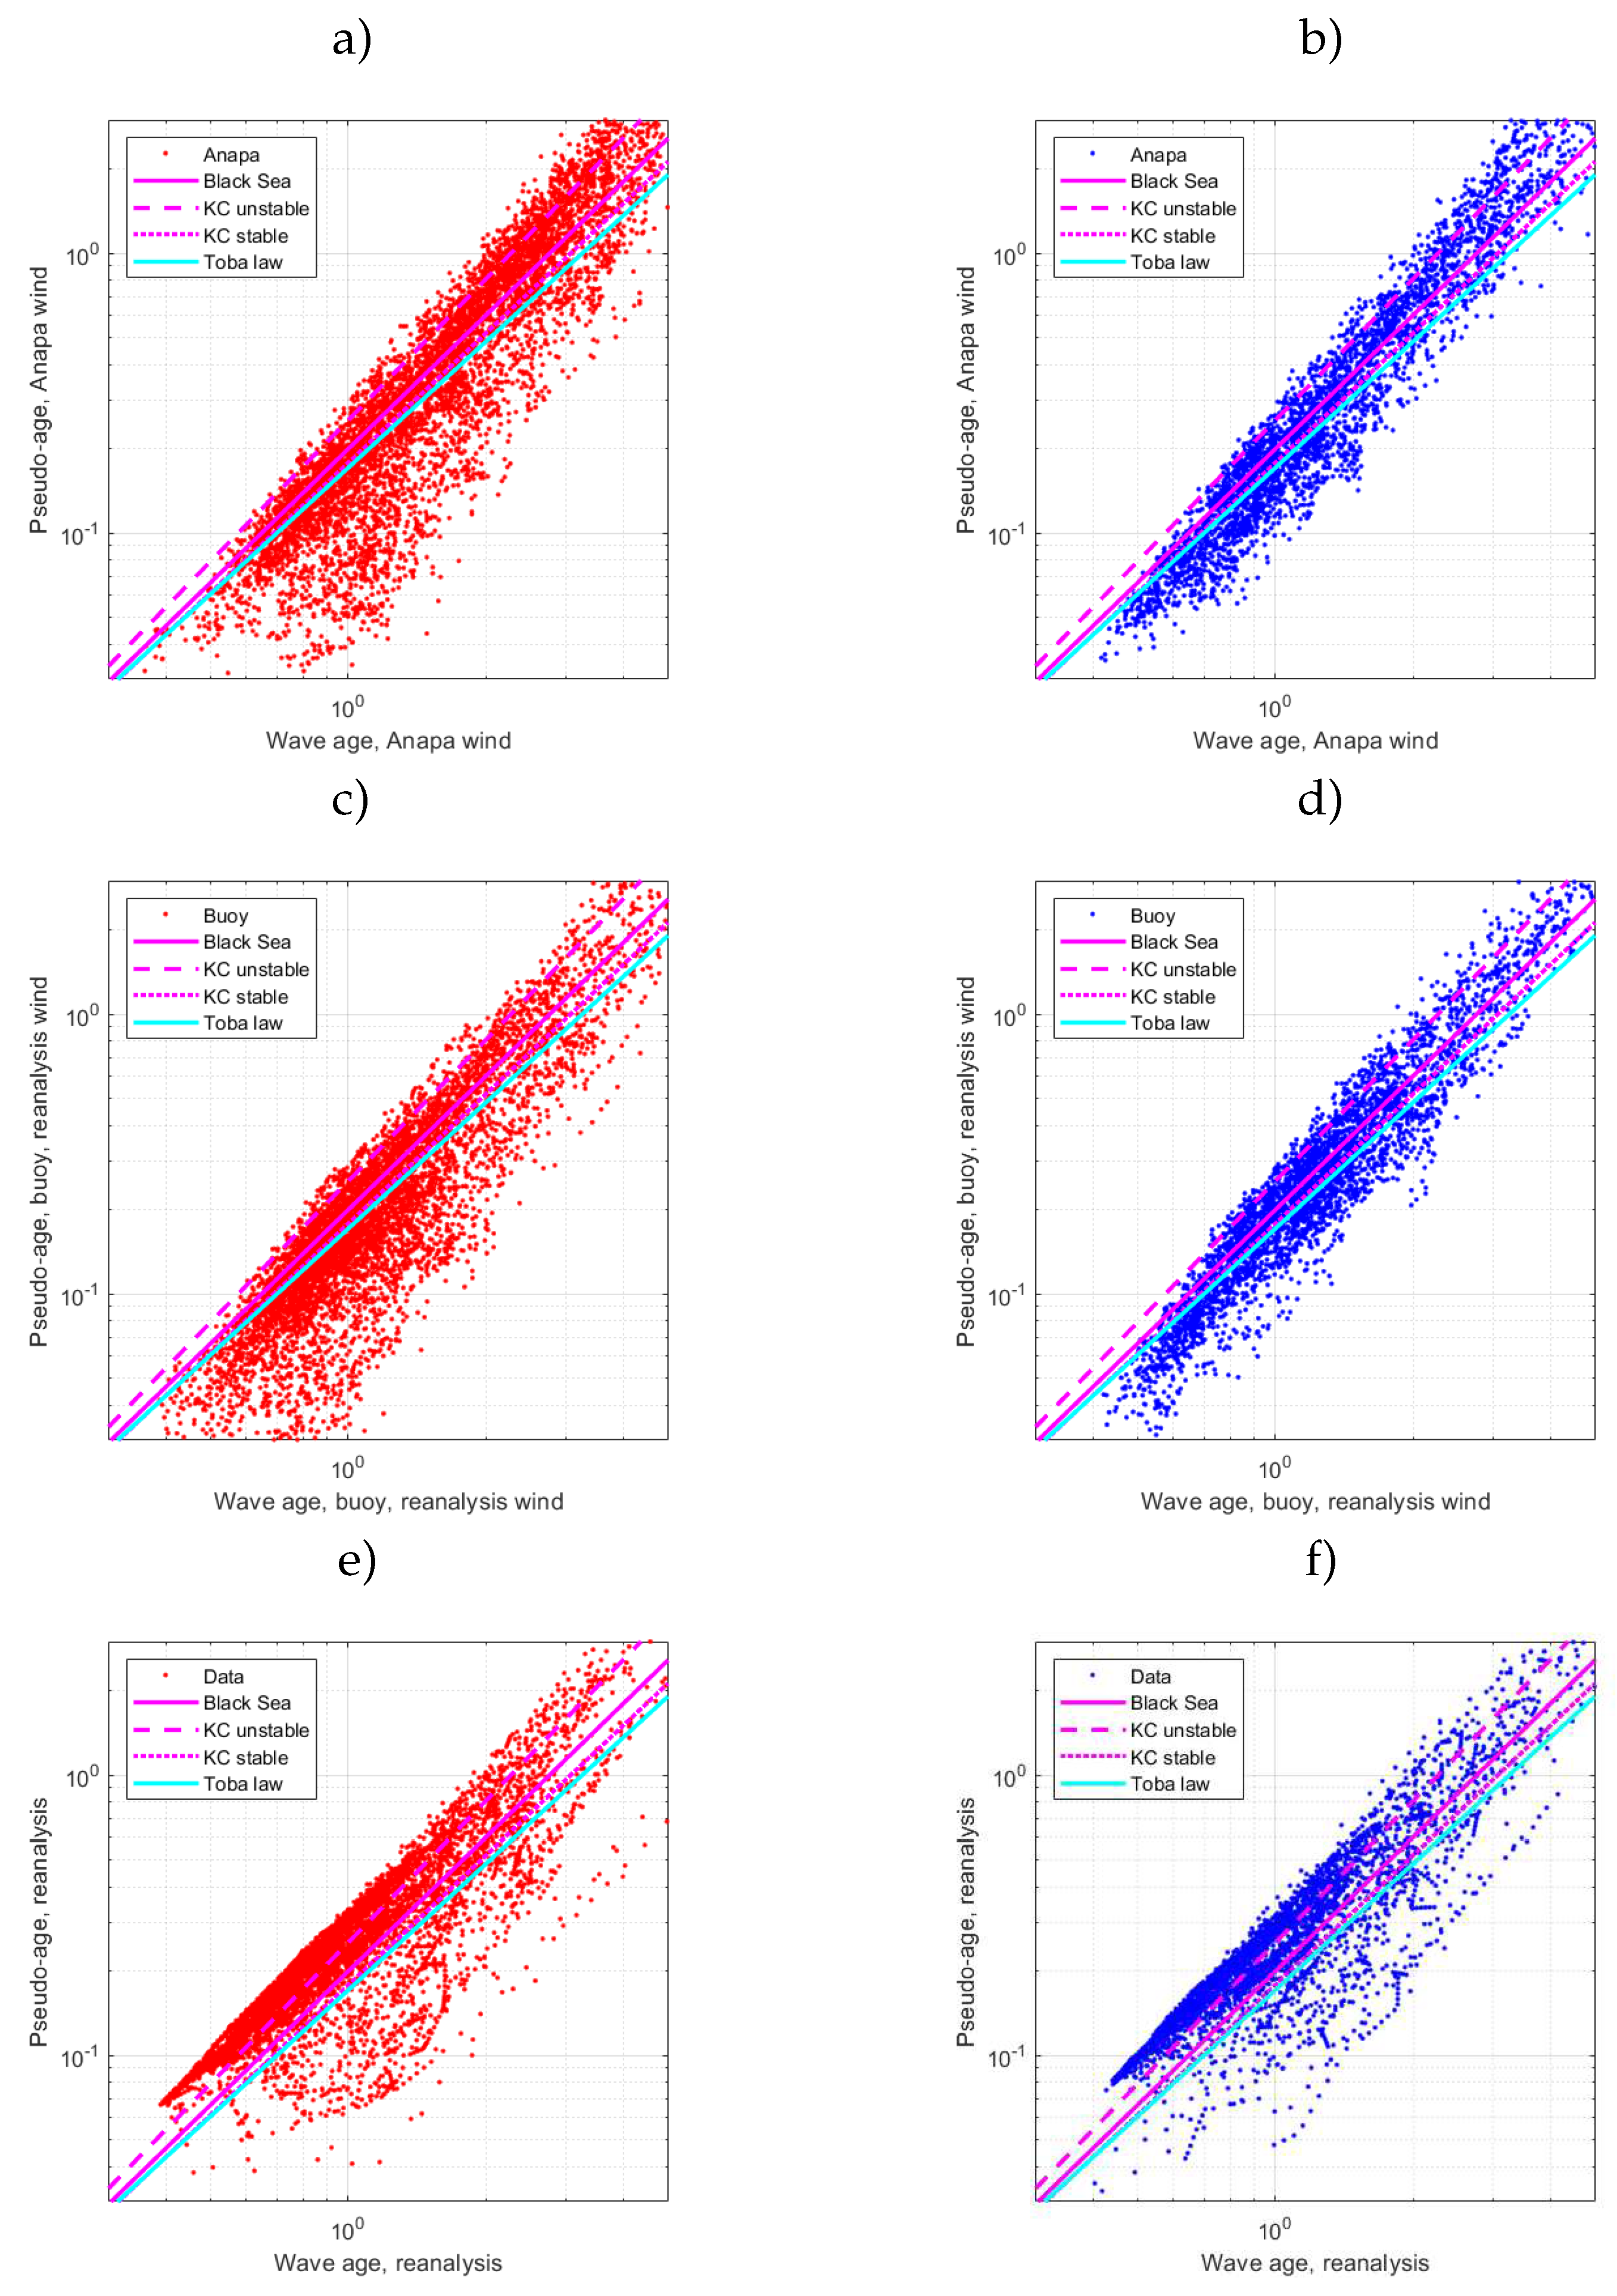
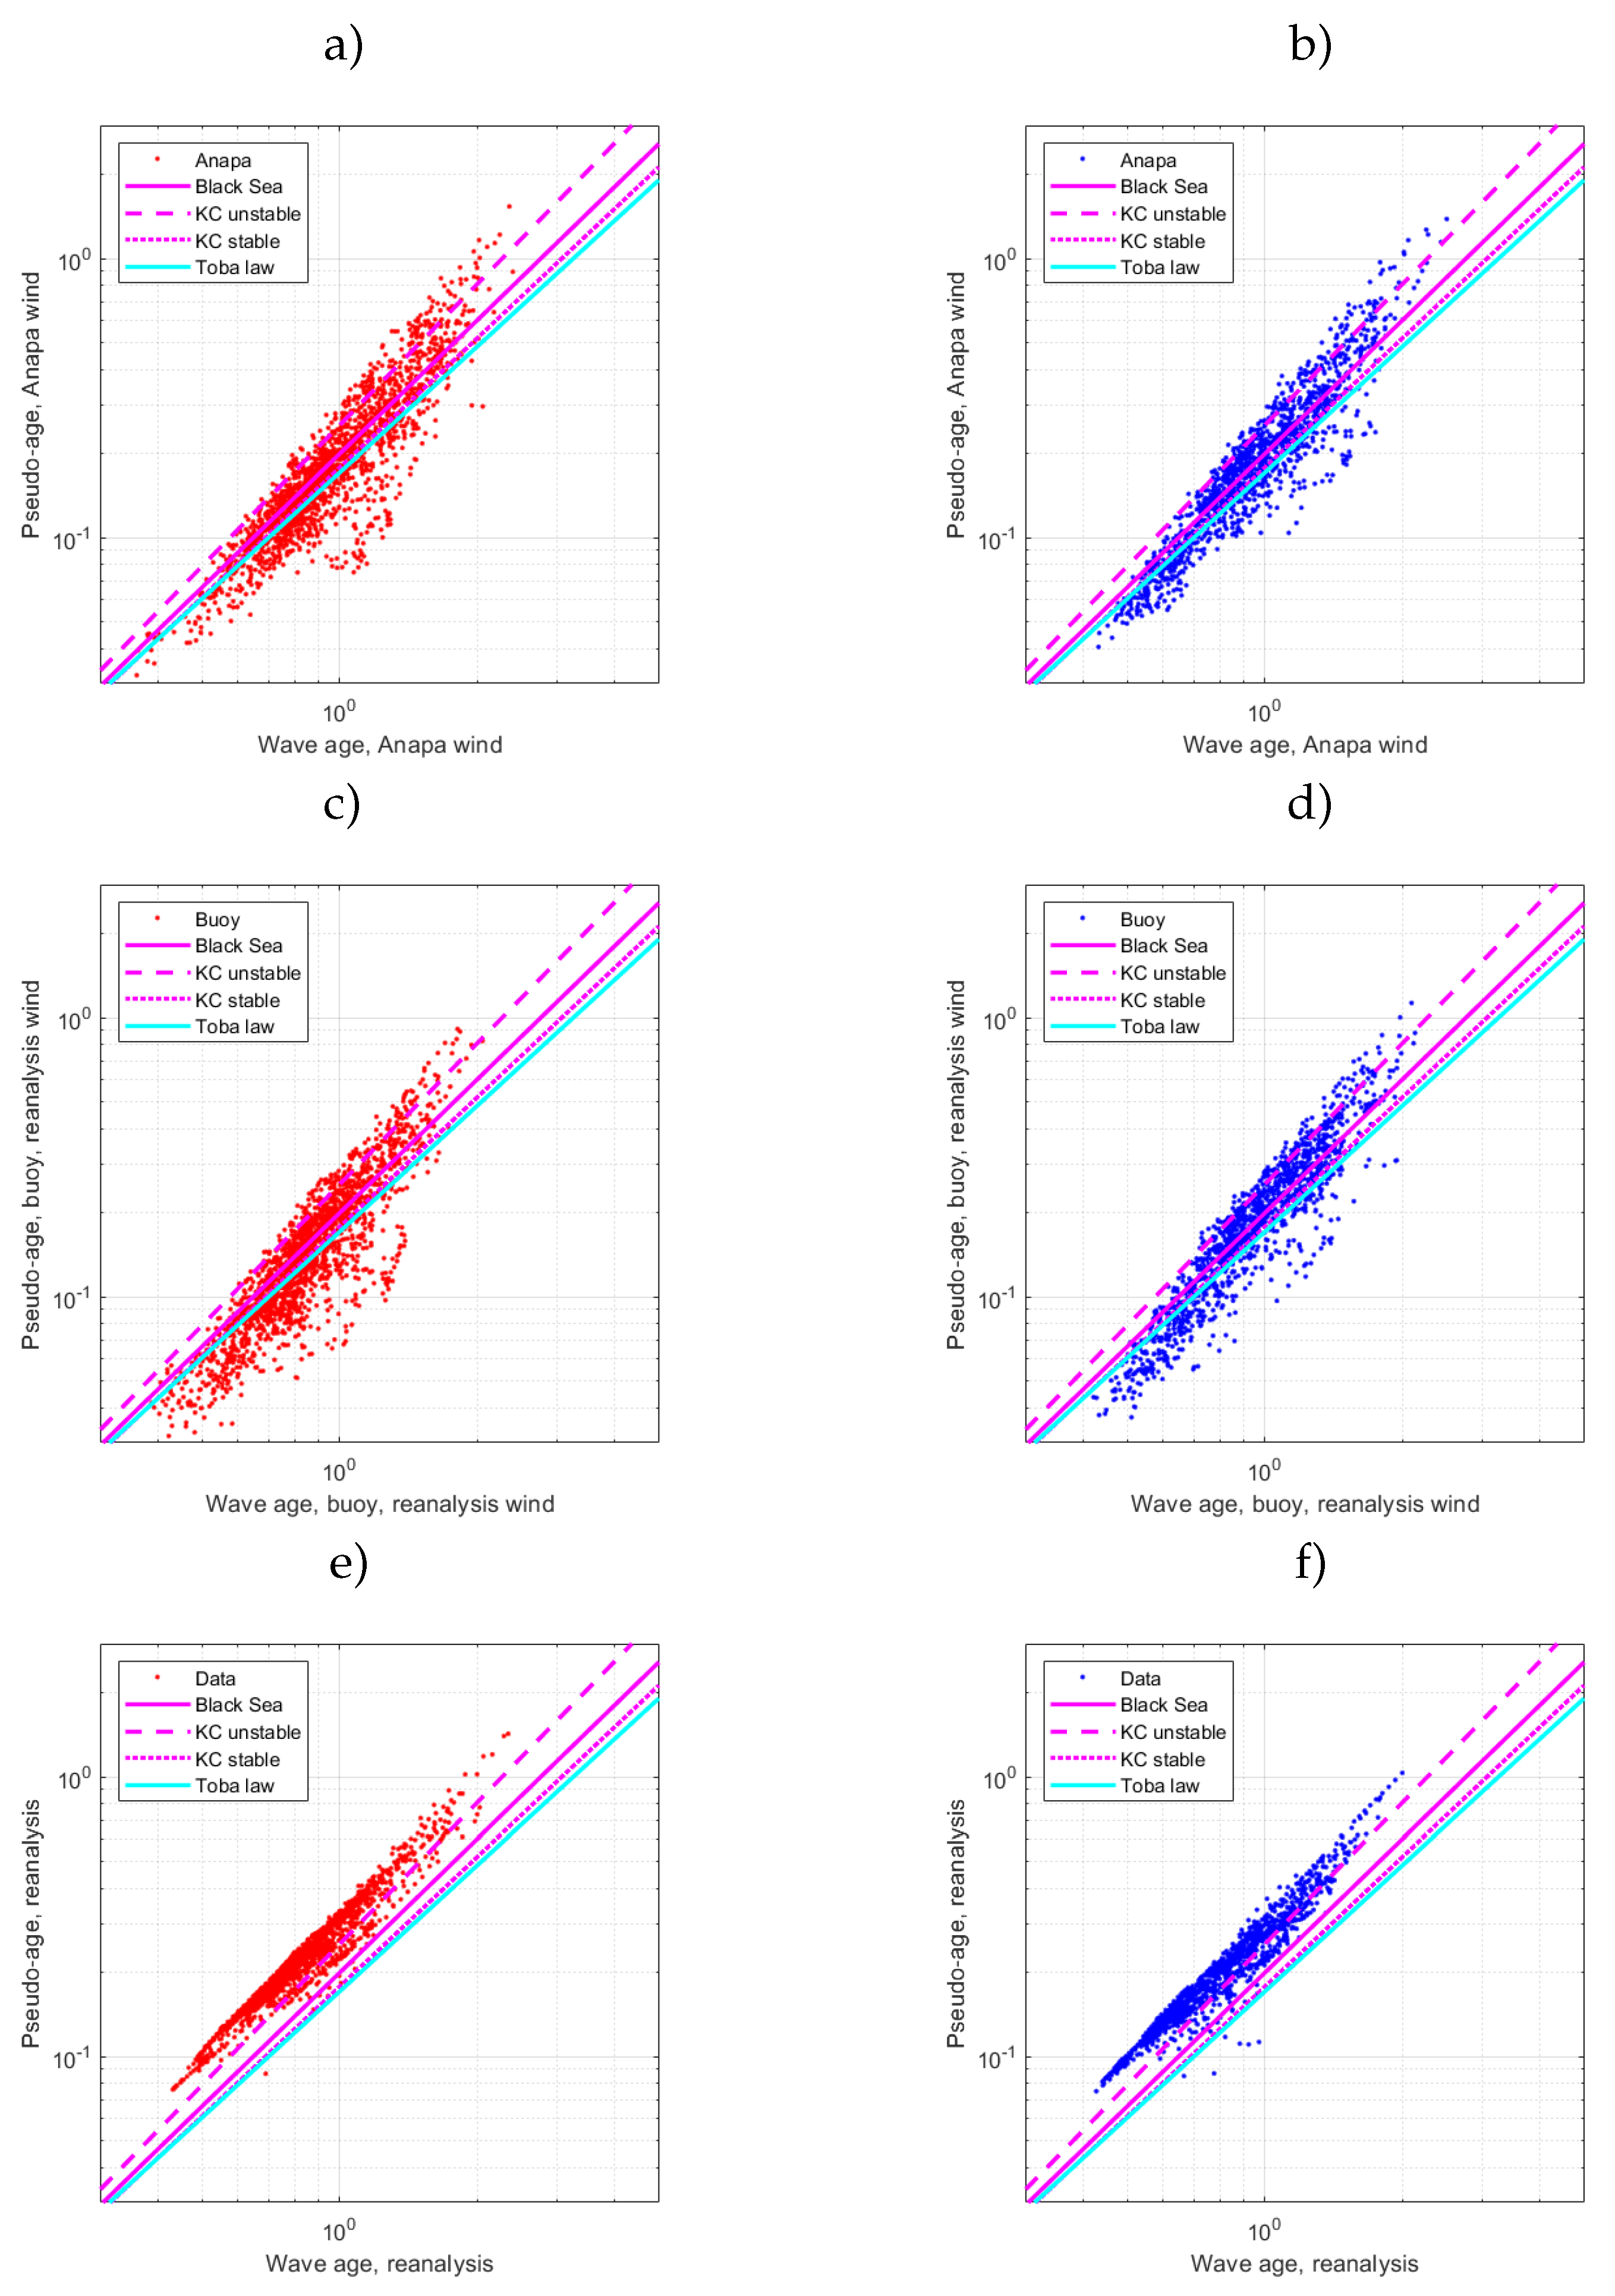
38], makes it possible to significantly advance the wind wave study without the explicit use of mathematical laws and even without formulation of physical laws. The dependencies of wave age on wave pseudo-age are shown in
Figure 9 and
Figure 10. Two upper rows (panels a,b,c,d) present buoy data scaled by the wind speed of the Anapa station (a,b) and one calculated at the point of reanalysis (c,d). The bottom row (panels e,f) shows data from the reanalysis. The lower limit of wave height
m is set in
Figure 9. All the data show their correspondence with the widely-known experimental power-law dependencies [
82,
83,
84]. Rather high dispersion of the data for all the speed scalings and the reanalysis results can be explained by rather mild constraints. Alternatively, setting up limits
m and
m/s leads to collapsing of the data to the reference dependencies in
Figure 10. One should stress good agreement not only with the exponents close to Toba (
) but also with the pre-exponents of the corresponding power-law parameterizations. The effect of data limitations has a simple physical explanation. By increasing the wave height threshold, we obtain data with well-pronounced effects of nonlinear interactions. By increasing the wind speed threshold, we consider data with strong wave generation by the wind. The data collapse to dependencies of the Toba type can be interpreted as a sort of saturation of balance between wave nonlinearity, generation, and dissipation.
This result can be seen as unexpected: the sea state is far from an idealized theoretical model of fetch-limited wave development and previous experimental setups. Nevertheless, for relatively strong winds and high waves the wave age and pseudo-age keep a robust dependence. This experimental result is in line with the concept of weakly turbulent nature of wind-driven seas.
3.3. Theory of wave turbulence for wind-wave coupling diagnostics
The conventional approach to the wind-wave study operates with wind speed as a governing physical parameter, thus implying a dominant role of wind input and wave dissipation. The issue of “shape-invariance of wind-sea spectra” [
35] cannot be adequately explained within the conventional approach. Since the JONSWAP experiment, an important or even a critical role of the nonlinear wave-wave interactions is discussed [see pp.48,52 in [
34]. Phillips [
70] tried to resolve the problem of the so-called equilibrium range where frequency spectra show a universal dependence
. All the terms, wind input, wave dissipation, and wave-wave interactions compete on equal terms in this model that lead to essential physical constraints which are not fully resolved so far [e.g. [
70], sect. 5]. Nevertheless, the idea of the universality of spectral shaping is widely used in empirical parameterizations and can be effectively used for experimental diagnostics wind-wave coupling [see, e.g. [
39].
3.3.1. The equilibrium range in the wave spectra measured by buoy
In our treatment of wave spectra, we follow the concept of dominating role of wave-wave interactions that allows one to use the results of the theory of wave turbulence [
40]. The essential outcome of this theory is the so-called Kolmogorov-Zakharov solutions (
10,
11) governed by spectral fluxes of wave energy
P and wave action
Q. The first solution describes the energy flux
P directed to the high-frequency range. This solution can be associated with the observed dependence of frequency spectra
in a range
[
87,
88,
89].
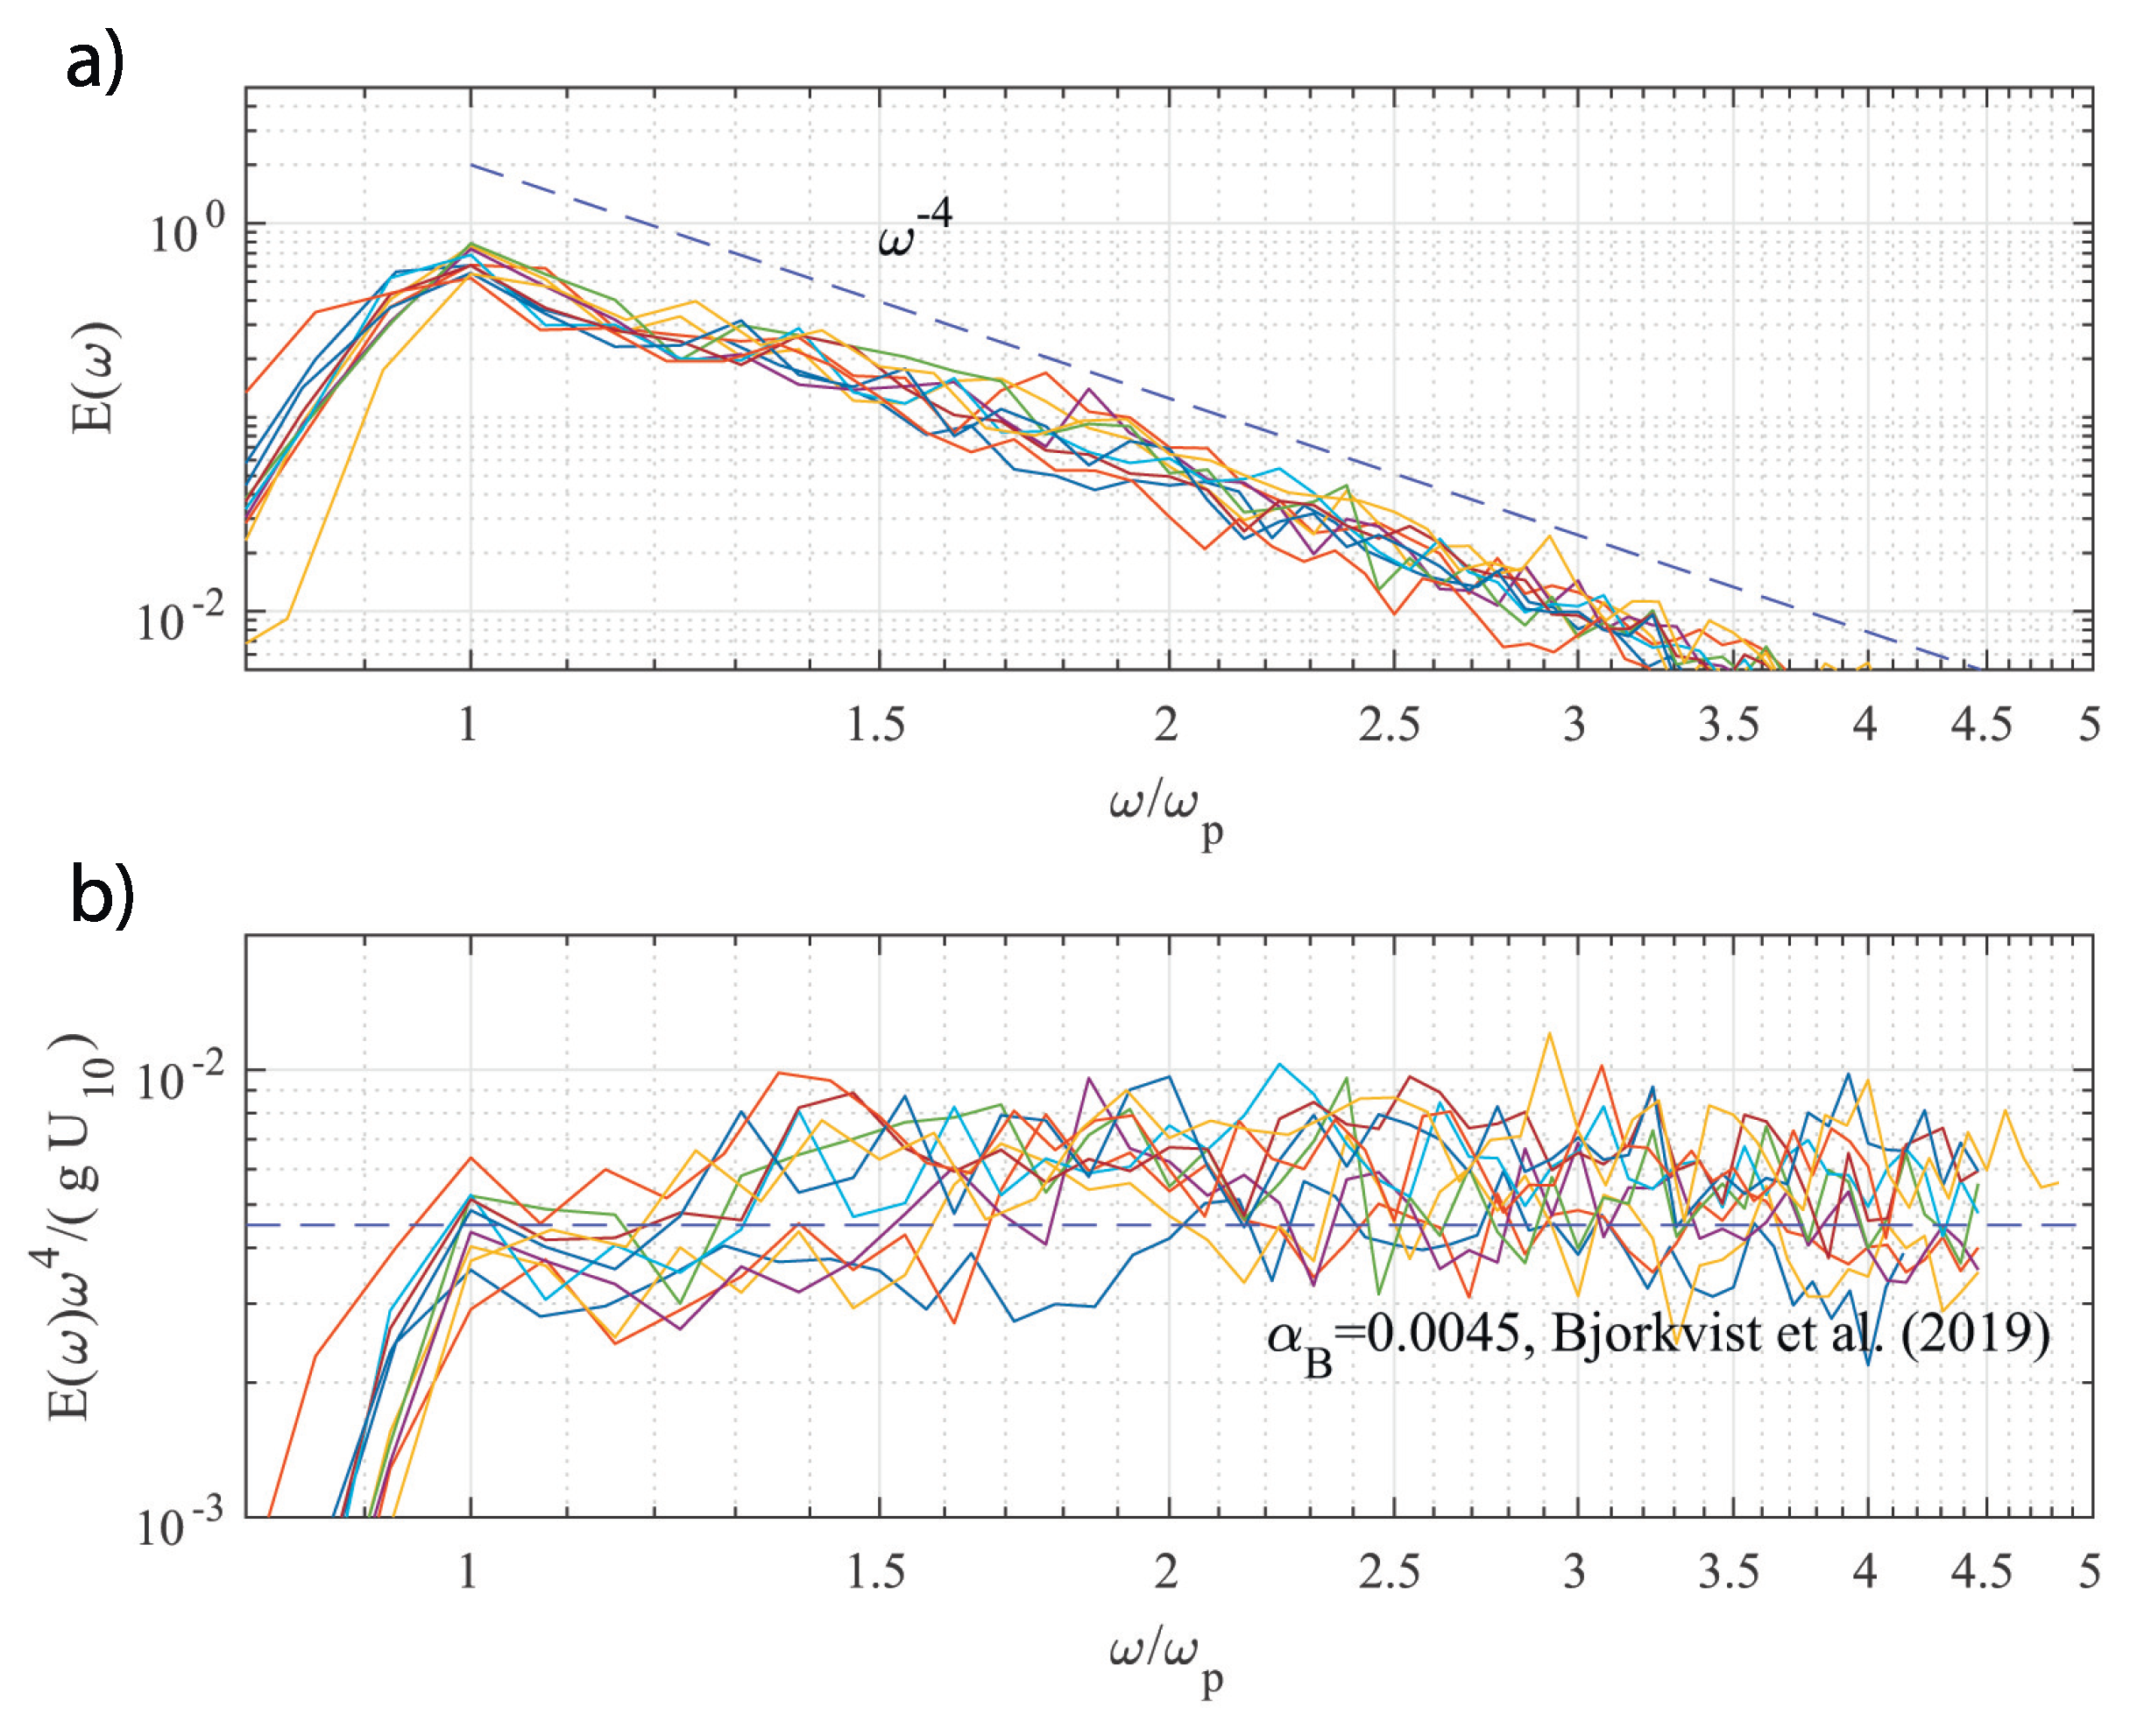
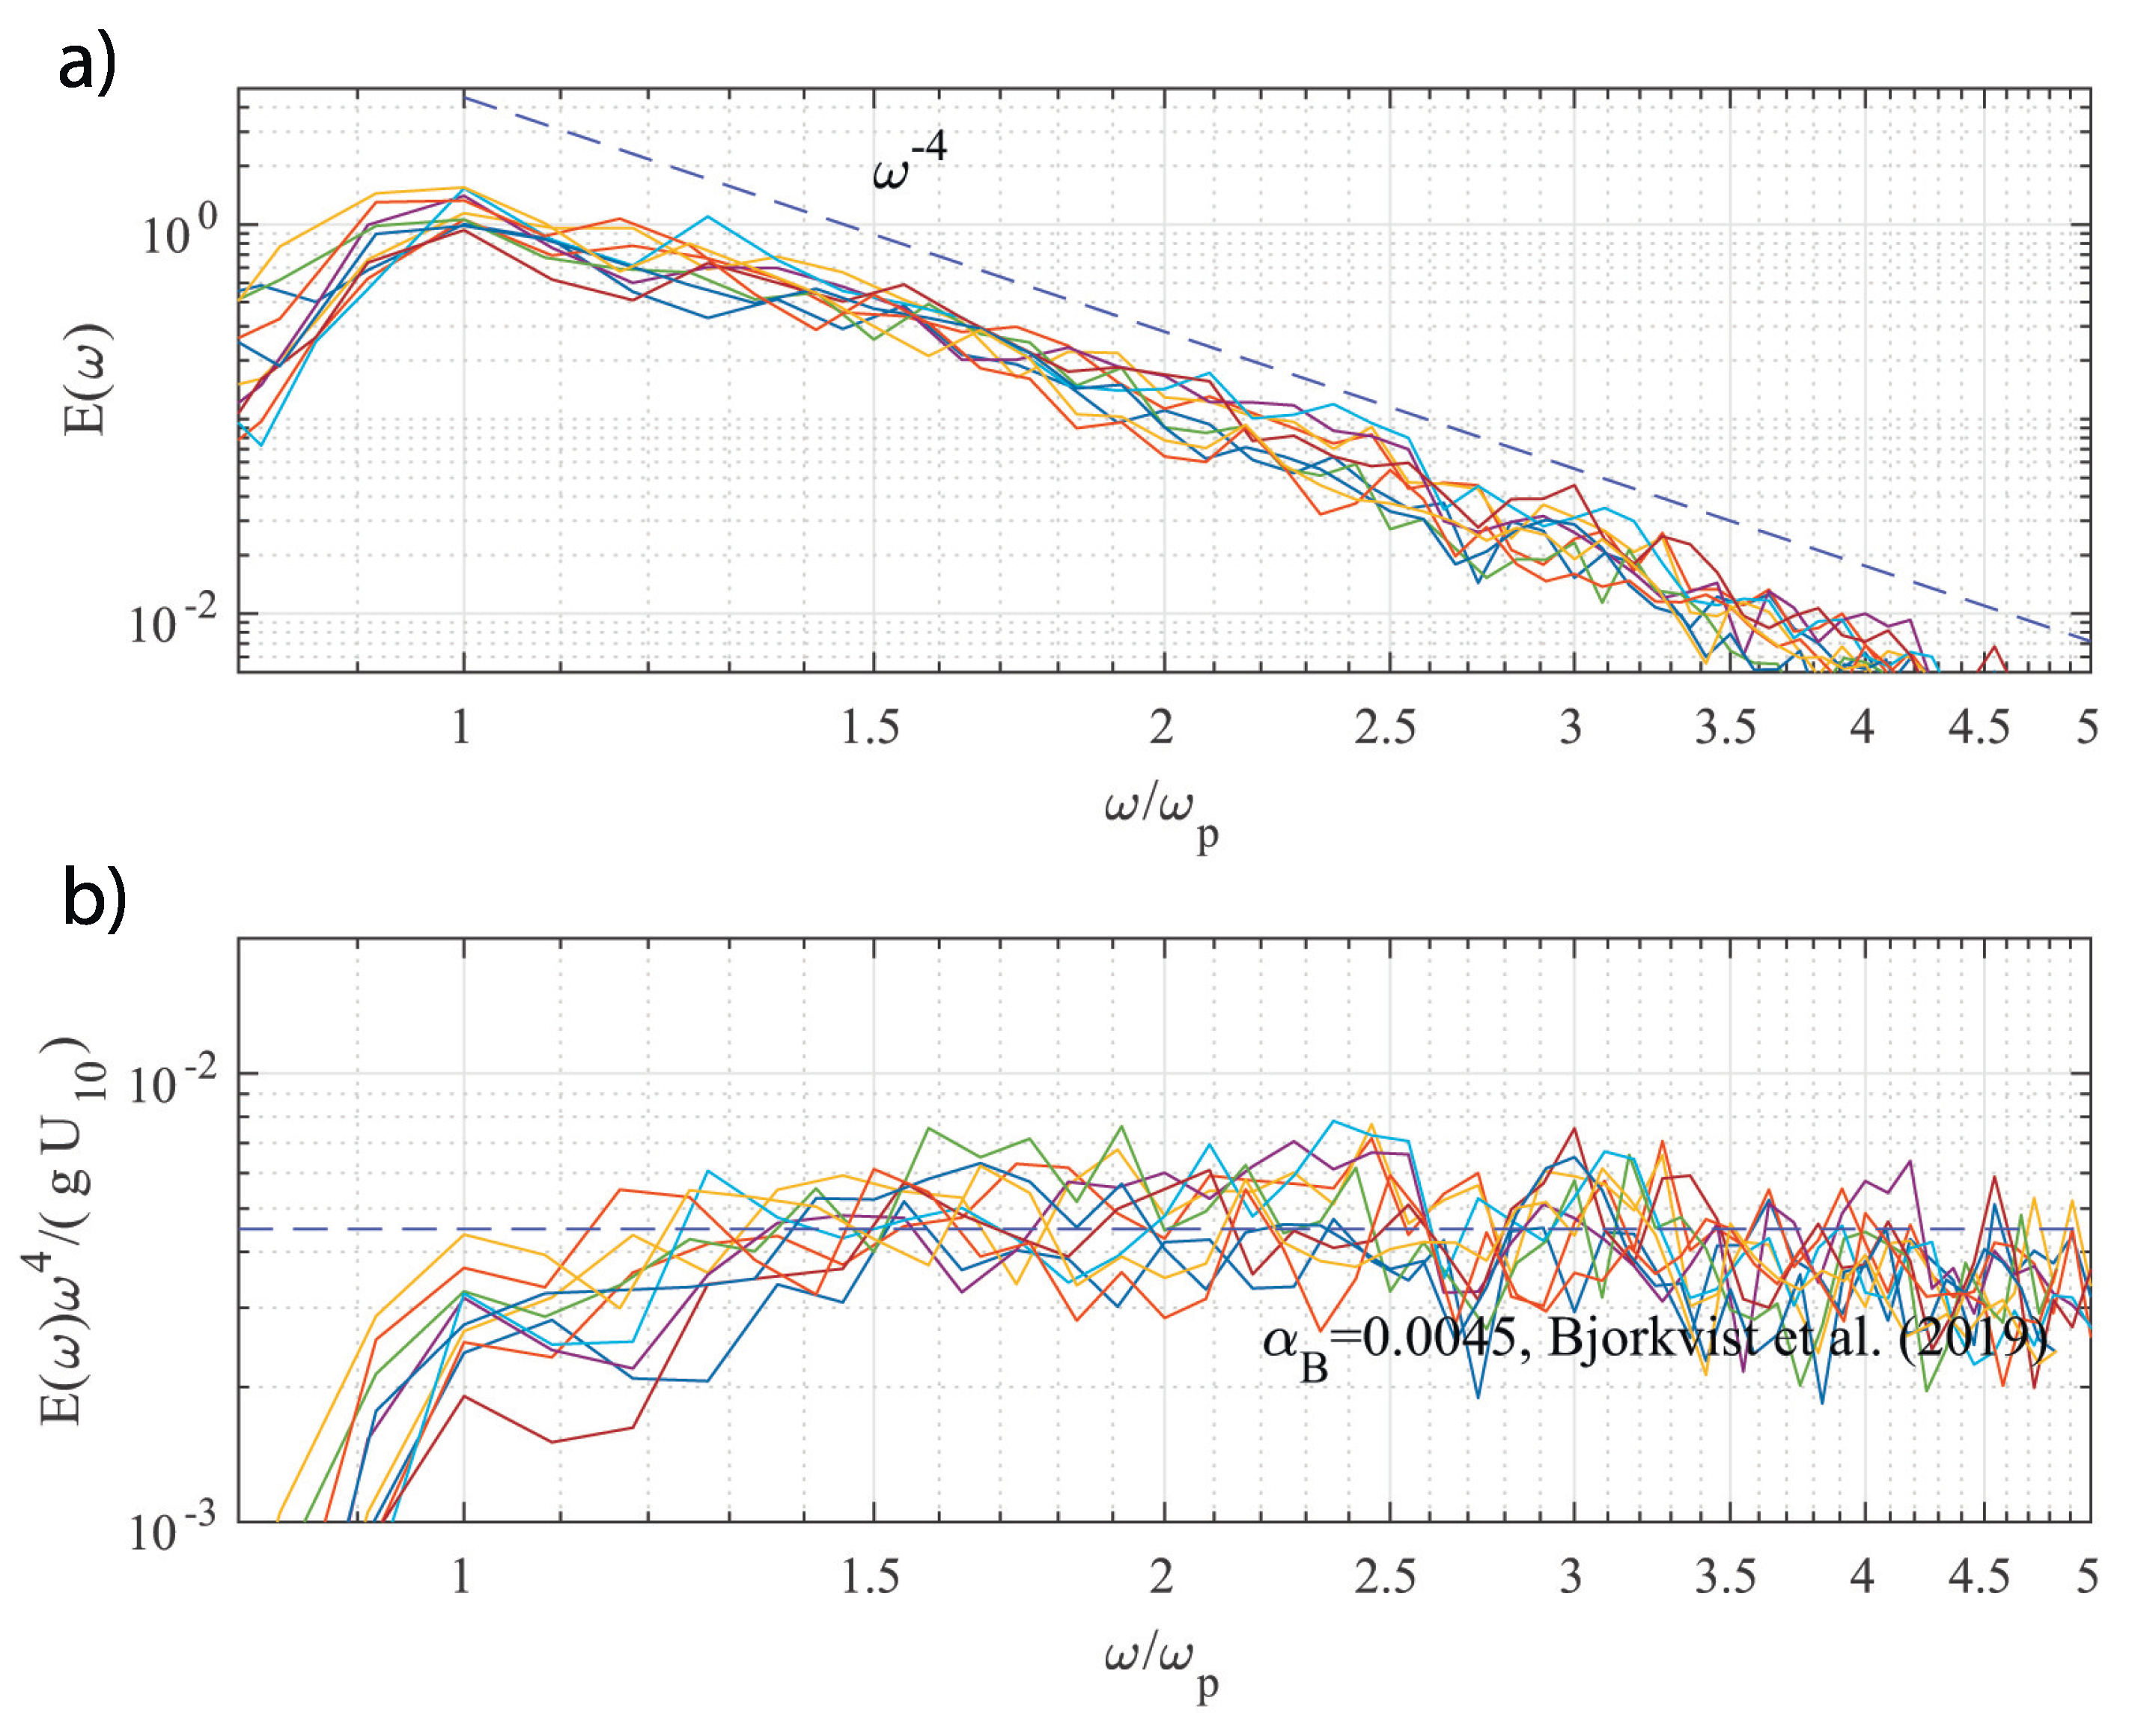
In upper panels of
Figure 12 and
Figure 13 frequency spectra
are shown for two cases with wave height about 2 and about 3 meters as functions of dimensionless frequency
. One should see the similarity of spectral shapes and the dependence proximity to a power-law
(the plots are in log-log axes). In the bottom panels of
Figure 11 and
Figure 12, the compensated spectra are normalized following [
39], fig. 12,
]
Equation
13 can be used for estimating the counterpart of
in (
8) for parameterization by
. The coefficient
was calculated by averaging
in the range
. The result is close [
39], fig. 12,
] and shown by horizontal dashed line in
Figure 11 and
Figure 12. In contrast to the cited paper [
39] and recent report [
85] the estimated
varies significantly as seen in
Figure 11 and
Figure 12.
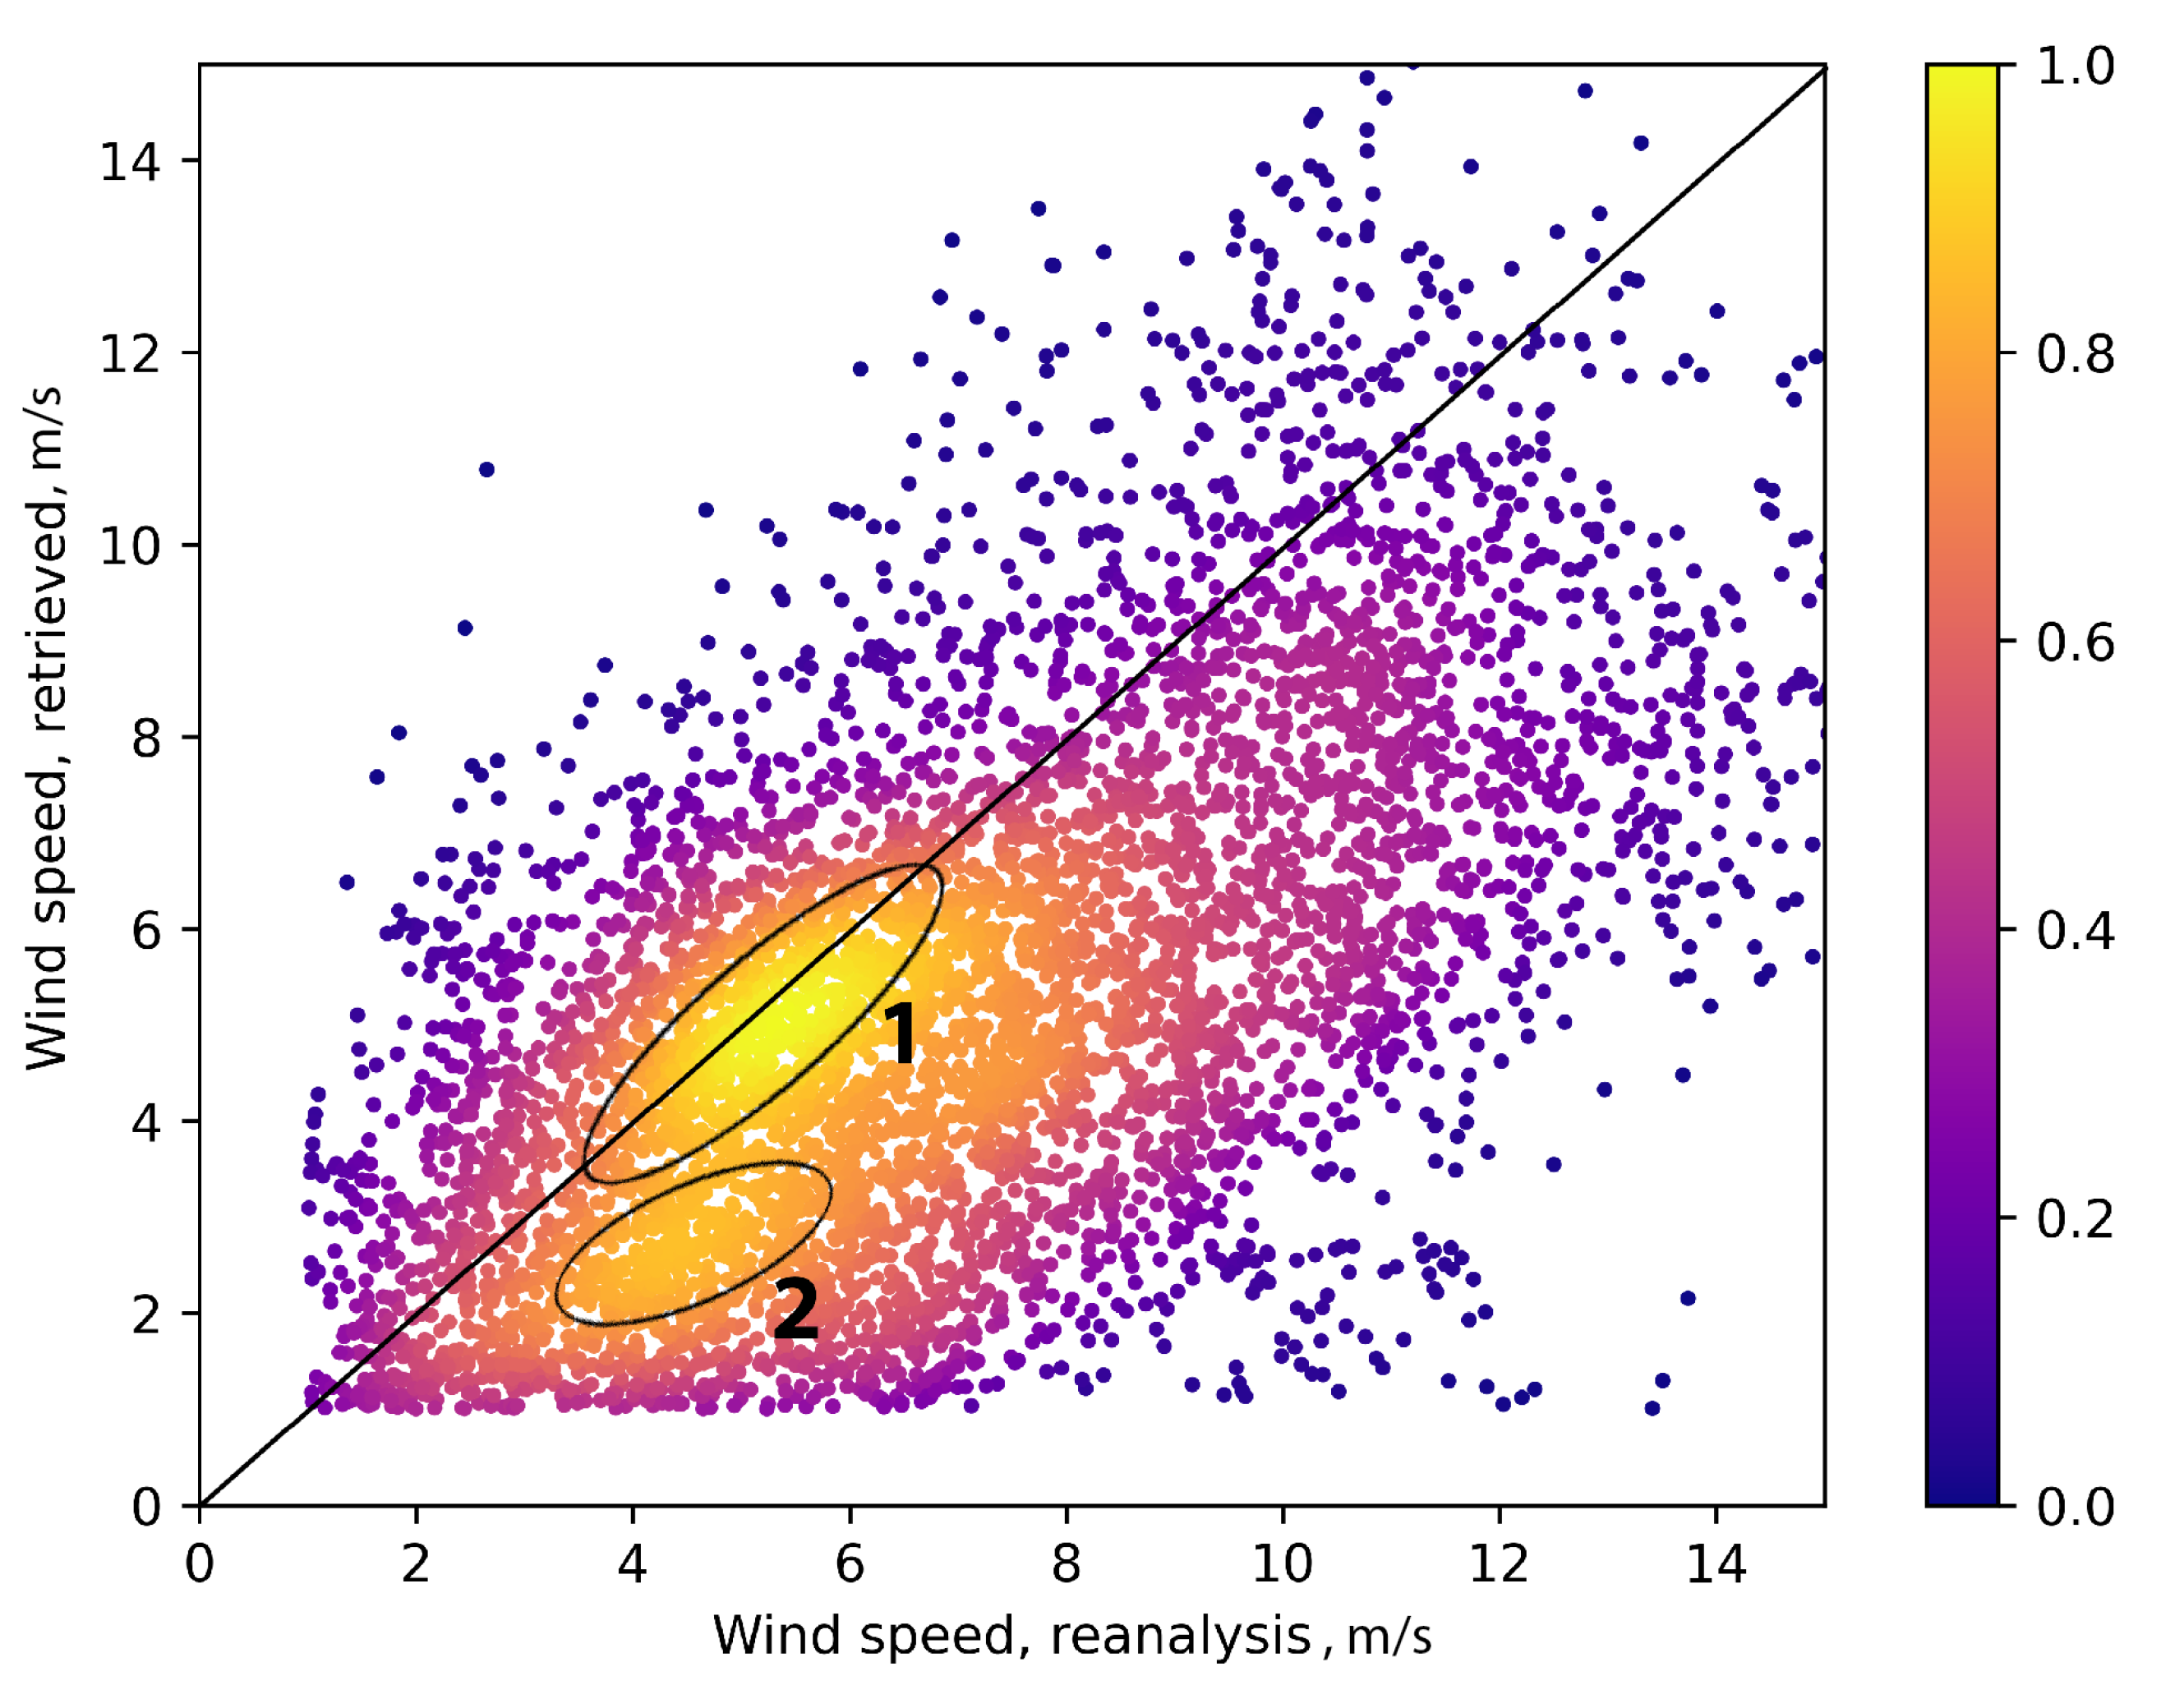
Figure 13 shows the scatterplot of the retrieved wind speed as proposed by [
85] vs the wind speed reanalysis. Rather high scattering does not support the idea of this method unconditionally in our specific case. At the same time, one can see a cluster of points near the diagonal (measurements and retrieval match) and a less pronounced cloud of measurements at the level above
of maximal probability where the retrieved wind speed is underestimated by
%. One can hypothesize the effect of the mixed sea state to be responsible for the two-phase distribution. We leave this issue for further study.
3.3.2. Energy flux in the spectral equilibrium range
The wave turbulence approach provides an alternative treatment of the spectral equilibrium range. One gets from the direct cascade solution (
10) the energy flux
One should stress that this flux governed by the direct cascade mechanism is just a part of energy flux coming to waves from wind. The remainder goes to the wave growth associated with the second Kolmogorov-Zakharov solution (
11) and the mechanism of spectral downshift, the inverse cascading. As shown in [
79,
86,
87,
88] the direct cascade accumulates the main part of the wind energy flux, about
and even more while the inverse cascade constitutes just very few per cent.
Energy flux of turbulent wind can be written as follows [
88]
(here we let
as acceptable approxiamtion). Note, that if we assume the direct cascade flux
to be proportional to
we immediately come to the parameterizaton (
8), i.e. to proportionality of spectra magnitude to the wind speed. Actually, the ratio
depend on the stage of wave growth. This trivial statement can be illustrated by the experimental data.
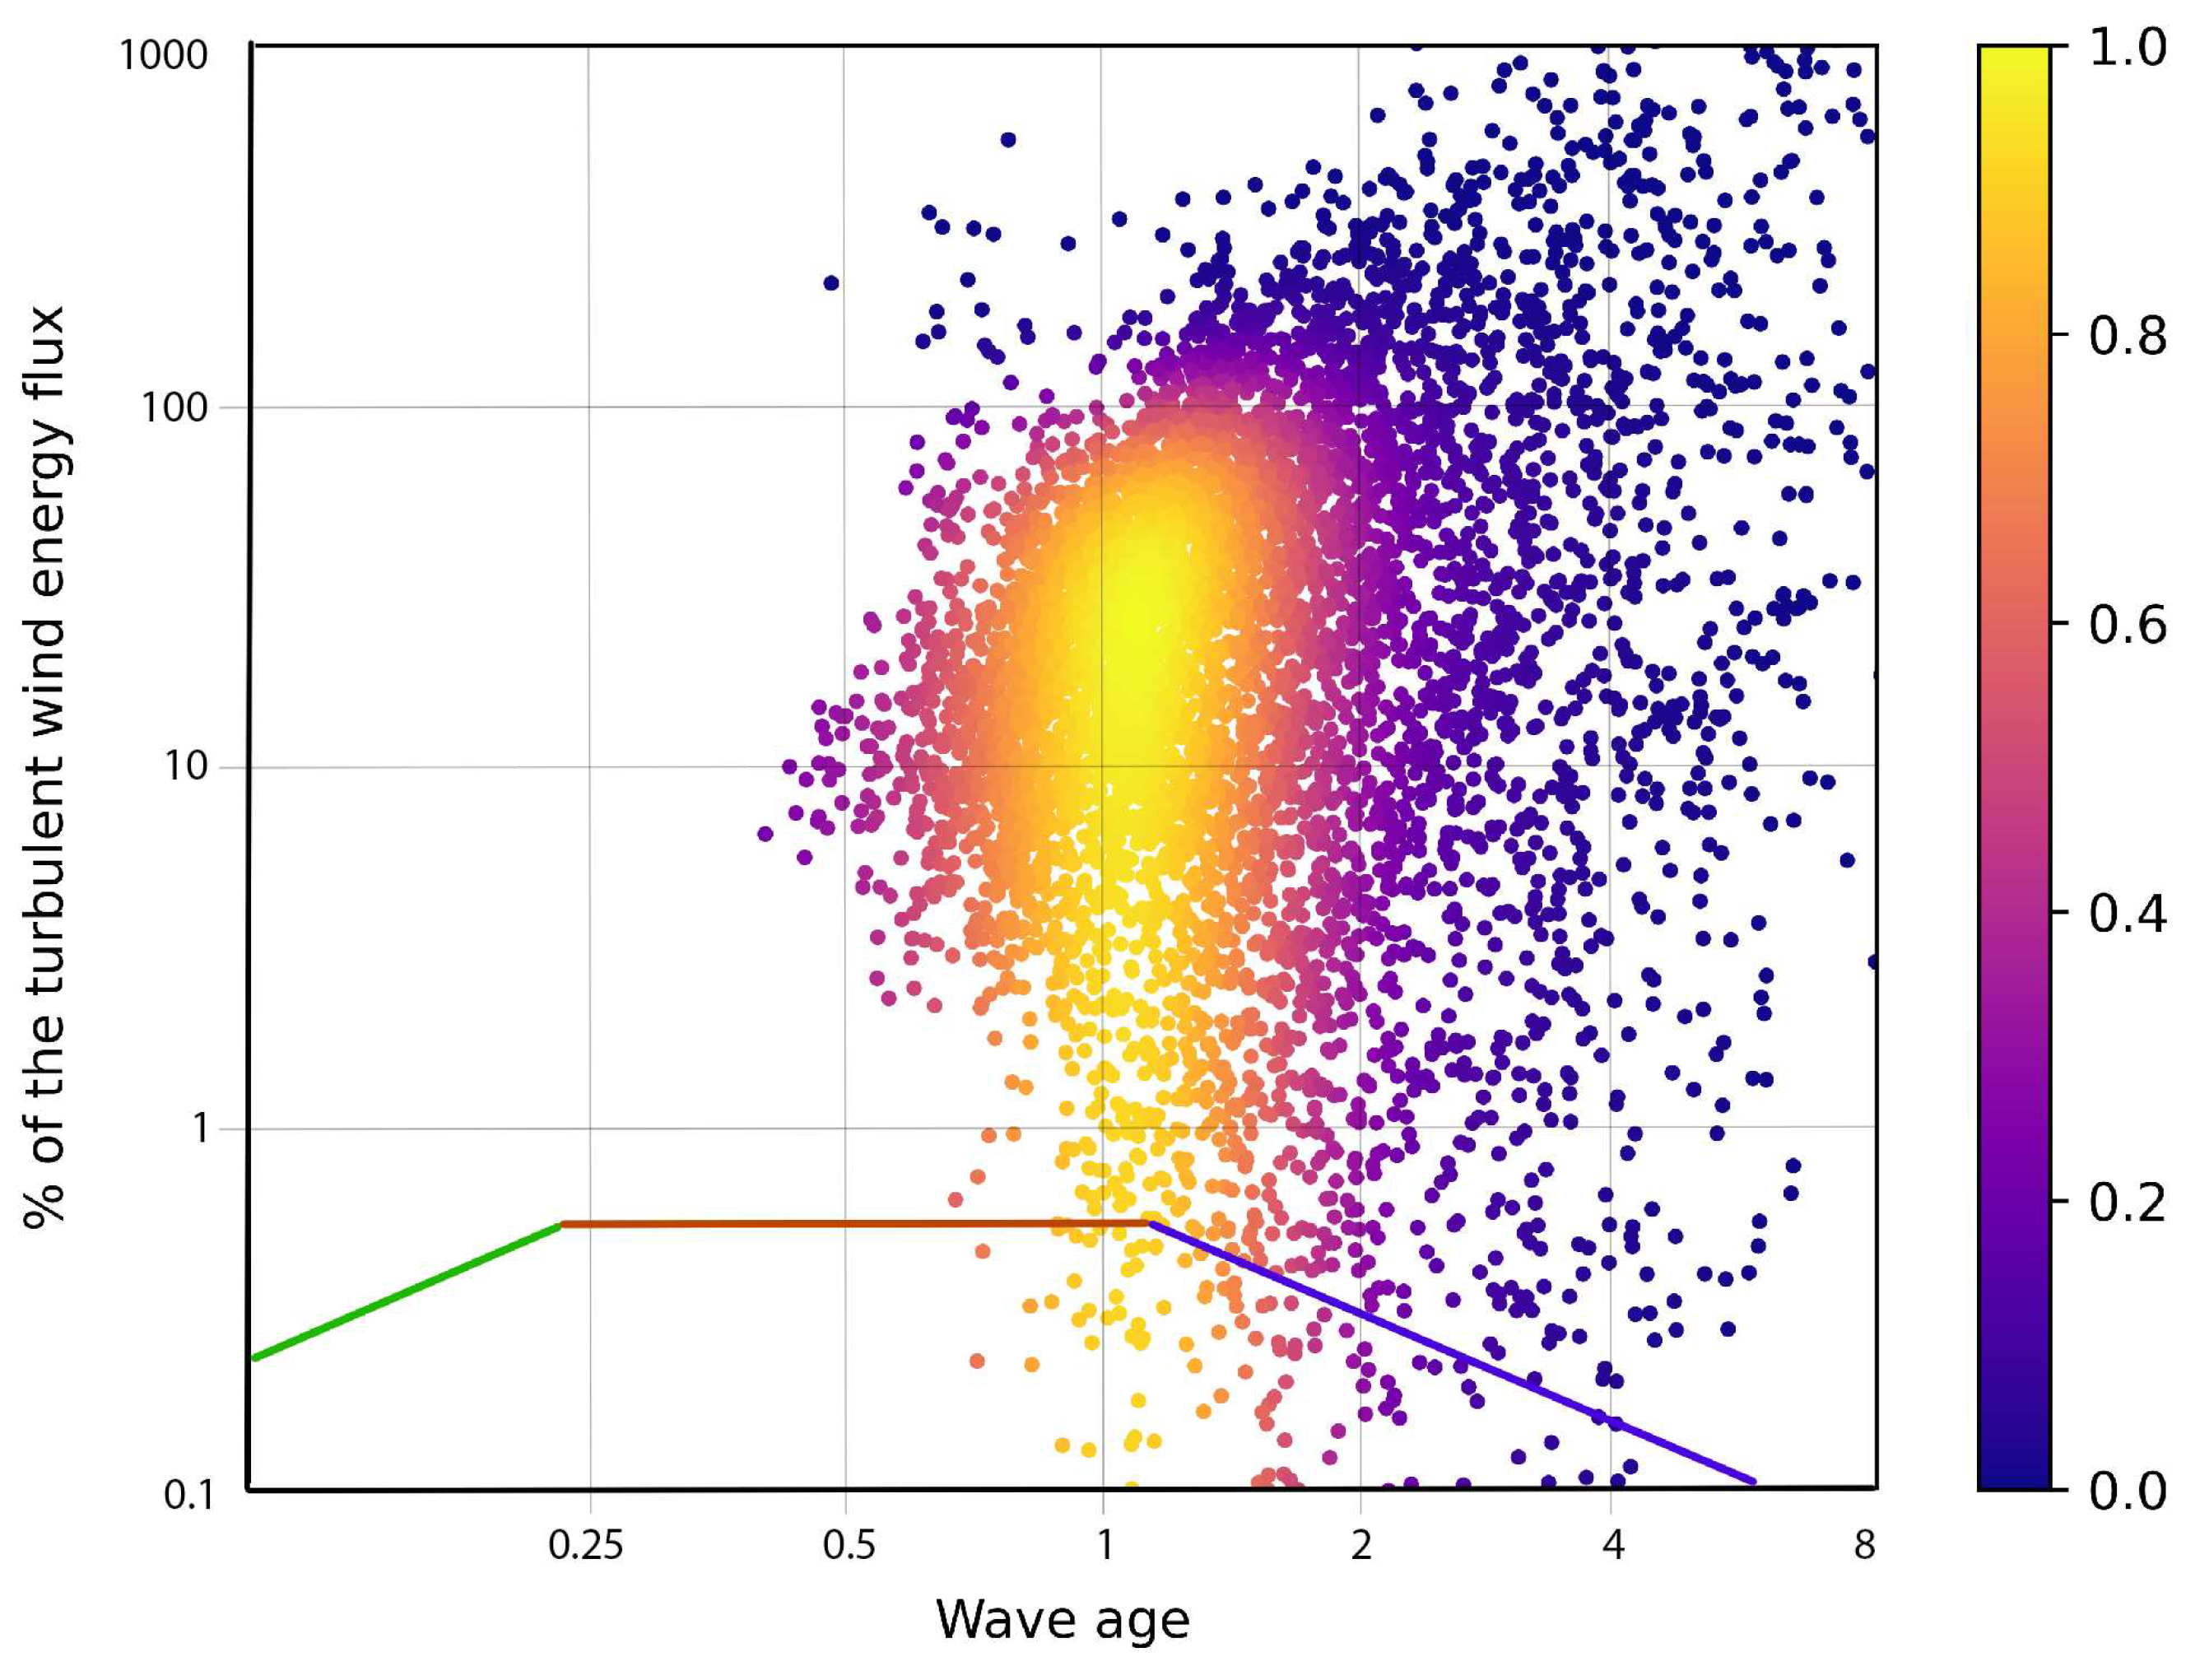
Figure 14 shows the probability density of data as a function of wave age and the ratio of energy fluxes
calculated with (
14,
15). The exceeding
looks acceptable for the accuracy of measurements and, mostly, because of errors in estimates of wind speed and resulting flux
. The ratio reaches its maximum for the wave age close to unity. Low ratio for “old” waves with
is a result of low energy flux from wind to fast waves, swell. Moreover, waves running faster than wind can transfer their energy to the wind [
89,
91].
Similar decay of the ratio occurs for young waves . The relatively short and slowly propagating waves cannot absorb a high flux of energy from the wind. This flux is redistributed between many physical processes, first of all, the generation of drift current, small-scale turbulence, etc.
The tricolor curve in
Figure 14 is taken from [
62,
79] and shows a similar dependence of the inverse cascade flux associated with the wave growth. Green is related to young waves and follows the experimental data and parametric model of [
35]. The Toba law (red) of wave growth [
58] gives a saturation of the inverse cascade flux. The flux decay corresponds to the transition of wind-driven waves to the regime of sea swell (blue line) close to the classic regime of constant wave action flux [
78]. One should draw attention to the mismatch of maxima of fluxes of direct and inverse cascades. The maximum of the inverse cascade flux, i.e. the energy growth rate occurs for younger waves than the maximal direct cascade, i.e. maximal transfer of energy by waves to small-scale turbulence.
In our opinion,
Figure 14 represents the essential physics of wind-wave coupling for the experimental data. Our data are obtained in the near-shore and, thus, associated with rather complex dynamics. The comparison of
Figure 14 with a similar one obtained in a “simpler” environment is seen as a challenging problem of wave studies.
4. Discussion and Conclusions
The work considers experimental data of wave measurements in the north-east of the Black Sea. One should stress the uniqueness of these data. First, they cover a rather long period of about one year. Secondly, all the measurements were carried out at very short distances less than 1500 meters from the shoreline. Physical conditions where high-quality wave data were previously obtained at short fetches ([see e.g. [
29,
87]) differ dramatically from those of the North-Eastern Black Sea nearshore. The mountainous relief with a height of up to 550 meters and cliff on the coast modify the wind flow significantly. Both experimental points are set at a rather steep bottom slope surrounded by underwater cliffs. Additionally, harsh weather conditions of cold seasons also contribute to the uniqueness and complexity of the data analysis.
An apparent flaw of our experimental setup is the absence of on-site measurements of wind as it is very difficult and expensive to realize measurements in proximity to the chosen experimental points. In the study, we used the measurements of the Anapa weather station and the numerical model results in a distance of the experimental point. The correctness of such extrapolation requires special consideration. First, the wind field is not homogeneous in this area as is clearly seen from
Figure 3. At the same time, the dominant winds in the Anapa station are very close to the ones in the reanalysis point. An additional issue is a modification of the atmospheric boundary layer in the near-shore area. In other words, the wind-wave coupling is not fully characterized by wind speed. This is why we are trying to construct a consistent picture of wind-wave coupling based on different types of data and existing theoretical approaches.
Analysis of the directionality of the wave field showed the dominance of the mixed sea state. Dominant directions of wind and waves do not coincide (
Figure 3c,d). The south-western winds are very rare in the area while the waves of this direction in buoy data and reanalysis results predominate. These waves are associated rather with remote swell than with local wave transformation as seen from the reanalysis data (
Figure 3d). On the other hand, the pronounced off-shore winds do not generate visible waves from the coast. The effect of the coast shadowing may likely explain this effect. Unexpectedly, the shadowing (if our explanation is true) affects the wave in the reanalysis point almost 10 km offshore.
Conventional analysis of dimensionless dependencies of wave heights and periods gives us one more unexpected result: these dependencies follow rather well the previous experimental results [
66,
92,
93]. This coincidence becomes closer for wind speeds higher than 4 m/s and wave heights exceeding
meters. One should note that in the studies mentioned above the authors tried to achieve an idealized setup and to get rid of undesirable factors like the mixed sea state.
Difficulties of wind measurements in the near-shore motivated our attention to the theory of wave turbulence. This theory operates with fluxes of physical quantities when treating spectra of deep water waves. Wind speed appears, in a sense, a secondary physical parameter that is related to these fluxes in some way. An ambiguity of the link wind speed to energy flux has been demonstrated in our attempts to retrieve local wind speed from wave spectra measured by the buoy (see
Figure 13). This method has been recently used in [
85] in the Baltic Sea where experimental conditions better fit an idealized setup of wave growth.
We made a conceptual step in the application results of wave turbulence theory to experimental data. Energy fluxes have been estimated from the levels of equilibrium ranges of wave spectra. The wave spectra keep asymptotics
quite well in the range
peak frequencies and allow one to estimate the spectral flux of direct cascading of wave energy to small-scale turbulence. This flux is just a part of the energy flux to waves. This understanding motivates us to quantify the ratio of the wave spectral flux to the wind energy one. Despite the uncertainty of our measurements of wind speed we get a consistent illustration of the present-day knowledge of the “energy cycle” [see title [
62], and related works [
79,
88]] of the wind-driven sea.
Figure 14 shows the non-monotonical dependence of the fraction of turbulent wind energy coming to waves. The young waves get a relatively low fraction of wind energy because of the inability to effectively interact with relatively large-scale airflow. The old waves whose celerity significantly exceeds a characteristic wind speed are likewise can absorb just a small part of the turbulent wind energy flux.
The energy cycle analysis of other experimental data in the spirit of this study would be a good perspective.
Author Contributions
Conceptualization, S.B. and S.M.; methodology, S.B.; software, A.R., S.B. and S.M.; validation, S.M.; formal analysis, S.B. and A.R.; investigation, A.R. and S.B.; resources, A.R., S.B. and S.M.; data curation, S.M. and A.R.; writing—original draft preparation, A.R. and S.B.; writing—review and editing, A.R., S.B. and S.M.; visualization, A.R., S.B.; supervision, S.B.; project administration, S.B. and S.M. All authors have read and agreed to the published version of the manuscript.
Funding
Data collection and data processing were funded by Russian Foundation for Basic Research (RFBR) with project number 20–55–46007. The data analyse and interpretation were supported by Ministry of Science and Higher Education of the Russian Federation under the program FMWE-2022-0002.
Institutional Review Board Statement
Not applicable.
Informed Consent Statement
Not applicable.
Acknowledgments
The authors are thankful to the National Reserve Utrish team and especially to O.N. Bykhalova for help in organizing measurements.
Conflicts of Interest
The authors declare no conflict of interest.
References
- Sverdrup, H.V.; Munk, W.H. Wind, sea, and swell: Theory of relations for forecasting; Hydrographic Office Pub. 60, U.S. Navy, 1947.
- Li, L.; Haver, S.; Berlin, N. Assessment of operational limits: Effects of uncertainties in sea state description. Marine Structures 2021, 77, 102975. [Google Scholar] [CrossRef]
- Bonnefond, P.; Haines, B.; Watson, C. In situ Absolute Calibration and Validation: a link from coastal to open-ocean altimetry. In Coastal Altimetry; Vignudelli, S.; Kostianoy, A.; Cipollini, P.; Benveniste, J., Eds.; Springer, Berlin, Heidelberg, 2011; pp. 259–296. [CrossRef]
- Abdalla, S.; Abdeh Kolahchi, A.; Ablain, M.; Adusumilli, S.; Aich Bhowmick, S.; Alou-Font, E.; Amarouche, L.; Andersen, O.B.; Antich, H.; Aouf, L.; et al. Altimetry for the future: Building on 25 years of progress. Advances in Space Research 2021. [Google Scholar] [CrossRef]
- Gelci, R.; Cazalé, H.; Vassal, J. Prévision de la houle. La méthode des densités spectroangulaires. Bulletin d’information du Comité d’Océanographie et d’Etude des Côtes.
- Cavaleri, L.; Alves, J.H.G.M.; Ardhuin, F.; Babanin, A.; Banner, M.; Belibassakis, K.; Benoit, M.; Donelan, M.; Groeneweg, J.; Herbers, T.H.C.; et al. Wave modelling – the state of the art. Progr. Ocean. 2007, 75. [Google Scholar] [CrossRef]
- Hanson, J.L.; Phillips, O.M. Automated analysis of ocean surface directional wave spectra. J. Atmos. Ocean. Technol. 2001, 18, 277–293. [Google Scholar] [CrossRef]
- Munk, W.H.; Miller, G.R.; Snodgrass, F.E.; Barber, N.F. Directional Recording of Swell from Distant Storms. Phil. Trans. Roy. Soc. London 1963, 255, 505–584. [Google Scholar] [CrossRef] [PubMed]
- Official website of the Utrish Reserve. Available online: https://utrishgpz.ru/ (accessed on 12 12 2022).
- Rusu, L. Assessment of the wave energy in the Black Sea based on a 15-year hindcast with data assimilation. Energies 2015, 8, 10370–10388. [Google Scholar] [CrossRef]
- Akpınar, A.; Bingölbali, B. Long-term variations of wind and wave conditions in the coastal regions of the Black Sea. Natural Hazards 2016, 84, 69–92. [Google Scholar] [CrossRef]
- Myslenkov, S.; Shestakova, A.; Toropov, P. Numerical simulation of storm waves near the northeastern coast of the Black Sea. Russian Meteorology and Hydrology 2016, 41, 706–713. [Google Scholar] [CrossRef]
- Onea, F.; Rusu, L. A long-term assessment of the Black Sea wave climate. Sustainability 2017, 9, 1875. [Google Scholar] [CrossRef]
- Gippius, F.N.; Myslenkov, S.A. Black Sea wind wave climate with a focus on coastal regions. Ocean Engineering 2020, 218, 108–199. [Google Scholar] [CrossRef]
- Divinsky, B.V.; Fomin, V.V.; Kosyan, R.D.; Ratner, Y.D. Extreme wind waves in the Black Sea. Oceanologia 2020, 62, 23–30. [Google Scholar] [CrossRef]
- Divinsky, B.; Kuklev, S. Climate Variations of Certain Wave Parameters at the Inlet of Novorossiysk Bay. Oceanology 2022, 62, 155–161. [Google Scholar] [CrossRef]
- Melnikov, V.A.; Zatsepin, A.G.; Kostianoy. Hydrophysical polygon on the Black Sea. Trudy GOIN (Proceedings of Russian State Oceanographic Institute 2011, 213, 264–278. [Google Scholar]
- Evstigneev, V.; Naumova, V. ; E.N., V.; Evstigneev, M.P.and Ljubarec, E. Wind-wave climate over the coastal zone of the Azov and the Black seas, Ed.; Sevastopol: INTS, 2017; ISBN 978-5-6040795-0-8 EN. [Google Scholar]
- Melnikov, V.A.; Moskalenko, L.V.; Kuzevanova, N. Wind cycles and climatic trends of the Black Sea. Trudy GOIN (Proceedings of Russian State Oceanographic Institute 2018, 219, 101–123. [Google Scholar]
- Saprykina, Y.; Kuznetsov, S.; Valchev, N. Multidecadal fluctuations of storminess of black sea due to teleconnection patterns on the base of modelling and field wave data. Lecture Notes in Civil Engineering 2019, 22, 773–781. [Google Scholar]
- Badulin, S.I.; Vershinin, V.V.; Levchenko, D.G.; Zatsepin, A.G.; Ostrovskii, A.G.; Lobkovsky, L.I. A project of concrete stabilized spar buoy as a coastal environmental observation and maritime safety platform. J. Ocean Eng. Mar. Energy 2021, 7, 115–127. [Google Scholar] [CrossRef]
- Kos’yan, R.; Divinsky, B.; Pushkarev, O. Measurements of parameters of wave processes in the open sea near Gelendzhik. In Proceedings of the The Eight Workshop of NATO TU-WAVES/Black Sea. Middle East Technical University Ankara, Turkey; 1998; pp. 5–6. [Google Scholar]
- Yılmaz, N.; Özhan, E. Characteristics of the frequency spectra of wind-waves in Eastern Black Sea. Ocean Dynamics 2014, 64, 1419–1429. [Google Scholar] [CrossRef]
- Coastal dynamics. Available online: https://coastdyn.ru/toppage1.htm (accessed on 11 10 2022).
- Myslenkov, S.A.; Badulin, S.I.; Lopatukhin, L.; Arkhipkin, V.; Akpınar, A.; Bingölbali, B.; Soran, M.B. Quality assessment of wind wave spectra simulation in the Black Sea coastal zone. In Proceedings of the IX International Scientific and Practical Conference Marine Research and Education (MARESEDU-2020); 2020; pp. 258–261. [Google Scholar]
- Amarouche, K.; Akpınar, A.; Soran, M.B.; Myslenkov, S.; Majidi, A.G.; Kankal, M.; Arkhipkin, V. Spatial calibration of an unstructured SWAN model forced with CFSR and ERA5 winds for the Black and Azov Seas. Applied Ocean Research 2021, 117, 102962. [Google Scholar] [CrossRef]
- Rybalko, A.; Myslenkov, S. Seasonal variability of wave spectra based on simulation and measurement data in the Gelendzhik and Utrish region. In Proceedings of the X International Scientific and Practical Conference Marine Research and Education (MARESEDU-2021), Vol. 1; 2021; pp. 121–124. [Google Scholar]
- Amarouche, K.; Akpınar, A.; Rybalko, A.; Myslenkov, S. Assessment of SWAN and WAVEWATCH-III models regarding the directional wave spectra estimates based on Eastern Black Sea measurements. Ocean Engineering 2023, 272, 113944. [Google Scholar] [CrossRef]
- Baydakov, G.A.; Kandaurov, A.A.; Kuznetsova, A.M.; Sergeev, D.A.; Troitskaya, Y.I. Field Studies of Features of Wind Waves at Short Fetches. Bulletin of the Russian Academy of Sciences: Physics 2018, 82, 1431–1434. [Google Scholar] [CrossRef]
- Kuznetsova, A.M.; Dosaev, A.S.; Baydakov, G.A.; Sergeev, D.A.; Troitskaya, Y.I. Adaptation of the Parameterization of the Nonlinear Energy Transfer for Short Fetch Conditions in the WAVEWATCH III Wave Prediction Model. Izvestiya, Atmospheric and Oceanic Physics 2020, 56, 191–199. [Google Scholar] [CrossRef]
- Walsh, EJ; Hancock III, DW; Hines, DE; Swift, RN; Scott, JF Directional wave spectra measured with the surface contour radar Journal of physical oceanography 1985, 15, 566–592. 15.
- Mitsuyasu, H.; Nakamura, R.; Komori, T. Observations of the wind and waves in Hakata Bay. Report of the Research Institute for Applied Mechanics, Kyushu University 1971, 19, 37–74. [Google Scholar]
- Mitsuyasu, H.; Tasai, H.; Suhara, F.; Mizuno, T.; Honda, S.O.T.; Rikiishi, K. Observation of power spectrum of ocean waves using a clover-leaf buoy. J. Phys. Oceanogr. 1982, 10, 286–296. [Google Scholar] [CrossRef]
- Hasselmann, K.; Barnett, T.P.; Bouws, E.; Carlson, H.; Cartwright, D.E.; Enke, K.; Ewing, J.A.; Gienapp, H.; Hasselmann, D.E.; Kruseman, P.; et al. Measurements of wind-wave growth and swell decay during the Joint North Sea Wave Project (JONSWAP). Dtsch. Hydrogh. Zeitschr. Suppl. 1973, 12. [Google Scholar]
- Hasselmann, K.; Ross, D.B.; Müller, P.; Sell, W. A parametric wave prediction model. J. Phys. Oceanogr. 1976, 6, 200–228. [Google Scholar] [CrossRef]
- Badulin, S.I.; Pushkarev, A.N.; Resio, D.; Zakharov, V.E. Self-similarity of wind-driven seas. Nonl. Proc. Geophys. 2005, 12, 891–946. [Google Scholar] [CrossRef]
- Zakharov, V.E.; Badulin, S.I.; Hwang, P.A.; Caulliez, G. Universality of Sea Wave Growth and Its Physical Roots. J. Fluid Mech. 2015, 708, 503–535. [Google Scholar] [CrossRef]
- Kitaigorodskii, S.A. Applications of the theory of similarity to the analysis of wind-generated wave motion as a stochastic process. Bull. Acad. Sci. USSR, Geophys. Ser., Engl. Transl. 1962, N1, 73–80. [Google Scholar]
- Björkqvist, J.V.; Pettersson, H.; Drennan, W.M.; Kahma, K.K. A New Inverse Phase Speed Spectrum of Nonlinear Gravity Wind Waves. Journal of Geophysical Research: Oceans 2019, 124, 6097–6119. [Google Scholar] [CrossRef]
- Zakharov, V.E.; Badulin, S.I.; Geogjaev, V.V.; Pushkarev, A.N. Weak-Turbulent Theory of Wind-Driven Sea. Earth and Space Science 2019, 6. [Google Scholar] [CrossRef]
- Semenov, E.; Sokolikhina, N.; Sokolikhina, E. Meteorological and synoptic aspects of the formation and evolution of the Novorossiysk Bora. Russian Meteorology and Hydrology 2013, 38, 661–668. [Google Scholar] [CrossRef]
- Kuharev, I.L. Relief. In Proceedings of the Atlas of State Nature Reserve Utrish. Scientific prossessings. Anapa, Vol. 2; 2013; p. 24. [Google Scholar]
- Tkachenko, Y.; Denisov, V. Climate. In Proceedings of the Atlas of State Nature Reserve Utrish. Scientific prossessings. Anapa, Vol. 2; 2013; p. 32. [Google Scholar]
- Banner, M.L.; Jones, I.S.F.; Trinders, J.C. Wavenumber spectra of short gravity waves. J. Fluid Mech. 1989, 198, 321–344. [Google Scholar] [CrossRef]
- Veselov, V.; Pribylskaya, I.; Mirzeabasov, O. All-Russia Research Institute of Hydrometeorological Information - World Data Center (RIHMI-WDC), Roshydromet, 2023. http://aisori-m.meteo.ru/waisori/ Last accessed 2022-09-30.
- Saha, S.; Moorthi, S.; Wu, X.; Wang, J.; Nadiga, S.; Tripp, P.; Behringer, D.; Hou, Y.T.; Chuang, H.y.; Iredell, M.; et al. The NCEP climate forecast system version 2. Journal of climate 2014, 27, 2185–2208. [Google Scholar] [CrossRef]
- Tolman, H.; Abdolali, A.; Accensi, M.; Alves, J.H.; Ardhuin, F.; Babanin, A.; Barbariol, F.; Benetazzo, A.; Bidlot, J. User manual and system documentation of WAVEWATCH III (R) version 6.07. Technical Report 333, NOAA/NWS/NCEP/MMAB, 2019.
- Zieger, S.; Babanin, A.V.; Rogers, W.E.; Young, I.R. Observation-based source terms in the third-generation wave model WAVEWATCH. Ocean Modelling 2015, 96, 2–25. [Google Scholar] [CrossRef]
- Hasselmann, S.; Hasselmann, K.; Allender, J.H.; Barnett, T.P. Computations and parametrizations of the nonlinear energy transfer in a gravity-wave spectrum. Part II. Parameterizations of the nonlinear energy transfer for application in wave models. J. Phys. Oceanogr. 1985, 15, 1378–1391. [Google Scholar] [CrossRef]
- Zelenko, A.; Strukov, B.; Resnyansky, Y. ; S.L., M. A system of wind wave forecasting in the World ocean and seas of Russia. The State Oceanographic Institute`s Proceedings.
- Kirezci, C.; Ozyurt Tarakcıoglu, G. Validation of Wavewatch III Model in Black Sea Using Different Re-Analysis Wind Data. In Proceedings of the AGU Fall Meeting Abstracts, Vol. 2016; pp. 43–0336. [Google Scholar]
- Myslenkov, S.; Zelenko, A.; Resnyanskii, Y.; Arkhipkin, V.; Silvestrova, K. Quality of the wind wave forecast in the Black Sea including storm wave analysis. Sustainability 2021, 13, 13099. [Google Scholar] [CrossRef]
- Soran, M.B.; Amarouche, K.; Akpınar, A. Spatial calibration of WAVEWATCH III model against satellite observations using different input and dissipation parameterizations in the Black Sea. Ocean Engineering 2022, 257, 111627. [Google Scholar] [CrossRef]
- Hasselmann, K. On the nonlinear energy transfer in a gravity wave spectrum. Part 1. General theory. J. Fluid Mech. 1962, 12, 481–500. [Google Scholar] [CrossRef]
- Zakharov, V.E.; Filonenko, N.N. Energy spectrum for stochastic oscillations of the surface of a fluid. Soviet Phys. Dokl. 1966, 170, 1292–1295. [Google Scholar]
- Zakharov, V.E.; Zaslavsky, M.M. Shape of spectrum of energy carrying components of a water surface in the weak-turbulence theory of wind waves. Izv. Acad. Sc. USSR. Atm. Ocean. Phys. 1983, 19, 207–212. [Google Scholar]
- Pierson, W.J.; Moskowitz, L.A. A proposed spectral form for fully developed wind seas based on the similarity theory of S. A. Kitaigorodskii. J. Geophys. Res. 1964, 69, 5181–5190. [Google Scholar] [CrossRef]
- Toba, Y. Local balance in the air-sea boundary processes. Part I. On the growth process of wind waves. J. Oceanogr. Soc. Japan 1972, 28, 109–121. [Google Scholar] [CrossRef]
- Pushkarev, A.N.; Resio, D.; Zakharov, V.E. Weak turbulent approach to the wind-generated gravity sea waves. Phys. D: Nonlin. Phenom. 2003, 184, 29–63. [Google Scholar] [CrossRef]
- Badulin, S.I.; Babanin, A.V.; Resio, D.; Zakharov, V. Weakly turbulent laws of wind-wave growth. J. Fluid Mech. 2007, 591, 339–378. [Google Scholar] [CrossRef]
- Gagnaire-Renou, E.; Benoit, M.; Badulin, S.I. On weakly turbulent scaling of wind sea in simulations of fetch-limited growth. J. Fluid Mech. 2011, 669, 178–213. [Google Scholar] [CrossRef]
- Badulin, S.I. , Nonlinear waves-2018; Institute of Applied Physics, Russian Academy of Sciences; Nizhny Novgorod, 2019; collected papers ABC of wind-driven waves, pp. 121–141. in Russian.
- Phillips, O. The equilibrium range in the spectrum of wind-generated waves. J. Fluid Mech. 1958, 4, 426–434. [Google Scholar] [CrossRef]
- Toba, Y. Local balance in the air-sea boundary processes. III. On the spectrum of wind waves. J. Oceanogr. Soc. Japan 1973, 29, 209–220. [Google Scholar] [CrossRef]
- Forristall, G.Z. Measurements of a saturated range in ocean wave spectra. J. Geophys. Res. 1981, 86, 8075–8084. [Google Scholar] [CrossRef]
- Kahma, K.K. A study of the growth of the wave spectrum with fetch. J. Phys. Oceanogr. 1981, 11, 1503–1515. [Google Scholar] [CrossRef]
- Battjes, J.A.; Zitman, T.J.; Holthuijsen, L.H. A reanalysis of the spectra observed in JONSWAP. J. Phys. Oceanogr. 1987, 17, 1288–1295. [Google Scholar] [CrossRef]
- Donelan, M.A.; Hamilton, J.; Hui, W.H. Directional spectra of wind-generated waves. Phil. Trans. Roy. Soc. Lond. A 1985, 315, 509–562. [Google Scholar]
- Young, I.R. Wind Generated Ocean Waves; Elsevier, 1999.
- Phillips, O.M. Spectral and statistical properties of the equilibrium range in wind-generated gravity waves. J. Fluid Mech. 1985, 156, 505–531. [Google Scholar] [CrossRef]
- Zakharov, V.E.; Lvov, V.S.; Falkovich, G. Kolmogorov spectra of turbulence. Part I; Springer, Berlin, 1992.
- Zakharov, V.E. Statistical theory of gravity and capillary waves on the surface of a finite-depth fluid. Eur. J. Mech. B/Fluids 1999, 18, 327–344. [Google Scholar] [CrossRef]
- Zakharov, V.E. Energy balance in a wind-driven sea. Phys. Scr. 2010, T142, 014052. [Google Scholar] [CrossRef]
- Zakharov, V.E.; Badulin, S.I. On Energy Balance in Wind-Driven Seas. Doklady Earth Sciences 2011, 440, 1440–1444. [Google Scholar] [CrossRef]
- Kolmogorov, A.N. The local structure of turbulence in incompressible viscous fluid for very large Reynolds numbers. Proceedings of the USSR Academy of Sciences (Russian) 1941, 30, 299–303. [Google Scholar]
- Geogjaev, V.V.; Zakharov, V.E. Numerical and analytical calculations of the parameters of power-law spectra for deep water gravity waves. JETP Letters 2017, 106, 184–187. [Google Scholar] [CrossRef]
- Kats, A.V.; Kontorovich, V.M. Drift stationary solutions in the weak turbulence theory. JETP Letters 1971, 14, 265–267. [Google Scholar]
- Zakharov, V.E.; Zaslavsky, M.M. Dependence of wave parameters on the wind velocity, duration of its action and fetch in the weak-turbulence theory of water waves. Izv. Acad. Sc. USSR. Atm. Ocean. Phys. 1983, 19, 300–306. [Google Scholar]
- Badulin, S.I.; Geogdzhaev, V.V. Evaluation of wind wave growth parameters basing on spectral fluxes. Radiophysics and Quantum Electronics 2019, 61, 545–552. [Google Scholar] [CrossRef]
- Kahma, K.K.; Pettersson, H. Wave growth in a narrow fetch geometry. Global Atmos. Ocean Syst. 1994, 2, 253–263. [Google Scholar]
- Pettersson, H. Wave growth in a narrow bay. PhD thesis, University of Helsinki, 2004. [ISBN 951-53-2589-7 (Paperback) ISBN 952-10-1767-8 (PDF)].
- Toba, Y. Stochastic form of the growth of wind waves in a single-parameter representation with physical implementations. J. Phys. Oceanogr. 1978, 8, 494–507. [Google Scholar] [CrossRef]
- Kahma, K.K.; Calkoen, C.J. Reconciling discreapancies in the observed growth of wind-generated waves. J. Phys. Oceanogr. 1992, 22, 1389–1405. [Google Scholar] [CrossRef]
- Babanin, A.V.; Soloviev, Y.P. Field investigation of transformation of the wind wave frequency spectrum with fetch and the stage of development. J. Phys. Oceanogr. 1998, 28, 563–576. [Google Scholar] [CrossRef]
- Björkqvist1, J.V.; Alari, V. Real-time estimates of wind speed and direction from a small spherical wave buoy. In Proceedings of the The 4th workshop on Waves and Wave-Coupled Processes, 14.-16.2.2023, Uppsala, Sweden; 2023. [Google Scholar]
- D. T. Resio and C. E. Long and C. L. Vincent Equilibrium-range constant in wind-generated wave spectra J. Geophys. Res. 2004, 109. [CrossRef]
- C. Long and D. Resio Wind wave spectral observations in Currituck Sound, North Carolina J. Geophys. Res. 2007, 112. [CrossRef]
- Golitsyn, G.S. The Energy Cycle of Wind Waves on the Sea Surface. Izv. Atmos. Ocean. Phys. 2010, 46, 10–18. [Google Scholar] [CrossRef]
- Benilov, A.Y.; Kouznetsov, O.A.; Panin, G.N. On the analysis of wind wave-induced disturbances in the atmospheric turbulent surface layer. Boundary-Layer Meteorol. 1974, 6, 269–285. [Google Scholar] [CrossRef]
- I. R. Young Directional spectra of hurricane wind waves J. Geophys. Res. 2006, 111. [CrossRef]
- Badulin, S.I.; Grigorieva, V.G. On discriminating swell and wind-driven seas in Voluntary Observing Ship data. J. Geophys. Res. 2012, 117. [Google Scholar] [CrossRef]
- Kahma, K.K. On prediction of the fetch-limited wave spectrum in a steady wind. Finnish Marine Research 1986, 253, 52–78. [Google Scholar]
- Babanin, A.V.; Soloviev, Y.P. Variability of directional spectra of wind-generated waves, studied by means of wave staff arrays. Mar. Freshwater Res. 1998, 49, 89–101. [Google Scholar] [CrossRef]
Figure 1.
The research area. (a) The general features of the study area and its location within the Black Sea boundaries. (b) The bathymetry at the buoy location. S1 and S2 are the buoy locations at different experiment stages (see Materials and Methods section).
Figure 1.
The research area. (a) The general features of the study area and its location within the Black Sea boundaries. (b) The bathymetry at the buoy location. S1 and S2 are the buoy locations at different experiment stages (see Materials and Methods section).
Figure 2.
Buoy time series. Height (a) and zero-crossing period (b) recorded by the buoy. The vertical line shows the beginning of the stage II).
Figure 2.
Buoy time series. Height (a) and zero-crossing period (b) recorded by the buoy. The vertical line shows the beginning of the stage II).
Figure 3.
Wind and wave directions. (a) Wind speed and direction at the Anapa station. (b) Wind speed and direction according to reanalysis data. (c) Buoy wave heights and directions. (d) Reanalysis wave heights and directions.
Figure 3.
Wind and wave directions. (a) Wind speed and direction at the Anapa station. (b) Wind speed and direction according to reanalysis data. (c) Buoy wave heights and directions. (d) Reanalysis wave heights and directions.
Figure 4.
Wind directions from the Anapa station and reanalysis. Left – stage I, right – stage II. (a,b) Comparison of all data with m. (c,d) Comparison for winds higher than 4 m/s.
Figure 4.
Wind directions from the Anapa station and reanalysis. Left – stage I, right – stage II. (a,b) Comparison of all data with m. (c,d) Comparison for winds higher than 4 m/s.
Figure 5.
Wind directions from the Anapa station vs buoy wave directions. (a,b) Spectral peak wave direction. (c,d) Mean-over-spectrum direction. (e,f) Spectral peak wave direction for winds higher than 4 m/s. (g,h) Mean-over-spectrum direction for winds higher than 4 m/s. Left – stage I, right – stage II. Circles in panel (a) illustrate possible sequence of wave system conversion: 1) purely wind-driven waves generated along a dominating wind direction (close to the diagonal of the scatter plot); 2) swell as a possible result of the wind-driven system after a switching wind direction.
Figure 6.
Wind directions given by reanalysis vs buoy wave directions. Left – stage I, right – stage II. (a,b) Mean wave directions for all data. (c,d) Wave spectral peak directions for all data. (e,f) Mean wave direction for winds higher than 4 m/s. (g,h) Wave spectral peak directions for winds higher than 4 m/s.
Figure 7.
(a) Spectral component directions vs spread from buoy data. (b) Peak wave directions measured by buoy vs reanalysis data.
Figure 7.
(a) Spectral component directions vs spread from buoy data. (b) Peak wave directions measured by buoy vs reanalysis data.
Figure 8.
Comparison of wave heights (a,b) and periods (c,d). Left – stages I, right - stage II.
Figure 8.
Comparison of wave heights (a,b) and periods (c,d). Left – stages I, right - stage II.
Figure 9.
Wave age vs pseudo-age, m, no wind speed restrictions. Left column – stage I, right – stage II.(a,b) Buoy measurements with the wind speed scaling from Anapa station. (c,d) Buoy measurements with the wind speed scaling from reanalysis data. (e,f) Reanalysis data.
Figure 9.
Wave age vs pseudo-age, m, no wind speed restrictions. Left column – stage I, right – stage II.(a,b) Buoy measurements with the wind speed scaling from Anapa station. (c,d) Buoy measurements with the wind speed scaling from reanalysis data. (e,f) Reanalysis data.
Figure 10.
Wave age vs pseudo-age, m, wind speed m/s. Left column – stage I, right – stage II. (a,b) Buoy measurements with the wind speed scaling from Anapa station. (c,d) Buoy measurements with the wind speed scaling from reanalysis data. (e,f) Reanalysis data.
Figure 10.
Wave age vs pseudo-age, m, wind speed m/s. Left column – stage I, right – stage II. (a,b) Buoy measurements with the wind speed scaling from Anapa station. (c,d) Buoy measurements with the wind speed scaling from reanalysis data. (e,f) Reanalysis data.
Figure 11.
Period of measurements 01/02/2020 11:43:00 – 01/02/2020 16:13:00 (
m). (
a) Buoy frequency spectra
. (
b) Bottom panel – compensated dimensionless spectra with the reanalysis wind scaling
, horizontal line corresponds to estimates of
of Björkqvist et al. [
39], see, e.g..
Figure 11.
Period of measurements 01/02/2020 11:43:00 – 01/02/2020 16:13:00 (
m). (
a) Buoy frequency spectra
. (
b) Bottom panel – compensated dimensionless spectra with the reanalysis wind scaling
, horizontal line corresponds to estimates of
of Björkqvist et al. [
39], see, e.g..
Figure 12.
Period of measurements 03/06/2021 19:44:00 – 04/06/2021 00:14:00 (
m).(
b) Buoy frequency spectra
. (
b) Compensated dimensionless spectra with the reanalysis wind scaling
, horizontal line corresponds to estimates of
of Björkqvist et al. [
39], see, e.g..
Figure 12.
Period of measurements 03/06/2021 19:44:00 – 04/06/2021 00:14:00 (
m).(
b) Buoy frequency spectra
. (
b) Compensated dimensionless spectra with the reanalysis wind scaling
, horizontal line corresponds to estimates of
of Björkqvist et al. [
39], see, e.g..
Figure 13.
Scatter density plot (normalized by the distribution maximum) of the reanalysis wind speed vs the retrieved one.
Figure 13.
Scatter density plot (normalized by the distribution maximum) of the reanalysis wind speed vs the retrieved one.
Figure 14.
The probability density of data as function of wave age
and ratio
(in per cent). Tricolor curve is dependence of inverse cascade energy flux on wave age from [
62,
79])
Figure 14.
The probability density of data as function of wave age
and ratio
(in per cent). Tricolor curve is dependence of inverse cascade energy flux on wave age from [
62,
79])
Table 1.
General information about buoy locations and received data.
Table 1.
General information about buoy locations and received data.
| Stage |
Coord. |
Depth, m |
Fetch, m |
Dates |
Data type |
Number of records |
| 1 |
44.7191N, 37.4343E |
18 |
600 |
31.01.2020 - 21.02.2020;
17.07.2020 - 2.10.2020;
27.10.20 - 18.02.2021 |
wave height, , spectra |
11 143 |
| 2 |
44.716N, 37.428E |
42 |
1500 |
15.03.2021 - 17.06.2021 |
wave height, , spectra |
4 569 |
Table 2.
Buoy specifications.
Table 2.
Buoy specifications.
| Wave motion sensor |
Precision |
1-2 cm, all directions (1) |
| |
Periods |
1.6 s -20 s |
| Wave data |
Resolution |
1 cm (north 2 cm, LSB “north” is GPS data gap indicator) |
| |
Range |
–20 m - +20 m |
| |
Rate |
1.28 Hz |
| |
Reference |
WGS84 |
| Spectral data |
Frequency resolution |
0.005 Hz below 0.10 Hz and 0.010 Hz above Frequency range 0.025 Hz - 0.60 Hz |
| |
Direction resolution |
|
| |
Direction range |
|
|
Disclaimer/Publisher’s Note: The statements, opinions and data contained in all publications are solely those of the individual author(s) and contributor(s) and not of MDPI and/or the editor(s). MDPI and/or the editor(s) disclaim responsibility for any injury to people or property resulting from any ideas, methods, instructions or products referred to in the content. |
© 2023 by the authors. Licensee MDPI, Basel, Switzerland. This article is an open access article distributed under the terms and conditions of the Creative Commons Attribution (CC BY) license (http://creativecommons.org/licenses/by/4.0/).

