1. Introduction
Cancer remains the world's primary cause of death, despite continuous therapeutic advances, making it a major public health issue with devastating societal consequences (Perthame, 2016 and Zhang et al., 2022). From what can be gleaned from the databases of the World Health Organization (WHO) and the United Nations (UN), it is clear that cancer is currently, and is likely to remain, one of the top causes of mortality around the world. Cancer ranks high on the list of global killers and causes a great deal of suffering. Annually, it's responsible for the deaths of around six million individuals. In light of this, it is clear why efforts toward cancer prevention, treatment, and discovery are so vital (Kolev and Zubik-Kowal, 2010). The anticipated 18.1 million new cases and 9.6 million deaths from cancer worldwide in 2018 demonstrate the continued escalation in this disease's global burden. It's putting a major burden on healthcare systems and populations worldwide. WHO's Global Cancer Observatory projects that ten million people will lose their lives to cancer in 2020, up from nine million in 2018, and that number will climb to over sixteen and a half million by 2040 if preventative measures aren't implemented (WHO, 2020 & 2018, Roose et al, 2007).
Some of the biggest obstacles to a comprehensive understanding of cancer development and treatment are metastatic colonization, dormancy, relapse, multiple drug therapy, immune resistance, and the use of mathematical models and simulations to predict the course of the disease and the optimal treatment. What makes this phenomenon so difficult to understand is that cancer is an ancient disease that appears to be inherent to the complexity of creatures produced by evolution, in contrast to viral infections, which only became major killers with the rise of vast societies a few hundred years ago (Perthame, 2016).
Cancer is a disease characterized by a series of evolutionary steps at the somatic level, including tumour initiation, development, dissemination, immune evasion, and the emergence and maintenance of drug resistance. The evolutionary history of a tumour can be deduced from molecular data, and evolutionary theory can be used to examine the dynamics of tumour cell populations. The promise of several approaches to modeling cancer's development has been recently assessed. They include the phylogenetic approaches to modeling the evolutionary relationship between tumor subclones and the probabilistic graphical models for characterizing dependencies among mutations, as well as models of tumour onset and progression based on the dynamics of the population. Understanding the genesis of tumours, as well as the likely course of a disease and the effectiveness of treatments like targeted therapy, can be greatly aided by evolutionary modeling. Hence, the multistep theory is incorporated into the population dynamics models. Tumour phylogenetic tree, single-cell approach, hybrid models, and stochastic models are some of the phylogenetic approaches (Beerenwinkel, Schwarz, Gerstung and Markowetz 2015).
In order to deal with the difficulties associated with tumour growth, Perthame (2016) provides some invasion models. First, there are models of interplanetary invasion based on the Reaction-Diffusion Equations. Considered alongside constrained expansion and dispersal via diffusion, it depicts the spread of an infectious disease, the arrival of a new species (with no natural enemies), a combustion wave, or a new way of thinking. Second, the Fisher-KPP model is suggested to model the spatiotemporal development of a tumour under chemotherapeutic influence.
In order to tackle the many difficulties associated with tumour development, several models based on Ordinary Differential Equations (ODEs) have been presented. Two species, one predator and one prey, interacting in a biological system is the focus of several theoretical frameworks, such as the Lotka-Volterra model. cells that are both active and dormant, or P-Q, Model; According to the NCI's Dictionary of Cancer Terminology, cell proliferation refers to the increase in cell population that occurs as a result of normal cellular processes including growth and division. An absence of proliferation that is both transitory and reversible characterizes a state called quiescence. To wit. When it comes to describing and analyzing the immune response to cancer growth, the ODEs models are invaluable tools (Fornier & Sagot, 2011).
Tumour growth models have been demonstrated to be an essential tool in the development of an engineering foundation for cancer therapy through the use of therapeutic procedure design coupled with control engineering or the use of the models for simulation and assessment of treatment processes. This work further demonstrates the usefulness of mathematical modeling in describing tumour formation, a process of great complexity, by highlighting the characteristics and physiological processes of the tumours. For this reason, they built a partial differential equation-based mathematical model for tumour growth and presented its results in their study. In this model, the densities of proliferative, quiescent, necrotic, and surrounding cells are described together with the flow of nutrients using a deterministic model of an avascular tumour growth framed in a system of nonlinear coupled PDEs (Akhtar et al., 2021).
This paper is organized as follows. First, the background to the study is described in section1. Then, the governing mathematical principles and equations are given in section , model formulation and applications are presented in section , results and discussion on results is provided in section 4, summary and conclusion in section , and recommendations in section .
2. Background
The mechanisms involved in the evolution of cancer are extremely intricate and dynamic. Due to its enormous complexity, cancer has become a very effective human killer in modern times by hindering early identification and treatment. The numerous methods and approaches used to treat cancer aim to stop the disease's spread at different phases (such as immortalization or unending cell development, transformation, and metastasis). Yet, the bigger achievements in science and medicine have not yet connected all the dots, leaving us without an apparent solution at this time. We are still unable to develop a vaccine or an effective anti-cancer medicine since we still don't fully understand how cancer develops and manifests (Fornier & Sagot, 2011).
One such area that pertains to the cutting-edge study of cancer growth and treatment is mathematical modeling. The goal of developing mathematical models of cancer is to forecast tumour growth and treatment options. A highly associative topic, mathematical modeling integrates the real-world issue with multiple simulative models built using mathematical techniques.
There is still tremendous space for improvement in cancer therapy, despite the fact that it has been more effective for many tumours in recent years. Knowing the basics of how tumour cells invade can help doctors prescribe treatments and preventative measures for cancer. This cancer invasion process can be mathematically described as a system (or systems) of differential equations, which, when solved, will essentially offer a useful contribution to solving the cancer problem. In order to maximize the cancer problem, mathematical oncology will be employed to deliver an integrated solution without the need for clinical trials and experimentation. Therefore, there will be need to determine integrable theoretical solution to the dynamics of cancer invasion in reference to density of tumour cells, turbulence and motility of tumour cells and to determine the equilibrium between charge and discharge of tumour cells. (Socolofsky, S. A. and Jirka.G.H., 2002).
2.1. Governing Equations and Theories
This section discusses the equations that govern the growth rate, concentration and invasion of cancer cells with reference to its density, growth rate, degradation, renewal, mobility and concentration in the tumour. Since this is a two-dimensional problem, the equations are presented along the horizontal and vertical axes. The following universal laws form the basis for the general equations in the dynamics of cancer cells: The equations of diffusion and concentration, as well as the Cahn-Hilliard equation. In order to facilitate their incorporation into the aforementioned computer code, these essential equations are presented in Cartesian form.
It is not possible to get analytical solutions to the equations driving cancer invasion and tumour growth since they are extremely non-linear PDEs. The Navier-Stokes equations are used to characterize the dynamics of fluids. Hence, the Navier-Stokes equations are used to model the flow of fluids, such as the weather, ocean currents, water flow in a pipe, and air flow over a wing. Its use as models extends to other fields, such as the analysis of pollutants, the development of power plants, and the research of blood flow. These equations include the following;
2.1.1. Continuity Equation
The continuity equation in 3-D is given as
Along with a mathematical definition of the relevant process, the equation for conservation of mass (or continuity equation) can be used to derive a differential equation describing the movement of cancer cells (Sarah, 2011 & Elaine, 2009). The conservation equation (2.1) can be examined under two distinct circumstances. The first scenario is satisfied when the charging and discharging rates of the cancer cells are equal. The second scenario involves investigating what occurs when the charging and discharging rates of cancer cells are different. The first condition will be considered in this study to develop the dynamics of cancer cells in human body.
2.1.2. Momentum Equation
According to the principle of momentum conservation in fluid dynamics, the momentum of a closed system does not change. The momentum equation, a form of Newton's Second Law, describes the relationship between the total force acting on an element and the rate of change in that element's momentum or acceleration. These partial differential equations (PDEs) provide the incompressible version of the Navier-Stokes equations. The Navier-Stokes equation in
x-direction is given as
The Navier-Stokes equation in y-direction is given as
2.1.3. Concentration Equation
In fluid mechanics, the concentration equation (derived from the scalar transport equation) describes how material is transported (and, thus, mixed) from a continuum viewpoint. In this equation, material (with concentration is passively carried by a velocity field while simultaneously undergoing diffusion (where is the diffusion coefficient). In contrast to the Navier-Stokes equations, the velocity field is known, and with the given initial condition, the evolution of the concentration can be determined for all time. The application of the concentration equation to physical systems can shed light onto how these systems diffuse for different parameters.
The net movement of the cancer cells in
and
respectively are
Thus, the total flux in the
and
directions are
and
, respectively including the advective transport and a Fickian diffusion term, we obtain
Where is the given divergence-free advective velocity vector field, is time and is the fluid concentration levels in mixing process, is the concentration of cancer cells and is the diffusion coefficient.
2.1.4. Energy Equation
Energy can neither be created nor be destroyed; can only change physical form. Energy equation can be written in many different ways, such as the one given below
2.1.5. Cahn–Hilliard Equation
The original governing equations for the tumour growth in Wise
et al., (2008
), are the Cahn–Hilliard equation
where, mobility
.
The diffuse interface model of Wise et al., (2008) is reformulated using the conservative second-order AC equation with a space–time dependent Lagrange multiplier in Equation (2.11).
The diffuse interface model of Wise et al (2008
), involves the second-order
CH equation with a source term. The proposed model consists of the following three equations
3. Mathematical Formulation
The final model of this study was solved numerically in two dimensions. With the help of the finite difference approximations, spatial discretization was conducted on the model equations, reducing them to a set of (time-dependent) partial differential equations that were solved with the help of the central difference formulas.
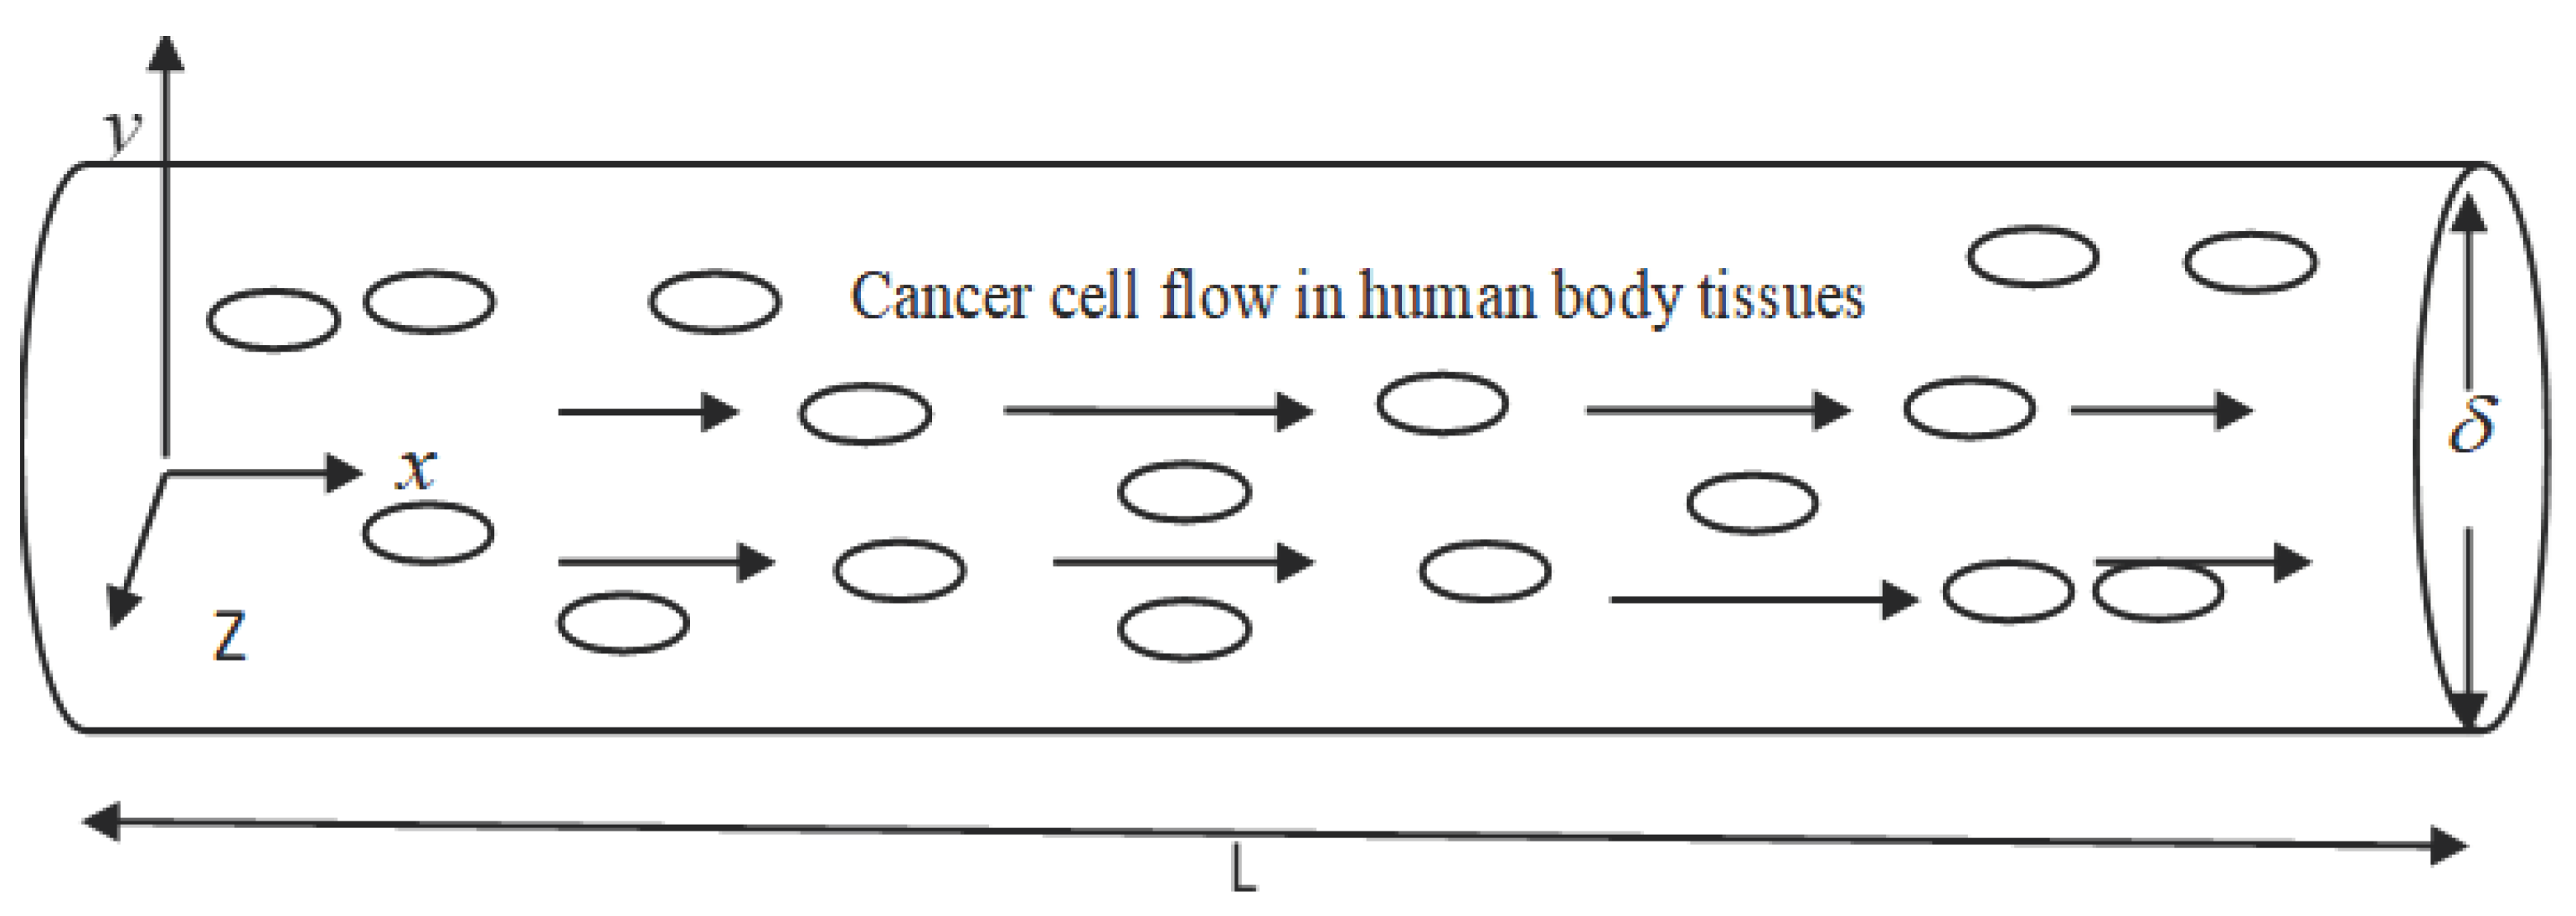
In
Figure 3.1,
x is the horizontal coordinate and
y is the vertical coordinate. The flowing layer depth is
, and the length of the tissue under consideration is
.
There is a cylinder-shaped flow chamber. Cancer cells, which are seen as small, circular particles, and blood, which is depicted as the fluid represented by the arrow, enter the chamber and become well mixed. A current of fluid is moving through the chamber. Arteries, veins, and capillaries are the blood vessels (tubes) via which blood travels throughout the body. The cardiovascular system functions like this. It is used to transport gases such as oxygen, carbon dioxide, and others. The presence of blood supply is crucial in the metastatic process. Some cancer cells are able to leave the main tumour and enter the bloodstream by squeezing through tiny crevices in the walls of blood vessels. Modern cancer cells in the circulation are able to adhere to the walls of blood vessels, creating microscopic channels through which they can inject genetic information that changes the endothelial cells lining the blood vessels, making them far more friendly to other cancer cells.
In nature, transport occurs in fluids through the combination of advection and diffusion. It is therefore necessary to mathematically incorporates advection equation into concentration equation.
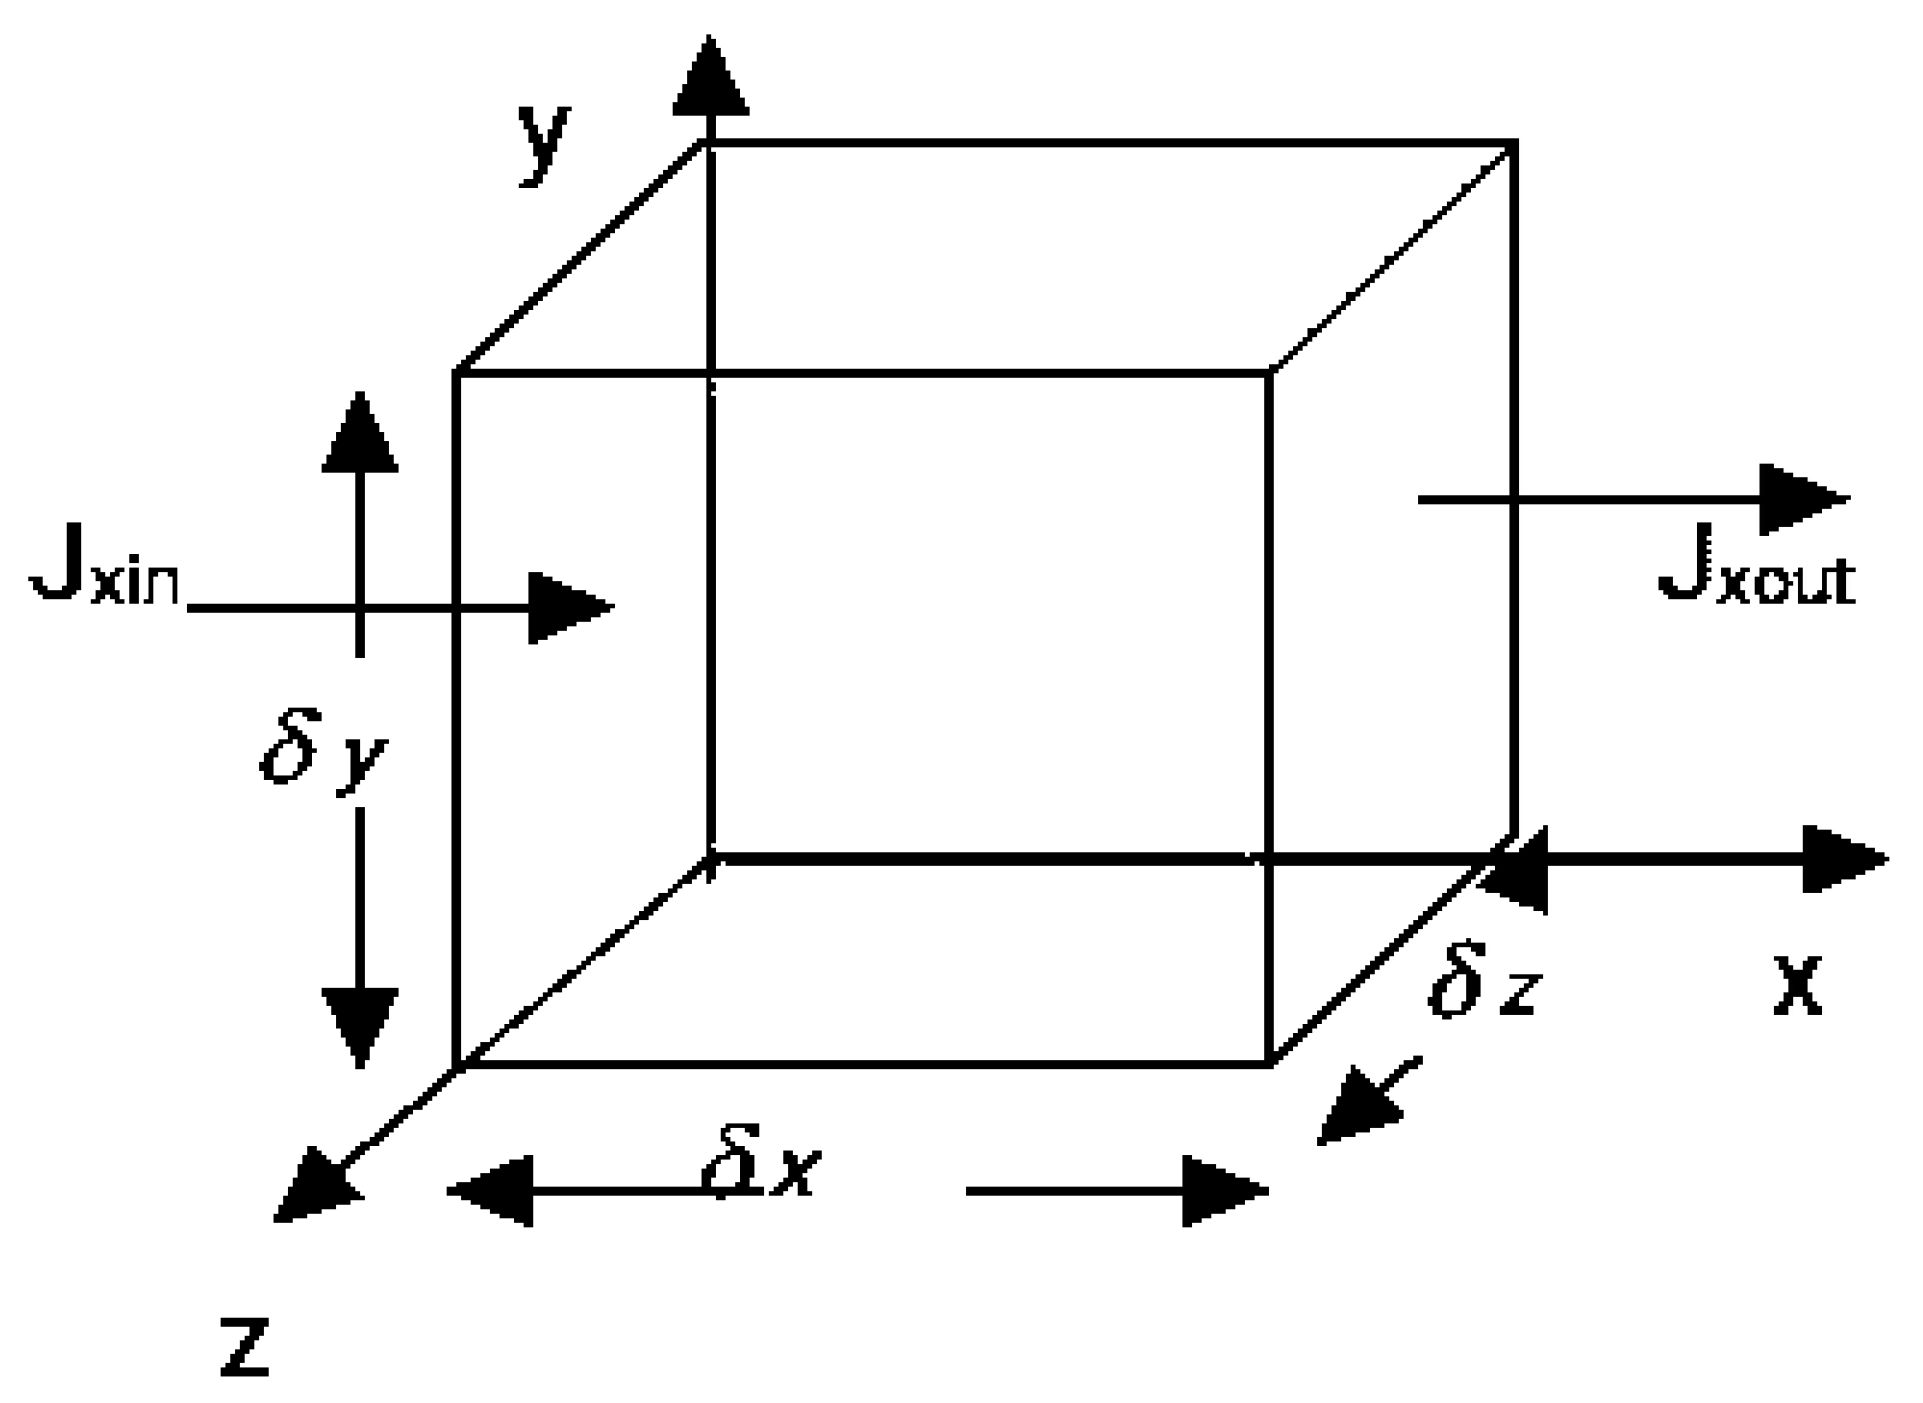
Figure 3.2.
Schematic diagram of a control volume with cross flow.
Figure 3.2.
Schematic diagram of a control volume with cross flow.
The concentration equation is derived using the principle of superposition, which states that linearly independent processes such as advection and diffusion can be put together. Each cancer cell, over the course of time, will diffuse to the left or right by a single step. Due to diffusion, each cancer cells in time will move either one step to the left or one step to the right ( ±). Due to advection, each cancer cells will also move in the cross-flow direction. The crossflow does not affect whether or not cancer cells diffuse to the right or left. However, its presence only amplifies the effect of the original process.
3.4. Methods of Solution
The Finite Difference Technique was used for this research. Cahn-Hilliard, diffusion, and concentration equations are solved by means of two numerical schemes: a central Crank-Nicolson scheme and a central Difference scheme. By discretizing the supplied equation and developing numerical techniques analogous to the equations, the approaches obtain a finite system of linear or nonlinear algebraic equations from the Partial Differential Equations. Using the specified boundary conditions in mind, we solve the equations using MATLAB software.
3.4.1. Central Difference Scheme
The Central Difference scheme is a finite difference method used to get numerical solutions to a differential equation in applied mathematics by optimizing the approximation for the differential operator at the center of the patch under discussion. Its benefits include a quicker convergence rate than other finite differencing methods like the forward and backward differencing methods, as well as being straightforward to comprehend and apply at least for simple material relations.
3.4.2. Crank Nicolson Scheme
In a central Crank Nicolson scheme, the temporal variable is replaced by forward difference scheme: is replaced by central difference scheme while is by the average of central difference approximation at th and ()th level.
3.5. Dimensionalizing Tumour Concentration Equation
The focus is to solve the concentration equation for tumour concentration
. In dimensionless variables, the governing equation, Landau and Lifshitz (1959) is:
where
and
are the given divergence-free advective velocity vector fields along
and
directions respectively,
is time and
is the tumour concentration levels in human body tissues.
But the Peclet number is given by
Pe is the Peclet number, where is an axial velocity, is arterial length, and is the diffusivity of the tumour cells.
Substituting (3.2) into (3.1) gives
3.6 Discretization of Concentration Equation
The partial differential equation for concentration was discretized to form a central Crank Nicolson scheme which was eventually solved using the finite difference method. In application, equation (3.3) is discretized to study the effects of Peclet number for tumour concentration levels. Using a central difference numerical scheme, is replaced by forward difference scheme while is the average of central difference approximation at th and th level, and is replaced by central difference approximation. When these approximations are substituted into equation (3.3), and taking , the second derivative in concentration equation at node could be represented as follows:
The effect of Pe number was investigated on the tumour concentration levels. Taking
, and
,
and multiplying by
throughout equation (3.4) and re-arranging, the scheme below is obtained
Taking
, and
,
and
results to central difference scheme below
The above central difference scheme can be in form of six algebraic equations when i = 1, 2, …,6 with j = 1 and n = 0 as
the following initial and boundary conditions were applied to equation (3.7)
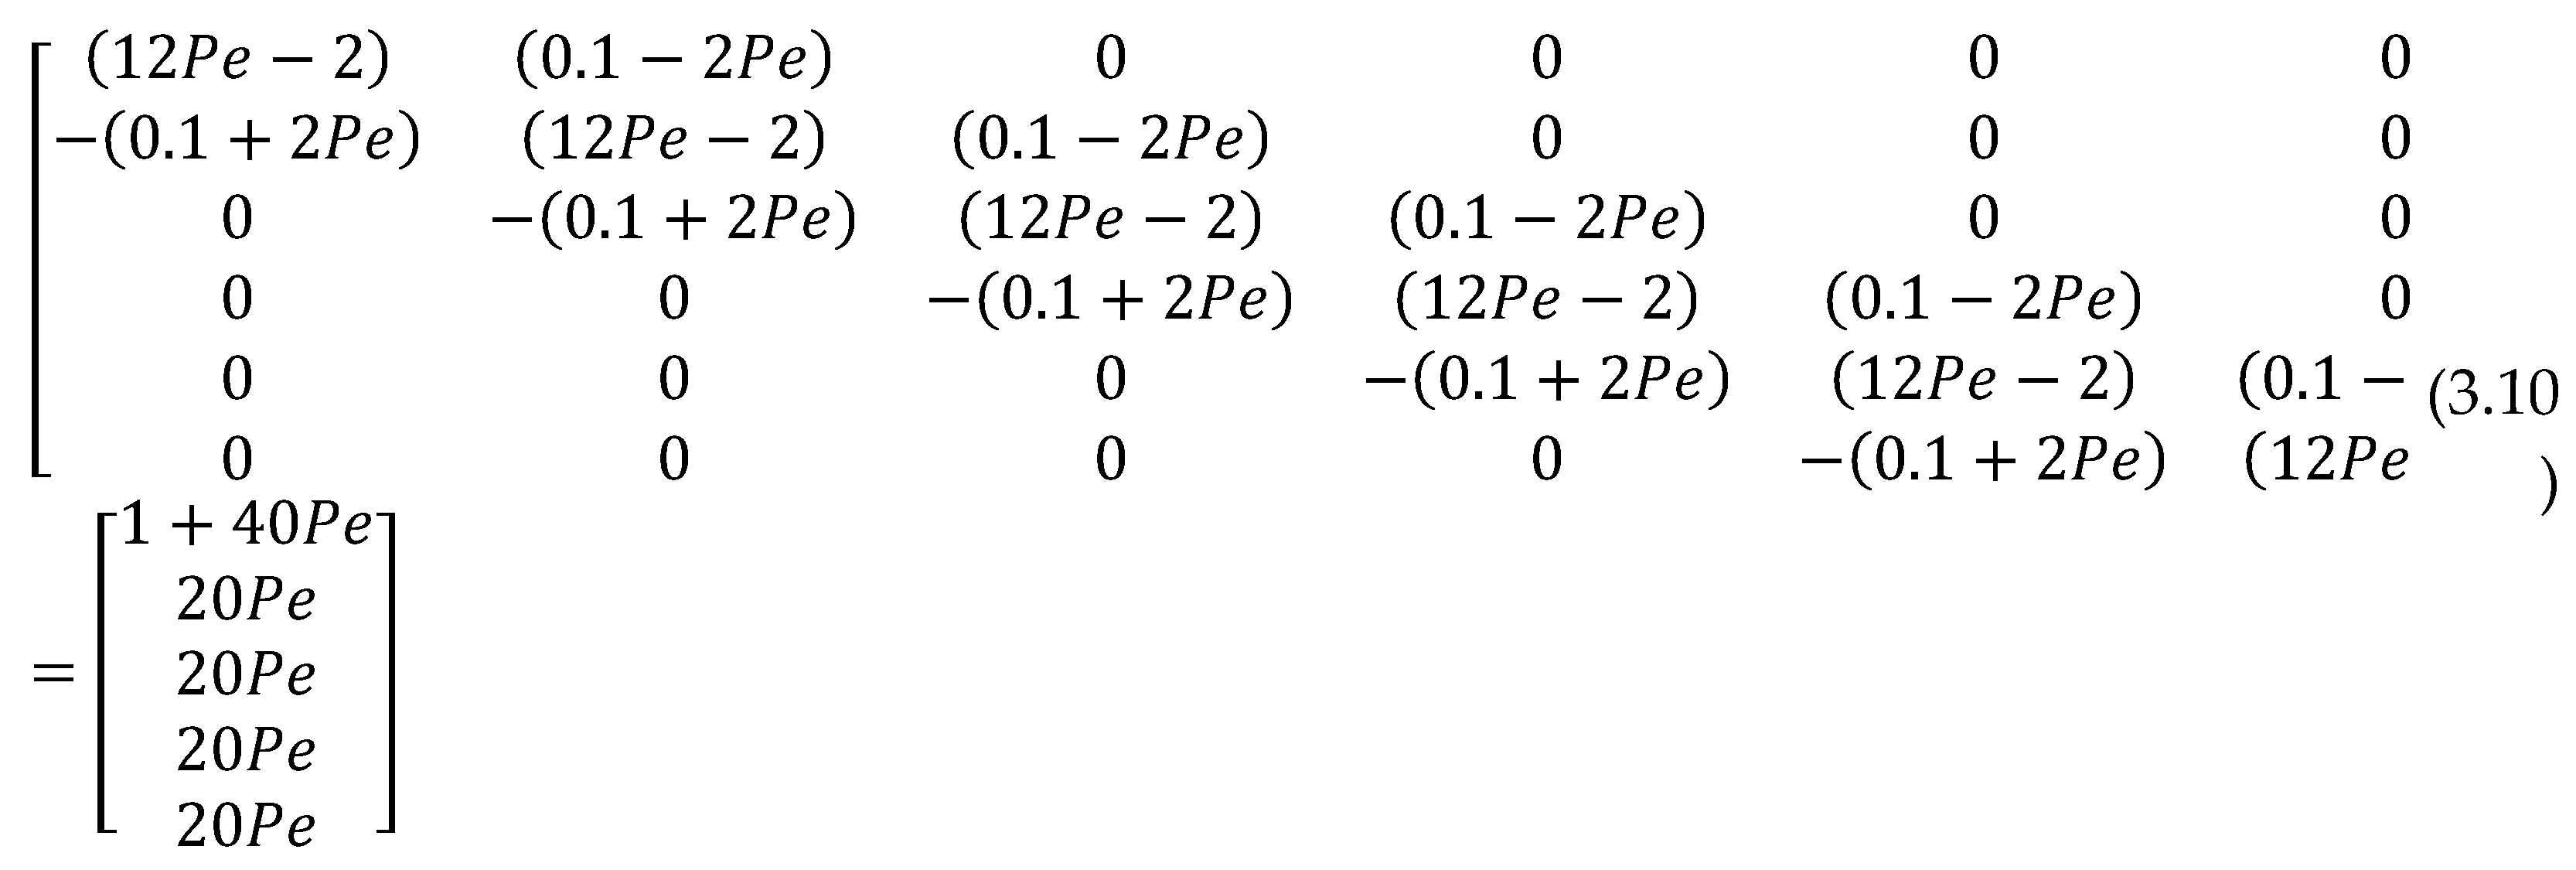
The above algebraic equations in (3.7) can be written in matrix form as
Solving the matrix system (3.10) using MATLAB, solutions were obtained for varying values of Pe. The results were provided in table 4.3.
3.7. Discretization of Cahn-Hilliard Model
Equation (3.10) was discretized to study the effects of mobility
, and density
, of tumour cells. Using a central difference numerical scheme,
was replaced by forward difference scheme.
was considered the average of central difference approximation at
th and
th level, and
was replaced by central difference approximation. These approximations were substituted into equation (3.11). Letting the superscript
indicate the time (temporal variable) while the subscript
and
indicate the spatial variable
and
, discretization of equation (2.10) gives
Similarly, in three dimension the subscript
and
indicate the spatial variable
and
.
Taking constant values of
and
so that
and multiplying by 2
with square mesh for variables
yields
Taking the mesh sizes
But if ,,
Equation (3.15) becomes
multiplying both sides of equation (3.16) by 100 gives
Putting the
level on LHS of equation (3.17) yields
Taking
, …,
,
we get the algebraic equations
Taking the initial , and boundary conditions, , the above system of algebraic equations become
Solving the above matrix equation, the solutions for varying values of
and M were obtained and provided in
table 4.1 and
4.2.
3.9. Reaction-diffusion Equation
A more involved reaction-diffusion model was taken into account, the so-called Cahn-Hilliard model which emphasizes the mutually beneficial relationships between ECM and cancer tumour and metastatic capacities of cancer cells. More elaborate extensions of the model were explored and its various forms, including additional terms related to tumour cell proliferation, ECM renewal, and alternative functions representing tumour cell MDE generation. This study focused to uncover how cancer cells are able to create and secrete the MDE, which in turn degrades the ECM and initiates migration of the cells towards healthy regions of the tissue. The model was given as
3.10. 1Discretization of Reaction-Diffusion Equation
Simplifying equation (3.24) gives
In order for us to solve the system (3.25), we impose some initial conditions to get the algebraic equations below
Taking the initial
and boundary conditions,
, the above system of algebraic equation becomes
Solving the matrix equation (3.27), the solutions for varying values of
and
obtained and provided in
table 4.3 and
4.4.
4. Results and Discussions
The simulation results given focus on the effects of the mobility, M, tumour density,,and Peclet number, Pe, Extracellular Matrix,and Matrix degradation Enzymes, on tumour growth rate, tumour cells concentration and tumour invasion, respectively.
4.1. Effects of Cell Density on Tumour Growth Rate
Equation (3.27) was solved in MATLAB and to obtain the results of the effects of
on tumour growth rate when we hold M constant and get results as shown in
table 4.1 below
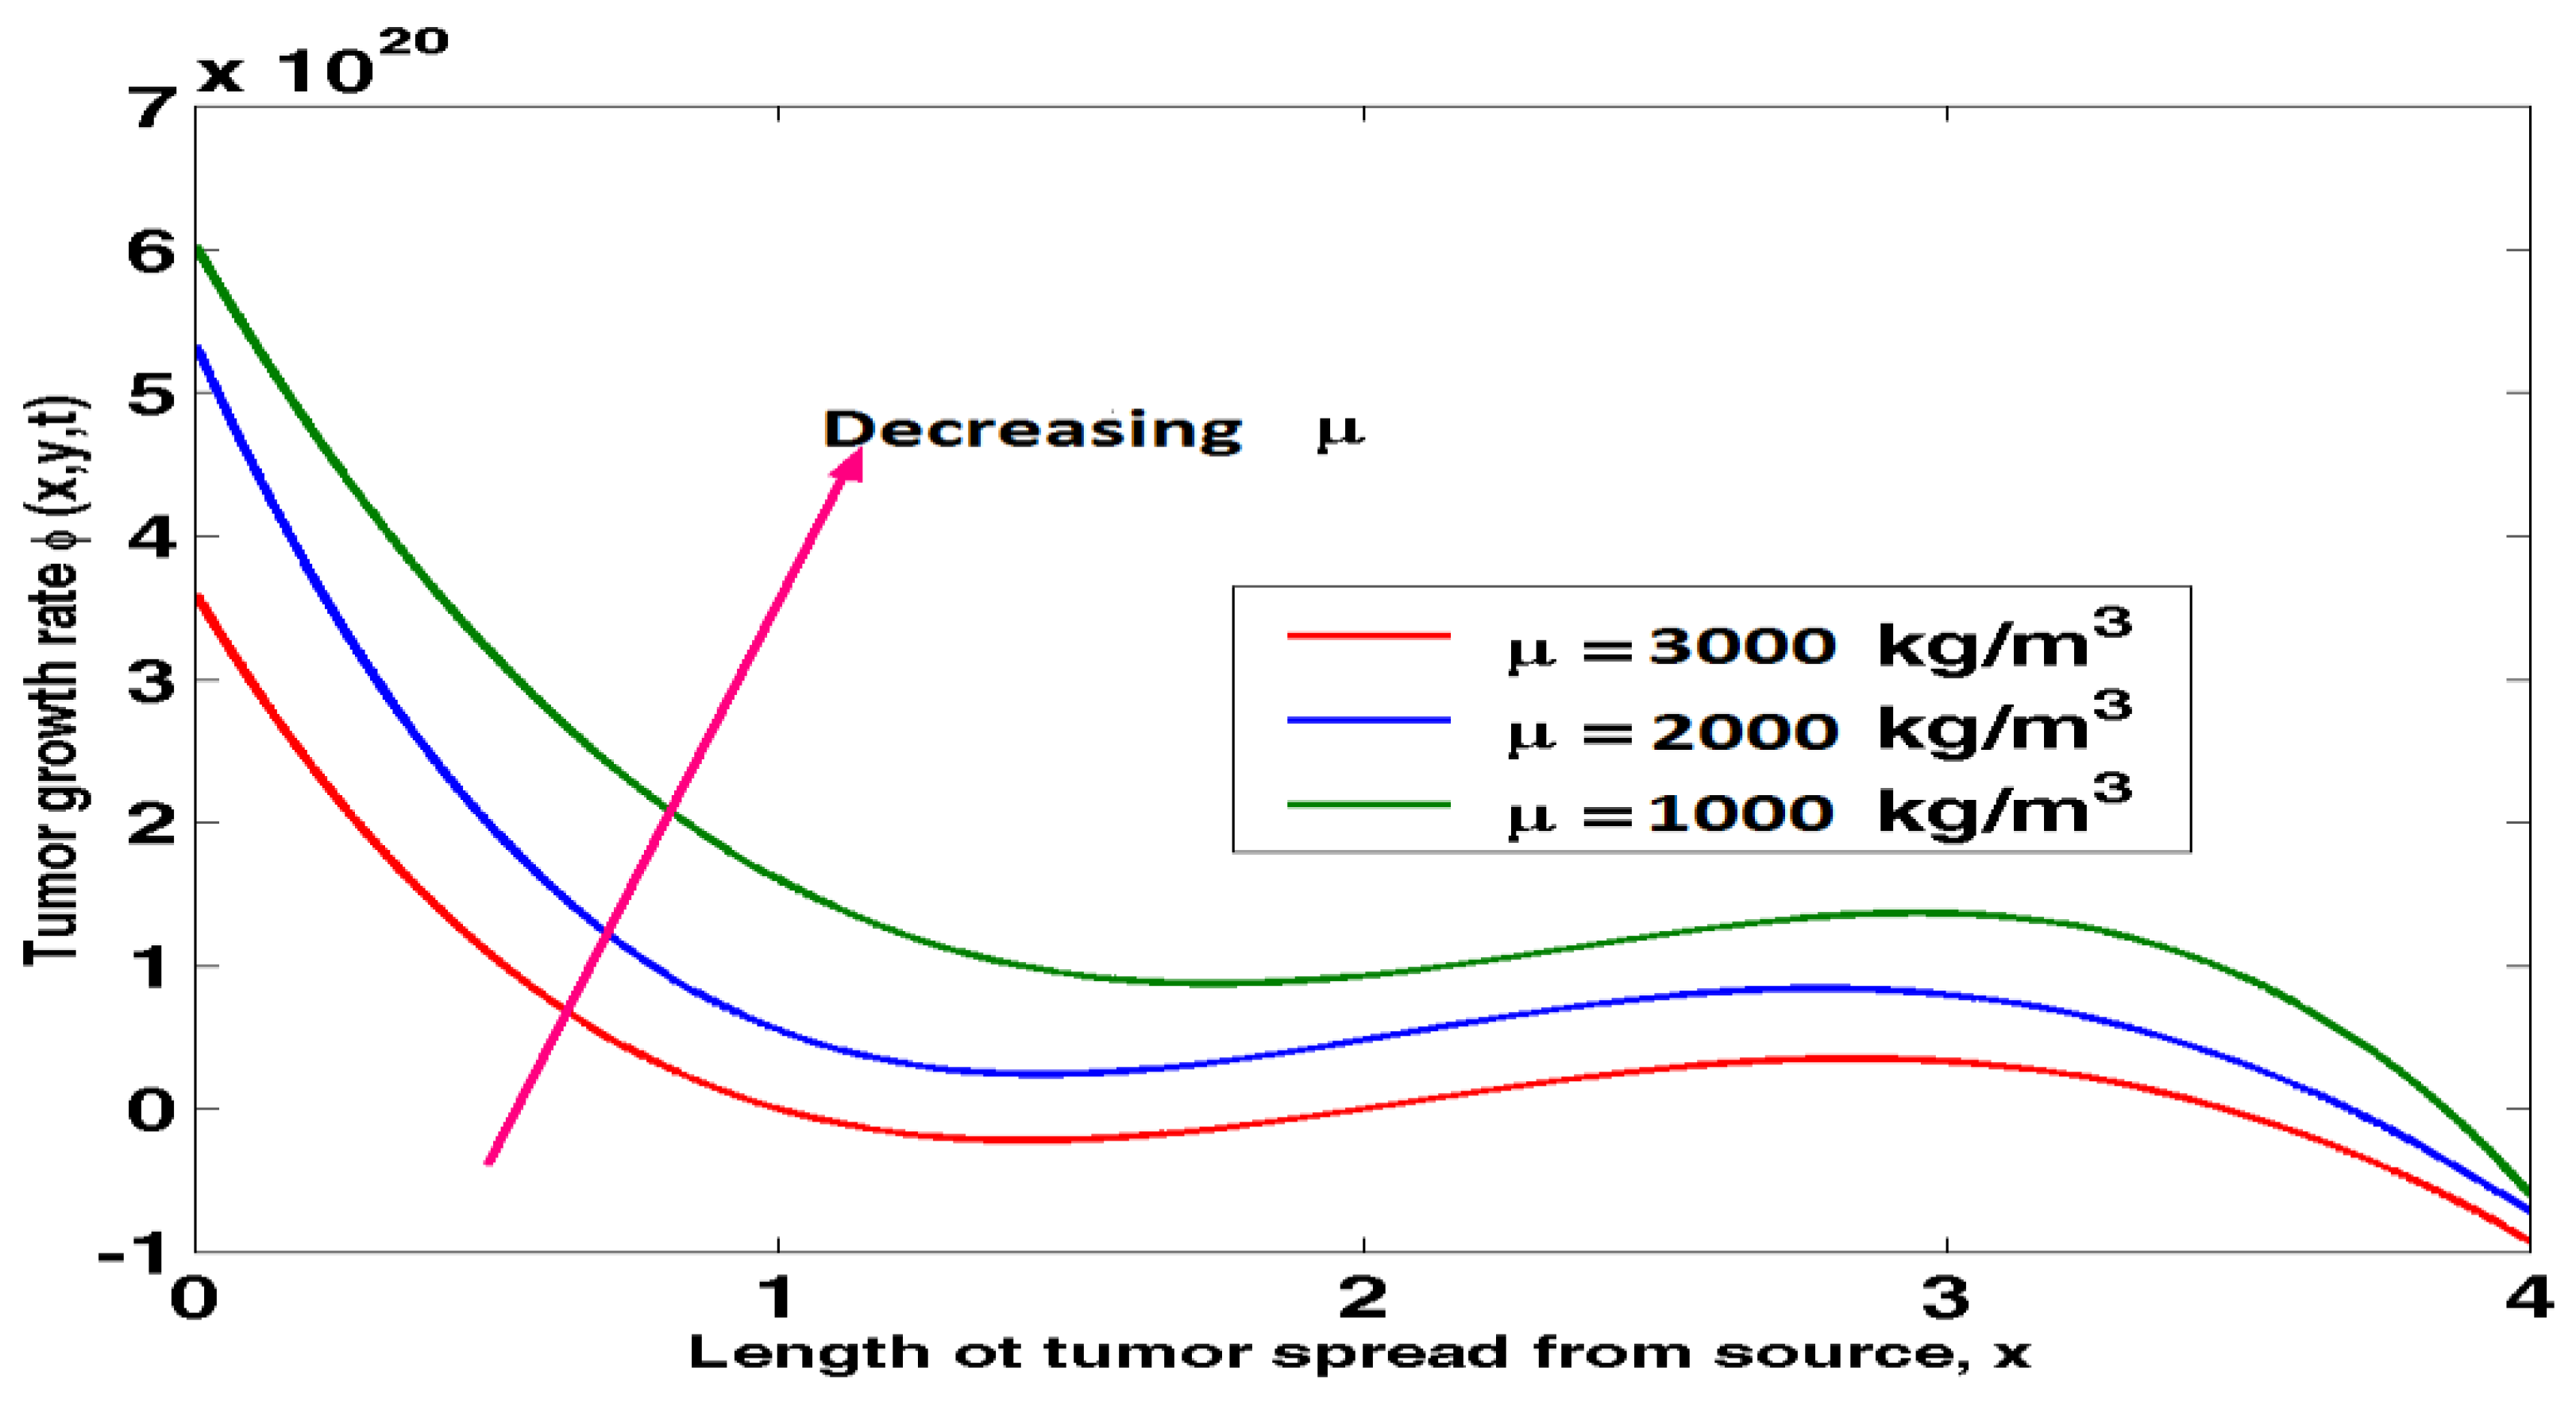
The above results were presented in figure 4.1 below
Figure 4.1 shows how tumour density impacts tumour growth.
Figure 4 shows that tumour growth slows with increasing tumour density and accelerates in the opposite direction as tumours spread from their original location. Tumours formed in high-density cells are suppressed through the application of compressive pressures, leading to smaller tumours than those grown in low-density cells. As a result, an increase in cell density typically results in a smaller tumour.
Figure 4.1.
Graph of tumour growth rate against length of tumour spread from source at varying tumour density.
Figure 4.1.
Graph of tumour growth rate against length of tumour spread from source at varying tumour density.
4.2. Effects of Mobility on Tumour Growth Rate
Equation (3.27) was solved in
MATLAB and obtain the results of the effects of M on tumour growth rate as shown in
table 4.2 below.
The above results was presented in figure 4.2 below
Figure 4.2 shows how the movement of cancer cells affects the formation of tumours. Tumour growth rates are observed to rise alongside cell motility. As mobility decreases, the distance a tumour can travel from its initial site increases. Tumour and normal host cell motility play a role in tumour metastasis at multiple stages, including tumour cell motility during basement membrane breakdown, tumour cell motility during escape from the primary tumour, tumour cell motility during migration to blood and lymphatic vessels, and tumour cell motility during intravasation, extravasation, and metastasis to distant organs.
4.3. Effects of P’eclet Number on Tumour Concentration
Equation (3.14) was solved in MATLAB and to obtain the results of the effects of Peclet number on tumour concentration as shown in table 4.3 below.
The above results was presented in figure 4.3 below.
The effect of Peclet number on tumour concentration can be observed from figure 6. Initially, an increase in P’eclet number leads to increases in the tumour growth rate. The effect of Pe on concentration is seen to have been very significant in two-phase flows in tumour cells. From the first phase, it is clearly seen that, with increasing values of Pe, the peak of tumour concentration increases from 0 to 1.5 and the profile of concentration becomes flatter. The peak values of tumour concentration are 1.5 to 2.0. With increasing values of Pe beyond 2.0, the initial tumour cells concentration decreases for a fixed radius from 2.0 to 4.0. From figure 4.3 it is worth noting that the Pe governs the initial concentration of tumour cells in the human body system. For this reason, the concentration of the tumour cells reduces for higher values of Pe. The peak of the mean concentration decreases with the increase in the value of Pe and this effect is very significant in small cell radius. This study may be applied for investigation of the transportation process of drugs or plasma proteins in blood flow through small arteries.
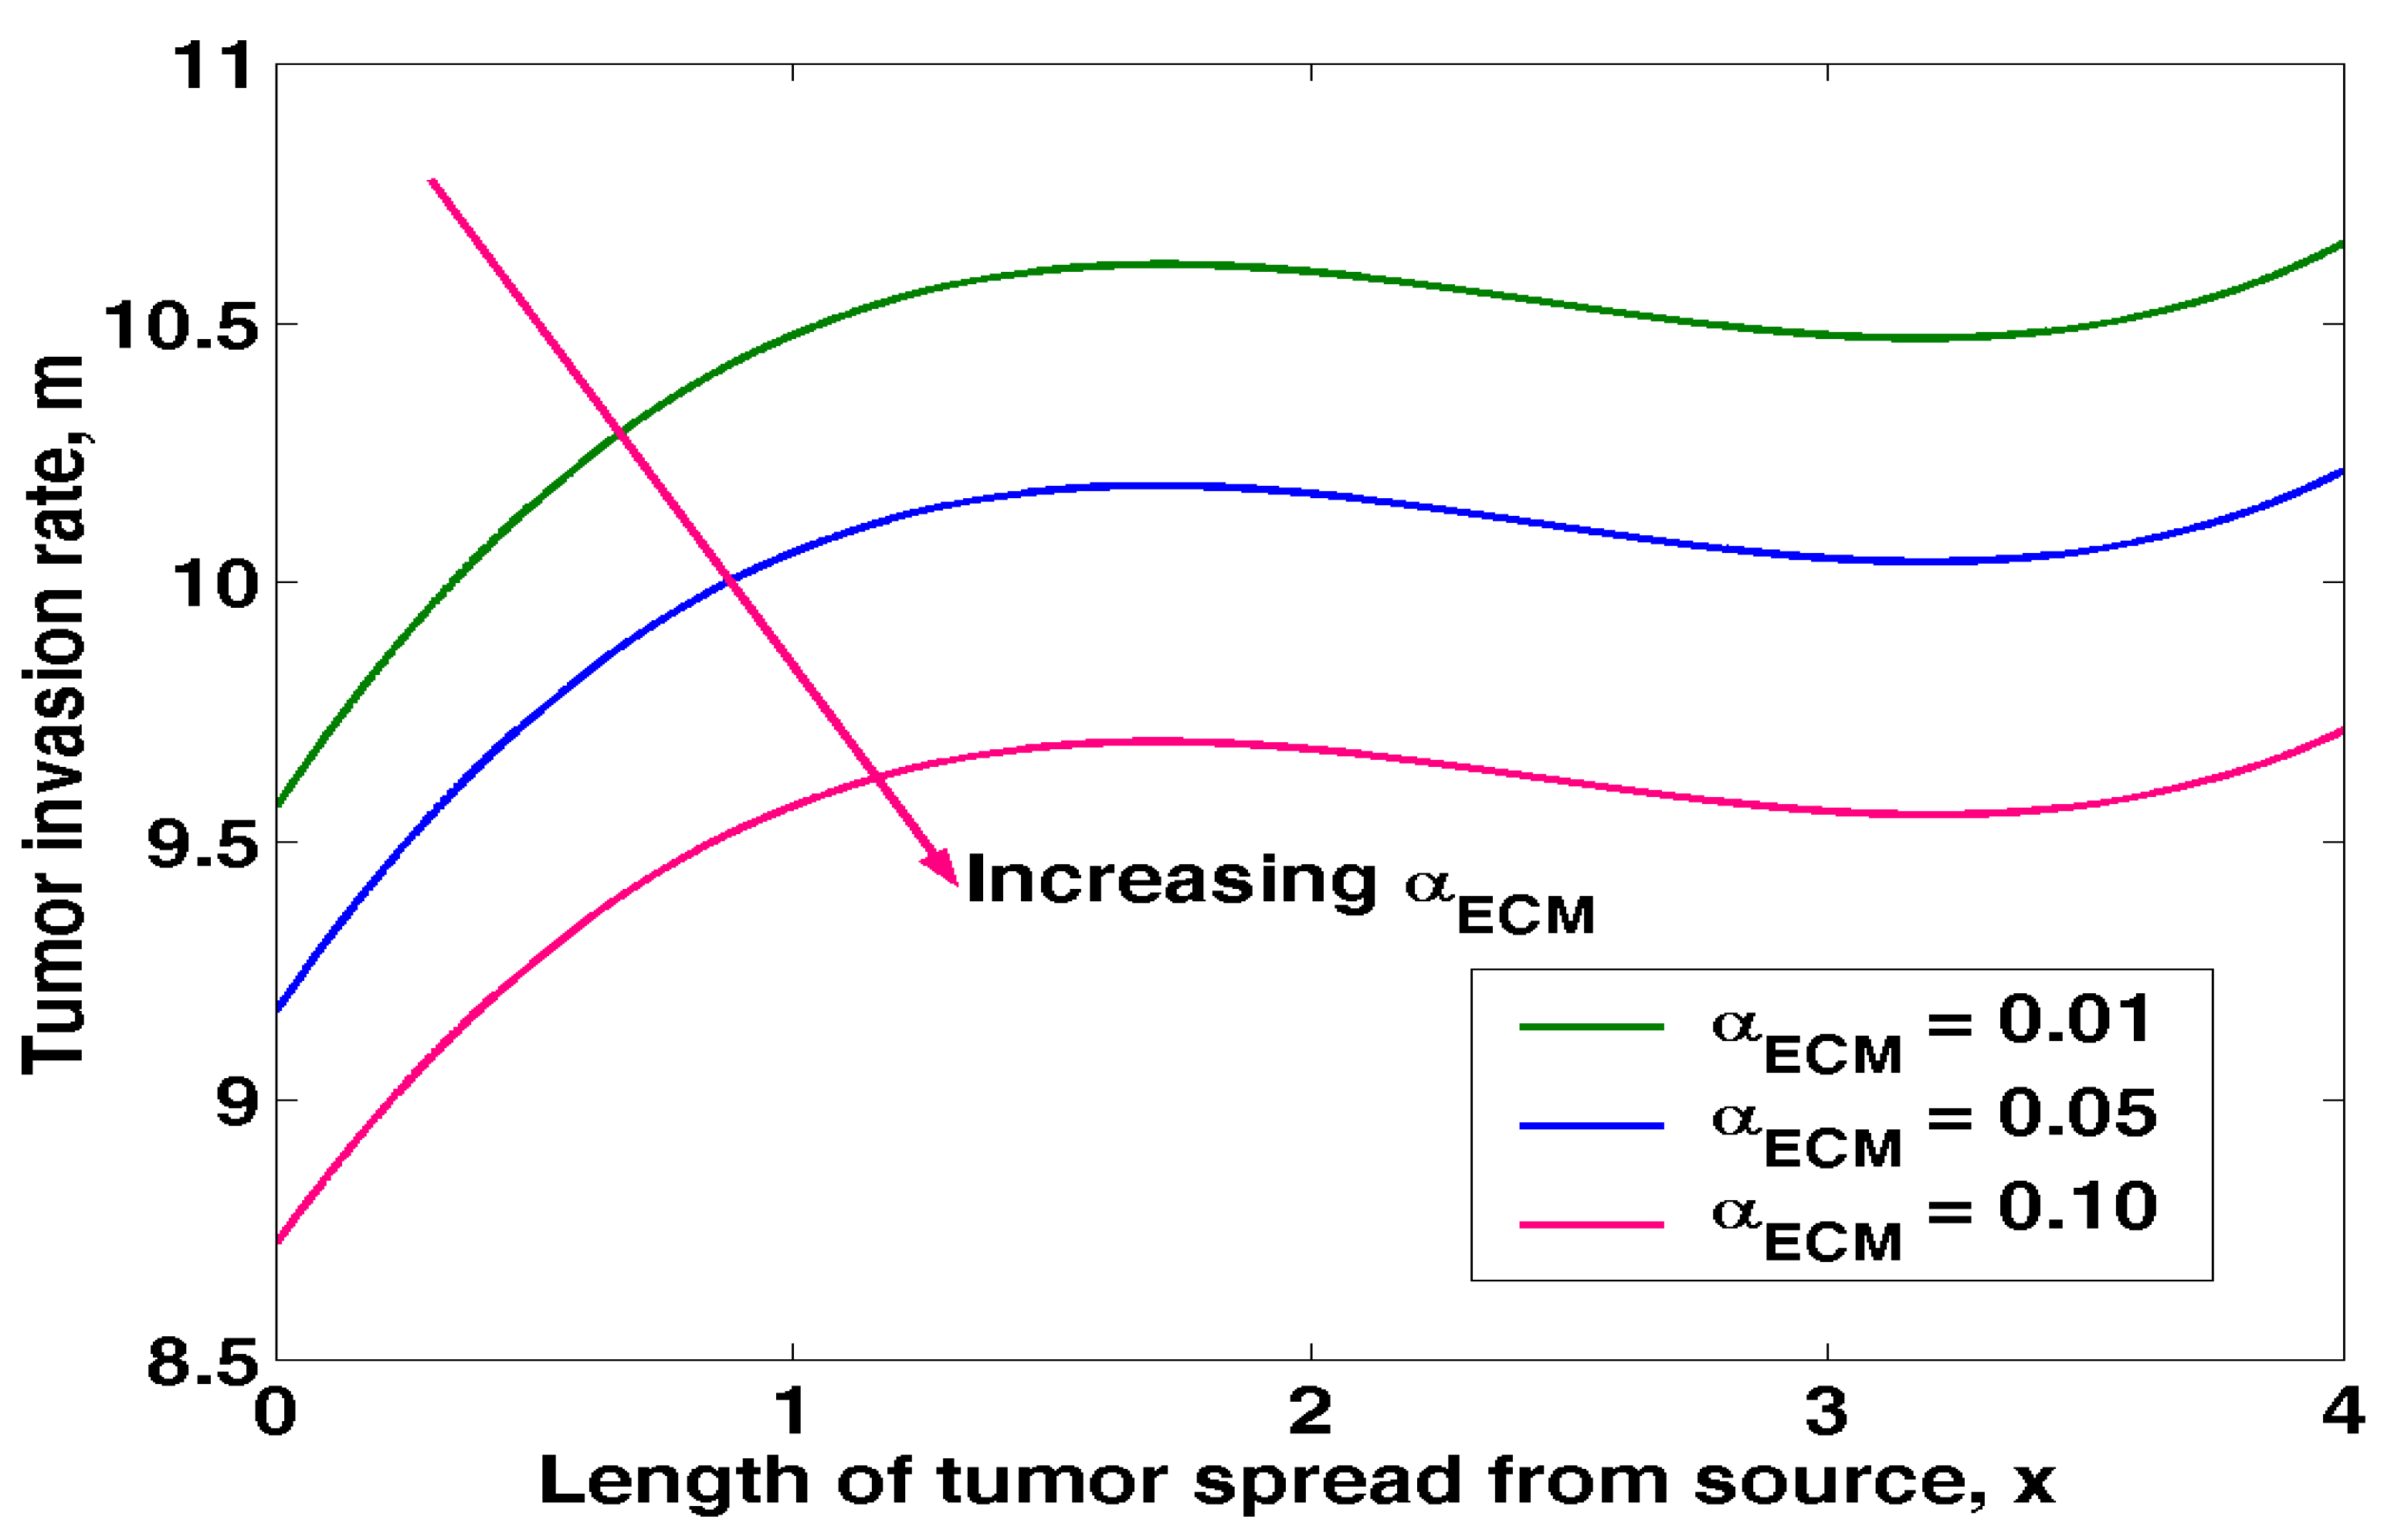
4.4. Effects of ECM on Tumour Invasion
Equation (3.27) was solved in MATLAB and to obtain the results of the effects of ECM on tumour invasion rate as shown in table 4.4 below.
The above results was presented in figure 4.4 below
Figure 4.4 displays the impact of extracellular matrix on tumour invasion. Rise in ECM leads to decreases in the tumour invasion rate. The ECM binds soluble substances, such as growth factors and other ECM-associated proteins. Skeletal muscle development from embryonic stage to senescence involves cell surface receptors interacting with ECM components and ECM-bound substances to regulate cell adhesion and cell signaling, consequently regulating activities as varied as proliferation, differentiation, migration, and apoptosis. Due to an increase in ECM in the cell milieu of aged muscle, satellite cells lose their capacity to differentiate into myogenic lineages. Collagen released by satellite cells can keep them dormant, and studies have shown that ECM protein components contribute to the myogenesis process of skeletal muscle progenitor cells. Hence, it is safe to say that ECM plays a crucial role in preventing tumour growth and sustaining normal cancer cell activity.
4.5. Effects of MDE on Tumour Invasion Rate
Equation (3.27) was solved in
MATLAB and to obtain the results of the effects of MDE on tumour invasion rate as shown in
table 4.5 below.
The above results was presented in figure 4.5 below.
Figure 4.5 shows how MDE affects the pace of tumour invasion. When DME levels rise, tumours invade at a faster rate. During DME, the invading tissue's extracellular matrix scaffolds are degraded in whole while a new, tumour-derived extracellular matrix is simultaneously formed to support the tumour mass's unchecked growth. As a result, it is safe to say that MDE plays a crucial role in promoting tumour growth by degrading cancer cells' physiological function and fostering the formation of skeletal muscle.
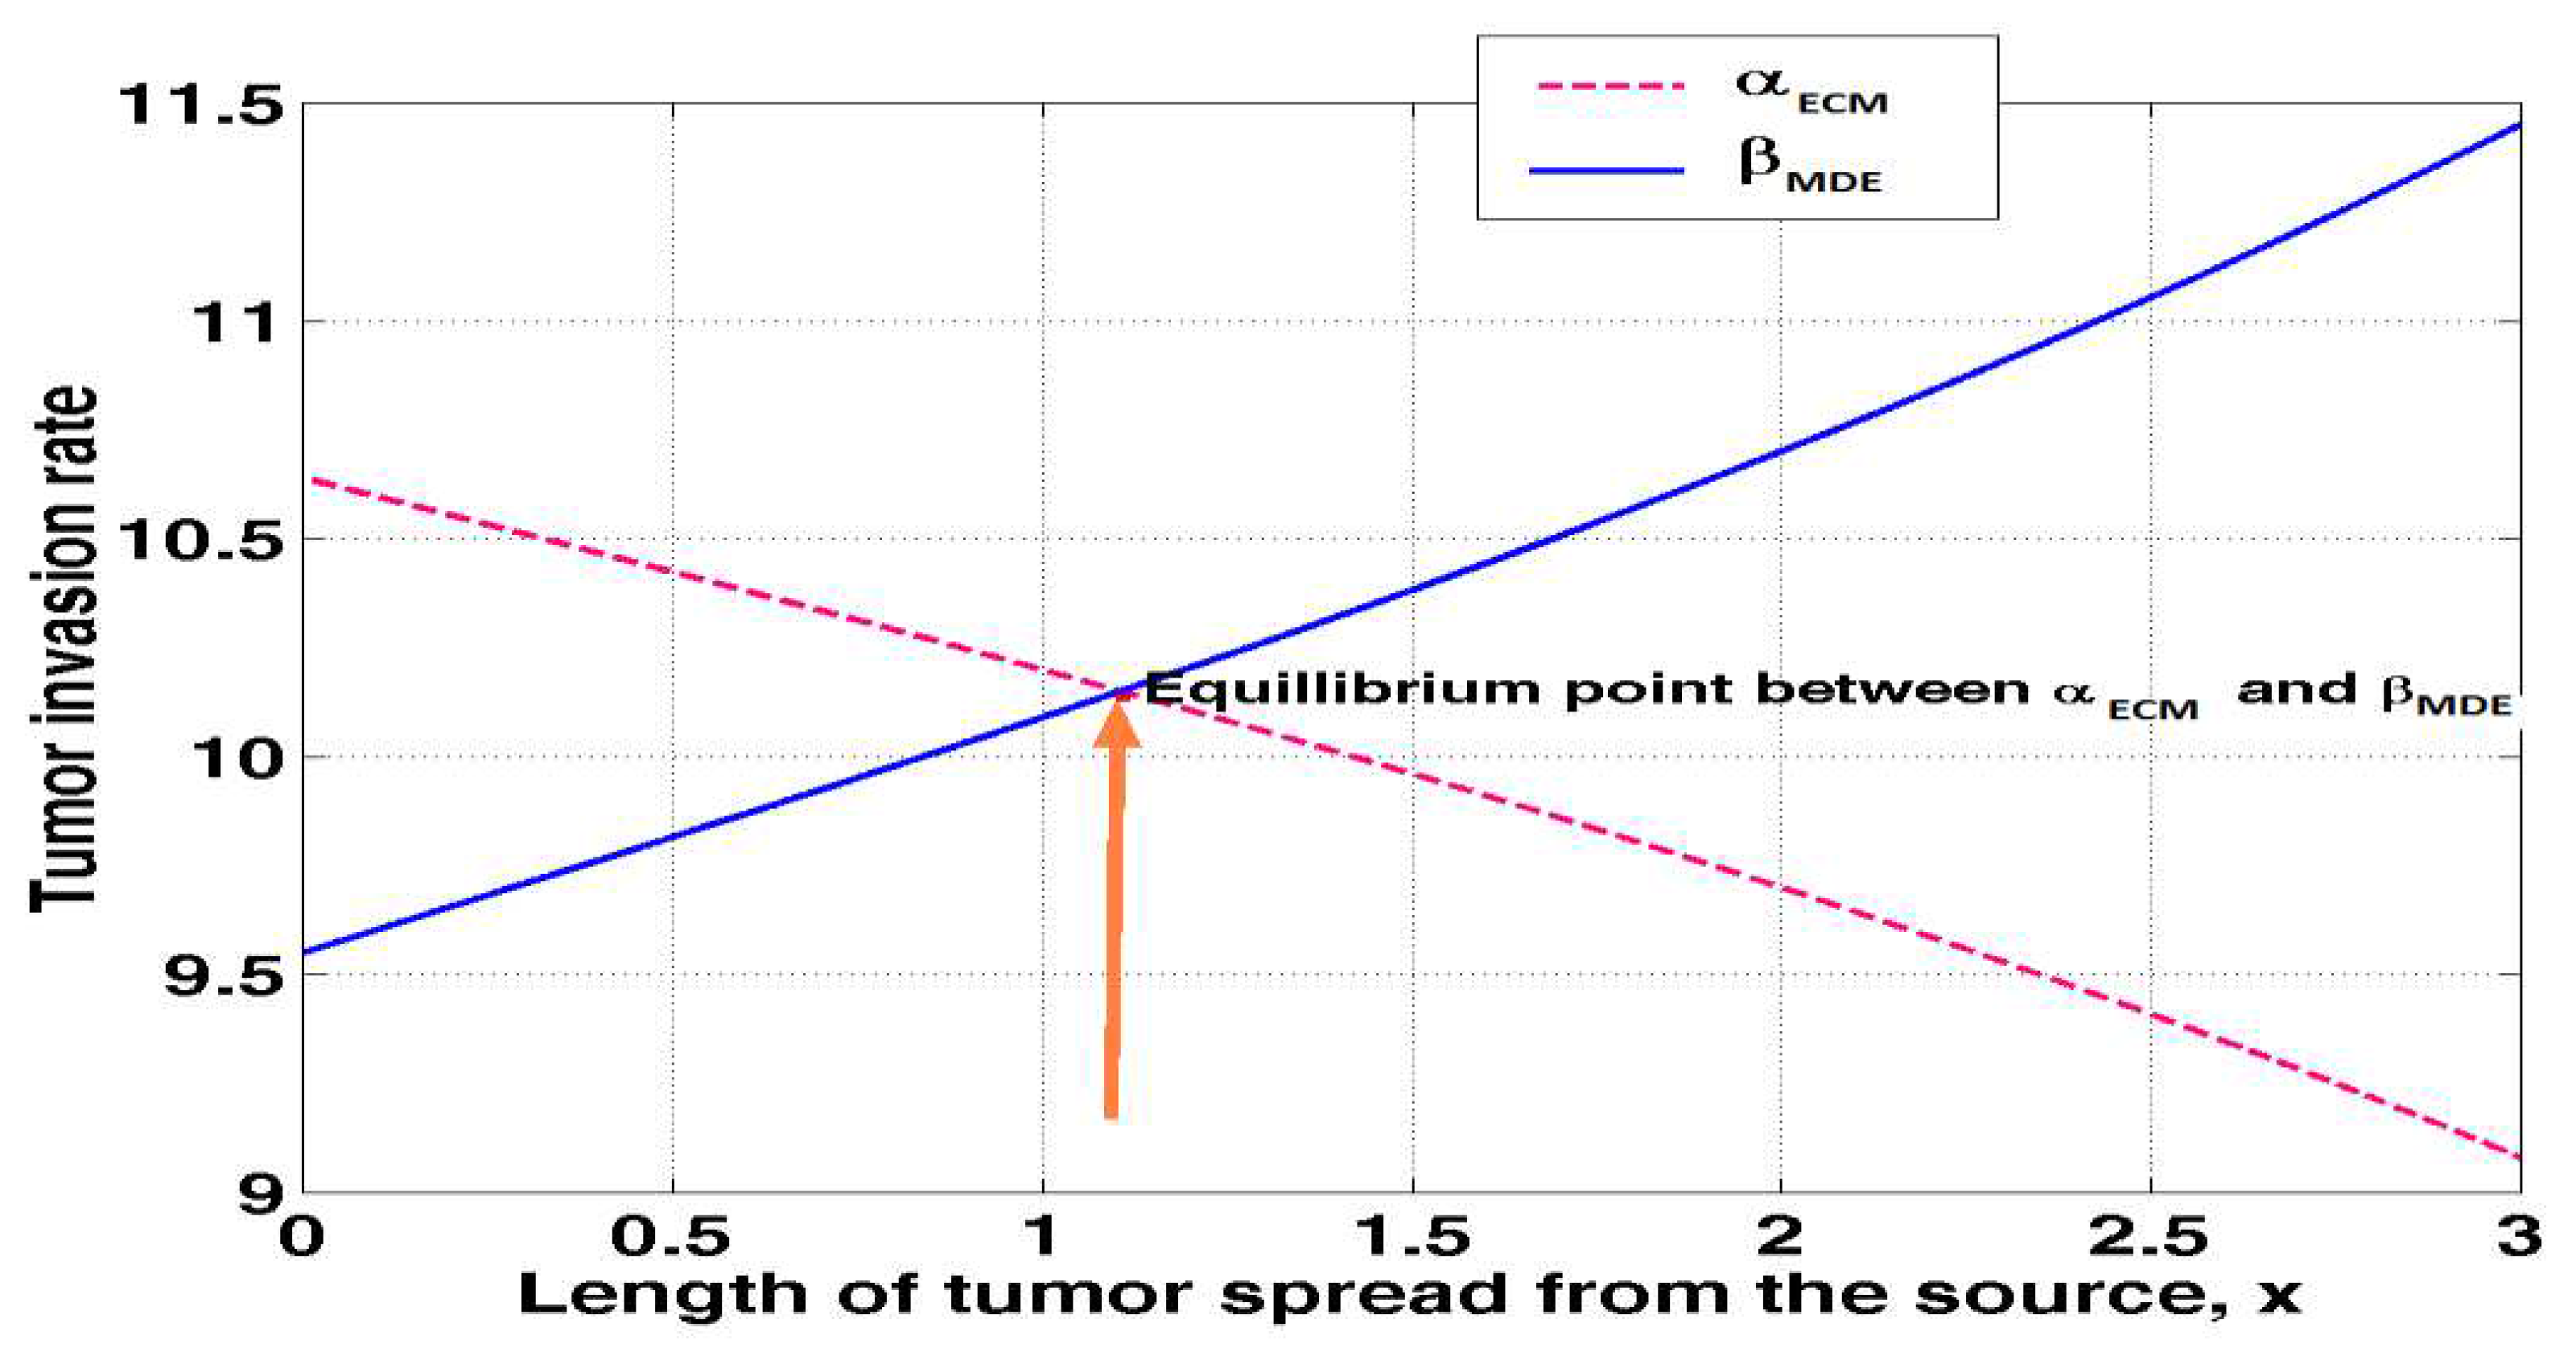
4.6. Equilibrium point between of ECM and MDEs in tumour invasion
Equation (3.27) was solved
MATLAB and to obtain the results of the point of equilibrium between ECM = 0.05 and MDE = 0.05 on tumour invasion rate as shown in
table 4.6 below.
The above results was presented in figure 4.6 below
Figure 4.6 demonstrates that the amount of extracellular matrix decreases with tumour size and distance from the tumour's origin. This is because the cells are stuck together, whereas the graph of matrix degrading enzymes shows a direct correlation between tumour length and tumour depth. Collagen, enzymes, and glycoproteins are just a few examples of the macromolecules and minerals that make up the extracellular matrix, which provides structural and biochemical support to the cells in their immediate vicinity. The integrins on the cells of the tissues it is connecting are the point of attachment for the extracellular matrix. Proteins known as integrins bind to the cytoskeleton of cells. Molecules of this kind are exudates from neighbouring cells. Yet, tumour cells' own matrix degrading enzymes (MDEs) break down the extracellular matrix, freeing cancer cells to spread across the body. As the point where the ECM and the MDEs meet, equilibrium is established.
5. Summary and Conclusions
A numerical study was performed to analyze the effects of the mobility M, tumour density, and Peclet number, Pe, Extracellular Matrix,and Matrix degradation Enzymes, on tumour growth rate tumour cells concentration and tumour invasion, respectively.
The following outcomes can be written from the study.
An increase in the mobility leads to an increase in the tumour growth rate.
Surface heat transfer tends to decrease with an increase in tumour growth rate
An increase in Peclet number leads to a decrease in tumour concentration.
An increase in ECM leads to an increase in tumour growth rate.
An increase in MDEs causes a decrease in tumour growth rate.
An increase in Peclet number leads to a decrease in tumour growth rate.
6. Recommendations
From this study, the following areas arise for further analysis and development:
An extension of this study to factor in a varying sources of tumour, ST and dead cells, SD.
An extension of this study to incorporate diffusion coefficient tumour growth rate
Nomanclature
, Mobility Parameter (m2/V.\ s); , Number of living cells per unit volume in Nanometers (); ST, Net sources of tumour cells (nm); SD, Net sources of dead cells (nm); , Density of the tumour (kg (m-3); Double well bulk energy(joule); , Parameter related to the thickness of the diffuse interface tumour and host domains; , Tumour velocity(m/s); ; Space–time dependent Lagrange multiplier; , Pressure (N/m2); , Nutrient concentration; , Sum of the volume fractions of viable and dead tumour cells; , Host tissue; , Dead tumour cells; , Population density; , Advection cancer invasion velocity; , Cancer cells diffusivity (2/h);, Density of a single tumour cell (); , MDE diffusion coefficient; , MDE production rate by cells ; , MDE natural decay rate; , Area occupied by tumour at time ; , Specific heat capacity (); Repose angle; , Materials conductivity ; , Flowing layer depth; , Prandtl number; , Peclet number; , Reynolds number; , Schmidt number; Total flux of the cancer cells -axis; , Total flux of the cancer cells along the -axis.
Acknowledgement
The authors acknowledge Kisii University (Department of Mathematics and Actuarial Sciences) for affiliation and support in academic resources.
Funding Declaration
The authors received no financial support for the research authorship and/or publication of this article.
References
- Akhtar, A., Majid, H., Abdul, G., Zafar, A., Kottakkaran, S., Alharthi M. and Wasim J. (2021). Numerical Simulations and Analysis for Mathematical Model of Avascular Tumour Growth Using Gompertz Growth Rate Function. Published by Elsevier BV. This is an open access article under the CC BY-NC-ND license. Available online: http://creativecommons.org/ licenses/by-nc-nd/4.0/.
- Beerenwinkel, N.; Schwarz, R.F.; Gerstung, M.; Markowetz, F. Cancer Evolution: Mathematical Models and Computational Inference. Syst. Biol. 2014, 64, e1–e25. [Google Scholar] [CrossRef] [PubMed]
- Brassel, M. and Bretin, E. (2011). A modified phase field approximation for mean curvature flow with conservation of the volume. Math. Meth. Appl. Sci. 34, 1157–1180. [CrossRef]
- Elaine, L. et al., (2009). Mathematical Oncology. Multiparameter Computational Modelling of Tumour Invasion. Available online: www.aacrjournals.org. [CrossRef]
- Gregório, A.C.; Fonseca, N.A.; Moura, V.; Lacerda, M.; Figueiredo, P.; Simões, S.; Dias, S.; Moreira, J.N. Inoculated Cell Density as a Determinant Factor of the Growth Dynamics and Metastatic Efficiency of a Breast Cancer Murine Model. PLOS ONE 2016, 11, e0165817. [Google Scholar] [CrossRef] [PubMed]
- Gross, J.F. and Popel, A.S. (1979). Mathematical models of transport phenomena in normal and neoplastic tissue, Tumour Blood Circulation. CRC Press, Peterson edition; (Google Scholar).
- Hasitha, N., Weerasinghe, Pamela, M., Burrage, [...]and Dan V., Nicolau (Journal of Oncology). Published online 2019 oct 31. 2019. [CrossRef]
- Johnson, K.E.; Howard, G.; Mo, W.; Strasser, M.K.; Lima, E.A.B.F.; Huang, S.; Brock, A. Cancer cell population growth kinetics at low densities deviate from the exponential growth model and suggest an Allee effect. PLOS Biol. 2019, 17, e3000399. [Google Scholar] [CrossRef] [PubMed]
- Katira, P.; Bonnecaze, R.T.; Zaman, M.H. Modeling the Mechanics of Cancer: Effect of Changes in Cellular and Extra-Cellular Mechanical Properties. Front. Oncol. 2013, 3, 145. [Google Scholar] [CrossRef] [PubMed]
- Sharif, G.M.; Wellstein, A.; Brahmer, J.R.; Hammers, H.; Lipson, E.J.; Krishnamurthy, S.; Ng, V.W.; Gao, S.; Tan, M.-H.; Hedrick, J.L.; et al. Cell density regulates cancer metastasis via the Hippo pathway. Futur. Oncol. 2015, 11, 3253–3260. [Google Scholar] [CrossRef] [PubMed]
- Socolofsky, S. A. and Jirka.G.H. (2002). Environmental Fluid Mechanics. Part 1, 2nd Edition, Institute for Hydrodynamics, University of Karlsruhe, Germany.
- Uthamacumaran, A. Cancer: A turbulence problem. Neoplasia 2020, 22, 759–769. [Google Scholar] [CrossRef] [PubMed]
- WHO (2020). Global Cancer Observatory, [2020, December 18]. Cancer data for cancer action. (http//gco.iarc.fr/today/home). GLOBOCAN_GCO [Twitter post]. Available online: http//twitter.com/today home.
- Xuelian, H., Zhang L.Xuezhao, L… (2019). Toll-like receptor 2 and Toll-like receptor regulation of cancer cell stemness mediated by cell death-induced high-mobility group box 1. Biomedicine 40, 135–150.
- Song, G.; Liang, G.; Tian, T.; Zhang, X. Mathematical Modeling and Analysis of Tumor Chemotherapy. Symmetry 2022, 14, 704. [Google Scholar] [CrossRef]
|
Disclaimer/Publisher’s Note: The statements, opinions and data contained in all publications are solely those of the individual author(s) and contributor(s) and not of MDPI and/or the editor(s). MDPI and/or the editor(s) disclaim responsibility for any injury to people or property resulting from any ideas, methods, instructions or products referred to in the content. |
© 2023 by the authors. Licensee MDPI, Basel, Switzerland. This article is an open access article distributed under the terms and conditions of the Creative Commons Attribution (CC BY) license (https://creativecommons.org/licenses/by/4.0/).
