1. Introduction
Crystals of the lantangallium silicate family La
3Ga
5SiO
14 (langasite, LGS) are promising piezoelectric materials for telecommunications systems, for information transmission and processing in the real-time mode. Crystals are grown by the Czochralski method from the melt [
1,
2,
3,
4,
5,
6,
7,
8,
9]. The crystals are of the point symmetry group 32, like the SiO
2 piezoquartz crystals. In terms of their piezoelectric properties, crystals of the LGS family occupy an intermediate position between SiO
2 piezoquartz crystals and LiNbO
3 ferroelectric crystals [
10,
11,
12]. It should be noted that a number of cuts of the LGS crystal family have practically zero temperature frequency coefficients. Also note that there are no phase transitions in crystals up to the melting point (
). In quartz crystals, the phase transition from α to β phase is observed at 575℃. This process is nonreversible. Therefore, piezoquartz crystals are not suitable for use in high-temperature surface and bulk acoustic wave sensors that can operate at temperatures as high as 600°C. LGS crystals have low surface acoustic wave velocities, which makes it possible to create miniature acoustoelectronic devices.
Crystals of the lantangallium silicate family grown by the Czochralski method have a high perfection of the crystal lattice, which allows a wide range of studies using X-ray radiation. Usually electrical measuring methods are used to study the piezoelectric and acoustic properties of crystals. In [
13,
14], the method of high-resolution triple-axis X-ray diffraction was used to measure the piezoelectric moduli in crystals of the LGS family. This method is based on changing the parameters of the unit cell when an external electric field is applied to the crystal, i.e., under the conditions of the inverse piezoelectric effect. That is, the interplanar spacing changes and the corresponding change in the angular position of the Bragg peak, which makes it possible to determine the piezoelectric moduli based on the measurement of the change in the angular position of the Bragg peak. However, it should be noted that this approach was first proposed in [
15,
16,
17] to measure the piezoelectric moduli in a quartz crystal. In these works [
15,
16,
17], a scheme of a double-crystal X-ray diffraction was used, which does not allow to eliminate the contribution of deformations such as torsion and bending in the crystal when an external electric field is applied. The use of a crystal-analyzer in the optical scheme of the triple-axis X-ray diffraction makes it possible to eliminate the contribution of the substrate deformation and to take into account in the measurement process the change of interplanar spacing only.
Methods of X-ray topography and diffraction are optimal for studying the process of acoustic wave propagation in solids. Methods of X-ray topography on synchrotron radiation sources allow to visualize in the real time mode the process of traveling surface acoustic waves propagation using the method of stroboscopic X-ray topography [
18,
19,
20,
21] or using the Talbot effect [
22]. These topography methods can be used to visualize the interaction process with crystal lattice defects, to measure the power flow angles, and to determine the wavelength of the SAW. The investigation of the SAW propagation process in solids by high-resolution X-ray diffractometry is based on the process of X-ray diffraction on a crystal lattice which is sinusoidally modulated by the SAW [
23,
24,
25]. The presence of such a diffraction grating leads to the appearance of diffraction satellites around the Bragg peak on the rocking curve. If the angular divergence between diffraction satellites is determined by the wavelength of the SAW, then their number and intensity are determined by the amplitude of the SAW. It is also possible to investigate the attenuation of SAW along the direction of the SAW propagation and in crystal depth.
In this work, the thermal expansion coefficients () of La3Ga5SiO14 and Ca3TaGa3Si2O14 crystals were measured. Usually, to determine the coefficients of thermal expansion, bars are cut from crystals and the elongation of the bars is measured during heating. In this work, the X-ray diffraction method was used to measure the thermal expansion coefficients under the crystal heating conditions. In this case, a change in temperature leads to a change in the parameters of the crystal unit cell. Analysis of X-ray diffraction spectra makes it possible to determine the change in the angular position of the Bragg peaks due to changes in the interplanar spacing. The change in the interplanar spacing as the temperature changes makes it possible to determine the value of the thermal expansion coefficients.
Previously, α was measured in the crystal Ca
3TaGa
3Si
2O
14 based on a study of the elongation of bars cut from the crystal as the temperature changes [
26].
2. Piezoelectric La3Ga5SiO14 and Ca3TaGa3Si2O14 crystals
La
3Ga
5SiO
14 and Ca
3TaGa
3Si
2O
14 crystals were grown from the melt using the Czochralski method to measure the thermal expansion coefficients.
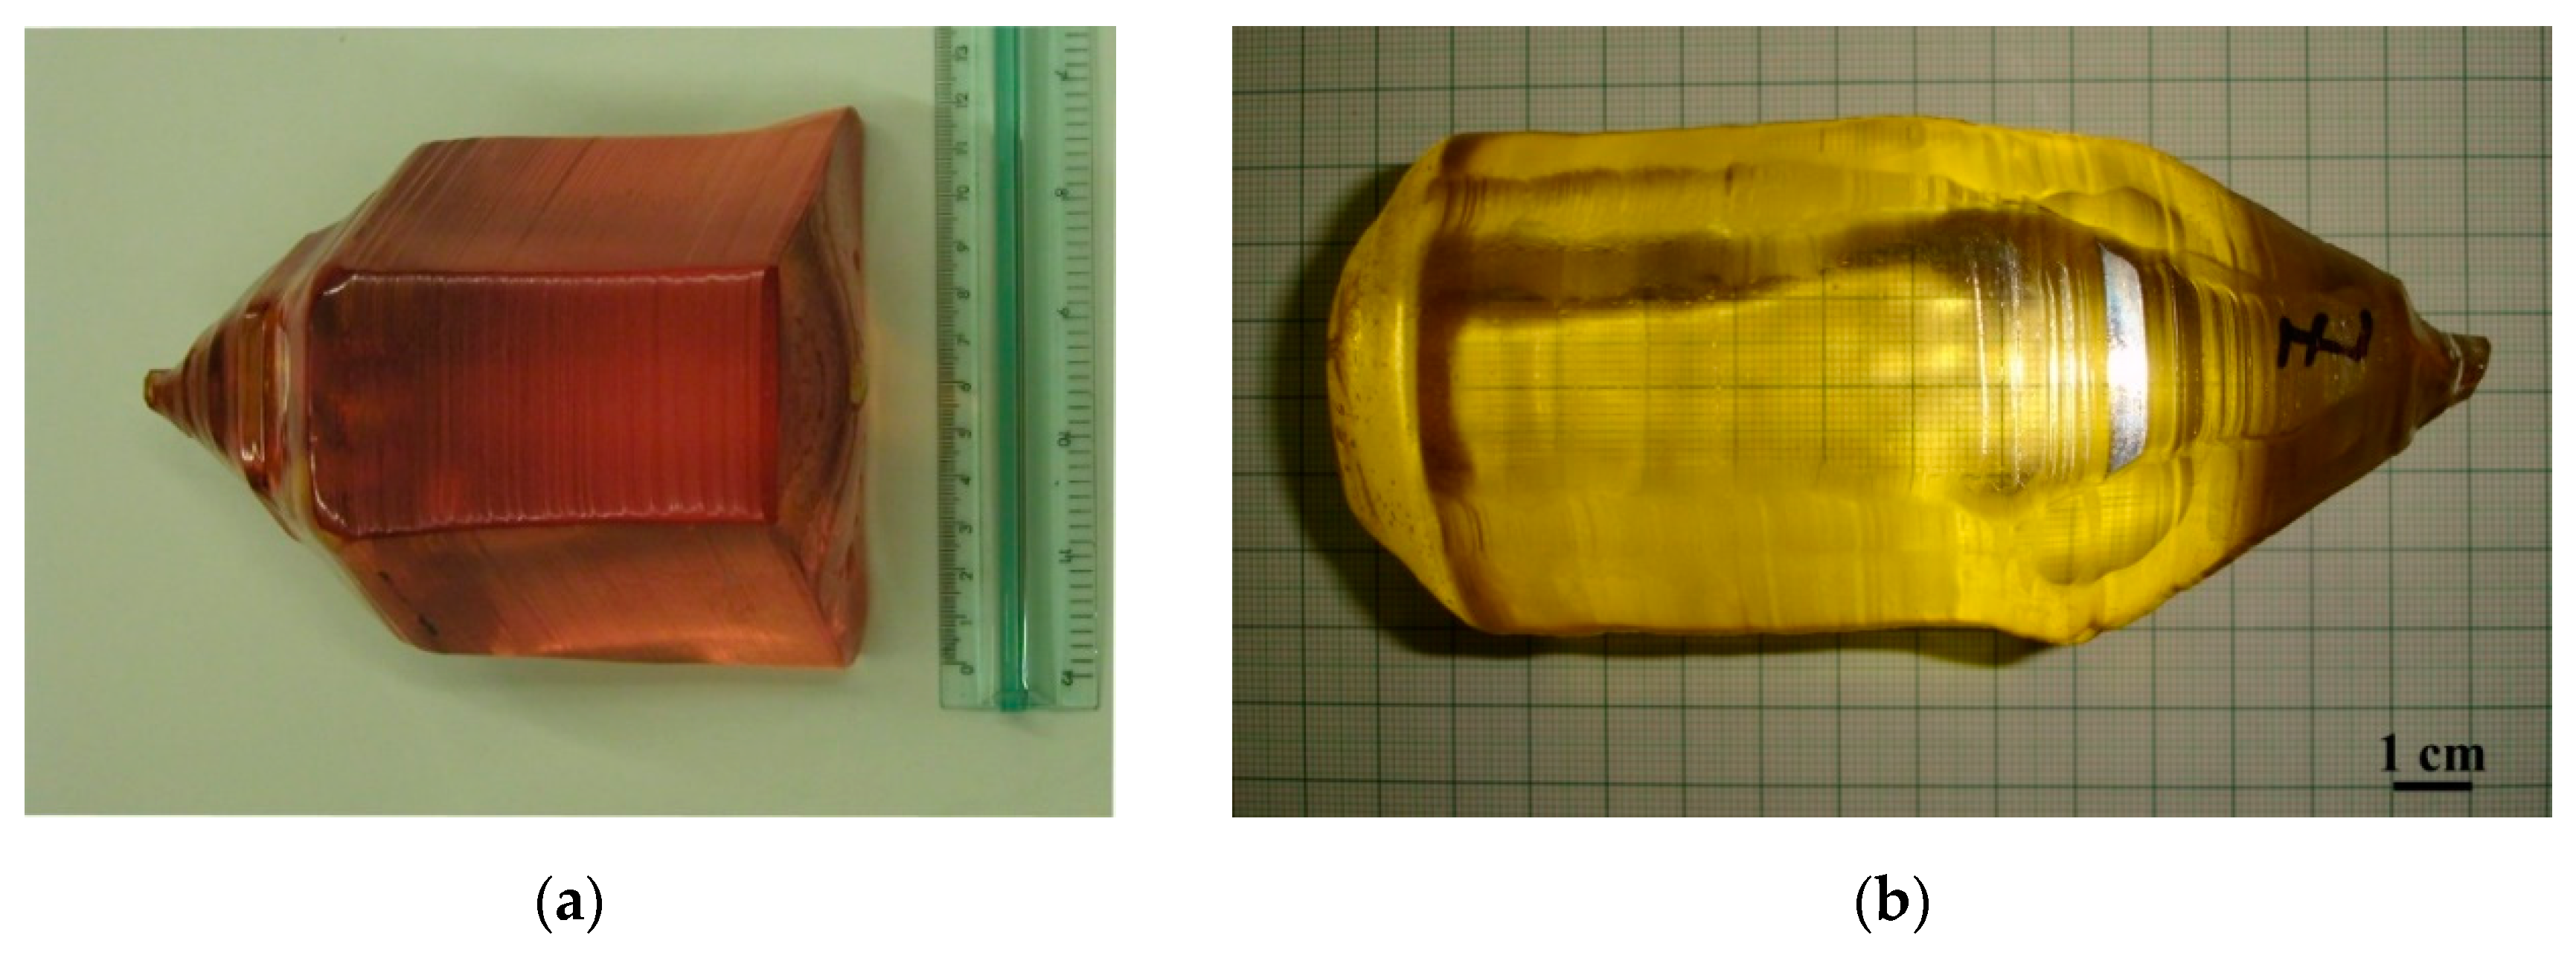
Figure 1 shows the disordered La
3Ga
5SiO
14 crystal (a) and ordered Ca
3TaGa
3Si
2O
14 crystal (b) grown by the Czochralski method.
Thermal expansion coefficients must be taken into account when designing high-temperature sensors, acoustoelectronic and acousto-optic devices. It should be noted that in crystals of point group symmetry 32, the and directions are equivalent in terms of thermal expansion. Thus, there are two independent coefficients of thermal expansion in crystals of point group symmetry 32: along direction (direction [001]) and along direction (direction [110]) .
To measure , the powder diffraction method was used under conditions of temperature changing. The grown crystals were grinded into a powder with a grain size of ~100 nm.
3. Experimental set-up
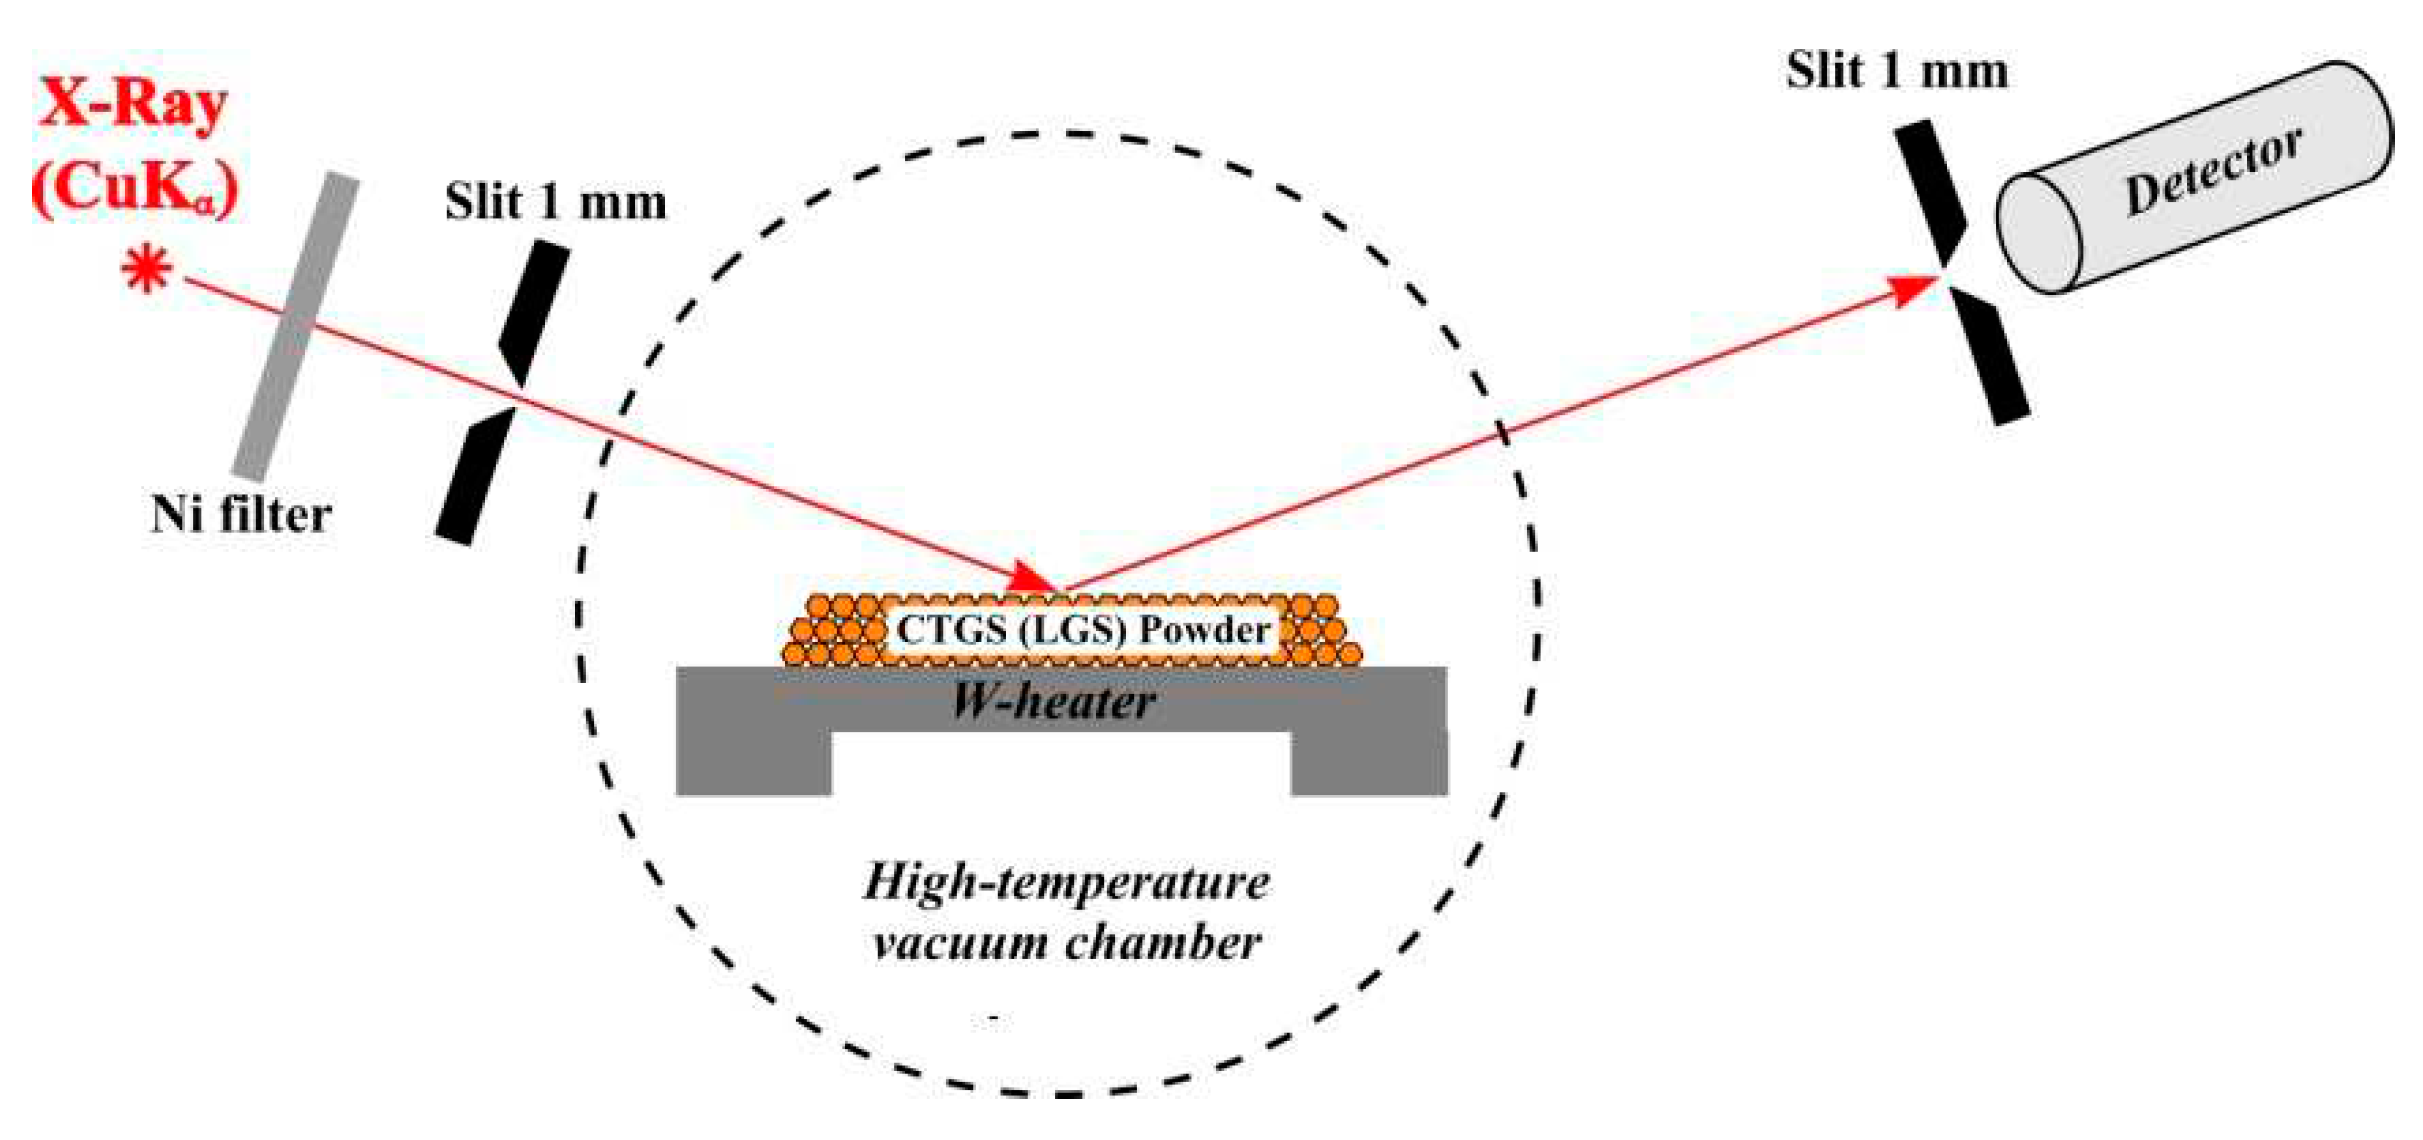
The studies were performed on an ARL X’TRA X-ray diffractometer. The ANTON PAAR HTK 2000 high-temperature chamber with a vacuum of 6×10
-5 mbar was used for high-temperature studies. An X-ray optical scheme of the diffractometer is shown in
Figure 2. An X-ray tube with a Cu anode was used as an X-ray source. The
lines were filtered using a Ni filter. Then the X-ray radiations was collimated by the entrance slit with the size of 1 mm. Collimated X-ray radiation diffracted on a powder of grown crystals placed on a W-heater in a high-temperature vacuum chamber. Diffracted X-ray radiation was recorded with a standard NaI scintillation detector with an input slit size of 1 mm. The W-heater provides the ability to change the temperature from room temperature to 2300℃. The investigations were carried out in the temperature range from 25°C to 1200°C.
X-ray diffraction spectra were measured in a Θ-2Θ diffraction scheme.
4. Experimental results
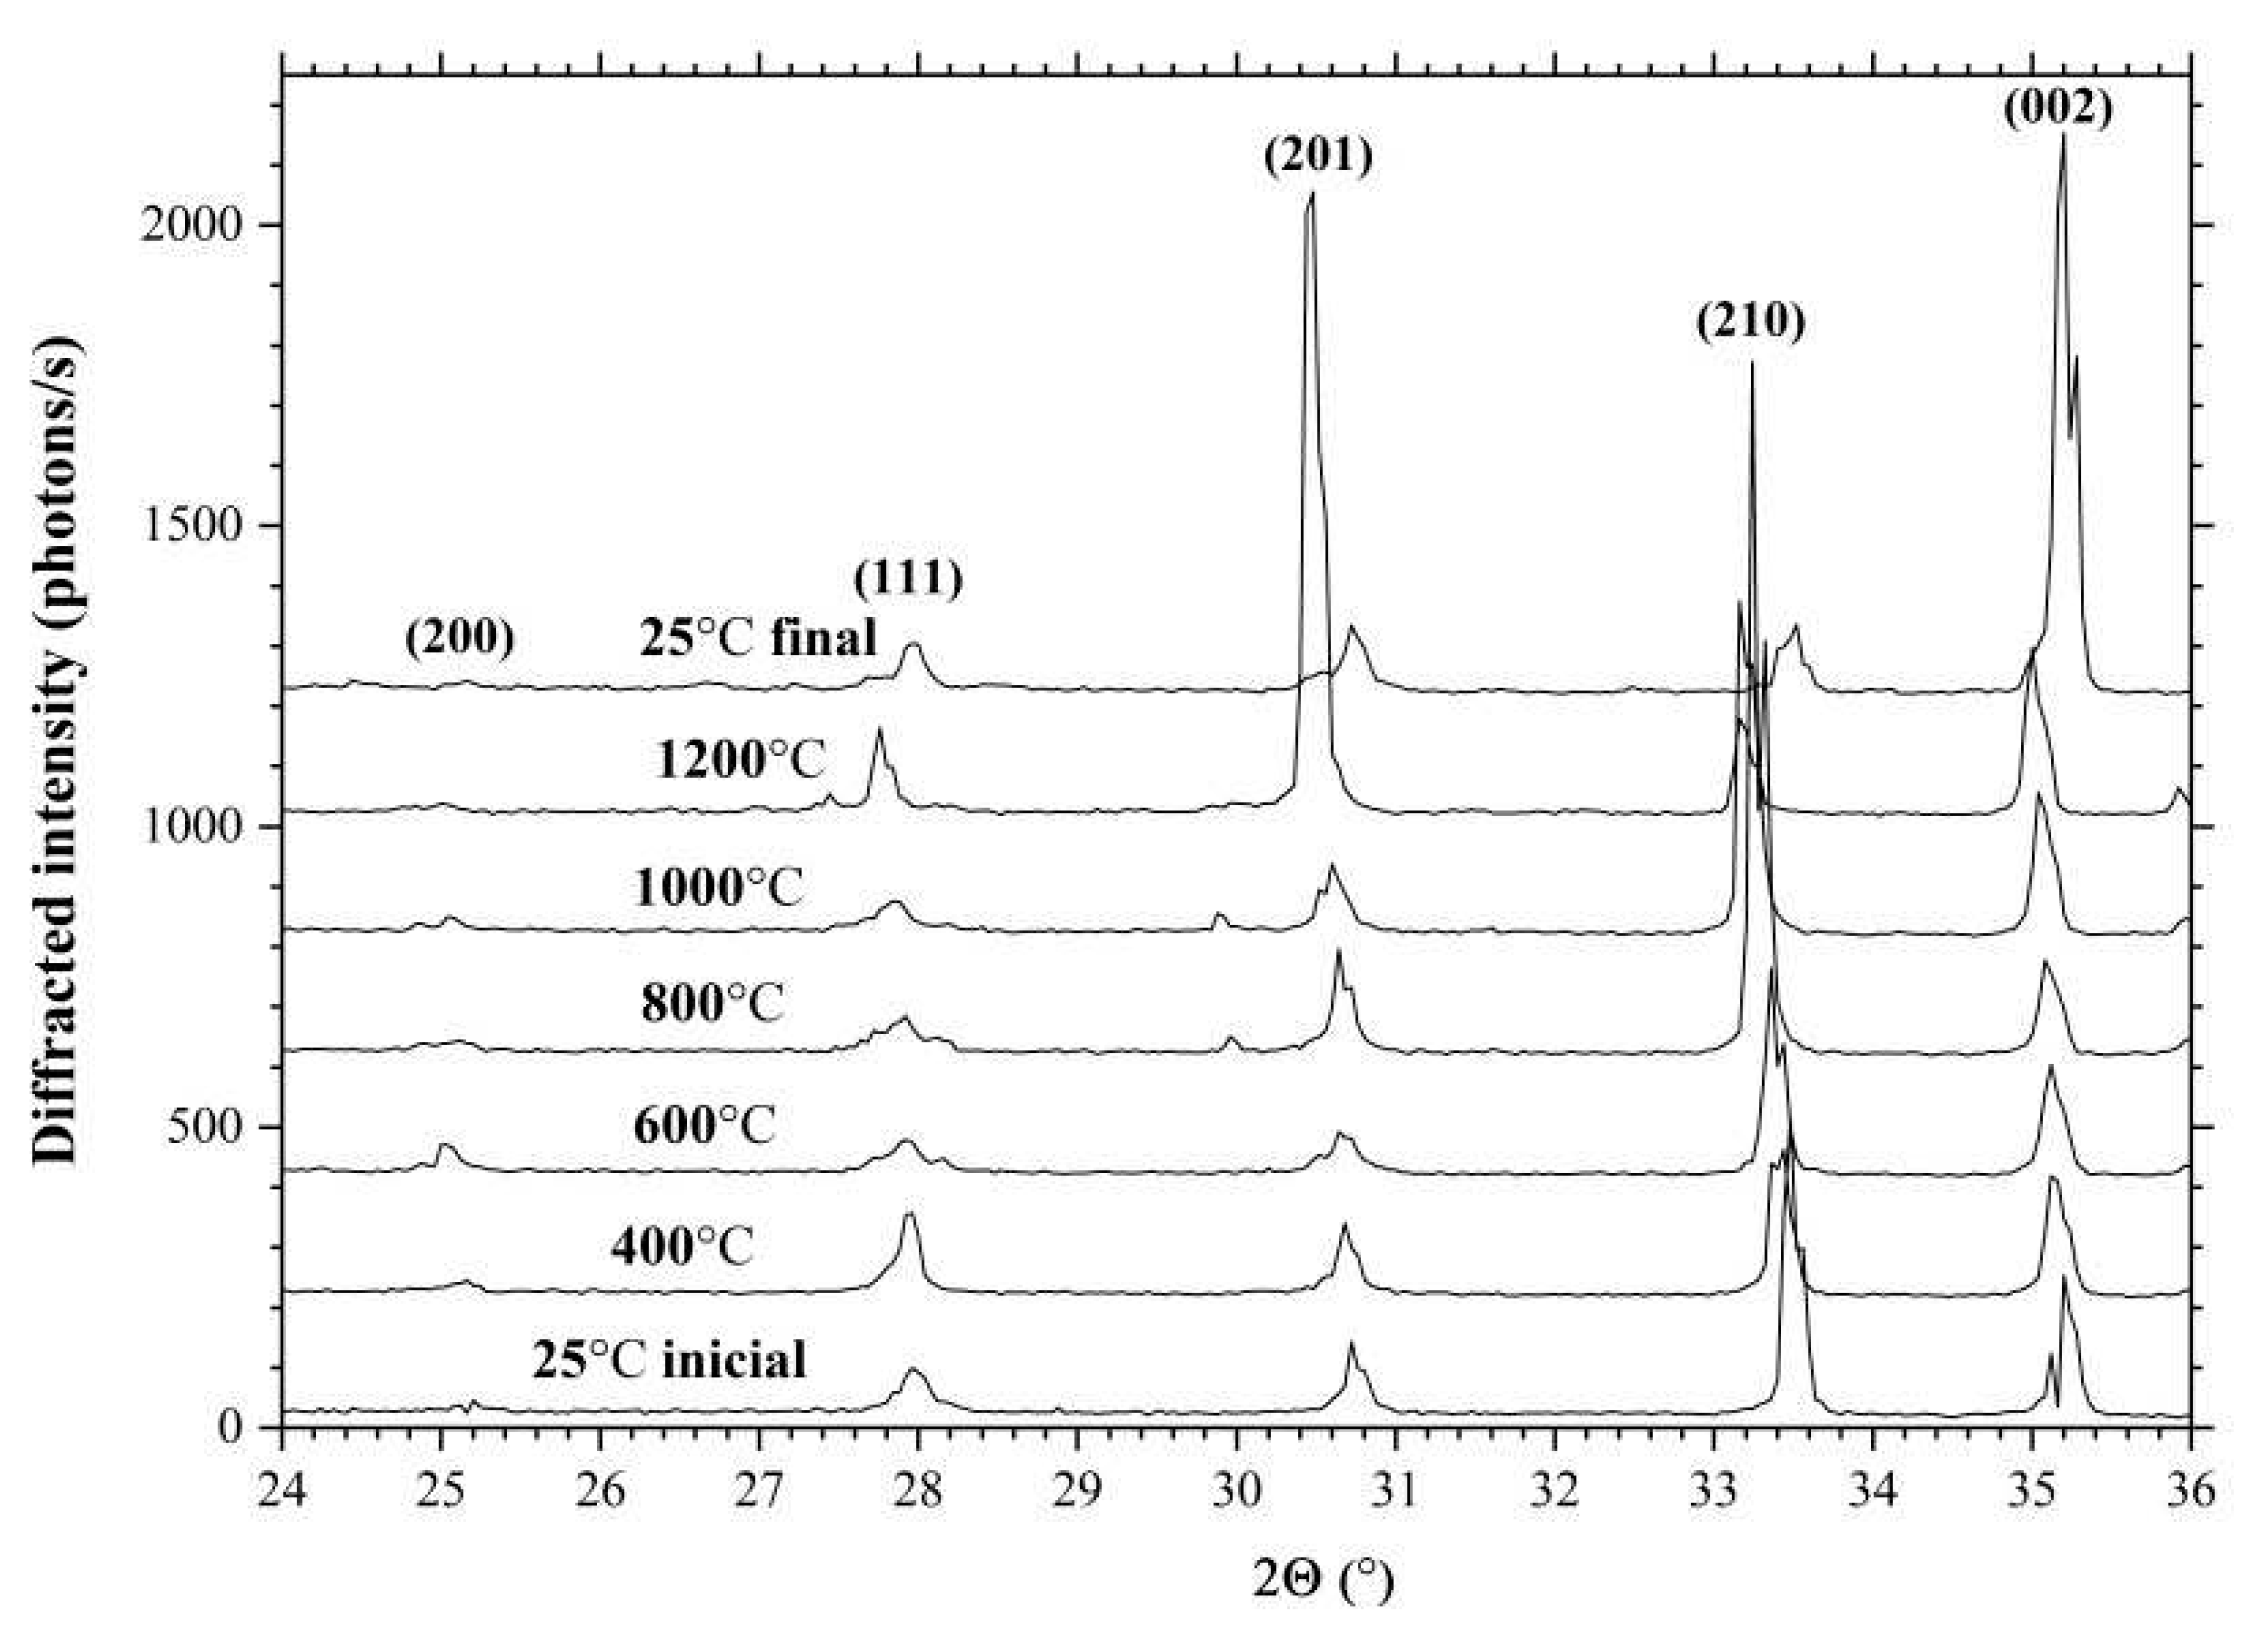
Figure 3 shows X-ray diffraction spectra of CTGS crystal powder measured at different temperatures. The figure shows that an increase in temperature leads to a change in the angular position of the diffraction peaks toward smaller angles, which corresponds to an increase in the values of interplanar spacing and a corresponding change in the parameters of the crystal unit cell. However, it should be noted that the linear behavior of the diffraction peaks is observed up to 800°C. Further, there is a sharp change in the position of the diffraction peaks, which is associated with the peculiarities of the behavior of LGS crystals at high temperatures. At temperatures above 800°C, gallium atoms begin to leave the surface of the langasite crystal family, which leads to the formation of a porous structure.
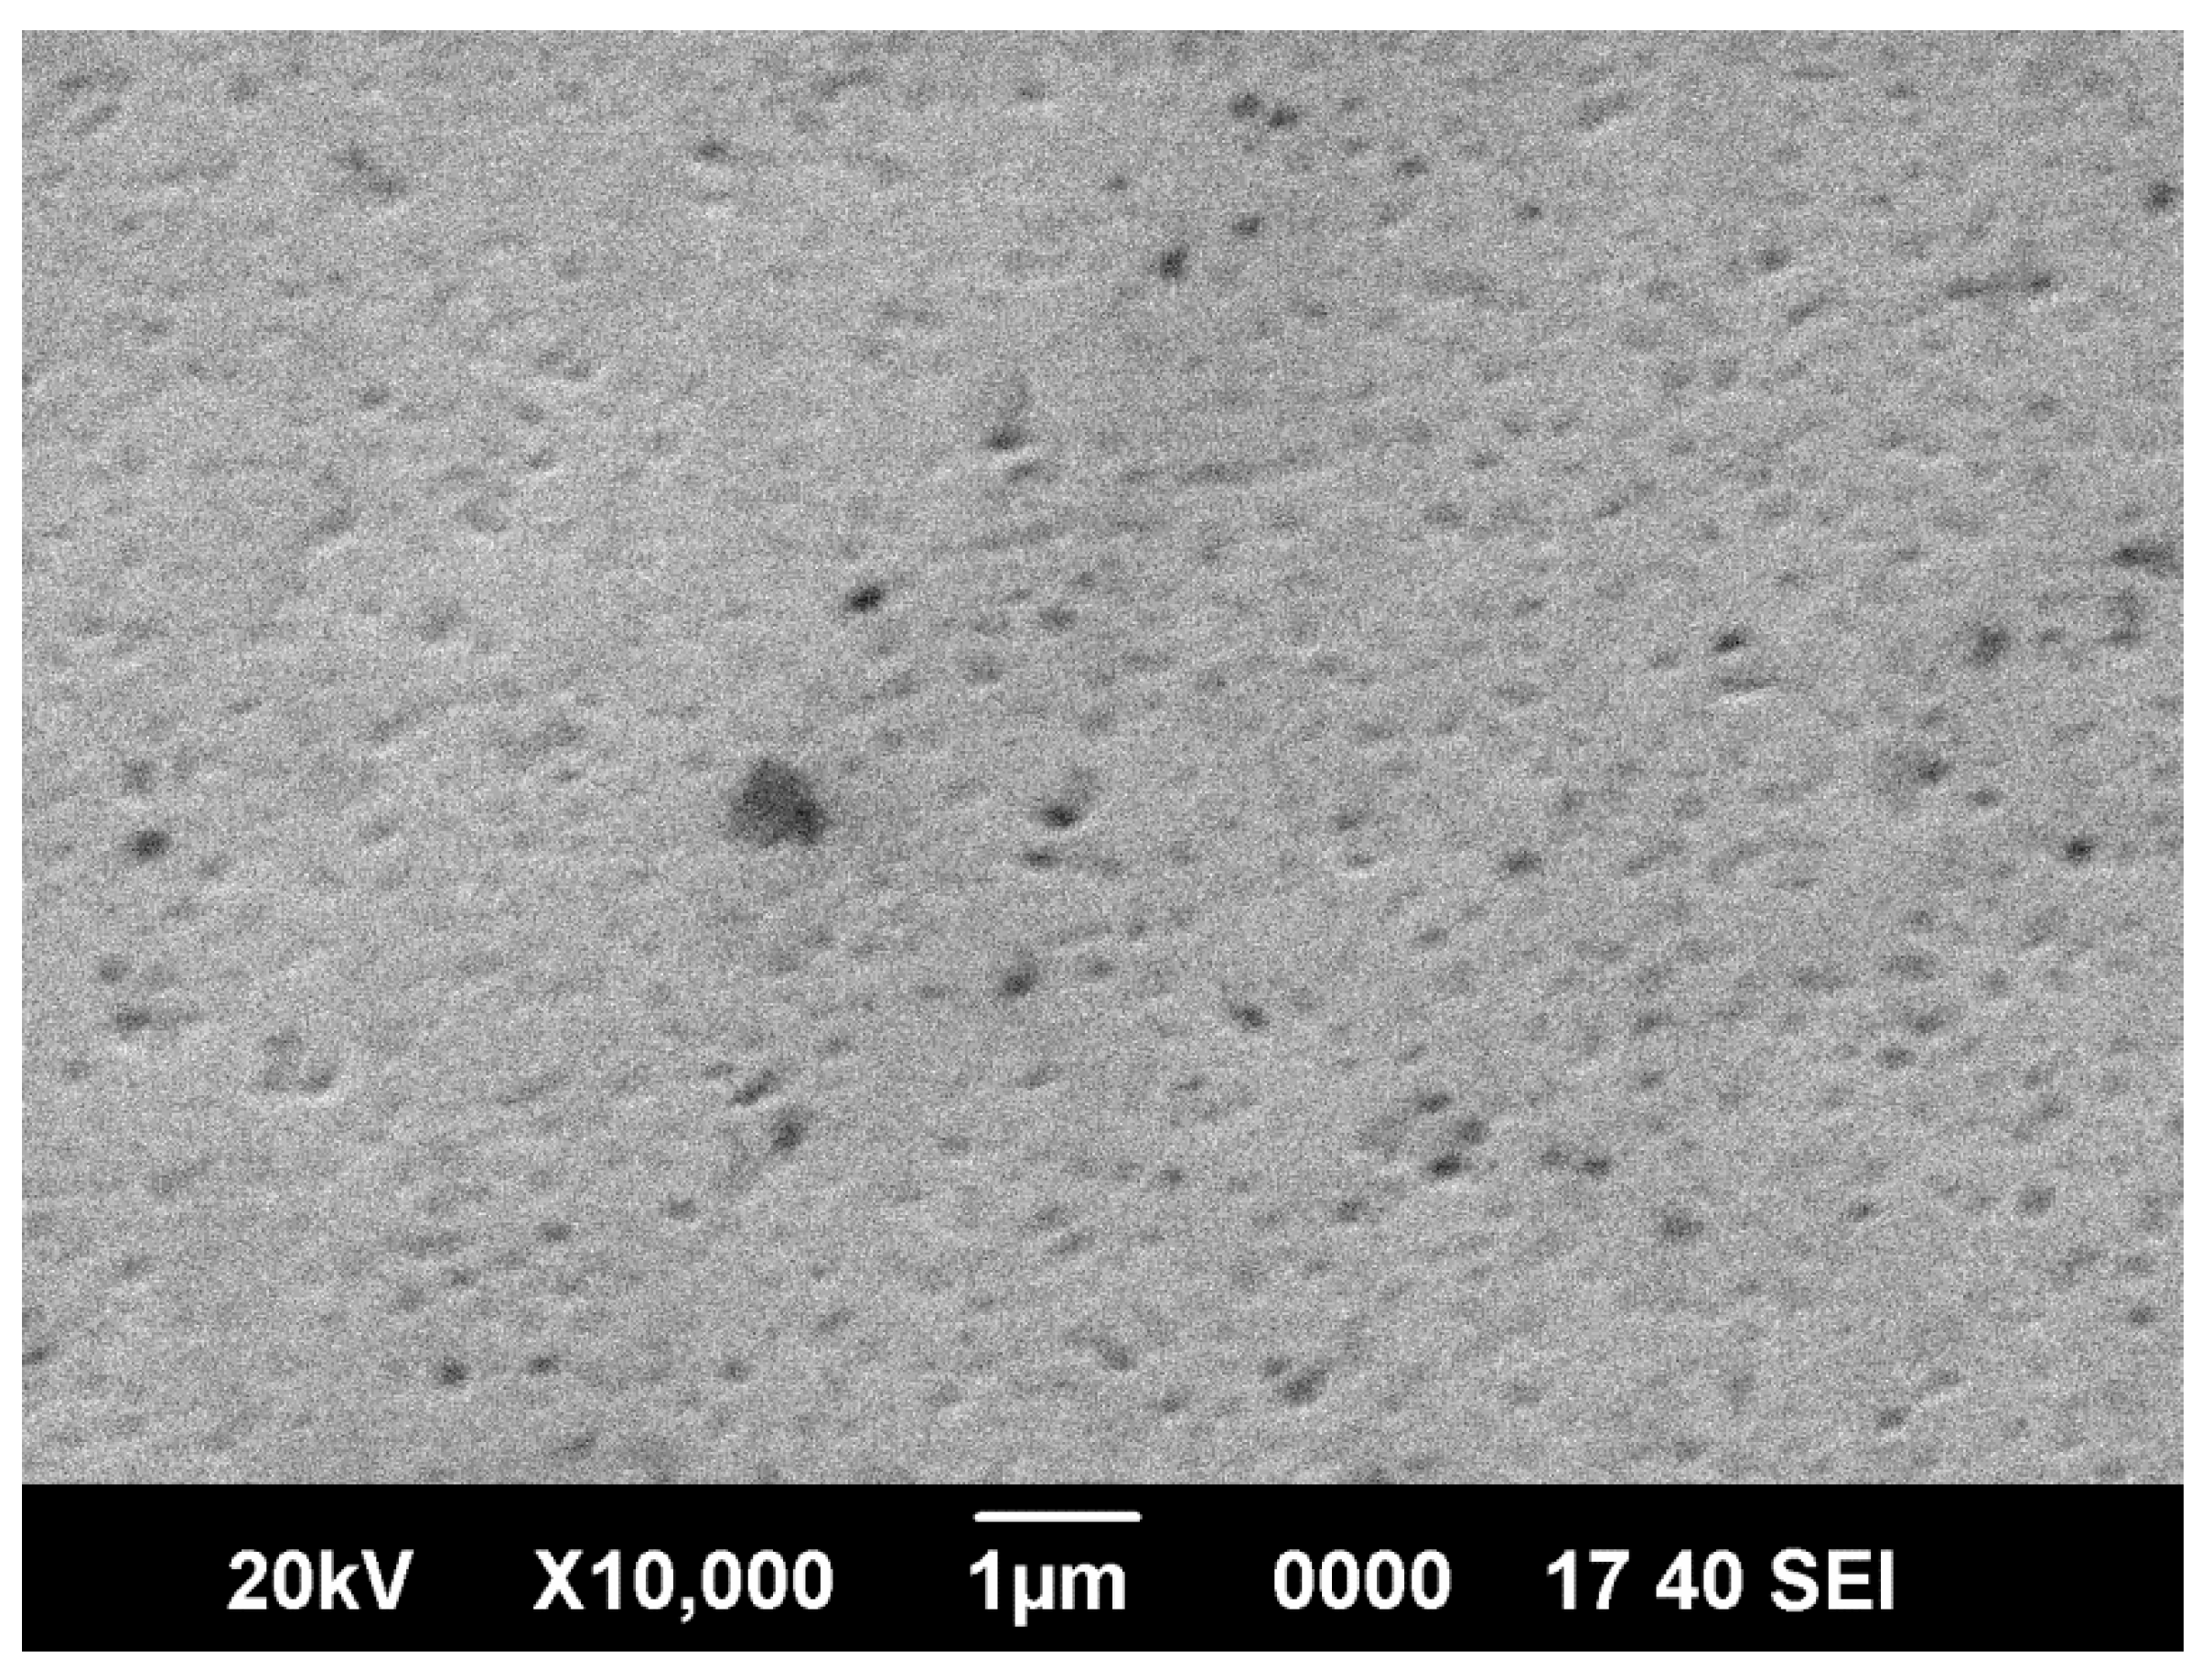
Figure 4 shows a microphotograph of the Ca
3TaGa
3Si
2O
14 crystal surface obtained by scanning electron microscopy in the secondary electron emission mode after thermal treatment of the substrate at 1000°C. In this case, a substrate was cut from the CTGS crystal and its surface was polished so that the surface roughness did not exceed 3 Å. The substrate was subjected to heat treatment in a vacuum, but only at temperatures above 800°C was there a significant change in the crystal surface, the surface became porous. In microphotographs, one can observe significant surface degradation due to the escape of Ga atoms from the crystal lattice to the surface and subsequent evaporation at high temperatures. That is, in this case there is a decrease in the number of Ga atoms in the crystal lattice. Therefore, it is advisable to determine the coefficient of thermal expansion in the temperature range up to 800°C, where there is a linear dependence of changes in the angular position of diffraction peaks on X-ray diffraction spectra.
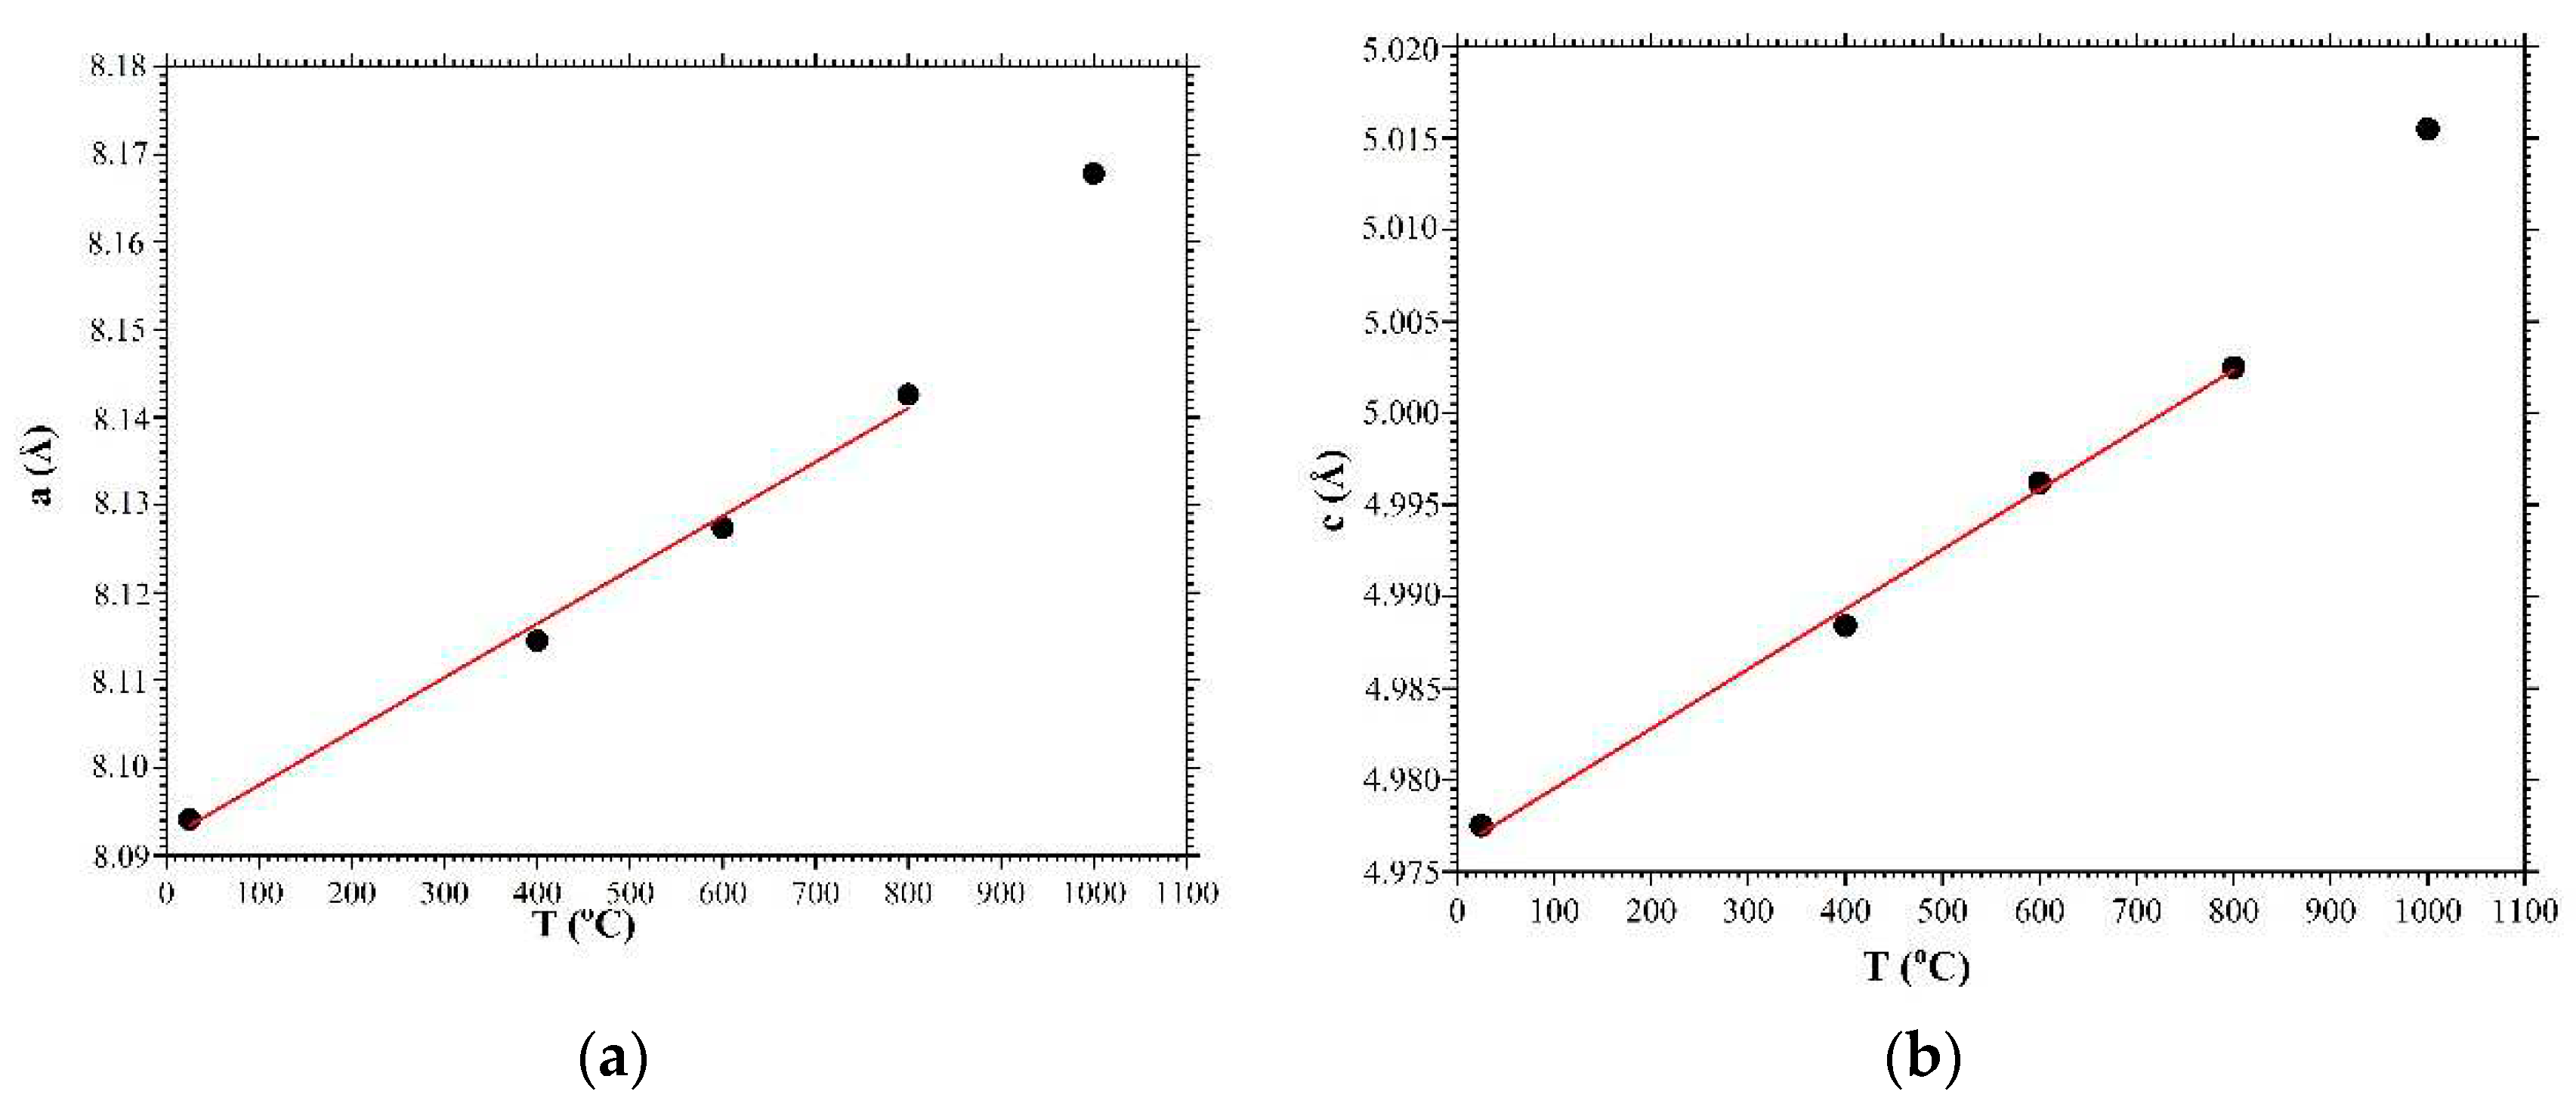
Figure 5 shows the dependences of the crystal unit cell parameters
and
of the CTGS crystal in the temperature range from 25°C to 1000°C. The black circles correspond to experimental data based on the diffraction spectra in
Figure 3. The red lines correspond to a linear approximation of the dependence of the change in the crystal unit cell parameters as a function of temperature. The coefficient of thermal expansion in our case is defined as
where
is the interplanar spacing at room temperature,
is the change in the interplanar spacing with the temperature change
. As noted earlier, crystals of the point symmetry group 32 have two independent coefficients of thermal expansion along direction
(direction [001])
and direction
(direction [110])
. Thermal expansion coefficients of the CTGS crystal were determined based on the results of linear approximation of the change in the parameters of the crystal unit cell in the temperature range 25÷800°C. The values of the thermal expansion coefficients for the CTGS crystal calculated from expression (1) were
K
-1 and
K
-1, respectively. These values are in a good agreement with the values obtained in [
26] when the change in the length of the CTGS crystal bar was measured with the change in the temperature. It should also be noted that the article [
26] demonstrated the nonlinear behavior of the coefficient of thermal expansion at temperatures below 0°C. And these studies demonstrate a deviation of the coefficient of thermal expansion from linear at temperatures above 800°C due to the decrease of Ga in the crystal lattice.
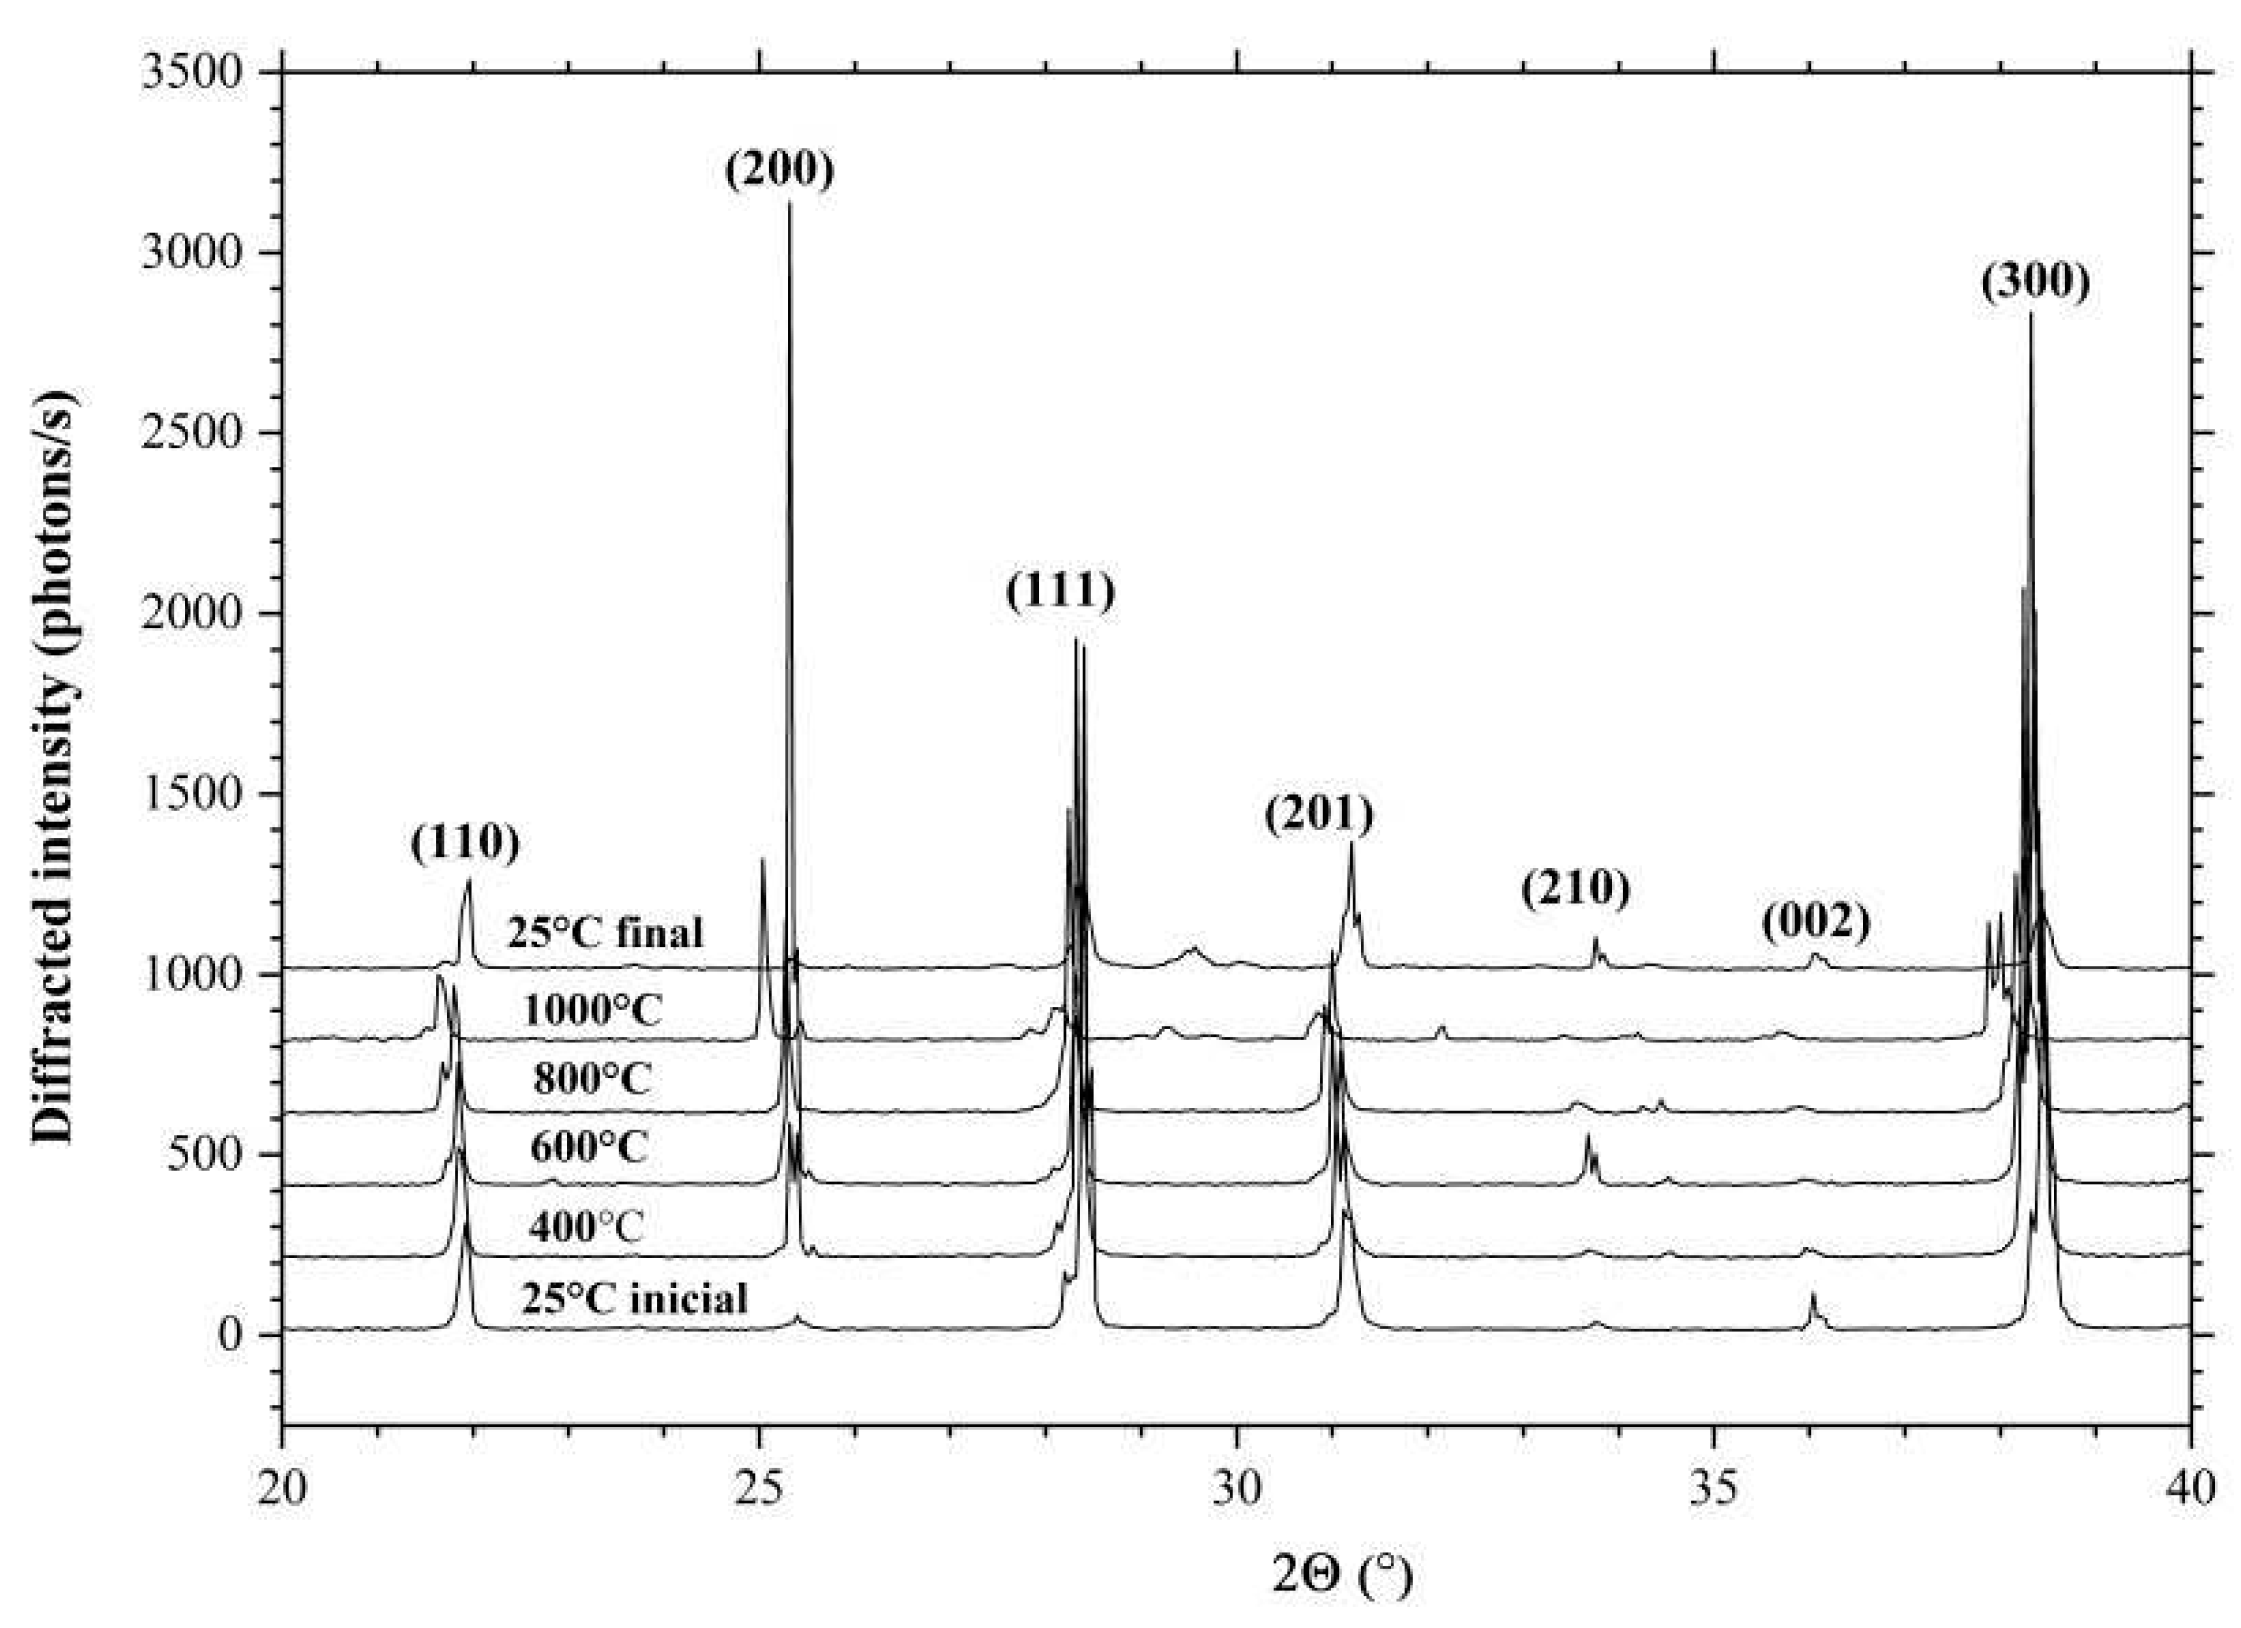
Figure 6 shows the diffraction spectra of the LGS crystal powder measured at 25°C, 400°C, 600°C, 800°C, 1000°C and 1200°C. It can also be observed that a change in temperature leads to a change in the position of the diffraction peaks by increasing the interplanar spacing. In the temperature range of 25÷800°C the change in the position of the diffraction peaks is linear, and at temperatures of 1000°C and 1200°C there is a stronger change in the interplanar spacing due to the removal of Ga from the crystal structure.
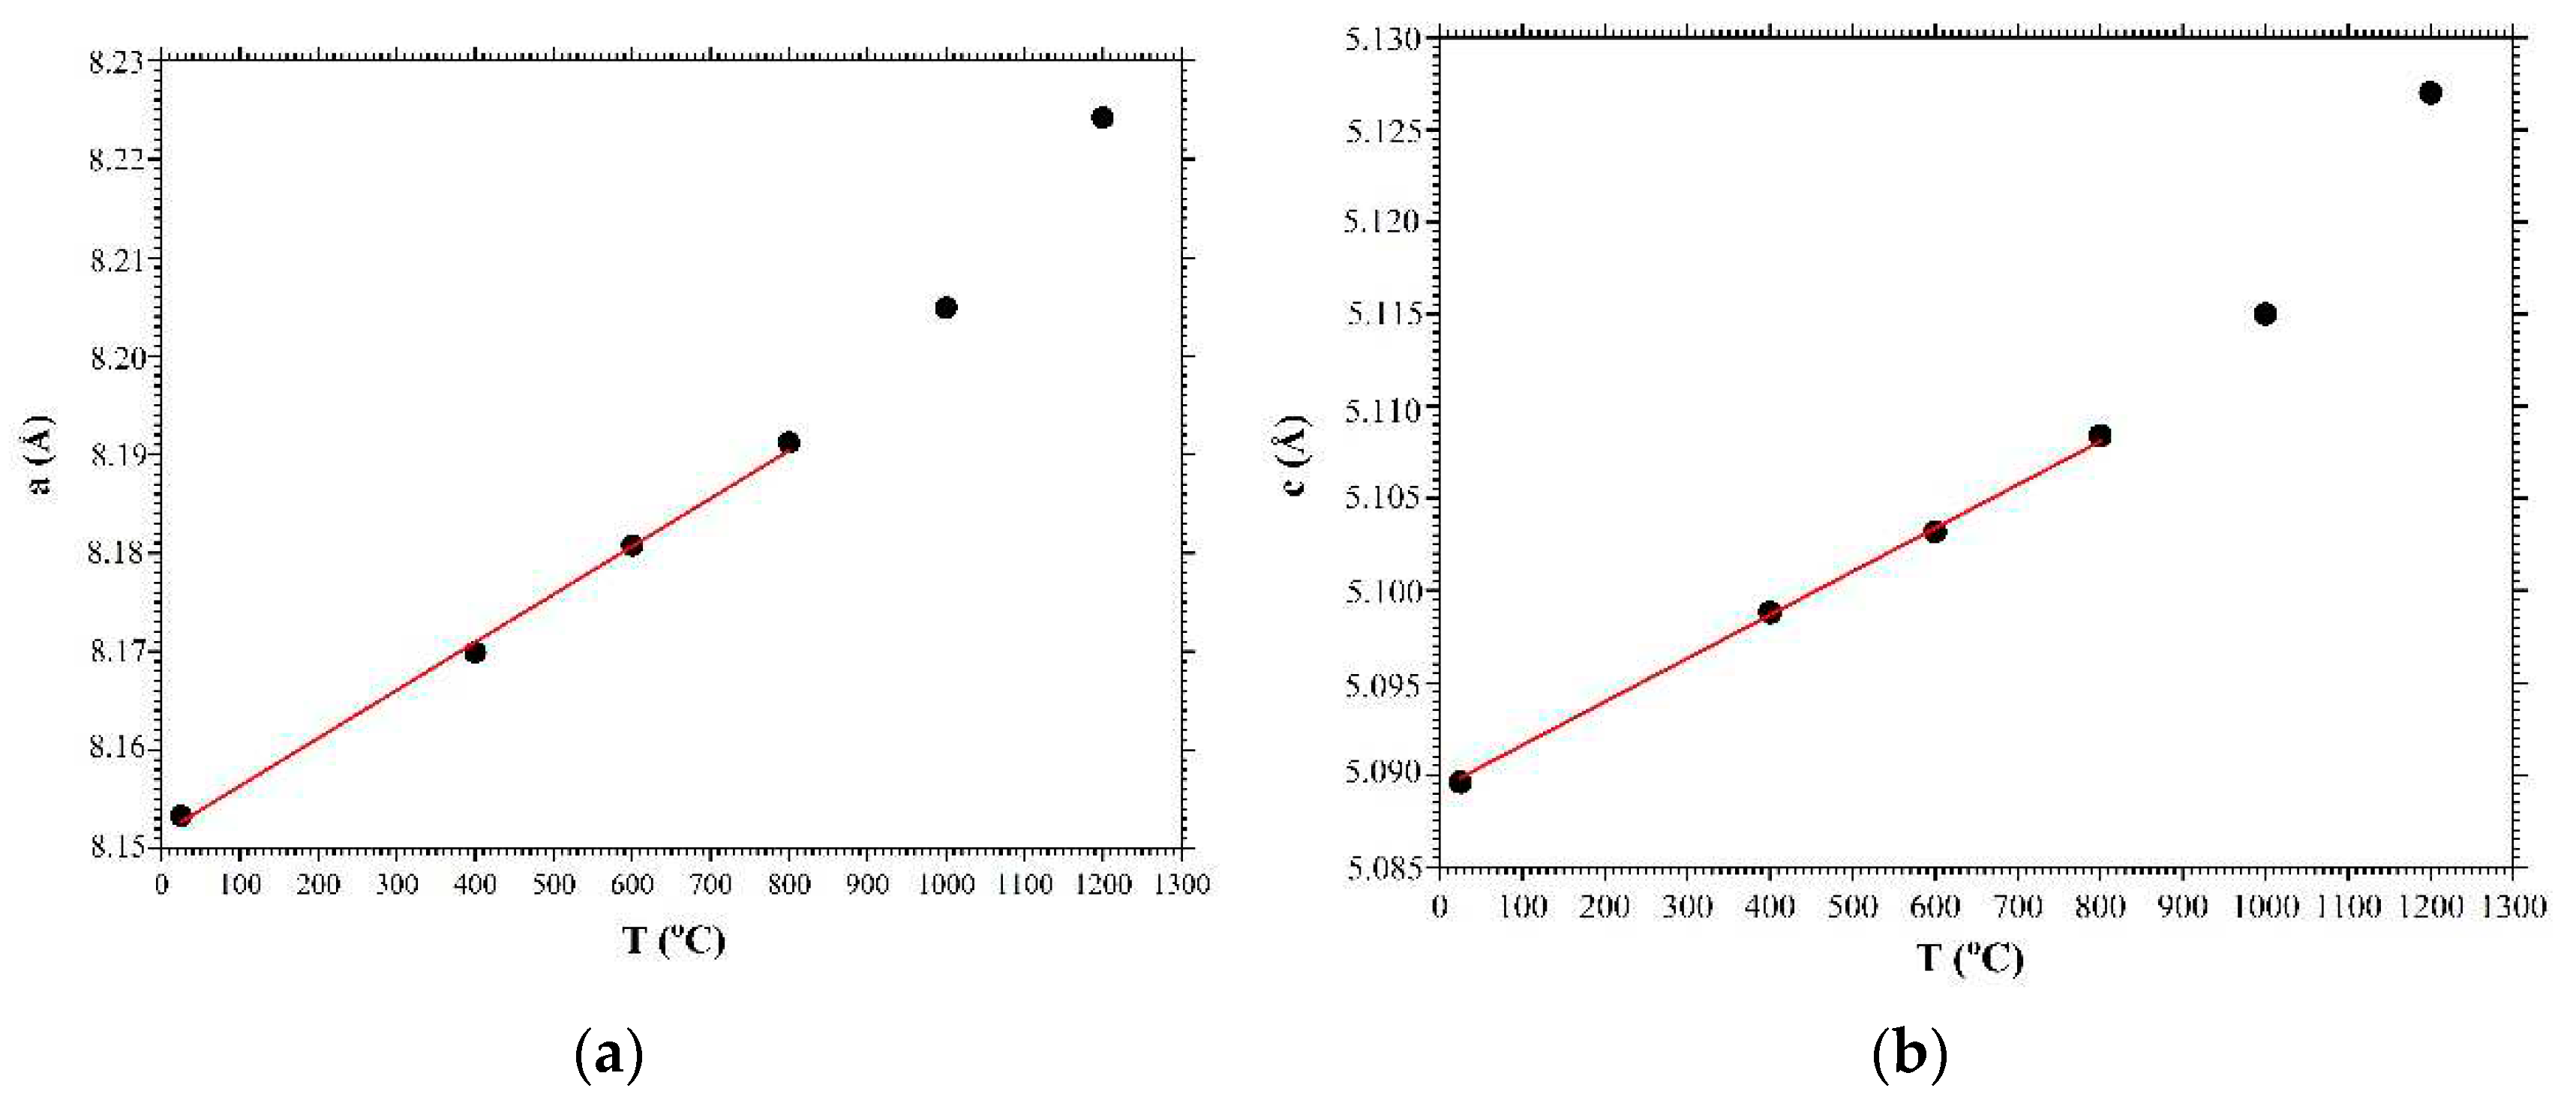
Figure 7 shows the dependences of changes in the parameters of the crystal unit cell
(a) and
(b) of the LGS crystal in the temperature range 25÷1200°C. In the figure, the black circles correspond to the experimental results based on the measured diffraction spectra of
Figure 6. The red lines are a linear approximation of the change in the crystal unit cell parameters as a temperature function, which were used to measure the thermal expansion coefficients. The values of thermal expansion coefficients for the LGS crystal were
K
-1 and
K
-1.
5. Conclusion
The thermal expansion coefficients were measured in crystals of the lantangallium silicate family (La3Ga5SiO14 and Ca3TaGa3Si2O14 crystals) by X-ray powder diffraction (CTGS: K-1 and K-1; LGS: K-1 and K-1). X-ray diffraction spectra were measured in the temperature range from 25°C to 1200°C. It is shown that the thermal expansion coefficients are linear in the temperature range 25÷800°C. At temperature above 800°C, a non-linear behavior of the thermal expansion coefficients (a sharp increase in the thermal expansion coefficient) is observed, associated with a decrease in the Ga content in the crystal lattice of crystals of the lanthanum gallium silicate family.
Author Contributions
Conceptualization, D.R. and D.K.; crystal growth, D.R.; X-ray powder diffraction, D.R., D.K.; calculation of thermal expansion coefficient, D.K.; writing—original draft preparation, D.R. and D.K. All authors have read and agreed to the published version of the manuscript.
Funding
This research was funded by Ministry of Science and Higher Education of the Russian Federation (Dmitry Roshchupkin: grant number 075-01304-23-00; Dmitry Kovalev: grant number FFSZ-2022-0009).
Conflicts of Interest
The authors declare no conflict of interest.
References
- Bohm, J.; Heimann, R.B.; Hengst, M.; Roewer, R.; Schindler, J. Czochralski growth and characterization of piezoelectric single crystals with langasite structure: La3Ga5SiO14 (LGS), La3Ga5. 5Nb0.5O14 (LGN), and La3Ga5.5Ta0.5O14 (LGT). Part I, Journal of Crystal Growth 1999, 204, 128–136. [Google Scholar]
- Bohm, J.; Chilla, E.; Flannery, C.; FroKhlich, H.-J.; Hauke, T.; Heimann, R.B.; Hengst, M.; Straube, U. Czochralski growth and characterization of piezoelectric single crystals with langasite structure: La3Ga5SiO14 (LGS), La3Ga5. 5Nb0.5O14 (LGN), and La3Ga5.5Ta0.5O14 (LGT). II. Piezoelectric and elastic properties, Journal of Crystal Growth 2000, 216, 293–298. [Google Scholar]
- Fu, X.; Víllora, E.G.; Matsushita, Y.; Kitanaka, Y.; Noguchi, Y.; Miyayama, M.; Shimamura, K. , Ohashi, N. Temperature dependence of electrical resistivity, dielectric and piezoelectric properties of Ca3TaGa3-xAlxSi2O14 single crystals as a function of Al content, Journal of Alloys and Compounds 2016, 687, 797–803. [Google Scholar]
- Xin, J.; Zheng, Y.; Kong, H.; Shi, E. From ab initio forecast of piezoelectric properties to growth of piezoelectric single crystals, Appl. Phys. Lett. 2008, 93, 252901. [Google Scholar]
- Fritze, H. High-temperature piezoelectric crystals and devices, J. Electroceram. 2011, 26, 122–161. [Google Scholar] [CrossRef]
- Roshchupkin, D.; Ortega, L. , Plotitcyna, O. ; Erko, A.; Zizak, I.; Irzhak, D.; Fahrtdinov, R.; Buzanov, O. Advanced piezoelectric crystal Ca3TaGa3Si2O14: growth, crystal structure perfection, and acoustic properties, Appl. Phys. A 2014, 114, 1105–1112. [Google Scholar]
- Roshchupkin, D.; Ortega, L.; Plotitcyna, O.; Irzhak, D.; Emelin, E.; Fahrtdinov, R.; Alenkov, V.; Buzanov, O. Piezoelectric La3Ga5. 3Ta0.5Al0.2O14 crystal: growth, crystal structure perfection, piezoelectric, and acoustic properties, Appl. Phys. A 2014, 116, 1477–1488. [Google Scholar]
- Roshchupkin, D.; Ortega, L.; Plotitcyna, O.; Erko, A.; Zizak, I.; Vadilonga, S.; Irzhak, D.; Emelin, E.; Buzanov, O.; Leitenberger, W. Piezoelectric Ca3NbGa3Si2O14 crystal: crystal growth, piezoelectric and acoustic properties, Appl. Phys. A 2016, 122, 753. [Google Scholar] [CrossRef]
- Shi, X.; Yuan, D.; Yin, X.; Wei, A.; Guo, S.; Yu, F. Crystal growth and dielectric, piezoelectric and elastic properties of Ca3TaGa3Si2O14 single crystal, Solid State Comm. 2007, 142, 173–176.
- Da Cunda, M.P.; Fagundes, S.A. Investigation on recent quartz-like materials for SAW applications, IEEE Trans. Sonics Ultrason. 1999, 46, 1583–1590. [Google Scholar]
- Adachi, M.; Karaki, T.; Miyamoto, W. Surface acoustic wave properties of La3Ga5SiO14 (Langasite) single crystals, Jpn. J. Appl. Phys. 1999, 38, 3283–3287. [Google Scholar] [CrossRef]
- Onozato, N.; Adachi, M.; Karaki, T. Surface acoustic wave properties of La3Ga5. 5Ta0.5O14 single crystals, Jpn. J. Appl. Phys. 2020, 39, 3028–3031. [Google Scholar] [CrossRef]
- Irzhak, D.; Roshchupkin, D. Piezoelectric strain coefficients in La3Ga5. 3Ta0.5Al0.2O14 and Ca3TaGa3Si2O14 crystals, AIP Advances 2013, 3, 102108. [Google Scholar]
- Irzhak, D.; Roshchupkin, D. Measurement of independent piezoelectric moduli of Ca3NbGa3Si2O14, La3Ga5. 5Ta0.5O14 and La3Ga5SiO14 single crystals, J. Appl. Cryst. 2018, 51, 1174–1181. [Google Scholar]
- Nênmejcová, A.; Brož, J. The effect of a direct electric field on the Laue diffraction photograms, Phys. Rev. 1938, 54, 379. [Google Scholar]
- Barsch, G.R. X-ray determination of piezoelectric constants, Acta cryst. A 1976, 32, 575. [Google Scholar]
- Annaka, S.; Nemoto, A. Piezoelectric constants of α-quartz determined from dynamical x-ray diffraction curves, J. Appl. Cryst. 1977, 10, 354. [Google Scholar] [CrossRef]
- Whatmore, R.W. , Goddard, P. A.; Tanner, B.K.; Clark, G F. Direct imaging of travelling Rayleigh waves by stroboscopic X-ray topography, Nature 1982, 299, 44–46. [Google Scholar]
- Cerva, H.; Graeff, W. Contrast investigation of surface acoustic waves by stroboscopic topography, Phys. Status Solidi (a) 1984, 82, 35–45. [Google Scholar]
- Zolotoyabko, E.; Shilo, D.; Sauer, W.; Pernot, E.; Baruchel, J. Visualization of 10 μm surface acoustic waves by stroboscopic x-ray topography, Applied Physics Letters 1998, 73, 2278.
- Sauer, W.; Streibl, M.; Metzger, T.H.; Haubrich, A.G.C.; Manus, S.; Wixforth, A.; Peis, J.; Mazuelas, A.; Härtwig, J.; Baruchel, J. X-ray imaging and diffraction from surface phonons on GaAs, Appl. Phys. Lett. 1999, 75, 1709–1711. [Google Scholar]
- Roshchupkin, D.; Ortega, L.; Snigirev, A.; Snigireva, I. X-ray imaging of the surface acoustic wave propagation in La3Ga5SiO14 crystal, Appl. Phys. Lett. 2013, 103, 154101. [Google Scholar]
- Roshchupkin, D.V.; Irzhak, D.V.; Tucoulou, R.; Buzanov, O.A. , X-ray Bragg diffraction from langasite crystal modulated by surface acoustic wave, J. Appl. Phys. 2003, 94, 6692–6696. [Google Scholar] [CrossRef]
- Roshchupkin, D.V.; Erko, A.I.; Ortega, L.; Irzhak, D.V. X-ray diffraction analysis of the surface acoustic wave propagation in langatate crystal, Applied Physics A 2009, 94, 477–484.
- Irzhak, D.; Roshchupkin, D. X-ray diffraction on the X-cut of a Ca3TaGa3Si2O14 single crystal modulated by a surface acoustic wave, Journal of Applied Physics 2014, 115, 244903.
- Sotnikov, A.; Schmidt, H., Haghighi, M.H.; Gorev, M.; Suhak, Y.; Fritze, H.; Sakharov, S. Material parameters of Ca3TaGa3Si2O14 (CTGS) piezoelectric single crystal at extreme temperatures, In Proceedings of the 2017 Joint Conference of the European Frequency and Time Forum and IEEE International Frequency Control Symposium (EFTF/IFCS), Besancon, France, 2017, 193-197. [CrossRef]
|
Disclaimer/Publisher’s Note: The statements, opinions and data contained in all publications are solely those of the individual author(s) and contributor(s) and not of MDPI and/or the editor(s). MDPI and/or the editor(s) disclaim responsibility for any injury to people or property resulting from any ideas, methods, instructions or products referred to in the content. |
© 2023 by the authors. Licensee MDPI, Basel, Switzerland. This article is an open access article distributed under the terms and conditions of the Creative Commons Attribution (CC BY) license (https://creativecommons.org/licenses/by/4.0/).
