1. Introduction-Research Question
In the following article we consider the role of RDE in the context of ESG. Traditionally, the role of RDE has been analysed with reference to economic growth. However, the originality of our article consists precisely in having considered the role of RDE within the context of ESG models. Certainly, the fruits of the RDE are not necessarily good and compatible with the development of civilization. In fact, the atomic bomb, the military sector, and many other inventions connected to the dominion of nations, are type of RDE that have had a negative impact in terms of ESG. In our case we focused on that type of RDE compatible with ESG models. Indeed, we analysed the RDE as if it were in full inspired by the ESG principles. ESG models are affirming themselves as business models either in the private sector either in the public sphere. The goals of the RDE are increasingly arranged in the scope of ESG, as happens for example in the case of the Sustainable Development Goals-SDG. Certainly, RDE can make an essential contribution in improving production and manufacturing systems by making them compatible with the environment. In addition, RDE can reduce social discrimination and improve governance models. However, the probability of a full compatibility between RDE and ESG also has a political profile. In fact, it should not be taken for granted that all countries are interested in the application of ESG models. For example, poor countries could ignore environmental sustainability issues and decide to pollute more to access faster economic growth. In fact, for poor countries the energy transition is complex and can lead to a removal from the path of economic development. In the same way, autocratic countries could ignore the issues of social equality and be more interested in promoting a model of hierarchical society with a high degree of discrimination. Just as not all countries are willing to accept principles of good governance. Many countries could consider good governance as a luxury reserved for medium-high income countries that does not take into consideration the socio-economic and cultural conditions of countries having a non-western institutional tradition. It follows that in these cases the purposes of RDE can be distorted. ESG models, together with the SDG risk being relegated to the western world. If, on the other hand, as most likely, the ESG models will be relegated to the western world, then RDE effects will also be divergent between ESG countries and non-ESG countries.
2. Literature Review
In the following part, a part of the scientific literature relating to the role of RDE is analyzed. The analysis does not want to be exhaustive and simply aims to introduce the theme.
RDE and Digitalization. The investment in research and development is necessary to support digitization processes. Although in this regard, it is necessary to distinguish between RDE, technological innovation and digitization. In fact, not all investments in R&D generate outputs evaluable in terms of technological innovation and useful for digitization. In addition, a significant part of technological innovation is made without investments in R&D also having a significant impact in terms of digitization. The only stable relationship is between technological innovation and digitization. In fact, generally technological innovation, especially in the IT field, generally has a significant impact in terms of digitization. However, technological innovation is not necessarily the fruit of the RDE. Being able to exist in fact also the Non-R&D Innovation Technology.There is a positive relationship between RDE and the increase of Information and Communication Technology-ICT specialists in Romania [1]. The investment in R&D is positively associated to innovation in European countries in the period 2000-2019 [2]. There is a positive relationship between the attractiveness of research systems and the level of innovation for 36 European countries during the 2000-2019 [3].
RDE in the Private Sector. The RDE is essential for the development of companies in the western capitalist market system. In fact, the possibility of increasing the output for the same input depends on technological innovation and the investment in R&D. However, it is complex to create institutions capable of supporting companies to increase technological innovations. In fact, by definition, investments in R&D are risky. Therefore, it is difficult for companies to be able to finance R&D through their own resources or with the use of the banking system. The development of financial markets has promoted the arise of a new kind of professionals able to manage technological risks i.e. venture capitalists. Venture capitalists can evaluate the risks and offer financial resources to sustain R&D. However, the growth of interest rates to combat inflation may have a negative impact on the ability of venture capitalists to finance technological innovation and R&D. In fact, in the presence of a higher interest rates, the financial component of the risk tends to increase. The level of RDE expenditure in the private sector tend to growth if firms are embedded in an economic environment in which also clients, peers and suppliers invests in R&D. Furthermore, the level of RDE in the private sector is positively associated to the growth of R&D expenditure at the university level [4]. There is a positive connection among RDE in the private sector, the number of innovative enterprises and GDP growth in Kazakhstan [5]. The level of RDE in Poland in the period 2015-2019 is insufficient to sustain the economic growth [6]. RDE improves the level of competitiveness in manufacturing industries in Poland in the period 2009-2016 [7]. There is a positive relationship between RDE and the financial performance of 41 companies listed at the Borsa Instabul [8]. The increase in RDE improves net sales and the number of workers in Europe [9]. The level of patent applications is positively associated either to private co-founding of public RDE either with RDE in the business sector [10]. RDE in the private sector improves the diffusion of opportunity driven entrepreneurship in Europe [11]. The level of private co-founding of public RDE is negatively associated to the ability of SME to collaborate in innovation in Europe [12]. RDE in the private sector improves the level of intellectual assets in Europe [13]. There is a negative relationship between private investment in innovation and private co-founding of public RDE in European countries [14]. The negative effect of RDE on dividends in high-tech companies is mitigated by high ESG scores [15]. RDE significantly improve the performance of listed companies [16].
RDE in the Public Sector. The impact of public spending in R&D has a contrasting role. In technologically evolved countries, public spending in R&D is low. In fact, in these countries the financial efforts of the R&D and technological innovation tend to be supported by private companies. Private companies have an interest in investing in R&D to develop more patents and increase the level of market power. Furthermore, thanks to the R&D private companies can improve their products and services. The fact that, at country level the degree of public R&D is high indicates that companies have low proclivity to innovation. RDE in the public sector is negatively associated to the innovation in 36 European countries in the period 2000-2019 [17]. RDE in the public sector is negatively associated to the number of most cited scientific publication in Europe [18]. RDE in the public sector is negatively associated to the presence of foreign doctorate students in Europe [19]. There is a positive relationship between RDE in the public sector and the level of design applications [20].
RDE and Exports. Countries that have a higher level of RDE tends to be more competitive. In countries with high levels of RDE the firms are able to produce better goods and services. Firms that innovate more also tend to win in the global competition thank to exports. If a country wants to improve the exports of high value-added products and services, then it should improve the level of RDE. There is a positive relationship between the level of RDE and the level of high-tech product exports in OECD countries [21]. RDE is positively associated to high tech product export in 25 OECD countries in the period 1997-2016 [22]. There is a positive relationship between RDE in the private sectors and the level of export of medium and high-tech products manufactured in Europe [23]. The increase in RDE in the private sector improves the level of knowledge intensive exports in the case of European countries in the period 2000-2019 [24]. Turkey can increase the export of high-tech products and services through the improvement of RDE following the path of others OECD countries [25]. RDE and CSR considered as a proxy of ESG orientation have a positive role in promoting exports and access to foreign markets [26].
RDE and ESG. There is a positive relationship between RDE and the pursuit of ESG goals. In effect RDE can promote better environmental sustainability, greater social responsibility, and a more efficient good governance. If ESG models drive RDE then the results of RDE can generate a multiplier effect on the implementation of ESG policies at national and world level. Startups that are more ESG compliant also have greater ability to maximize RDE having better patent utilization [27]. The investment in RDE and innovation does not necessarily generate positive effects on the environment in Asian countries: i.e. while on one side traditional innovation improves carbon emissions, on the other side only environmental innovation has a positive impact on environmental sustainability [28]. ESG performance has a positive effect on RDE for companies listed in Indonesia Stock Exchange in the period 2016-2020 [29]. RDE is positively appreciated by stakeholders’ investors in an ESG framework in the case of companies listed in the 100 Euronext index [30]. R&D intensity is negatively associated to Return on Assets-ROA, and positively associated to Return on Equity-ROE and Tobin’s Q in a set of 510 firms with ESG scores in 17 countries in the period 2010-2018 [31]. RDE improve the probability to achieve the Sustainable Development Goals-SDG in EU 16 countries during the period 1997-2014 [32]. RDE has a positive effect in increasing the productivity of maize crop in Pakistan, India, and China [33].
RDE and Economic Growth. The level of RDE is positively associated to economic growth. RDE is the only key to promote economic growth in the presence of fixed inputs i.e. the main assumption in the short period. RDE is also a strategic asset. The technology rivalry between USA and China shows that RDE is essential to gain global hegemony and credibility. RDE is positively associated to economic growth for small European countries such as Estonia and Finland [34]. The investment in R&D can improve the let the Estonian economy converge on the path of the Germany [35]. The attractiveness of national research systems improves the ability to innovate at national level [36].
RDE and Human Capital. To develop a high level of RDE it is necessary to invest in human capital at the country level. In fact, the R&D is a sector based on high intensity of human capital. Countries that have the best university systems also tend to have the best results in terms of R&D thanks to the ability to educate human capital. However, it is likely that in the future the relationship between R&D and human capital will become negative. In fact, the development of artificial intelligence could allow the affirmation of scientific research methods based on algorithms with low intensity of human capital. There is a positive relationship between the attractiveness of research systems and the level of human capital in Europe [37]. Private co-founding of public RDE has a negative impact on lifelong learning in European countries [38]. The attractiveness of research systems improves the level of international scientific co-publication in Europe [39]. RDE either in the public sector either in the private one is positively associated to the improvement of human capital in 36 European countries in the period 2000-2019 [40].
RDE and Finance. RDE requires adequate financial institutions and organizations. In fact, the possibility of enduring the risks connected to the R&D activity requires the investment of huge financial resources. These resources can be acquired through specialized financial intermediaries i.e. banks, venture capitalists or business angels. If a country has a low level of financial development, then it will not be able to sustain RDE. The level of financial resources to sustain innovation increases with private co-founding of public RDE and RDE in the public sector [41]. RDE do not improve the level of firm value in a set of companies listed on the Nigeria Stock Exchange during the period 2010-2019 [42].
| Literature Review by Main Theme |
| Main Theme |
References |
| RDE and Digitalization |
[1], [2], [3] |
| RDE in the Private Sector |
[4] , [5], [6], [7], [8], [9], [10], [11], [12] , [13] , [14] , [15], [16] |
| RDE and Exports |
[21] , [22], [23], [24] , [25] |
| RDE and Economic Growth |
[34], [35] |
| RDE in the Public Sector |
[17] , [18], [19] , [20] |
| RDE and Human Capital |
[37] , [38], [39], [40] |
| |
[41] , [42] |
| RDE and ESG |
[27] , [28], [29], [30], [31], [26], [32], [33] |
3. The Econometric Model for the Estimation of the Value of RDE in the Context of the ESG Models
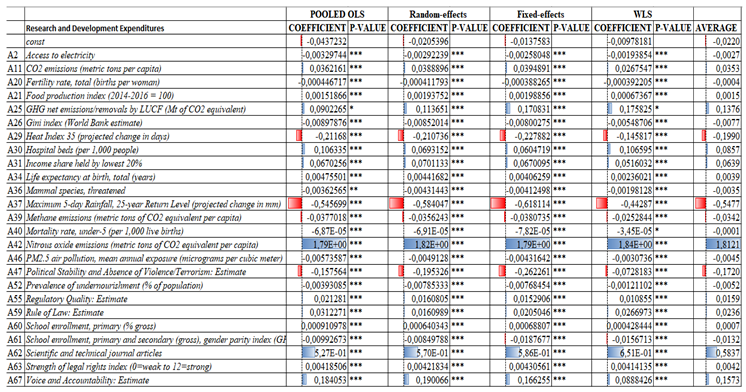
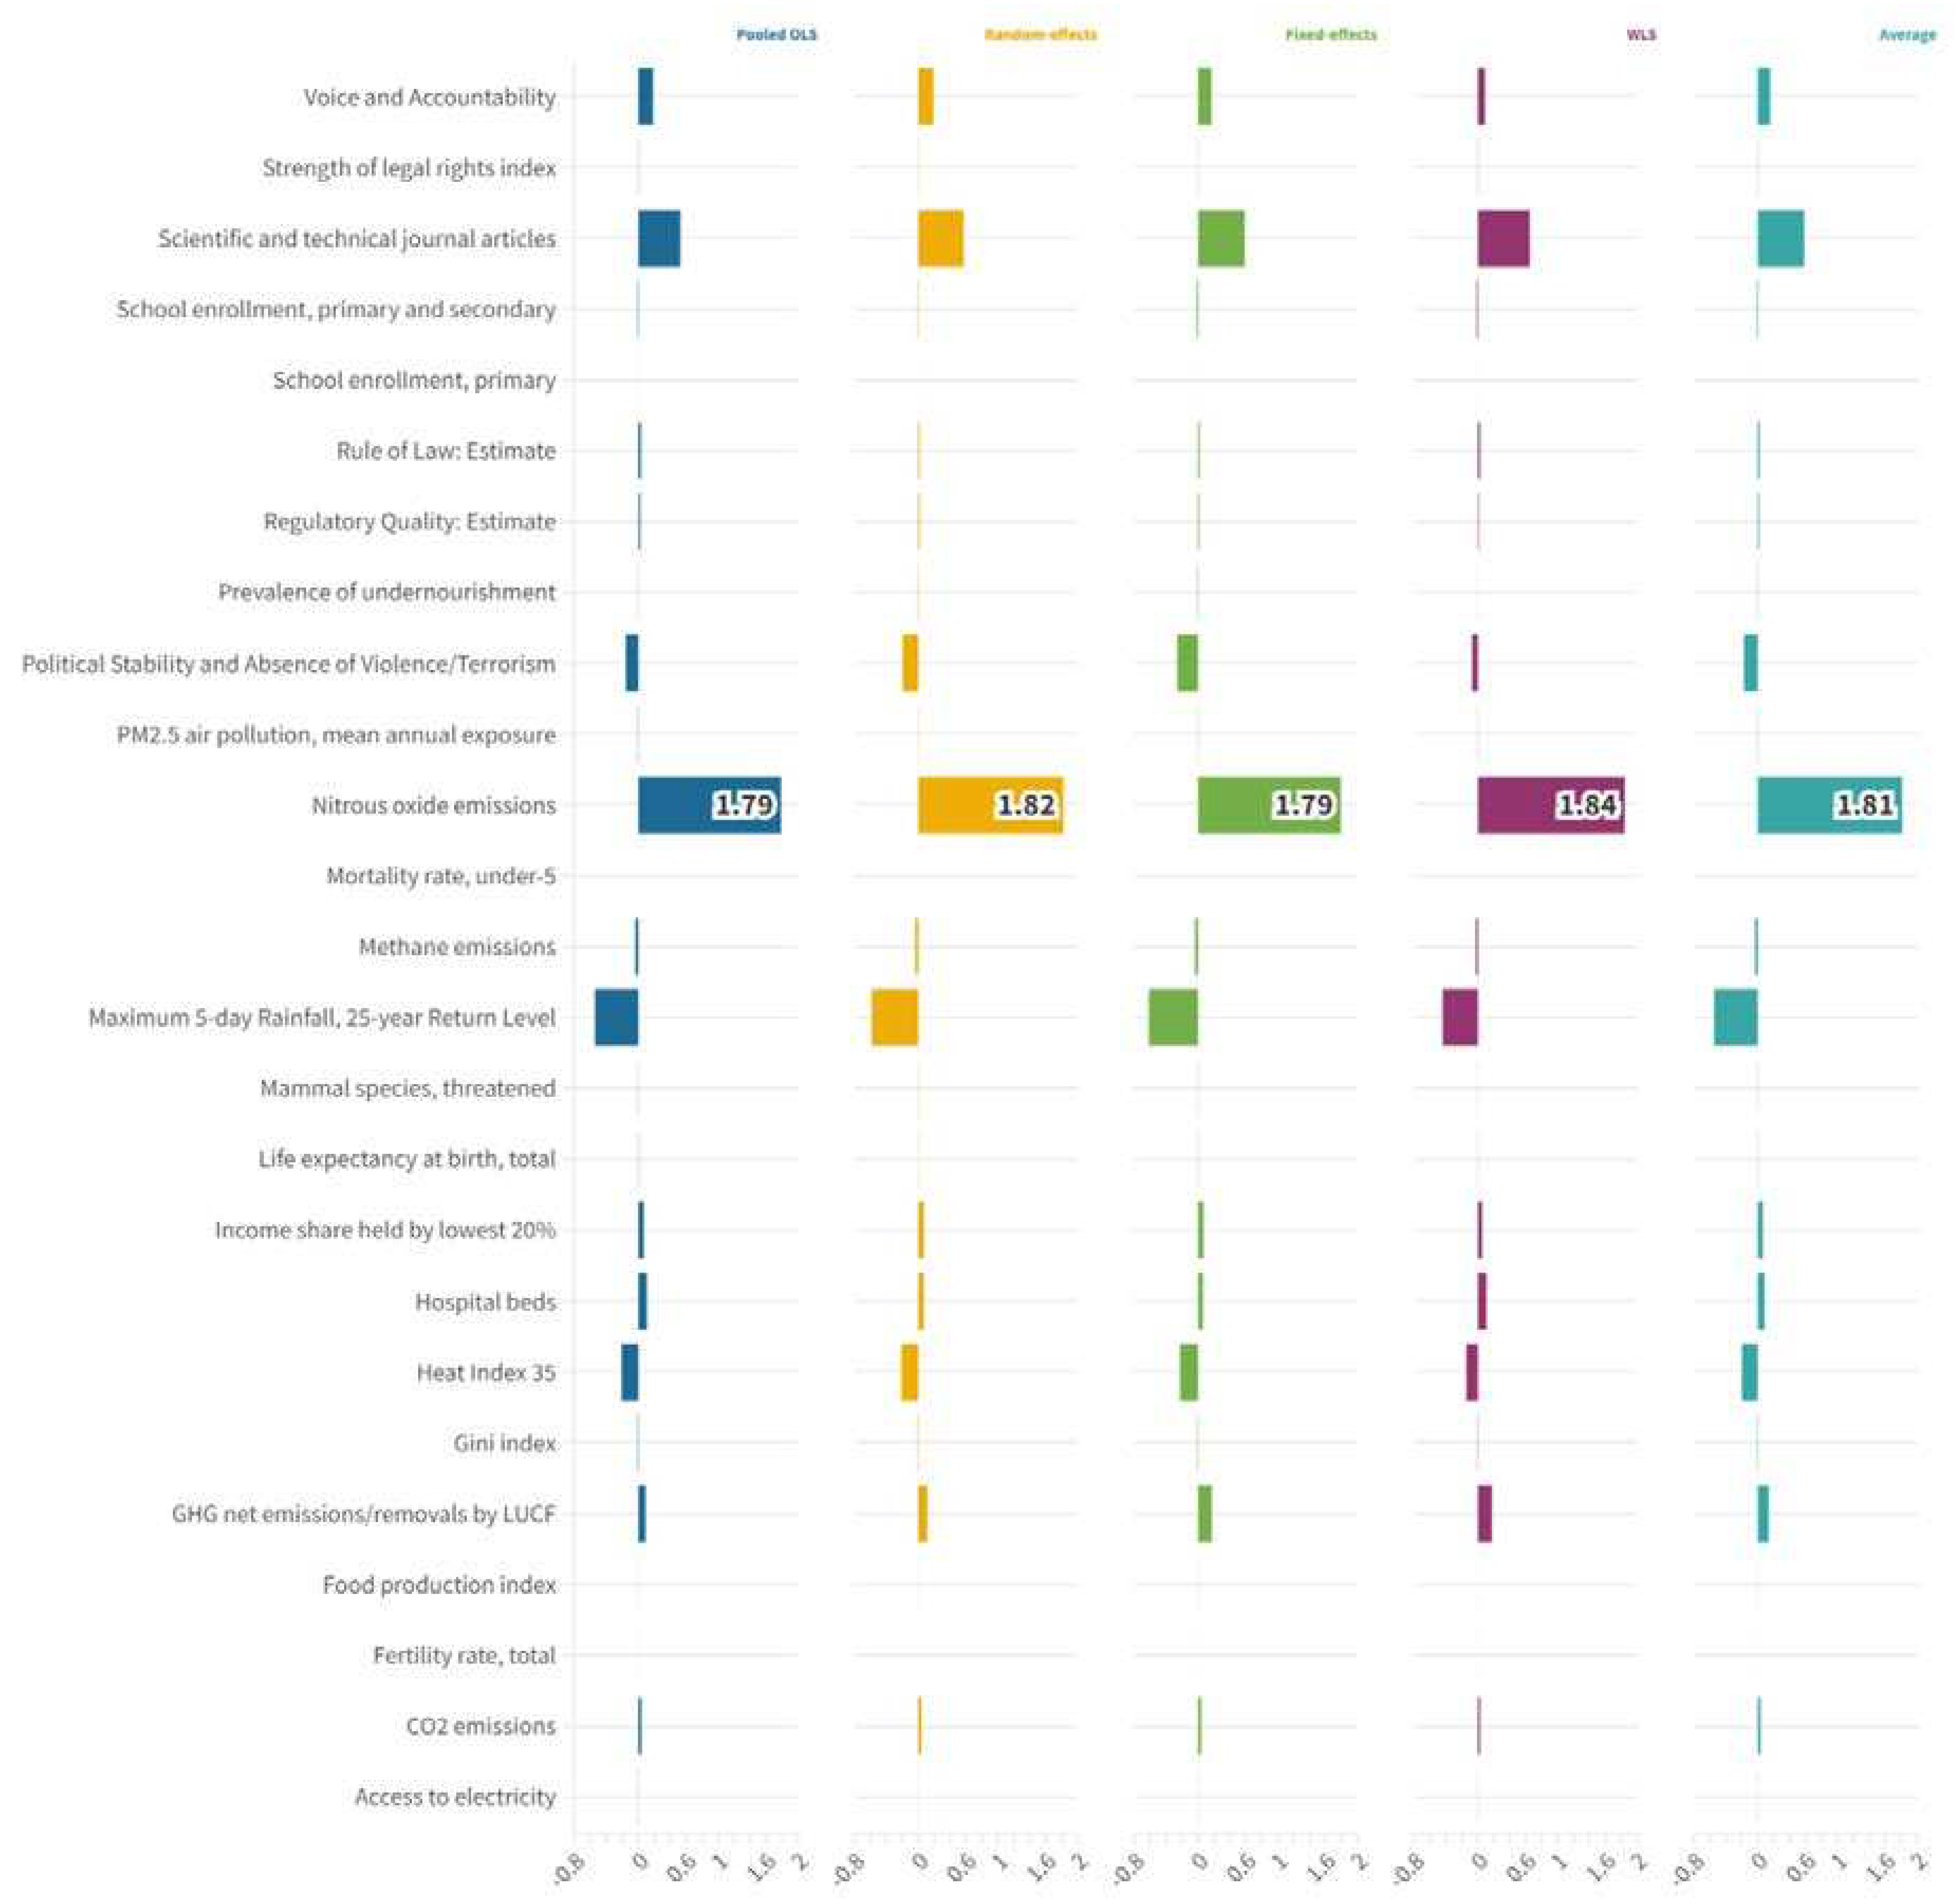
To determine the value of RDE in the context of the ESG variables of the World Bank dataset, we used a set of econometric tools and techniques, namely: Pooled OLS, Panel Data with Random Effects, Panel Data with Fixed Effects, and WLS. The results of the analysis led us to choose 25 variables from the 65 available in the original World Bank dataset. The decision to use panel models was a necessity to make the most of the available dataset. In fact, panel models allow the use of individualized data that highlight the trend in terms of historical series of the variables of a set of countries considered. The Pooled OLS model was added as further confirmation of the tested econometric relationships. The values analysed turn out to be statistically significant from the point of view of the p-value. The analysis we have conducted cannot be considered as relevant from the point of view of cause-effect relationships. In fact, in our case we have not used any of the metric tools to analyze the causal link, such as for example in the case of Gender Causality. We cannot therefore affirm that a certain variable causes another, or that there are cause-effect relationships between the variables of the model used, nor can we infer which directions the causal link is. On the contrary, we can only infer the presence of associations between the variables presented. In fact, we will refer to variables that are positively or negatively associated with the variable of interest or RDE. Specifically, we have estimated the following equation:
Were and We found that the level of RDE is positively associated to:
NOE: considers nitrous oxide emissions, which are emissions deriving from the combustion of agricultural biomass, industrial activities, and livestock management. There is a positive relationship between the NOE value and the RDE value. The countries that emit the highest levels of NOE are China, the United States, India, Brazil, Indonesia, Pakistan, Cameroon, Russia, Australia, and Argentina. Countries that emit high levels of NOE also tend to have more advanced industrial systems and therefore to invest more in research and development. It is certainly the case of China and the United States and of Australia. Furthermore, since the growth in the value of the NOE tends to generate higher levels of pollution, there is a greater orientation towards investments in research and development for the sustainability of production systems.
STJA: considers the number of articles in technical and scientific subjects published in the fields of physics, biology, chemistry, mathematics, clinical medicine, biomedical research, engineering and technology, earth science and space. From a strictly metric point of view, the countries with the highest levels of STJA are China, the USA, India, Germany, Japan, the United Kingdom, Italy, South Korea, France and Brazil. These countries have high levels of investment in terms of RDE. It follows that there is a positive relationship between the RDE and the STJA value. The two variables are closely connected as the results of scientific research are often measured in terms of scientific publications or patents. In fact, scientific research, both basic and applied, requires the publication and communication of results to the scientific community also to open the debate and activate the processes of falsification. Scientific publications take place in referred journals with the peer review method to guarantee the impartiality of the publication process. However, the method of peer review and publication in journals that have a high h-index can be discriminatory especially against scientific research conducted by young researchers or on highly innovative topics. In fact, young researchers hardly publish in high-level journals due to the lack of credibility and the necessary scientific reputation. Furthermore, new topics are generally not of interest to journals with a high h-index, which instead tend to publish mainstream research. The result is a system of scientific publications which tends to be conservative, and which ends up prejudicing both new researchers and innovative ideas, putting the efficiency of RDE at risk.
VA: captures perceptions of the extent to which a country's citizens are able to participate in the selection of their government, as well as freedom of expression, freedom of association and freedom of the media. Countries that have the highest VA levels are: Norway 1.72, Finland 1.61, New Zealand 1.59, Switzerland 1.53, Netherlands, 1.52, Denmark, 1.51, Sweden 1.50, Luxembourg 1.50, Canada 1.47, Austria 1.39. There is a positive relationship between the VA value and the RDE value. This relationship indicates that the choice of a country to have democratic institutions and to guarantee freedom of expression and freedom of the media has a positive impact in terms of RDE. Scientific and technological research is connected to a type of civil liberty similar to the freedom of the media and the expression of free thought. In fact, generally people who are applied to scientific research tend to be disinclined to follow pre-established hierarchical guidelines, as the results of research do not necessarily produce outputs that are to the liking of the ruling and political class. Furthermore, the participation of the population in democratic choices can also increase the value of RDE expenditure. In fact, citizens can ask the government and businesses to invest in R&D to improve the health system, the quality of the environment and to promote the economic growth. On the contrary, people who live under dictatorial regimes or with little political freedom have even greater difficulty in asking governments and companies to invest in solving important problems connected to scientific research and technological innovation.
GHG: net GHG emissions/removals are manifested in changes in atmospheric levels of all greenhouse gases attributable to forestry and land use change activities, including but not limited to (1) emissions and CO2 removals resulting from decreases or increases in biomass stocks due to forest management, logging, firewood harvesting, etc.; (2) conversion of existing forests and natural grasslands to other land uses; (3) removal of CO2 from abandonment of previously managed land; and (4) soil CO2 emissions and removals associated with land use change and management. There is a positive relationship between the GHG value and the RDE value. The top 10 countries by GHG emission level in million metric tons in 2019 worldwide are: China with a value of 9,887 units, United States with a value of 4,745, India with 2,310, Russia with 1,640, Japan with 1,056, Germany with 644 units, South Korea with 586, Iran with 583, Canada with 571 and Saudi Arabia with 495. With the exception of Saudi Arabia, Russia and Iran, all other countries have high RDE levels. The reasons that generate a positive relationship between the GHG level and the RDE level consist in the fact that many Western countries that invest in research and development also have very high levels in terms of GHG. However, it is highly probable that this relationship between GHG and RDE levels could change in the future because of the green-oriented economic policies introduced at international level. In fact, the change in business models, the attention towards climate change and the sensitivity that the western population has towards the theme of respect for the environment can generate an effect in the medium-long term in terms of reduction of GHG value.
HBs: hospital beds include inpatient beds available in public, private, general and specialized hospitals and rehabilitation centres. In most cases, acute and chronic care beds are included. The number is calculated per 1000 inhabitants. The top ten values for the number of hospital beds are shown below: Japan with 13.05, South Korea 12.27, Russia with 8.05, Germany and Mongolia with 8%, Bulgaria with 7.45, Austria with 7 ,37, Hungary with 7.02, Romania with 6.89 and the Czech Republic with 6.63. There is a positive relationship between the HBs value and the RDE value. This positive relationship is because the countries that have a positive RDE value are also countries that have high health expenditure values and therefore have a greater availability of hospital beds. This condition is certainly true for Germany, South Korea and Austria. On the other hand, the value of Russia and Mongolia, i.e. the countries that have a low per capita income and which nevertheless have high values of hospital beds, arouse particular interest. The growth in the number of bed places depends on health policies defined at country level, which target the number of bed places based on estimated risk factors in the population. Western countries generally have higher levels of bed places thanks to the presence of a welfare state. Democratic countries also have the opportunity to make additional investments in public health thanks to the presence of public pressure that claims health rights as essential rights together with the right to education and essential political and civil freedoms.
ISHL20: the percentage share of income or consumption is the share belonging to population subgroups indicated by deciles or quintiles. There is a positive relationship between the value of ISHL20 and the value of RDE. The countries having the highest levels of ISHL20 are: Belarus and Slovenia with 10.3%, Armenia with 10.2%, Ukraine with 10.00%, Czech Republic with 9.8%, Finland with 9.5%, Belgium, the Kyrgyz Republic and Denmark with 9.4%, the Netherlands with a value of 9.2%. There is a positive relationship between the value of ISHL20 and the value of RDE. Countries that have high ISHL20 values also have high RDE values. This relationship is because the value of ISHL20 tends to increase especially in western countries due to the growth of social inequality. In fact, since the 2000s there has been a growth in inequality in Western countries, which also occurred in the context of increased economic growth and the development of new technologies because of an improvement in the level of RDE. The growth of inequality in the Western world also occurred following the elimination of welfare state economic policies, i.e. the dismantling of public economic policies that supported the private economy. A further element that has produced a growth in social inequality has been the reduction of taxation for the upper-middle income classes. The reduction of taxation for the rich, the privatization of public companies, the dismantling of the welfare state, the growth of job insecurity, have led to an increase in people with low incomes within the distribution defined at the national level. It follows that as a result of these socio-economic changes there has been a growth in social inequality even in countries with high per capita incomes and in the presence of growth in technological innovation.
: carbon dioxide emissions are those deriving from the combustion of fossil fuels and the production of cement. They include carbon dioxide produced during the burning of solid, liquid and gaseous fuels and gas flaring. There is a positive relationship between the value and the RDE value. The countries that have a high value of value are: Qatar with a value of 32.76, Bahrain with an amount of 22.26, Kuwait with 20.86, United Arab Emirates with 20.50, Oman with 16.52 , Brunei Darussalam with 15.96, Canada with 15.43, Luxembourg with 15.31, Australia with 15.25, United States with 14.7. Countries that have higher RDE investment levels also have high levels. This condition derives from the fact that countries that have high levels of RDE also have high levels of economic growth and tend to consume more energy and therefore also have more emissions. It is probable that in the future the relationship between and RDE could be modified and become a negative relationship following the application of green oriented economic policies able to reduce pollution and emissions. In this sense, the development of sustainable economic policies capable of generating industrial systems aimed at combating climate change could make it possible to create production models with low emissions.
RL: captures the perceptions of the measure in which the agents trust and respect the rules of the company, and in particular the quality of the execution of contracts, the property rights, the police and the courts, as well as the probability of crime and violence The estimate provides the score of the country on the aggregate indicator, in units of a standard distribution, that is to say it ranges from about -2.5 to 2.5. The top ten of the countries by RL value are Finland with a value of 2.05, followed by Norway with 1.94, Denmark with 1.93, Singapore with a value of 1.85, New Zealand with 1.81, Switzerland with a value of 1.80, Austria with 1.78, Iceland with a value of 1.75 units, Liechtenstein with a value of 1.74 units. There is a positive relationship between RL's value and RDE's value. This positive relationship is since the countries that invest in research and development also have high levels in terms of RL. The possibility of increasing the RDE level tends to be positively associated with the value of RL.
RQ: captures the perceptions of the government's ability to formulate and implement solid policies and regulations that allow and promote the development of the private sector. There is a positive relationship between the RQ value and the RDE value. The countries that have greater RQ value in 2020 are Singapore with 99.04, New Zealand with 92.31, Finland 91.35, Australia 90.87, Denmark, and Luxembourg with a value of 90.87, Hong Kong and Netherlands with 89.90, Norway and Sweden with a value of 87.50. The positive relationship between RQ and RDE depends on the fact that the countries that have high RQ are also able to invest in the financing of new technologies, research institutes, start -ups, and promoting the venture capitalism. One of the elements that can generate greater investments in terms of R&D is represented by the spread of intellectual property rights. It follows that the countries that have greater orientation towards companies, the private sector, and the market system have also greater probability of investing in research and development by increasing economic growth.
SLRI: measures the degree in which the guaranteed and bankruptcy laws protect the rights of borrowers and financiers and therefore facilitate loans. The index varies from 0 to 12, with higher scores indicating that these laws are better designed to expand access to credit. The countries that have higher levels of SLRI are Azerbaijan, Brunei Darussalam, Montenegro, New Zealand, Puerto Rico with a value of 12 units. Australia, Colombia, Jordan, Kenya, and Malawi with an amount of 11 units. There is a positive relationship between the value of SLRI and the RDE value. The countries that may have greater access to credit manage to invest in the R&D. This report indicates the strategic role of credit for the financing of the initiatives of the R&D. R&D's investment tends to be very risky from a financial point of view. Access to credit facilitates the development of the sector by increasing the value of R&D allowing companies to support greater risks in the search for new products and new services.
LEB: indicates the number of years in which a newborn would live if the prevalent models of mortality at the time of its birth should remain the same for life. There is a positive relationship between LEB's value and RDE's value. This relationship depends on the fact that the countries that have the greatest levels of RDE are also the countries that invest most in medical research, which offer the best living conditions of the population and therefore have the ability to increase the value of life expectancy of the population. The countries that have the highest levels of life expectancy at birth are: Hong Kong with a value of 85.38, followed Macao with 85.18, from Japan with 84.61, Singapore with an amount of 83.74 units, South Korea with an amount of 83.42, Norway with a value of 83.21, Australia with an amount of 83.20, Switzerland with an amount of 83,100, Faroe Islands with 83,093 units, Iceland with a value 83.06.
FPI: covers the food crops considered edible and that contain nutrients. Coffee and tea are excluded because, although edible, they have no nutritional value. There is a positive relationship between the value of FPI and the value of RDE. The countries that have a high level of RDE also have a high level of FPI. The motivation consists in the fact that the countries that have high RDE levels are also the countries with a high level of pro-capita income and therefore also tend to have high levels of FPI. The countries that have high levels of FPI are Hong Kong with an amount of 220.9 units, followed by Senegal with an amount of 181.5 units, by Mongolia with 173.7 units, from Singapore with 160.3, Oman with 152.8, Saudi Arabia with 151.1, Iraq with 149.4, Qatar with 146.3, Burundi with 143.5, Guinea with 135.8.
SEP: is the relationship between total registration, regardless of age, with the population of the age group that officially corresponds to the level of education shown. Primary education provides children with the basic reading, writing and mathematics skills with an elementary understanding of topics such as history, geography, natural sciences, social sciences, art and music. There is a relationship between the SEP and the value of RDE. The countries that have a high level of RDE also have high SEP levels.
We also find that the level of RDE is negatively associated to:
MR: is the probability for 1,000 that a newborn will die before reaching five years, if subject to specific mortality rates by age of the specified year. There is a negative relationship between the value of MR and the RDE value. That is, the growth of the RDE value reduces the value of MR. This report is since the countries that invest most in R&D have also the countries that have the greatest per capita income and therefore are also more likely to invest in healthcare expenditure and guarantee higher levels of quality of life and public health to the population. In addition, the countries that have high levels of RDE also have the technologies and scientific knowledge necessary to do medical and pharmaceutical research increasing the probability of a better life at any age.
FR: represents the number of children who would be born from a woman if she had to live until the end of her fertile years and endure children in accordance with specific fertility rates by age of the specified year. Hesitates a negative relationship between the value of FR and the value of RDE. It follows that the countries that have high levels of RDE also have high levels of income and tend to be crossed by the phenomenon of the demographic transition. The demographic transition is that phenomenon for which countries that have a growing pro-bench income tend to have a negative demographic balance. This condition is in fact very common in highly high-income countries especially in Europe and Japan.
AE: is the percentage of population with access to electricity. Electrification data are collected by industry, national surveys and international sources. There is a negative relationship between AE and RDE's value. However, it must be considered that the average value of the coefficients obtained through the value of Panel Data with Fixed Effects, Panel Data with Random Effects, Poled OLS and WLS is equal to -0.0027 units or a very close value to zero.
MS: are excluded whales and focus. The threatened species are the number of species classified by the IUCN as in danger, vulnerable, rare, indeterminate, out of danger or insufficiently known. There is a negative relationship of MS and the RDE value. The countries that have greater MS values are: Indonesia with 191, Madagascar with 121, Mexico with 96, India with 93, Brazil with 80, China with 73, Malaysia with 71, Australia with 63, Thailand with 59, Colombia with 58. It follows that the value of MS tends to be tends to be high for countries that have a reduced RDE value.
PM2.5: is the average level of exposure of the population of a nation at concentrations of suspended particles that measure less than 2.5 microns in the aerodynamic diameter, which are able to penetrate deeply in the respiratory tract and causing serious health. The exhibition is calculated by placing the average annual concentrations of PM2.5 by population in urban and rural areas. There is a negative relationship between the value of PM2.5 and the RDE value. The countries that have high RDE levels also have higher pro-capitals, and a more marked sensitivity towards environmental issues. The countries that have high RDE levels have even greater sensitivity towards the energy transition.
PU: is the percentage of the population whose usual food consumption is insufficient to provide the levels of dietary energy necessary to maintain a normal and healthy life. The data showing how 2.5 can mean a prevailing of underestimation below 2.5%. There is a negative relationship between PU value and RDE's value. This relationship is since the countries that have a high level of RDE also tend to be countries that have a high pro-capita income. And the countries with high per capita income tend to have markets for the production and distribution of the most efficient diet products. In addition, unemployment rates in higher pro-capita countries are lower and therefore there is a greater percentage of the population capable of supporting themselves by accessing food consumption.
GINI: measures the quantity in which the distribution of income between individuals or families within an economy differs from a perfectly equal distribution. A curve of Lorenz traces the cumulative percentages of total income received compared to the cumulative number of recipients, starting from the poorest individual or family. The Gini index measures the area between Lorenz's curve and a hypothetical line of absolute equality, expressed as a percentage of the maximum area under the line. In this sense, a Gini index of 0 represents perfect equality, while an index of 100 implies perfect inequality. There is a negative relationship between Gini's value and RDE's value. In particular, the countries that invest in R&D are also countries that have lower social inequality levels.
SEPS: is the relationship between total registration, regardless of age, with the population of the age group that officially corresponds to the level of education shown. Primary education provides children with the basic reading, writing and mathematics skills with an elementary understanding of topics such as history, geography, natural sciences, social sciences, art and music. There is a negative relationship between the SEPS value and the RDE value.
Methane emissions: derive from human activities such as agriculture and the production of industrial methane. There is a negative relationship between the value of me and the value of RDE. Countries with a high level of me also have high RDE levels. This relationship is since the countries with high RDE have greater sensitivity towards environmental issues related to the climate change. These are countries that have invested in new technologies that are more sustainable and that have created laws capable of stopping the ecological transaction and combating climate change.
PS: measure perceptions of the probability of political instability and/or politically motivated violence, including terrorism. There is a negative relationship between PS's value and RDE's value. That is, this relationship would indicate that RDE's growth is associated with a PS reduction. To better understand this relationship, it must be considered that many countries that are at the forefront of the R&D are not democracies such as in the case of China. And also, the US also are considered a country at risk from the point of view of the PS value due to the widespread political and racial violence.
HI35: is an index that combines the air temperature and relative humidity, in shaded areas, to position an equivalent temperature perceived by man, since how hot it would feel if the humidity was another value in the shade. The result is also known as “felt air temperature”, “apparent temperature”, “real feeling” or “sensation”. There is a negative relationship between the value of HI35 and the RDE value. This relationship is due to both strictly geographical factors and to economic policy issues. From a geographical point of view, it is necessary to consider that many of the countries that have high RDE levels are Northern Europe countries where Heat Index levels tend to be less than the level of 35 degrees. From a political-economic point of view, it is necessary to emphasize that the countries that have high levels of RDE have also activated policies contrary to the climate change and having as its objective the reduction of the value of HI35.
M5DR: This climatic index is a measure of strong rainfall, with high values corresponding to a high possibility of floods. An increase in this index over time means that the possibility of flood conditions will increase. There is a negative relationship between the value of M5DR and the RDE value. This negative relationship is mainly due to geographical reasons. In fact, the countries that have high RDE levels are found in areas of the planet where the risk of floods is reduced, such as in northern Europe. Asian countries that tend to be more exposed to the risk of flood, however, have lower RDE levels compared to those of the western countries.
Figure 1.
Results of the econometric models.
Figure 1.
Results of the econometric models.
4. Clusterization with the Application of the k-Means Algorithm Optimized with the Elbow Method
Below, a cluster analysis is presented with the application of the k-Means algorithm optimized with the Elbow method. The clustering method is proposed to identify the presence of clusters within the analysed dataset. We decided to use only the countries with a complete historical series and therefore the number of countries analysed decreased from initial 193 to 83.
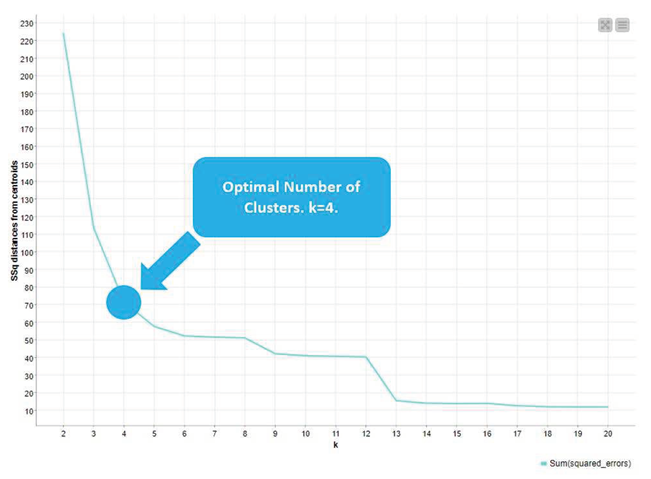
The decision to use clustering was made to verify the presence of clusters among the countries analysed. In fact, since we are dealing with 83 countries, we wondered if it was possible to make groupings to analyse in detail the economic, political, institutional, and geographical characteristics of the clusters analysed. The k-Means algorithm is an unsupervised machine-learning algorithm and therefore requires an intervention by the researcher to identify the optimal number of clusters. There are two methods for identifying the optimal number of clusters: the maximization of the Silhouette coefficient, and the Elbow method. The maximization of the Silhouette coefficient consists in the application of a metric method, which leads the researcher to choose the number of k such that the Silhouette coefficient is maximum. However, this method can be inefficient from a qualitative point of view. In fact, in the analysis conducted, the optimal number of clusters obtained by maximizing the Silhouette coefficient was equal to two. However, having several k=2 would have meant eliminating the heterogeneity present among the countries by proposing an excessive simplification of the cluster representation. Therefore, the Elbow method was used to overcome this problem and identify several clusters greater than two, which could give a representation of the complexity of the data analysed. Elbow's method is a graphical method for identifying the optimal number of clusters which consists of two steps: first, a curve is identified consisting of the variable "SSQ Distances from Centroids" on the ordinate and the variable "k" on the abscissa; secondly, in this curve the point is identified which shows a variation of the curve such as to constitute an elbow representation. With Elbow's method, an optimal number of clusters was identified at k=4. The value of k=four was considered as congruous with respect to the possibility of a representation of the heterogeneity of the data. Therefore, four different clusters were identified, namely:
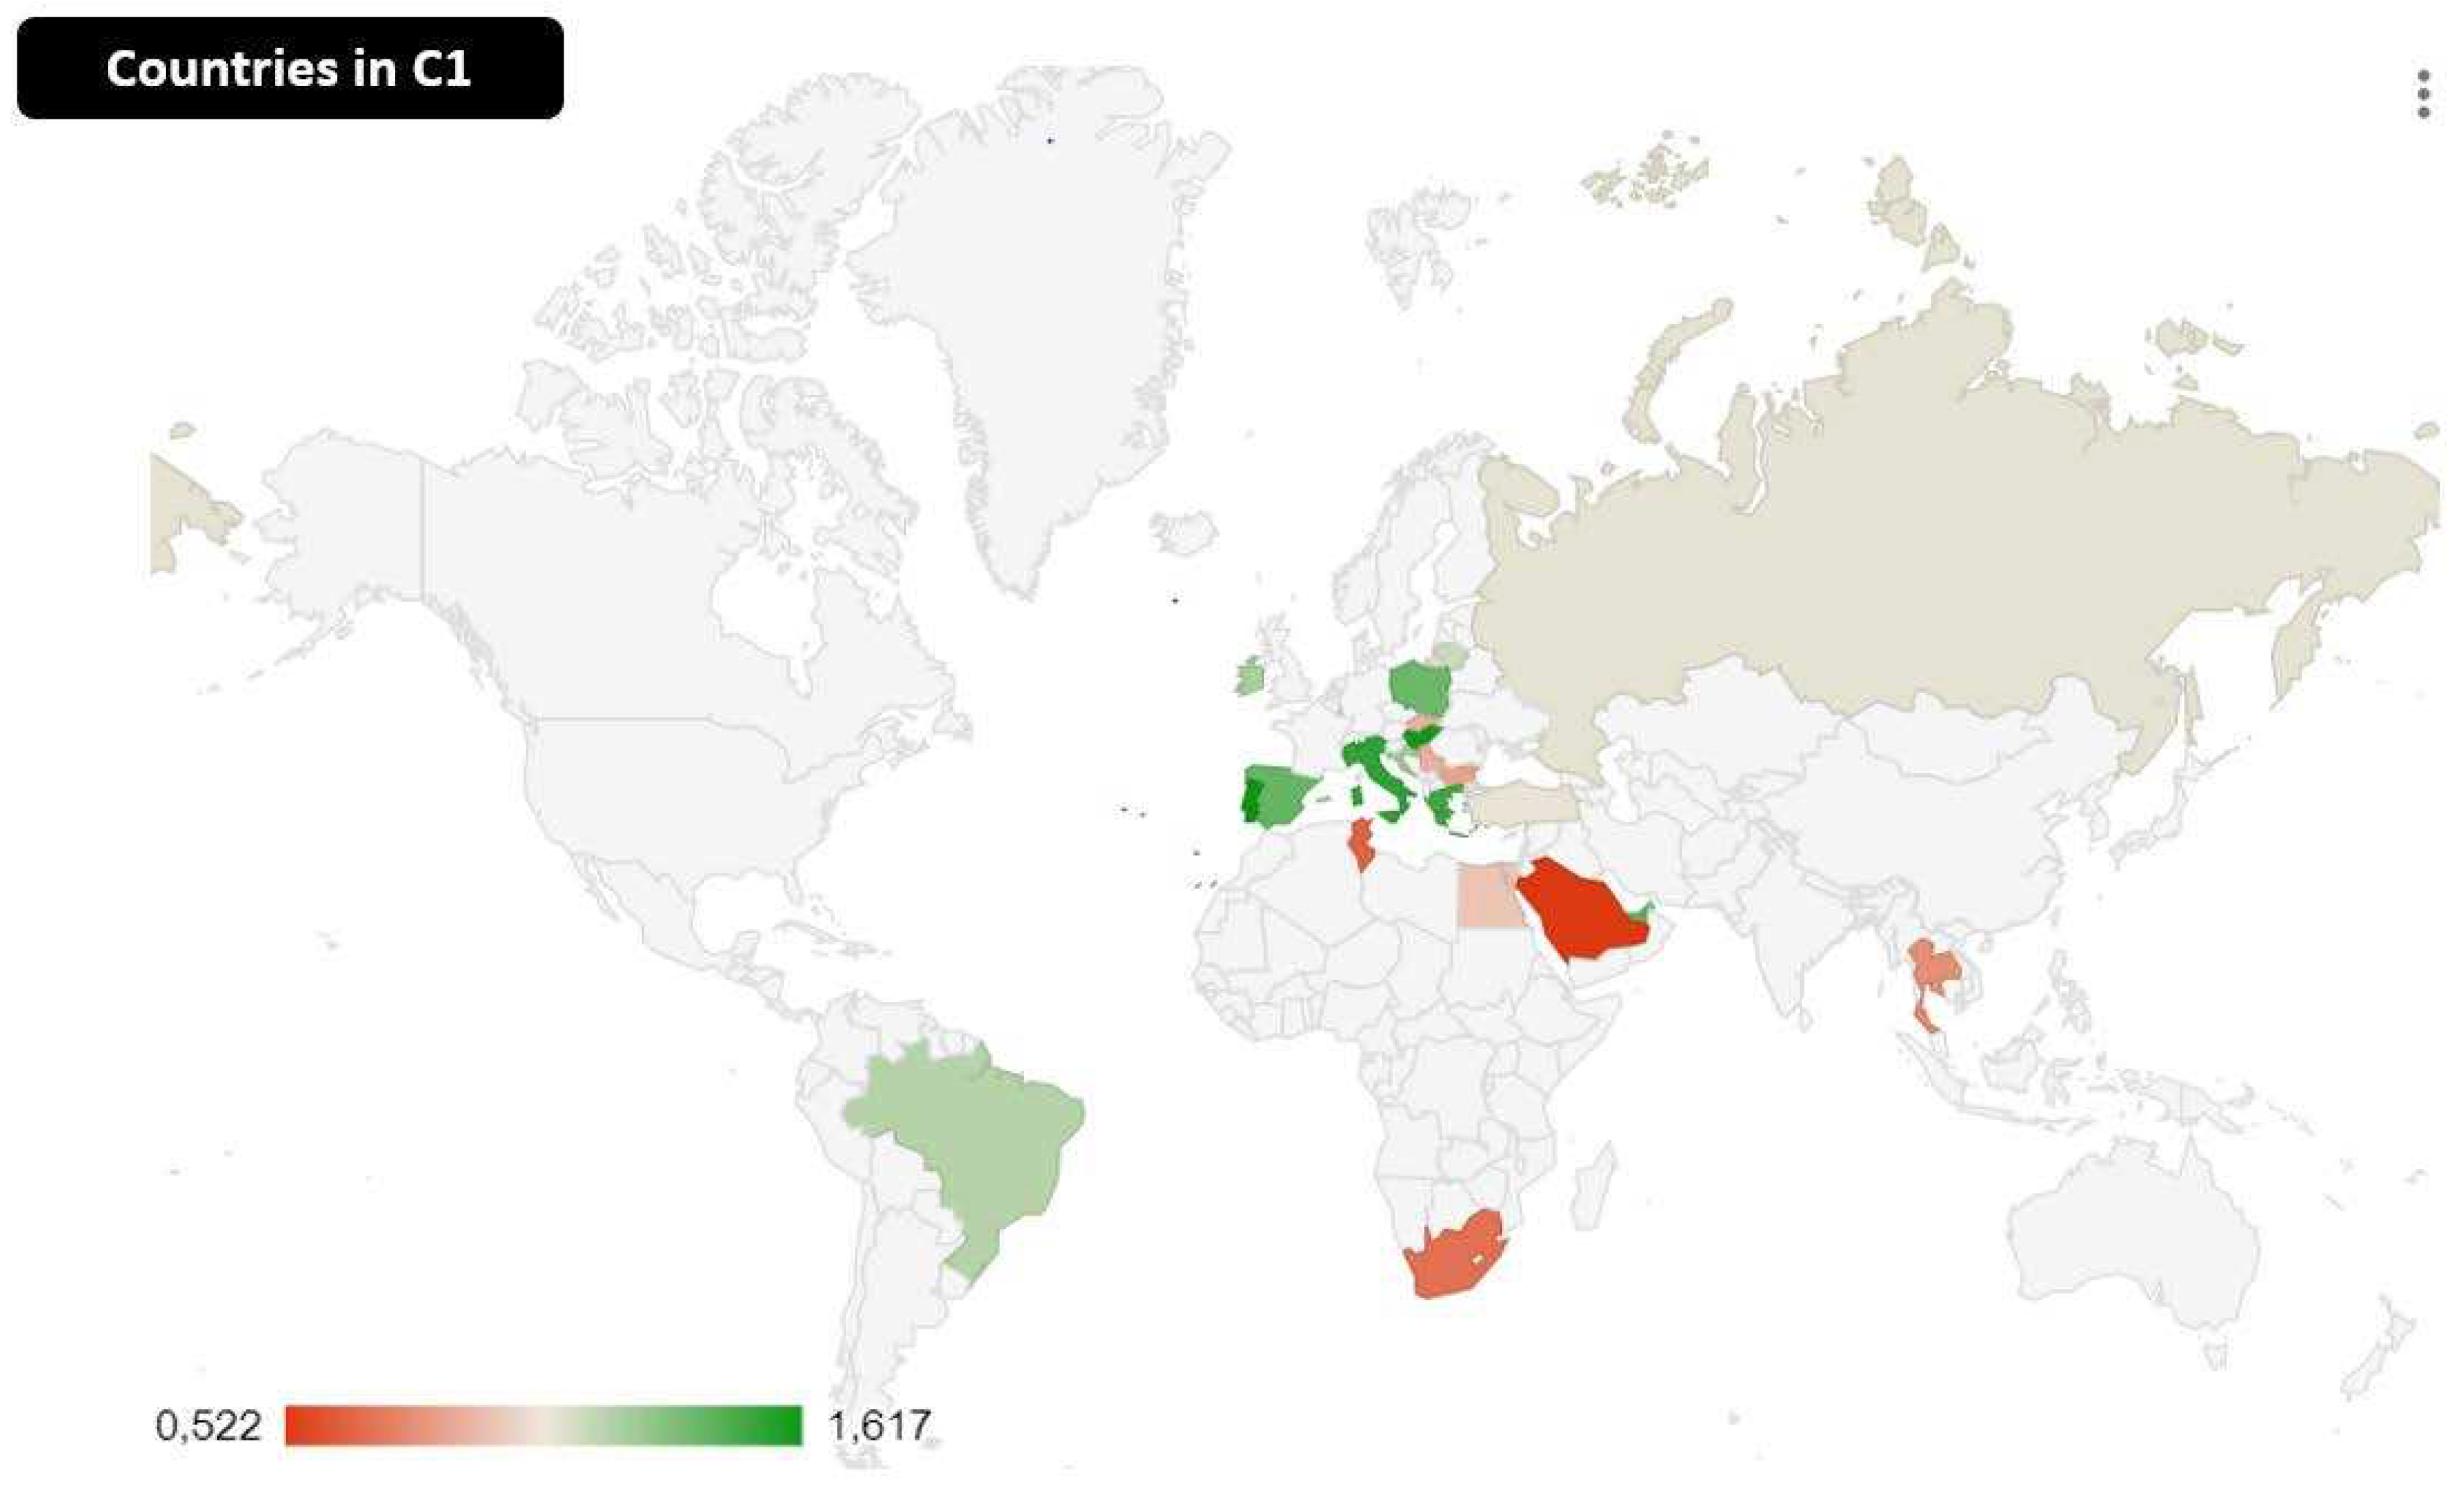
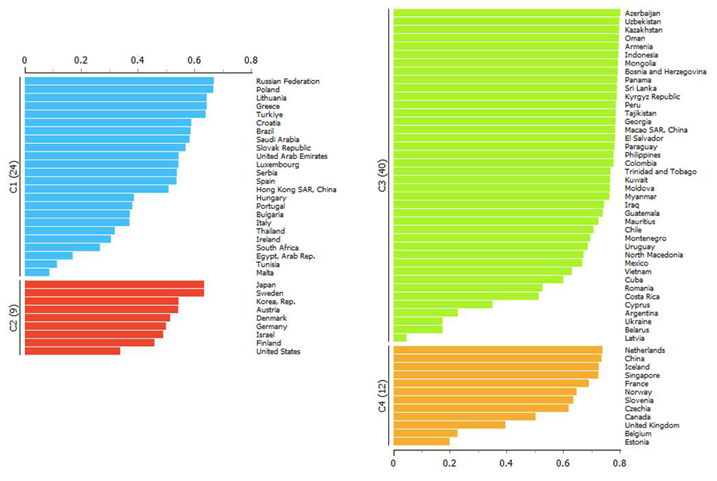
Cluster 1: consists of Russian Federation, Poland, Lithuania, Greece, Turkeys, Croatia, Brazil, Saudi Arabia, Slovak Republic, United Arab Emirates, Luxembourg, Serbia, Spain, Hong Kong SAR, Hungary, Portugal, Bulgaria, Italy, Thailand, Ireland, South Africa, Egypt Arab Rep., Tunisia, Malta. The third cluster by value of the median is C1. C1 is a cluster that brings together several very heterogeneous countries. The cluster consists of 24 countries. The value of the RDE variable in C1 ranges from a maximum of 1.61% in the case of Portugal, up to a value of 0.52% in the case of Saudi Arabia. At the top of the C1 are Portugal, Hungary with 1.60%, and Italy with 1.53%. In the middle of the ranking, there are Lithuania with 1.15%, Luxembourg with 1.12% and Russia with 1.09%. The final positions in the ranking are occupied by: Malta with 0.65%, Tunisia with 0.65% and Saudi Arabia with 0.52%.
The cluster is made up mostly of southern European countries to which are added countries of Africa and Asia. Brazil is the only country in the Americas to be present in the C1. From a geo-political and economic point of view, we can see that the C1 countries are nations with low-middle per capita income. The only countries with upper-middle income per capita in C1 are Luxembourg, Ireland, and Hong Kong. However, these countries have a reduced RDE value due to an economy that has focused essentially on finance and tax competition. In fact, Luxembourg, Ireland, and Hong Kong do not have a real industrial, manufacturing and production system that requires the growth of RDE to increase their competitiveness. Luxembourg and Ireland have increased their per capita income reducing taxes on multinational companies. Hong Kong gets its resources from the development of the financial sector. In all three cases, the value of R&D in determining per capita income is low and negligible. As far as the countries of southern Europe are concerned, they are in any case backward economies from the point of view of per capita income and the value added produced, which are far behind the other European countries in the development of the knowledge economy and in the creation of a digitized and evolved industrial system. With reference to the United Arab Emirates, Egypt, Saudi Arabia, Tunisia, and Turkey, these are countries with a Muslim majority, which invest a lot in the RDE compared to other countries of the same religion. The United Arab Emirates, Egypt, Saudi Arabia, Tunisia, and Turkey must therefore be considered champions in the sub-category of Muslim-majority countries by RDE value. As far as Russia is concerned, a separate discussion needs to be made. Russia has always had a special role in participation in the scientific community and technological development. Even in the case of the development of the ICT sector, Russia has achieved excellent results by creating organizations with a very high level of technical knowledge in the field of information technology. However, Russia's GDP has lost a lot in both absolute and per capita terms due to the slowdown in international integration and due to aggressiveness towards neighbouring countries. Finally, the Russo-Ukrainian war distracts many of the country's resources from R&D and determines an imbalance of public spending towards military spending which will have long-term consequences in the economic and social development of the country.
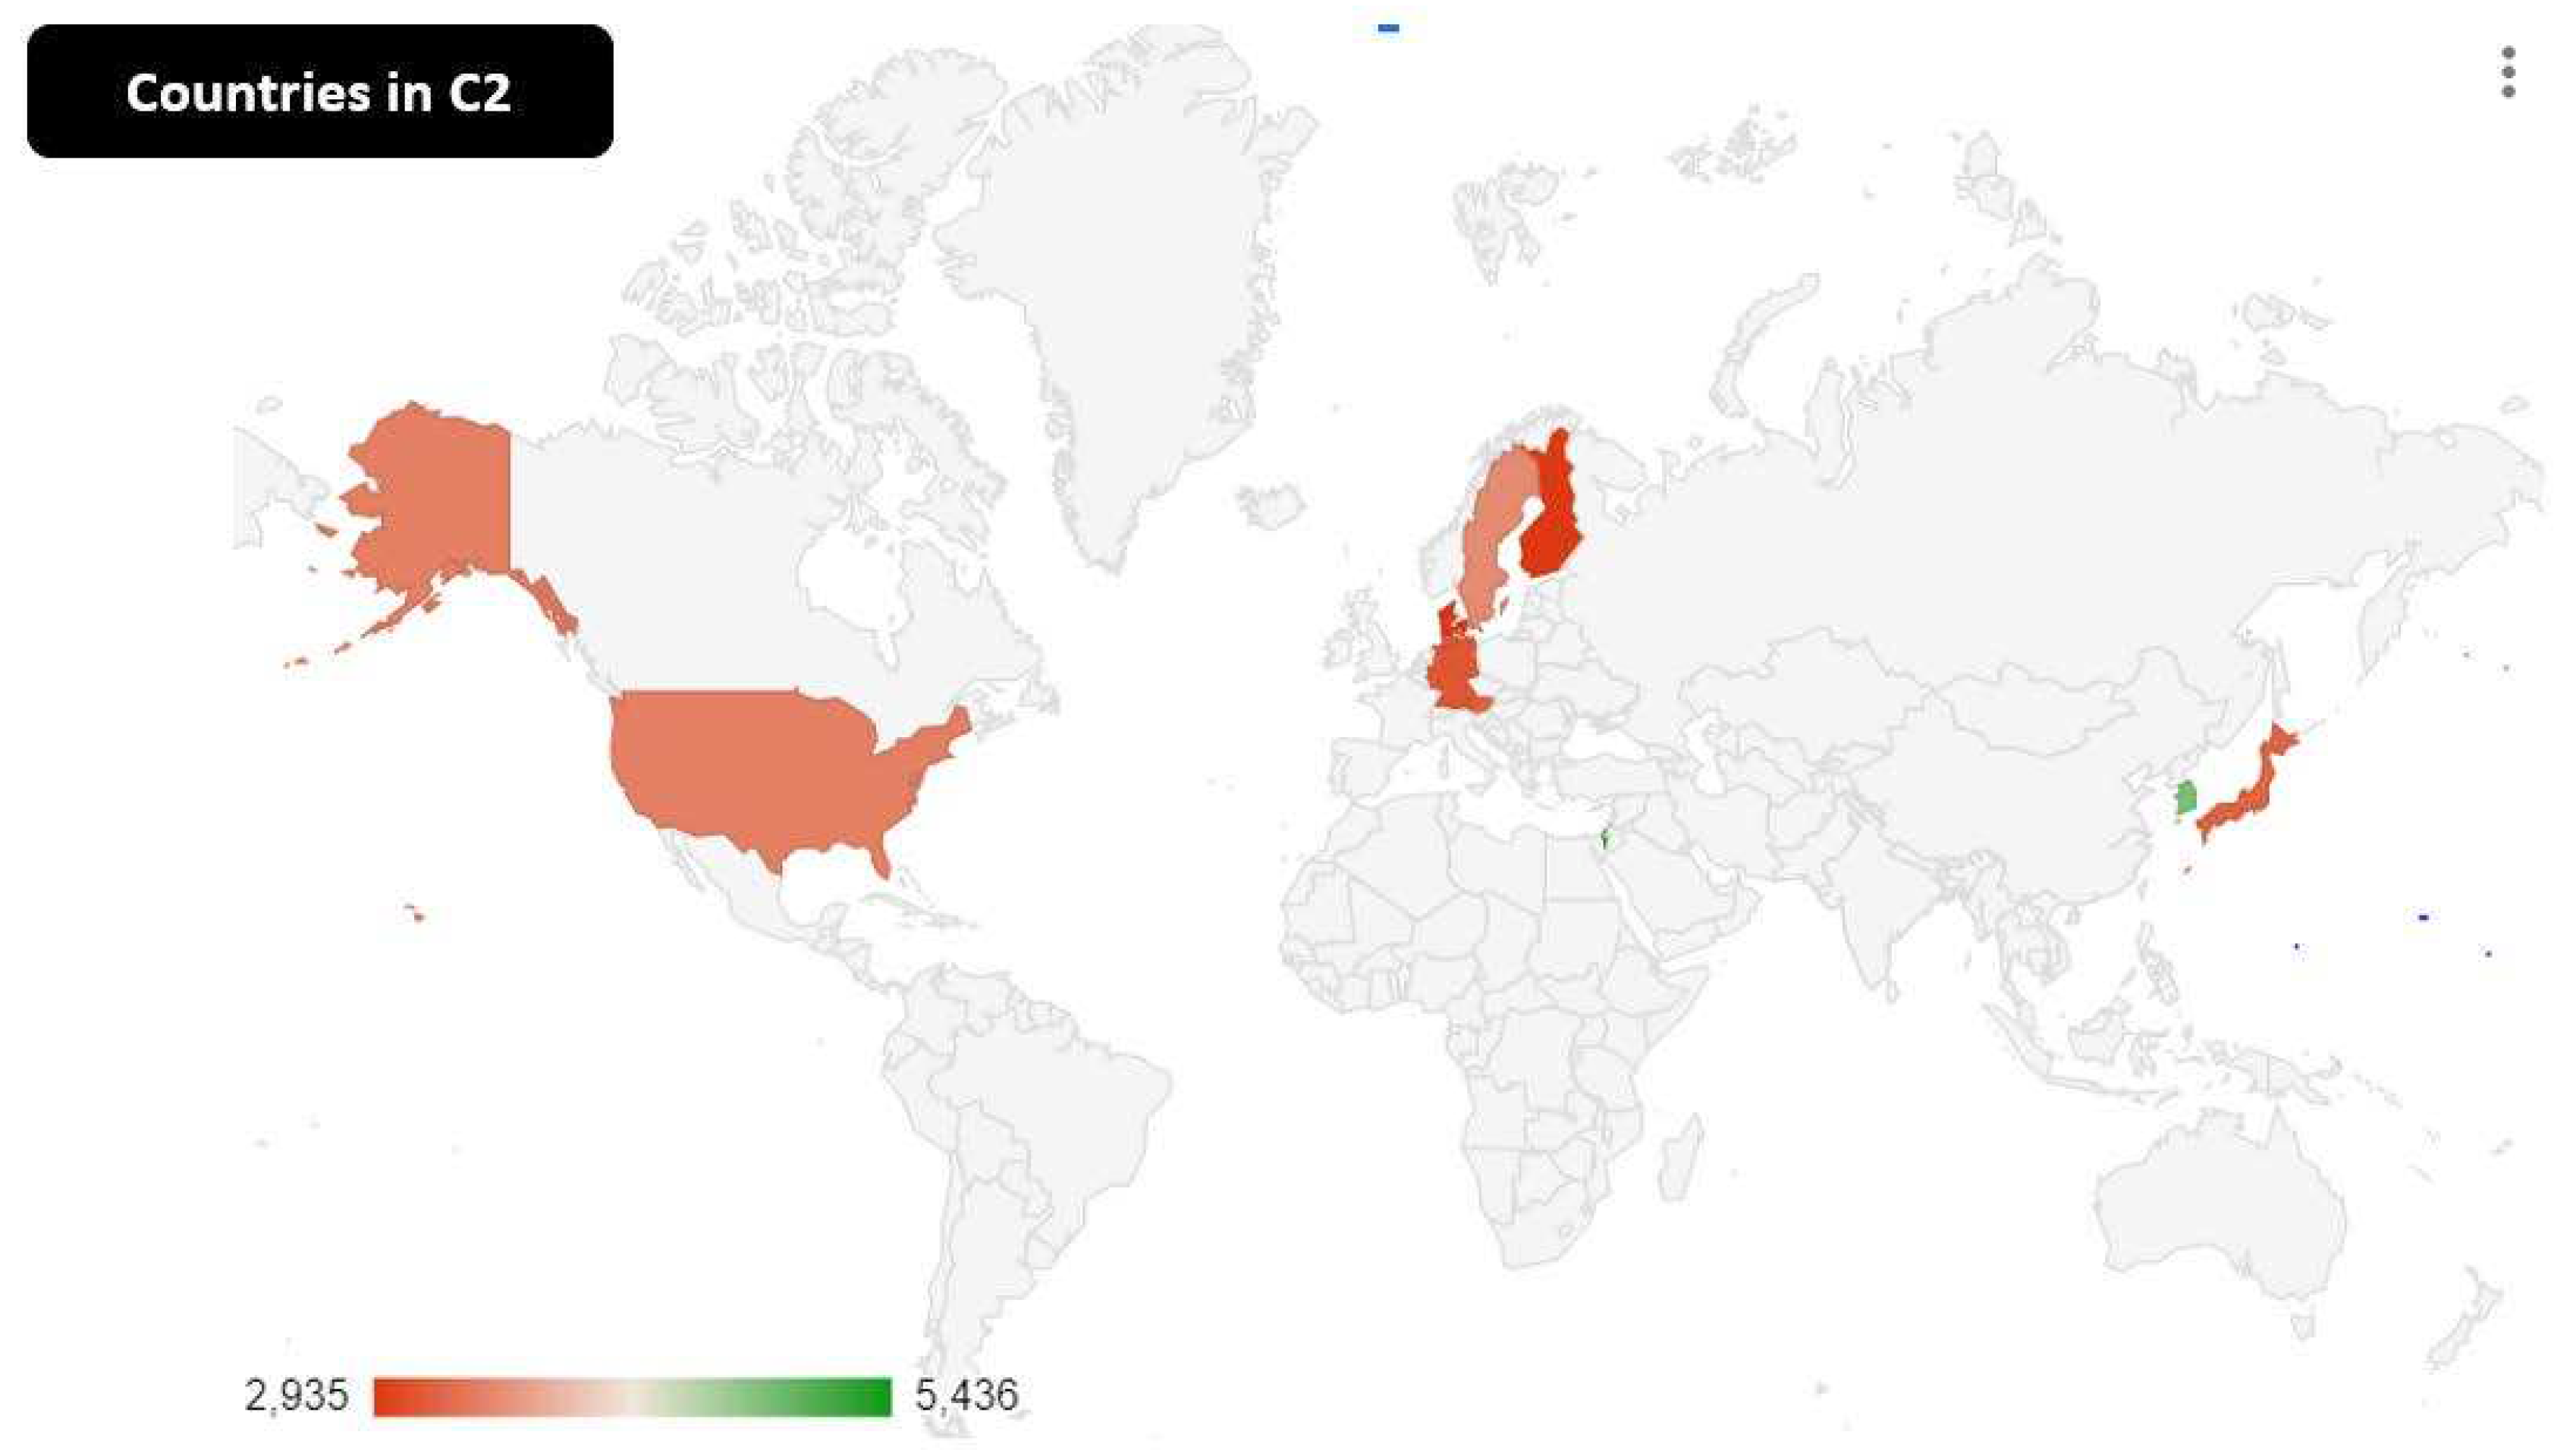
Cluster 2: is composed by Japan, Sweden, Korea Rep., Austria, Denmark, Israel, Finland, and United States. The countries of this cluster have the highest values in terms of RDE among all those analysed. The size of investment in RDE tends to be crucial for these countries that are engaged both in the attempt to achieve economic hegemony and in the effort to maintain technological and scientific leadership, especially against China and the new autarkic countries. With reference to 2020, among the C2 countries, Israel is in first place by value of RDE with an amount equal to a value of 5.43%, followed by South Korea with 4.8%, by Sweden with 3.5 %, USA with 3.4%, Japan with 3.2% and Austria with 3.2%. The ranking of C2 countries is closed by Germany with a value of 3.14%, followed by Denmark with +2.96% and Finland with 2.93%. These countries invest in R&D for reasons related to economic growth and to support the competitiveness of their companies and their country in the global challenge for scientific and technological supremacy. However, especially as regards the USA and Israel, scientific research is not just a tool for economic growth. In fact, in these cases, scientific research also becomes a factor for increasing national security. In fact, especially in the USA, there is a close relationship between investments in scientific research and the strengthening of the military force. An example of the connections between R&D and the military sector is the development of the ICT industry. Similar considerations also apply to Israel. Hence the strategic role of scientific research in affirming the economic and technological supremacy of the West. Furthermore, as was evident in the case of the Covid 19 pandemic, investment in R&D also makes it possible to increase the country's ability to respond to certain adverse macro-economic phenomena that can suddenly hit the global economy. The recent events of the Russo-Ukrainian war, for example, have mobilized rearmament in Japan and Germany. It is highly probable that in Japan and Germany, as has also happened in the USA and Israel, a close connection will be created between the military and the industrial sector, thanks to the growth in the value of RDE. It should also be considered that the C2 countries are Western and democratic countries. C2 countries highlights the presence of a deep interconnection among political rights, scientific research, and the presence of liberal market institutions. A set of factors that improves the development of science and technology in the Western world, allowing for the generation of significant spill over effects both with reference to economic growth and to national security.
Figure 2.
The countries belonging to the C1. C1 is the second cluster by value of expenditure in RDE based on the value of the median.
Figure 2.
The countries belonging to the C1. C1 is the second cluster by value of expenditure in RDE based on the value of the median.
Figure 3.
Countries of C2. C2 is the best cluster in terms of RDE.
Figure 3.
Countries of C2. C2 is the best cluster in terms of RDE.
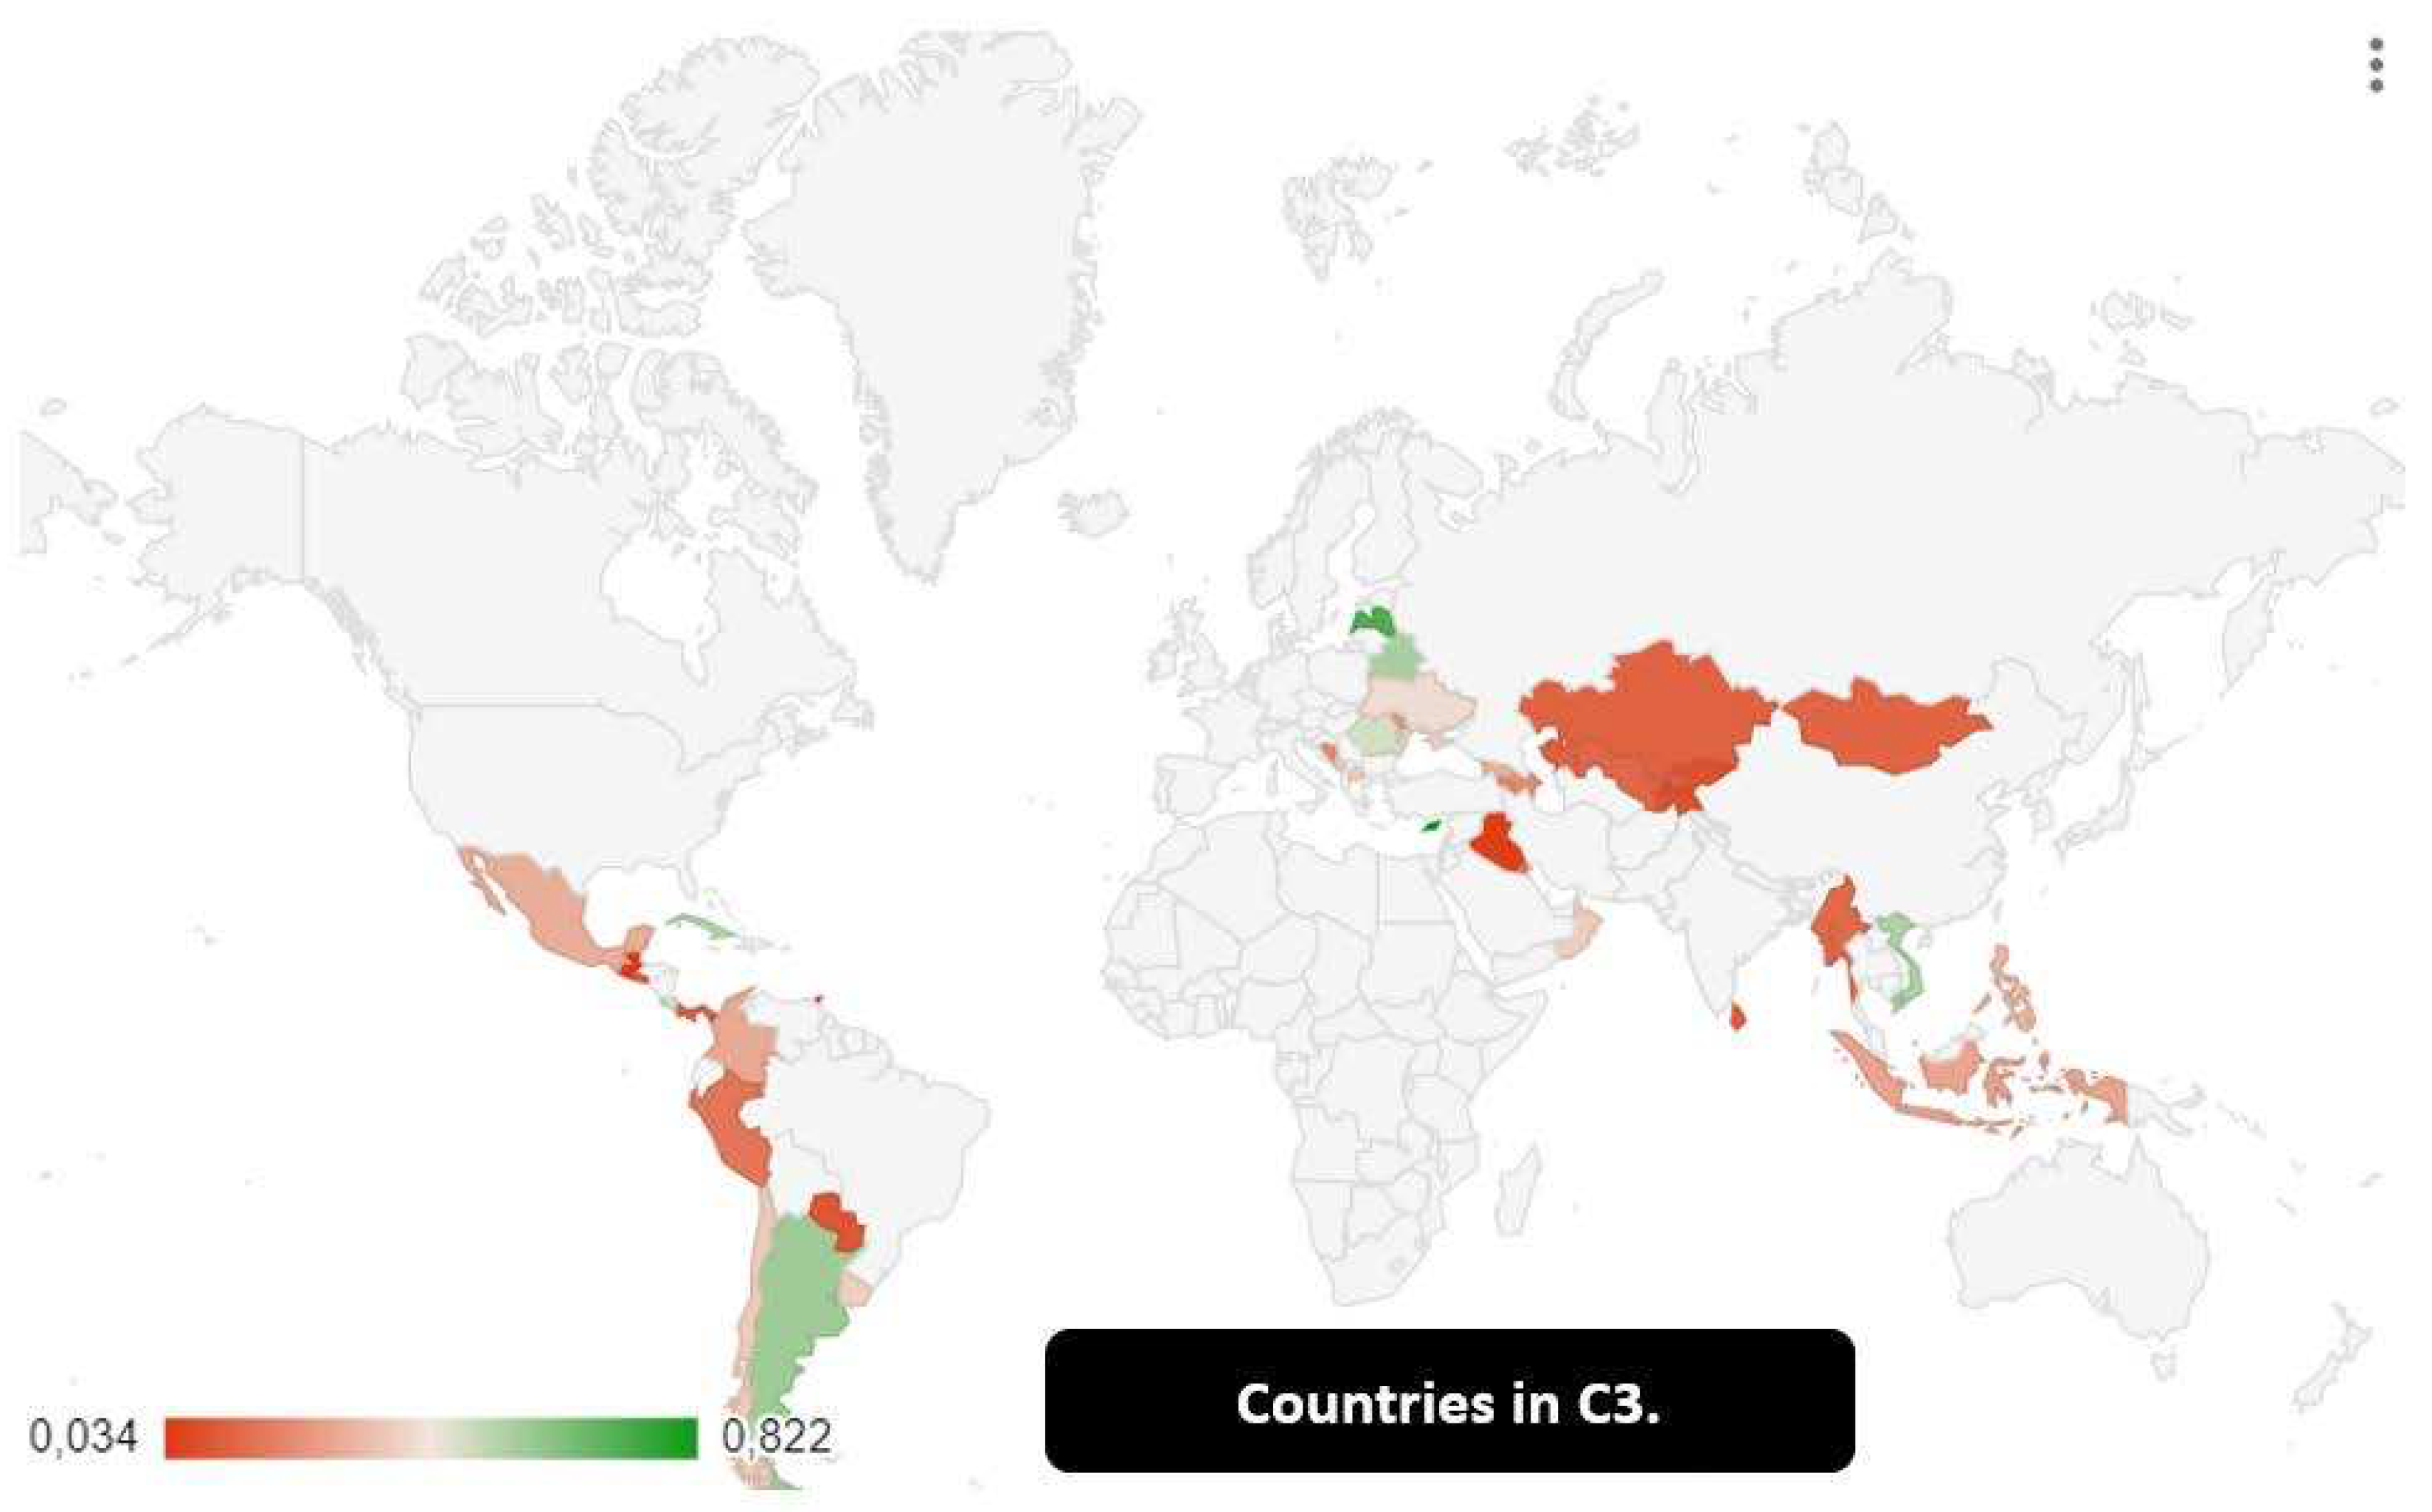
Cluster 3: with Azerbaijan, Uzbekistan, Oman, Armenia, Indonesia, Mongolia, Bosnia and Herzegovina, Panama, Sri Lanka, Kyrgyz Republic, Peru, Tajikistan, Georgia, Macao, El Salvador, Paraguay, Philippines, Colombia, Trinidad and Tobago, Kuwait, Moldova, Myanmar, Iraq, Guatemala, Mauritius, Chile, Montenegro, Uruguay, North Macedonia, Mexico, Vietnam, Cuba, Romania, Costa Rica, Cyprus, Argentina, Ukraine, Belarus, Latvia. C3 is the last cluster in terms of the median value of the RDE variable. It is a cluster made up of countries belonging to Eastern Europe, Central Asia, Southeast Asia, Central and South America and the Middle East. In first place, there is Cyprus with a value of 0.82%, followed by Latvia with an amount of 0.70%, and Argentina with a value of 0.56%. In the middle of the ranking there are Georgia with a value of 0.30%, followed by Colombia with 0.288%, and Indonesia with 0.28%. Trinidad and Tobago close the ranking with a value of 0.07%, followed by Iraq with 0.04% and Guatemala with 0.03%. The C3 countries are very heterogeneous from a political, institutional, and geographical point of view. However, they have in common a medium-low per capita income. The only exception is Macao, which is a country with a high per capita income and as such should have a high RDE value. However, Macau's RDE tends to be low as Macau's economy depends on the advanced tertiary sector with an important role of the port and maritime economy.
It is highly probable that in the future the value of expenditure in RDE will grow in Eastern European countries, i.e. Latvia, Romania, Ukraine, Moldova, Belarus, and in North Macedonia and Bosnia. However, this growth will occur in connection with the overall development of Eastern European countries as they converge with the higher per capita income levels in Western and Northern European countries. The countries of Central and South America are very lagging in terms of RDE. Particularly serious is the case of Argentina, which was once an economic leader in the Americas. The condition of Chile is also very particular. Chile should have become the South American nation with the greatest orientation towards the free market, with businesses, venture capitalism and technological investments. On the contrary, as the data show, investment in entrepreneurial capitalism is still low in Chile with a low RDE level.
Finally, particular attention must be paid to Indonesia, which is a growing country from an economic point of view. Indonesia will become one of the top 10 economies in the world. It is very probable that the value of RDE in Indonesia will tend to grow in the future to support the process of industrialization and servitization of the economy. In fact, after China and India, Indonesia will be the third Asian giant and therefore probably also grow in the value of RDE. Finally, Iraq and Kuwait seem to be under the malediction of raw materials, namely with a low level of RDE. The condition of the RDE in C3 countries is therefore serious and shows an overall backwardness of the countries from a technical-scientific as well as an economic-political point of view.
Figure 4.
Countries in C3. C3 is the last cluster in the sense of the median value of RDE.
Figure 4.
Countries in C3. C3 is the last cluster in the sense of the median value of RDE.
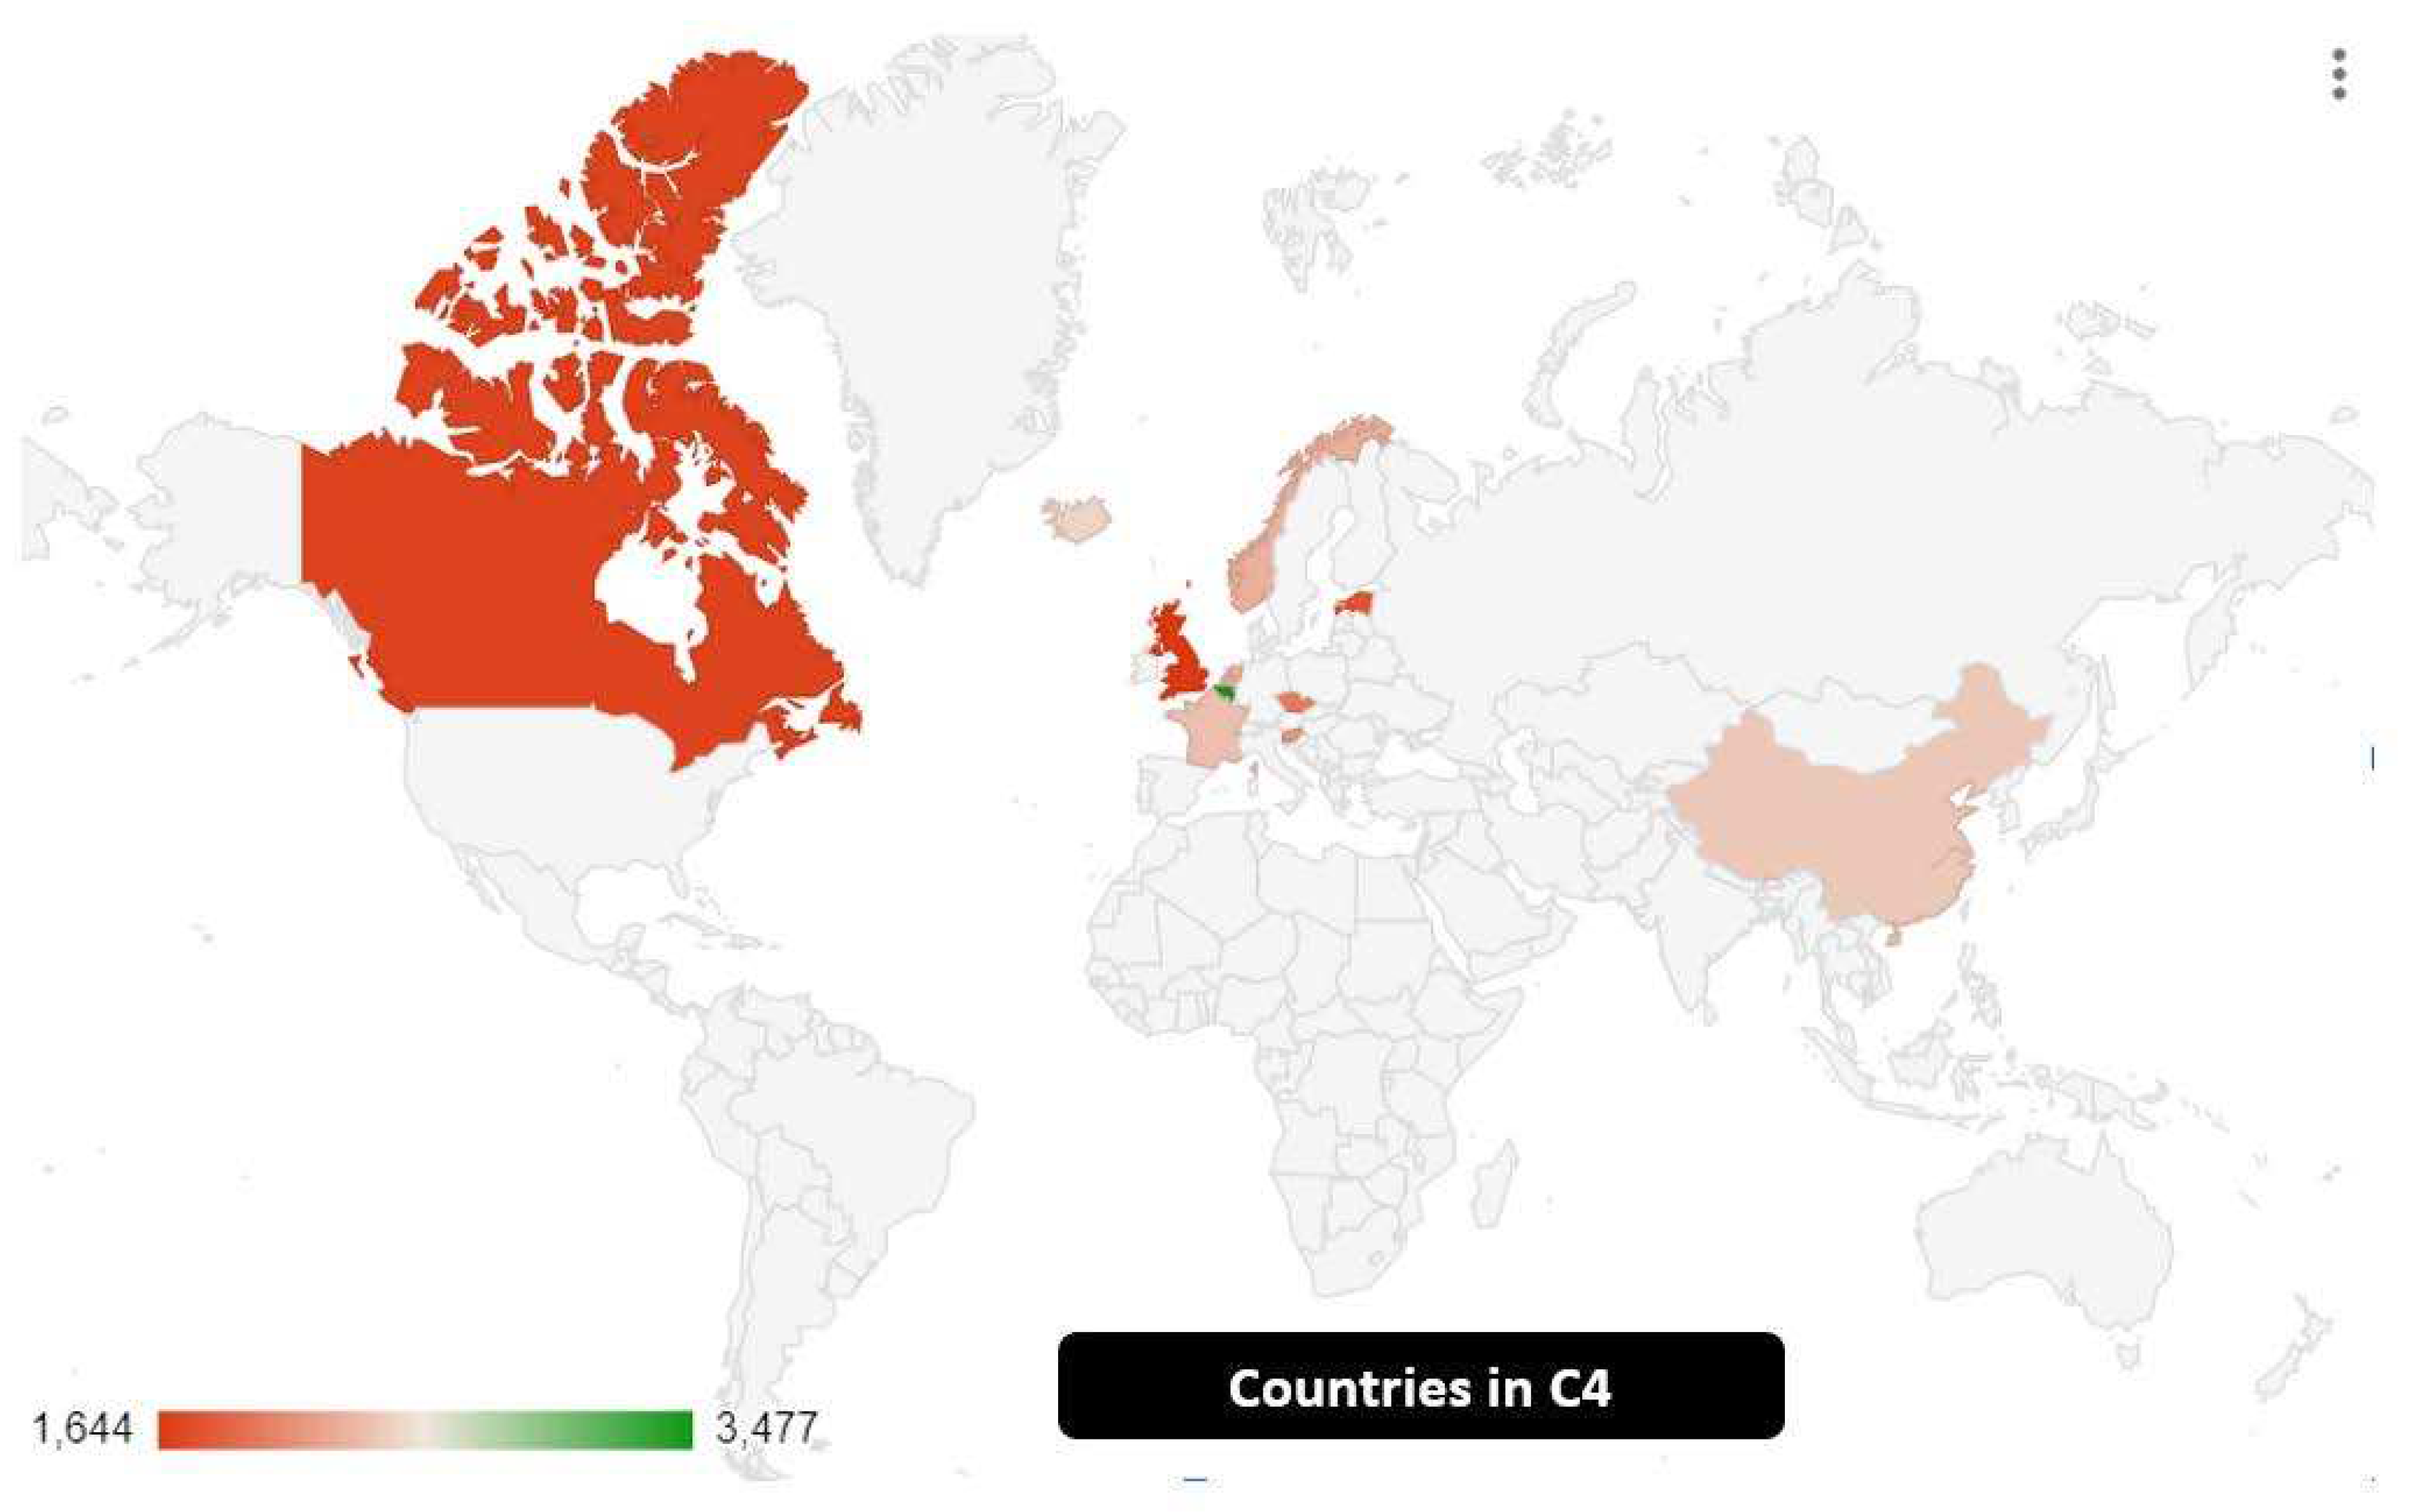
Cluster 4: is a composed by Netherlands, China, Iceland, Singapore, France, Norway, Slovenia, Czechia, Canada, United Kingdom, Belgium, Estonia. It is a cluster made up of western countries, essentially belonging to Europe with the addition of China, Singapore, and Canada. From a political-institutional point of view, there is a lot of heterogeneity as this cluster brings together both democratic and capitalist countries as well as China and its mix of socialism, market, autarky, and international projection. From a strictly quantitative point of view, it is possible to note the following ranking of countries by RDE value, namely: Belgium with 3.4%, Iceland with 2.47%, China with 2.4%, France with 2.35%, Countries Netherlands with 2.295, Norway with 2.27%, Slovenia with 2.14%, Czech Republic with 1.99%, Singapore with 1.98%, Estonia with 1.79%, Canada with 1.69% and United Kingdom with 1.64%. Particularly relevant is the presence of Slovenia within this cluster. In fact, the small European country maintained an investment in terms of RDE equal to an average value of 2% between 2011 and 2022. On the contrary, the value of expenditure in RDE appears to be particularly low in the United Kingdom, a country that traditionally has always invested in R&D. Finally, the value of the Chinese investment is very high, which is also significant from an absolute point of view. Between 2011 and 2020, China increased the value of RDE by 34%. A clear sign of the strategic role that the Asian giant recognizes in the value of research and development for economic, strategic, and military reasons. The growth of the RDE is functional to the Chinese hegemonic and imperialist project, which around the "Belt and Road Initiative" intends to build its own system of political and economic relations that project the greatness of the country in the world. In fact, the growth in the value of RDE in China is one of the reasons for the intensification of the tech rivalry with the United States. However, it is certain that China's growth has been driven by the desire of Western countries, and first by the USA, to outsource production to China and to implement technology transfer. Therefore, it is very probable that if China were to lose its connection with the USA, then there would be a weakening of the ability of the Chinese to grow in science, technology, and industry. The risk for the Chinese, without the Western bank, is to over-politicise economic activity and lose contact with the markets and with industrial production, losing the comparative advantages of purchases. A risk that could put the dragon back to sleep rather than lead China to the acquisition of world leadership.
Figure 5.
Countries in C4. C4 is the second cluster in the sense of median value of RDE.
Figure 5.
Countries in C4. C4 is the second cluster in the sense of median value of RDE.
From the point of view of clustering based on the value of the median, it results that the value of cluster 2-C2 is equal to an amount of 3.2 units, followed by cluster 4-C4 with an amount of 2.2 units, by C1 with 1.1 units and with C3 equal to 0.284. Hence the following ordering of the clusters, that is C2>C4>C1>C3. It therefore follows that the cluster analysis shows a significant heterogeneity among the countries considered. Countries with higher per capita incomes tend to invest more in RDE than countries with lower per capita incomes. Furthermore, as demonstrated by the countries of the leading cluster i.e. the C2 countries, it appears that democratic countries tend to have much higher RDE levels than autocratic countries. The analysis therefore suggests a positive relationship between RDE, democratic and political systems, and scientific and technological progress.
5. Machine Learning and Predictions
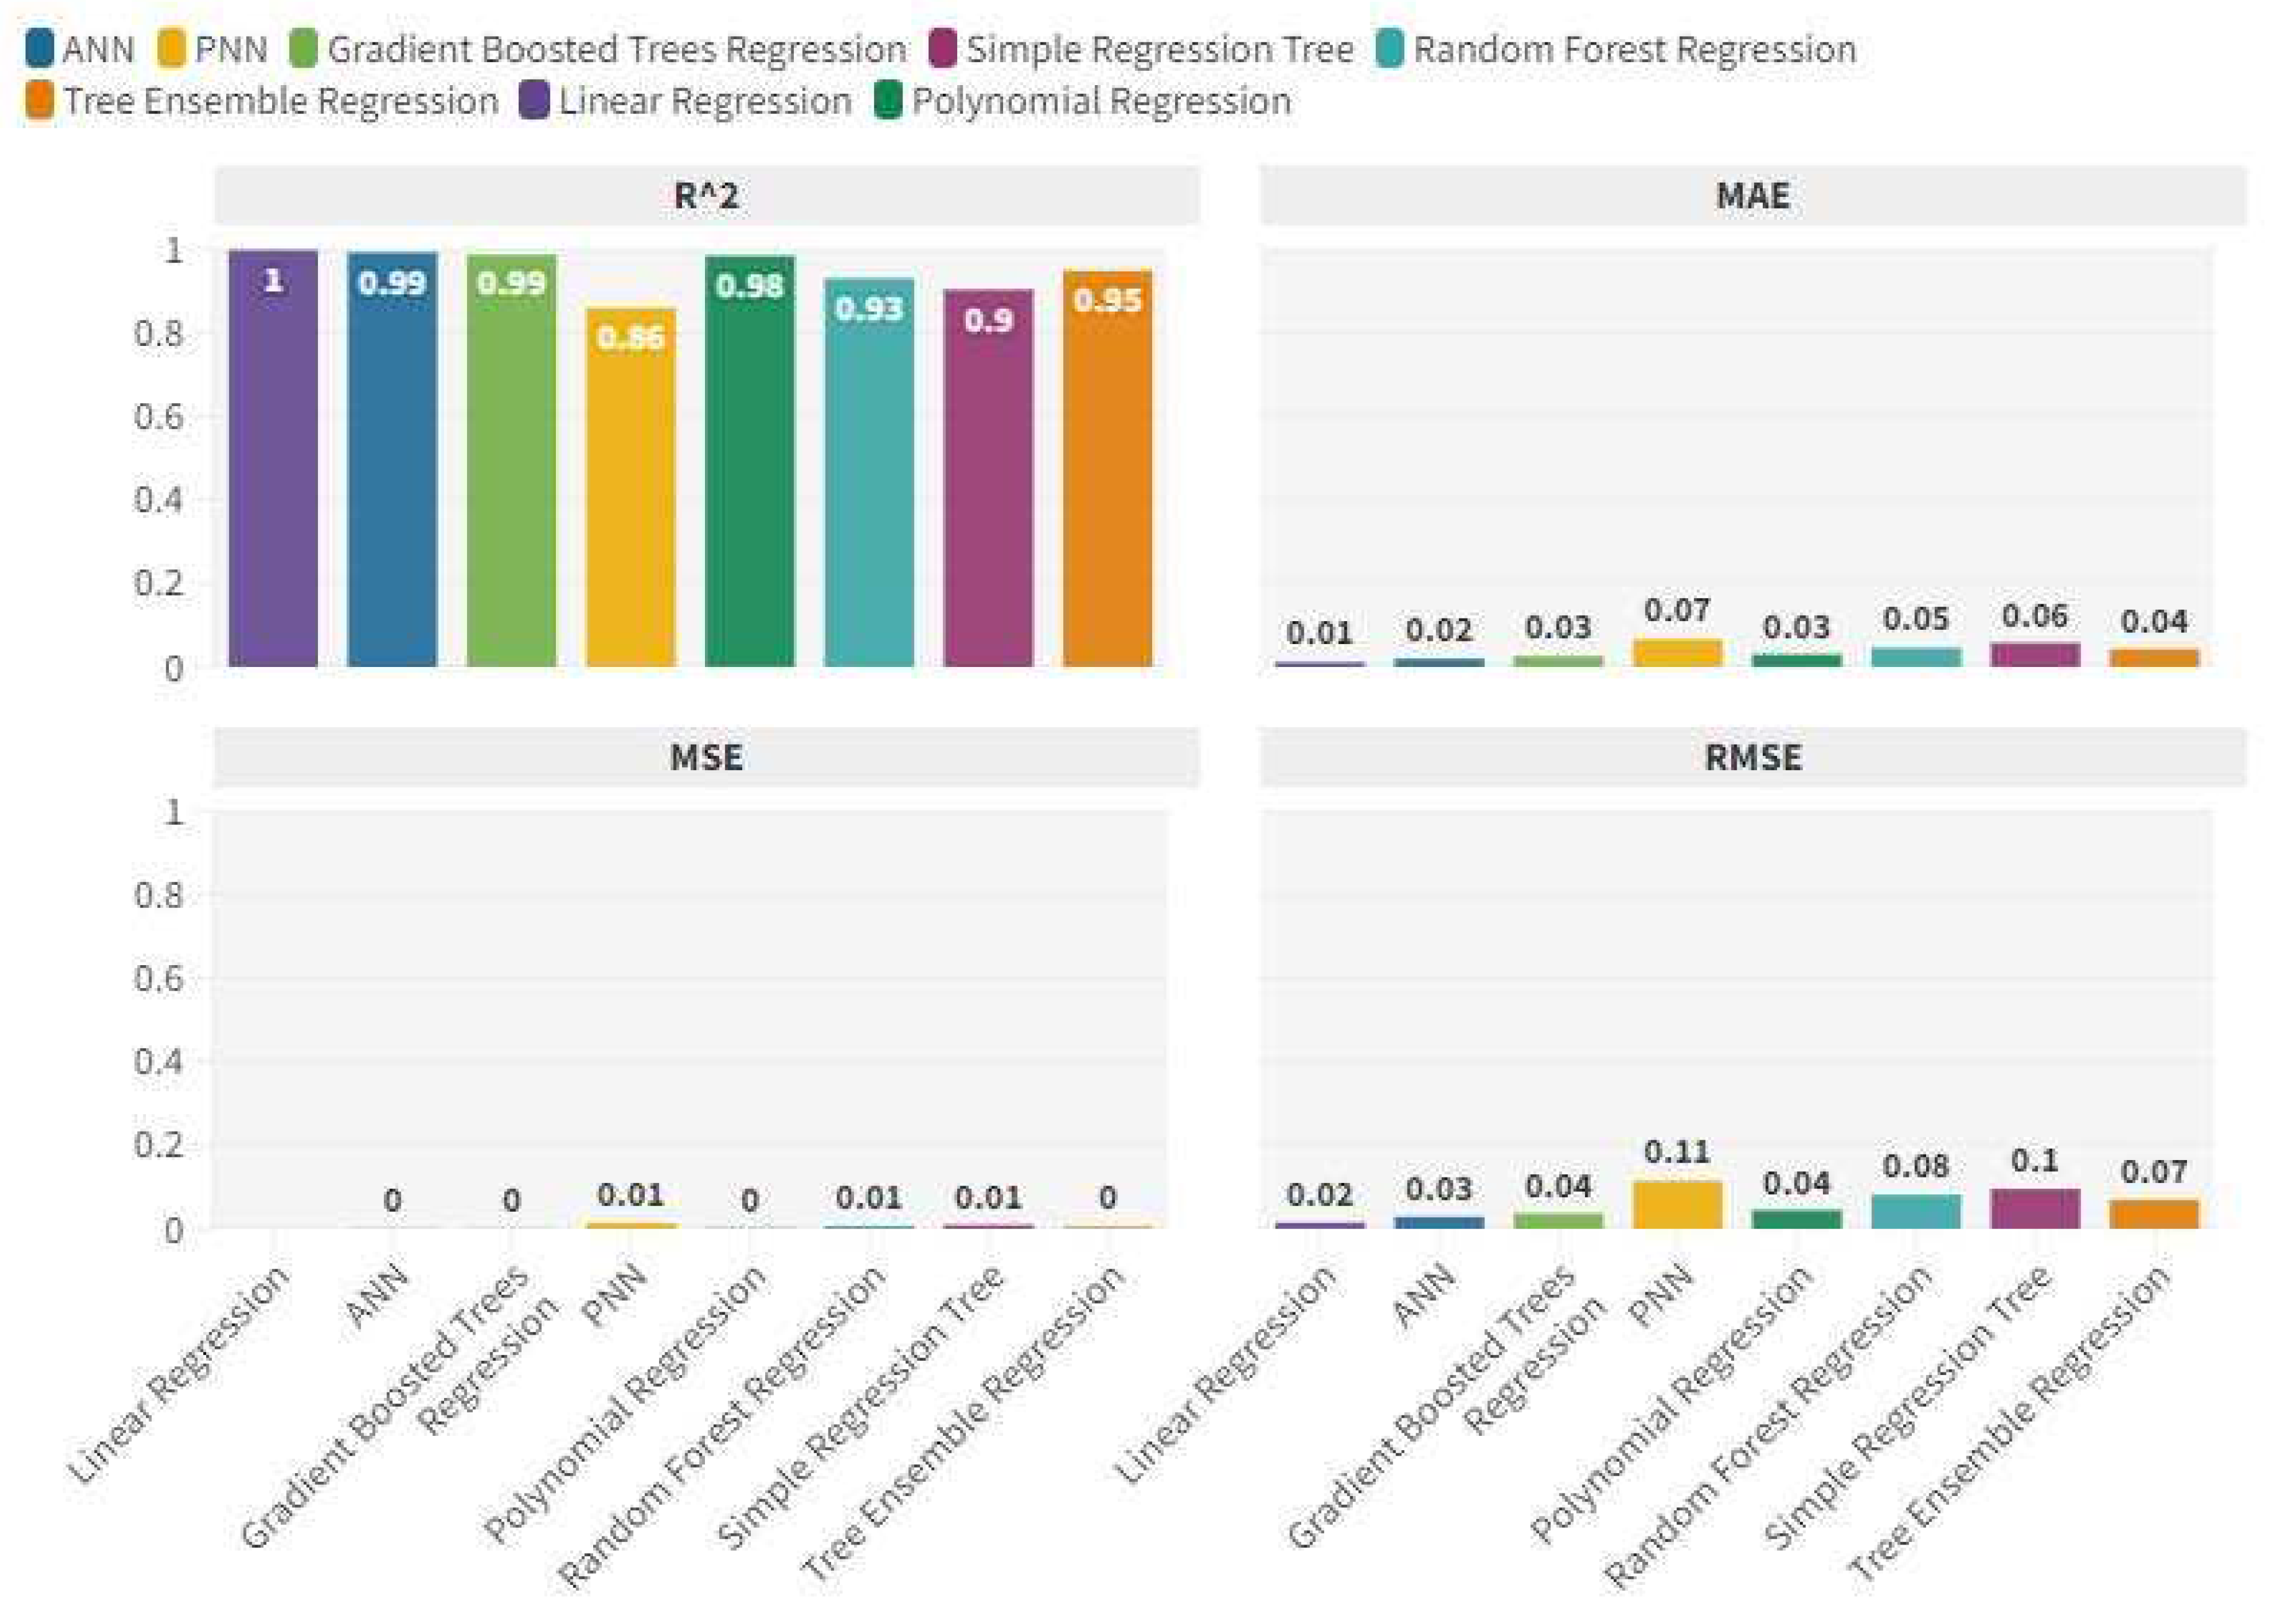
Below is a machine learning analysis for predicting the future value of R&D spending as a percentage of GDP. Specifically, eight different machine-learning algorithms are compared for predicting the future value of research and development spending. The algorithms were analysed through the maximization of the R-squared, and the minimization of errors, i.e. Mean Squared Error-MSE, Mean Average Error-MAE, and Root Mean Squared Error-RMSE. The algorithms were trained using 70% of the data while the remaining 30% was used for the actual prediction.
Figure 6.
Statistical errors and R-squared of the algorithms.
Figure 6.
Statistical errors and R-squared of the algorithms.
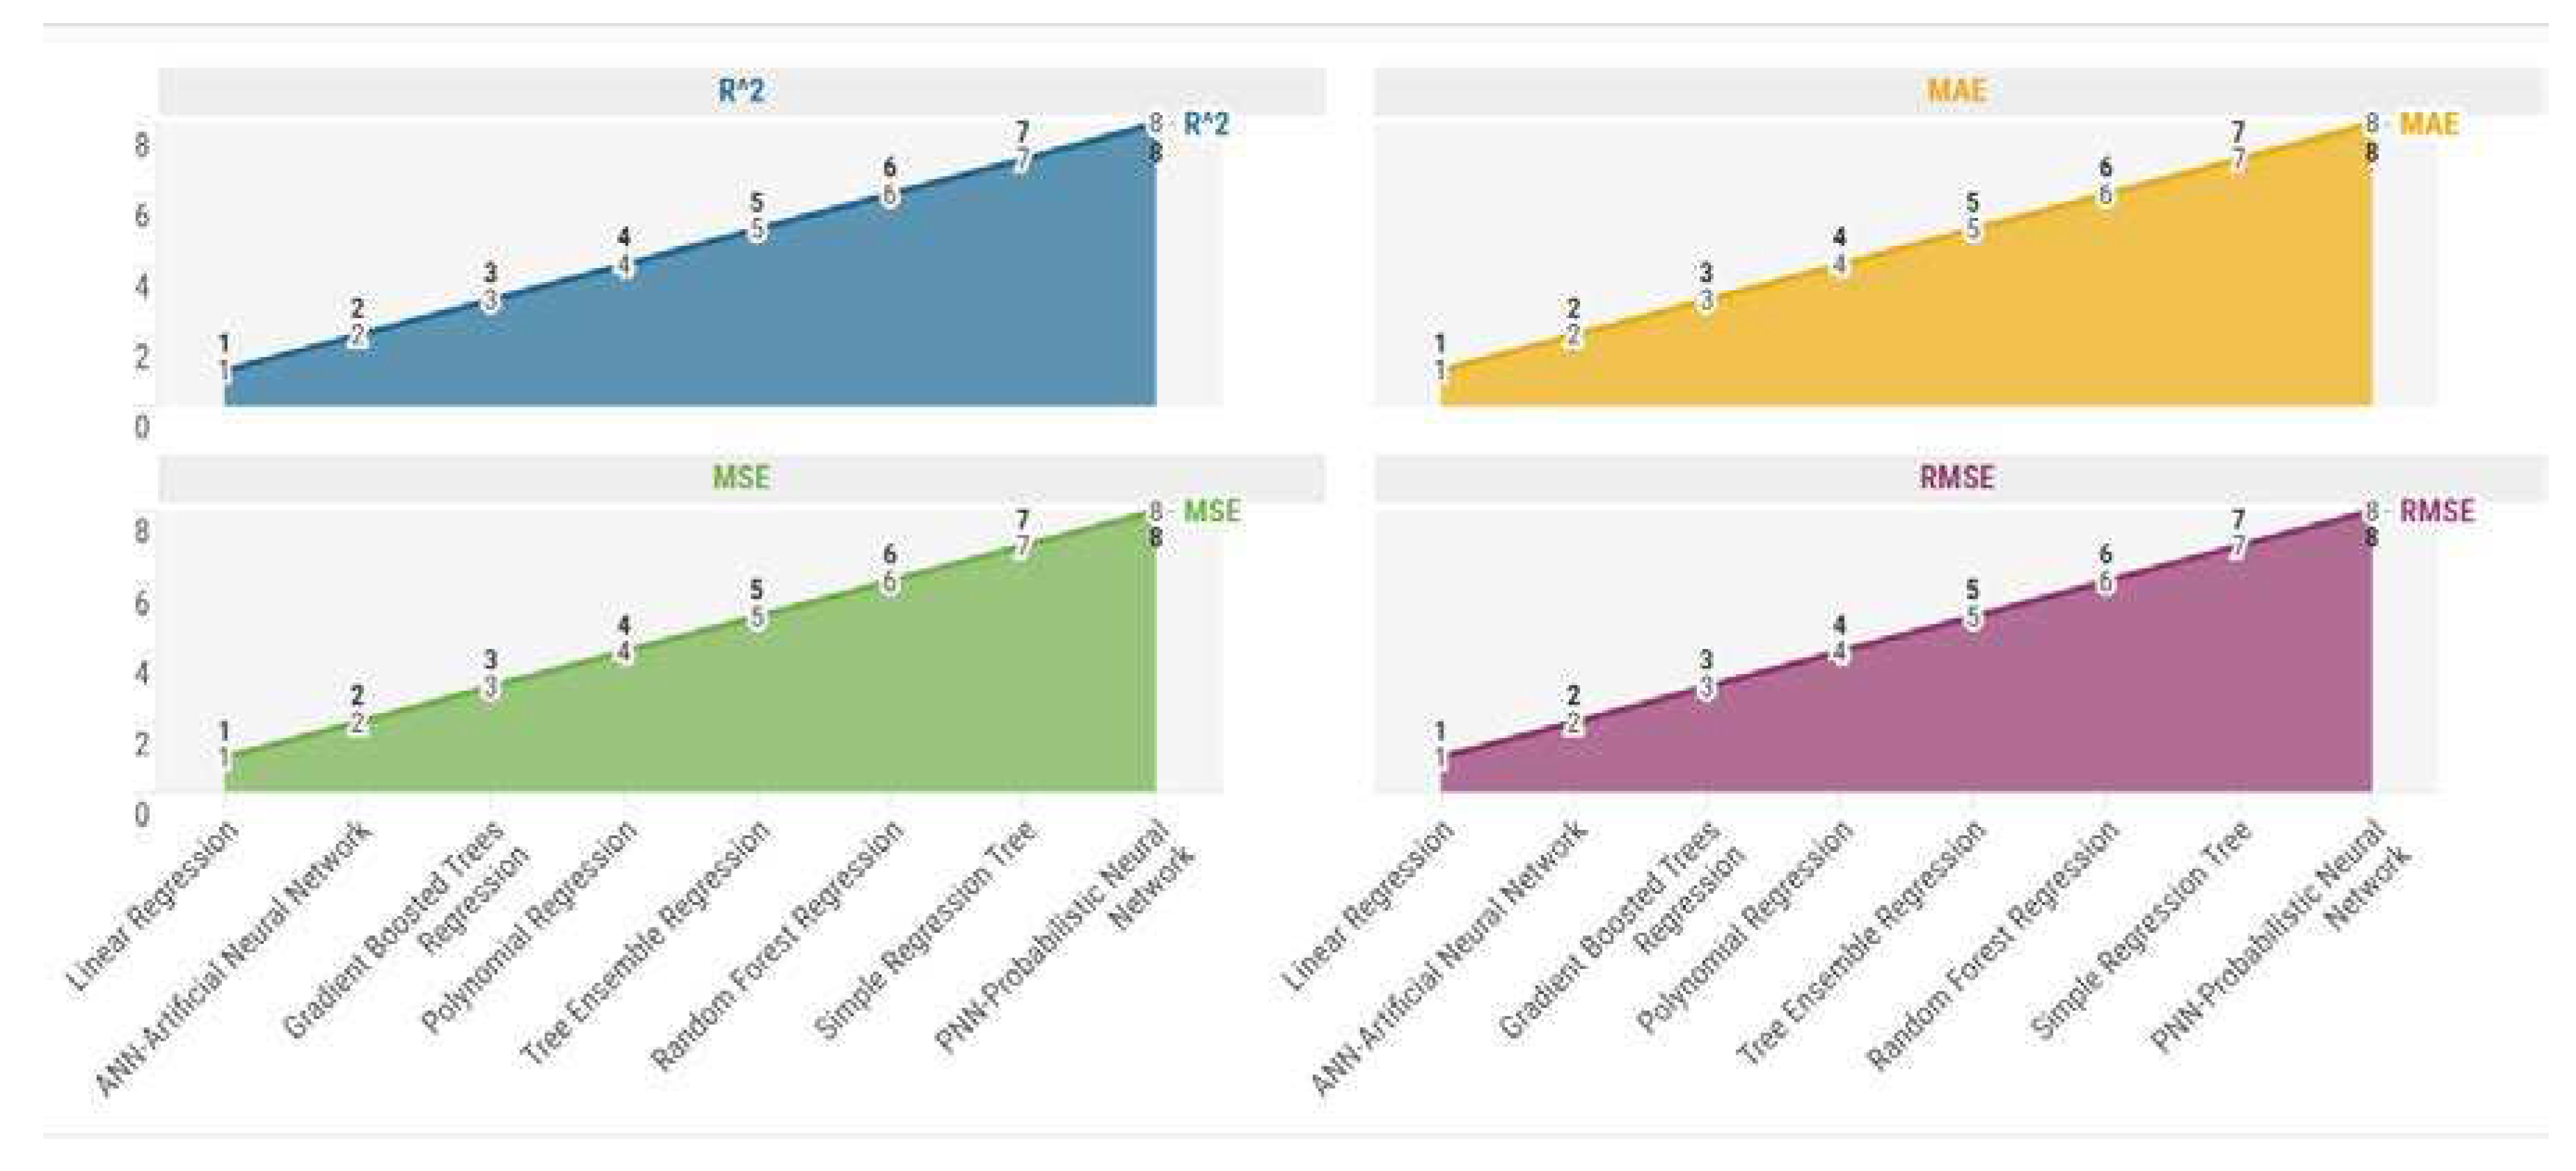
Through the analysis conducted, it was possible to obtain the following ordering of the algorithms, namely:
Linear Regression with a payoff value equal to 4;
ANN-Artificial Neural Network with a payoff value of 8;
Gradient Boosted Trees Regression with a payoff value of 12;
Polynomial Regression with a payoff value of 16;
Tree Ensemble Regression with a payoff value of 20;
Random Forest Regression with a payoff value of 24;
Simple Regression Tree with a payoff value equal to 28;
PNN-Probabilistic Neural Network with a payoff value of 32.
Figure 7.
Ranking of algorithms for predictive performance.
Figure 7.
Ranking of algorithms for predictive performance.
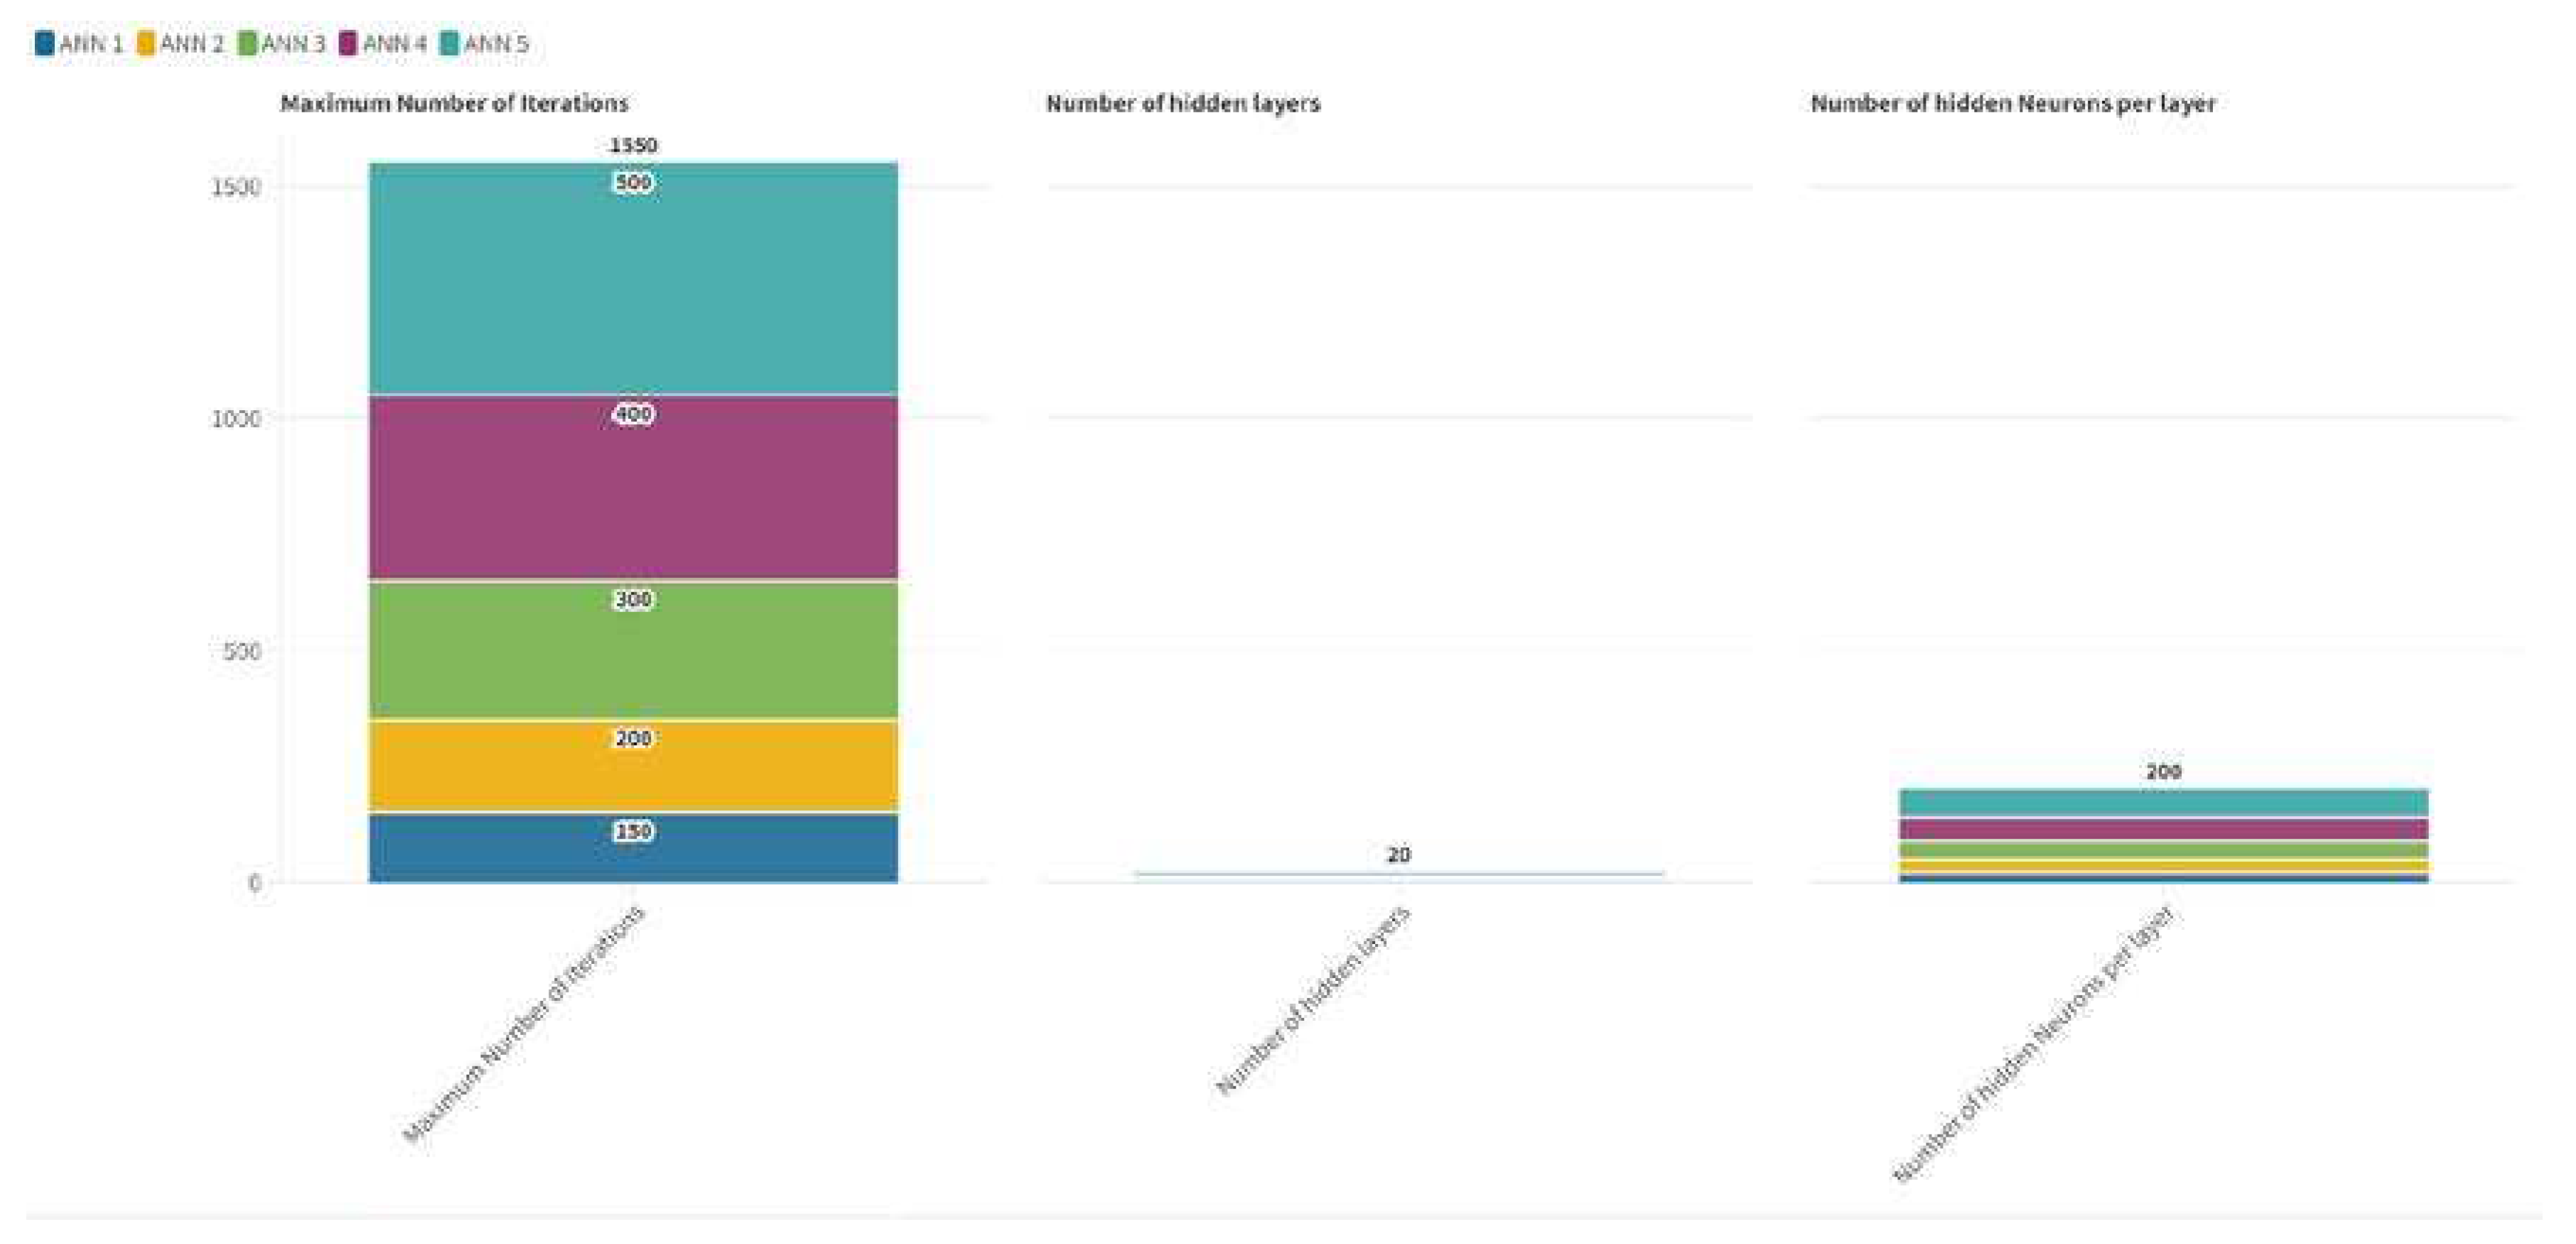
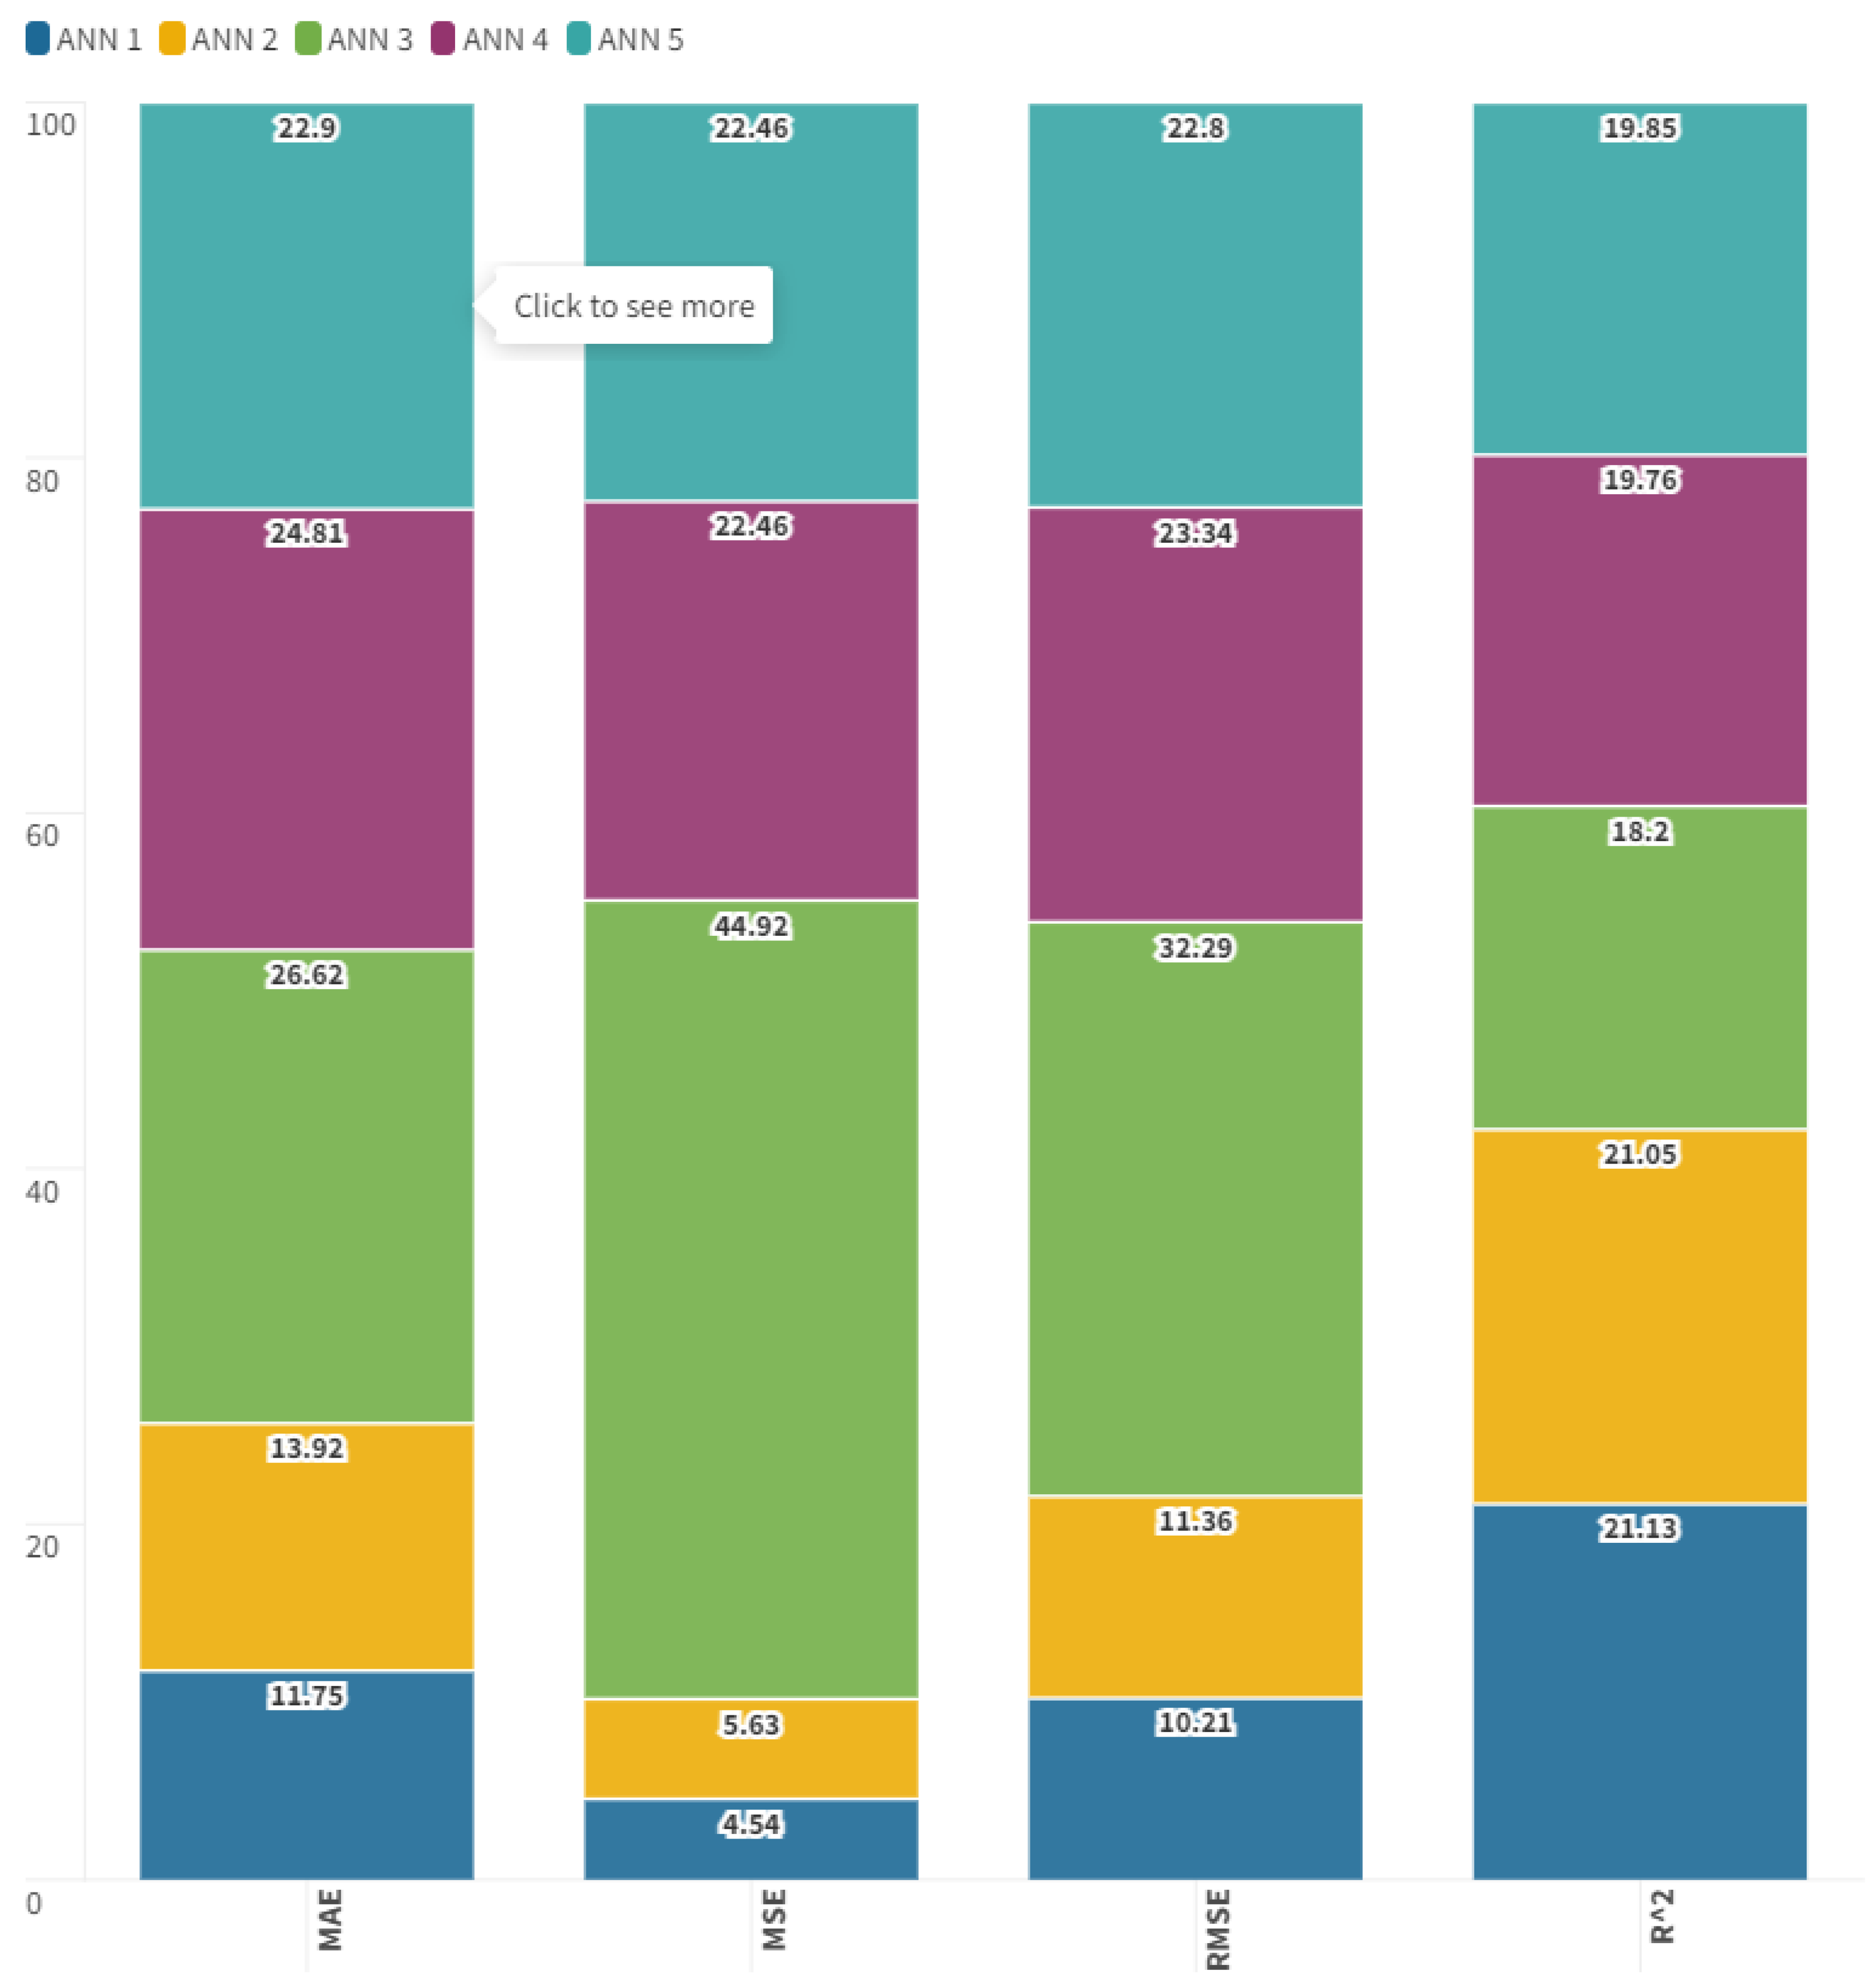
However, to have further proof of the fact that the value of Linear Regression turns out to be better than the other tested algorithms, we propose a comparison between Linear Regression and deep learning realized using ANN-Artificial Neural Network. Specifically, five examples of modified ANN with a deep learning orientation were carried out. To achieve deep learning, the hyper parameters of the ANN were modified. The three hyper parameters on which we acted are: Maximum Number of Iterations, Number of Hidden Layers, and Number of Hidden Neurons per Layer. However, the performance of the Linear Regression algorithm turns out to be efficient even in comparison with the deep learning modifications of the ANN-Artificial Neural Network algorithm. It follows that the Linear Regression algorithm is the best predictor both with reference to the eight tested algorithms and with reference to the deep learning achieved with the modifications of the ANN hyper parameters.
Figure 8.
Hyper parameters of the deep learning algorithm ANN-Artificial Neural Network.
Figure 8.
Hyper parameters of the deep learning algorithm ANN-Artificial Neural Network.
Figure 9.
Statistical errors of deep learning algorithms.
Figure 9.
Statistical errors of deep learning algorithms.
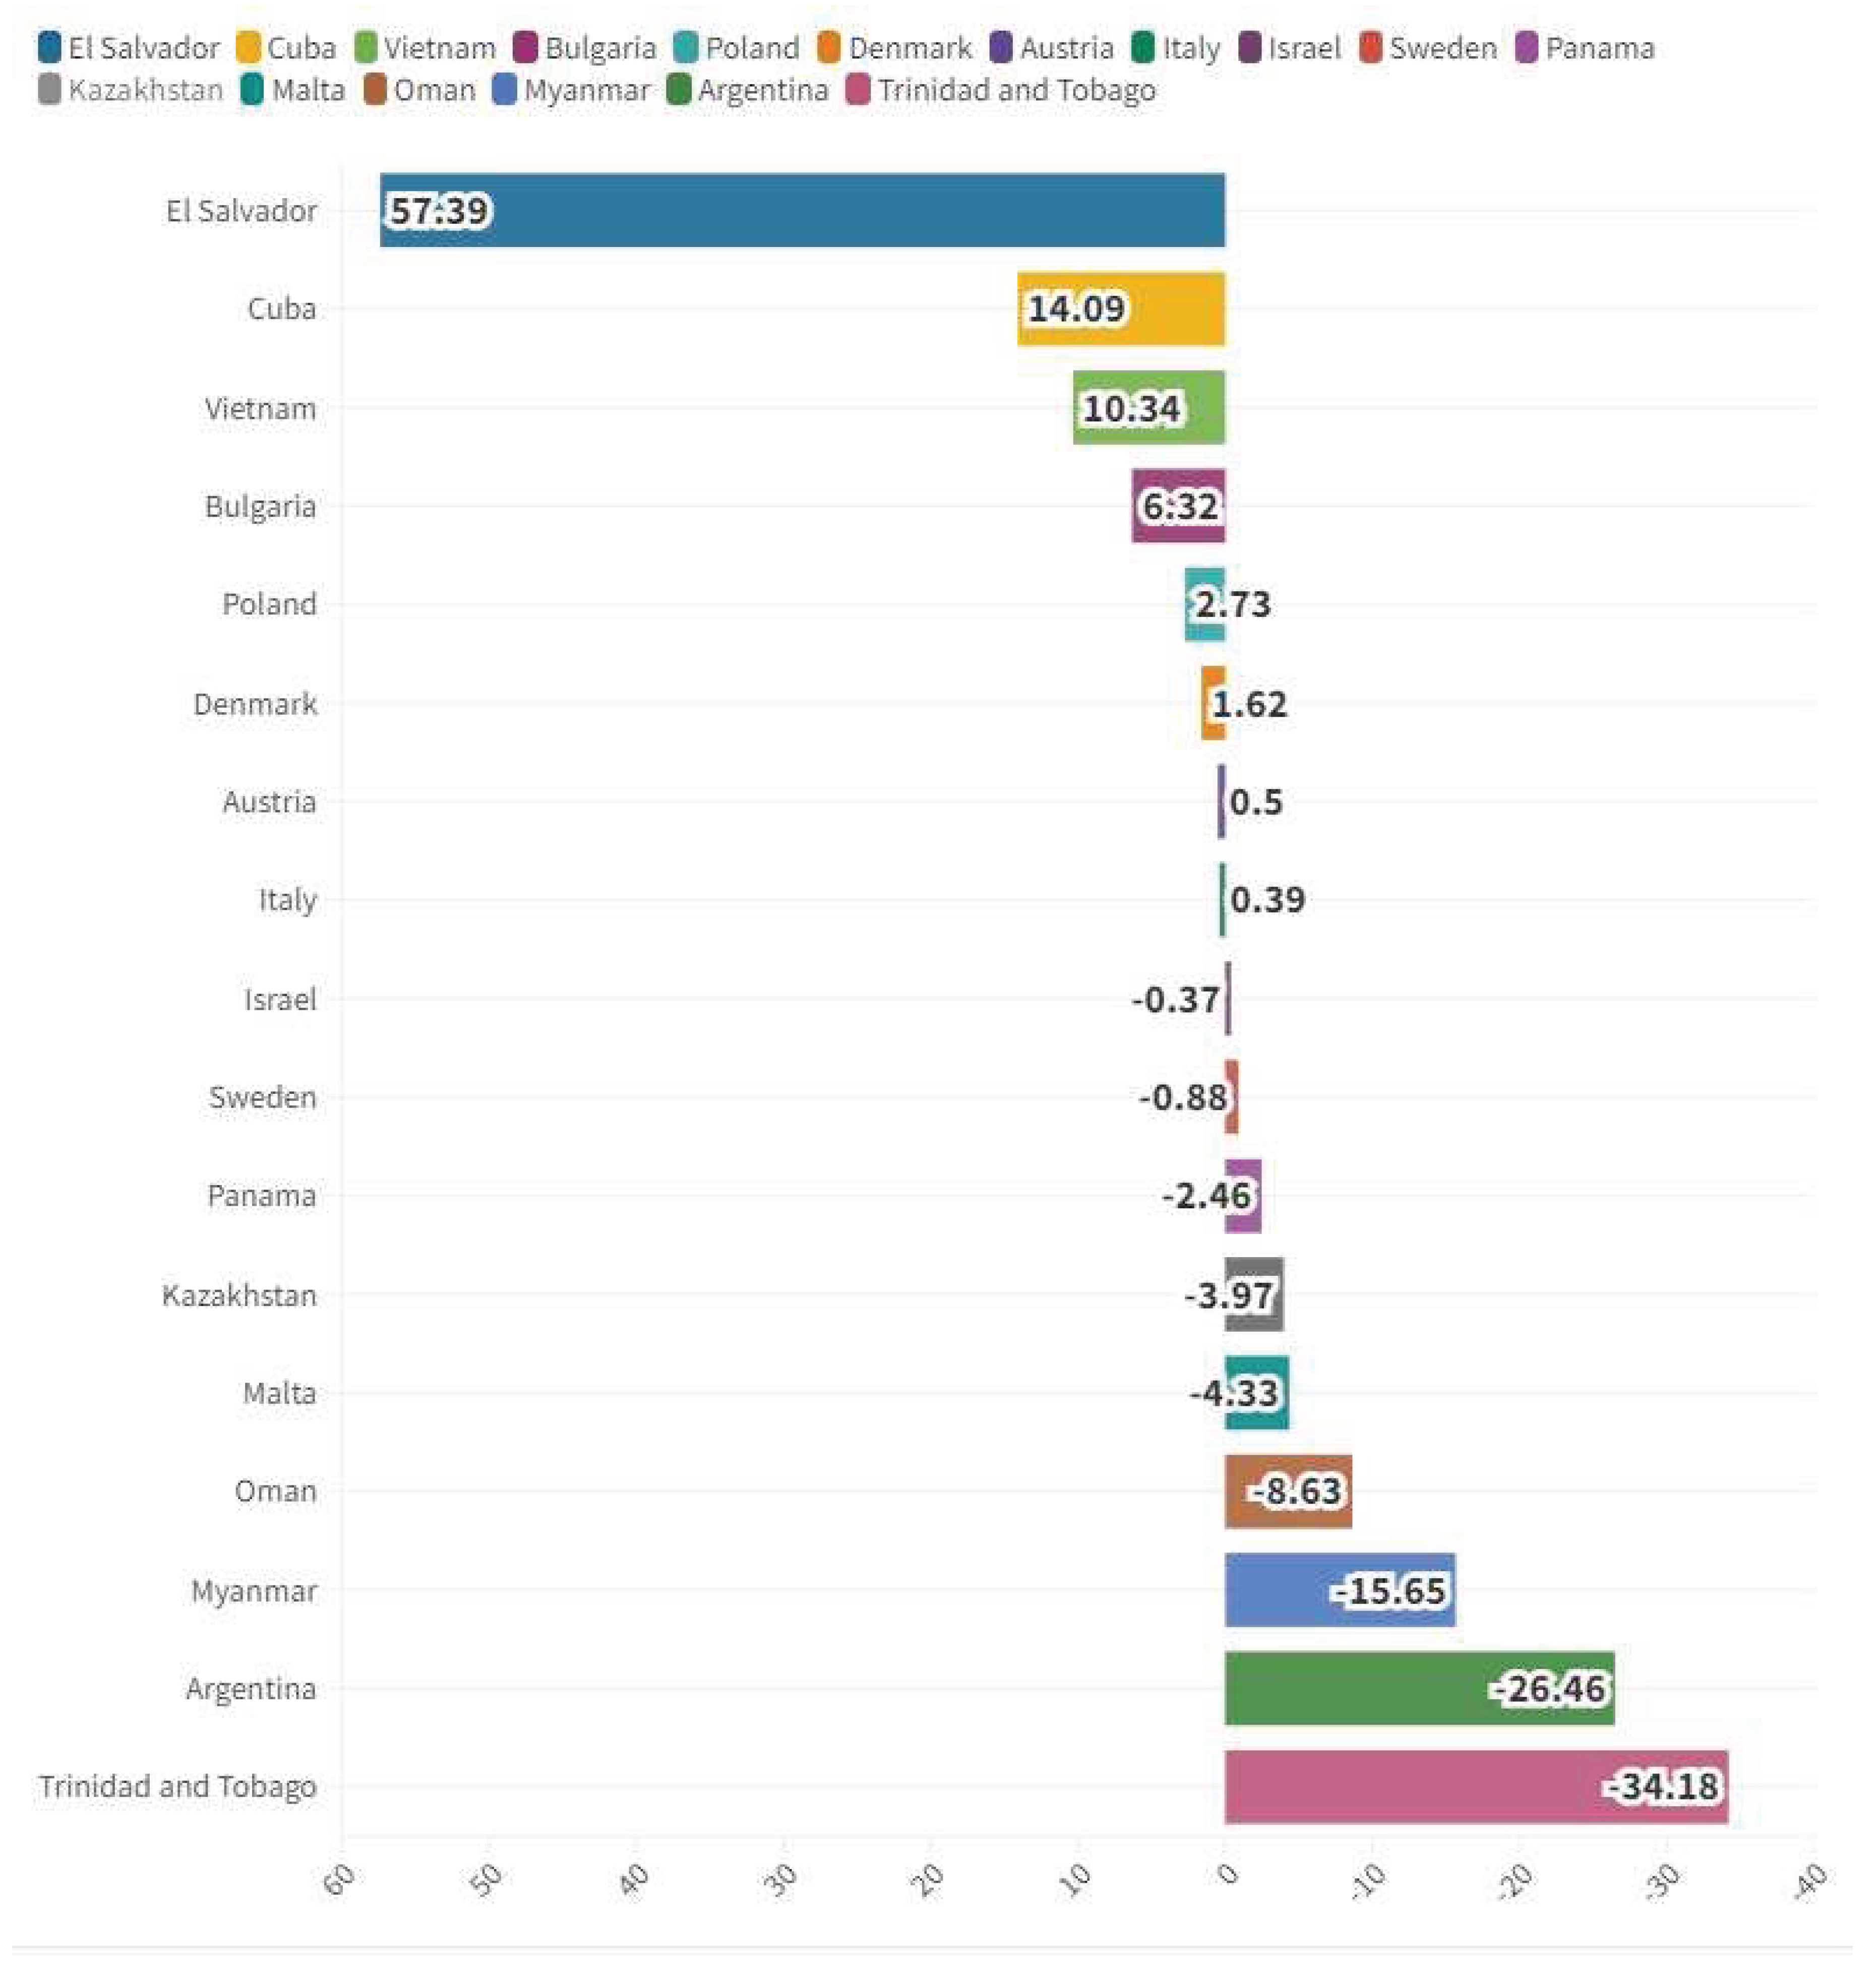
Therefore, it is possible to make predictions based on the application of the Linear Regression algorithm. As a result, the countries that will grow the most in terms of value of research and development expenditure are El Salvador with +57.39%, Cuba with +14.09%, Vietnam with +10.34%. The ranking is closed by Myanmar -15.65%, Argentina -26.46%, Trinidad and Tobago -34.18%. RDE is expected to growth on average of 0.07% for the analysed countries.
Figure 10.
Predictions with Linear Regression Algorithm.
Figure 10.
Predictions with Linear Regression Algorithm.
6. Conclusions
In the present article we have analysed the role of RDE in the context of the ESG model at world level. Our econometric results confirm the presence of a positive relationships among RDE and the variables representative of the ESG model. Furthermore we have applied a cluster analysis with the k-Means algorithm and we have found four clusters. The value of RDE tends to be higher in the countries that have a higher level of per capita income i.e. the same countries that also have more sensitivity towards the issues of the ESG model. Finally, we applied eight machine learning algorithms to predict the future value of RDE and we found that the level of RDE should increase for the analysed countries. Our analysis shows that the improvement in the level of RDE is compatible with the application of the ESG model. However, this relationship must not be taken for granted and depends on political factors. In fact, not all countries have the same advantages from the application of ESG models. It is likely that in the future a distinction will arise between ESG countries and non-ESG countries at world level. And in this distinction a key role will be played by RDE.
Funding
The authors received no financial support for the research, authorship, and/or publication of this article.
Data Availability Statement
The data presented in this study are available on request from the corresponding author.
Acknowledgements
We are grateful to the teaching staff of the LUM University Giuseppe Degennaro and to the management of the LUM Enterprise s.r.l. for the constant inspiration to continue our scientific research work undeterred.
Conflicts of Interest
The authors declare that there is no conflict of interests regarding the publication of this manuscript. In addition, the ethical issues, including plagiarism, informed consent, misconduct, data fabrication and/or falsification, double publication.
Software
The authors have used the following software: Gretl for the econometric models, Orange for clusterization and network analysis, and KNIME for machine learning and predictions. They are all free version without licenses.
Abbreviations
| Variables |
Acronym |
| Access to electricity |
AE |
| CO2 emissions |
CO2 |
| Fertility rate, total |
FR |
| Food production index |
FPI |
| GHG net emissions/removals by LUCF |
GHG |
| Gini index |
GINI |
| Heat Index 35 |
HI35 |
| Hospital beds |
HBs |
| Income share held by lowest 20% |
ISHL20 |
| Life expectancy at birth, total |
LEB |
| Mammal species, threatened |
MS |
| Maximum 5-day Rainfall, 25-year Return Level |
M5DR |
| Methane emissions |
ME |
| Mortality rate, under-5 |
MR |
| Nitrous oxide emissions |
NOE |
| PM2.5 air pollution, mean annual exposure |
PM2.5 |
| Political Stability and Absence of Violence/Terrorism |
PS |
| Prevalence of undernourishment |
PU |
| Regulatory Quality: Estimate |
RQ |
| Rule of Law: Estimate |
RL |
| School enrollment, primary |
SEP |
| School enrollment, primary and secondary |
SEPS |
| Scientific and technical journal articles |
STJA |
| Strength of legal rights index |
SLRI |
| Voice and Accountability |
VA |
| Research and Development as Percentage of GDP |
RDE |
| Sustainable Development Goals |
SDG |
| Information and Communication Technology |
ICT |
| Research and Development |
R&D |
| Return on Assets |
ROA |
| Return on Equity |
ROE |
Appendix
| Variables of the Model for the Estimation of RDE |
| Variable |
Explanation |
| Research and Development Expenditure (% of GDP) |
Gross domestic expenditures on research and development (R&D), expressed as a percent of GDP. They include both capital and current expenditures in the four main sectors: Business enterprise, Government, Higher education and Private non-profit. R&D covers basic research, applied research, and experimental development. |
| Nitrous oxide emissions |
Nitrous oxide emissions are emissions from agricultural biomass burning, industrial activities, and livestock management. |
| Scientific and technical journal articles |
Scientific and technical journal articles refer to the number of scientific and engineering articles published in the following fields: physics, biology, chemistry, mathematics, clinical medicine, biomedical research, engineering and technology, and earth and space sciences. |
| Voice and Accountability |
Voice and Accountability captures perceptions of the extent to which a country's citizens are able to participate in selecting their government, as well as freedom of expression, freedom of association, and a free media. Standard error indicates the precision of the estimate of governance. Larger values of the standard error indicate less precise estimates. A 90 percent confidence interval for the governance estimate is given by the estimate +/- 1.64 times the standard error. |
| GHG net emissions/removals by LUCF |
GHG net emissions/removals by LUCF refers to changes in atmospheric levels of all greenhouse gases attributable to forest and land-use change activities, including but not limited to (1) emissions and removals of CO2 from decreases or increases in biomass stocks due to forest management, logging, fuelwood collection, etc.; (2) conversion of existing forests and natural grasslands to other land uses; (3) removal of CO2 from the abandonment of formerly managed lands (e.g. croplands and pastures); and (4) emissions and removals of CO2 in soil associated with land-use change and management. For Annex-I countries under the UNFCCC, these data are drawn from the annual GHG inventories submitted to the UNFCCC by each country; for non-Annex-I countries, data are drawn from the most recently submitted National Communication where available. Because of differences in reporting years and methodologies, these data are not generally considered comparable across countries. Data are in million metric tons. |
| Hospital beds |
Hospital beds include inpatient beds available in public, private, general, and specialized hospitals and rehabilitation centers. In most cases beds for both acute and chronic care are included. |
| Income share held by lowest 20% |
Percentage share of income or consumption is the share that accrues to subgroups of population indicated by deciles or quintiles. Percentage shares by quintile may not sum to 100 because of rounding. |
| CO2 emissions |
Carbon dioxide emissions are those stemming from the burning of fossil fuels and the manufacture of cement. They include carbon dioxide produced during consumption of solid, liquid, and gas fuels and gas flaring. |
| Rule of Law |
Rule of Law captures perceptions of the extent to which agents have confidence in and abide by the rules of society, and in particular the quality of contract enforcement, property rights, the police, and the courts, as well as the likelihood of crime and violence. Estimate gives the country's score on the aggregate indicator, in units of a standard normal distribution, i.e. ranging from approximately -2.5 to 2.5. |
| Regulatory Quality |
Regulatory Quality captures perceptions of the ability of the government to formulate and implement sound policies and regulations that permit and promote private sector development. Percentile rank indicates the country's rank among all countries covered by the aggregate indicator, with 0 corresponding to lowest rank, and 100 to highest rank. Percentile ranks have been adjusted to correct for changes over time in the composition of the countries covered by the WGI. Percentile Rank Lower refers to lower bound of 90 percent confidence interval for governance, expressed in percentile rank terms. |
| Strength of legal rights index |
Strength of legal rights index measures the degree to which collateral and bankruptcy laws protect the rights of borrowers and lenders and thus facilitate lending. The index ranges from 0 to 12, with higher scores indicating that these laws are better designed to expand access to credit. |
| Life expectancy at birth |
Life expectancy at birth indicates the number of years a newborn infant would live if prevailing patterns of mortality at the time of its birth were to stay the same throughout its life. |
| Food production index |
Food production index covers food crops that are considered edible and that contain nutrients. Coffee and tea are excluded because, although edible, they have no nutritive value. |
| School enrolment primary |
Gross enrollment ratio is the ratio of total enrollment, regardless of age, to the population of the age group that officially corresponds to the level of education shown. Primary education provides children with basic reading, writing, and mathematics skills along with an elementary understanding of such subjects as history, geography, natural science, social science, art, and music. |
| Mortality rate, under-5 |
Under-five mortality rate is the probability per 1,000 that a newborn baby will die before reaching age five, if subject to age-specific mortality rates of the specified year. |
| Fertility rate, total |
Total fertility rate represents the number of children that would be born to a woman if she were to live to the end of her childbearing years and bear children in accordance with age-specific fertility rates of the specified year. |
| Access to electricity |
Access to electricity is the percentage of population with access to electricity. Electrification data are collected from industry, national surveys and international sources. |
| Mammal species, threatened |
Mammal species are mammals excluding whales and porpoises. Threatened species are the number of species classified by the IUCN as endangered, vulnerable, rare, indeterminate, out of danger, or insufficiently known. |
| PM2.5 air pollution, mean annual exposure |
Population-weighted exposure to ambient PM2.5 pollution is defined as the average level of exposure of a nation's population to concentrations of suspended particles measuring less than 2.5 microns in aerodynamic diameter, which are capable of penetrating deep into the respiratory tract and causing severe health damage. Exposure is calculated by weighting mean annual concentrations of PM2.5 by population in both urban and rural areas. |
| Prevalence of undernourishment |
Prevalence of undernourishments is the percentage of the population whose habitual food consumption is insufficient to provide the dietary energy levels that are required to maintain a normal active and healthy life. Data showing as 2.5 may signify a prevalence of undernourishment below 2.5%. |
| Gini index |
Gini index measures the extent to which the distribution of income (or, in some cases, consumption expenditure) among individuals or households within an economy deviates from a perfectly equal distribution. A Lorenz curve plots the cumulative percentages of total income received against the cumulative number of recipients, starting with the poorest individual or household. The Gini index measures the area between the Lorenz curve and a hypothetical line of absolute equality, expressed as a percentage of the maximum area under the line. Thus a Gini index of 0 represents perfect equality, while an index of 100 implies perfect inequality. |
| School enrolment, primary and secondary |
Gross enrollment ratio is the ratio of total enrollment, regardless of age, to the population of the age group that officially corresponds to the level of education shown. Primary education provides children with basic reading, writing, and mathematics skills along with an elementary understanding of such subjects as history, geography, natural science, social science, art, and music. |
| Methane emissions |
Methane emissions are those stemming from human activities such as agriculture and from industrial methane production. |
| Political Stability and Absence of Violence/Terrorism |
Political Stability and Absence of Violence/Terrorism measures perceptions of the likelihood of political instability and/or politically-motivated violence, including terrorism. |
| Heat Index 35 |
The heat index (HI) is an index that combines air temperature and relative humidity, in shaded areas, to posit a human-perceived equivalent temperature, as how hot it would feel if the humidity were some other value in the shade. The result is also known as the "felt air temperature", "apparent temperature", "real feel" or "feels like".[citation needed] For example, when the temperature is 32 °C (90 °F) with 70% relative humidity, the heat index is 41 °C (106 °F). The humidity where the heat index feels like itself is typically left unstated. The heat index example in this case, 41°C, feels like 41°C only when the humidity is 21%. |
| Maximum 5-day Rainfall, 25-year Return Level |
This climate index is a measure of heavy precipitation, with high values corresponding to a high chance of flooding. An increase of this index with time means that the chance of flood conditions will increase. |
| |
|
AVERAGE |
| |
const |
-0,022 |
| A2 |
Access to electricity (% of population) |
-0,0027 |
| A11 |
CO2 emissions (metric tons per capita) |
0,0353 |
| A20 |
Fertility rate, total (births per woman) |
-0,0004 |
| A21 |
Food production index (2014-2016 = 100) |
0,0015 |
| A25 |
GHG net emissions/removals by LUCF (Mt of CO2 equivalent) |
0,1376 |
| A26 |
Gini index (World Bank estimate) |
-0,0077 |
| A29 |
Heat Index 35 (projected change in days) |
-0,199 |
| A30 |
Hospital beds (per 1,000 people) |
0,0857 |
| A31 |
Income share held by lowest 20% |
0,0639 |
| A34 |
Life expectancy at birth, total (years) |
0,0039 |
| A36 |
Mammal species, threatened |
-0,0035 |
| A37 |
Maximum 5-day Rainfall, 25-year Return Level (projected change in mm) |
-0,5477 |
| A39 |
Methane emissions (metric tons of CO2 equivalent per capita) |
-0,0342 |
| A40 |
Mortality rate, under-5 (per 1,000 live births) |
-0,0001 |
| A42 |
Nitrous oxide emissions (metric tons of CO2 equivalent per capita) |
1,8121 |
| A46 |
PM2.5 air pollution, mean annual exposure (micrograms per cubic meter) |
-0,0045 |
| A47 |
Political Stability and Absence of Violence/Terrorism: Estimate |
-0,172 |
| A52 |
Prevalence of undernourishment (% of population) |
-0,0052 |
| A55 |
Regulatory Quality: Estimate |
0,0159 |
| A59 |
Rule of Law: Estimate |
0,0236 |
| A60 |
School enrollment, primary (% gross) |
0,0007 |
| A61 |
School enrollment, primary and secondary (gross), gender parity index (GPI) |
-0,0132 |
| A62 |
Scientific and technical journal articles |
0,5837 |
| A63 |
Strength of legal rights index (0=weak to 12=strong) |
0,0042 |
| A67 |
Voice and Accountability: Estimate |
0,1573 |
| Model 51: Pooled OLS, using 1930 observations |
| Included 193 cross-sectional units |
| Time-series length = 10 |
| Dependent variable: A58 |
| |
Coefficient |
Std. Error |
t-ratio |
p-value |
|
| const |
−0.0437232 |
0.0335879 |
−1.302 |
0.1932 |
|
| A2 |
−0.00329744 |
0.000497829 |
−6.624 |
<0.0001 |
*** |
| A11 |
0.0362161 |
0.00315293 |
11.49 |
<0.0001 |
*** |
| A20 |
−0.000446717 |
5.14355e-05 |
−8.685 |
<0.0001 |
*** |
| A21 |
0.00151866 |
0.000401700 |
3.781 |
0.0002 |
*** |
| A25 |
0.0902265 |
0.0512769 |
1.760 |
0.0786 |
* |
| A26 |
−0.00897876 |
0.00124828 |
−7.193 |
<0.0001 |
*** |
| A29 |
−0.211680 |
0.0260997 |
−8.110 |
<0.0001 |
*** |
| A30 |
0.106335 |
0.00621921 |
17.10 |
<0.0001 |
*** |
| A31 |
0.0670256 |
0.00708497 |
9.460 |
<0.0001 |
*** |
| A34 |
0.00475501 |
0.000716859 |
6.633 |
<0.0001 |
*** |
| A36 |
−0.00362565 |
0.00141301 |
−2.566 |
0.0104 |
** |
| A37 |
−0.545699 |
0.0403146 |
−13.54 |
<0.0001 |
*** |
| A39 |
−0.0377018 |
0.00497683 |
−7.575 |
<0.0001 |
*** |
| A40 |
−6.87432e-05 |
1.48360e-05 |
−4.634 |
<0.0001 |
*** |
| A42 |
1.79160e-05 |
2.56023e-06 |
6.998 |
<0.0001 |
*** |
| A46 |
−0.00573587 |
0.000795586 |
−7.210 |
<0.0001 |
*** |
| A47 |
−0.157564 |
0.0145666 |
−10.82 |
<0.0001 |
*** |
| A52 |
−0.00393085 |
0.00126399 |
−3.110 |
0.0019 |
*** |
| A55 |
0.0212810 |
0.00371043 |
5.735 |
<0.0001 |
*** |
| A59 |
0.0312271 |
0.00616446 |
5.066 |
<0.0001 |
*** |
| A60 |
0.000910978 |
0.000265420 |
3.432 |
0.0006 |
*** |
| A61 |
−0.00992673 |
0.00289977 |
−3.423 |
0.0006 |
*** |
| A62 |
5.27397e-06 |
2.95423e-07 |
17.85 |
<0.0001 |
*** |
| A63 |
0.00418506 |
3.59194e-05 |
116.5 |
<0.0001 |
*** |
| A67 |
0.184053 |
0.0157479 |
11.69 |
<0.0001 |
*** |
| Mean dependent var |
0.529537 |
|
S.D. dependent var |
2.735240 |
| Sum squared resid |
473.6768 |
|
S.E. of regression |
0.498778 |
| R-squared |
0.967178 |
|
Adjusted R-squared |
0.966748 |
| F(25, 1904) |
2244.267 |
|
P-value(F) |
0.000000 |
| Log-likelihood |
−1382.967 |
|
Akaike criterion |
2817.935 |
| Schwarz criterion |
2962.632 |
|
Hannan-Quinn |
2871.161 |
| rho |
0.569206 |
|
Durbin-Watson |
0.746983 |
| Model 50: Random-effects (GLS), using 1930 observations |
| Included 193 cross-sectional units |
| Time-series length = 10 |
| Dependent variable: A58 |
| |
Coefficient |
Std. Error |
z |
p-value |
|
| const |
−0.0205396 |
0.0355755 |
−0.5774 |
0.5637 |
|
| A2 |
−0.00292239 |
0.000674090 |
−4.335 |
<0.0001 |
*** |
| A11 |
0.0388896 |
0.00387377 |
10.04 |
<0.0001 |
*** |
| A20 |
−0.000411793 |
3.88572e-05 |
−10.60 |
<0.0001 |
*** |
| A21 |
0.00193752 |
0.000337807 |
5.736 |
<0.0001 |
*** |
| A25 |
0.113651 |
0.0403446 |
2.817 |
0.0048 |
*** |
| A26 |
−0.00852014 |
0.00135079 |
−6.308 |
<0.0001 |
*** |
| A29 |
−0.210736 |
0.0208103 |
−10.13 |
<0.0001 |
*** |
| A30 |
0.0693152 |
0.00582552 |
11.90 |
<0.0001 |
*** |
| A31 |
0.0701133 |
0.00769382 |
9.113 |
<0.0001 |
*** |
| A34 |
0.00441682 |
0.000930971 |
4.744 |
<0.0001 |
*** |
| A36 |
−0.00431443 |
0.00104664 |
−4.122 |
<0.0001 |
*** |
| A37 |
−0.584047 |
0.0341889 |
−17.08 |
<0.0001 |
*** |
| A39 |
−0.0356243 |
0.00613954 |
−5.802 |
<0.0001 |
*** |
| A40 |
−6.91338e-05 |
1.19503e-05 |
−5.785 |
<0.0001 |
*** |
| A42 |
1.81938e-05 |
1.77668e-06 |
10.24 |
<0.0001 |
*** |
| A46 |
−0.00491280 |
0.000713272 |
−6.888 |
<0.0001 |
*** |
| A47 |
−0.195326 |
0.0169674 |
−11.51 |
<0.0001 |
*** |
| A52 |
−0.00785333 |
0.00169226 |
−4.641 |
<0.0001 |
*** |
| A55 |
0.0160805 |
0.00315393 |
5.099 |
<0.0001 |
*** |
| A59 |
0.0160989 |
0.00510579 |
3.153 |
0.0016 |
*** |
| A60 |
0.000640343 |
0.000239995 |
2.668 |
0.0076 |
*** |
| A61 |
−0.00849788 |
0.00298020 |
−2.851 |
0.0044 |
*** |
| A62 |
5.70414e-06 |
3.77067e-07 |
15.13 |
<0.0001 |
*** |
| A63 |
0.00421834 |
3.80805e-05 |
110.8 |
<0.0001 |
*** |
| A67 |
0.190066 |
0.0203088 |
9.359 |
<0.0001 |
*** |
| Mean dependent var |
0.529537 |
|
S.D. dependent var |
2.735240 |
| Sum squared resid |
500.4826 |
|
S.E. of regression |
0.512563 |
| Log-likelihood |
−1436.088 |
|
Akaike criterion |
2924.177 |
| Schwarz criterion |
3068.874 |
|
Hannan-Quinn |
2977.402 |
| rho |
0.035735 |
|
Durbin-Watson |
1.685768 |
| 'Between' variance = 0.112769 |
| 'Within' variance = 0.113632 |
| theta used for quasi-demeaning = 0.697442 |
| Joint test on named regressors - |
| Asymptotic test statistic: Chi-square(25) = 32979.1 |
| with p-value = 0 |
| |
| Breusch-Pagan test - |
| Null hypothesis: Variance of the unit-specific error = 0 |
| Asymptotic test statistic: Chi-square(1) = 2228.8 |
| with p-value = 0 |
| |
| Hausman test - |
| Null hypothesis: GLS estimates are consistent |
| Asymptotic test statistic: Chi-square(25) = 105.908 |
| with p-value = 6.23115e-12 |
| Model 49: Fixed-effects, using 1930 observations |
| Included 193 cross-sectional units |
| Time-series length = 10 |
| Dependent variable: A58 |
| |
Coefficient |
Std. Error |
t-ratio |
p-value |
|
| const |
−0.0137583 |
0.0255694 |
−0.5381 |
0.5906 |
|
| A2 |
−0.00258048 |
0.000812770 |
−3.175 |
0.0015 |
*** |
| A11 |
0.0394891 |
0.00434542 |
9.088 |
<0.0001 |
*** |
| A20 |
−0.000388265 |
3.96874e-05 |
−9.783 |
<0.0001 |
*** |
| A21 |
0.00198856 |
0.000347301 |
5.726 |
<0.0001 |
*** |
| A25 |
0.170831 |
0.0427168 |
3.999 |
<0.0001 |
*** |
| A26 |
−0.00800275 |
0.00144203 |
−5.550 |
<0.0001 |
*** |
| A29 |
−0.227882 |
0.0224216 |
−10.16 |
<0.0001 |
*** |
| A30 |
0.0604719 |
0.00600743 |
10.07 |
<0.0001 |
*** |
| A31 |
0.0670095 |
0.00822754 |
8.145 |
<0.0001 |
*** |
| A34 |
0.00406259 |
0.00111090 |
3.657 |
0.0003 |
*** |
| A36 |
−0.00412498 |
0.00104170 |
−3.960 |
<0.0001 |
*** |
| A37 |
−0.618114 |
0.0376145 |
−16.43 |
<0.0001 |
*** |
| A39 |
−0.0380735 |
0.00703261 |
−5.414 |
<0.0001 |
*** |
| A40 |
−7.81751e-05 |
1.28117e-05 |
−6.102 |
<0.0001 |
*** |
| A42 |
1.79395e-05 |
1.74718e-06 |
10.27 |
<0.0001 |
*** |
| A46 |
−0.00431642 |
0.000742550 |
−5.813 |
<0.0001 |
*** |
| A47 |
−0.262261 |
0.0214172 |
−12.25 |
<0.0001 |
*** |
| A52 |
−0.00768454 |
0.00205299 |
−3.743 |
0.0002 |
*** |
| A55 |
0.0152906 |
0.00331475 |
4.613 |
<0.0001 |
*** |
| A59 |
0.0205046 |
0.00578028 |
3.547 |
0.0004 |
*** |
| A60 |
0.000688070 |
0.000246356 |
2.793 |
0.0053 |
*** |
| A61 |
−0.0187677 |
0.00429613 |
−4.369 |
<0.0001 |
*** |
| A62 |
5.85917e-06 |
4.26905e-07 |
13.72 |
<0.0001 |
*** |
| A63 |
0.00430561 |
4.71530e-05 |
91.31 |
<0.0001 |
*** |
| A67 |
0.166255 |
0.0250478 |
6.638 |
<0.0001 |
*** |
| Mean dependent var |
0.529537 |
|
S.D. dependent var |
2.735240 |
| Sum squared resid |
194.5383 |
|
S.E. of regression |
0.337094 |
| LSDV R-squared |
0.986520 |
|
Within R-squared |
0.937002 |
| LSDV F(217, 1712) |
577.3884 |
|
P-value(F) |
0.000000 |
| Log-likelihood |
−524.2177 |
|
Akaike criterion |
1484.435 |
| Schwarz criterion |
2697.665 |
|
Hannan-Quinn |
1930.711 |
| rho |
0.035735 |
|
Durbin-Watson |
1.685768 |
| Joint test on named regressors - |
| Test statistic: F(25, 1712) = 1018.55 |
| with p-value = P(F(25, 1712) > 1018.55) = 0 |
| |
| Test for differing group intercepts - |
| Null hypothesis: The groups have a common intercept |
| Test statistic: F(192, 1712) = 12.7943 |
| with p-value = P(F(192, 1712) > 12.7943) = 1.56871e-220 |
| Model 48: WLS, using 1930 observations |
| Included 193 cross-sectional units |
| Dependent variable: A58 |
| Weights based on per-unit error variances |
| |
Coefficient |
Std. Error |
t-ratio |
p-value |
|
| const |
−0.00978181 |
0.0111567 |
−0.8768 |
0.3807 |
|
| A2 |
−0.00193854 |
0.000163187 |
−11.88 |
<0.0001 |
*** |
| A11 |
0.0267547 |
0.00180722 |
14.80 |
<0.0001 |
*** |
| A20 |
−0.000392205 |
0.000121101 |
−3.239 |
0.0012 |
*** |
| A21 |
0.000673670 |
0.000130554 |
5.160 |
<0.0001 |
*** |
| A25 |
0.175825 |
0.0980634 |
1.793 |
0.0731 |
* |
| A26 |
−0.00548706 |
0.000388887 |
−14.11 |
<0.0001 |
*** |
| A29 |
−0.145817 |
0.0411393 |
−3.544 |
0.0004 |
*** |
| A30 |
0.106595 |
0.00333274 |
31.98 |
<0.0001 |
*** |
| A31 |
0.0516032 |
0.00305871 |
16.87 |
<0.0001 |
*** |
| A34 |
0.00236021 |
0.000240019 |
9.833 |
<0.0001 |
*** |
| A36 |
−0.00198128 |
0.000425071 |
−4.661 |
<0.0001 |
*** |
| A37 |
−0.442870 |
0.0610349 |
−7.256 |
<0.0001 |
*** |
| A39 |
−0.0252844 |
0.00185716 |
−13.61 |
<0.0001 |
*** |
| A40 |
−3.44621e-05 |
1.84524e-05 |
−1.868 |
0.0620 |
* |
| A42 |
1.84329e-05 |
4.77816e-06 |
3.858 |
0.0001 |
*** |
| A46 |
−0.00307360 |
0.000285884 |
−10.75 |
<0.0001 |
*** |
| A47 |
−0.0728183 |
0.00673441 |
−10.81 |
<0.0001 |
*** |
| A52 |
−0.00121102 |
0.000360229 |
−3.362 |
0.0008 |
*** |
| A55 |
0.0108550 |
0.00378068 |
2.871 |
0.0041 |
*** |
| A59 |
0.0266973 |
0.00600331 |
4.447 |
<0.0001 |
*** |
| A60 |
0.000428444 |
8.61477e-05 |
4.973 |
<0.0001 |
*** |
| A61 |
−0.0156713 |
0.00382193 |
−4.100 |
<0.0001 |
*** |
| A62 |
6.50935e-06 |
2.06178e-07 |
31.57 |
<0.0001 |
*** |
| A63 |
0.00414135 |
7.74981e-05 |
53.44 |
<0.0001 |
*** |
| A67 |
0.0888426 |
0.00797105 |
11.15 |
<0.0001 |
*** |
| Statistics based on the weighted data: |
| Sum squared resid |
1485.381 |
|
S.E. of regression |
0.883254 |
| R-squared |
0.894870 |
|
Adjusted R-squared |
0.893490 |
| F(25, 1904) |
648.2778 |
|
P-value(F) |
0.000000 |
| Log-likelihood |
−2485.868 |
|
Akaike criterion |
5023.735 |
| Schwarz criterion |
5168.432 |
|
Hannan-Quinn |
5076.961 |
| Statistics based on the original data: |
| Mean dependent var |
0.529537 |
|
S.D. dependent var |
2.735240 |
| Sum squared resid |
513.9790 |
|
S.E. of regression |
0.519564 |
| |
|
POOLED OLS |
Random-effects |
Fixed-effects |
WLS |
|
| |
|
COEFFICIENT |
P-VALUE |
COEFFICIENT |
P-VALUE |
COEFFICIENT |
P-VALUE |
COEFFICIENT |
P-VALUE |
AVERAGE |
| |
const |
-0,0437232 |
|
-0,0205396 |
|
-0,0137583 |
|
-0,00978181 |
|
-0,0220 |
| A2 |
Access to electricity (% of population) |
-0,00329744 |
*** |
-0,00292239 |
*** |
-0,00258048 |
*** |
-0,00193854 |
*** |
-0,0027 |
| A11 |
CO2 emissions (metric tons per capita) |
0,0362161 |
*** |
0,0388896 |
*** |
0,0394891 |
*** |
0,0267547 |
*** |
0,0353 |
| A20 |
Fertility rate, total (births per woman) |
-0,000446717 |
*** |
-0,000411793 |
*** |
-0,000388265 |
*** |
-0,000392205 |
*** |
-0,0004 |
| A21 |
Food production index (2014-2016 = 100) |
0,00151866 |
*** |
0,00193752 |
*** |
0,00198856 |
*** |
0,00067367 |
*** |
0,0015 |
| A25 |
GHG net emissions/removals by LUCF (Mt of CO2 equivalent) |
0,0902265 |
* |
0,113651 |
*** |
0,170831 |
*** |
0,175825 |
* |
0,1376 |
| A26 |
Gini index (World Bank estimate) |
-0,00897876 |
*** |
-0,00852014 |
*** |
-0,00800275 |
*** |
-0,00548706 |
*** |
-0,0077 |
| A29 |
Heat Index 35 (projected change in days) |
-0,21168 |
*** |
-0,210736 |
*** |
-0,227882 |
*** |
-0,145817 |
*** |
-0,1990 |
| A30 |
Hospital beds (per 1,000 people) |
0,106335 |
*** |
0,0693152 |
*** |
0,0604719 |
*** |
0,106595 |
*** |
0,0857 |
| A31 |
Income share held by lowest 20% |
0,0670256 |
*** |
0,0701133 |
*** |
0,0670095 |
*** |
0,0516032 |
*** |
0,0639 |
| A34 |
Life expectancy at birth, total (years) |
0,00475501 |
*** |
0,00441682 |
*** |
0,00406259 |
*** |
0,00236021 |
*** |
0,0039 |
| A36 |
Mammal species, threatened |
-0,00362565 |
** |
-0,00431443 |
*** |
-0,00412498 |
*** |
-0,00198128 |
*** |
-0,0035 |
| A37 |
Maximum 5-day Rainfall, 25-year Return Level (projected change in mm) |
-0,545699 |
*** |
-0,584047 |
*** |
-0,618114 |
*** |
-0,44287 |
*** |
-0,5477 |
| A39 |
Methane emissions (metric tons of CO2 equivalent per capita) |
-0,0377018 |
*** |
-0,0356243 |
*** |
-0,0380735 |
*** |
-0,0252844 |
*** |
-0,0342 |
| A40 |
Mortality rate, under-5 (per 1,000 live births) |
-6,87E-05 |
*** |
-6,91E-05 |
*** |
-7,82E-05 |
*** |
-3,45E-05 |
* |
-0,0001 |
| A42 |
Nitrous oxide emissions (metric tons of CO2 equivalent per capita) |
1,79E+00 |
*** |
1,82E+00 |
*** |
1,79E+00 |
*** |
1,84E+00 |
*** |
1,8121 |
| A46 |
PM2.5 air pollution, mean annual exposure (micrograms per cubic meter) |
-0,00573587 |
*** |
-0,0049128 |
*** |
-0,00431642 |
*** |
-0,0030736 |
*** |
-0,0045 |
| A47 |
Political Stability and Absence of Violence/Terrorism: Estimate |
-0,157564 |
*** |
-0,195326 |
*** |
-0,262261 |
*** |
-0,0728183 |
*** |
-0,1720 |
| A52 |
Prevalence of undernourishment (% of population) |
-0,00393085 |
*** |
-0,00785333 |
*** |
-0,00768454 |
*** |
-0,00121102 |
*** |
-0,0052 |
| A55 |
Regulatory Quality: Estimate |
0,021281 |
*** |
0,0160805 |
*** |
0,0152906 |
*** |
0,010855 |
*** |
0,0159 |
| A59 |
Rule of Law: Estimate |
0,0312271 |
*** |
0,0160989 |
*** |
0,0205046 |
*** |
0,0266973 |
*** |
0,0236 |
| A60 |
School enrollment, primary (% gross) |
0,000910978 |
*** |
0,000640343 |
*** |
0,00068807 |
*** |
0,000428444 |
*** |
0,0007 |
| A61 |
School enrollment, primary and secondary (gross), gender parity index (GPI) |
-0,00992673 |
*** |
-0,00849788 |
*** |
-0,0187677 |
*** |
-0,0156713 |
*** |
-0,0132 |
| A62 |
Scientific and technical journal articles |
5,27E-01 |
*** |
5,70E-01 |
*** |
5,86E-01 |
*** |
6,51E-01 |
*** |
0,5837 |
| A63 |
Strength of legal rights index (0=weak to 12=strong) |
0,00418506 |
*** |
0,00421834 |
*** |
0,00430561 |
*** |
0,00414135 |
*** |
0,0042 |
| A67 |
Voice and Accountability: Estimate |
0,184053 |
*** |
0,190066 |
*** |
0,166255 |
*** |
0,0888426 |
*** |
0,1573 |
Clusterization
References
- C. L. Elena e F. O. Bianca, «THE INFLUENCE OF RESEARCH AND DEVELOPMENT EXPENDITURE AND LEVEL OF INTERNET ACCESS ON EMPLOYED ICT SPECIALISTS IN ROMANIA,» IETI Transactions on Economics and Management, vol. 3, n. 2, pp. 5-13, 2021.
- L. Laureti, A. Costantiello e A. Leogrande, «THE DETERMINANTS OF FIRM INVESTMENTS IN RESEARCH AND DEVELOPMENT,» IAI ACADEMIC CONFERENCE PROCEEDINGS Education and Social Sciences Business and Economics, pp. 55-67, 2021.
- Leogrande, A. Massaro e A. M. Galiano, «The attractiveness of European research systems,» American Journal of Humanities and Social Sciences Research (AJHSSR), vol. 4, n. 10, pp. 72-101, 2020.
- Bakhtiari, S.; Breunig, R. The role of spillovers in research and development expenditure in Australian industries. Econ. Innov. New Technol. 2017, 27, 14–38. [Google Scholar] [CrossRef]
- Nurpeisova, G. Mauina, S. Niyazbekova, A. Jumagaliyeva, A. Zholmukhanova, Y. G. Tyurina e L. A. Maisigova, «Impact of R&D expenditures on the country's innovative potential: a case study,» Entrepreneurship and Sustainability Issues, vol. 2, n. 682, p. 8, 2020.
- Baruk, J. Research and Development Expenditures in the Sector of Polish Enterprises as an Instrument of Research and Development Policy. Mark. Sci. Res. Organ. 2022, 43, 25–52. [Google Scholar] [CrossRef]
- M. M. Grzelak, I. Laskowska e E. Roszko-Wójtowicz, «The importance of Research and Development expenditure for the competitiveness of manufacturing enterprises in Poland. The application of panel models,» Econometrics. Ekonometria. Advances in Applied Data Analytics, vol. 22, n. 3, pp. 9-22, 2018.
- Caglar, M.; Nisel, R.N. Impact of marketing and R D expenditures on financial performance: a research in manufacturing industry. Pressacademia 2017, 4, 359–371. [Google Scholar] [CrossRef]
- Leogrande, A. Massaro e A. M. Galiano, «The impact of R&D investments on corporate performance in European Countries,» American Journal of Humanities and Social Sciences Research (AJHSSR), vol. 4, n. 7, pp. 186-201, 2020.
- Leogrande, A. Costantiello e L. Laureti, «The Impact of Patent Applications on Technological Innovation in European Countries,» University Library of Munich, Germany., n. 115346, 2022.
- Leogrande, A. Costantiello e L. Laureti, «The Opportunity Driven Entrepreneurship in the Context of Innovation Systems in Europe in the Period 2010-2019,» University Library of Munich, Germany, n. 114716, 2022.
- Leogrande, A. Costantiello, L. Laureti e M. M. Matarrese, «Innovative SMEs Collaborating with Others in Europe,» University Library of Munich, Germany, n. 113008, 2022.
- Costantiello, L. Laureti e A. Leogrande, «The Intellectual Assets in Europe,» University Library of Munich, Germany, n. 110506, 2021.
- Costantiello, A. Leogrande e L. Laureti, «The Corporate Innovation in Europe,» SSRN Electronic Journal, vol. 10, n. 130, 2021.
- Barros, V.; Matos, P.V.; Sarmento, J.M.; Vieira, P.R. High-tech firms: Dividend policy in a context of sustainability and technological change. Technol. Forecast. Soc. Chang. 2023, 190. [Google Scholar] [CrossRef]
- Herciu, M.; Șerban, R.A. Measuring Firm Performance: Testing a Proposed Model. Stud. Bus. Econ. 2018, 13, 103–114. [Google Scholar] [CrossRef]
- Leogrande, L. Laureti e A. Costantiello, «The Innovation Index in Europe,» International Journal of Entrepreneurship, vol. 27, n. 2, pp. 1-45, 2023.
- Leogrande, A. Costantiello e L. Laureti, «k-Means Clusterization and Machine Learning Prediction of European Most Cited Scientific Publications,» University Library of Munich, Germany, 2022.
- L. Laureti, A. Costantiello, M. Matarrese e A. Leogrande, «Foreign Doctorate Students in Europe,» SSRN, n. 4032975, 2022.
- Leogrande, A. Costantiello, L. Laureti e D. Leogrande, «The Determinants of Design Applications in Europe,» University Library of Munich, Germany, n. 110836, 2021.
- KARAHAN, «THE ROLE OF RESEARCH AND DEVELOPMENT EXPENDITURES ON HIGH TECHNOLOGY PRODUCT EXPORTS IN OECD COUNTRIES,» 2020.
- Sözen, I.; Tufaner, M.B. THE RELATIONSHIP BETWEEN R&D EXPENDITURES AND INNOVATIVE DEVELOPMENT: A PANEL DATA ANALYSIS FOR SELECTED OECD COUNTRIES. M.U. Iktis. ve Idari Bilim. Derg. 2019, 41, 493–502. [Google Scholar] [CrossRef]
- Leogrande, A.; Costantiello, A.; Laureti, L. The Export of Medium and High-Tech Products Manufactured in Europe. J. Appl. Econ. Sci. (JAES) 2022, 181. [Google Scholar] [CrossRef]
- Leogrande, A. Costantiello e L. Laureti, «The Exports of Knowledge Intensive Services. A Complex Metric Approach,» University Library of Munich, Germany, 2022.
- Meral, Y. High technology export and high technology export impact on growth. Int. J. Bus. Ecosyst. Strat. (2687-2293) 2019, 1, 32–38. [Google Scholar] [CrossRef]
- Teplova, T.; Sokolova, T.; Gubareva, M.; Sukhikh, V. The Multifaceted Sustainable Development and Export Intensity of Emerging Market Firms under Financial Constraints: The Role of ESG and Innovative Activity. Complexity 2022, 2022, 1–20. [Google Scholar] [CrossRef]
- R. Jacob e P. P. Arcot, «Patents and ESG Compliance in Startups,» 2023.
- Khalil, R.; Khalil, M.K. Environmental, social and governance (ESG) - augmented investments in innovation and firms' value: a fixed-effects panel regression of Asian economies. China Finance Rev. Int. [CrossRef]
- Lutfiani, A.P.; Hidayah, R. ESG Performance and Ownership Structure on Cost of Capital and Research & Development Investment. Fokus Bisnis : Media Pengkaj. Manaj. dan Akunt. 2022, 21, 25–42. [Google Scholar] [CrossRef]
- D. Coluccia, M. Dabić, M. Del Giudice, S. Fontana e S. Solimene, «R&D innovation indicator and its effects on the market. An empirical assessment from a financial perspective,» Journal of Business Research, 2019.
- Shaikh, I. ENVIRONMENTAL, SOCIAL, AND GOVERNANCE (ESG) PRACTICE AND FIRM PERFORMANCE: AN INTERNATIONAL EVIDENCE. J. Bus. Econ. Manag. 2022, 23, 218–237. [Google Scholar] [CrossRef]
- Adedoyin, F.F.; Alola, A.A.; Bekun, F.V. An assessment of environmental sustainability corridor: The role of economic expansion and research and development in EU countries. Sci. Total. Environ. 2020, 713, 136726. [Google Scholar] [CrossRef] [PubMed]
- Ullah, M. Rafiq e U. U. Safi, «Research & Development Expenditures and Climate Change Impact on Maize Productivity: A Case Study of Pakistan, China and India.,» Journal of Educational Research and Social Sciences Review (JERSSR), vol. 2, n. 2, pp. 76-82, 2022.
- Dutt, P.; Ferraro, S.; Chochia, A.; Muljar, R. Using Patent Development, Education Policy and Research and Development Expenditure Policy to Understand Differences between Countries: The Case of Estonia and Finland. Balt. J. Eur. Stud. 2018, 8, 123–153. [Google Scholar] [CrossRef]
- P. K. Dutt, M. Wahl e T. Kerikmae, «Using patent development, education policy and research and development expenditure policy to understand differences between countries–the case of estonia and Germany,» International and Comparative Law Review, 2019.
- Leogrande, A. Massaro e A. M. Galiano, «The Determinants of Innovation in European Countries in the period 2010-2019,» American Journal of Humanities and Social Sciences Research (AJHSSR), vol. 4, n. 8, pp. 91-126, 2020.
- Leogrande, A. Costantiello e L. Laureti, «The Impact of New Doctorate Graduates on Innovation Systems in Europe,» University Library of Munich, Germany., n. 114452, 2022.
- Costantiello, L. Laureti e A. Leogrande, «The Determinants of Lifelong Learning in Europe,» University Library of Munich, Germany, 2022.
- Leogrande, A. Costantiello, L. Laureti e M. Matarrese, «International Scientific Co-Publications in Europe,» SSRN, n. 4117970, 2022.
- Leogrande e, A. Costantiello, «Human Resources in Europe. Estimation, Clusterization, Machine Learning and Prediction,» University Library of Munich, Germany., n. 109749, 2021.
- L. Laureti, A. Costantiello e A. Leogrande, «The finance-innovation nexus in Europe,» IJISET-International Journal of Innovative Science, Engineering & Technology, vol. 7, n. 12, 2020.
- F. C. Anidebe, P. C. Umenzekwe e C. U. Uchegbu, «RESEARCH AND DEVELOPMENT EXPENDITURES AND FIRM VALUE OF SELECTED INDUSTRIAL GOODS COMPANIES IN NIGERIA,» Journal of Contemporary Issues in Accounting, vol. 2, n. 1, pp. 129-140, 2021.
|
Disclaimer/Publisher’s Note: The statements, opinions and data contained in all publications are solely those of the individual author(s) and contributor(s) and not of MDPI and/or the editor(s). MDPI and/or the editor(s) disclaim responsibility for any injury to people or property resulting from any ideas, methods, instructions or products referred to in the content. |
© 2023 by the authors. Licensee MDPI, Basel, Switzerland. This article is an open access article distributed under the terms and conditions of the Creative Commons Attribution (CC BY) license (http://creativecommons.org/licenses/by/4.0/).
