Preprint
Article

Discovery of New 2-Phenylamino-3-Acyl-1,4-Naphthoquinones as Inhibitors of Cancer Cells Proliferation. Searching for Intra-cellular Targets Playing a Role in Cancer Cells Survival

Altmetrics

Downloads

180

Views

47

Comments

0

Submitted:

11 April 2023

Posted:

12 April 2023

You are already at the latest version

Alerts
Abstract
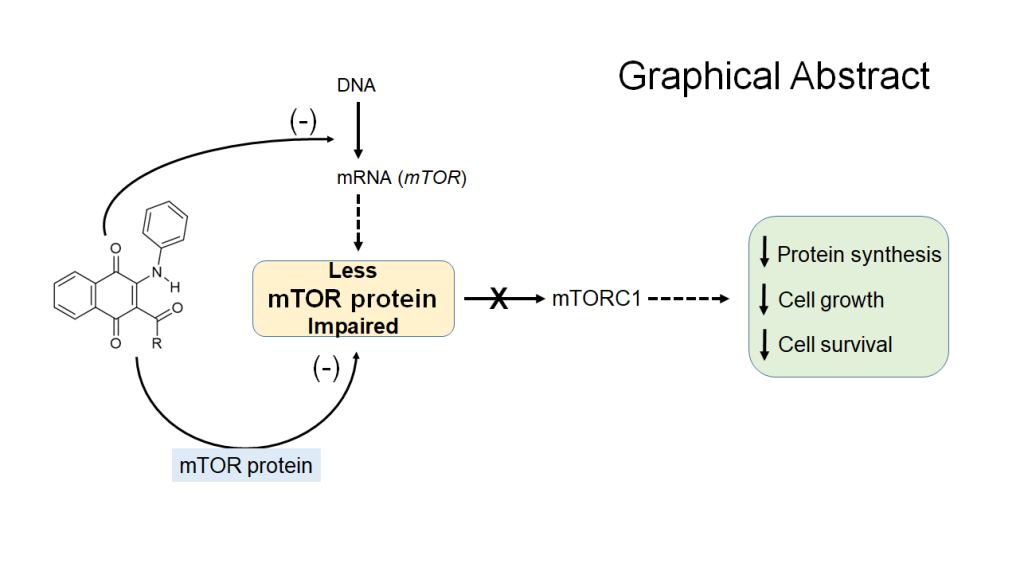
A series of 2-phenylamino-3-acyl-1,4-naphtoquinones were evaluated regarding their in vitro antiproliferative activities using DU-145, MCF-7 and T24 cancer cells. Such activities were discussed in terms of molecular descriptors like half-wave potentials, hydrophobicity and molar refractivity. Compounds 4 and 11 display the highest antiproliferative activity against the three cancer cells, therefore, they were subject to further studies. The in silico prediction of drug likeness, using pkCSM and SwissADME explorer online, shows that compound 11 is a suitable lead molecule to be developed. Furthermore, the expression of some key genes was studied in DU-145 cancer cells. They include genes involved in apoptosis (Bcl-2), tumor metabolism regulation (mTOR), redox homeostasis (GSR), cell cycle regulation (CDC25A), cell cycle progression (TP53), epigenetic (HDAC4), cell-cell communication (CCN2) and inflammatory pathways (TNF). Compound 11 displays an interesting profile because among these genes, mTOR was significantly less expressed as compared to control conditions. Molecular docking show that compound 11 has good affinity with mTOR, unraveling a potential inhibitory effect on this protein. Due to the key role of mTOR on tumor metabolism, we suggest that impaired DU-145 cells proliferation by compound 11 is caused by a reduced mTOR expression (less mTOR protein) and inhibitory activity on mTOR protein.
Keywords: 
Subject: Biology and Life Sciences  -   Toxicology

1. Introduction

Quinones are ubiquitous in nature and their scaffold are present in many drugs such as anthracyclines, daunorubicin, doxorubicin, mitomycin, mitoxantrones and saintopin (Figure 1), some of them used clinically in the therapy of solid cancers. The cytotoxic effects of these quinones are mainly due to the inhibition of DNA topoisomerase-II [1]. The most important and widely distributed chemical class in the quinone family is the 1,4-naphthoquinones. Their biological activities, particularly against cancer cells, has stimulated enormous research on the development of novel antitumor agents based on the 1,4-naphthoquinone array [2,3,4,5].
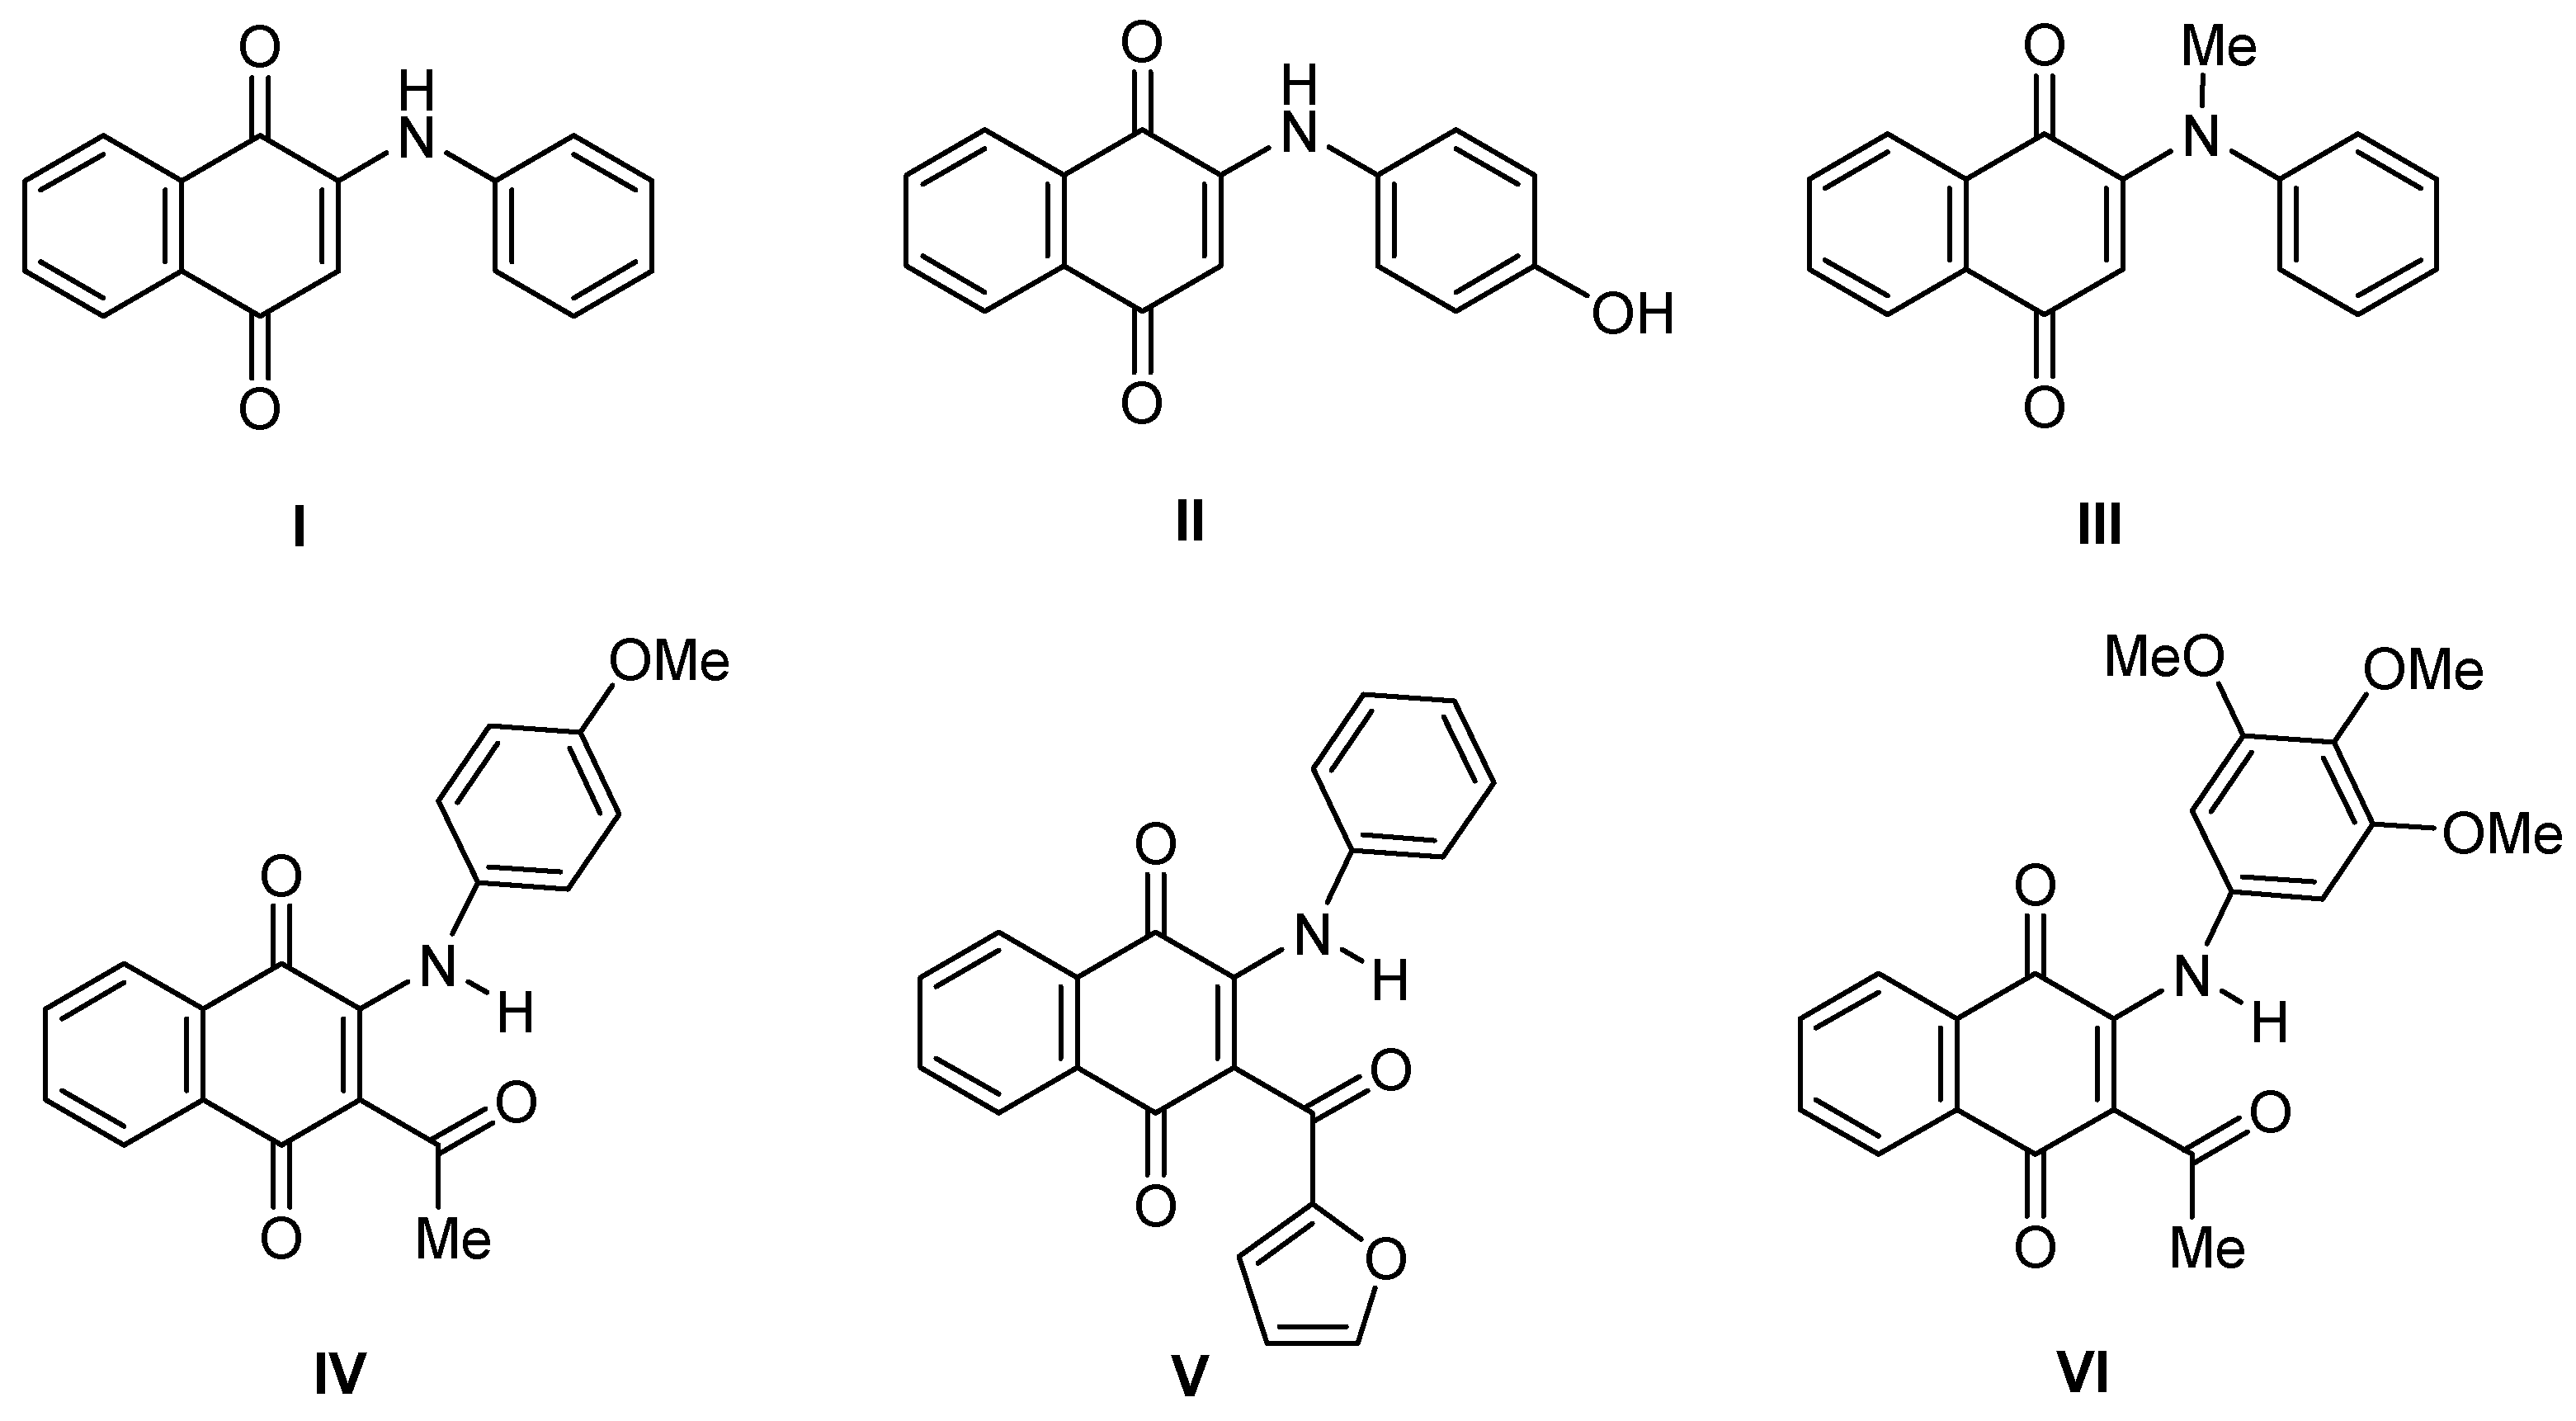
Among the diverse reported synthetic 1,4-naphthoquinone-contained analogues, the 2-phenylamino-1,4-naphthoquinone I and their phenylamino-substituted derivatives, as compounds II and III (Figure 2), have been the subject of study because of their anticancer properties [6,7]. The synthetic flexibility towards 2-arylamino-1,4-naphthoquinones as well as the redox capability of the 1,4-naphthoquinone scaffold, determined by the magnitude of the donor effect of the arylamino substituents, have contributed, in part, to get proofs on the probable biological mechanism and targets involved in the anticancer effects. It is worth to note that according to biological evidences on the mechanisms and target of action of quinoid antitumor agents, they participate in the cell redox cycle and act as a precursor of ROS, which leads to oxidative stress [8].
We have previously shown the antiproliferative properties of a class of analogues of 2-arylaminonaphthoquinones: Containing an electron-acceptor acyl substituent located at the 3-position of the quinone scaffold, named 2-arylamino-3-acyl-1,4-naphthoquinone [9,10]. The screening of the members of the series, such as compound IV-VI (Figure 2), express in vitro antiproliferative activity against non-tumor fibroblasts and a panel of a variety of cancer cell lines [9]. Additional studies with a number of 2-arylamino-3-acyl-1,4-naphthoquinones in the MCF-7 human breast cancer cell line and in male Ehrlich tumor-bearing Balb/c mice, demonstrated that compound V displays a high cytotoxicity against MCF-7 with IC50 values of 1.5 μM [10].
On the other hand, cancer cells display much higher reactive oxygen radicals (ROS) levels than normal cells due to dysfunctional mitochondria, oncogene activation and antioxidant imbalance [11,12]. For instance, ROS inactivate PTEN, facilitating PI3K, Akt/mTOR signaling, which ultimately leads to tumor progression [13]. Two decades ago, Vafa et al. [14] reported that increased ROS levels activate c-Myc in a HIF1-α dependent way, resulting in tumor proliferation and DNA damage. Since then, several studies led to the conclusion that loss of redox homeostasis, likely due to molecular interactions of ROS molecules with specific targets in redox signaling pathways, is a hallmark of cancer cells [12,15,16,17]. In agreement with other research groups, we support the hypothesis that a pro-oxidant treatment contributes, in a substantive way, to the elimination of cancer cells, via the induction of an oxidative stress leading to different manners of cell demise [18,19,20,21,22]. In this context, we have synthesized several quinone compounds and their biological activities have been assessed on a variety of human cancer cells [23,24,25,26,27,28,29].
The aim of the work was to investigate whether the in vitro cytotoxicity of a novel designed series of 2-phenylamino-3-acyl-1,4-napththoquinones may be associated with an altered expression of some representative genes of major cellular pathways playing a role in carcinogenesis and cancer cells survival. These pathways include apoptosis, redox homeostasis, tumor metabolism regulation, cell cycle, epigenetic, cell-cell crosstalk and inflammation. The antiproliferative activities were also examined in terms of molecular descriptors (half-wave potentials, hydrophobicity and molar refractivity) as well as using pharmacokinetic, druglikeness, gene expression and molecular docking studies. Altogether, of the collected data allows us to analyze the influence of stereo-electronic factors involved in biological mechanisms subtending the potential antiproliferative activity of the members of the new 2-phenylamino-3-acyl-1,4-naphthoquinones series.

2. Results and Discussion

The structure of compounds 114 were designed to evaluate how their antiproliferative activities is influenced by stereoelectronic effects of diverse electron-withdrawing acyl groups located at the 3-position of the 2-phenylamino-1,4-naphthoquinone core. To this end, compounds were tested against three human cell lines and the results are summarized in Table 2. The biological assays included the non-tumorigenic HEK-293 (embryonic kidney cells), and three human-derived cancer cell lines, namely prostate (DU-145), breast (MCF-7), and bladder (T24). The antiproliferative activity of quinones was evaluated through their IC50 values, expressed in µM. Doxorubicin, a well-known anticancer drug, was included as reference compound.
Since the selection of electron-withdrawing acyl groups (R-C=O) in the synthesized compounds was made to cover significant stereoelectronic structural differences among the members of the series, the structure-activity relationships were examined regarding of the structural features of the ligands, as follows: alkyl (compounds 13); b) phenyl (compounds 410) and heteroaryl (compounds 1114).
In addition, three standard molecular descriptors commonly used in structure-activity relationships of cytotoxic 1,4-naphthoquinones [1,2,3,4,30,31] were evaluated: half-wave potential (EI½, expressed in mV), hydrophobicity (ClogP) and steric effect as molar refractivity (CMR, expressed in cm3/mol). These parameters are key in order to delineate a large number of receptor-ligand interactions that are critical to biological processes [1]. To this end, the mentioned physicochemical descriptors were acquired to get qualitative information on their putative correlation with the observed antiproliferative activities of the 2-phenylamino-3-acyl-1,4-naphthoquinone 114 (Table 3).
According to the data in Table 2 and Table 3, compounds 13, having the alkyl-C=O ligands, show weak cytotoxic activity for 1 (IC50: 60.89 to 86.69 μM) while 2 and 3 were almost devoid of activity. Among these members, the most active compound 1 exhibited the lower values of lipophilicity (Clog P = 2.72) and molar refractivity (CMR= 9.96). In the case of the aryl-C=O and heteroaryl-C=O ligands, interesting antiproliferative activities in the IC50 range: 0.82 to 21.66 μM, were show for their members. Inspection of structural features vs antiproliferative activities of the members of the aryl-C=O group (410), led us to conclude that the most active compounds 4, among the aryl-C=O ligands, and compound 11 among the heteroaryl-C=O ligands, exhibited the lower CMR values (10.15 and 9.36 respectively).
Comparison of the ClogP vs IC50 values of the members of aryl-C=O ligand reveals that lipophilicity does not influence the cytotoxic activity of their members 410. Similarly, considering the ClogP vs IC50 values of the members of heteroaryl-C=O ligands, in particular for 11 (ClogP = 1.24), the more active member of this group against the less active member 14 (ClogP = 1.17), led us to conclude that lipophilicity does not capture the variability of the biological activity.
Inspection of the half-wave potentials of the members 114 of the series, located in the range −800 to −596 mV, reveals significant stereoelectronic effects for the members of the aryl- and heteroaryl-CO ligands 414. Compounds 4 and 11 appear as the most active members of these groups, showing one-electron reduction capability in terms of their half-wave potentials at −695 mV and −578 mV, respectively.
It is worth to note that the most bioactive members of the alkyl, aryl and heteroaryl-CO groups of the series exhibited the lower CMR values (9.96, 10.15 and 9.36). Based on above results we can assume that molar refractivity could be a valuable parameter for the design of new members of the series endowed with cytotoxic activity.
Considering the mean selective index displayed by 4 (MSI: 6.2) and 8 (MSI: 4.7), the former one was selected to be included in further gene expression and molecular docking studies. Regarding members of the group having the heteroaryl-C=O ligands, it is evident that due to structural analogies of the O,N,S-heterocycles involved into their structures, no significant differences among the CMR parameter were observed. Nevertheless, among this group, bioisosters 11/12 exhibited higher activity than the pair 13/14, likely due to redox capability of 11/12 pair having less negative potential (−578 and −552 mV) than the 13/14 pair (−635 and −685 mV).
Complementary studies to those resulting from the SAR analysis were conducted to obtain some insights regarding the molecular mechanism involved in the in vitro antiproliferative evaluation of bioactive quinones. Compound 11 displaying good antiproliferative activity, high hydrophilic character and low activity against healthy non-tumorigenic HEK-293 cells was selected, among all the tested compounds 114, as a promising potential anti-cancer molecule. Therefore, compound 11, along its carbocyclic analogue 4, were included in the next studies (Representative dose-response curves for compounds 4 and 11 are reported in the Supplementary Material, see Figures S2 and S3). First, we investigated their physicochemical, pharmacokinetic, and druglikeness properties. Second, we focused on gene expression and molecular docking studies.
Drug development involves assessment for physicochemical properties, pharmacokinetics, drug-likeness and medicinal chemistry friendliness; in that context, computer models constitute valid alternatives to experiments. Both pkCSM and SwissADME explorer online were used for in silico prediction of drug likeness of the synthesized compounds 4 and 11 based on various molecular descriptors and the results are depicted in Table 4.
The results obtained from ADMET analysis and depicted in Table 4, revealed that the structures 4 and 11 had a molecular weight less than 500 g/mol, which is important for penetrability [32]. Both molecules show Caco-2 permeability values less 1.00 and high intestinal absorption (94.3%) as well, predicting that they would be absorbed in the small intestine [33]. The transdermal efficacy as illustrated by skin permeability of compounds 4 and 11 was from −2.774 and −2.798 cm/hour, which mean that they will penetrate the skin properly. Note that molecules will penetrate the skin with difficulties if the logKp value is greater than −2.5 cm/hour [34]. The circulation in blood plasma (VDss) came out to be acceptable for compounds with values higher than -0.15. Penetration via blood-brain barrier (BBB) is an important parameter for reducing side effects and toxicity. To note that compounds 4 and 11 have log BB < 0.3 would sufficiently be able to penetrate the brain [35]. None of the compounds appeared to be CYP2D6 inhibitor, but they inhibited CYP3A4, a potential interference with CYP450 biotransformation reactions. Excretion parameters are illustrated as total clearance. They showed that compounds have positive values indicating a rapid excretion. In addition, the adverse interactions of both compounds with the organic cation transport 2 (OCT2) showed no potential contraindication. Finally, while both compounds did not violate the Lipinski’s Rule of Five, compound 4, but not compound 11, shows hepatotoxicity. In summary, it seems that both compounds 4 and 11 are druglikeness structures allowing a further drug development but they differ in terms of liver toxicity [36]. The full reports of SwissADME and pkCSM parameters are reported in Supplementary Table S2.
Since neither a particular sensitivity nor a resistance against quinones were observed between the three cell lines utilized for antiproliferative assays, a follow-up study was conducted by using the DU-145 prostate cancer cell line. The selection of these cancer cells was made based on practical in house motives (i.e., best survival levels, growth rapidity, easy manipulation, etc). Afterwards, the effects of compounds 4 and 11 were further explored looking for changes in gene expression levels in DU-145 cells and the mRNA levels were analyzed by RT-PCR and normalized to B2M levels.
Table 5 shows the changes in the expression of different genes after 24 h incubation of DU-145 cells in the absence or presence of compounds 4 and 11. As explained previously, these genes are representative of major pathways involved in carcinogenesis and cancer cell survival. They included genes involved in apoptosis regulation (Bcl-2), in kinases cascades regulating tumor metabolism (mTOR), in redox homeostasis and protection against oxidative stress (GSR), in regulation of cell cycle (CDC25A), in tumor suppression and cell cycle progression (TP53), in epigenetic and transcriptional regulation (HDAC4), in cell-cell communication (CCN2) and in inflammatory pathways (TNF).
In this assay, only compound 11 displays an interesting profile: indeed, two genes were less expressed as compared to control conditions, namely Bcl-2 and mTOR. The former one has an anti-apoptosis function [37,38,39] and its depressed levels may be associated with a less cellular proliferation [40], but the inhibitory effect induced by compound 11 was not statistically significant as compared with control conditions (B2M levels).
Interestingly, the effect of compound 11 on the second one, mTOR, is not only statistically significant but it is biologically relevant. Indeed, mTOR regulates different cellular processes such as cell growth, cell proliferation, cell motility, cell survival, protein synthesis, autophagy, and transcription [41,42]. Furthermore, the activity of mTOR was found to be dysregulated in many types of cancer cells likely caused by mutations in tumor suppressor PTEN gene [43] and an increased activity of PI3K or Akt [44,45,46]. Consequently, the mTOR signaling pathway, which is often activated in tumors, significantly contributes to the initiation and development of cancer cells and it plays an important role in their metabolism [47,48,49]. Therefore, decreased levels in the expression of mTOR gene induced by compound 11 may be correlated with its antiproliferative effect. Such inhibition of mTOR expression (and the prediction of a decreased amount of mTOR protein) is relevant because mTOR signaling pathway is dysregulated by increased activity of PI3K or Akt [48,49], and we have previously reported that a similar family of quinones, synthesized in our laboratory, has an inhibitory effect on Akt [27].
Since mTOR, a master protein regulating cancer cell metabolism and proliferation, may be impaired at two different levels: gene expression and protein activity, and given the observance of a positive correlation between mRNA and protein expression levels, we next explored the potential interactions of quinones with the gene products (proteins) that were analyzed in DU-147 cancer cells.
Molecular docking simulations were performed to study the binding pattern of compounds 4 and 11 in the active sites of mTOR, Bcl-2, GSSG reductase, HDAC4, TNF-α, CDC25A, and B2M proteins as shown in Table 6
According to the results shown in Table 6, we observed that the interaction of compounds 4 and 11 with the selected proteins can be classified into three categories. Firstly, the best interactions are observed with the group formed by TNF-α, GSR, and HDAC4, reaching values of −9.1 to −8.2 kcal.mol-1, with compound 4 presenting a slightly better interaction than compound 11. To note that both quinones did not modify the expression levels corresponding to the genes encoding these proteins (Table 5). Secondly, compounds 4 and 11 have a good affinity for mTOR (−7.7 and −8.0 kcal·mol-1) and Bcl-2 (−8.1 and −7.9 kcal·mol-1), respectively. Therefore, the interaction with these proteins and their putative inhibitory effect may be related to the antiproliferative activity displayed by such quinone derivatives. Thirsty, the interactions are poor for CDC25A and B2M, with a maximum value of −5.9 kcal.mol-1 for compound 11 in CDC25A and a minimum value of −2.3 kcal.mol-1, respectively.
The Kd, LE, and ΔEMW values complement these results. It is possible to notice that in some cases, compound 4 has a better trend than compound 11 and vice versa. This will depend on the environment in which the ligand is found. For example, compound 4 contains a furyl group to promote van der Waals (vdW) interactions such as π-stacking. In addition, the oxygen atom allows the formation of hydrogen bonds hand compound 11, which contains aromatic rings, which will prioritize vdW interactions.
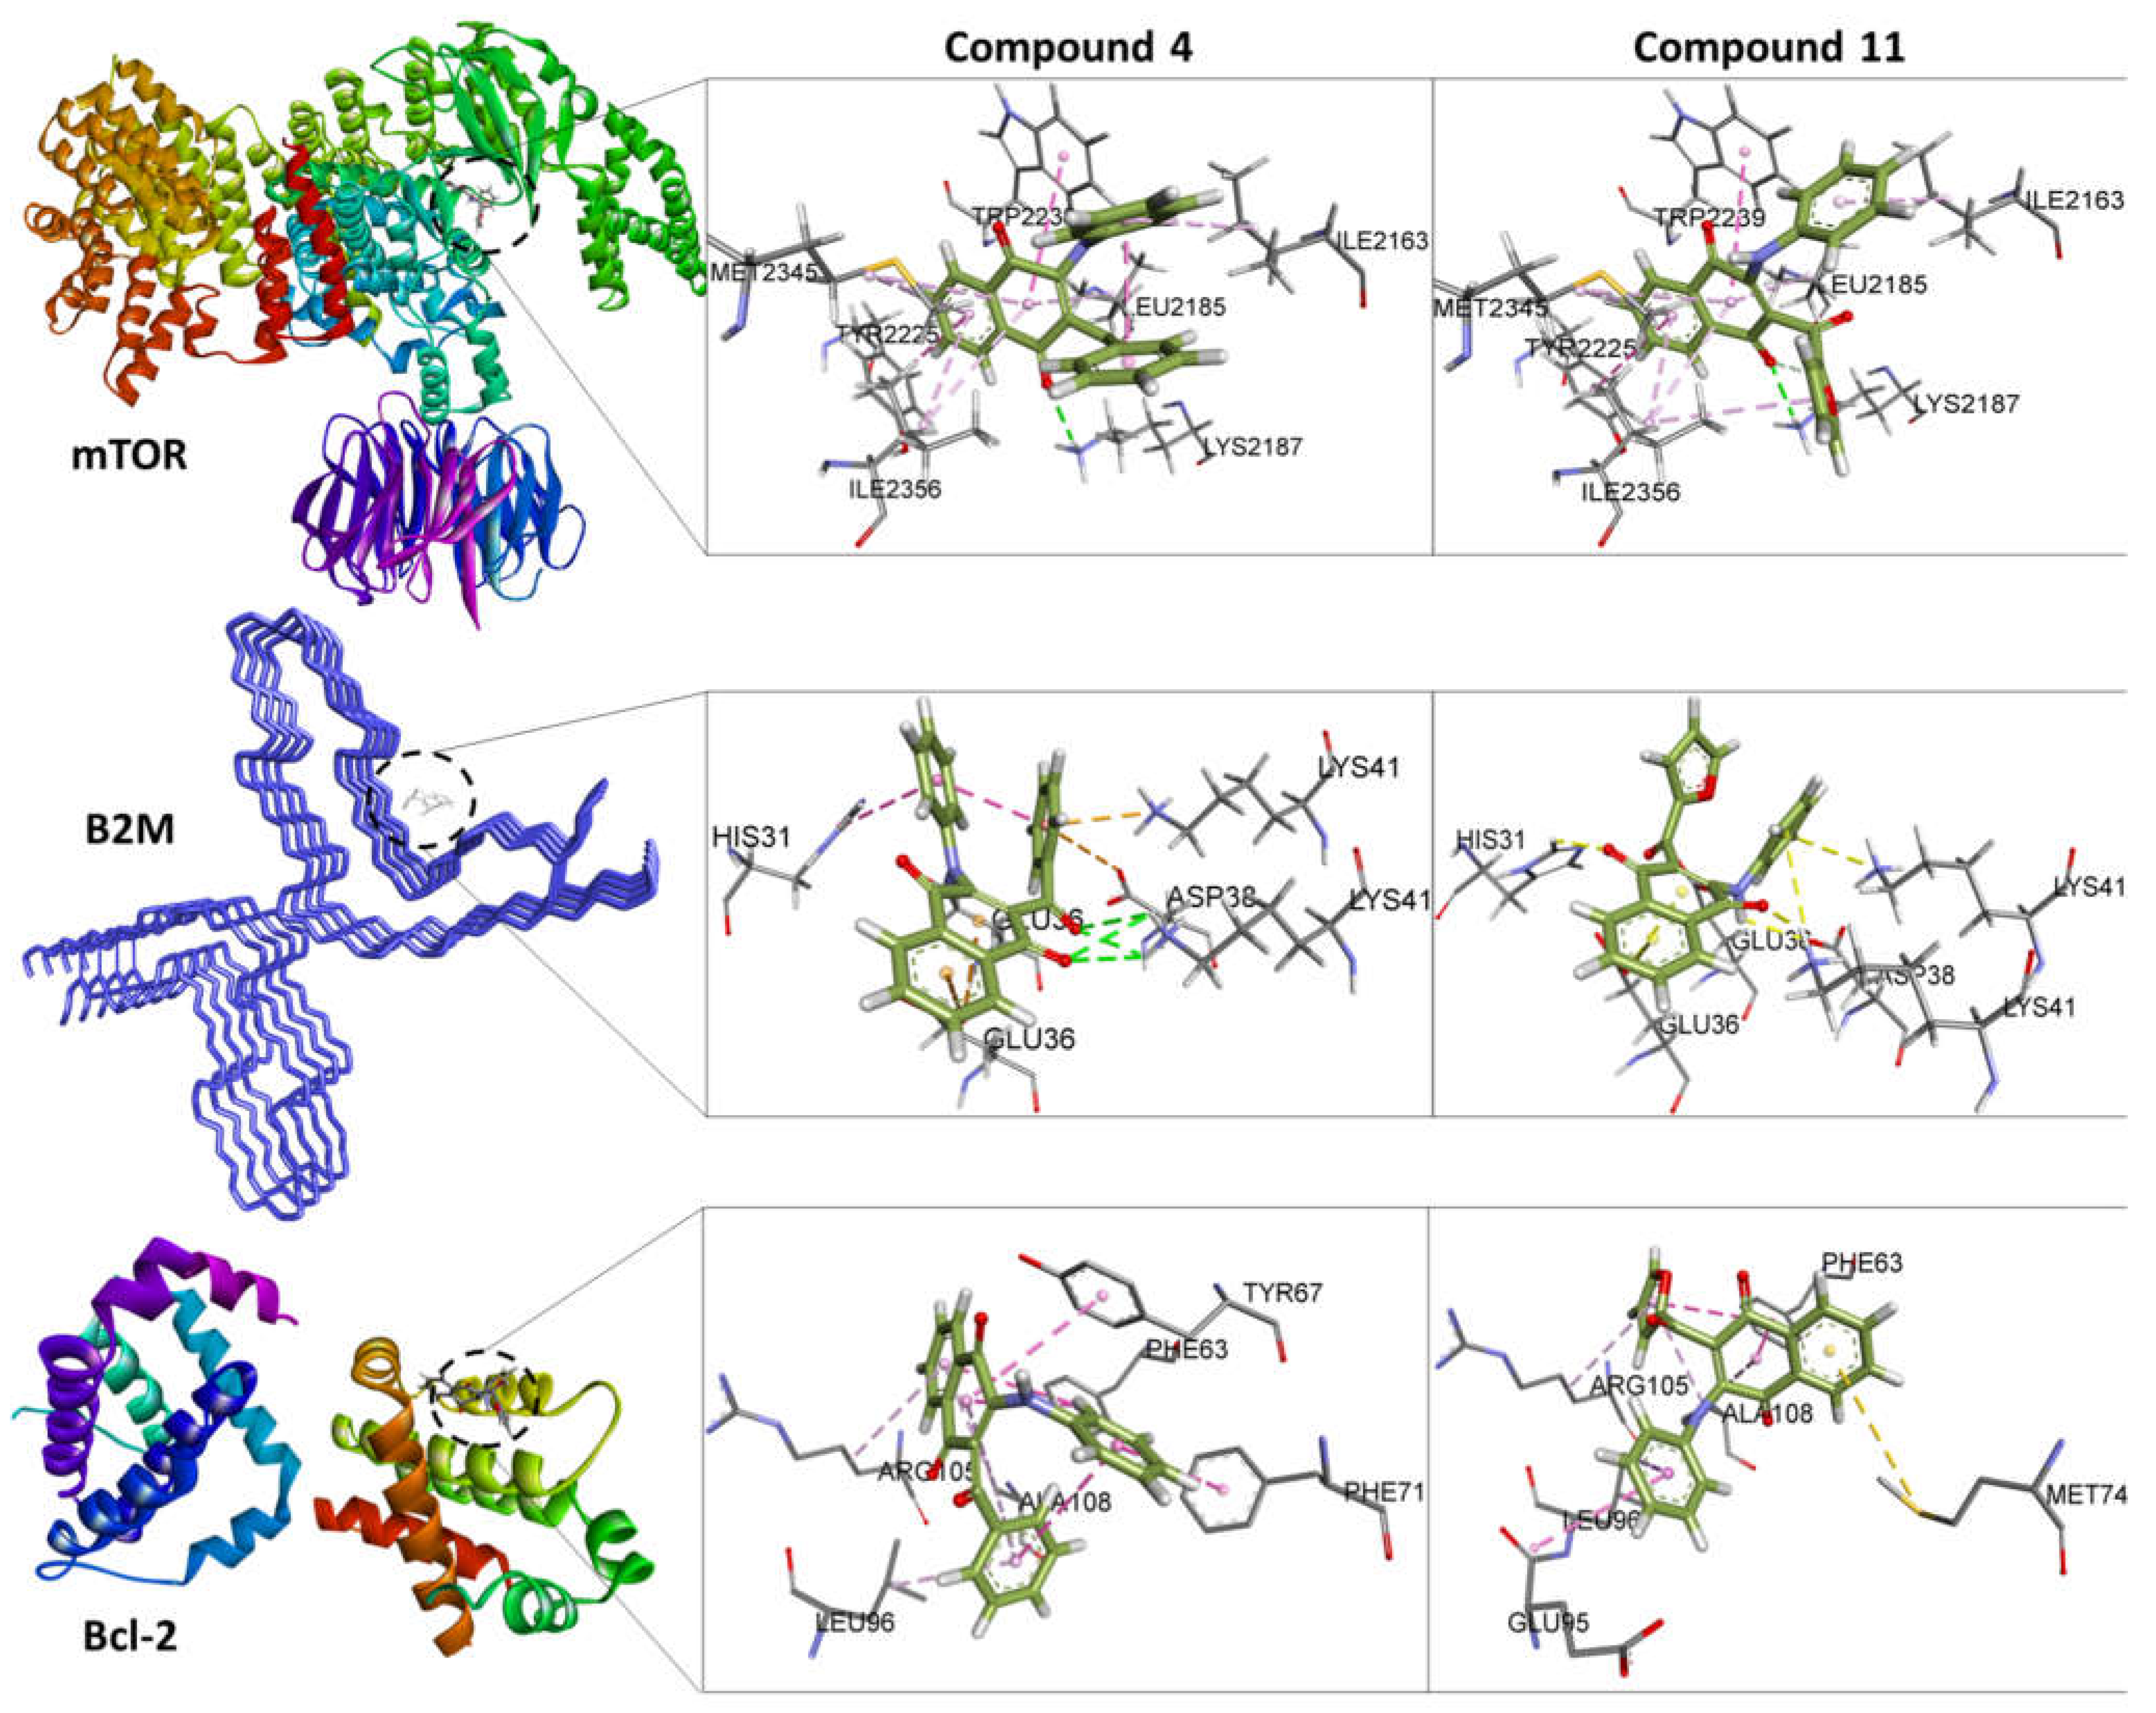
Figure 3 shows the interactions of compounds 4 and 11 with the amino acids corresponding to the mTOR, Bcl-2 and B2M proteins. It can be clearly observed that the interactions with the amino acids are not only due to the aromatic substituents, but also to the quinone rings, which are very reactive, thus allowing the formation of hydrogen bridges and π–π interactions. For complexes with lower affinity, interactions are weaker, and they are predominantly of the vdW type.
According to these data, compound 11 has similar interactions than compound 4 with regard to mTOR protein. Interestingly, both compounds interact with most of the amino acids identified as main targets of mTOR inhibitors such as Torin2, PP242 and PI-103 [39].
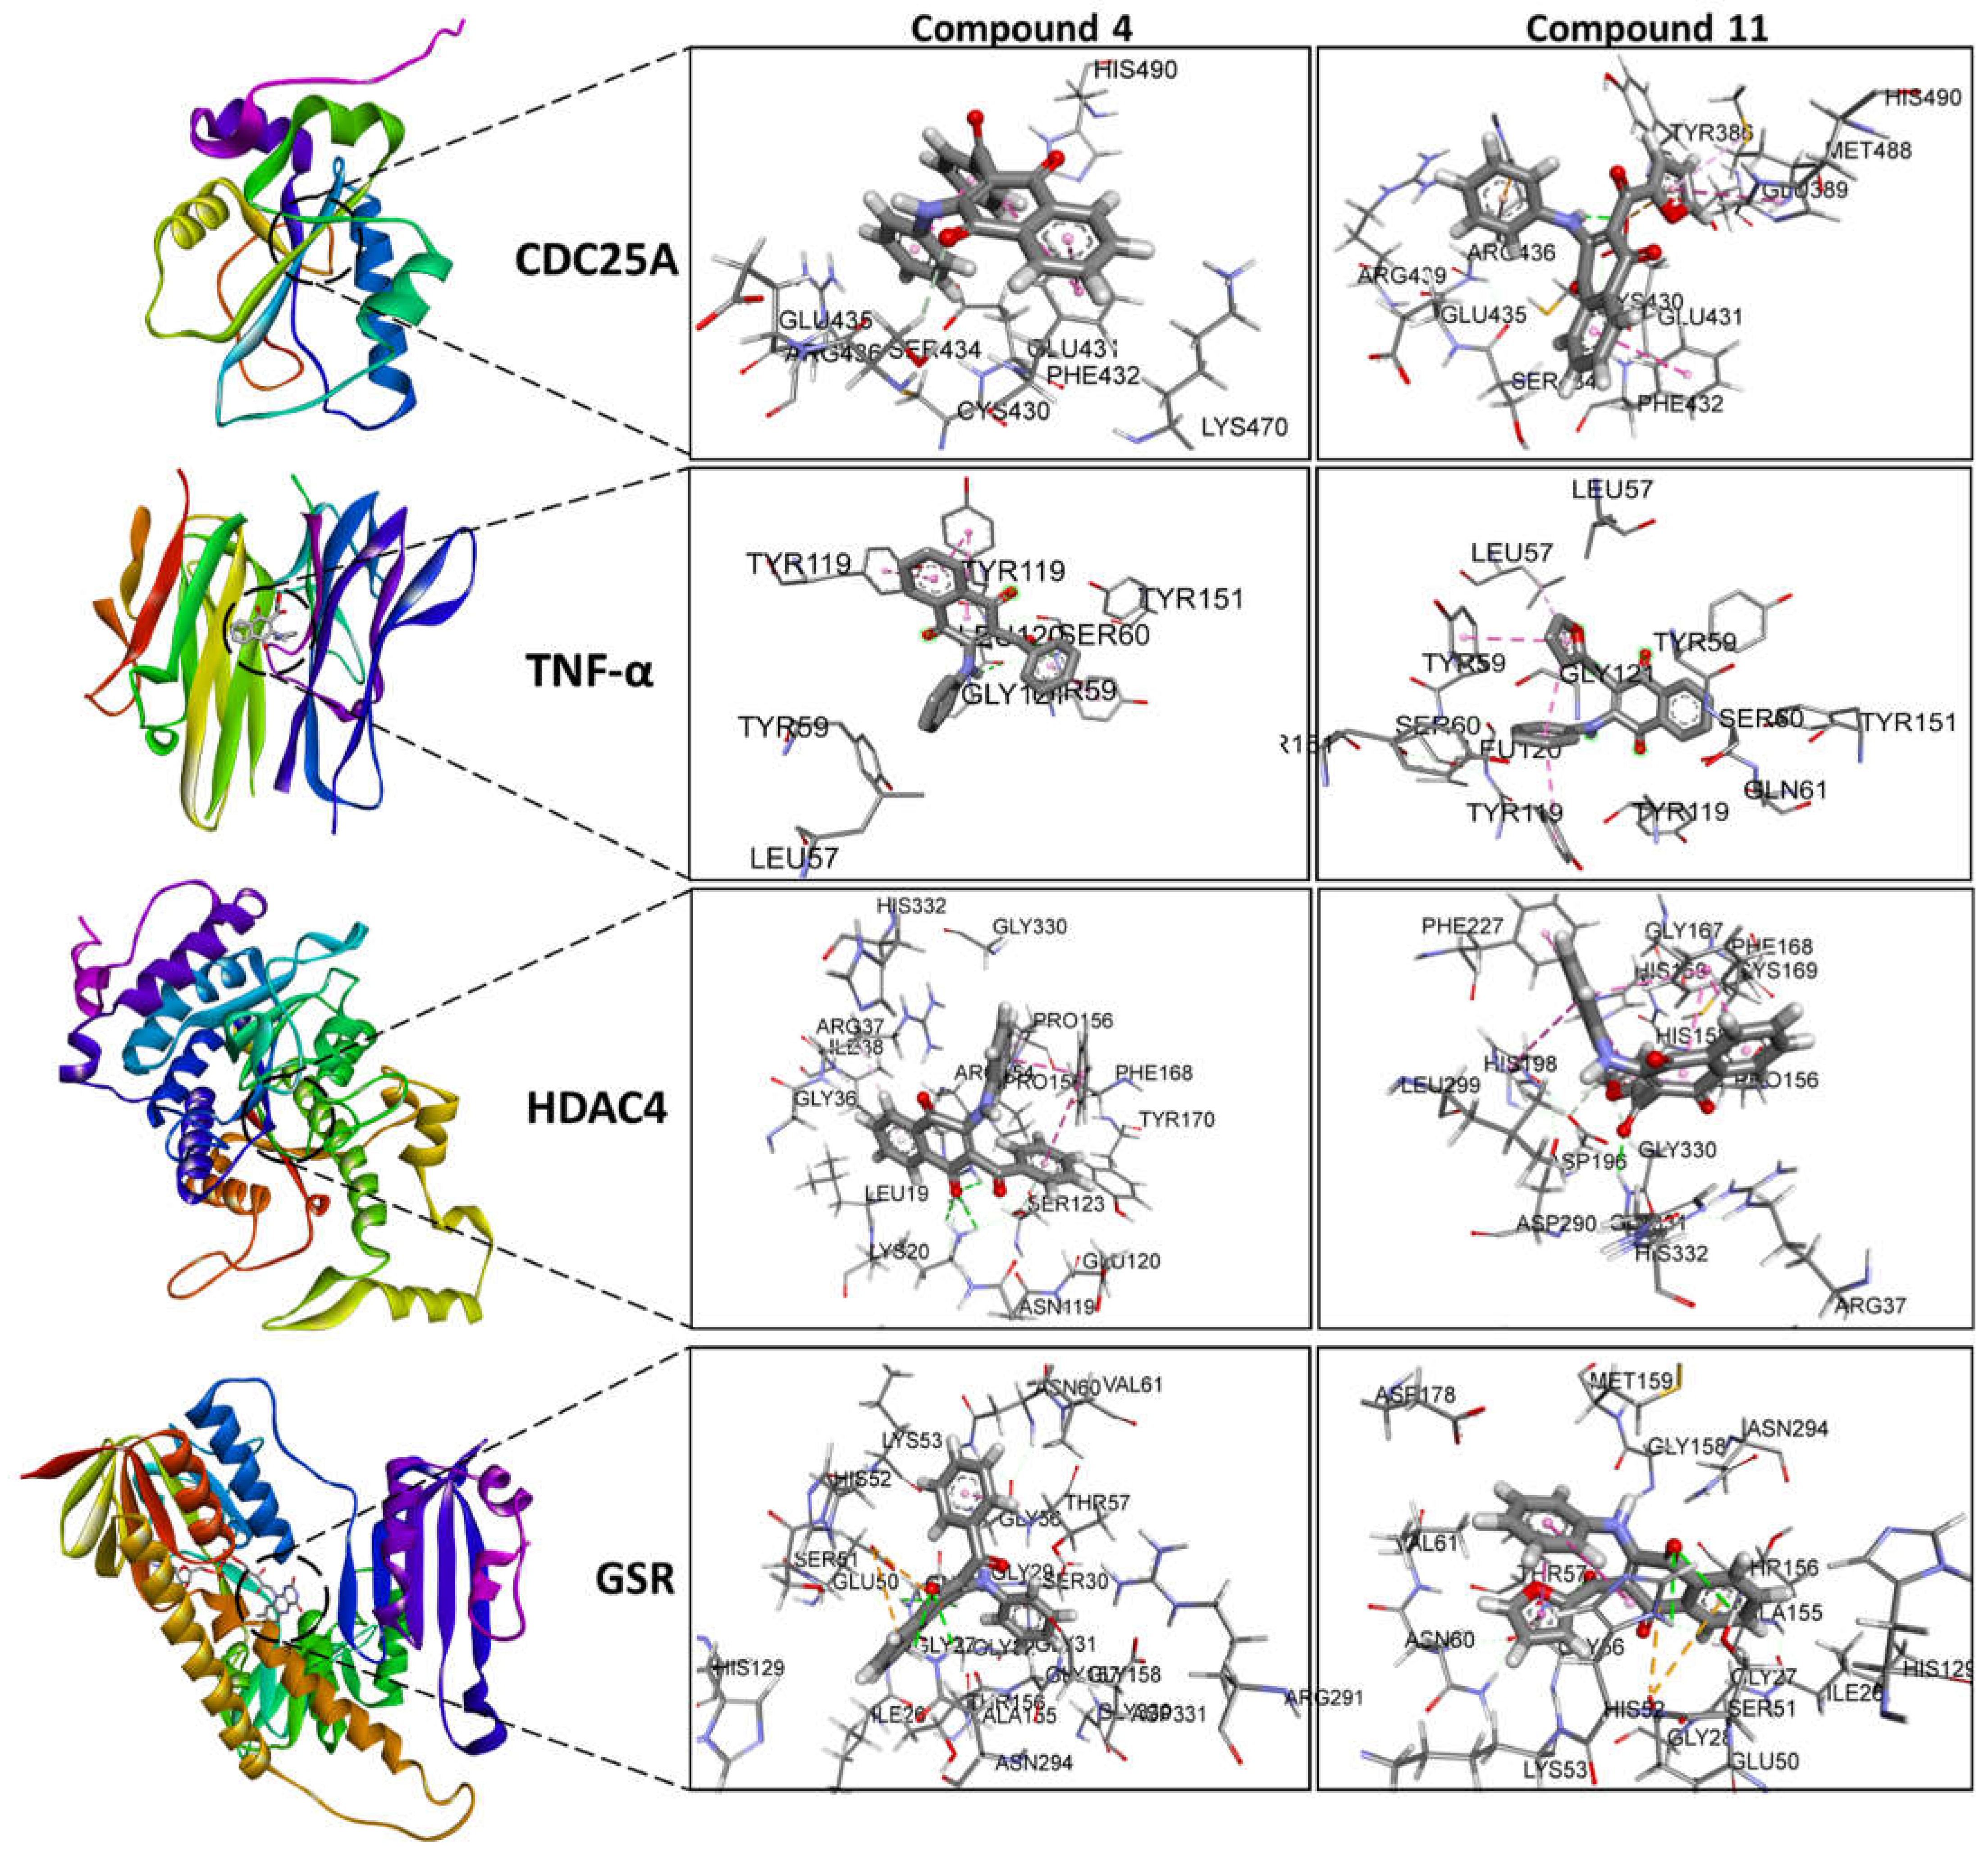
Although compounds 4 and 11 did not modify the expression levels of other genes (Table 5), their effects on CDC25A, TNF-α, HDAC4, and GSR proteins are shown in Figure 4. The contributing interactions with these proteins are the same as previously mentioned for the mTOR, Bcl-2, and B2M proteins.
Altogether, the results show that mTOR appears as a good intracellular target of quinones, explaining, at least in part, their inhibition of cancer cell proliferation. Actually, targeting the mTOR pathway has emerged as a promising therapeutic strategy for cancer treatment. To this end, several approaches have been developed hindering such mTOR contribution to cancer development including mTOR inhibitors [50,51,52,53,54], with however non-conclusive results. Indeed, despite the initial promise of mTOR inhibitors, resistance to these drugs is a major challenge in cancer treatment. In this context, several mechanisms have been proposed to explain resistance to mTOR inhibitors, including activation of compensatory signaling pathways, mutations in mTOR and its downstream effectors, and altered cellular metabolism.
In conclusion, mTOR pathway dysregulation is a common feature of cancer cells, and targeting this pathway holds promise for cancer treatment. Yet, since other pathways may also be involved in the regulation of mTOR, they deserve a deeper assessment. For instance, future studies should focus on whether compound 11 has a putative effect on the Nrf2 system of sensing environmental stress. In fact, a recent study has reported that Nrf2 regulates mTOR transcription [55], therefore, it would be interesting to unveil the molecular link affecting mTOR, a key cellular protein in tumor metabolism.

3. Materials and Methods

3.1. Chemistry

3.1.1. General Information

All the solvents and reagents were purchased from different companies, such as Aldrich (St. Louis, MO, USA) and Merck (Darmstadt, Germany), and were used as supplied. Melting points (mp) were determined on a Stuart Scientific SMP3 (Staffordshire, UK) apparatus and are uncorrected. The IR spectra were recorded on an FT IR Bruker spectrophotometer; model Vector 22 (Bruker, Rheinstetten, Germany), using KBr disks, and the wave numbers are given in cm−1. 1H- and 13C-NMR spectra were recorded on a Bruker Avance-400 instrument (Bruker, Ettlingen, Germany) in CDCl3 or DMSO-d6 at 400 and 100 MHz, respectively. Chemical shifts are expressed in ppm downfield relative to tetramethylsilane, and the coupling constants (J) are reported in Hertz. Data for the 1H-NMR spectra are reported as follows: s = singlet, br s = broad singlet, d = doublet, m = multiplet, and the coupling constants (J) are in Hz. Bi-dimensional NMR techniques and distortion-less enhancement by polarisation transfer (DEPT) were used for the signal assignment. Chemical shifts are expressed in ppm downfield relative to tetramethylsilane, and the coupling constants (J) are reported in Hertz. The HRMS data for all final compounds were obtained using a LTQ-Orbitrap mass spectrometer (Thermo-Fisher Scientific, Waltham, MA, USA) with the analysis performed using an atmospheric-pressure chemical ionization (APCI) source, operated in positive mode. Silica gel Merck 60 (70–230 mesh, from Merck) was used for preparative column chromatography and thin layer chromatography (TLC) aluminum foil 60F254 was used for analytical thin layer chromatography.

3.1.2. Synthesis of 2-phenylamino-3-acyl-1,4-naphtoquinones 1–14

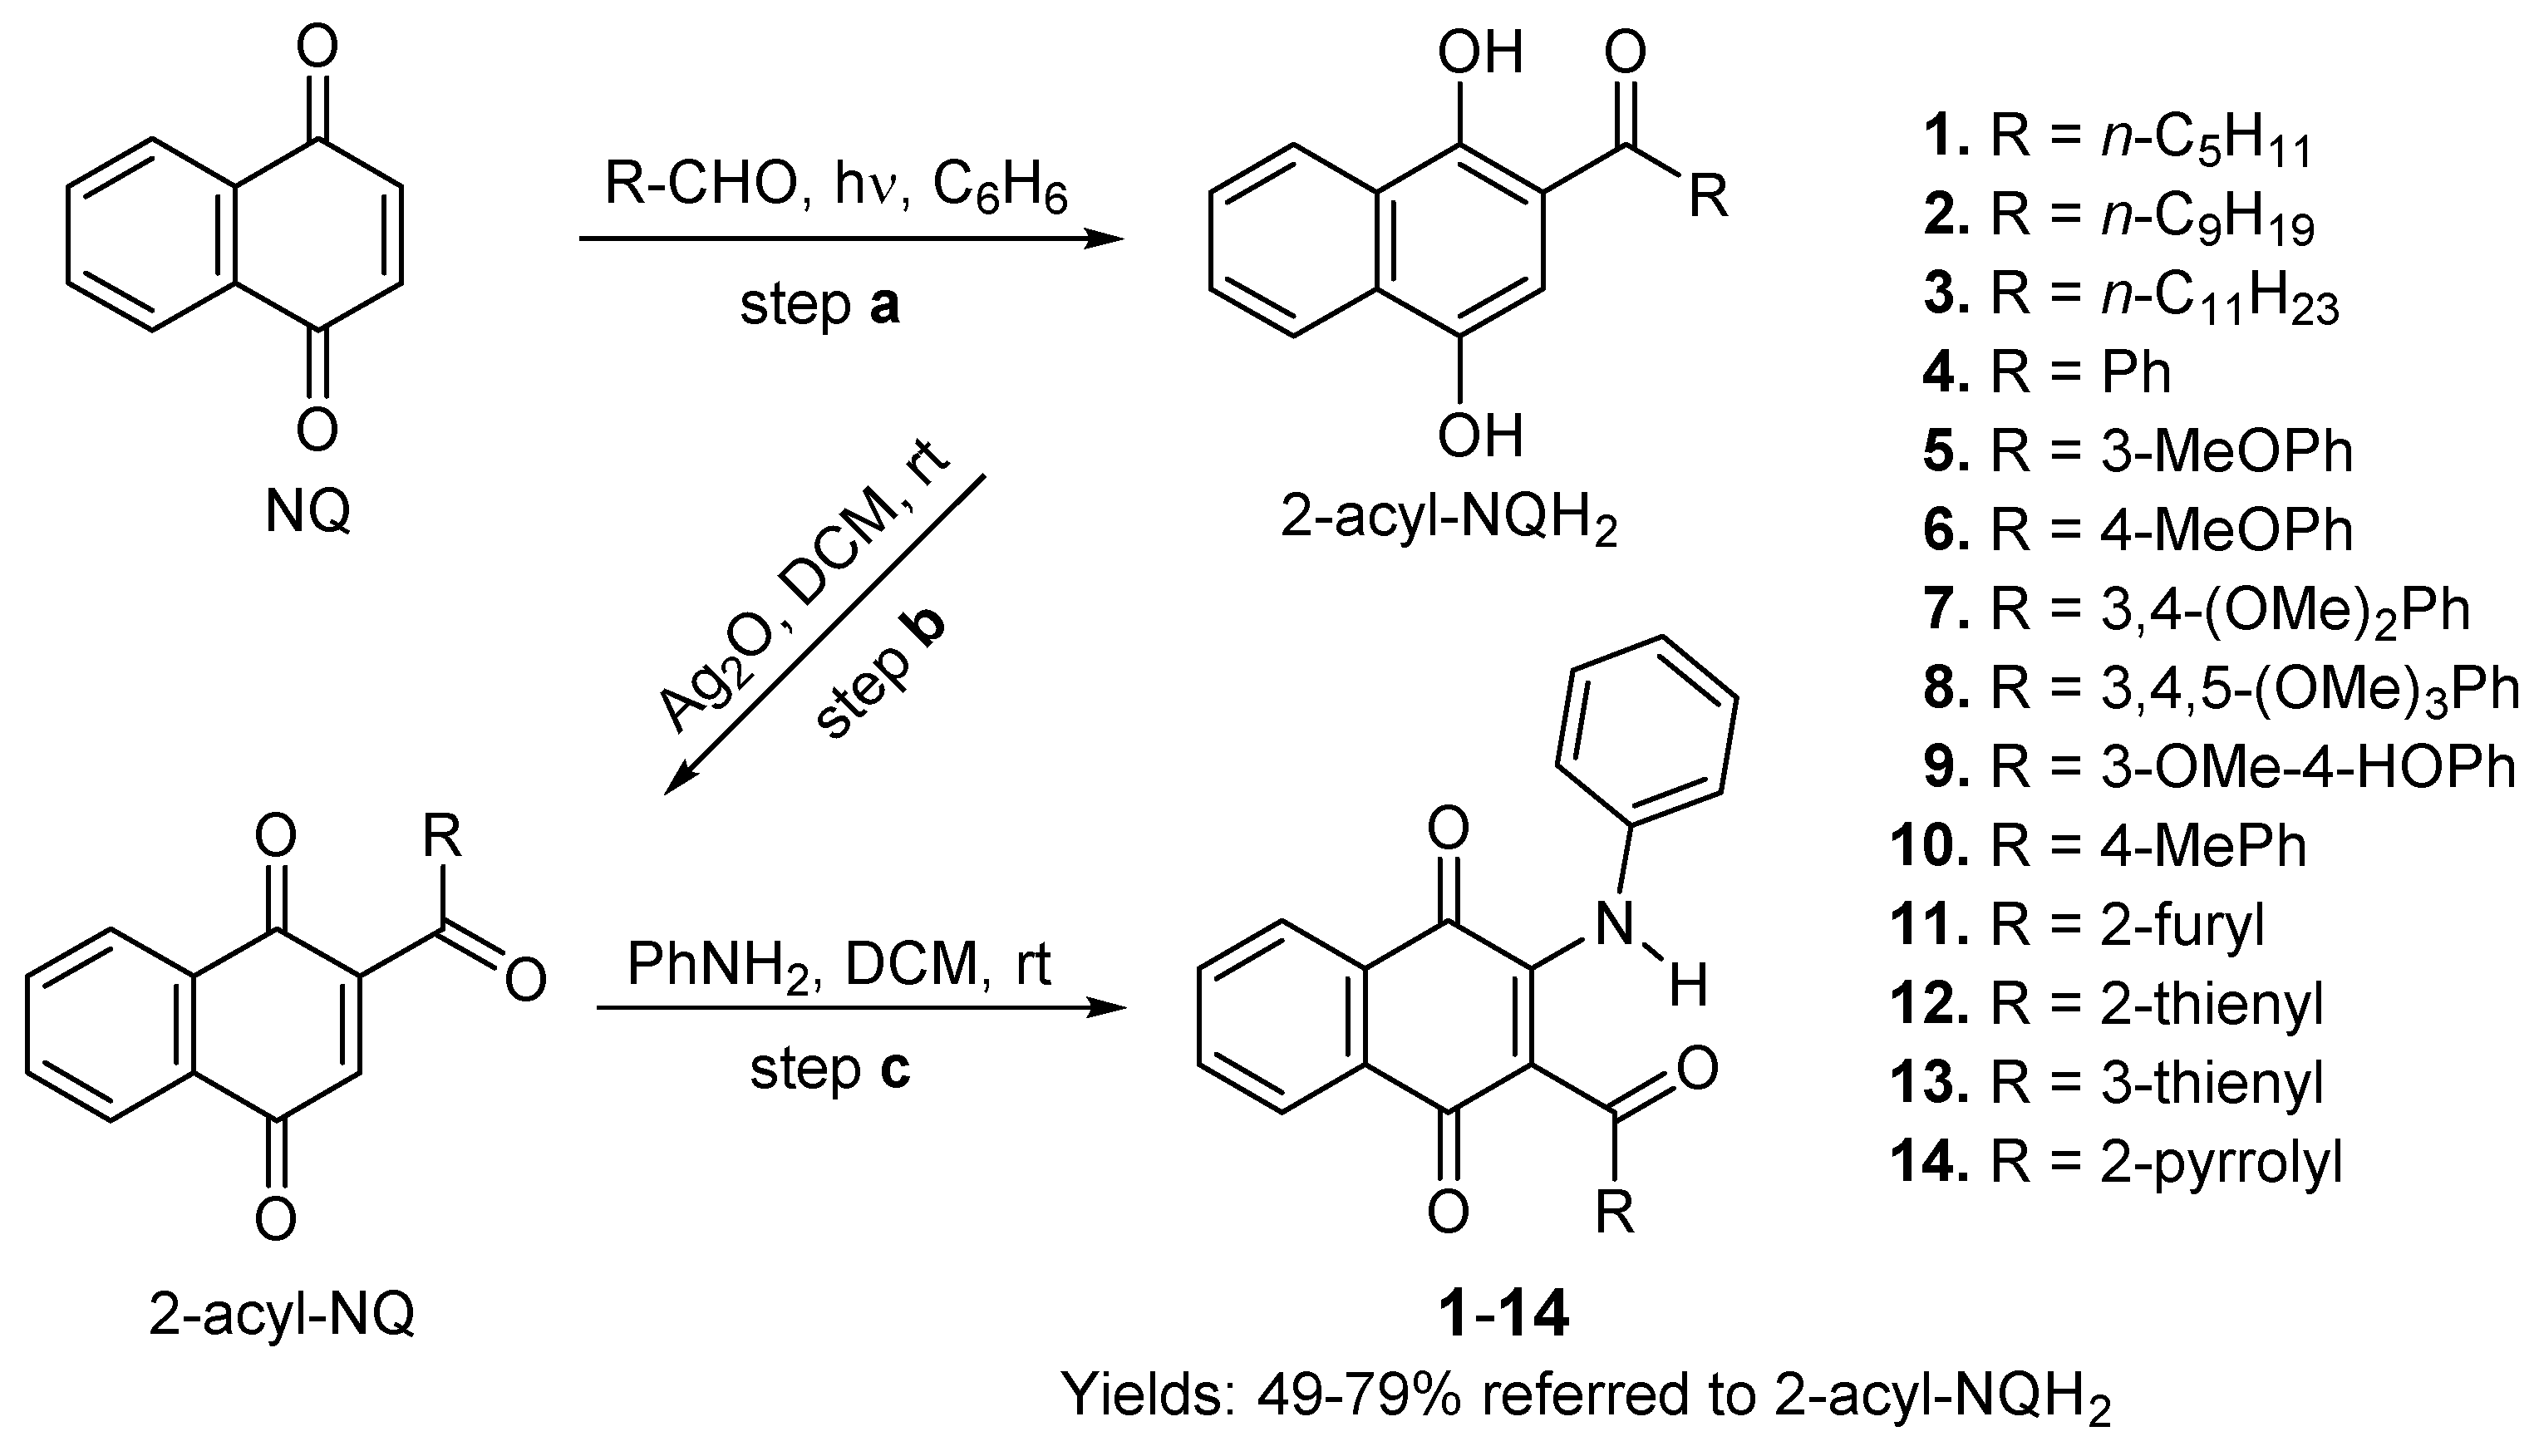
The products required for the cytotoxic evaluation were synthesized according to our previously reported three-step procedure [9,29]. They included a) solar photoacylation Friedel–Crafts reaction of 1,4-naphthoquinone (NQ) with aldehydes [56]; b) oxidation of the resulting acylnaphthohydroquinones (2-acylNQ) with Ag2O to give the 2-phenylamino-1,4-naphtoquinones (AcylNQ), and c) oxidative amination reaction of the products resulting in the previous step, with phenylamine, to produce the respective 2-phenylamino-3-acyl-1,4-naphtoquinones 114 (Scheme 1).
The 2-AcNQH2 resulting in the step a) were synthesized from 1,4-NQ and the following aldehydes: n-pentanal, n-nonanal, n-undecanal, benzaldehyde, 3-methoxybenzaldeyde, 4-methoxybenzaldeyde, 3,4-dimethoxybenzaldehyde, 3,4,5-trimethoxybenzaldehyde, 3-methoxy-4-hydroxybenzaldehyde, 4-methylbenzaldehyde, furan-2-carbaldehyde, thiophen-2-carbaldehyde, thiophen-3-carbaldehyde and pyrrole-2-carbaldehyde.
The structure of the known compounds 11 and 12 were confirmed based on their spectral data [9] and those of the remaining unknown analogues 110, 13 and 14 were established by means of their IR, NMR and HRMS spectroscopy. The spectra of compounds were reported in Supplementary materials (Figure S1).

3.1.3. General Procedure for the preparation of 2-phenylamino-3-acyl-1,4-naphtoquinones 1–10 and 13–14.

Suspensions of the acylnaphthohydroquinones (1.0 mmol), Ag2O (2.0 equiv.), and MgSO4 anhydrous (300 mg) in dichloromethane (30 mL) were left with stirring for 30 min at room temperature (rt). The mixtures were filtered, the solids were washed with dichloromethane (3×15mL), and the filtrates containing the respective 2-acyl-1,4-naphthoquinones were evaporated under reduced pressure. The residues were dissolved in methanol (15 mL), the phenylamines (2 equiv.) and CeCl3·7H2O (5% mmol) were added to the solutions, and the mixtures were left with stirring at rt. The solvents were removed under reduced pressure, and the residues were column chromatographed over silica gel (petroleum ether/EtOAc) to yield the corresponding pure 2-phenylamino-3-acyl-1,4-naphtoquinones 110 and 13–14.
2-(phenylamino)-3-hexanoylnaphthalene-1,4-dione 1. (55%), red solid, mp: 124–126 °C. IR (KBr) νmáx cm–1: 3431 (NH); 1687 (C=O); 1640 (C=O); 1595 (C=O). 1H-NMR (300 MHz, CDCl3) δ: 0.90 (t, 3H, J = 6.9 Hz, –COCH2–CH2)–CH3); 1.32 (m, 4H, –COCH2–CH2CH2–CH2–CH3); 1.55 (m, 2H, –COCH2CH2–CH2)2–CH3); 3.04 (m, 2H, –COCH2–CH2)3–CH3); 7.13 (m, 2H, H-arom); 7.29 (m, 1H, H-arom); 7.38 (m, 2H, H-arom); 7.65 (td, 1H, J = 7.5, 1.3 Hz, H-6 or H-7); 7.79 (td, 1H, J = 7.6, 1.4 Hz, H-7 or H-6); 7.93 (dd, 1H, J = 7.7, 0.9 MHz, H-5); 8.17 (dd, 1H, J = 7.8, 0.8 MHz, H-8); 12.09 (s, 1H, –NH). 13C-NMR (75 MHz, CDCl3) δ: 14.16; 22.73; 24.11; 31.65; 44.89; 112.78; 124.74 (2C); 126.25; 126.78; 126.98; 129.39 (2C); 131.04; 132.74; 133.53; 135.43; 139.20; 150.43; 181.69; 182.41; 205.39. HRMS (APCI): [M + H]+ calcd for C22H21NO3: 347.15214; found 347.15209
2-(phenylamino)-3-decanoylnaphthalene-1,4-dione 2 (55%), red solid, mp: 95–96 °C. IR (KBr) νmáx cm–1: 3783(NH); 1678(C=O); 1638(C=O); 1594(C=O). 1H−NMR (300 MHz, CDCl3) δ: 0.88 (t, 3H, J = 6.6Hz, -COCH2−(CH2)7CH3); 1.29 (m, 12H, −COCH2−CH2CH2−CH2−CH2−CH2−CH2−CH2−CH3); 1.54 (d, 2H, J =6.8 Hz, −COCH2CH2−(CH2)6−CH3); 3.04 (m, 2H, −COCH2−(CH2)7−CH3); 7.12 (d, 2H, J = 7.6 Hz, H−arom); 7.31 (d, 1H, J = 7.2 Hz, H−arom); 7.39 (t, 2H, J = 7.5 Hz, H−arom); 7.65 (td, 1H, J = 7.6, 1.1 Hz, H−6 or H−7); 7.80 (td, 1H, J = 7.6, 1.2 Hz, H−7 or H−6); 7.94 (d, 1H, J = 7.7 Hz, H−5); 8.17 (d, 1H, J =7.8 Hz, H−8); 12.09 (s, 1H, −NH). 13C−NMR (75 MHz, CDCl3) δ: 14.15; 22.70; 24.31; 29;33; 29.36; 29.53; 29.58; 31.92; 44.83; 112.70; 124.63 (2C); 126.13; 126.67; 126.86; 129.27 (2C); 130.94; 132.62; 133.43; 135.31; 139.10; 150.31; 181.58; 182.30; 205.29. HRMS (APCI): [M + H]+ calcd for C26H29NO3: 403.21474; found 403.21159.
2-(phenylamino)-3-dodecanoylnaphthalene-1,4-dione 3 (53%), red solid, mp: 100–101 °C. IR (KBr) νmáx cm–1: 3434 (NH); 1679 (C=O); 1638 (C=O); 1569 (C=O). 1H−NMR (300 MHz, CDCl3) δ: 0.87 (t, 3H, J = 6.3 Hz, −COCH2−(CH2)9CH3); 1.28 (m, 16H, COCH2−CH2CH2−CH2−CH2−CH2−CH2−CH2−CH2−CH2−CH3); 1.54 (m, 2H, COCH2CH2−(CH2)8−CH3); 3.04 (t, 2H, J = 7.4 Hz, −COCH2−(CH2)9−CH3); 7.12 (d, 2H, J = 7.7 Hz, H−arom); 7.30 (d, 1H, J= 7.0 Hz, H−arom); 7.38 (t, 2H, J = 7.4 Hz, H−arom); 7.65 (t, 1H, J = 7.5Hz H−6 or H−7); 7.79 (t, 1H, J = 7.6 Hz, H−7 or H−6); 7.93 (d, 1H, J = 7.6 Hz, H−5); 8.17 (d, 1H, J = 7.7 Hz, H−8); 12.09 (s, 1H, −NH). 13C−NMR (75 MHz, CDCl3) δ: 14,28; 22,83; 24,42; 29,49 (2C); 29,70(2C); 29,79(2C); 32,05; 44,95; 112,78; 124,73(2C); 126,24; 126,78; 126.97; 129,38 (2C), 131.04; 132,73; 133,52; 135,43; 139,21; 150,42; 181.68; 182.41; 205.40. HRMS (APCI): [M + H]+ calcd for C28H33NO3: 431.21604; found 431.21814
2-(phenylamino)-3-benzoylnaphthalene-1,4-dione 4 (55%), orange solid, mp: 224–226 °C. IR (KBr) νmáx cm–1: 3438 (NH); 1667 (C=O); 1592 (C=O); 1560 (C=O). 1H−NMR (300 MHz, CDCl3) δ: 6.85 (d, 2H, J = 7.0 Hz, H−arom); 7.00 (m, 3H, H−arom); 7.29 (m, 2H, H−arom); 7.46 (t, 1H, J = 7.4 Hz, H−arom); 7.55 (m, 2H, H−arom); 7.72 (td, 1H, J = 7.5, 1.3Hz, H−7 or H−6); 7.80 (td, 1H, J =7.5, 1.3 Hz, H−6 or H−7); 7.90 (s, 1H, −NH), 8.12 (d, 1H, J = 7.6 Hz, H−5), 8.17 (d, 1H, J = 7.6 Hz, H−8). 13C−NMR (75 MHz, CDCl3) δ: 113.57; 126.19 (2xC); 126.69; 126.78; 127.18; 128.30 (2C); 128.93 (4C); 130.01; 132.85; 133.00; 133.17; 135.59; 136.85; 137.48; 143.77; 182.19; 182.38; 193.87. HRMS (APCI): [M + H]+ calcd for C23H15NO3: 353.10519; found 353.10196.
2-(phenylamino)-3-(3-methoxybenzoyl)naphthalene-1,4-dione 5 (60%), orange solid, mp: 164–166 °C. IR (KBr) νmáx cm–1: 3435 (NH); 1677 (C=O); 1652 (C=O); 1594 (C=O). 1H−NMR (300 MHz, CDCl3) δ: 3.74 (s, 3H, -OCH3); 6.86 (d, 2H, J = 6.8 Hz, H−arom); 7.01 (m, 5H, H−arom); 7.21 (d, 2H, J = 5.0 Hz, H−arom); 7.72 (t, 1H, J = 7.5 Hz, H−7 or H−6); 7.80 (t, 1H, J = 7.5 Hz, H−6 or H−7); 7.87(s, 1H, −NH); 8.12 (d, 1H, J = 7.5 Hz, H−5), 8.17 (d, 1H, J = 7.6 Hz, H−8).13C−NMR (75 MHz, CDCl3) δ: 55.48; 112.00; 113.62; 120.13; 122.31; 126.30 (2C); 126.68; 126.79; 127.09; 128.95 (2C); 129.24; 129.98; 132.85; 132.98; 135.58; 136.83; 138.90; 143.63; 159.62; 182.14; 182.36; 193.66. HRMS (APCI): [M + H]+ calcd for C24H17NO4: 383,11576; found 383.11242.
2-(phenylamino)-3-(4-methoxybenzoyl)naphthalene-1,4-dione 6 (53%), orange solid, mp: 227–229 °C. IR (KBr) νmáx cm–1: 3435 (NH); 1667 (C=O); 1659 (C=O); 1592 (C=O). 1H−NMR (300 MHz, CDCl3) δ: 3.83 (s, 3H, −OCH3); 6.77 (d, 2H, J = 8.7 Hz, H−arom); 6.86 (d, 2H, J =7.0 Hz, H−arom); 7.00 (m, 3H, H−arom); 7.52 (d, 2H, J = 8.7 Hz, H−arom); 7.71 (t, 1H, J = 7.5 Hz, H−7 or H−6); 7.80 (m, 2H, −NH + H−6 or H−7); 8.11 (d, 1H, J = 7.6 Hz, H−5), 8.16 (d, 1H, J = 7.6 Hz, H−8). 13C−RMN (75 MHz, CDCl3) δ: 55.58; 113.52 (2C); 113.95; 126.16 (2C); 126.63; 126.76; 127.10; 128.78 (2C); 129.98; 130.97; 131.34 (2C); 132.78; 133.02; 135.52; 136.86; 143.45; 163.65; 182.21; 182.48; 192.20. HRMS (APCI): [M + H]+ calcd for C24H17NO4: 383.39608; found 383.39818.
2-(phenylamino)-3-(3,4-dimethoxybenzoyl)naphthalene-1,4-dione 7 (63%), orange solid, mp: 217–219° C. IR (KBr) νmáx cm–1: 3435 (NH); 1675 (C=O); 1649 (C=O); 1618 (C=O). 1H−NMR (300 MHz, DMSO−d6) δ: 3.65 (s, 3H, −OCH3); 3.81 (s, 3H, −OCH3); 6.89 (m, 7H, H−arom); 7.30 (dd, 1H, J= 8.4, 1.5 Hz, H−arom); 7.87 (m, 3H, H−5 + H−6 + H−7); 8.11 (d, 1H, J = 7.5 Hz, H−8); 9.33 (s, 1H, −NH). 13C−NMR (75 MHz, DMSO−d6) δ: 55.38; 55.72; 109.88; 110.33; 113.37; 124.28; 125.53; 125.75; 126.07; 126.27 (2C); 127.91 (2C); 130.31; 130.72; 132.61; 132.80; 135.07; 137.92; 144.66; 148.24; 152.94; 181.53; 182.10; 192.02. HRMS (APCI): [M + H]+ calcd for C25H19NO5: 413.12632; found 413.12275.
2-(phenylamino)-3-(3,4,5-trimethoxybenzoyl)naphthalene-1,4-dione 8 (55%), orange solid, mp: 209–210° C. IR (KBr) νmáx cm–1: 3435 (NH); 1683 (C=O); 1657 (C=O); 1509 (C=O). 1H−NMR (300 MHz, DMSO−d6) δ: 3.69 (s, 6H, −OCH3); 3.72 (s, 3H, −OCH3); 6.74 (s, 2H, H−arom); 6.82 (m, 2H, H−arom); 6.95 (m, 3H, H−arom); 7.85 (m, 2H, H−5 + H−7 or H−6); 7.96 (d, 1H, J = 7.3 Hz, H−6 or H−7); 8.12 (d, 1H, J = 6.7 Hz, H−8); 9.35 (s, 1H, −NH). 13C−NMR (75 MHz, DMSO−d6) δ: 56.10 (2C); 60.24; 106.24; 112.84; 125.55; 125.71; 126.05; 126.24 (2C); 128.00 (3C); 130.44; 132.75 (2C); 132.78; 135.01; 137.98; 141.94; 144.99; 152.43 (2xC); 181.53; 182.09; 192.43. HRMS (APCI): [M + H]+ calcd for C26H21NO6: 443.13689; found 443.13299.
2-(phenylamino)-3-(4-hydroxy-3-methoxybenzoyl)naphthalene-1,4-dione 9 (54%), orange solid, mp: 194–195 °C. IR (KBr) νmáx cm–1: 3433 (NH); 1679 (C=O); 1565 (C=O); 1503 (C=O). 1H−NMR (300 MHz, CDCl3) δ: 3.78 (s, 3H, −OCH3); 6.15 (s, 1H, −OH); 6.79 (d, 1H, J = 8.2 Hz, H−arom); 6.85 (m, 2H, H−arom); 6.94 (d, 1H, J = 1.7 Hz, H−arom); 7.01 (m, 3H, H−arom); 7.23 (dd, 1H, J = 8.2, 1.8 Hz, H−arom); 7.71 (dt, 1H, J = 7.5, 3.8 Hz, H−7 or H−6); 7.79 (m, 2H, −NH + H−6 or H−7); 8.12 (d, 1H, J = 7.6 Hz, H−5); 8.16 (d, 1H, J = 7.7 Hz, H−8). 13C−NMR (75 MHz, CDCl3) δ: 56.09; 109.54; 113.61; 113.83; 125.55; 126.40 (2C); 126.66; 126.80; 126.92; 128.78 (2C); 129.95; 130.89; 132.82; 133.00; 135.55; 136.82; 143.34; 146.57; 150.63; 182.19; 182.43; 192.28. HRMS (APCI): [M + H]+ calcd for C24H17NO5: 399.11067; found 399.11316.
2-(phenylamino)-3-(4-methylbenzoyl)naphthalene-1,4-dione 10 (50%), red solid, mp: 224–226 °C. IR (KBr) νmáx cm–1: 3434 (NH); 1679 (C=O); 1658 (C=O); 1604 (C=O). 1H-NMR (300 MHz, CDCl3) δ: 2.36 (s, 3H, -CH3); 6.86 (d, 2H, J= 7.3 Hz, H-arom); 7.00 (m, 3H, H-arom); 7.09 (d, 2H, J= 7.9 Hz, H-arom); 7.46 (d, 2H, J= 8.0 Hz, H-arom); 7.71 (t, 1H, J= 7.5 Hz, H-7 or H-6); 7.79 (t, 1H, J= 7.5 Hz, H-6 or H-7); 7.89 (s, 1H, -NH); 8.11 (d, 1H, J= 7.6 Hz, H-5); 8.16 (d, 1H, J= 7.5 Hz, H-8). 13C-NMR (75 MHz, CDCl3) δ: 21.87; 113.78; 126.06 (2xC); 126.64; 126.76; 127.09; 128.87 (2xC); 129.03 (2xC); 129.09 (2xC); 130.00; 132.79; 133.01; 135.21; 135.53; 136.91; 143.61; 144.03; 182.23; 182.44; 193.46. HRMS (APCI): [M+H]+ calcd for C24H17NO3: 367.12084; found 367.12371.
2-(phenylamino)-3-(thiophene-3-carbonyl)naphthalene-1,4-dione 13 (50%), orange solid. mp: 187–189 °C. IR (KBr) νmáx cm–1: 3432 (NH); 1677 (C=O); 1657 (C=O); 1561 (C=O). 1H−NMR (300 MHz, CDCl3) δ: 6.87 (m, 2H, H−arom); 7.06 (m, 4H, H−arom); 7.12 (m, 1H, H−arom); 7.71 (m, 2H, H−7 or H−6 + H−arom); 7.80 (t, 1H, J = 7.5 Hz, H−6 or H−7); 7.86 (s, 1H, −NH); 8.14 (t, 2H, J = 8.3 Hz, H−5 + H−8). 13C-NMR (75 MHz, CDCl3) δ: 114.40; 125.83; 125.96 (2C); 126.67; 126.79; 127.09; 127.16; 128.87 (2C); 129.91; 132.86; 132.95; 133.62; 135.62; 136.81; 143.27; 143.30; 181.94; 182.50; 187.07. HRMS (APCI): [M + H]+ calcd for C21H13NO3S: 359.06161; found 359.05989
2-(phenylamino)-3-(1H-pyrrole-2-carbonyl)naphthalene-1,4-dione 14 (55%), red solid, mp: 210–212 °C. IR (KBr) νmáx cm–1: 3439 (NH); 1670 (C=O); 1615 (C=O); 1591 (C=O). 1H−NMR (300 MHz, CDCl3) δ: 6.19 (m, 1H, H−arom); 6.69 (s, 1H, H−arom); 6.89 (d, 3H, J = 7.6 Hz, H−arom); 7.04 (d, 3H, J = 6.8 Hz, H−arom); 7.71 (t, 1H, J = 7.5 Hz, H−7 or H−6); 7.80 (m, 2H, −NH + H−6 or H−7); 8.15 (d, 2H, J = 8.2 Hz, H−8 + H−5); 8.97 (s, 1H, −NH). 13C−NMR (75 MHz, CDCl3) δ: 110.94; 113.70; 118.83; 125.29; 125.80 (2C); 126.62; 126.84 (2C); 128.41 (2C); 129.96; 132.75; 133.08; 133.60; 135.52; 136.81; 143.27; 181.52; 181.89; 182.59. HRMS (APCI): [M + H]+ calcd for C21H14N2O3: 342.10044; found 342.099234

3.1.4. Molecular Descriptors

Calculation of lipophilicity (ClogP) and molar refractivity (CMR) was assessed by using the ChemBioDraw Ultra 11.0 software and the obtained values are shown in Table 3. Redox potentials of 2-phenylamino-3-acyl-1,4-naphtoquinones 114 were measured by cyclic voltammetry at room temperature in acetonitrile as solvent using a platinum electrode and 0.1M tetraethylammonium tetrafluoroborate as the supporting electrolyte [57].

3.2. Cytotoxic assays

3.2.1. Cell lines and cell cultures

Human cancer cell lines from bladder (T24), prostate (DU−145), breast (MCF−7) and non-tumor HEK-293 cells were obtained from the American Type Culture Collection (ATCC, Manassas, VA, USA). The cultures were maintained at a density of 1−2 x 10⁵ cells/mL and the medium was changed at 48− and 72−h intervals. They were cultured in high-glucose Dulbecco’s modified Eagle medium (Gibco, Grand Island, NY, USA) supplemented with 10% fetal calf serum, penicillin (100 U/mL), and streptomycin (100 μg/mL). All cultures were kept at 37 °C in 95% air/5% CO2 at 100% humidity. Phosphate-buffered saline (PBS) was purchased from Gibco. Cells were incubated at the indicated times at 37 °C with or without compounds 114 at various concentrations.

3.2.2. Cell survival assays

The cytotoxicity of the compounds 114 was assessed by following the reduction of MTT (3-(4,5-Dimethylthiazol-2-yl)-2,5-diphenyltetrazolium bromide) to formazan blue [58]. Cells were seeded into 96-well plates at a density of 10 000 cells/well for 24 h and then they were further incubated for 24 h with or without the quinones. Doxorubicin was used as standard chemotherapeutic agent (positive control). Cells were washed twice with warm PBS and further incubated with MTT (0.5 mg/mL) for 2 h at 37 °C. Blue formazan crystals were solubilized by adding 100 µl DMSO/well, and the optical density of colored solutions was subsequently read at 550 nm in a microplate reader Tecan infinite M200 Pro (Männedorf, Switzerland). The compounds 1−14 were dissolved in DMSO (stock solution at 100 mM) and further diluted to be evaluated at the following concentrations: 0 μM, 1 μM, 10 μM, 20 μM, 40 μM, 60 μM, 80 μM and 100 μM. Results are expressed as % of MTT reduction compared to untreated control conditions. The IC50 values were calculated using the GraphPad Prism software (San Diego, CA, USA).

3.3. Quantitative real-time PCR (qPCR) Assay

The DU-124 cells were cultured as previously mentioned. They were seeded into 6-well plates (2 × 10⁵ cells/well) and, after 24 h of incubation; they were treated for 48 h with compounds 4 and 11 (at 32 and 68 μM, respectively). Afterwards, they were washed with phosphate-buffered saline. The cellular lysate was prepared with E.Z.N.A.®RNA-Lock Reagent (Omega Bio-tek, Norcross, GA, USA) to preserve and immediately stabilize the total RNA for the subsequent gene expression assays. The total RNA isolated from the cells using the E.Z.N.A.®HP Total RNA Isolation Kit (Omega Bio-tek) was reverse-transcribed to cDNA using the AffinityScript QPCR cDNA Synthesis Kit (Agilent Technologies, Santa Clara, CA, USA) and 1000 ng of the RNA sample.
The cDNA synthesized was employed for qPCR using Brilliant III Ultra-Fast SYBR®Green QPCR Master Mix (Agilent Technologies) in an Mx3000P qPCR System (Agilent Technologies), employing a 96-well plate with 20 μL of PCR reaction per well and 10 pmol each of forward and reverse gene-specific primers. Nine genes were analyzed: B2M, Bcl2, CDC25A, CCN2, GSR, HDAC4, mTOR, TNF, TP53 and their quantitative real-time (qPCR) primer sequences are reported in Table S1 (supplementary material). The relative gene expressions were determined using Beta-2-microglobulin (B2M) as housekeeping, and the delta-delta Ct method (2−∆∆Ct method) with regard to the vehicle-treated group (i.e., the reference group). Five biological replicates were used from each group (treated and reference group). The qPCR reactions were run by duplicates and negative controls contained no cDNA, as previously reported [59]. The GraphPad Prism software was used for statistical analyses of the relative gene expressions. The comparisons between means were performed using one-way analysis of variance (ANOVA) and Dunnett’s multiple comparisons test. All statistical analyses were performed with a significance level of p < 0.05.

3.4. In Silico Studies

3.4.1. Molecular Docking

The compounds 4 and 11 were docked as potential inhibitors of the following proteins: Human CDC25A [60], TNF-α [61], Human HDAC4 [62], human glutathione reductase GSR [63], mTOR kinase [64], beta2-microglobulin B2M fibril [65] and human Bcl-2 promoter [66] using AutoDock Vina (v 1.0.2). The three-dimensional coordinates of all structures were optimized using MOPAC2016 software by PM6-D3H4 semi-empirical method [67,68]. The ligand files were prepared using the AutoDockTools package [69]. The crystal structure of CDC25A (PDB Code: 1C25), TNF-α (PDB Code: 2AZ5), HDAC4 (PDB Code: 2VQJ), GSR (PDB Code: 3DK9), mTOR (PDB Code: 4JSN), B2M (PDB Code: 6GK3) and Bcl-2 (PDB Code: 2W3L), were downloaded from the Protein Data Bank [70] . The CDC25A, TNF-α, HDAC4, GSR, mTOR, B2M and Bcl-2 were treated with the Schrödinger’s Protein Preparation Wizard [71]; polar hydrogen atoms were added, nonpolar hydrogen atoms were merged, and charges were assigned. Docking was treated as rigid and carried out using the empirical free energy function and the Lamarckian Genetic Algorithm provided by AutoDock Vina [72,73,74]. The grid map dimensions were 20 x 20 x 20 Å3. The centre of the binding site were the following coordinates for each of the proteins studied (Table 1). Each binding site coordinate shown in Table 1 represents the position obtained from the literature of ligands from the same aromatic chemical class and the geometric center of each co-crystallized ligand with the protein.
All other parameters were set as the default defined by AutoDock Vina. Dockings were repeated 20 times with space search exhaustiveness set to 100. The best interaction binding energy (kcal·mol-1) was selected for evaluation. Docking results 3D representations were used Discovery Studio 3.1 (Accelrys, San Diego, CA, USA) molecular graphics system was used.

3.4.2. Ligand Efficiency

Ligand efficiency (LE) calculations were performed using the Kd parameter. The latter corresponds to the dissociation constant between a ligand/protein and its value indicates the bond strength between the ligand/protein [100,101]. Low values indicate strong binding of the molecule to the protein. Kd calculations were done using Equations (1) and (2):
G 0 = 2.303 R T l o g ( K d )
K d = 10 G 0 2.303 R T
where ∆G0 is the binding energy (kcal·mol-1) obtained from docking experiments, R is the gas constant, and T is the temperature in Kelvin; in standard conditions of aqueous solution at 298.15 K, neutral pH and remaining concentrations of 1 M. The LE (Equation (3) allows us to compare molecules according to their average binding energy [102], and is computed as the ratio of binding energy per non-hydrogen atom [100,101,103]:
L E = 2.303 R T H A C log ( K d )
where Kd is obtained from Equation (2) and HAC denotes the heavy atom count (i.e., number of non-hydrogen atoms) in a ligand.
To complement this ligand efficiency study, an additional analysis of the size of the molecules in relation to the binding energy was implemented. Score Normalization Based on the Number of Non-Hydrogen Atoms, this score-based approach ( I E n o r m , b i n d i n g ) is biased towards the selection of high molecular weight compounds because of the contribution of the compound size to the energy score [104]. Such biasing behaviour was observed to depend on the shape and chemical properties of the binding pocket. The procedure starts with the normalization of the binding energy ( I E b i n d i n g ) by the number of heavy atoms (HAC) or by a selected power of HAC in each respective compound. This normalization approach shifts the MW distribution of selected compounds. In the present study, the following equation (4) was used to calculate the normalized binding energy value.
I E n o r m , b i n d i n g = I E b i n d i n g H A C 1 2
An important aspect of normalizing binding energy is the ability to bias selection towards lower MW compounds, thereby identifying compounds more appropriate for lead optimization. Importantly, ligand-based postdocking structural clustering leads to the selection of diverse compounds, many of which would have been lost through selection based on binding energy alone. Therefore, it is important to establish a relationship between binding energy and MW of 4 and 11 compounds.

3.5. Physicochemical, Pharmacokinetic, and Druglikeness properties

SwissADME (http://swissadme.ch, accessed on 8 August 2022) [105] and pkCSM online tools (http://biosig.unimelb.edu.au/pkcsm/prediction, accessed on 15 August 2022) [106] were utilized to predict physicochemical, pharmacokinetic (ADMET) and drug-likeness properties of compounds 4 and 11.

3.6. Statistical Analysis

GraphPad Prism 8.0.2 software (San Diego, CA, USA) was used for statistical analysis. The IC50 value (concentration of compounds causing half-maximal responses) was established by regression analysis.

4. Conclusions

This study demonstrates that a new set of 2-phenylamino-3-acyl-1,4-naphthoquinones, prepared through an environmentally friendly protocol, were evaluated against three human cell lines (DU-145, MCF-7, and T24). Compounds 4 and 11 appeared as the most active compound against proliferation of DU-145 human cancer cells. Based on previous elements already discussed, we would like to suggest that compound 11 is a good lead molecule that deserves to be further developed. In addition, its lipophilia allows it to traverse cell membranes to exert its cytotoxic action. We propose that mTOR is an interesting intracellular target and its dysregulation by compound 11 may affect cancer cells growth.

Supplementary Materials

The following supporting information can be downloaded at the website of this paper posted on Preprints.org. Figure S1: 1H-NMR and 13C-NMR spectra of compounds 1-10 and 13-14. Figure S2: Graphing dose-response curves of compound 4. Figure S3: Graphing dose-response curves of compound 11. Table S1: Quantitative real-time (qPCR) Primer Sequences. Table S2: Full reports of SwissADME and pkCSM parameters.

Author Contributions

The author contributions were as followed: JB—supervision, methodology, investigation, writing original draft, review, editing; JAV—investigation, writing original draft; AC—investigation (chemical synthesis); CE—investigation (cytotoxic assays); RPR—investigation (docking molecular); OY—investigation (docking molecular); writing original draft, editing; PBC—conceptualization, investigation, methodology, original draft preparation, writing, review and editing. All authors contributed to the article and approved the submitted version.

Funding

This research was funded by Fondo Nacional de Ciencia y Tecnología (FONDECYT), grant number 1190577, Chile.

Institutional Review Board Statement

Not applicable.

Informed Consent Statement

Not applicable.

Data Availability Statement

Not applicable.

Acknowledgments

The authors thank Dra. Angelica Guerrero (School of Pharmacy, San Sebastian University) for biological evaluation.

Conflicts of Interest

The authors declare no conflict of interest.

References

  1. Verma, R. Anti-Cancer Activities of 1,4-Naphthoquinones: A QSAR Study. Anticancer Agents Med. Chem. 2006, 6, 489−499. [CrossRef]
  2. Tandon, V.; Kumar, S. Recent development on naphthoquinone derivatives and their therapeutic applications as anticancer agents. Expert Opin. Ther. Pat. 2013, 23, 1087−1108. [CrossRef]
  3. Prachayasittikul, V.; Pingaew, R.; Worachartcheewan, A.; Nantasenamat, C.; Prachayasittikul, S.; Ruchirawat, S.; Prachayasittikul, V. Prachayasittikul, V.; Pingaew, R.; Worachartcheewan, A.; Nantasenamat, C.; Prachayasittikul, S.; Ruchirawat, S.; Prachayasittikul, V. Synthesis, anticancer activity and QSAR study of 1,4-naphthoquinone derivatives. Eur. J. Medl Chem. 2014, 84, 247−263. [CrossRef]
  4. Pingaew, R.; Prachayasittikul, V.; Worachartcheewan, A.; Nantasenamat, C.; Prachayasittikul, S.; Ruchirawat, S.; Prachayasittikul, V. Novel 1,4-naphthoquinone-based sulfonamides: Synthesis, QSAR, anticancer and antimalarial studies. Eur. J. Med. Chem. 2015, 103, 446−459. [CrossRef]
  5. Badave, D.K.; Khan, A.A.; Rane, Y.S. Anticancer Vitamin K3 Analogs: A Review. Anticancer Agents Med. Chem. 2016, 16, 1017−1030.
  6. Benites, J.; Valderrama, J. A.; Bettega, K.; Pedrosa, R. C.; Calderon, P. B.; Verrax, J. Biological evaluation of donor-acceptor aminonaphthoquinones as antitumor agents. Eur. J. Med. Chem. 2010, 45, 6052−6057. [CrossRef]
  7. Mahalapbutr, P.; Leechaisit, R.; Thongnum, A.; Todsaporn, D.; Prachayasittikul, V.; Rungrotmongkol, T.; Prachayasittikul, S.; Ruchirawat, S.; Prachayasittikul, V.; Pingaew, R., Discovery of Anilino-1,4-naphthoquinones as Potent EGFR Tyrosine Kinase Inhibitors: Synthesis, Biological Evaluation, and Comprehensive Molecular Modeling. ACS Omega 2022, 7, 17881−17893. [CrossRef]
  8. Bolton, J.; Dunlap, T. Formation and Biological Targets of Quinones: Cytotoxic versus Cytoprotective Effects. Chem. Res. Toxicol. 2017, 30, 13−37. [CrossRef]
  9. Ríos, D.; Benites, J.; Torrejón, F.; Theoduloz, C.; Valderrama, J. Synthesis and in vitro antiproliferative evaluation of 3-acyl-2-arylamino-1,4-naphthoquinones. Med. Chem. Res. 2014, 23, 4149−4155. [CrossRef]
  10. Rios, D.; Benites, J.; A. Valderrama, J.; Farias, M.; C. Pedrosa, R.; Verrax, J.; Buc Calderon, P. Biological Evaluation of 3-Acyl-2-Arylamino-1,4-Naphthoquinones as Inhibitors of Hsp90 Chaperoning Function. Curr. Top. Med. Chem. 2012, 12, 2094−2102.
  11. Gorrini, C.; Harris, I.; Mak, T. Modulation of oxidative stress as an anticancer strategy. Nat. Rev. Drug Discov. 2013, 12, 931−947. [CrossRef]
  12. Panieri, E.; Santoro, M.M. ROS homeostasis and metabolism: a dangerous liason in cancer cells. Cell Death Dise. 2016, 7, e2253. [CrossRef]
  13. Locasale, Jason W.; Cantley, Lewis C. Metabolic Flux and the Regulation of Mammalian Cell Growth. Cell Metab. 2011, 14, 443−451. [CrossRef]
  14. Vafa, O.; Wade, M.; Kern, S.; Beeche, M.; Pandita, T.; Hampton, G.; Wahl, G. c-Myc Can Induce DNA Damage, Increase Reactive Oxygen Species, and Mitigate p53 Function. Mol. Cell 2002, 9, 1031−1044.
  15. Ghoneum, A.; Abdulfattah, A.; Warren, B.; Shu, J.; Said, N. Redox Homeostasis and Metabolism in Cancer: A Complex Mechanism and Potential Targeted Therapeutics. Int. J. Mol. Sci. 2020, 21, 3100. [CrossRef]
  16. Sies, H.; Jones, D. Reactive oxygen species (ROS) as pleiotropic physiological signalling agents. Nat. Rev. Mol. Cell Biol. 2020, 21, 363−383. [CrossRef]
  17. Xing, F.; Hu, Q.; Qin, Y.; Xu, J.; Zhang, B.; Yu, X.; Wang, W. The Relationship of Redox With Hallmarks of Cancer: The Importance of Homeostasis and Context. Front. Oncol. 2022, 12, 862743. [CrossRef]
  18. Jamison, J.; Gilloteaux, J.; Taper, H.; Calderon, P.; Summers, J. Autoschizis: a novel cell death. Biochem. Pharmacol. 2002, 63, 1773−1783. [CrossRef]
  19. Verrax, J.; Cadrobbi, J.; Marques, C.; Taper, H.; Habraken, Y.; Piette, J.; Calderon, P. Ascorbate potentiates the cytotoxicity of menadione leading to an oxidative stress that kills cancer cells by a non-apoptotic caspase-3 independent form of cell death. Apoptosis 2004, 9, 223−233. [CrossRef]
  20. Zhou, B.; Zhang, J.-Y.; Liu, X.-S.; Chen, H.-Z.; Ai, Y.-L.; Cheng, K.; Sun, R.-Y.; Zhou, D.; Han, J.; Wu, Q. Tom20 senses iron-activated ROS signaling to promote melanoma cell pyroptosis. Cell Res. 2018, 28, 1171−1185. [CrossRef]
  21. Su, Y.; Zhao, B.; Zhou, L.; Zhang, Z.; Shen, Y.; Lv, H.; Alqudsy, L.; Shang, P. Ferroptosis, a novel pharmacological mechanism of anti-cancer drugs. Cancer Lett. 2020, 483, 127−136. [CrossRef]
  22. Kim, S.; Lee, H.; Lim, J.; Kim, H. Astaxanthin induces NADPH oxidase activation and receptor-interacting protein kinase 1-mediated necroptosis in gastric cancer AGS cells. Mol. Med. Report. 2021, 24, 837–849. [CrossRef]
  23. Valderrama, J.; Ríos, D.; Muccioli, G.; Buc Calderon, P.; Brito, I.; Benites, J. Hetero-annulation reaction between 2-acylnaphthoquinones and 2-aminobenzothiazoles. A new synthetic route to antiproliferative benzo[g]benzothiazolo[2,3-b]quinazoline-7,12-quinones. Tetrahedron Lett. 2015, 56, 5103−5105. [CrossRef]
  24. Valderrama, J.; Delgado, V.; Sepúlveda, S.; Benites, J.; Theoduloz, C.; Buc Calderon, P.; Muccioli, G. Synthesis and Cytotoxic Activity on Human Cancer Cells of Novel Isoquinolinequinone–Amino Acid Derivatives. Molecules 2016, 21, 1199. [CrossRef]
  25. Benites, J.; Valderrama, J.; Ríos, D.; Lagos, R.; Monasterio, O.; Calderon, P. Inhibition of cancer cell growth and migration by dihydroxynaphthyl aryl ketones. Mol. Cell. Toxicol. 2016, 12, 237−242. [CrossRef]
  26. Valderrama, J.; Cabrera, M.; Benites, J.; Ríos, D.; Inostroza-Rivera, R.; Muccioli, G.; Calderon, P. Synthetic approaches and in vitro cytotoxic evaluation of 2-acyl-3-(3,4,5-trimethoxyanilino)-1,4-naphthoquinones. RSC Advances 2017, 7, 24813−24821. [CrossRef]
  27. Benites, J.; Valderrama, J.; Ramos, M.; Muccioli, G.; Buc Calderon, P. Targeting Akt as strategy to kill cancer cells using 3-substituted 5-anilinobenzo[c]isoxazolequinones: A preliminary study. Biomed. Pharmacother. 2018, 97, 778−783. [CrossRef]
  28. Benites, J.; Valderrama, J.; Ramos, M.; Valenzuela, M.; Guerrero-Castilla, A.; Muccioli, G.; Buc Calderon, P. Half-Wave Potentials and In Vitro Cytotoxic Evaluation of 3-Acylated 2,5-Bis(phenylamino)-1,4-benzoquinones on Cancer Cells. Molecules 2019, 24, 1780. [CrossRef]
  29. Ríos, D.; Valderrama, J.; Cautin, M.; Tapia, M.; Salas, F.; Guerrero-Castilla, A.; Muccioli, G.; Buc Calderón, P.; Benites, J. New 2-Acetyl-3-aminophenyl-1,4-naphthoquinones: Synthesis and In Vitro Antiproliferative Activities on Breast and Prostate Human Cancer Cells. Oxid. Med. Cell. Longev. 2020, 2020, 1−11.
  30. Verma, R.; Hansch, C. Elucidation of structure–activity relationships for 2- or 6-substituted-5,8-dimethoxy-1,4-naphthoquinones. Bioorg. Med. Chem. 2004, 12, 5997−6009.
  31. Elfaki, M.; Sultan, M.; Mohammed, I. Mechanistic Study of Anticancer Activity of Some Known Aminopyrimidoisoquinolinequinones via QSAR Classification Methodology. Comp. Chem. 2020, 8, 1−13. [CrossRef]
  32. Veber, D.; Johnson, S.; Cheng, H.-Y.; Smith, B.; Ward, K.; Kopple, K. Molecular Properties That Influence the Oral Bioavailability of Drug Candidates. J. Med. Chem. 2002, 45, 2615−2623. [CrossRef]
  33. Angelis, I.; Turco, L. Caco-2 Cells as a Model for Intestinal Absorption. Curr. Protoc. Toxicol. 2011, 47, 20−26.
  34. Cheng, F.; Li, W.; Zhou, Y.; Shen, J.; Wu, Z.; Liu, G.; Lee, P.; Tang, Y. admetSAR: A Comprehensive Source and Free Tool for Assessment of Chemical ADMET Properties. J. Chem. Inf. Model. 2012, 52, 3099−3105. [CrossRef]
  35. Nau, R.; Sörgel, F.; Eiffert, H. Penetration of Drugs through the Blood-Cerebrospinal Fluid/Blood-Brain Barrier for Treatment of Central Nervous System Infections. Clin. Microbiol. Revi. 2010, 23, 858−883. [CrossRef]
  36. Domínguez-Villa, F.; Durán-Iturbide, N.; Ávila-Zárraga, J. Synthesis, molecular docking, and in silico ADME/Tox profiling studies of new 1-aryl-5-(3-azidopropyl)indol-4-ones: Potential inhibitors of SARS CoV-2 main protease. Bioorg. Chem. 2021, 106, 104497. [CrossRef]
  37. Vaux, D.; Cory, S.; Adams, J. Bcl-2 gene promotes haemopoietic cell survival and cooperates with c-myc to immortalize pre-B cells. Nature 1988, 335, 440−442. [CrossRef]
  38. Gross, A.; McDonnell, J.; Korsmeyer, S. BCL-2 family members and the mitochondria in apoptosis. Genes Dev. 1999, 13, 1899−1911. [CrossRef]
  39. Hardwick, J.; Soane, L. Multiple Functions of BCL-2 Family Proteins. Cold Spring Harb. Perspect. Biol. 2013, 5, a008722. [CrossRef]
  40. Adams, J.; Cory, S. The BCL-2 arbiters of apoptosis and their growing role as cancer targets. Cell Death Differ. 2018, 25, 27−36. [CrossRef]
  41. Hay, N.; Sonenberg, N. Upstream and downstream of mTOR. Genes Dev. 1926, 18, 1926−1945. [CrossRef]
  42. Wullschleger, S.; Loewith, R.; Hall, M. TOR Signaling in Growth and Metabolism. Cell 2006, 124, 471−484. [CrossRef]
  43. Xu, K.; Liu, P.; Wei, W. mTOR signaling in tumorigenesis. Biochim. Biophys. Acta 2014, 1846, 638−654. [CrossRef]
  44. Guertin, D.; Sabatini, D. An expanding role for mTOR in cancer. Trends Mol. Med. 2005, 11, 353−361. [CrossRef]
  45. Rafalski, V.; Brunet, A. Energy metabolism in adult neural stem cell fate. Prog. Neurobiol. 2011, 93, 182-203. [CrossRef]
  46. King, D.; Yeomanson, D.; Bryant, H. PI3King the lock: targeting the PI3K/Akt/mTOR pathway as a novel therapeutic strategy in neuroblastoma. J. Ped. Hematol. Oncol. 2015, 37, 245–251.
  47. Mossmann, D.; Park, S.; Hall, M. mTOR signalling and cellular metabolism are mutual determinants in cancer. Nat. Rev. Cancer 2018, 18, 744−757. [CrossRef]
  48. Magaway, C.; Kim, E.; Jacinto, E. Targeting mTOR and Metabolism in Cancer: Lessons and Innovations. Cells 2019, 8, 1584−1584. [CrossRef]
  49. Huang, S. mTOR Signaling in Metabolism and Cancer. Cells 2020, 9, 2278−2278. [CrossRef]
  50. Alzahrani, A. S. PI3K/Akt/mTOR inhibitors in cancer: At the bench and bedside. Semin. Cancer Biol. 2019, 59, 125−132. [CrossRef]
  51. Hua, H.; Kong, Q.; Zhang, H.; Wang, J.; Luo, T.; Jiang, Y. Targeting mTOR for cancer therapy. J. Hematol. Oncol. 2019, 12, 71. [CrossRef]
  52. Popova, N.; Jücker, M. The Role of mTOR Signaling as a Therapeutic Target in Cancer. Int. J. Mol. Sci. 2021, 22, 1743. [CrossRef]
  53. Qiu, H.-Y.; Wang, P.-F.; Zhang, M. A patent review of mTOR inhibitors for cancer therapy (2011–2020). Expert Opin. Ther. Pat. 2011, 31, 965−975. [CrossRef]
  54. Sun, S.-Y. mTOR-targeted cancer therapy: great target but disappointing clinical outcomes, why? Front. Med. 2020, 15, 221−231.
  55. Bendavit, G.; Aboulkassim, T.; Hilmi, K.; Shah, S.; Batist, G. Nrf2 Transcription Factor Can Directly Regulate mTOR: Linking cytoprotective gene expression to a major metabolic regulator that generates redox activity. J. Biol. Chem. 2016, 291, 25476–25488.
  56. Benites, J.; Rios, D.; Díaz, P.; Valderrama, J. The solar-chemical photo-Friedel–Crafts heteroacylation of 1,4-quinones. Tetrahedron Lett. 2011, 52, 609−611.
  57. Prieto, Y.; Muñoz, M.; Arancibia, V.; Valderrama, M.; Lahoz, F.; Luisa Martín, M. Synthesis, structure and properties of ruthenium(II) complexes with quinolinedione derivatives as chelate ligands: Crystal structure of [Ru(CO)2Cl2(6-methoxybenzo[g]quinoline-5,10-dione)]. Polyhedron 2007, 26, 5527−5532. [CrossRef]
  58. Mosmann, T. Rapid colorimetric assay for cellular growth and survival: Application to proliferation and cytotoxicity assays. J. Immunol. Methods 1983, 65, 55−63. [CrossRef]
  59. Guerrero-Castilla, A.; Olivero-Verbel, J.; Sandoval, I.; Jones, D. Toxic effects of a methanolic coal dust extract on fish early life stage. Chemosphere 2019, 227, 100−108. [CrossRef]
  60. Fauman, E.; Cogswell, J.; Lovejoy, B.; Rocque, W.; Holmes, W.; Montana, V.; Piwnica-Worms, H.; Rink, M.; Saper, M. Crystal Structure of the Catalytic Domain of the Human Cell Cycle Control Phosphatase, Cdc25A. Cell 1998, 93, 617−625. [CrossRef]
  61. Smith, A.; Oslob, J.; Flanagan, W.; Braisted, A.; Whitty, A.; Cancilla, M.; Wang, J.; Lugovskoy, A.; Yoburn, J.; Fung, A.; Farrington, G.; Eldredge, J.; Day, E.; Cruz, L.; Cachero, T.; Miller, S.; Friedman, J.; Choong, I.; Cunningham, B. Small-molecule inhibition of TNF-alpha. Science 2005, 11, 1022–1025. [CrossRef]
  62. Bottomley, M.; Lo Surdo, P.; Di Giovine, P.; Cirillo, A.; Scarpelli, R.; Ferrigno, F.; Jones, P.; Neddermann, P.; De Francesco, R.; Steinkühler, C.; Gallinari, P.; Carfí, A. Structural and Functional Analysis of the Human HDAC4 Catalytic Domain Reveals a Regulatory Structural Zinc-binding Domain. J, Biol. Chem. 2008, 283, 26694−26704. [CrossRef]
  63. Berkholz, D.; Faber, H.; Savvides, S.; Karplus, P. Catalytic Cycle of Human Glutathione Reductase Near 1 Å Resolution. J. Mol. Biol. 2008, 382, 371−384. [CrossRef]
  64. Yang, H.; Rudge, D.; Koos, J.; Vaidialingam, B.; Yang, H.; Pavletich, N. mTOR kinase structure, mechanism and regulation. Nature 2013, 497, 217−223.
  65. Iadanza, M.; Silvers, R.; Boardman, J.; Smith, H.; Karamanos, T.; Debelouchina, G.; Su, Y.; Griffin, R.; Ranson, N.; Radford, S. The structure of a β2-microglobulin fibril suggests a molecular basis for its amyloid polymorphism. Nature Comm. 2018, 9, 4517. [CrossRef]
  66. Porter, J.; Payne, A.; De Candole, B.; Ford, D.; Hutchinson, B.; Trevitt, G.; Turner, J.; Edwards, C.; Watkins, C.; Whitcombe, I.; Davis, J.; Stubberfield, C. Tetrahydroisoquinoline amide substituted phenyl pyrazoles as selective Bcl-2 inhibitors. Bioorg. Med. Chem. Lett. 2009, 19, 230−233. [CrossRef]
  67. Stewart, J. Optimization of parameters for semiempirical methods V: Modification of NDDO approximations and appli-cation to 70 elements. J. Mol. Model. 2007, 13, 1173–1213.
  68. Řezáč, J.; Hobza, P. Advanced Corrections of Hydrogen Bonding and Dispersion for Semiempirical Quantum Mechanical Methods. J. Chem. Theory Comput. 2012, 8, 141−151.
  69. Sanner, M. Using the Python programming language for bioinformatics. John Wiley & Sons, Ltd.: 1999; Vol. 17, pp 55–84.
  70. Berman, H.; Westbrook, J.; Feng, Z.; Gilliland, G.; Bhat, T.; Weissig, H.; Ilya, N., The Protein Data Bank. Nucleic Acids Res. 2000, 28, 235−242.
  71. Sastry, G.; Adzhigirey, M.; Day, T.; Annabhimoju, R.; Sherman, W., Protein and ligand preparation: parameters, protocols, and influence on virtual screening enrichments. J. Comput. Aided Mol. Des. 2013, 27, 221–234. [CrossRef]
  72. Morris, G.; Goodsell, D.; Halliday, R.; Huey, R.; Hart, W.; Belew, R. Automated docking using a Lamarckian genetic algorithm and an empirical binding free energy function. J. Comput. Chem. 1998, 19, 1639–1662.
  73. rott, O.; Olson, A. AutoDock Vina: Improving the speed and accuracy of docking with a new scoring function, efficient optimization, and multithreading. J. Comput. Chem. 2010, 455−461. [CrossRef]
  74. Eberhardt, J.; Santos-Martins, D.; Tillack, A.; Forli, S. AutoDock Vina 1.2.0: New Docking Methods, Expanded Force Field, and Python Bindings. J. Chem. Inf. Model. 2021, 61, 3891−3898. [CrossRef]
  75. Lauria, A.; Martorana, A.; La Monica, G.; Mannino, S.; Mannino, G.; Peri, D.; Gentile, C. In Silico Identification of Small Molecules as New Cdc25 Inhibitors through the Correlation between Chemosensitivity and Protein Expression Pattern. Int. J. Mol. Sci. 2021, 22, 3714−3714. [CrossRef]
  76. Khan, M.; Nasr, F.; Baabbad, A.; Alqahtani, A.; Wadaan, M. Investigating the Anticancer Activity and Characterization of Bioactive Constituents of Moricandia sinaica (Boiss.) Boiss through In Vitro and In Silico Approaches in Triple-Negative Breast Cancer Cell Line. Appl. Sci. 2021, 1244.
  77. Deokar, S.; Shaikh, K. Exploring Cytotoxic Potential of Ciclopirox on Colorectal Cancer Cells by In-Silico Methodology. Biointerface Res. Appl. Chem. 2021 12, 7287–7310.
  78. Bhat, S.; Nayek, U.; Bhattacharjee, H.; Abdul Ajees, A. In-silico studies on the protein-protein interactions between human Cdc25 and glutaredoxin. J. Comput. Methods Sci. Eng. 2017, 17, 235−242. [CrossRef]
  79. Tao, Y.; Hao, X.; Jing, L.; Sun, L.; Cherukupalli, S.; Liu, S.; Wu, G.; Xu, S.; Zhang, X.; Shi, X.; Song, Y.; Liu, X.; Zhan, P. Discovery of potent and selective Cdc25 phosphatase inhibitors via rapid assembly and in situ screening of Quinonoid-focused libraries. Bioorg. Chem. 2021, 115, 105254. [CrossRef]
  80. Kellenberger, E.; Hofmann, A.; Quinn, R. Similar interactions of natural products with biosynthetic enzymes and therapeutic targets could explain why nature produces such a large proportion of existing drugs. Nat. Prod. Rep. 2011, 28, 1483. [CrossRef]
  81. Evain-Bana, E.; Schiavo, L.; Bour, C.; Lanfranchi, D.; Berardozzi, S.; Ghirga, F.; Bagrel, D.; Botta, B.; Hanquet, G.; Mori, M. Synthesis, biological evaluation and molecular modeling studies on novel quinonoid inhibitors of CDC25 phosphatases. J. Enzyme Inhib. Med. Chem. 2017, 32, 113−118. [CrossRef]
  82. Sarkis, M.; Miteva, M.; Dasso Lang, M.; Jaouen, M.; Sari, M.-A.; Galcéra, M.-O.; Ethève-Quelquejeu, M.; Garbay, C.; Bertho, G.; Braud, E. Insights into the interaction of high potency inhibitor IRC-083864 with phosphatase CDC25. Proteins 2017, 85, 593−601. [CrossRef]
  83. Altowyan, M.; Barakat, A.; Al-Majid, A.; Al-Ghulikah, H. Spiroindolone analogues bearing benzofuran moiety as a selective cyclooxygenase COX-1 with TNF-α and IL-6 inhibitors. Saudi J. Biol. Sci. 2020, 27, 1208−1216. [CrossRef]
  84. Xu, S.; Peng, H.; Wang, N.; Zhao, M. Inhibition of TNF-α and IL-1 by compounds from selected plants for rheumatoid arthritis therapy: In vivo and in silico studies. Trop. J. Pharm. Res. 2018, 17, 277. [CrossRef]
  85. Kumar, P.; Krishnaswamy, G.; Desai, N.; Sreenivasa, S.; Kumar, D. Design, synthesis, PASS prediction, in-silico ADME and molecular docking studies of substituted-(Z)-3-benzylidine-5-aza-2-oxindole derivatives (Part-1). Chem. Data Collec. 2021, 31, 100617. [CrossRef]
  86. Upadhyay, N.; Tilekar, K.; Jänsch, N.; Schweipert, M.; Hess, J.; Henze Macias, L.; Mrowka, P.; Aguilera, R.; Choe, J.-Y.; Meyer-Almes, F.-J.; Ramaa, C. Discovery of novel N-substituted thiazolidinediones (TZDs) as HDAC8 inhibitors: in-silico studies, synthesis, and biological evaluation. Bioorg. Chem. 2020, 100, 103934. [CrossRef]
  87. Schweipert, M.; Jänsch, N.; Upadhyay, N.; Tilekar, K.; Wozny, E.; Basheer, S.; Wurster, E.; Müller, M.; Ramaa, C. S.; Meyer-Almes, F.-J. Mechanistic Insights into Binding of Ligands with Thiazolidinedione Warhead to Human Histone Deacetylase 4. Pharmaceuticals 2021, 14, 1032. [CrossRef]
  88. Tilekar, K.; Hess, J.; Upadhyay, N.; Schweipert, M.; Flath, F.; Gutierrez, D.; Loiodice, F.; Lavecchia, A.; Meyer-Almes, F.J.; Aguilera, R.; Ramaa, C. HDAC4 Inhibitors with Cyclic Linker and Non-hydroxamate Zinc Binding Group: Design, Synthesis, HDAC Screening and in vitro Cytotoxicity evaluation. ChemistrySelect 2021, 6, 6748−6763.
  89. Cetin, A.; Bursal, E.; Türkan, F. 2-methylindole analogs as cholinesterases and glutathione S-transferase inhibitors: Synthesis, biological evaluation, molecular docking, and pharmacokinetic studies. Arab. J. Chem. 2021, 14, 103449. [CrossRef]
  90. Karaman, M. Molecular Insight of the Possible Inhibition Mechanism of Therapeutic Cephalosporin Derivatives against Human Glutathione Reductase Enzyme. Cumhuriyet Sci. J. 2020, 41, 747−755. [CrossRef]
  91. Beaufils, F.; Cmiljanovic, N.; Cmiljanovic, V.; Bohnacker, T.; Melone, A.; Marone, R.; Jackson, E.; Zhang, X.; Sele, A.; Borsari, C.; Mestan, J.; Hebeisen, P.; Hillmann, P.; Giese, B.; Zvelebil, M.; Fabbro, D.; Williams, R.; Rageot, D.; Wymann, M. 5-(4,6-Dimorpholino-1,3,5-triazin-2-yl)-4-(trifluoromethyl)pyridin-2-amine (PQR309), a Potent, Brain-Penetrant, Orally Bioavailable, Pan-Class I PI3K/mTOR Inhibitor as Clinical Candidate in Oncology. J. Med. Chem. 2017, 60, 7524−7538. [CrossRef]
  92. Ruiz-Torres, V.; Losada-Echeberría, M.; Herranz-López, M.; Barrajón-Catalán, E.; Galiano, V.; Micol, V.; Encinar, J. New Mammalian Target of Rapamycin (mTOR) Modulators Derived from Natural Product Databases and Marine Extracts by Using Molecular Docking Techniques. Mar. Drugs 2018, 16, 385−385. [CrossRef]
  93. Li, D.-D.; Meng, X.-F.; Wang, Q.; Yu, P.; Zhao, L.-G.; Zhang, Z.-P.; Wang, Z.-Z.; Xiao, W. Consensus scoring model for the molecular docking study of mTOR kinase inhibitor. J. Mol. Graphics Modell. 2018, 79, 81−87. [CrossRef]
  94. Kashyap, B.; Barge, S.; Bharadwaj, S.; Deka, B.; Rahman, S.; Ghosh, A.; Manna, P.; Dutta, P.; Sheikh, Y.; Kandimalla, R.; Samanta, S.; Boruwa, J.; Saikia, S.; Swargiary, D.; Kamboj, P.; Tuli, D.; Pal, U.; Borah, J.; Banerjee, S.; Talukdar, N. Evaluation of therapeutic effect of Premna herbacea in diabetic rat and isoverbascoside against insulin resistance in L6 muscle cells through bioenergetics and stimulation of JNK and AKT/mTOR signaling cascade. Phytomedicine 2021, 93, 153761. [CrossRef]
  95. Gomha, S.; Riyadh, S.; Huwaimel, B.; Zayed, M.; Abdellattif, M. Synthesis, Molecular Docking Study, and Cytotoxic Activity against MCF Cells of New Thiazole–Thiophene Scaffolds. Molecules 2022, 27, 4639. [CrossRef]
  96. Suganya, V.; Anuradha, V. In silico molecular docking of astaxanthin and sorafenib with different apoptotic proteins involved in hepatocellular carcinoma. Biocatal. Agric. Biotechnol. 2019, 19, 101076. [CrossRef]
  97. El-Sawy, E.; Mandour, A.; Yahya, S.; Abo-Salem, H.; Ebaid, M. Synthesis, cytotoxic, proapoptotic evaluation, and molecular docking study of some new N-substituted sulfonyl-3-indolyl heterocycles. Egypt. Pharm. J. 2015, 14, 15. [CrossRef]
  98. Gowtham, H.; Ahmed, F.; Anandan, S.; Shivakumara, C.; Bilagi, A.; Pradeep, S.; Shivamallu, C.; Shati, A.; Alfaifi, M.; Elbehairi, S.; Achar, R.; Silina, E.; Stupin, V.; Murali, M.; Kollur, S. In Silico Computational Studies of Bioactive Secondary Metabolites from Wedelia trilobata against Anti-Apoptotic B-Cell Lymphoma-2 (Bcl-2) Protein Associated with Cancer Cell Survival and Resistance. Molecules 2023, 28, 1588. [CrossRef]
  99. Lewkowicz, E.; Jayaraman, S.; Gursky, O., Protein Amyloid Cofactors: Charged Side-Chain Arrays Meet Their Match? Trends Biochem. Sci. 2021, 46, 626.
  100. Abad-Zapatero, C., Ligand efficiency indices for effective drug discovery. Expert Opin. Drug Discov. 2007, 2, 469−488. [CrossRef]
  101. Abad-Zapatero, C.; Perišić, O.; Wass, J.; Bento, A.; Overington, J.; Al-Lazikani, B.; Johnson, M. Ligand efficiency indices for an effective mapping of chemico-biological space: the concept of an atlas-like representation. Drug Discov. Today 2010, 15, 804–811.
  102. Reynolds, C.; Tounge, B.; Bembenek, S. Ligand Binding Efficiency: Trends, Physical Basis, and Implications. J. Med. Chem. 2008, 51, 2432−2438. [CrossRef]
  103. Cavalluzzi, M.; Mangiatordi, G.; Nicolotti, O.; Lentini, G. Ligand efficiency metrics in drug discovery: the pros and cons from a practical perspective. Expert Opin. Drug Discov. 2017, 12, 1087−1104. [CrossRef]
  104. Pan, Y.; Huang, N.; Cho, S.; Mackerell, A. Consideration of Molecular Weight during Compound Selection in Virtual Target-Based Database Screening. J. Chem. Inf. Comput. Sci. 2003, 43, 267−272. [CrossRef]
  105. Bakchi, B.; Krishna, A.; Sreecharan, E.; Ganesh, V.; Niharika, M.; Maharshi, S.; Puttagunta, S.; Sigalapalli, D.; Bhandare, R.; Shaik, A. An overview on applications of SwissADME web tool in the design and development of anticancer, antitubercular and antimicrobial agents: A medicinal chemist’s perspective. J. Mol. Struct. 1259, 1259, 132712. [CrossRef]
  106. Pires, D.; Blundell, T.; Ascher, D. pkCSM: Predicting Small-Molecule Pharmacokinetic and Toxicity Properties Using Graph-Based Signatures. J. Med. Chem. 2015, 58, 4066−4072. [CrossRef]
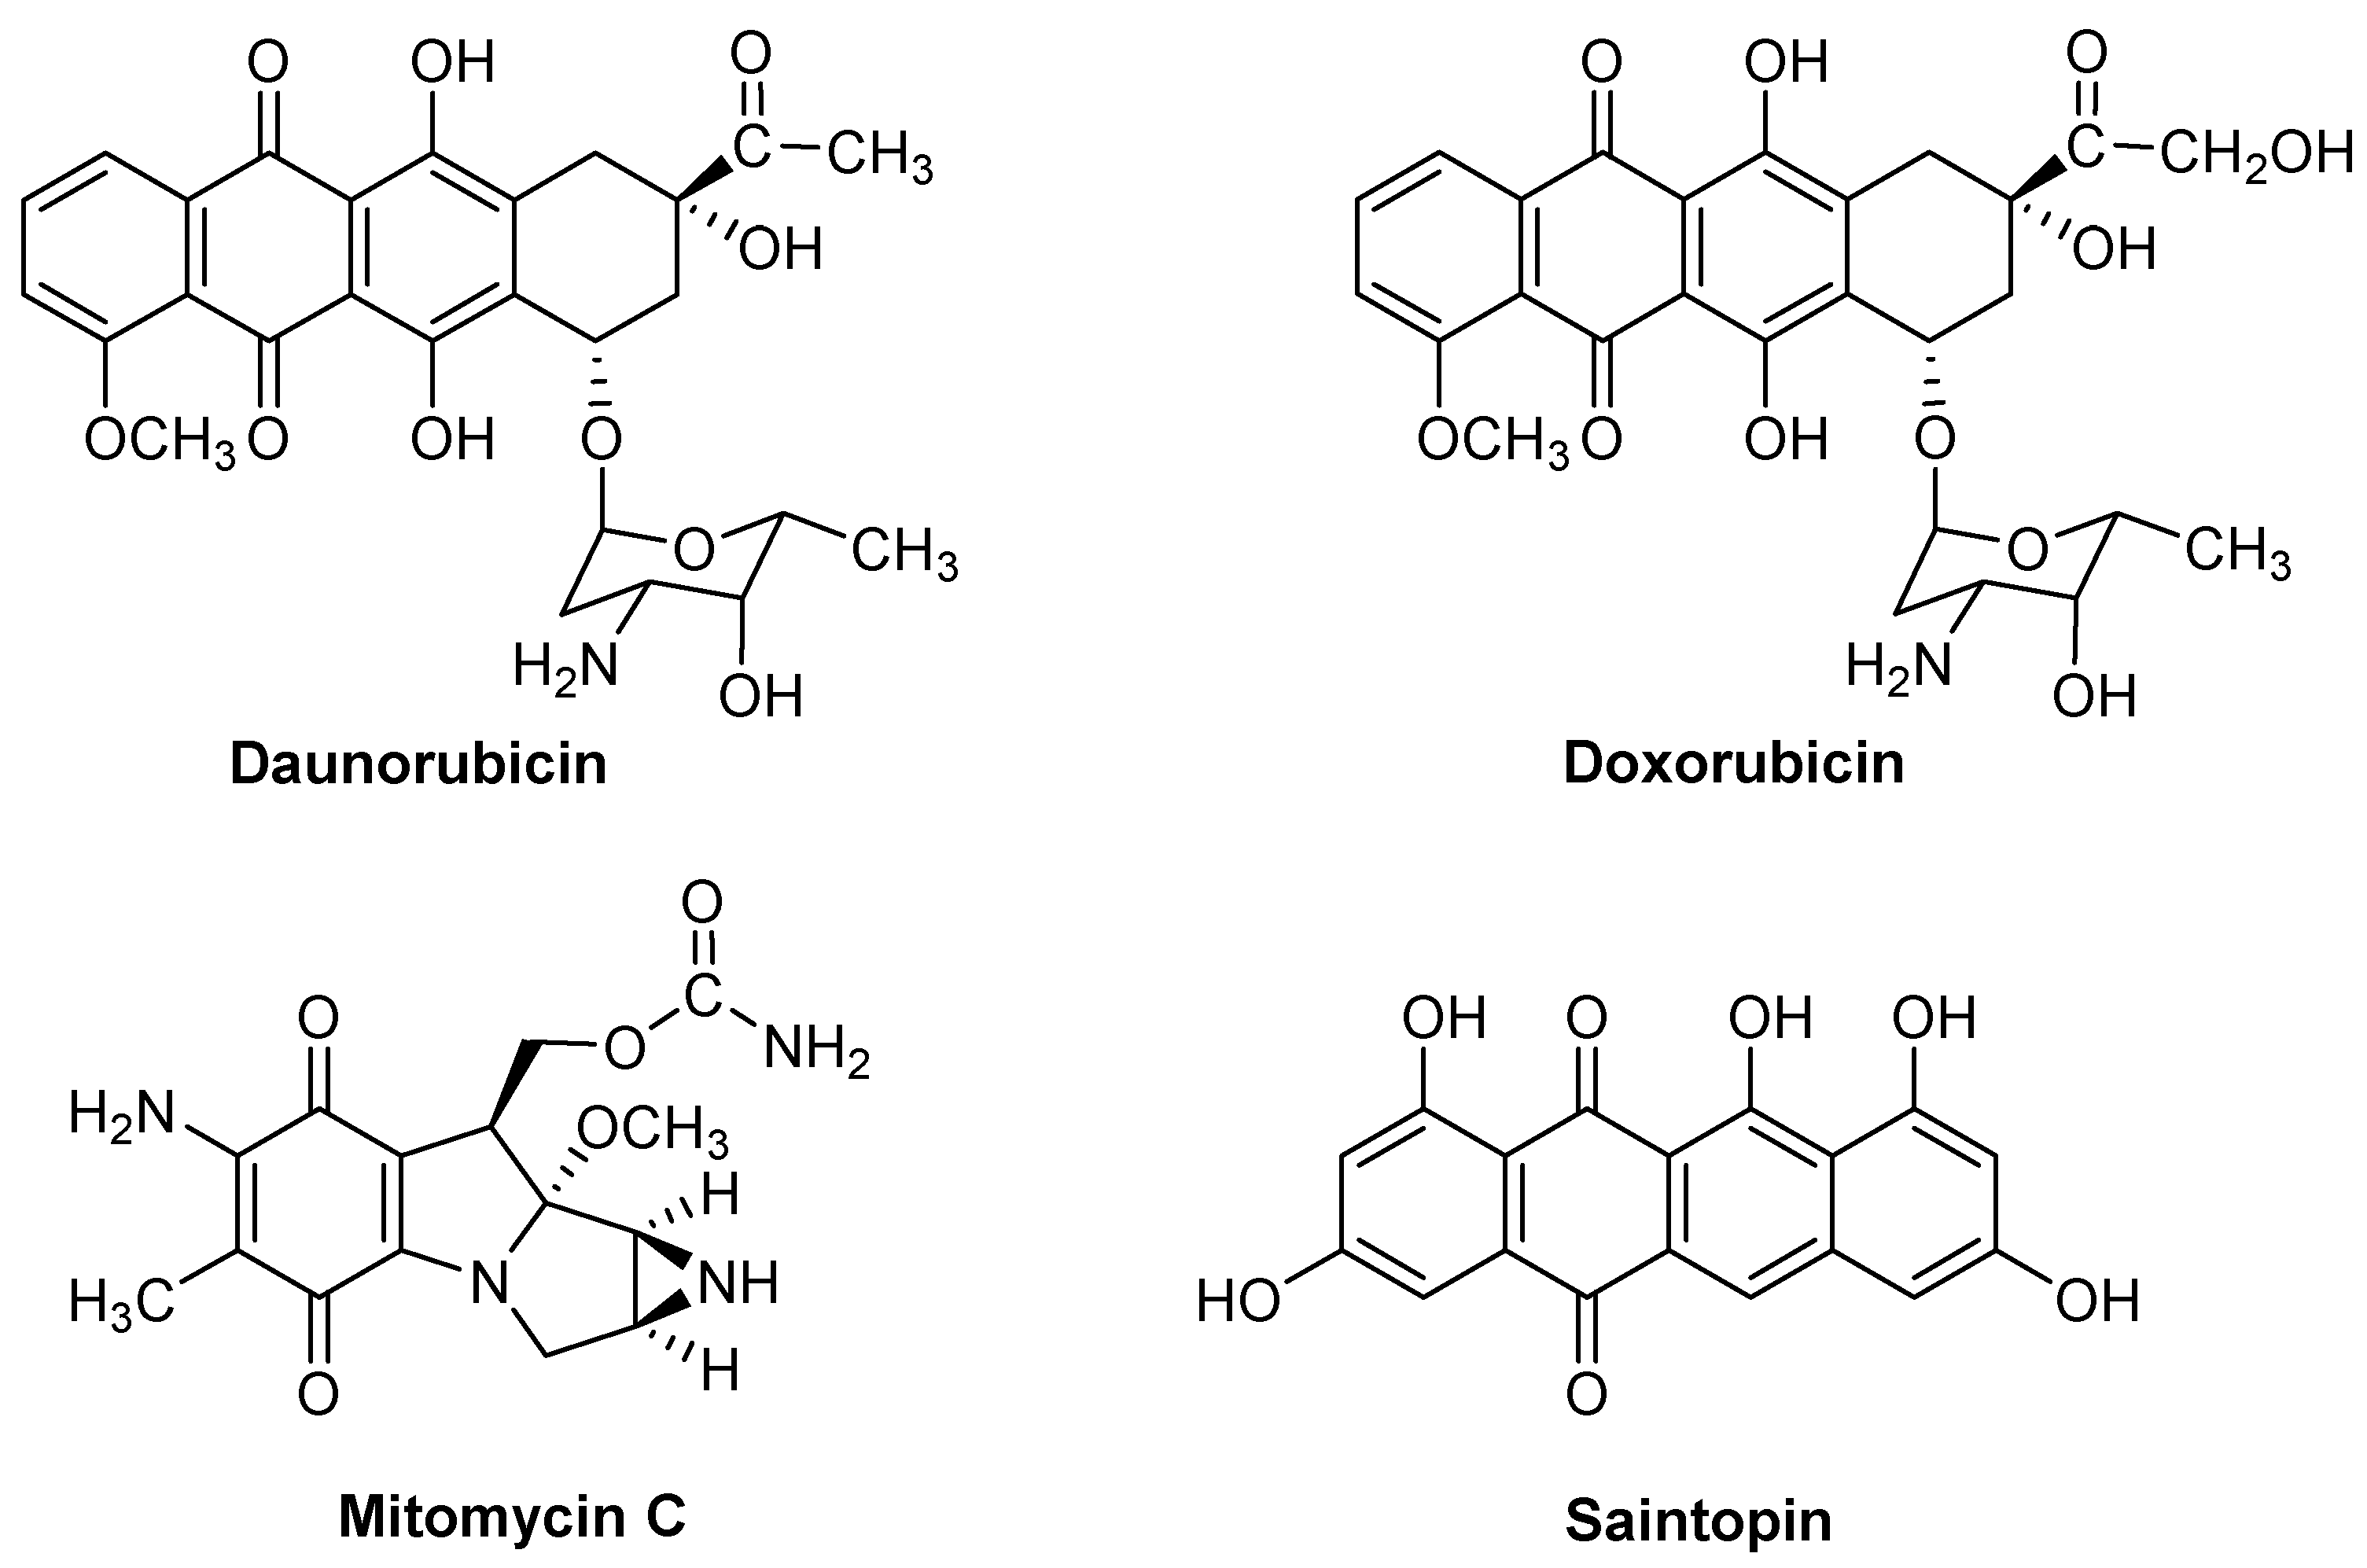
Figure 1. Anticancer drugs structures containing the quinone array.
Preprints 70861 g001
Figure 2. Structure of anticancer 2-phenylamino-1, 4-naphthoquinones and 3-acyl analogues.
Preprints 70861 g002
Figure 3. Molecular Docking visualization for the compounds 4 and 11 bound to mTOR, B2M and Bcl-2. It is shown the surrounding amino acid residues in the binding pocket of proteins within 4.0 Å. The dashed lines indicate attractive interactions. Hydrogen atoms have been removed for clarity.
Preprints 70861 g003
Figure 4. Molecular Docking visualization for the compounds 4 and 11 bound to CDC25A, TNF-α, HDAC4 and GSR. It is shown the surrounding amino acid residues in the binding pocket of proteins within 4.0 Å. The dashed lines indicate attractive interactions. Hydrogen atoms have been removed for clarity.
Preprints 70861 g004
Scheme 1. Access to 2-phenylamino-3-acyl-1,4-naphtoquinones 114.
Preprints 70861 sch001
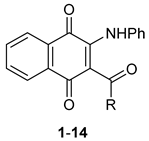
Table 2. IC50 ± SEM (μM) values of 114 on DU-145 (prostate cancer cells), MCF-7 (mammary cancer cells), T24 (Urinary bladder cancer cells) and non-tumorigenic HEK-293 (embryonic kidney cells)*.
Preprints 70861 i001
Compound R DU-145 MCF-7 T24 HEK-293 MSI
1 C5H11 60.89 ± 0.34 62.68 ± 0.53 86.69 ± 2.52 77.32 ± 3.66 1.1
2 C9H19 > 100 > 100 > 100 79.76 ± 9.74 0.8
3 C11H23 > 100 > 100 > 100 > 100 1.0
4 Ph 0.82 ± 0.10 5.16 ± 0.16 15.84 ± 0.90 45.18 ± 6.59 6.2
5 3-MeOPh 10.22 ± 0.95 6.63 ± 0.13 11.96 ± 0.37 30.77 ± 4.07 3.2
6 4-MeOPh 19.52 ± 0.95 11.84 ± 0.54 13.28 ± 0.44 38.93 ± 3.30 2.6
7 3,4-(OMe)2Ph 11.90 ± 0.22 10.61 ± 0.27 15.15 ± 0.88 79.92 ± 10.41 6.4
8 3,4,5-(OMe)3Ph 11.68 ± 0.29 4.88 ± 0.52 7.14 ± 0.20 37.41 ± 1.70 4.7
9 3-OMe-4-OHPh 12.48 ± 0.55 5.81 ± 0.71 13.80 ± 1.87 47.73 ± 3.29 4.5
10 4-MePh 11.11 ± 0.57 14.19 ± 0.53 21.48 ± 2.26 78.83 ± 5.53 5.0
11 2-Furyl 5.45 ± 0.21 4.64 ± 0.23 11.71 ± 0.84 > 100 13.7
12 2-Thienyl 6.97 ± 0.60 4.20 ± 0.06 11.72 ± 0.89 24.80 ± 1.41 3.3
13 3-Thienyl 8.91 ± 0.82 6.37 ± 0.23 13.77 ± 0.58 20.38 ± 2.77 2.1
14 2-Pyrrolyl 14.45 ± 0.25 10.71 ± 0.35 21.66 ± 0.22 13.66 ± 1.36 0.9
DOX 0.93 ± 0.06 0.33 ± 0.05 0.46 ± 0.08 4.27 ± 0.34 7.5
* Cells were incubated at 37 °C for 48 h, with or without quinone derivatives. Afterwards, aliquots of cell suspensions were taken and the MTT test was performed, as described in the Materials and Methods section. Results are expressed as mean values ± SEM (n = 3). DOX = Doxorubicin. Mean selective index: MSI = IC50 values HEK-293 cells/IC50 values tumour cells.
Table 3. Half-wave potentials, calculated lipophilicity and molar refractivity of 2-phenylamino-3-acyl-1,4-naphtoquinones 114.
Preprints 70861 i002
Product No R -EI½ (mV) a ClogP b CMR(cm3/mol) b
1 C5H11 475 2.73 9.96
2 C9H19 480 4.40 11.81
3 C11H23 484 5.23 12.74
4 Ph 695 2.62 10.15
5 3-MeOPh 500 2.50 10.77
6 4-MeOPh 800 2.50 10.77
7 3,4-(OMe)2Ph 604 2.37 11.38
8 3,4,5-(OMe)3Ph 690 2.25 12.00
9 3-OMe-4-OH-Ph 595 2.11 10.92
10 4-MePh 770 3.11 10.61
11 2-Furyl 578 1.24 9.36
12 2-Thienyl 552 2.61 9.96
13 3-Thienyl 635 2.55 9.96
14 2-Pyrrolyl 685 1.17 9.58
a EI½ (mV) were measured by cyclic voltammetry. b ClogP and CMR were calculated by using the ChemBioDraw Ultra 11.0 software.
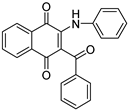
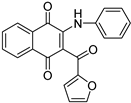
Table 4. Physicochemical, Pharmacokinetic, and Druglikeness properties of compounds 4 and 11 by pkCSM and SwissADME web tool.
Compound
4 11
Structure Preprints 70861 i003 Preprints 70861 i004
Physicochemical parameters MW(g/mol) 353.37 343.33
Rot 4 4
HBA 3 4
HBD 1 1
TPSA 63.24 76.38
Pharmacokinetic parameters Absorption Caco2 permeability (log Papp in 10-6 cm/s) 0.483 0.939
Intestinal absorption (human) (%Absorbed) 94.39 94.324
Skin Permeability (log Kp) -2.774 -2.798
Distribution VDss (human) (log L/Kg) -0.105 0.013
BBB permeability (log BB) 0.059 -0.027
CNS permeability (log PS) -1.738 -1.864
Metabolism CYP2D6 inhibitor No No
CYP3A4 inhibitor Yes Yes
Excretion Total Clearance (log mL/min/Kg) 0.138 0.138
Renal OCT2 substrate No No
Toxicity Oral Rat Acute Toxicity (LD50) (mol/Kg) 2.704 2.779
Oral Rat Chronic Toxicity (log mg/Kg_bw/day) 1.762 1.44
Hepatotoxicity Yes No
Druglikeness properties Lipinski rule Yes; 0 violation Yes; 0 violation
Bioavailability 0.55 0.55
a Optimal range: molecular weight (MW) 150–500; number of rotatable bonds (ᵑRot) ≤ 10; hydrogen-bonded acceptor (HBA) ≤ 10; hydrogen-bonded donor (HBD) ≤ 5; topological polar surface area (TPSA) ≤ 140 Å2. Cut-off values: Caco2 permeability (> 1 × 10⁻⁶ cm/s); high intestinal absorption (>90%); skin permeability (> -2.5 cm/hour); VDss (>-0.15 log L/Kg); BBB permeability (log BB < 0.3); total clearance (> 0.0 log mL/min/Kg).
Table 5. Relative expression levels (mRNA levels) of genes implicated in antiproliferative effects in DU-145 cells treated with compounds 4 and 11, by RT-qPCR and using B2M as reference gene.
Gene name Gene symbol Relative expression levels (mRNA levels) in DU145 cells
Vehicle Compound 4 Compound 11
Apoptosis regulator (Bcl2), transcript variant α Bcl-2 1.00 ± 0.08 0.81 ± 0.05 0.78 ± 0.04
Cell division cycle 25A CDC25A 1.00 ± 0.07 1.09 ± 0.10 0.90 ± 0.05
Cellular communication network factor 2 CCN2 1.00 ± 0.05 0.95 ± 0.03 0.95 ± 0.09
Glutathione-disulfide reductase GSR 1.00 ± 0.07 0.95 ± 0.05 0.94 ± 0.06
Histone deacetylase 4 HDAC4 1.00 ± 0.07 0.91 ± 0.05 0.81 ± 0.07
Mechanistic target of rapamycin kinase mTOR 1.00 ± 0.09 0.84 ± 0.06 0.72 ± 0.05*
Tumor necrosis factor TNF 1.00 ± 0.10 1.20 ± 0.08 0.93 ± 0.08
Tumor protein p53 TP53 1.00 ± 0.07 0.94 ± 0.04 0.87 ± 0.05
The DU145 cells were treated for 24 h with compounds 4 (1µM) and 11 (6 µM) using DMSO at 0.1% as vehicle control group. The mRNA levels were evaluated and normalized to B2M levels and the quantification performed according to the Delta–Delta Ct method (2–∆∆Ct method) respect to vehicle-treated group. Error bars correspond to mean of mRNA levels ± SEM to Bcl2, CDC25A, CCN2, GSR, HDAC4, mTOR, TNF, TP53. *Significant difference (p <0.05) compared to vehicle control.
Table 6. Molecular docking results for compounds 4 and 11. Intermolecular docking energy values (∆Ebinding), Kd values, Ligand Efficiency (LE), and Molecular weight energy (ΔEMW) for the CDC25A, TNF-α, HDAC4, GSR, mTOR, B2M and Bcl-2 complexes.
Docking and Ligand Efficiency Analysis
Protein PDBID Molecule ΔEbind
(kcal/mol)
Kd LE
(kcal/mol)
ΔEMW
(kcal/mol)
CDC25A 1C25 4 -5.2 1.5 × 10⁻⁴ 0.19 -1.0
11 -5.9 4.7 × 10⁻⁵ 0.23 -1.2
TNF-α 2AZ5 4 -9.1 2.1 × 10⁻⁷ 0.34 -1.8
11 -8.4 6.9 × 10⁻⁷ 0.32 -1.6
HDAC4 2VQJ 4 -8.6 5.0 × 10⁻⁷ 0.32 -1.7
11 -8.2 9.8 × 10⁻⁷ 0.32 -1.6
GSR 3DK9 4 -8.7 4.2 × 10⁻⁷ 0.32 -1.7
11 -8.6 5.0 × 10⁻⁷ 0.33 -1.7
mTOR 4JSN 4 -7.7 2.3 × 10⁻⁶ 0.29 -1.5
11 -8.0 1.4 × 10⁻⁶ 0.31 -1.6
B2M 6GK3 4 -3.4 3.2 × 10⁻³ 0.13 -0.7
11 -2.3 2.1 × 10⁻² 0.09 -0.5
Bcl-2 6ZX7 4 -6.9 8.8 × 10⁻⁶ 0.26 -1.3
11 -6.7 1.2 × 10⁻⁵ 0.26 -1.3
* Values are listed as a three-colored scheme from red (high affinity) to green (low affinity).
Table 1. Cartesian coordinates of center grid box for the CDC25A, TNF-α, HDAC4, GSR, mTOR, Bcl-2, B2M and binding site references.
Protein PDBID Center grid box Binding site reference
x y z
CDC25A 1C25 7.26 38.60 64.43 [75,76,77,78,79,80,81,82]
TNF-α 2AZ5 -19.40 74.65 33.84 [61,83,84,85] [36,58,59,60]
HDAC4 2VQJ 19.33 77.30 37.91 [co-crystallized ligand TFG, [86,87,88]
GSR 3DK9 6.80 17.30 20.70 [co-crystallized ligand FAD,[89,90]
mTOR 4JSN 55.48 2.38 -46.53 [91,92,93,94]
Bcl-2 2W3L 39.80 26.93 -12.41 [co-crystallized ligand DRO,[95,96,97,98]
B2M 6GK3 167.59 179.49 157.08 [99]
Disclaimer/Publisher’s Note: The statements, opinions and data contained in all publications are solely those of the individual author(s) and contributor(s) and not of MDPI and/or the editor(s). MDPI and/or the editor(s) disclaim responsibility for any injury to people or property resulting from any ideas, methods, instructions or products referred to in the content.
Copyright: This open access article is published under a Creative Commons CC BY 4.0 license, which permit the free download, distribution, and reuse, provided that the author and preprint are cited in any reuse.
Prerpints.org logo

Preprints.org is a free preprint server supported by MDPI in Basel, Switzerland.

Subscribe

© 2024 MDPI (Basel, Switzerland) unless otherwise stated