
Preprint
Article
Response of C:N:P in the plant-litter-soil system to phosphorus addition and stoichiometric homeostasis of plant tissues in a subtropical slash pine plantation
Altmetrics
Downloads
117
Views
43
Comments
0


This version is not peer-reviewed
Submitted:
11 April 2023
Posted:
12 April 2023
You are already at the latest version
Alerts
Abstract
Plants do need a fixed proportion of carbon (C), nitrogen (N) and phosphorus (P) elements to maintain normal metabolic activities. The P fertilizers are widely used to supplement nutrients in subtropical plantations. Stoichiometric homeostasis reflects the strategy of plants to cope with various environments (including P fertilizer supply rate). It is thus of great significance to understand C:N:P stoichiometry in the plant-litter-soil system under P addition and stoichiometric homeostasis of plant tissues for fertilization management of slash pine (Pinus elliottii Engelm) plantations. We measured the C, N and P contents in root, branch, needle, litter and soil in slash pine plantations fertilized with four treatments - P1 (25 kg P ha−1 yr−1), P2 (50 kg P ha−1 yr−1), P3 (100 kg P ha−1 yr−1), and a control (CK) in subtropical China and calculated stoichiometric homeostasis of plant tissues. Results showed that P addition increased the capacity of needle to obtain C, N and P elements and altered the C:N:P stoichiometry of plant tissues, as well promoted the accumulation of C and P elements in soil, but had no significant effect on soil stoichiometry. The nutrient contents of needle and branch were higher than those of root and litter, indicating that slash pine was more inclined to allocate nutrient to the aboveground tissues. The stoichiometric homeostasis of C, N and P among plant tissues was ranked as follows: root > branch > needle, and homeostasis of nutrient elements in the needle was C > N > P. This indicated that the C, N and P stoichiometric homeostasis was various among plant tissues and elements types under P addition. These findings suggest P addition would alleviate the P limitation of slash pine growth in subtropical regions. In the future, long-term observation experiments should be conducted and the trade-off between P addition rates and economic and ecological benefits should be considered.
Keywords:
Subject: Biology and Life Sciences - Forestry
1. Introduction
Phosphorus (P) is an essential element for plant growth and nutrient absorption, which is involved in the formation of nucleus, cell division and differentiation, flowering and fruiting of plants and other physiological metabolic activities (Liu et al. 2021). However, P is commonly described as the limiting element to forested ecosystems in subtropical China (Hou et al. 2020), because it is often fixed by Fe, Al and Mn oxides and is difficult to be directly used by plants (Turner et al. 2018). Previous studies have suggested that P deposition as dust is a possibility way for new P inputs to mitigate P constraints in many ecosystems (Zhu et al. 2016). However, atmospheric P deposition is considered relatively small. In recent years, P fertilization has become a popular measure to regulate P limitation and increase P supply in plantation forests. However, there is still a trade-off between the amount of P added and its benefits. Excessive P input may cause eutrophication and environmental pollution (Cheng et al. 2018). Therefore, it is urgent to explore the P addition rate suitable for plantation cultivation.
The absorption capacity of plants to nutrients is the basis of their material accumulation and determines the morphogenesis of plants. In particular, the ability of plants to obtain carbon (C), nitrogen (N) and phosphorus (P) is a reflection of plant adaptability to specific environments (Chapin et al. 1980). Ecological stoichiometry is considered as a tool to measure the relationship between the organismic characteristics and the ecosystemic chemical elements (Wang et al. 2020a), so as to understand the adaptability of plants to the changing environments and the limitation of soil nutrient conditions (Elser et al. 2007). C provides a structural basis for plants and is the main element of plant dry matter content (Liu et al. 2011 ). N and P participates in the synthesis of protein and phosphate and provides energy for material transformation in plants. The synergistic effect of C, N and P not only affects the function operation in plants, but also affects the its function in the ecosystem (Zhou and Wang 2021). C:N:P stoichiometry, focusing on the balance and interaction of C, N, P for soil and leaves. On the one hand, soil C:N:P stoichiometry reflects soil fertility and regulates plant growth and nutrient status (Bui et al. 2013). Meanwhile, the ratio of soil C:N:P varied with substrate input in forest. On the other hand, the C:N:P ratio of leaves varies extensively (Elser et al. 2000), and N:P ratio of leaves indicated the limitation of N and P in the ecosystem (Zhang et al. 2019). However, scholars have paid more attention to stoichiometry on leaves and less on roots and branches, due to the limitation of sampling methods, and the specific driving mechanism and the interaction between plant and soil stoichiometry have not been revealed. Moreover, how P addition affects the distribution of C, N and P in plant-litter-soil system in the P limited areas remains to be elucidated.
Stoichiometric homeostasis, the core concept of ecological stoichiometry, is the characteristics of organisms to respond the changing environmental conditions by regulating the concentrations and ratios of chemical elements and maintaining the relatively stable chemical composition (Sterner and Elser, 2002). It is helpful to understand the adaptation strategies of organisms to the changes of living environments (Yu et al., 2011). Stoichiometric homeostatic coefficient (H), as a continuously variable regulation parameter, is used to quantify the strength of stoichiometric homeostasis of organisms (Sterner and Elser, 2002). The greater value of plant H implies that the nutrients ratio of plant is more stable (Wang et al., 2018). Hence, it is feasible to predict the response of plants to nutrient environments by stoichiometric homeostasis, which also provides a basis for fertilization of plantations (Peng et al., 2016). The studies on stoichiometric homeostasis often regard the leaves, soil and microorganisms as a whole system to analyze their relationships, ignoring the contribution of branch, root and litter to the stoichiometric homeostasis. In fact, the homeostasis of plants tissues in response to external changes is different (Su and Shangguan, 2022). Meanwhile, many studies are based on the effect of N addition or N and P additions on plant nutrients (Wang et al., 2018), there is little information to reflect the relationship among plant tissues, litter and soil and their homeostasis under single P addition. Therefore, it is necessary to systematically analyze the stoichiometric homeostasis of plant organs (root-branch-leaf), litter and soil under P supply conditions.
The slash pine (Pinus elliottii Engelm), the fast-growing afforestation tree specie in southern China, was selected for our study. Plant tissues (including needle, branch and root), litter and soil samples were sampled to explore C, N, P contents, stoichiometry and stoichiometric homeostasis under P addition in a subtropical slash pine plantations. Here, two hypotheses were proposed: (1) the C, N, and P contents and stoichiometric ratios have different trends in the plant-litter-soil system in response to variable P addition in slash pine plantation; (2) stoichiometric homeostasis characteristics of plant and litter with soil differs among plants tissues and element types. Overall, this study about the effects of P addition on the C, N and P stoichiometry in plant-litter-soil system and stoichiometric homeostasis of plant tissues may provide a basis for fertilization management of slash pine plantations.
2. Materials and methods
2.1. Study site
The experiment was conducted at the Shixi forest farm (26°43' N, 115°6' E) located in Jiangxi Province in southeastern China, with a mean altitude of 80–120 m and an average slope of 0%–8%. Study site is a typical low mountain hilly landform with red soil (pH=4.73) and characterized by a obvious subtropical moist monsoon climate with a mean annual precipitation and air temperature of approximately 1489 mm and 17.9℃, respectively. The content of soil organic C, total N, total P and total potassium (K) are 10.19 g kg-1, 1.06 g kg-1, 0.50 g kg-1 and 2.45 g kg-1, respectively. The slash pine plantation was planted in 2008 at the spacing of 2 m × 3 m and had an average tree height and diameter at breast height (DBH) of about 11.19 m and 13.66 cm, respectively. There were some shrubs e.g. Rosa laevigata, Smilax china and herbs e.g. Dicranopteris linearis, Cyclosporus interruptus, Woodwardia japonica under the forest, with the coverage between 5% to 8%.
2.2. Experimental design
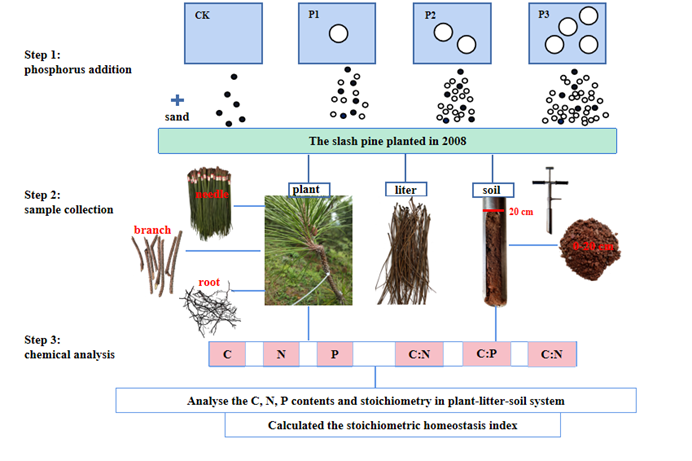
In December 2017, a fertilisation experiment was established in a slash pine plantation using a randomised complete block design with four replications. In each block, four plots of 20 m × 20 m were randomly arranged with the following treatments: P1 (25 kg P ha−1 yr−1), P2 (50 kg P ha−1 yr−1), P3 (100 kg P ha−1 yr−1), and the control (CK, without P addition). The plots were separated by a buffer zone of at least 20 m. The fertiliser was mixed with clean and dry fine sand and applied to each plot on non-rainy days two times each year (in June at 50% and December at 50%). P fertiliser was added as NaH2PO4·2H2O. Sixteen 5 m × 5 m plots were divided from each of the 20 m × 20 m quadrats to ensure an average fertiliser distribution (Chen et al., 2015). The spatial distribution of the plots and sampling methods in this study were shown in Figure 1.
2.3. Sample collection
The number of individuals, the diameter at breast height (DBH) and tree height (H) of all trees in the sixteen plots were measured in July 2020. The average number of trees under the CK, P1, P2 and P3 treatments was 59, 61, 61 and 60, respectively. Five standard trees without diseases and insect pests were selected based on the average DBH and height in each plot to collect samples. The needle and branch samples from the middle of the crowns were collected with the 20 m high retractable pruning shear. Root samples were dug from a 10 cm deep soil layer and consisted entirely of fine roots < 2 mm. In addition, the litter samples were obtained under the canopies of five standard trees within each plot. After the litter layer was removed, soil samples at 0-20 cm depth were collected using 50 mm diameter soil cores in each plot. A total of 400 samples were obtained. In the laboratory, plant samples were killed at 115 ℃ for half an hour and dried to constant weight at 60 ℃ in an oven. Soil samples were air-dried and removed debris and gravels. Then all samples were crushed and screened through the 1 mm screen to measure the C, N and P contents.
2.4. Chemical analysis
Plant and soil samples were digested with H2SO4-H2O2, the Kjeldahl method was used to measure the total nitrogen (TN); the total phosphorus (TP) content were determined by molybdenum antimony colorimetry and the total organic matter (TOC) was analyzed by the potassium dichromate-oxidation external heating (by oil bathing) method (Allen 1989). Finally, the stoichiometry was calculated according the ratio of the C:N:P.
2.5. Statistical analyses
The stoichiometric homeostasis index (H) is calculated as follows (Sterner and Elser, 2002):
In formula, H represents the homeostasis index, the independent variable x corresponds to the C, N, P contents and their stoichiometry of soil, the dependent variable y corresponds to the C, N, P and their stoichiometry of needle, branch, root and litter. The c represents the fitting constant. One-tailed tests with α = 0.1 were used. If the regression was non significant (p > 0.1), the organism was considered to be ‘strictly homeostatic’. If the regression relationship is significant (p < 0.1), species with 1/H=1 were considered not homeostatic. All datasets with significant regressions and 0 < H < 1 were categorized as: 0 < 1/H < 0.25: ‘homeostatic’; 0.25 < 1/H < 0.5: ‘weakly homeostatic’; 0.5 < 1/H < 0.75: ‘weakly plastic’; 1/H > 0.75 : ‘plastic’. For 1/H > 1, 1/H close to 1 indicates weak or no stoichiometric homeostasis, and 1/H much larger than 1 indicates ‘homeostatic’.
One-way analysis of variance, followed by multiple least significant different comparisons, was used to examine the effects of P addition on the C, N, P contents and their stoichiometry in the plant-litter-soil system. Pearson correlation method was used to determine the relationship among plant, litter and soil on the C, N, P contents and stoichiometry. Principal component analysis (PCA) was conducted using Canoco 5.0. Linear regression analyses were performed to establish the correlation and significance of relationships of plant, litter and soil stoichiometric homeostasis. All the results reported were significant at the 0.05 level. All the data were analyzed by SPSS 20.0 (SPSS Inc., Chicago, USA). All figures were mapped with Origin Pro 2018 (Origin Lab Corporation).
3. Results
3.1. The C, N, P contents and stoichiometry of plant tissues
For the content of C, P3 treatment only increased the C content of needle (p < 0.05). The N content of branch, needle and litter, and the P content of branch and needle with the P3 treatment were higher than those of the other treatments. The N content of root and the P content of litter with the P2 and P3 treatments were higher than those of the P1 and CK. In addition, the C:N ratio of root with the P2 and P3 treatments (98.77, 96.93, respectively) were lower than those of the CK and P1 treatments (132.55 and 134.08), while the N:P ratio (11.89, 11.74, respectively) were higher than those of CK and P1 treatments (9.51 and 9.14) (Figure 2).

Table 1.
Variance analysis for treatments and organs on C, N, P and stoichiometry.
| Source of variation | Treatments | Organs | Treatments×Organs | ||||||||
|---|---|---|---|---|---|---|---|---|---|---|---|
| df | F | p | df | F | p | df | F | p | |||
| C | 3 | 1.48 | 0.23 | 3 | 10.88 | 0.00 | 9 | 0.13 | 1.00 | ||
| N | 3 | 21.46 | 0.00 | 3 | 332.48 | 0.00 | 9 | 3.11 | 0.01 | ||
| P | 3 | 22.08 | 0.00 | 3 | 479.34 | 0.00 | 9 | 4.25 | 0.00 | ||
| C:N | 3 | 9.43 | 0.00 | 3 | 56.34 | 0.00 | 9 | 2.70 | 0.01 | ||
| C:P | 3 | 2.85 | 0.05 | 3 | 220.86 | 0.00 | 9 | 1.45 | 0.20 | ||
| N:P | 3 | 11.03 | 0.00 | 3 | 326.15 | 0.00 | 9 | 8.14 | 0.00 | ||
Note: The bold values indicate the non-significant differences.
The C, N, P contents and their stoichiometry varied among organs (p < 0.05) (Table 2). According to the mean values of treatments (Figure 2), the C and N contents of needle were the highest followed by branch then root and litter. The P content varied from 0.25 g kg-1 to 0.78 g kg-1 with needle > root > litter > branch. The C:N ratio of needle ranged from 61.64 to 65.21 and was lower than other tissues. And the C:P ratio of branch was 2.86, 2.30 and 2.13 times higher than that of needle, root and litter, respectively. The N:P ratio of branch was higher than needle and followed by litter (p < 0.05).
3.2. The C, N, P contents and stoichiometry of soil
With the increase of P addition level, the C, N, P contents and the C:N ratio of soil all showed an upward trend. Especially, compared with CK treatment, P3 treatment increased the contents of C and P (p < 0.05). However, soil N, the C:N, C:P and N:P ratios showed no significant difference among different treatments (p > 0.05). The C:P ratio of soil was the highest with P2 treatment for 18.04. The C:N ratio was the highest for 14.13 while the N:P ratio was the lowest for 1.29 with the P3 treatment (Table 2).
3.3. Relationships of C, N, P contents and stoichiometry in the plant-litter-soil system
Overall, the contents of C, N, P in branch and needle were positively correlated with the C, N, P contents of soil (Figure 3). Specifically, the N, P contents of needle positively correlated with the C, P contents of soil. In addition, the relationship between the C:N:P ratios of litter and needle and the C, N, P contents of soil were negatively correlated. The principal component analysis (PCA) showed that the N, P contents of needle and litter were correlated with the C, P contents of soil in plant-litter-soil system with the P2 and P3 treatments. Moreover, the soil N had a positive influence on the needle N content (Figure 4A). The C:P and N:P ratios of litter were positively correlated with the C:P and N:P ratios of needle, While the C:N and N:P ratios of root were negatively correlated with the C:N and N:P ratios of branch (Figure 4B).
3.4. The stoichiometric homeostasis
The C of needle, root and litter, the N of branch, root and litter, the P of root, the C:N ratio of branch and litter, the C:P ratio of root, needle and litter, and the N:P ratio of all tissues were categorized as “strictly homeostasis” (p > 0.1) (Figure 5). The root C:N ratio showed no homeostasis with 1/H = 1.06 (p < 0.1). Moreover, the P of needle and the C:P ratio of branch were “weakly plastic” with 1/H of 0.74 and 0.65, respectively. The homeostasis of litter P was 0.86 and identified as “plastic”. The HN, HC:N of needle, and HC, HP of branch ranged from 0.31-0.39. So they were also classified as “weakly homeostatic” (p < 0.1).
4. Discussion
4.1. The C, N, P contents and stoichiometry in the plant-litter-soil system
The C, N and P contents of plant tissues reflect the capacity of plants to absorb and store nutrients (Zhen 2014), as well reflect the distribution strategy of nutrients among organs when plants respond to various soil environment (Li 2019). As the activity center of photosynthesis, the nutrient content of leaves is always concerned. In this study, the average contents of C, N and P in needle were 649.59 g·kg-1, 10.31 g·kg-1, 0.77 g·kg-1, respectively, Which were the highest than other tissues. Needles are often considered a source organ (Chapin III et al., 1990), carbohydrates and proteins containing C, N, P elements produced by photosynthesis are temporarily stored in needles to maintain cellular metabolic activities (Piper, 2011). In addition, the branch C (616.60 g·kg-1) and N (5.95 g·kg-1) contents were higher than those in root, indicating that pines were more inclined to allocate nutrients to aboveground tissues. Root transport nutrient to needle along the trunk and branch after absorbing nutrient from the soil, providing sufficient nutrient for photosynthesis. This is in line with the principle of priority distribution of nutrient (Dietze et al., 2014), that is, plants prefer to allocate more nutrient to tissues in need. The litter C (551.41 g·kg-1) and N (4.28 g·kg-1) content were much lower than those in other plant tissues. This seems to be caused by the nutrient return strategy of plants. The litter transferred its own nutrient to other tissues before aging and falling (Würth et al., 2005). Simultaneously, the litter provided abundant carbon sources for soil microorganisms, which accelerated the decomposition of nutrient, and finally returned the decomposed nutrient to the soil (Cotrufo et al., 2015). The complex strategy of nutrient allocation among plant tissues is beneficial for plants to adapt the changing environment.
Plant ecological stoichiometry emphasizes the relationship among the main elements C, N and P of plants (Coile 1934), reveals the adjustment mechanism of nutrient proportion in the plant-litter-soil system. The C:N and C:P ratios of needle were 61.64-65.21 and 801.82-976.95, respectively, which were higher than the average level (40.40, 728.00) of coniferous forests in subtropical regions (Wang et al., 2011). This result indicated that Pinus elliottii in the study area has a stronger ability to assimilate C than other conifer species. Compared with the CK, P2 and P3 treatments reduced the C:N ratios of root and litter, which seems to be the P2 and P3 addition level accelerate the transport of C element from root to other tissues and expedite the decomposition of C element in litter. The N:P ratio of leaves was used as an indicator to measure the demand for N and P of ecosystem (He et al., 2008). In this study, the C:P and N:P ratios of needle were 801.82-976.95 and 13.13-15.25, respectively, which decreased gradually with the increase of P addition level. The plant growth rate hypothesis (Yu et al., 2012) suggests that plant adapt to their own growth rate by regulating the distribution of C:N:P during growth and development. Generally, the growth rate is negatively correlated with C:P and C:N ratios (Yu et al., 2012). The results of this study were consistent with this hypothesis, because the positive correlation between growth rate and P addition level has been confirmed in our unpublished studies. According to the N:P threshold hypothesis (Koerselman et al., 1996), it was judged that the P limitation of Pinus elliottii plantation was alleviated with the increase of P addition level. However, the factors affecting plant N:P ratio are complex (Sabine et al., 2004), and it is unreliable to evaluate the limiting elements in plant growth with a single index. The limiting elements of the ecosystem should be determined by a long-term experiment combined with soil environmental conditions and the ability of nutrient absorption of other associated tree species.
The mean values of soil C, N and P contents under different treatments were 12.88 g·kg-1, 0.99 g·kg-1 and 0.75 g·kg-1, respectively. The C and P contents were higher than the national average (11.12 g·kg-1, 0.65 g·kg-1), and the N content was lower than the national average (1.06 g·kg-1) (Tian et al., 2010). In addition, with the increase of P addition level, the contents of soil C and P increased gradually, indicating that P addition promoted the accumulation of C and P element in soil. The stoichiometric ratio of soil be used to evaluate the soil quality (Fan et al., 2015). Our results showed that the average value of C:N ratio was 13.37, which was higher than the national average level (11.09) (Tian et al., 2010), indicating that the soil N mineralization ability was strong in the study area. The soil C:P (17.74) was much lower than the national average (61.00) (Tian et al., 2010). We speculate that the results are related to our research object. We selected the slash pine in the middle-aged forest stage, which is in the stage of rapid growth. The activity of soil microorganisms at this stage is relatively complex and can release more P element from organic matter.
In addition, the stoichiometric ratio of soil is a very complex concept and is also affected by many factors (Wang et al., 2018). For example, the type of tree species, and the age of trees and the fungi:bacteria ratio were the important determinate of soil C:N:P stoichiometry (Bai et al., 2019; Jia et al., 2023; Zhao et al., 2018). Our results showed that the response of the soil C:N:P stoichiometry towards P addition did not change significantly with the P application rates, which indicated that the P addition effects on soil C:N:P stoichiometry show stability across various treatments and the same climatic conditions. This agrees well with the strategy of soil C:N:P stoichiometry toward drought (Su and Shangguan, 2022). Moreover, this result may be due to the short duration of the experiment, and the effect of P addition on soil environmental improvement is not obvious. In the future, long-term observation experiments should be carried out to understand the improvement effect of P addition on soil C:N:P stoichiometry.
4.2. Stoichiometric homeostasis of plant tissues
In response to changes in the soil nutrient environment, plant tissues maintain the stability of chemical composition in its body through homeostasis regulation (Yu et al., 2011). This process is thought to have complex regulatory mechanisms that change with tree species and tree ages (Bai et al., 2019). Our results showed that the stoichiometric homeostasis of elements and stoichiometric ratios are various among plant tissues, which means that there is a trade-off between nutrient uptake and distribution (Gu et al., 2017). This verifies our second hypothesis that stoichiometric homeostasis characteristics of plant and litter with soil differs among plants tissues and element types. In the study, the C, N and P contents of root were defined as “strictly homeostasis”, and the root were more stable than branch and needle, indicating that the root of slash pine had stronger C, N and P homeostasis in response to P addition, while the flexible homeostasis of the needle was easier to identify the absorption and limitation of nutrients. This seems to be the reason why scholars usually use leaf stoichiometry to determine nutrient limiting elements. However, different from our previous results (Jia et al., 2023), roots have worse homeostasis than branches and leaves in response to different age states. It is verified again that the homeostasis of plant tissues is not only related to the environment of soil nutrients, but also affected by the growth stage of trees.
As the main organ of photosynthesis in pines, the needle is important for the tree growth and the accumulation of biomass (Wang et al., 2018), thus its nutrient content is limited to a certain range to provide the best physiological traits for organisms (Aerts and Chapin, 2000). In this study, the order of C, N and P homeostasis in the needle was C > N > P, and the P homeostasis of needle was “weakly plastic”. This mechanism of homeostasis seems to be determined by the distribution characteristics of elements in organisms. The C content constitutes the plant skeleton in vivo with the most stable distribution. The P is a limiting element in the subtropical region of southern China, the P content in needle is more active when dealing with P addition. Meanwhile, it shows that the homeostasis of elements with more content in the organism is higher than that of the elements with less content.
Compared with C, N or P alone, the C:N:P stoichiometric homeostasis can better reflect the nutrient consumption and nutrient storage capacity during plant growth (Blouin et al., 2012). In the present study, except for the C:P of branch and the C:N of needle and root, the C:N:P stoichiometric homeostasis in other tissues were characterized as “strictly homeostatic”. Specially, the N:P homeostasis in all tissues were “strictly homeostatic”. This may be because the N:P is an important indicator of nutrient limitation in plant growth (Tian et al., 2021). Only when soil nutrient elements are scarce, the N:P ratio of plant tissues will fluctuate greatly and show poor homeostasis. In addition, the high N:P homeostasis in plant tissues also reflected that the nutrient limitation was relatively stable under the condition of P addition in this study area.
5. Conclusions
This study comprehensively explored the C, N and P contents and stoichiometry in the plant-litter-soil system under P addition and stoichiometric homeostasis of plant tissues in subtropical slash pine plantations. The results suggested that P addition (especially P3 treatment) increased the C, N and P contents of needle and the N content of litter. P2 and P3 treatments reduced the C:N ratio of root while increased the P content of litter and the N:P ratio of root. In addition, P addition promoted the accumulation of C and P elements in soil, but had no significant effect on its stoichiometry. This indicated that the C, N and P contents and stoichiometry in plant-litter-soil system showed different trends under P addition. The nutrient contents of needle and branch was higher than those of root and litter, indicating that slash pine was more inclined to allocate nutrient to the aboveground tissues. The C, N and P contents and stoichiometric homeostasis among plant tissues was ranked as: root > branch > needle, which indicated needle is more sensitive response to soil environment compared with root and branch. Except for the “plastic” of P homeostasis, the stoichiometric homeostasis of other indicators were “strictly homeostasis” in litter. The homeostasis of nutrient elements in needle was C > N > P, the N homeostasis of branch was greater than that of C and P, and the P homeostasis of litter was less than that of C and N. The above findings indicated that the C, N and P content and stoichiometric homeostasis of plant-litter was various among plant tissues and elements types when responding to P addition.
Author Contributions
Lu Zhang conceived the idea, designed the experiment, and authored or reviewed drafts of the paper; Ting Jia performed the experiment, analysed the data, prepared figures and tables, and wrote drafts of the paper. Min Yi and Fusheng Chen optimised the details of the experiment and modified the manuscript. Zixuan Nie, Linjin Zhou and Jinwen Xie took responsibility for the sampling collection. Meng Lai modified the manuscript.
Funding
This study was financially supported by the National Key R&D Program of China during 13th Five-Year Period (2017YFD0600502-5) and the Jiangxi Forestry Science and Technology Innovation Project (201811)
Acknowledgments
We are grateful to 2011 Collaborative Innovation Center of Jiangxi Typical Trees Cultivation and Utilization; Jiangxi Provincial Key Laboratory of Silviculture; College of Forestry, Jiangxi Agricultural University.
Declaration of interests
The authors declare that they have no known competing financial interests or personal relationships that could have appeared to influence the work reported in this paper.
Abbreviations
C; carbon; H; homeostatic coefficient; K; potassium; N; nitrogen; P; phosphorus; C:N; the ratio of carbon to nitrogen; C:P; the ratio of carbon to phosphorus; N:P; the ratio of nitrogen to phosphorus.
References
- Aerts, R.; Chapin III, F.S. The mineral nutrition of wild plants revisited: a reevaluation of processes and patterns. Adv. Ecol. Res. 2000, 30, 1–67. [Google Scholar]
- Bai, X.; Wang, B.; An, S.; Zeng, Q.; Zhang, H. Response of forest species to C:N:P in the plant-litter-soil system and stoichiometric homeostasis of plant tissues during afforestation on the Loess Plateau, China. Catena 2019, 183, 104–186. [Google Scholar] [CrossRef]
- Blouin, M.; Mathieu, J.; Leadley, P.W. Plant homeostasis, growth and development in natural and artificial soils. Ecol. Complex 2012, 9, 10–15. [Google Scholar] [CrossRef]
- Bui, E.N.; Henderson, B.L. C:N:P stoichiometry in Australian soils with respect to vegetation and environmental factors. Plant Soil 2013, 373, 553–568. [Google Scholar] [CrossRef]
- Chapin III, F.S. The mineral nutrition of wild plants. Annu. Rev. Ecol. Syst. 1980, 11, 233–260. [Google Scholar] [CrossRef]
- Chapin III, F.S.; Schulze, E.; Mooney, H.A. The ecology and economics of storage in plants. Ann. Rev. Ecol. Syst. 1990, 21, 423–447. [Google Scholar] [CrossRef]
- Chen, F.S.; Niklas, K.J.; Liu, Y.; Fang, X.M.; Wan, S.Z.; Wang, H.M. Nitrogen and phosphorus additions alter nutrient dynamics but not resorption efficiencies of Chinese fir leaves and twigs differing in age. Tree Physiol. 2015, 35, 1106–1117. [Google Scholar] [CrossRef]
- Cheng, Y.T.; Li, P.; Xu, G.C.; Li, Z.B.; Gao, H.D.; Zhao, B.H.; Wang, T.; Wang, F.C.; Cheng, S.D. Effects of soil erosion and land use on spatial distribution of soil total phosphorus in a small watershed on the Loess Plateau, China. Soil Till. Res. 2018, 184, 142–152. [Google Scholar] [CrossRef]
- Cotrufo, M.F.; Soong, J.L.; Horton, A.J.; Campbell, E.E.; Haddix, M.L.; Wall, D.H.; Parton, W.J. Formation of soil organic matter via biochemical and physical pathways of litter mass loss. Nat. Geosci. 2015, 8, 776–779. [Google Scholar] [CrossRef]
- Dietze, M.C.; Sala, A.; Carbone, M.S.; Czimczik, C.I.; Mantooth, J.A.; Richardson, A.D.; Vargas, R. Nonstructural carbon in woody plants. Annu. Rev. Plant Biol. 2014, 65, 667–687. [Google Scholar] [CrossRef]
- Elser, J.J.; Fagan, W.F.; Denno, R.F.; Dobberfuhl, D.R.; Folarin, A.; Huberty, A.; Interlandi, S.; Kilham, S.S.; McCauley, E.; Schulz, K.L.; Siemann, E.H.; Sterneret, R.W. Nutritional constraints in terrestrial and freshwater food webs. Nature 2000, 408, 578–580. [Google Scholar] [CrossRef]
- Elser, J.J; Hamilton, A. Stoichiometry and the new biology: the future is now. PLoS Biol. 2007, 5, e181. [Google Scholar] [CrossRef]
- Fan, H.B.; Wu, J.P.; Liu, W.F.; Yuan, Y.H.; Hu, L.; Cai, Q.K. Linkages of plant and soil C: N: P stoichiometry and their relationships to forest growth in subtropical plantations. Plant Soil 2015, 392, 127–138. [Google Scholar] [CrossRef]
- Gu, Q.; Zamin, T.J.; Grogan, P. Stoichiometric homeostasis: a test to predict tundra vascular plant species and community-level response to climate change. Arct. Sci. 2017, 3, 320–333. [Google Scholar] [CrossRef]
- He, J.S.; Wang, L; Flynn, D.F.B.; Wang, X.P.; Ma, W.H.; Fang, J.Y. Leaf nitrogen: phosphorus stoichiometry across Chinese grassland biomes. Oecologia 2008, 155, 301–310. [Google Scholar] [CrossRef]
- Hou, E.Q.; Luo, Y.Q.; Kuang, Y.W.; Chen, C.R.; Wen, D.Z. Global meta-analysis shows pervasive phosphorus limitation of above ground plant production in natural terrestrial ecosystems. Nat. Commun. 2020, 11, 1–9. [Google Scholar] [CrossRef]
- Koerselman, W.; Meuleman, A.M.F. The vegetation N:P ratio: a new tool to detect the nature of nutrient limitation. J. Appl. Ecol. 1996, 33, 1441–1450. [Google Scholar] [CrossRef]
- Li, Y.H. Stoichiometric characteristics of different aged Pinus sylvestris Var. mongolica plantations. Liaoning University of Engineering and Technology 2019. [Google Scholar]
- Liu, R.; Zhao, H.; Zhao, X.; Drake, S. Facilitative effects of shrubs in shifting sandon soil macrofaunal community in Horqin Sand Land of Inner Mongolia, Northern China. Eur. J. Soil Biol. 2011, 47, 316–321. [Google Scholar] [CrossRef]
- Liu, X.; Wang, T.; Song, J.C. Effects of different application amont of phosphorus fertilizer on olive growth and rhizosphere soil micro environment. Chinese Soil and Fertilizer 2021, 11, 1–13. [Google Scholar]
- Peng, H.; Chen, Y.; Yan, Z.; Han, W. Stage-dependent stoichiometric homeostasis and responses of nutrient resorption in Amaranthus mangostanus to nitrogen and phosphorus addition. Sci. Rep. 2016, 6, 37219. [Google Scholar] [CrossRef]
- Piper, F.I. Drought induces opposite changes in the concentration of non-structural carbohydrates of two evergreen Nothofagus species of differential drought resistance. Ann. For. Sci. 2011, 68, 415–424. [Google Scholar] [CrossRef]
- Sabine, G. N:P ratios in terrestrial plants: variation and functional significance. New Phytol. 2004, 164, 243–266. [Google Scholar]
- Sterner, R.; Elser, J. Ecological stoichiometry: the biology of elements from molecules to the biosphere. Princeton University Press 2003, 25, 1183. [Google Scholar]
- Su, B.; Shangguan, Z. Stoichiometric homeostasis in response to variable water and nutrient supply in a robinia pseudoacacia plant-soil system. J. Plant Ecol. 2022, 15, 991–1006. [Google Scholar] [CrossRef]
- Tian, H.Q.; Chen, G.S.; Zhang, C.; Melillo, J.M.; Hall, C. Pattern and variation of C:N:P ratios in China’s soil: a synthesis of observational data. Biogeochemistry 2010, 98, 139–151. [Google Scholar] [CrossRef]
- Turner, B.L.; Brenes-Arguedas, T.; Condit, R. Pervasive phosphorus limitation of tree species but not communities in tropical forests. Nature 2018, 555, 367–370. [Google Scholar] [CrossRef]
- Wang, J.Y.; Wang, J.N.; Guo, W.H.; Li, Y.G.; Geoff, G.; Wu, T.G. Stoichiometric homeostasis, physiology, and growth responses of three tree species to nitrogen and phosphorus addition. Trees 2018, 32, 1377–1386. [Google Scholar] [CrossRef]
- Wang, P.A.; Ren, X.M.; Bao, F.J. Analysis of soil stoichiometric characteristics and soil physical and chemical properties of different forests in Guandi Mountain. Journal of Shanxi Agricultural Sciences 2020, 48, 956–963. [Google Scholar]
- Wang, S.Q.; Li, R.L.; Yan, J.H.; Sha, L.Q.; Han, S.J. C:N:P stoichiometric characteristics of four forest types’ dominant tree species in China. Chinese Journal of Plant Ecology 2011, 35, 587–595. [Google Scholar]
- Würth, M.K.; Pelaez-Riedl, S.; Wright, S.J.; Körner, C. Non-structural carbohydrate pools in a tropical forest. Oecologia 2005, 143, 11–24. [Google Scholar] [CrossRef] [PubMed]
- Yu, Q.; Elser, J.J.; He, N.P.; Wu, H.H.; Chen, Q.S.; Zhang, G.M.; Han, X.G. Stoichiometric homeostasis of vascular plants in the Inner Mongolia grassland. Oecologia 2011, 166, 1–10. [Google Scholar] [CrossRef]
- Yu, Q.; Wu, H.; He, N.; Lü, X.T.; Wang, Z.P.; Elser, J.J.; Wu, J.G.; Han, X.G. Testing the growth rate hypothesis in vascular plants with above- and below-ground biomass. PLoS One 2012, 7, e32162. [Google Scholar] [CrossRef] [PubMed]
- Zhang, W.; Liu, W.C.; Xu, M.P.; Deng, J.; Han, X.H.; Yang, G.H.; Feng, Y.Z.; Ren, G.X. Response of forest growth to C:N:P stoichiometry in plants and soils during Robinia pseudoacacia afforestation on the Loess Plateau, China. Geoderma: An International Journal of Soil Science 2019, 337, 280–289. [Google Scholar] [CrossRef]
- Zhao, F.Z.; Ren, C.J.; Han, X.H.; Yang, G.H.; Wang, J.; Doughty, R. Changes of soil microbial and enzyme activities are linked to soil C, N and P stoichiometry in afforested ecosystems. Forest Ecol. Manag. 2018, 427, 289–295. [Google Scholar] [CrossRef]
- Zhen, Y.M. Study on the stoichiometric characteristics of plant carbon, nitrogen and phosphorus of sandy mountain soil in Poyang Lake. Jiangxi Normal University 2014. [Google Scholar]
- Zhou, J.; Wang, Q.G. Research progress on the effect of nitrogen addition on main functional characters of early spring herbaceous plants. Int. J. Ecol. 2021, 10, 129–137. [Google Scholar] [CrossRef]
- Zhu, J.X.; Wang, Q.F.; He, N.P.; Smith, M.D.; Elser, J.J.; Du, J.Q.; Yuan, G.F.; Yu, G.R.; Yu, Q. Imbalanced atmospheric nitrogen and phosphorus depositions in China: implications for nutrient limitation. J. Geophys. Res. Biogeo. 2016, 121, 1605–1616. [Google Scholar] [CrossRef]
Figure 1.
Spatial distribution of the plots and sampling methods in this study.
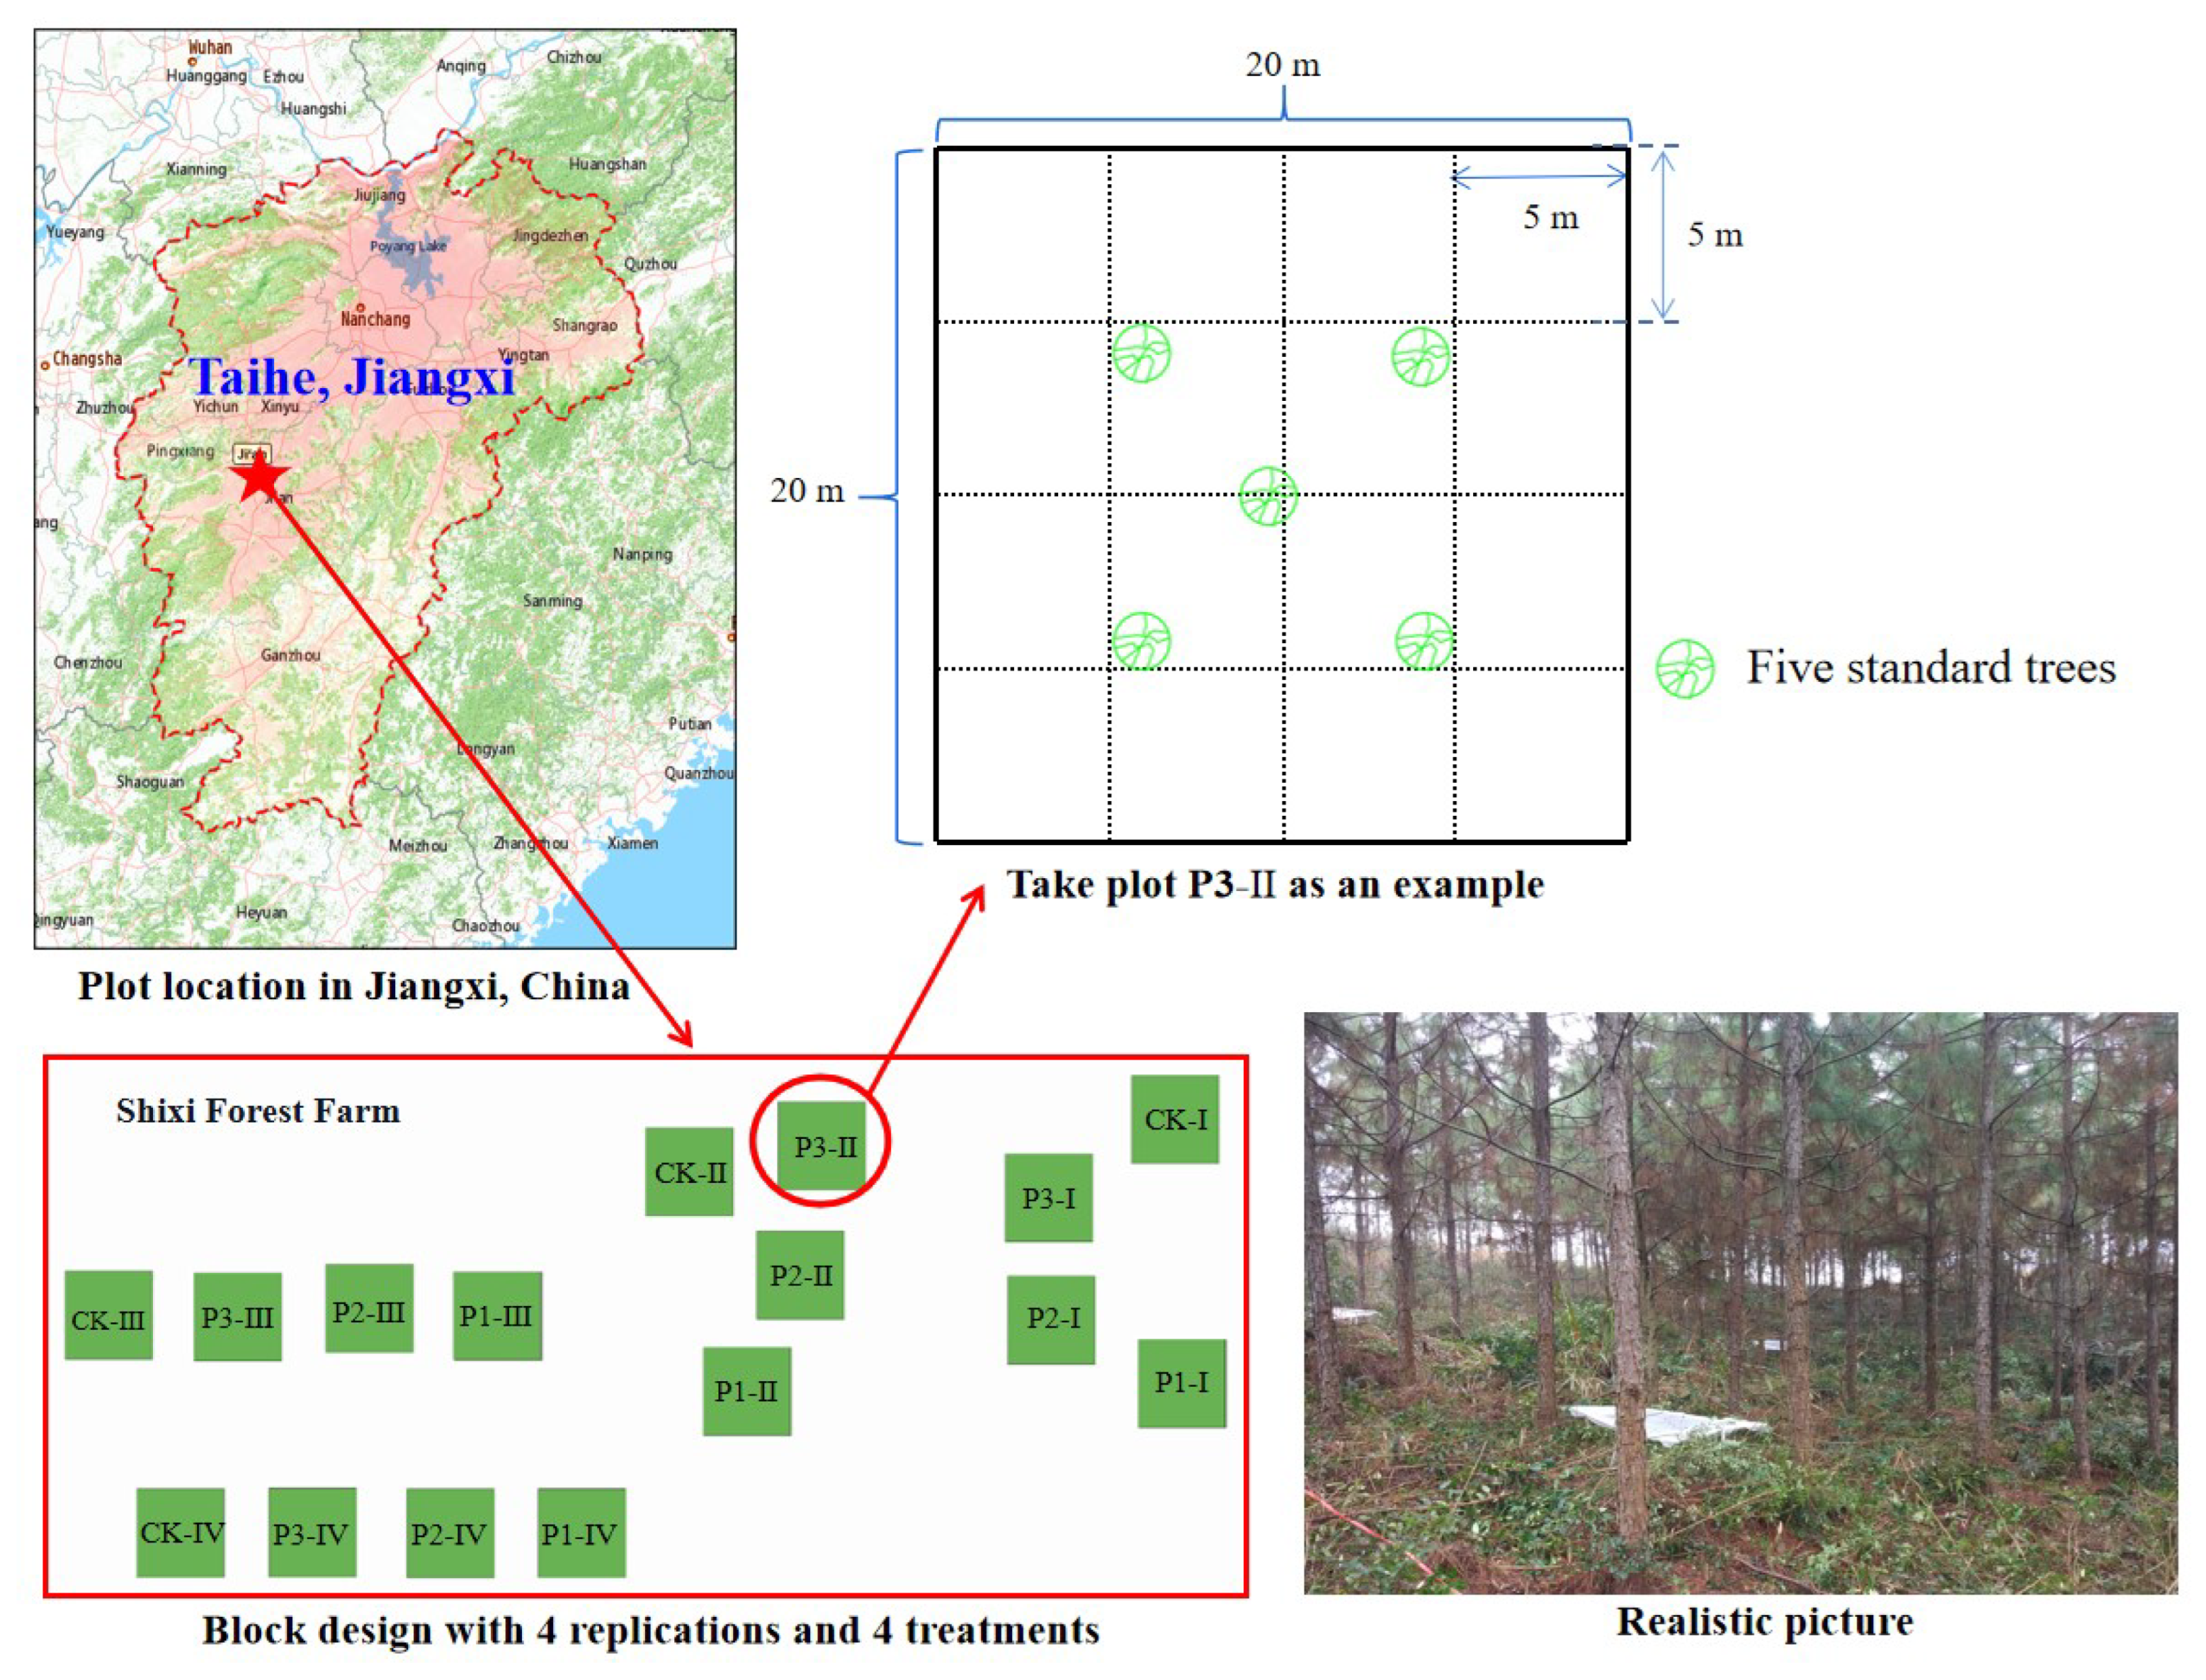
Figure 2.
The C, N, P contents and stoichiometry of tissues under P addition. Note: The top of bars are the standard errors of means. The different capital letter indicates the significant difference among tissues, and different small letters indicate the significant difference among treatments based on Tukey’s test. (p < 0.05).
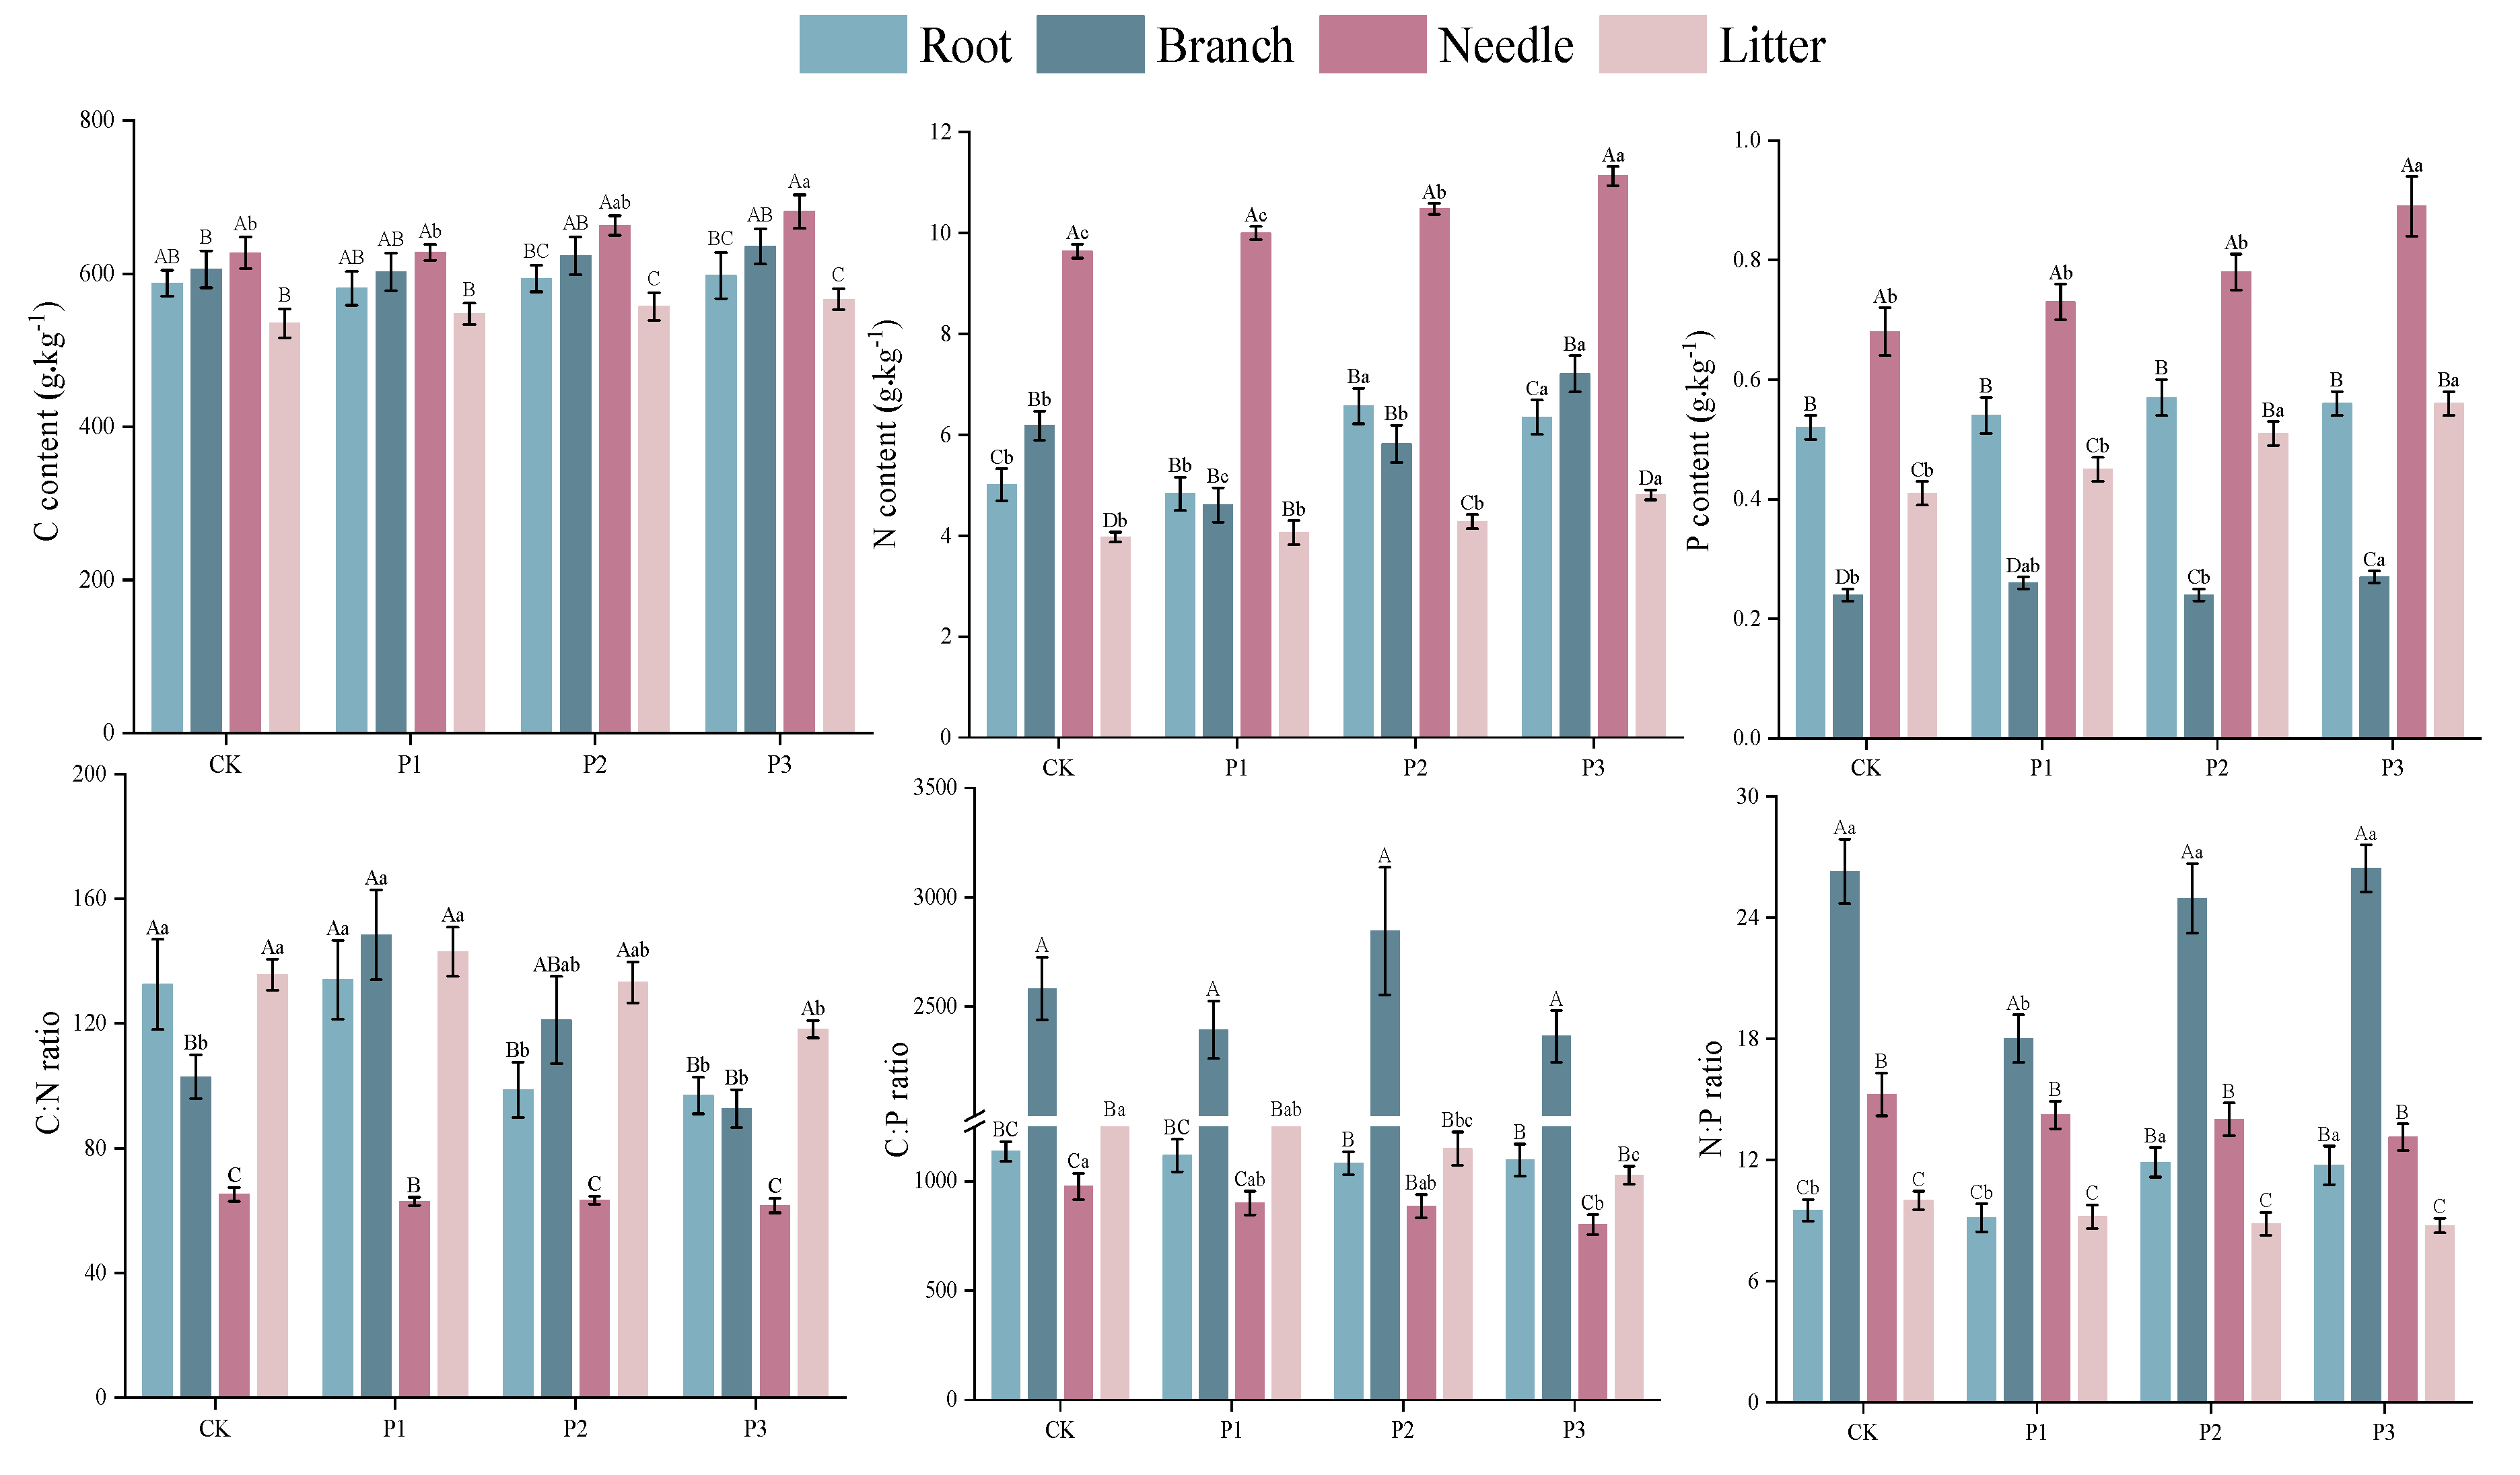
Figure 3.
Pearson correlation analysis of C, N, P and stoichiometry in the plant-litter-soil system in slash pine plantation.
Figure 3.
Pearson correlation analysis of C, N, P and stoichiometry in the plant-litter-soil system in slash pine plantation.
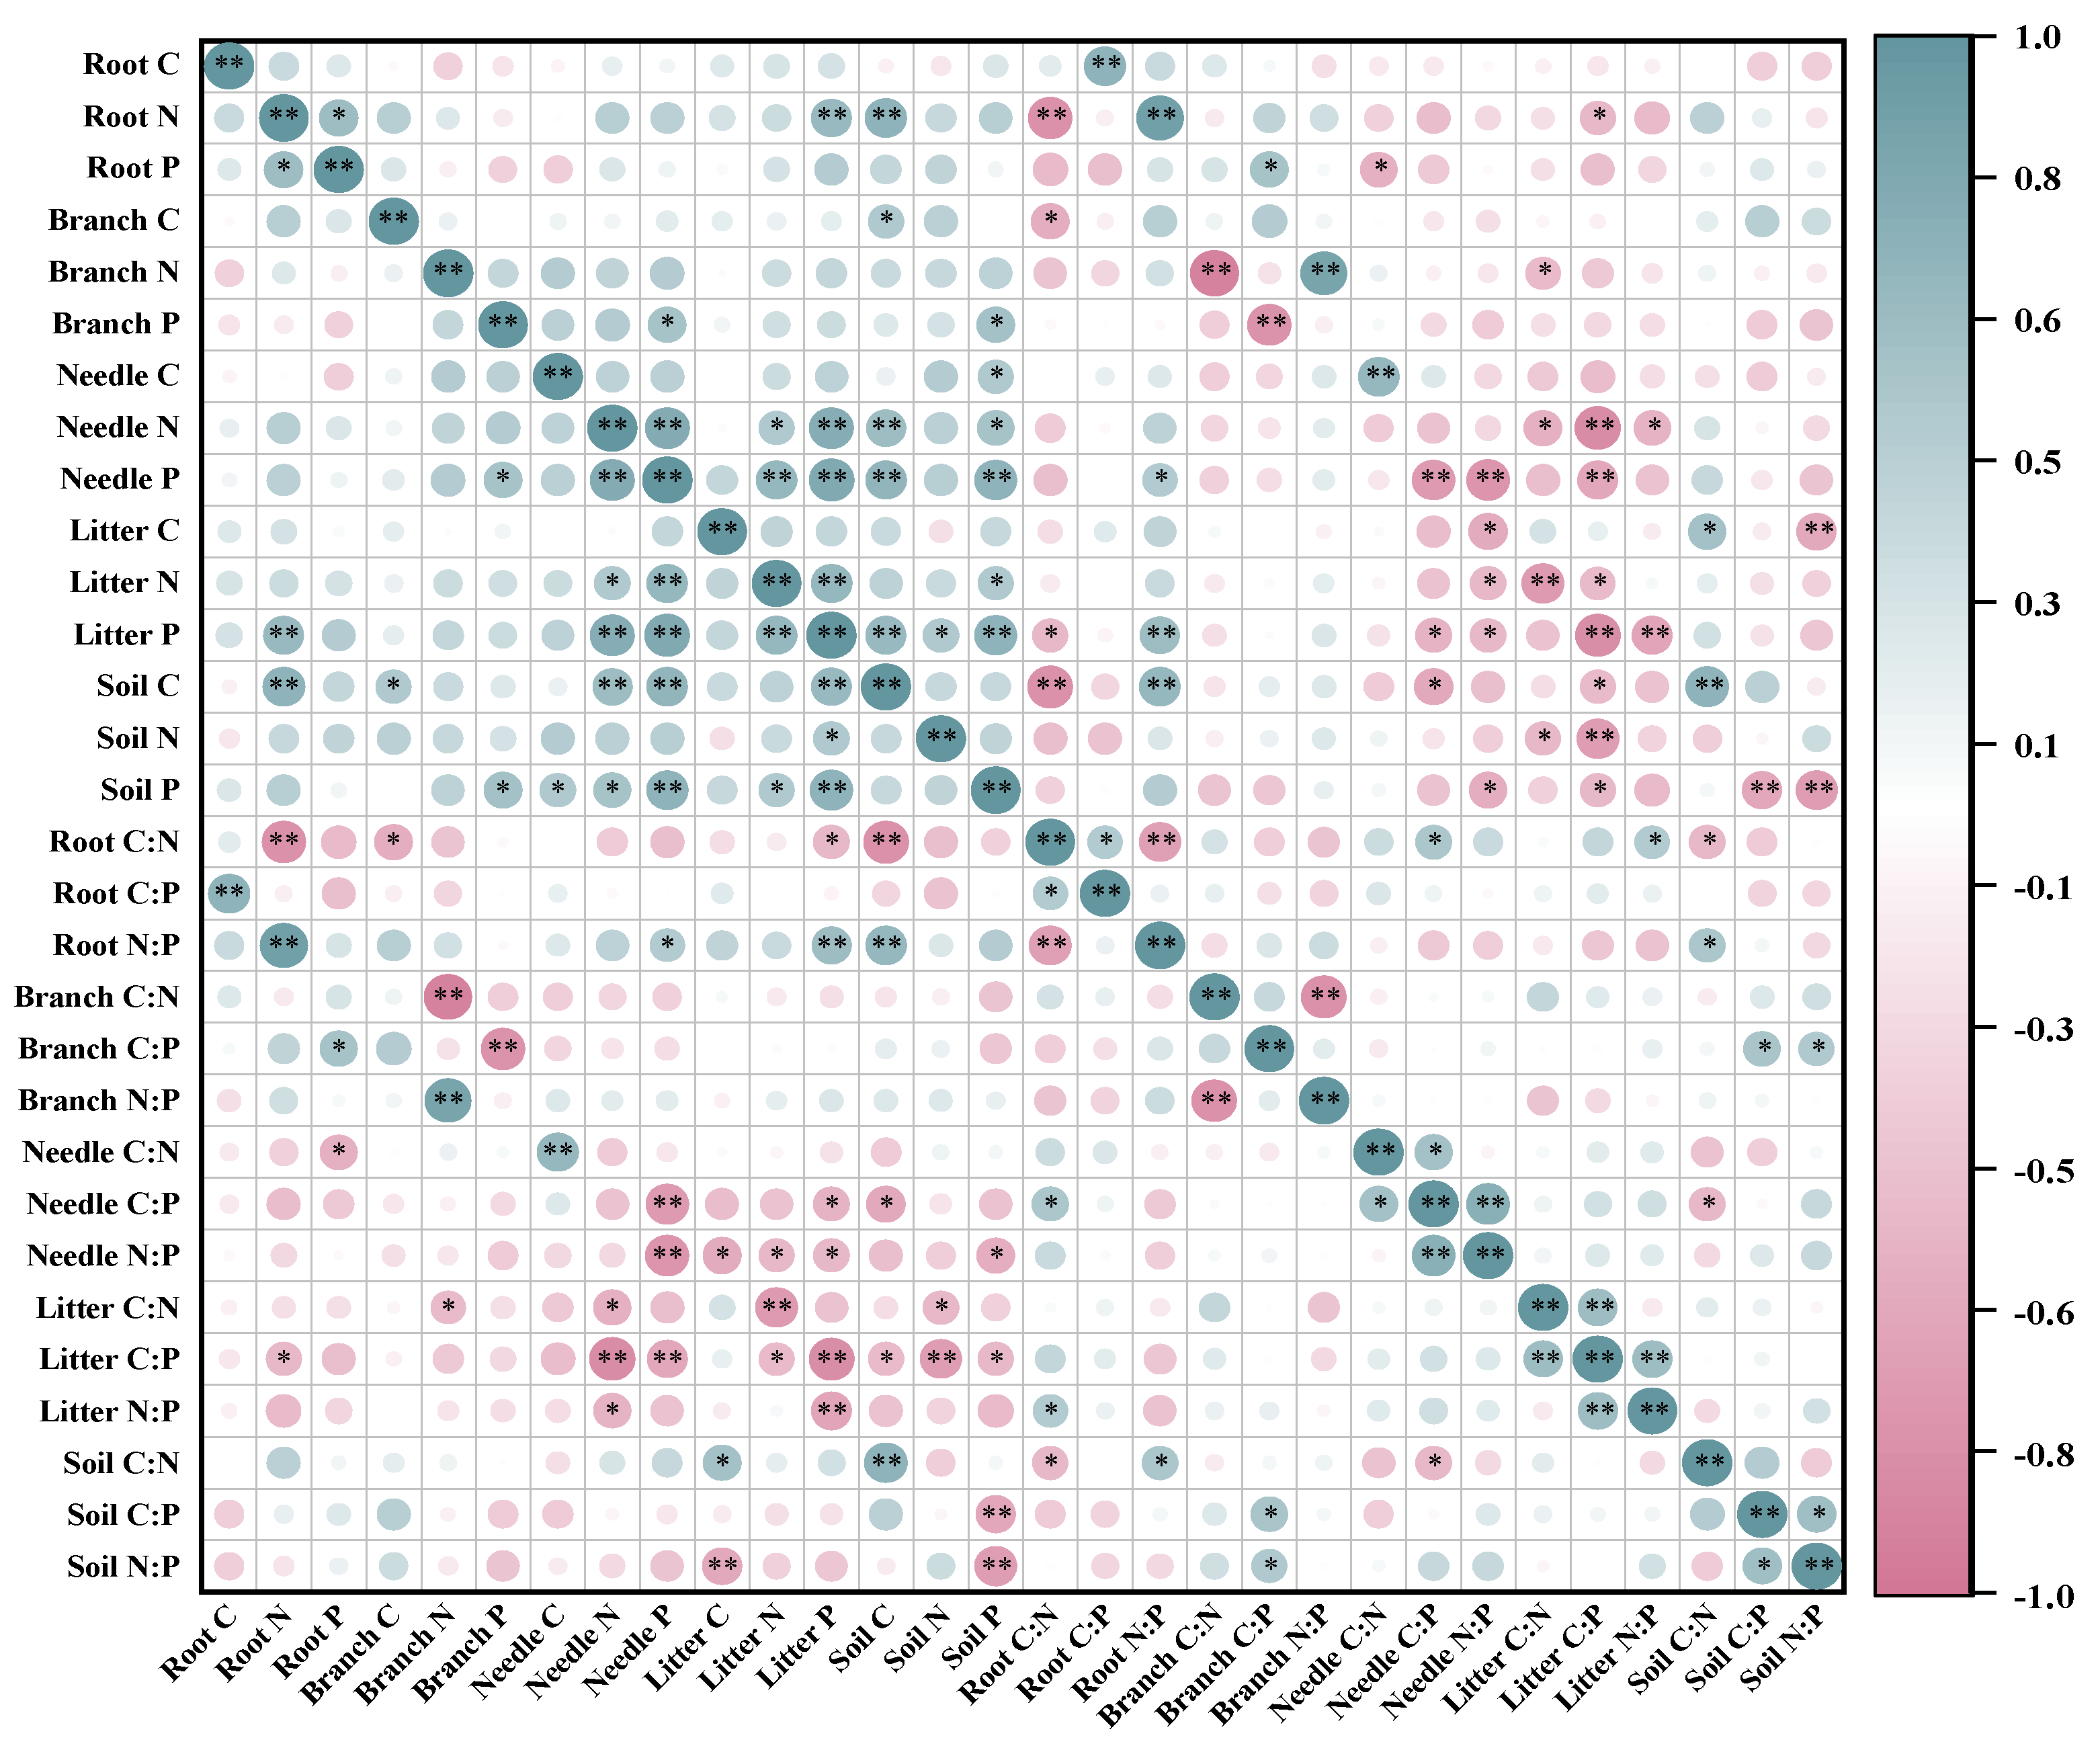
Figure 4.
In Figure 4(A), PCA was used to identify the relationship of C, N and P contents in the plant-litter-soil system. PCA axes 1 and 2 explained 40.6% and 16.6% of the variation, respectively. In Figure 4(B), PCA was used to identify the relationship of C, N and P stoichiometry in the plant-litter-soil system. PCA axes 1 and 2 explained 27.6% and 18.6% of the variation, respectively.
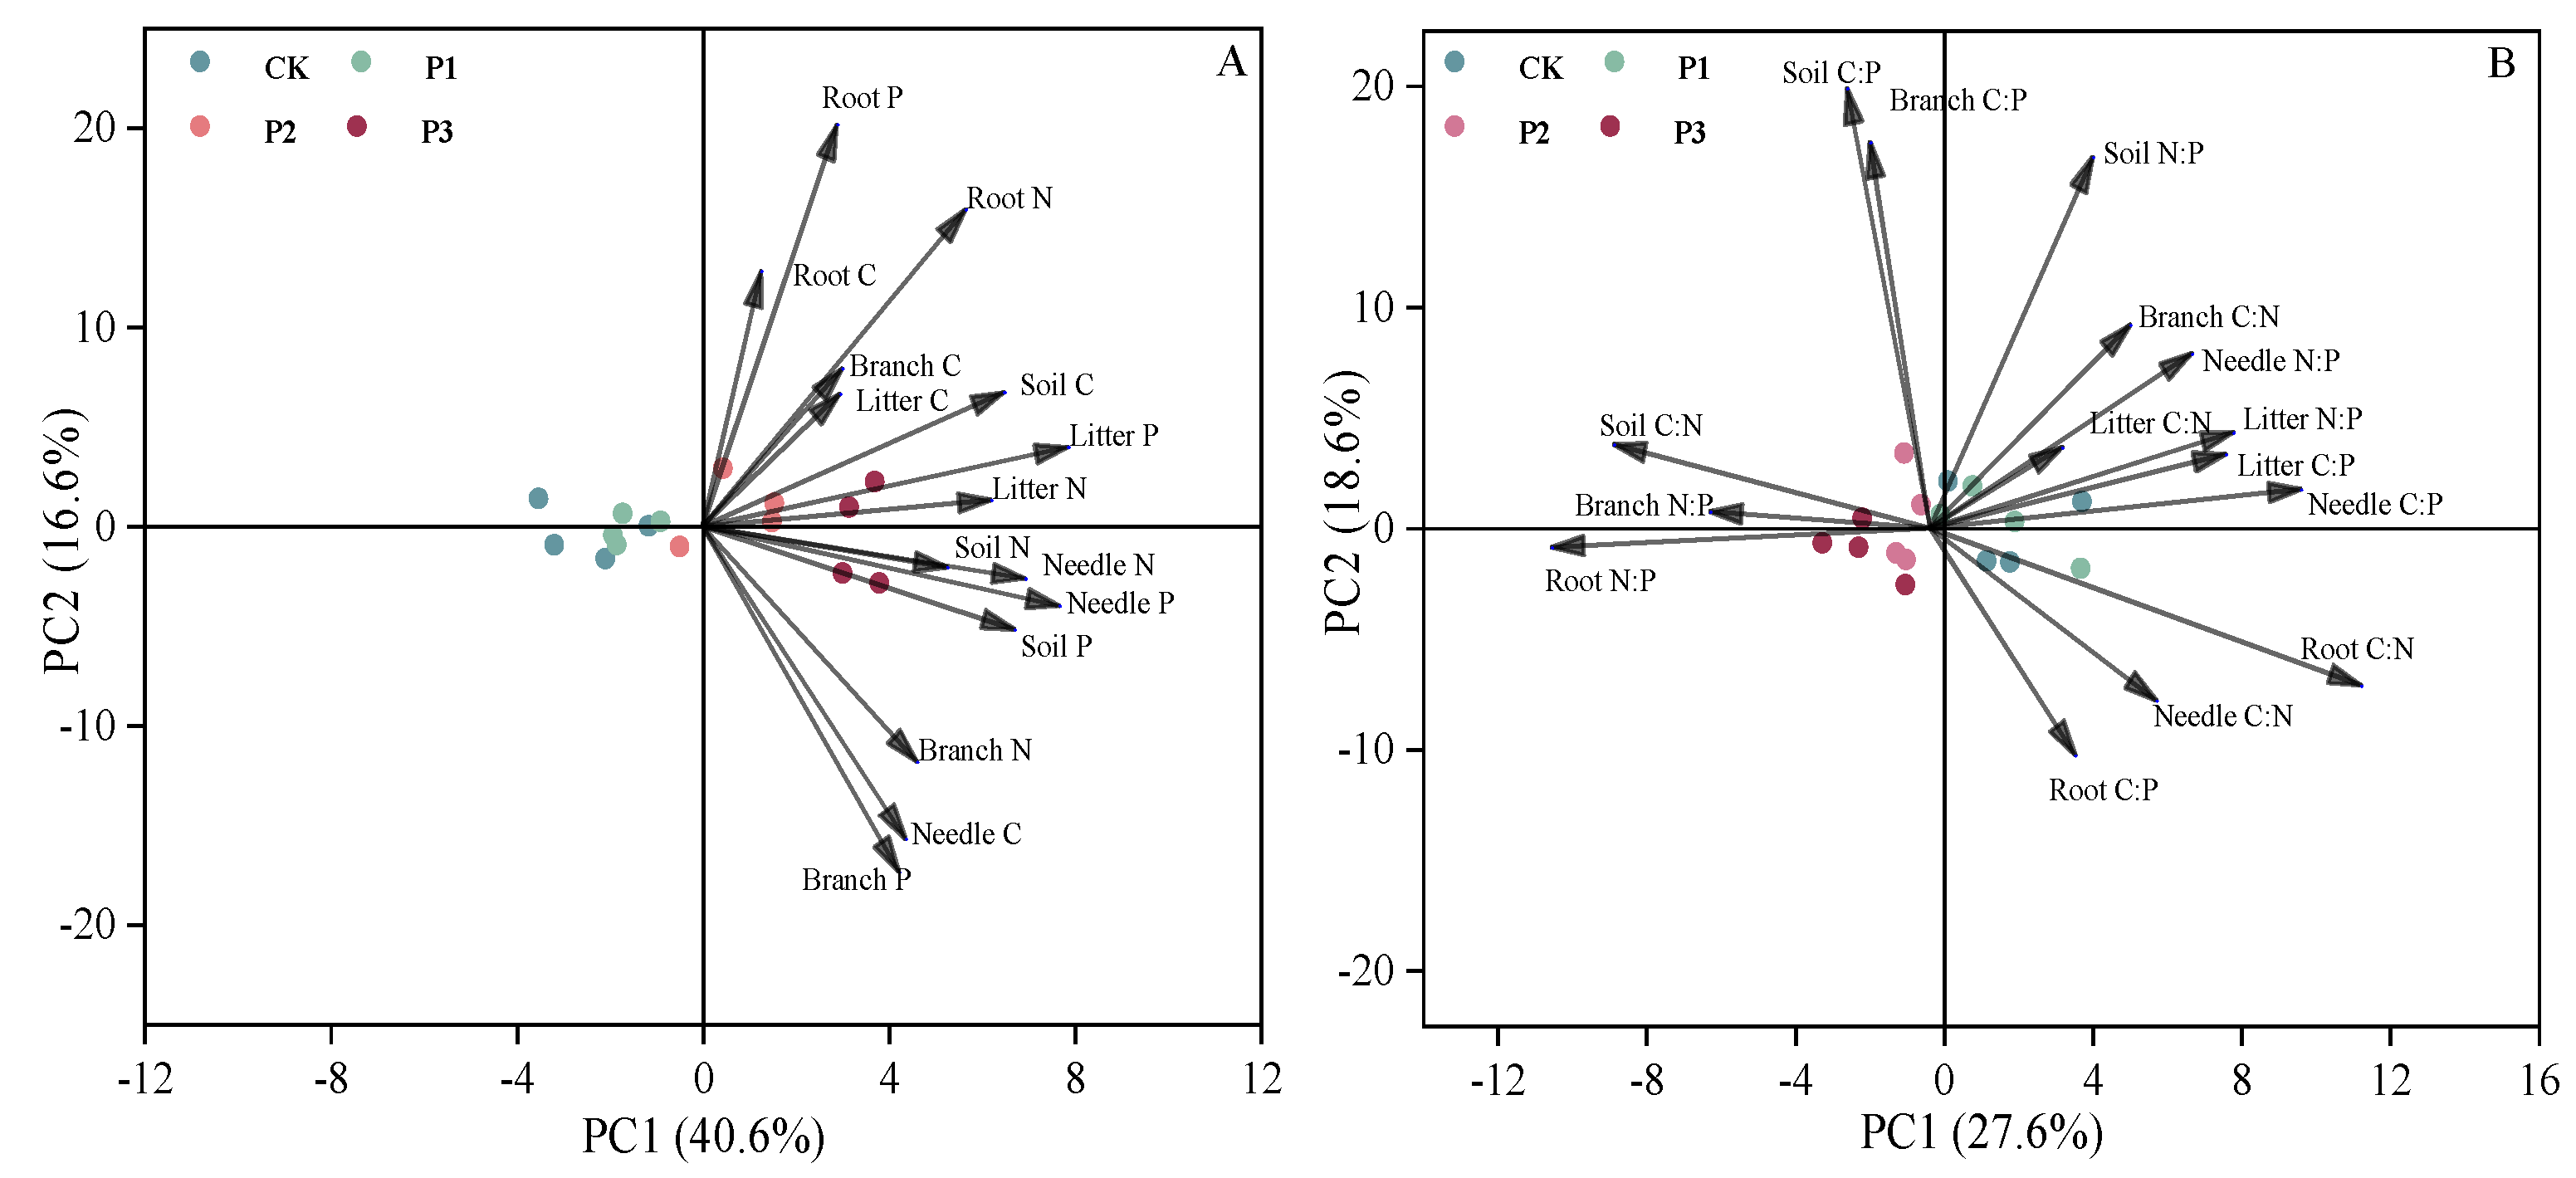
Figure 5.
Relationships between log10-transformed C, N, P contents and stoichiometry in the plant-litter -soil system.
Figure 5.
Relationships between log10-transformed C, N, P contents and stoichiometry in the plant-litter -soil system.
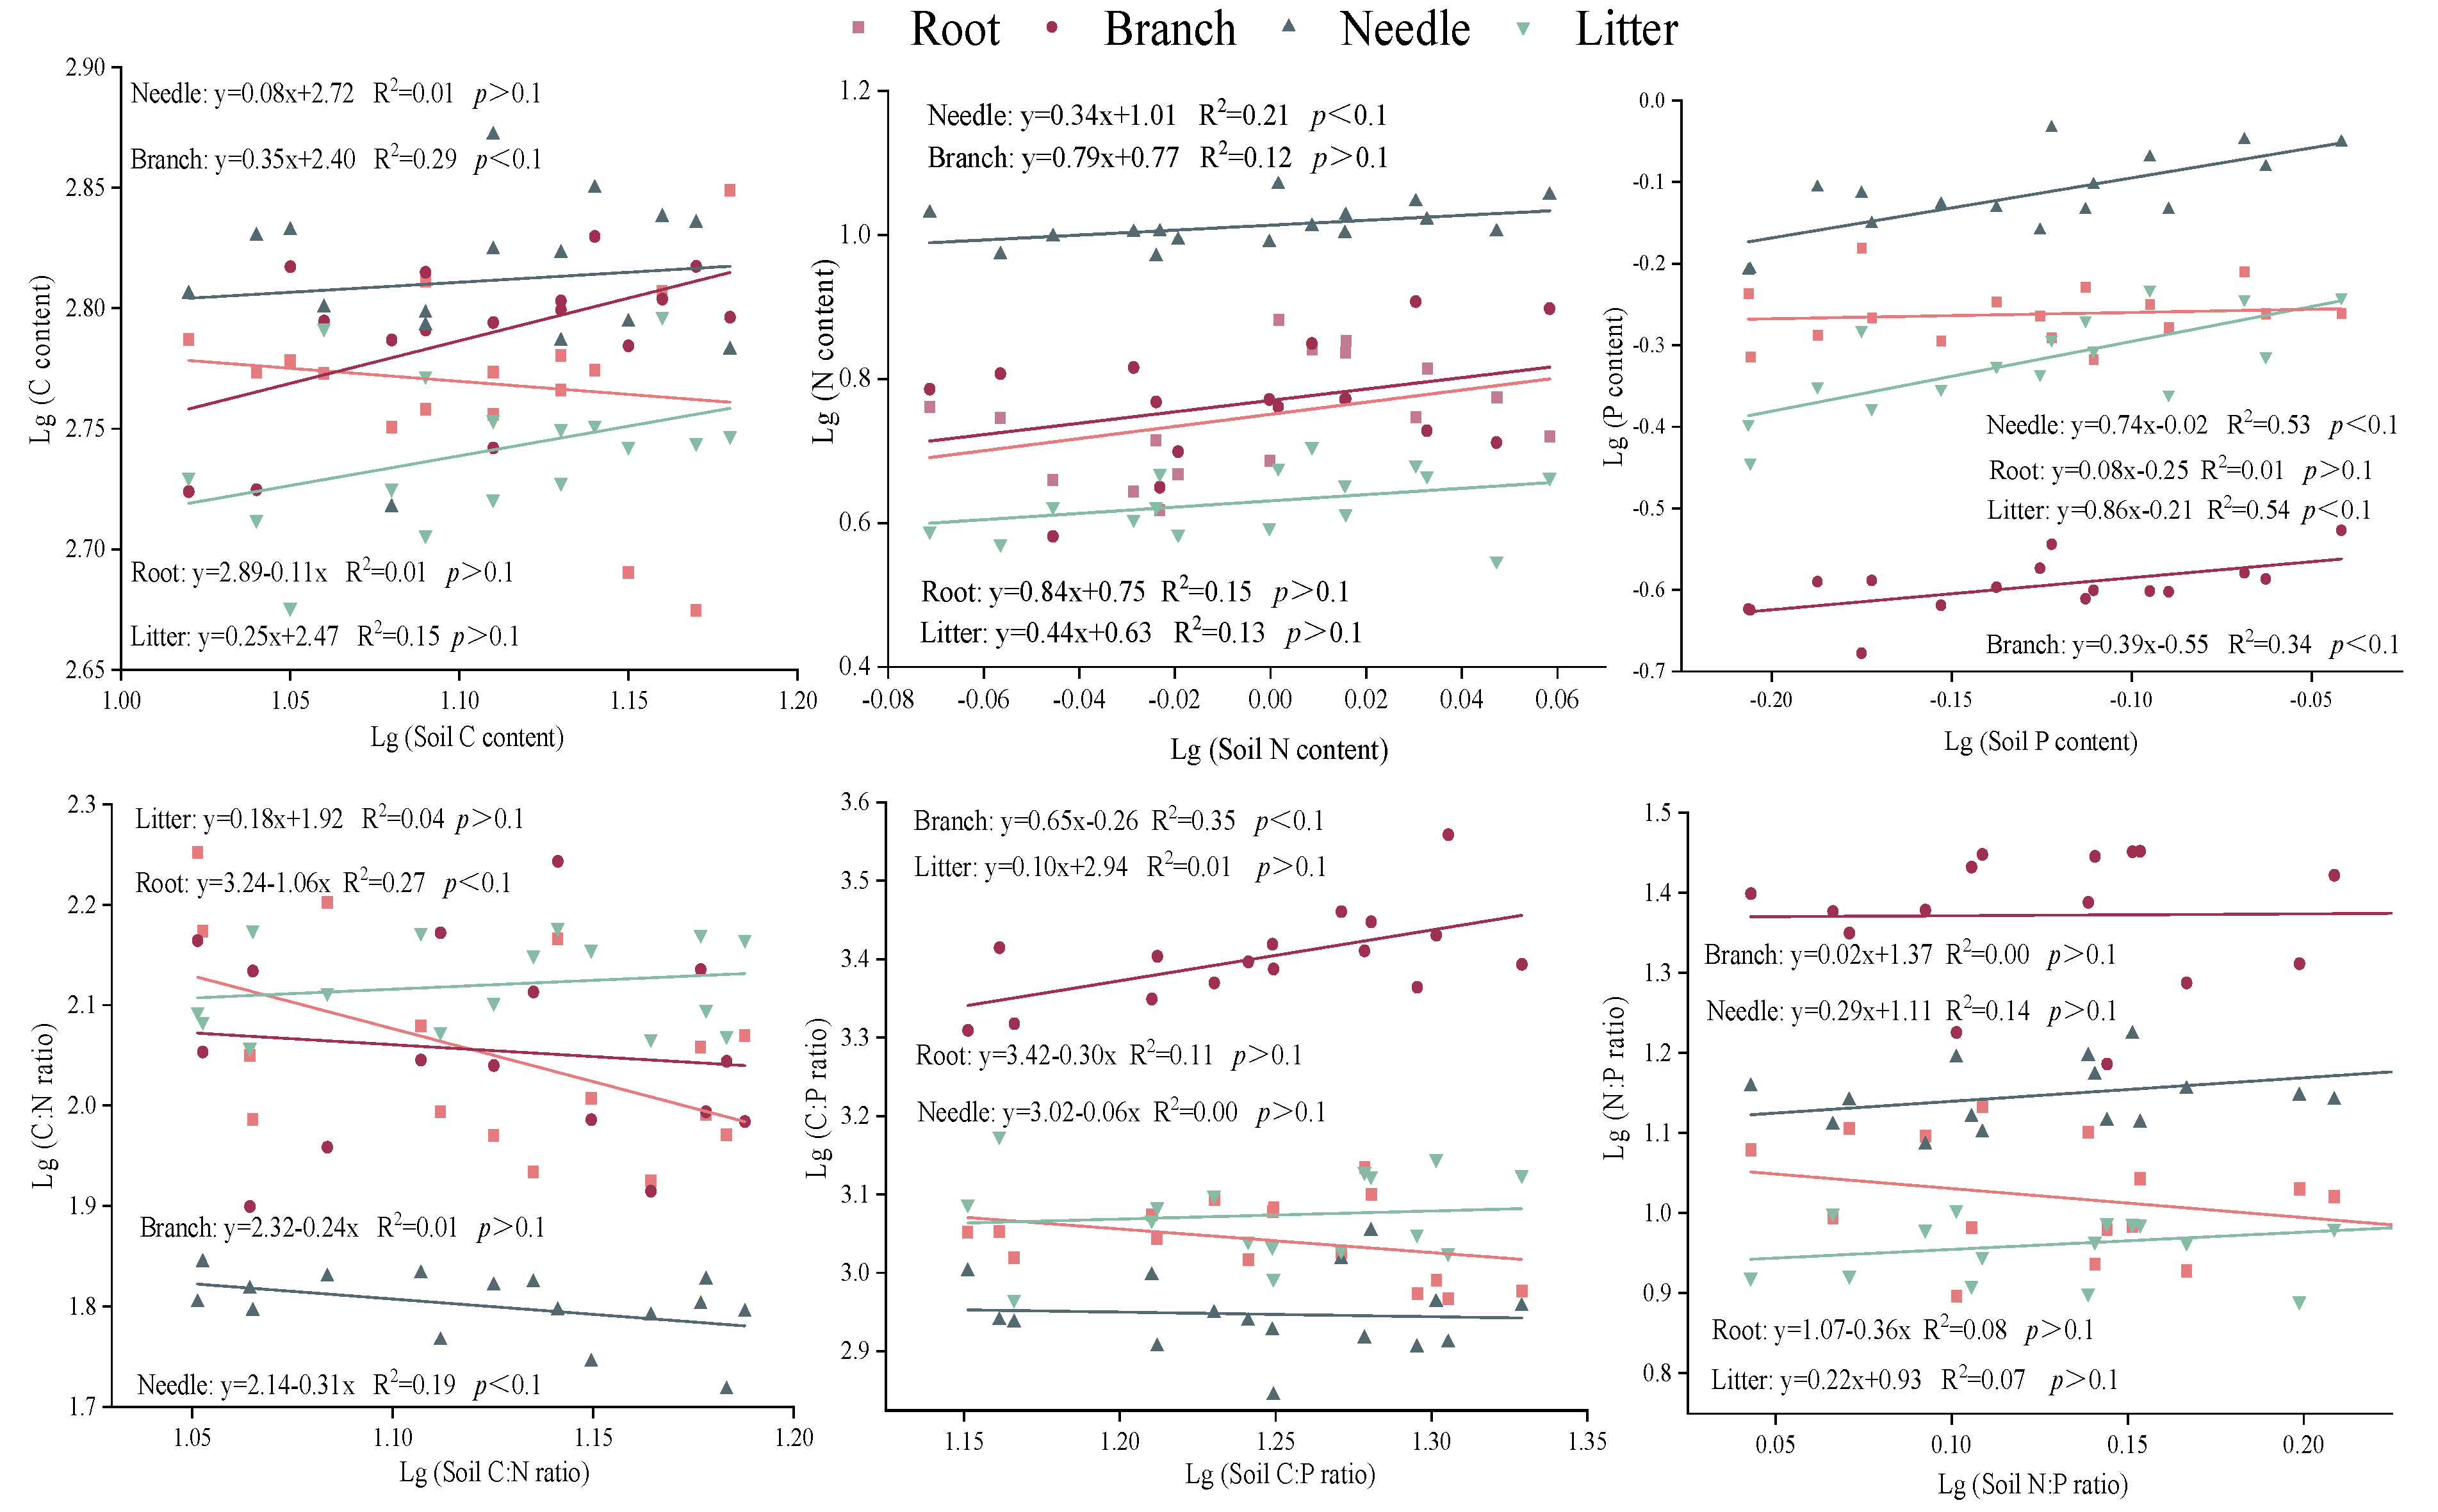
Table 2.
The C, N, P contents and stoichiometry of soil under P addition.
| Trait | CK | P1 | P2 | P3 |
|---|---|---|---|---|
| C | 11.50 ± 0.44 c | 12.28 ± 0.56 bc | 13.41 ± 0.51 ab | 14.31 ± 0.56 a |
| N | 0.94 ± 0.04 | 0.98 ± 0.05 | 1.00 ± 0.04 | 1.06 ±0.04 |
| P | 0.69 ± 0.03 b | 0.70 ± 0.03 b | 0.77 ± 0.03 ab | 0.83 ± 0.02 a |
| C:N | 12.58 ± 0.73 | 12.94 ±0.74 | 13.84 ± 0.72 | 14.13 ± 1.00 |
| C:P | 17.46 ± 1.20 | 17.98 ±1.06 | 18.04 ± 1.10 | 17.47 ± 0.80 |
| N:P | 1.41 ± 0.09 | 1.43 ± 0.08 | 1.33 ± 0.08 | 1.29 ± 0.05 |
Note: the different small letters indicate the significant difference among treatments based on Tukey’s test. (p < 0.05).
Disclaimer/Publisher’s Note: The statements, opinions and data contained in all publications are solely those of the individual author(s) and contributor(s) and not of MDPI and/or the editor(s). MDPI and/or the editor(s) disclaim responsibility for any injury to people or property resulting from any ideas, methods, instructions or products referred to in the content. |
© 2023 by the authors. Licensee MDPI, Basel, Switzerland. This article is an open access article distributed under the terms and conditions of the Creative Commons Attribution (CC BY) license (https://creativecommons.org/licenses/by/4.0/).
Copyright: This open access article is published under a Creative Commons CC BY 4.0 license, which permit the free download, distribution, and reuse, provided that the author and preprint are cited in any reuse.


MDPI Initiatives
Important Links
© 2024 MDPI (Basel, Switzerland) unless otherwise stated