1. Introduction
Unmanned Underwater Vehicle (UUV) localization and navigation is still a challenging topic mainly because electromagnetic waves do not propagate underwater, which avoids the use of typical above water surface solutions, and acoustic wave propagation is strongly dependent on the environment characteristics. However acoustic wave propagates well underwater and so a strong effort has been made in recent years to improve techniques and algorithms for allowing UUVs to navigate safely underwater. For that purpose the standard methods that are able to locate an UUV are long baseline (LBL), short baseline (SBL), and ultra-short baseline (USBL) [
1], and more recently networking techniques emerged as possible solutions [
2]. Typically, these techniques rely on measuring the time of flight (TOF) of the acoustic signal to perform localization, using multiple omnidirectional hydrophones or/and projectors. Localization solutions based on novel transducers as (i) vector acoustic sensors, which allows to measure the direction of arrival, and (ii) spiral acoustic sources, which generates a spiral acoustic field, have been presented in [
3] and [
4,
5,
6] respectively, as promising solutions.
The underwater localization using acoustic spiral sources is an analogy to the very high frequency omnidirectional range (VOR) which consists of emitting a circular wavefront and a spiral wavefront to determine the direction. For clarity,
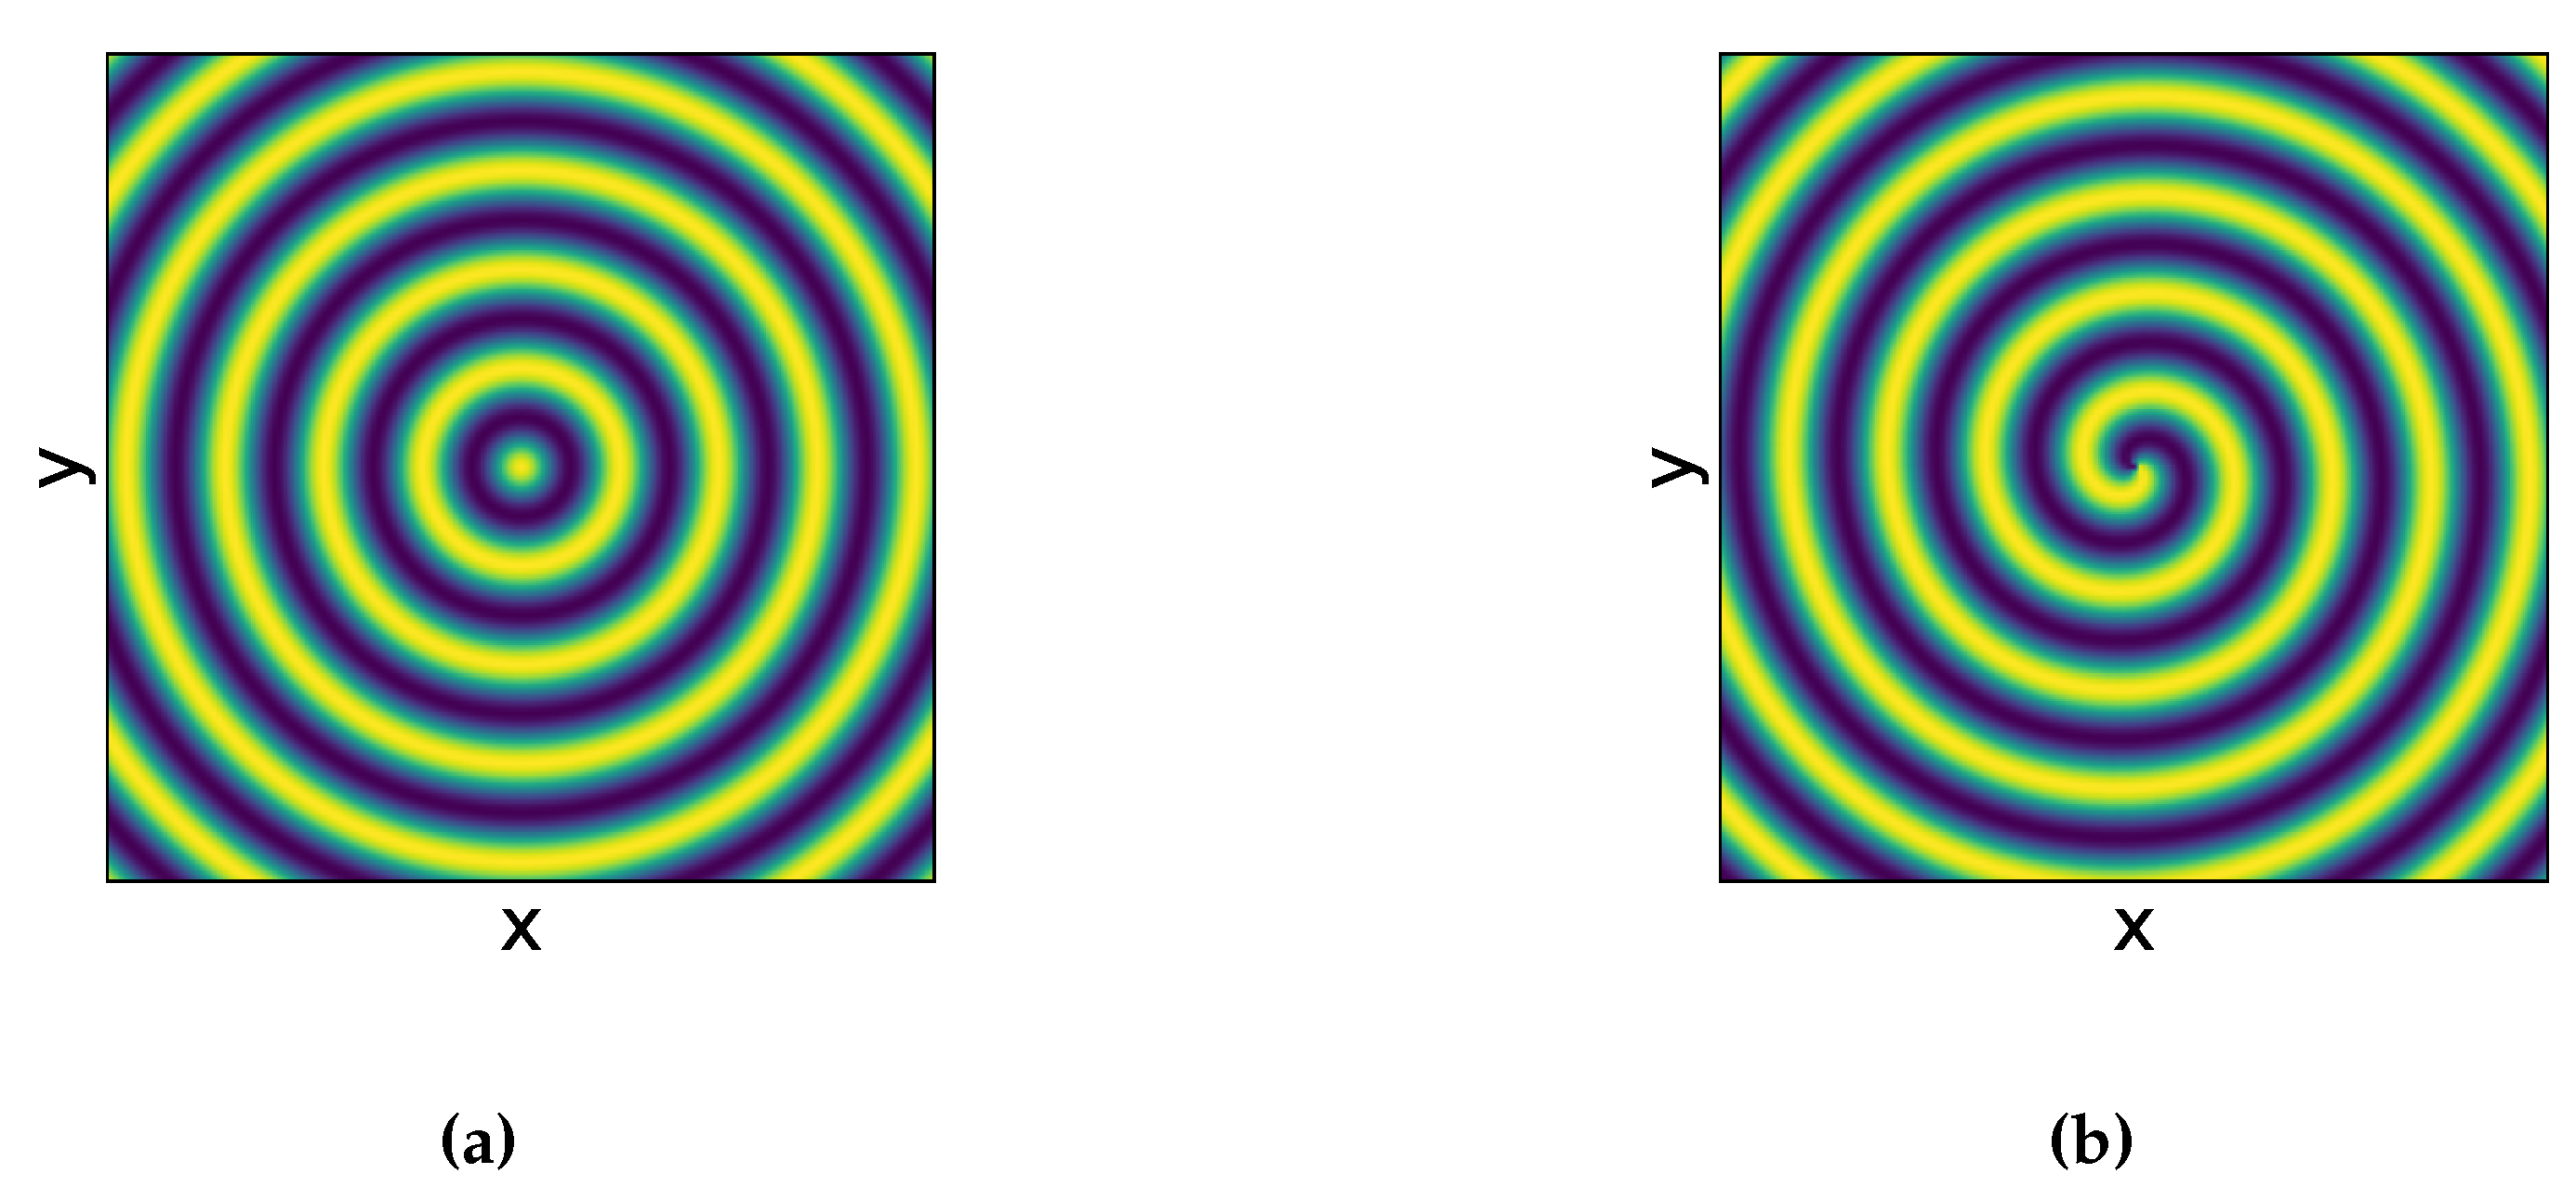
Figure 1 shows a comparison between a circular acoustic field and a spiral acoustic field. The circular wavefront (
Figure 1a) propagates with a constant phase at any direction while in the spiral wavefront (
Figure 1b) the phase varies linearly with the bearing angle relative to the acoustic source, allowing a receiver to compute the direction to the source by subtracting the phases of the two wavefronts. This underwater localization has the advantage of only needing a single source/hydrophone pair to determine the direction (azimuth or altitude depending on the spiral source orientation). In addition, it has the advantage that does not depend on the TOF to calculate source direction [
6].
Spiral sources can be divided into two types that were first described by Hefner and Dzikowicz [
7]: vibration of a surface in the form of a spiral, termed as “Physical-Spiral”, and the vibration of multiple acoustic elements with different phases, termed as “Phased-Spiral”. The physical-spiral sources have the disadvantage of being inherently narrowband unlike the phased-spiral sources [
7].
In 1998 and 1999 were published the first works about "acoustical helicoidal wave transducer" designs [
8,
9], that inspired the development of the two types of spiral sources in 2012, which consisted of a spiral-shaped piezocomposite strip underneath a circular reference source (Physical-Spiral type), and 16 equally spaced piezocomposite elements creating a circular shape (Phased-Spiral type) [
10]. The two spiral source prototypes were employed for unmanned surface vehicle (USV) navigation [
4]. Also in 2012, a different Phased-Spiral source using a radially polarized piezoceramic hollow cylinder, divided in four selective excitation zones, that forms two dipoles with phase biased in quadrature [
11]. Later, a reference source was included in the same package (BTech BT-SW1..6) [
12], and was employed in the work of the spiral wavefront sonar [
13] and in the work of the UUV spiral wavefront navigation [
6]. In 2018, Lu et al. developed a Phased-Spiral source using 8 longitudinal vibrating elements that vibrate due to multiple piezoelectric ceramic hollow cylinders [
14]. One year later, the same authors developed a more simple Phased-Spiral source using a group of 3 omnidirectional spherical transducers [
15].
Spiral acoustic sources, like other acoustic equipment, may require adjustments in order to display the desired performance. Those adjustments can be made to the spiral source input signals (spiral source calibration), or they can be made adjusting the received signals (receiving calibration). The first approach guarantees that the generated wavefront is as close as possible to a spiral wavefront, i.e., calibrates the spiral source, while in the second approach despite the system being functional, the propagated wavefront in water remains deficient. In [
11] it is mentioned that the phase difference between the reference signal and the dipole signal varies with the frequency in the described prototype and must be taken into account when emitting signals with multiple frequencies. In the Spiral Sonar work [
13], a receiving calibration is proposed where the deterministic phase errors are corrected through a polynomial regression. In [
6] the spiral source BTech BT-SW06 was characterized, showing the phase errors at different directions.
In
Section 2, the new spiral source prototype is presented, it is able to generate circular and spiral wavefronts, and stands out from previous implementations due to the fact that it is formed by four monopoles in the same piezoelectric ceramic. In
Section 3, the Experimental Setup for the experiments is clarified and the multipath features of the used water tank are presented. In
Section 4, the Spiral Signal Processing is described for the signal transmission, signal reception, and the proposed receiving calibration is outlined. In
Section 5, the carried acoustic spiral source experiments and the discussion of the results were divided in: (i) Amplitude and phase calibration, (ii) Horizontal Directivity evaluation, and (iii) Vertical Directivity evaluation. Finally, the conclusion and future work is addressed in
Section 6.
2. Spiral Source Prototyping
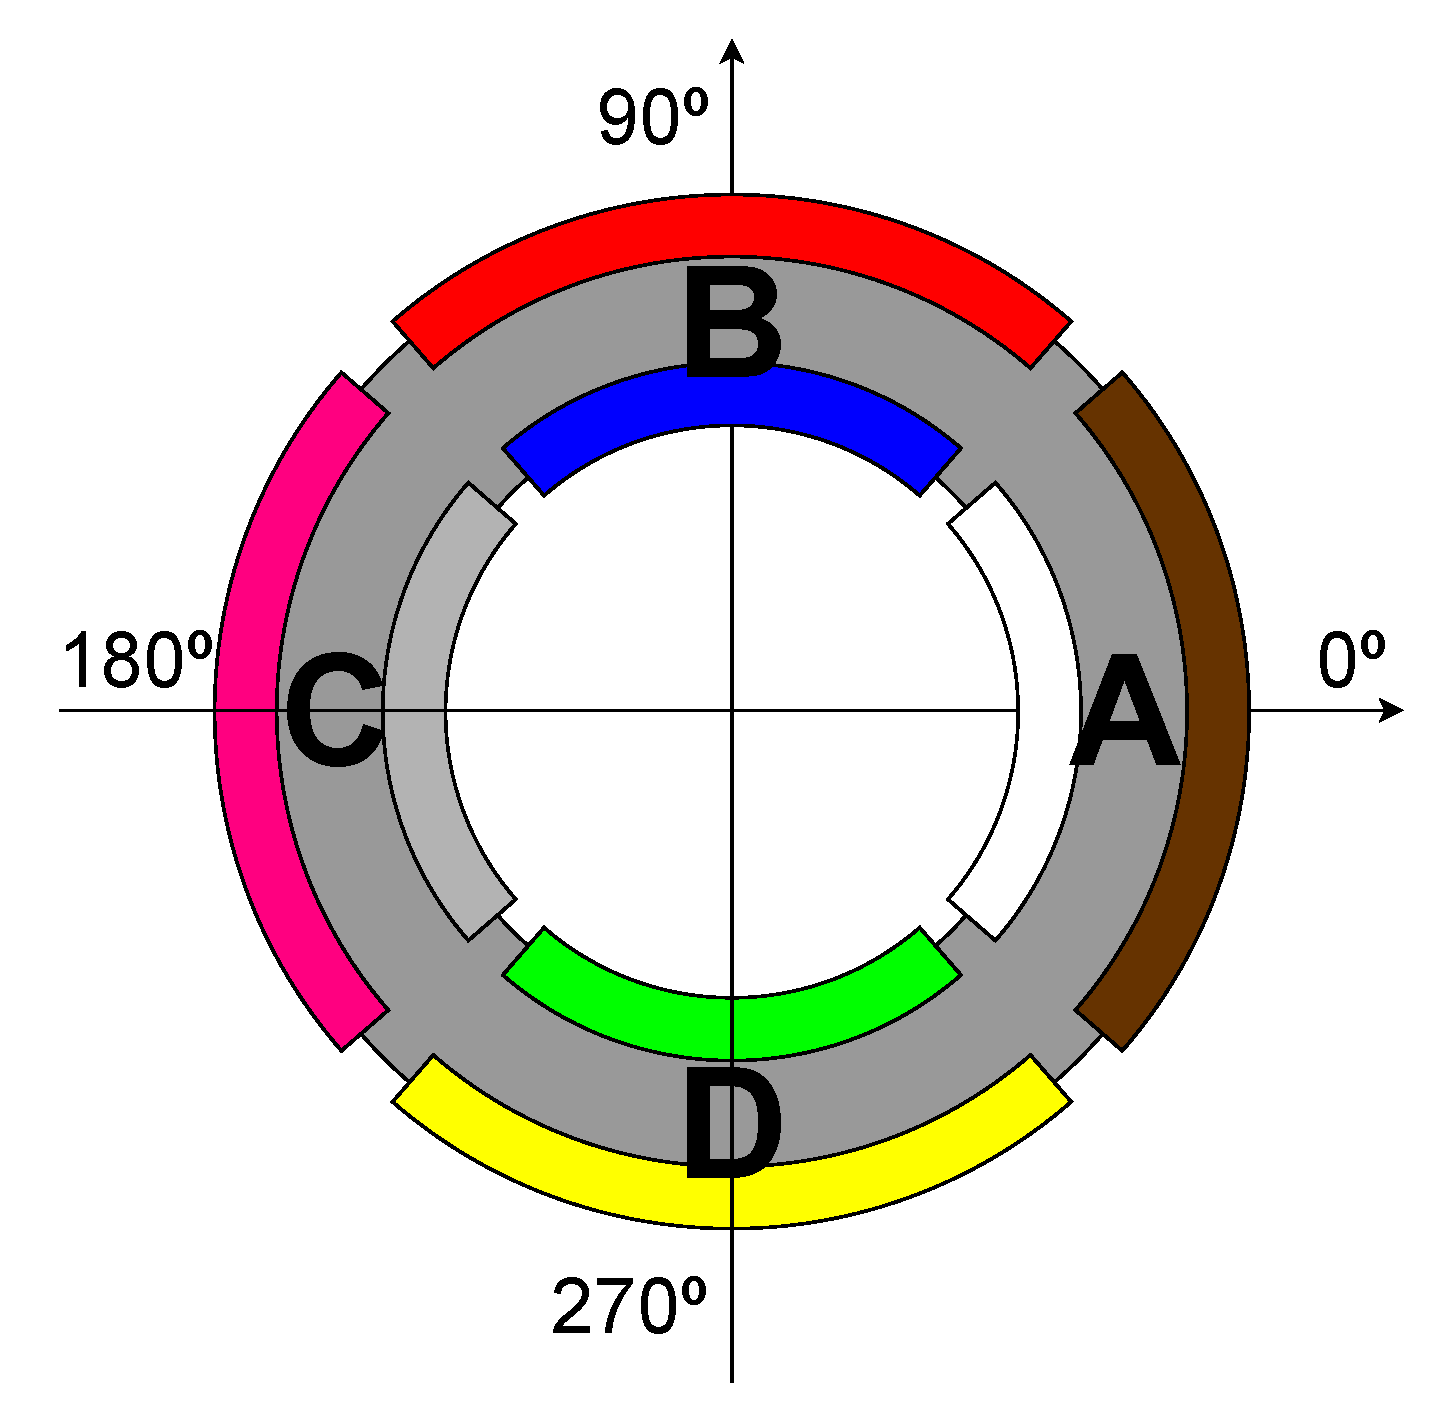
In November 2022, the spiral source prototype was developed. It has a cylindrical shape with four quadrants A, B, C and D (see
Figure 2) as the one developed in [
11]. However, the four quadrants are not acoustically isolated, thus resulting in a transducer with four omnidirectional monopoles that can be driven by four independent signal generators simultaneously as is the case of the spiral source developed in [
15] which uses 3 independent omnidirectional acoustic sources.
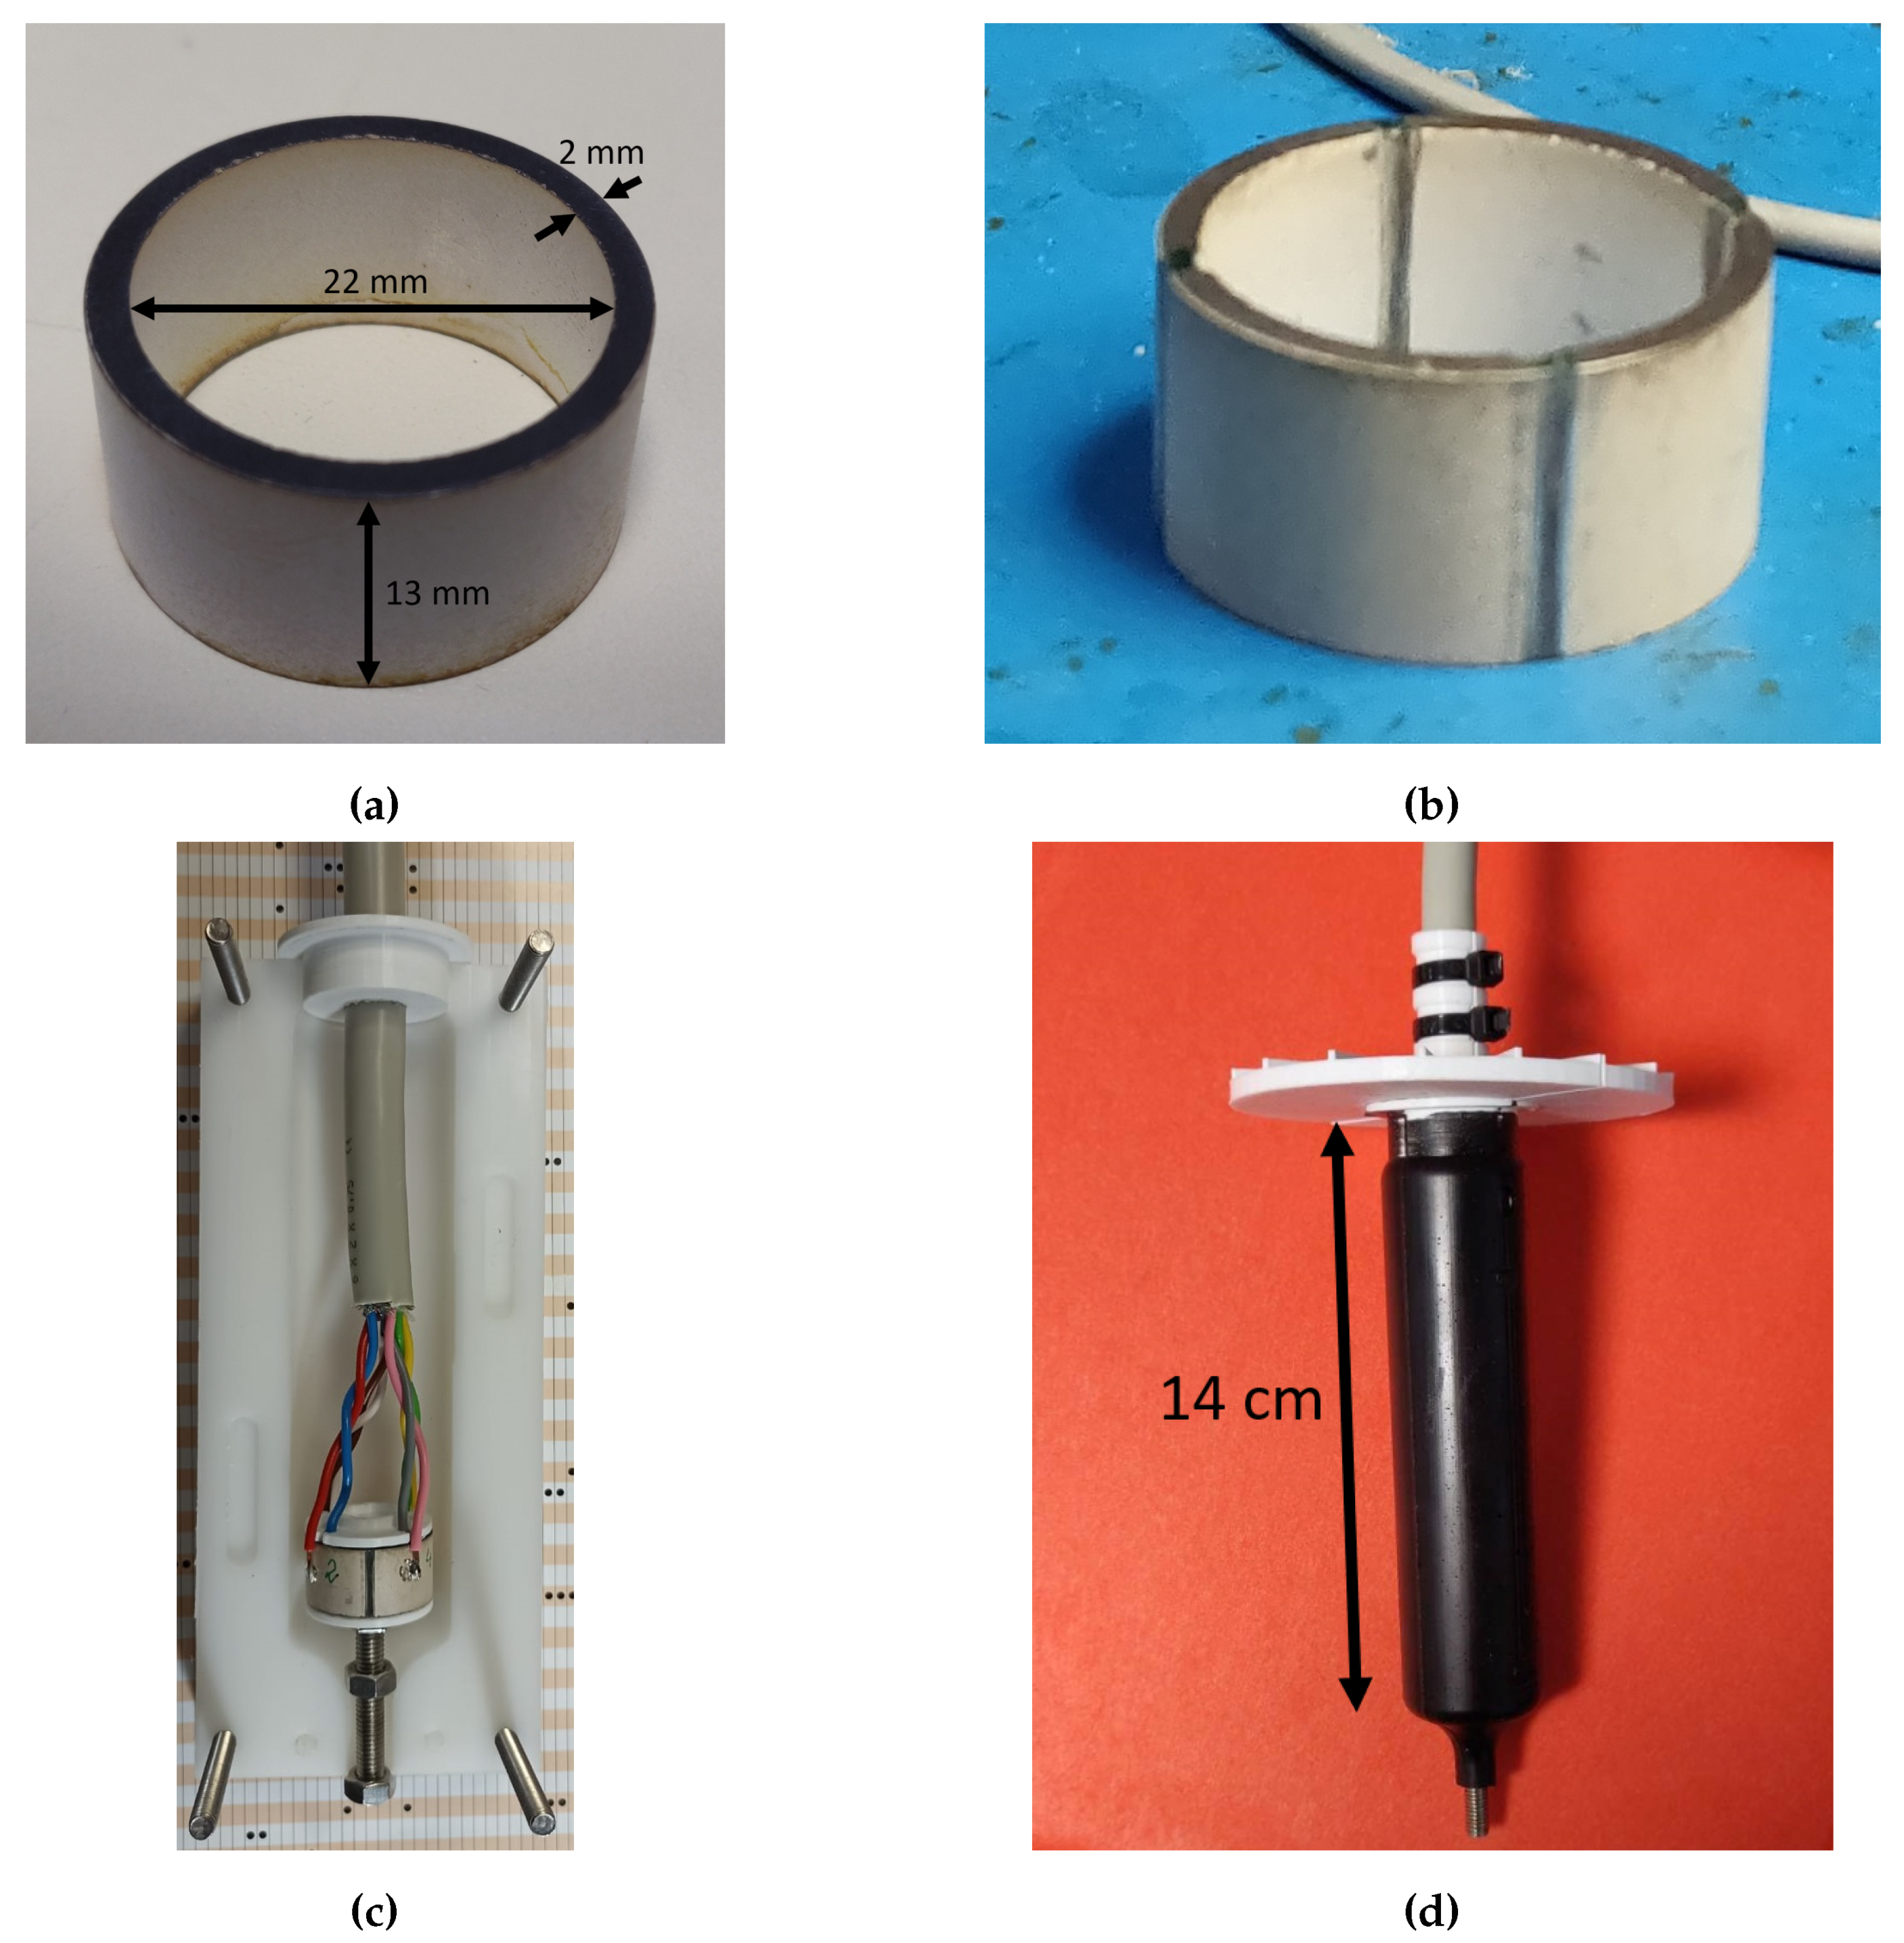
The spiral source’s prototype was made using a standard PZT-4 piezoelectric ceramic cylinder (
Figure 3a, STEMINC Part Number SMC26D22H13111) and the manufacturing process can be described in the following steps:
- (1)
Make four outer and inner rips, aligned, in the cylinder electrodes:
Figure 3b.
- (2)
Solder the wires to the cylinder electrodes (two for each quadrant, one inside and one outside) and place the top and bottom caps to prevent the potting material from entering the cylinder:
Figure 3c.
- (3)
Place the structure in the potting frame, close the potting frame, mold with polyurethane UR5041 and wait until potting material has dried.
- (4)
Remove the potting frame and place the reference frame aligned with the potting slots:
Figure 3d.
In this prototype the circular wavefront is generated by driven the four monopoles with the same signal, in contrast to what is described in [
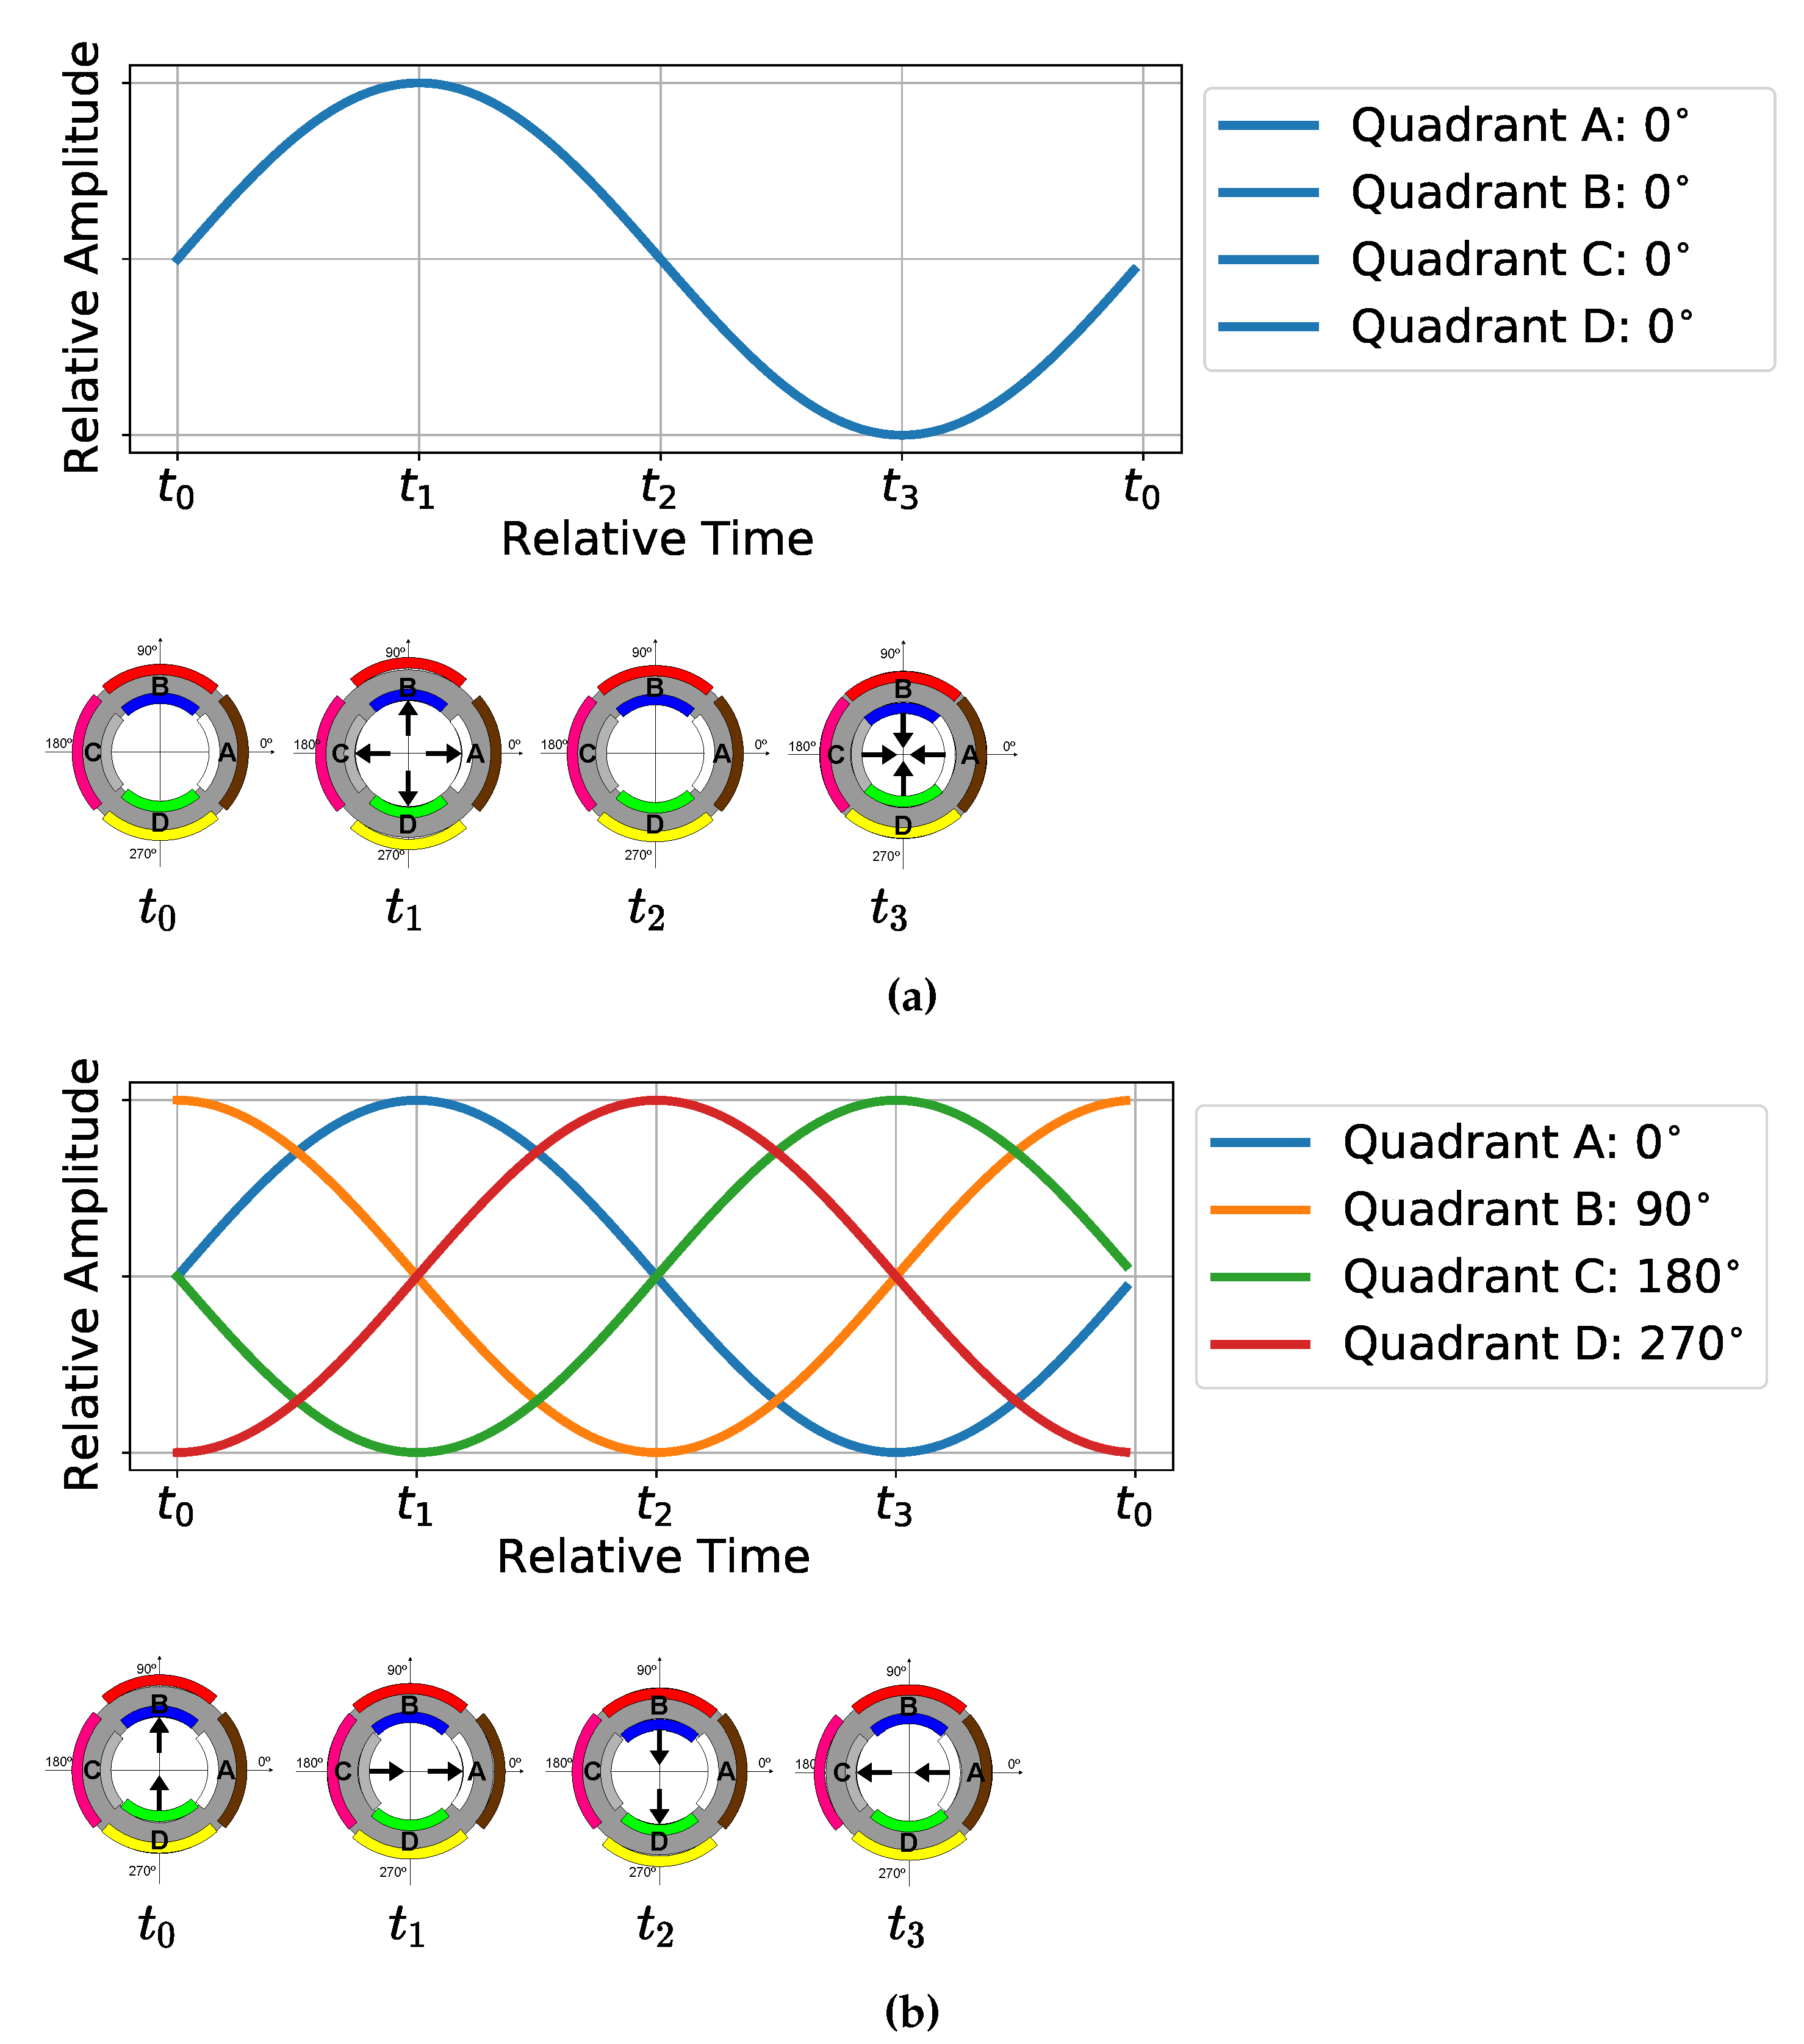
12] which uses a separate reference source. The spiral wave front is generated by applying the same signal with a 90 phase shift for each adjacent quadrant: 0, 90, 180, and 270 for the quadrants A, B, C, and D, respectively.
Figure 4 shows an example of the input signals to produce circular and spiral wavefronts and the corresponding behaviour of the 4 transducer quadrants.
Figure 4a shows that when the same sinusoidal signal is applied simultaneously to all the quadrants the displacements are similar in all quadrants, moving the surface of the cylinder to the outside when the sinusoid value increases and inside when decreases thus resulting a vibrating wave with a maximum pressure in
, a minimum in
and zero in
and
. Such behaviour corresponds to generate a circular wavefront in the “zeroth-mode” of a uniformly vibrating cylinder [
16].
Figure 4b shows that when phase shifted sinusoids are applied to each quadrant, in
the surface of the cylinder is moving up to the 90 direction, in
the surface of the cylinder is moving up to the 0 direction, in
the surface of the cylinder is moving up to the 270 direction, and in
the surface of the cylinder is moving up to the 180 direction. This movement corresponds to two first extensional mode of vibration [
16], one in the vertical and the other in the horizontal direction. Such behaviour generates a spiral wavefront based on a "phased-spiral" source.
The resonance frequencies of the mentioned vibration modes are given by [
13]
where
and
for the zero and first mode of vibration, respectively,
is the sound speed on the cylinder material and
a is the mean radius of the hollow cylinder. For the developed prototype (
=3456 m/s, and
a=12 mm), the resonance frequencies for the circular wave should occur at 46 kHz (
) and for the spiral wave at 65 kHz (
).
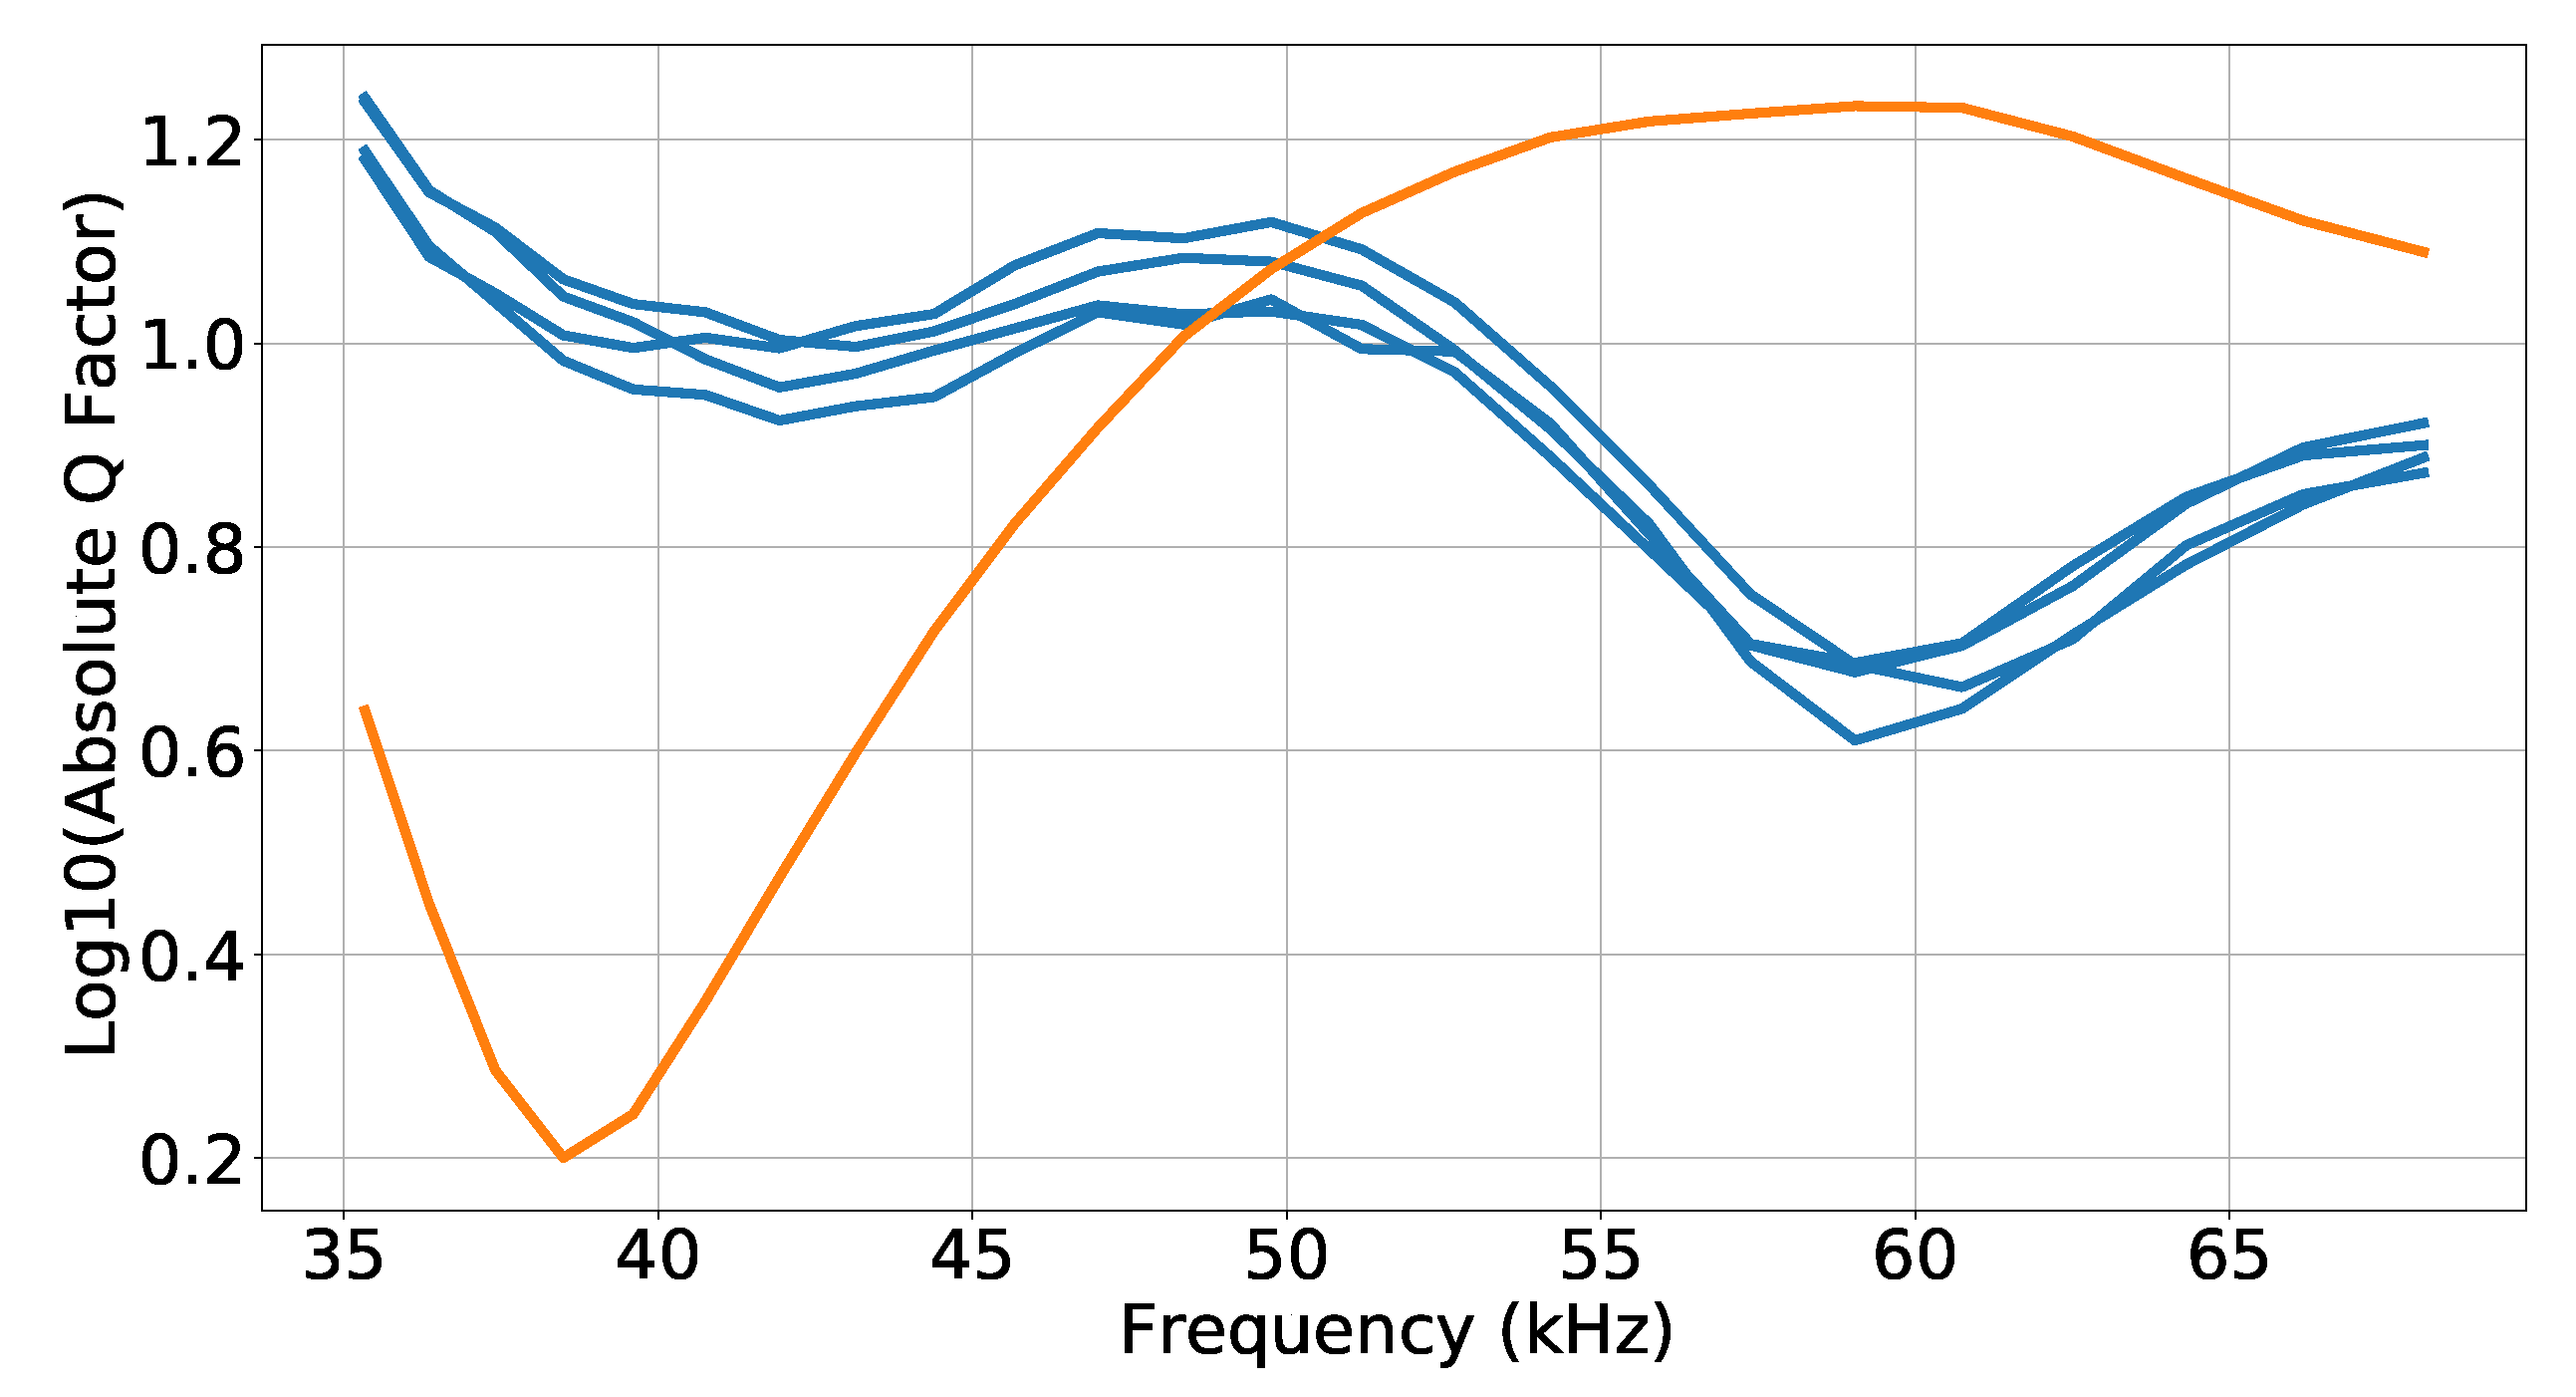
The measurement of the Q factor (ratio between reactance and resistance of the transducer) along the frequency allows evaluating, experimentally, the electrical behavior of the transducer, namely their resonance frequencies which occurs when the absolute value of the Q factor is minimum. The Q factor of the spiral source was measured using a KEYSIGHT E4980A LCR-meter: (i) with all inner terminals connected and outer terminals connected which corresponds to the connection of the quadrants in parallel; and (ii) for the individual quadrants.
Figure 5 shows the Q factor results where it is possible to identify a resonance at 39 kHz for (i) the orange curve and a resonance at 59 kHz for (ii) the blue curve. There is a small discrepancy between those values and the ones estimated with (
1) which was probably due to the potting or any miss-adjustment of the handmade rips.
3. Experimental Setup
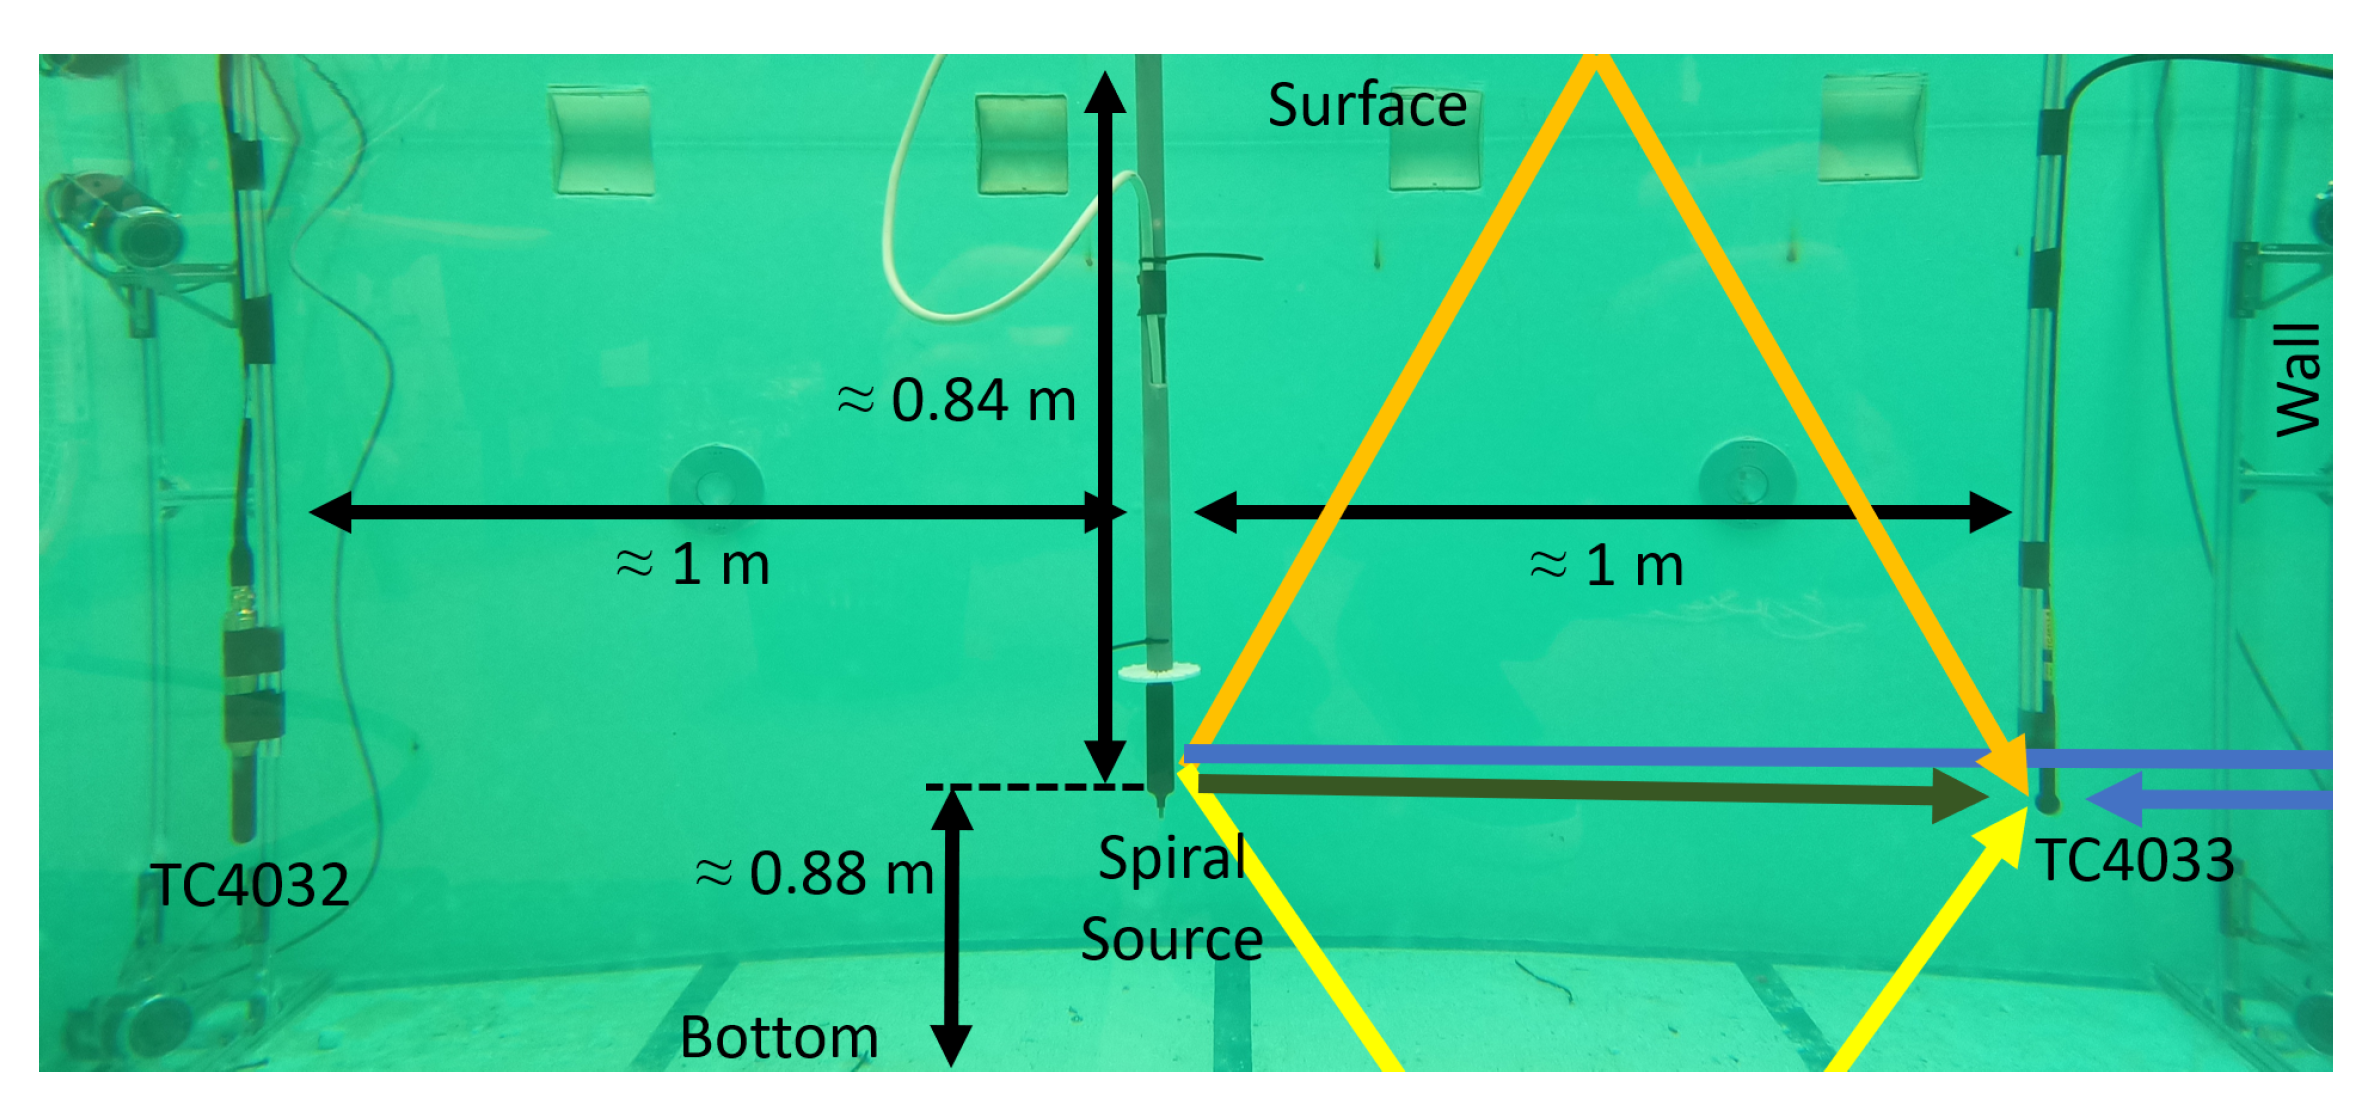
Laboratory acoustic experiments were carried out in January 2023 with the developed spiral source in the water tank at the Robotics and Autonomous Systems (CRAS), at FEUP, Porto, Portugal. It is a tank filled with with chlorine water with a width of 4.6 meters, a length of 4.8 meters and a water depth of 1.72 meters. In the center of the tank there was a metal bridge, above the water, used to hold equipment. The spiral source was mounted at the center of the tank on a tube that was fixed to the bridge. Two calibrated hydrophones, the RESON TC4033 and TC4032, were attached to two vertical bars at 1 meter from the spiral source.
Figure 6 shows the placement of the three devices (spiral source, TC4033 and TC4032) at 0.84 meters depth.
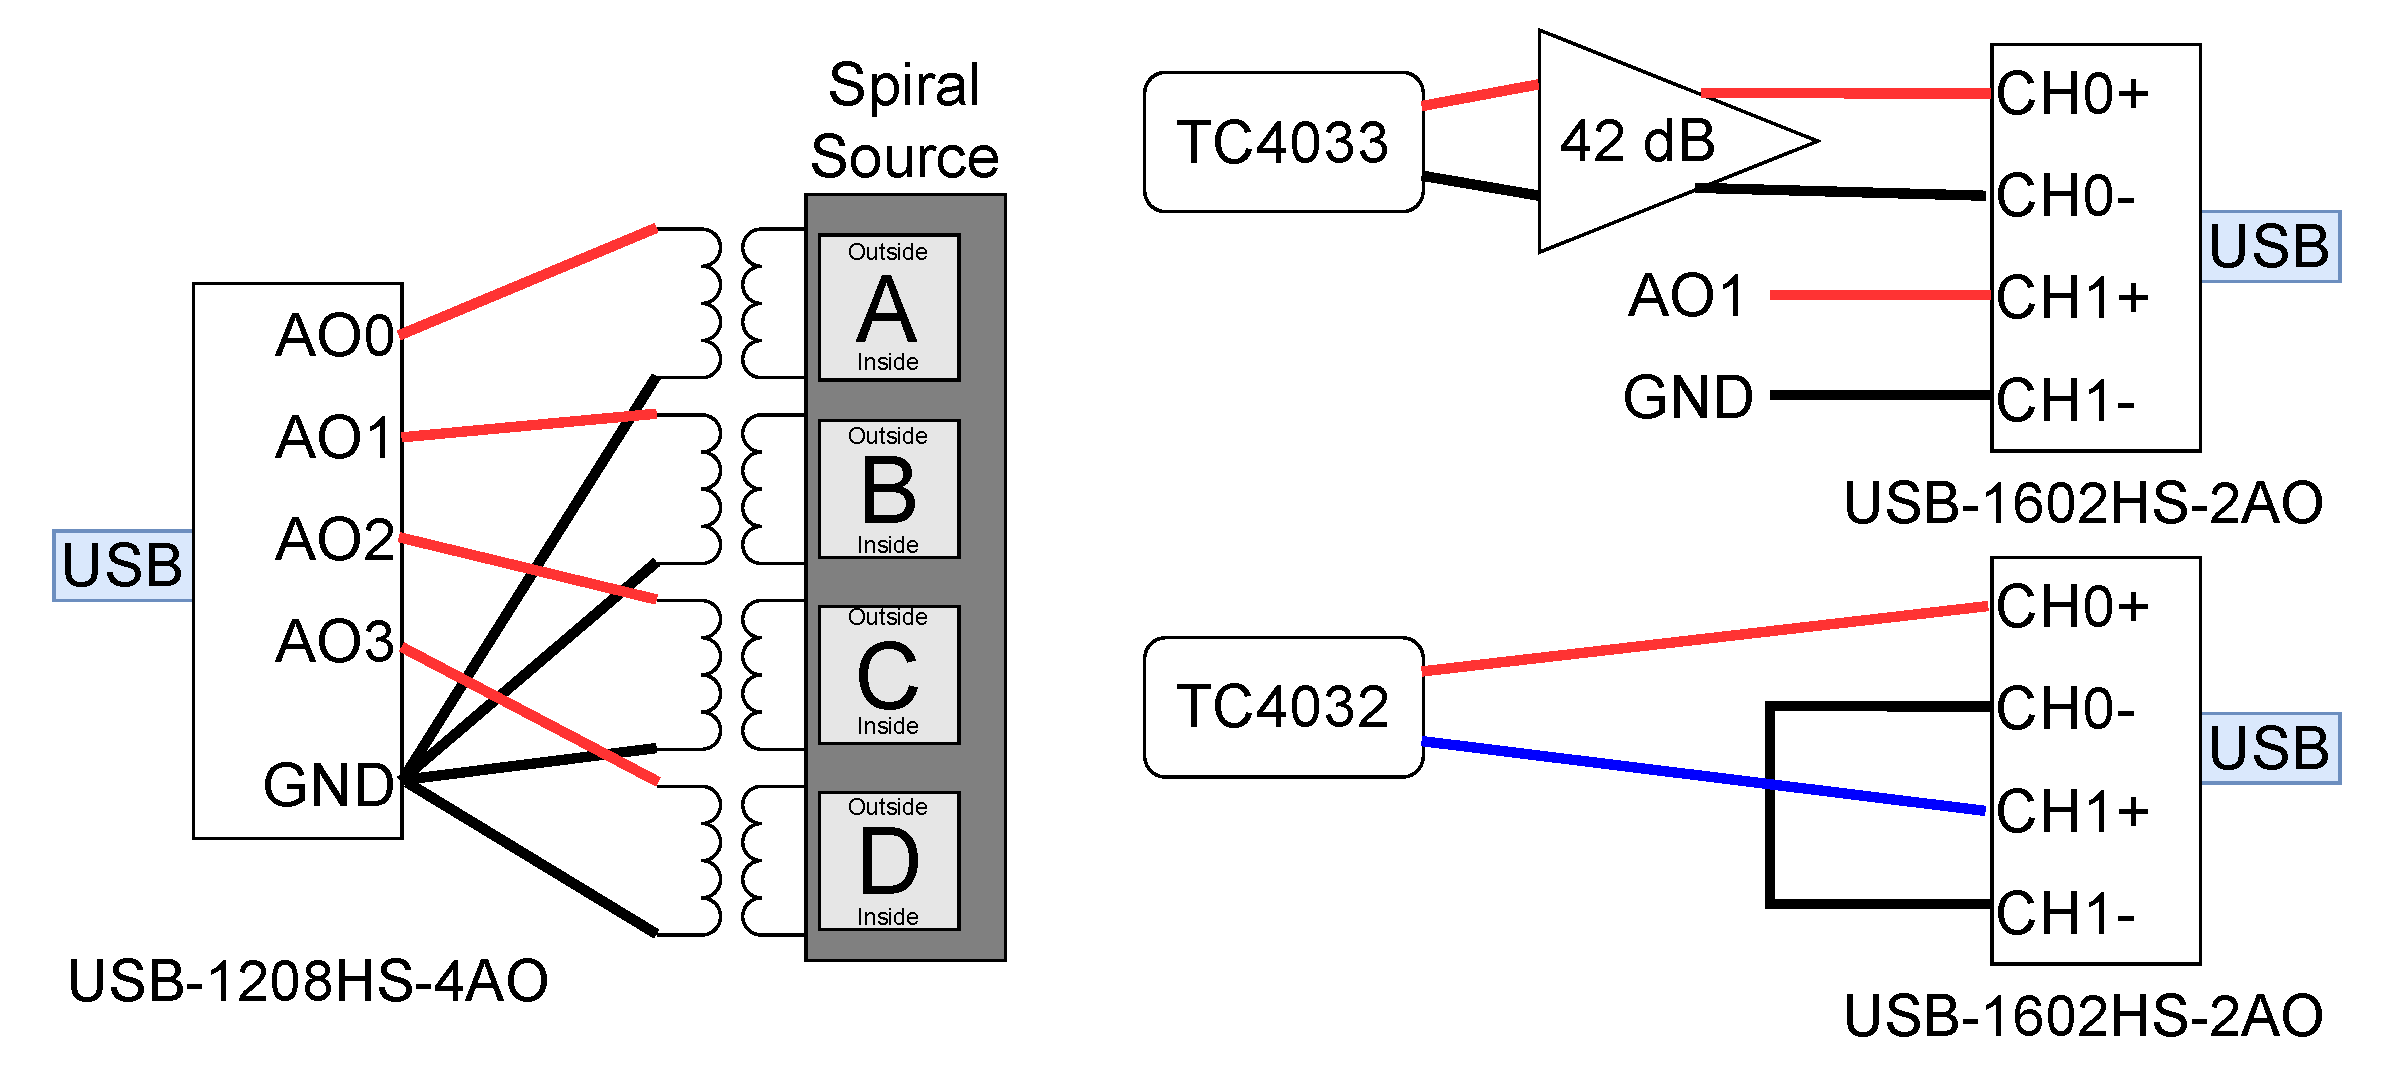
Figure 7 shows the electronic setup for generating and acquiring the transmitted and received signals. The 4 quadrant spiral source transmitted signals were digitally generated using a computer and sent, via USB, to the USB-1208HS-4AO DAQ for digital to analog conversion. Before applying the signals to the spiral source 4 toroidal transformers with unity-gain were used to ensure the electrical isolation between the 4 quadrants. On the receiving side the signal captured by the TC4032 was connected to a USB-1602HS-2AO DAQ in differential mode and the TC4033 was connected to a 42 dB gain pre-amplifier and acquired in another USB-1602HS-2AO DAQ in single mode. The latter DAQ also acquires the transmitted signal in the quadrant B of the spiral source and was used as a synchronization signal. All signals were acquired with a sample rate of 1 Msps.
Before carrying out the acoustic tests associated with the functioning of the spiral source, it was necessary to estimate the channel impulse response (CIR) for observing the delay and size of the tank’s multipath. This multipath experimentation was relevant to define the maximum duration of the transmitted signals and the time interval between them.
Figure 6 also depicts the most relevant expected paths between the spiral source and the hydrophones with the direct path in dark-green, the path with one surface reflection in orange, the path with one bottom reflection in yellow, and the path with one wall reflection in blue.
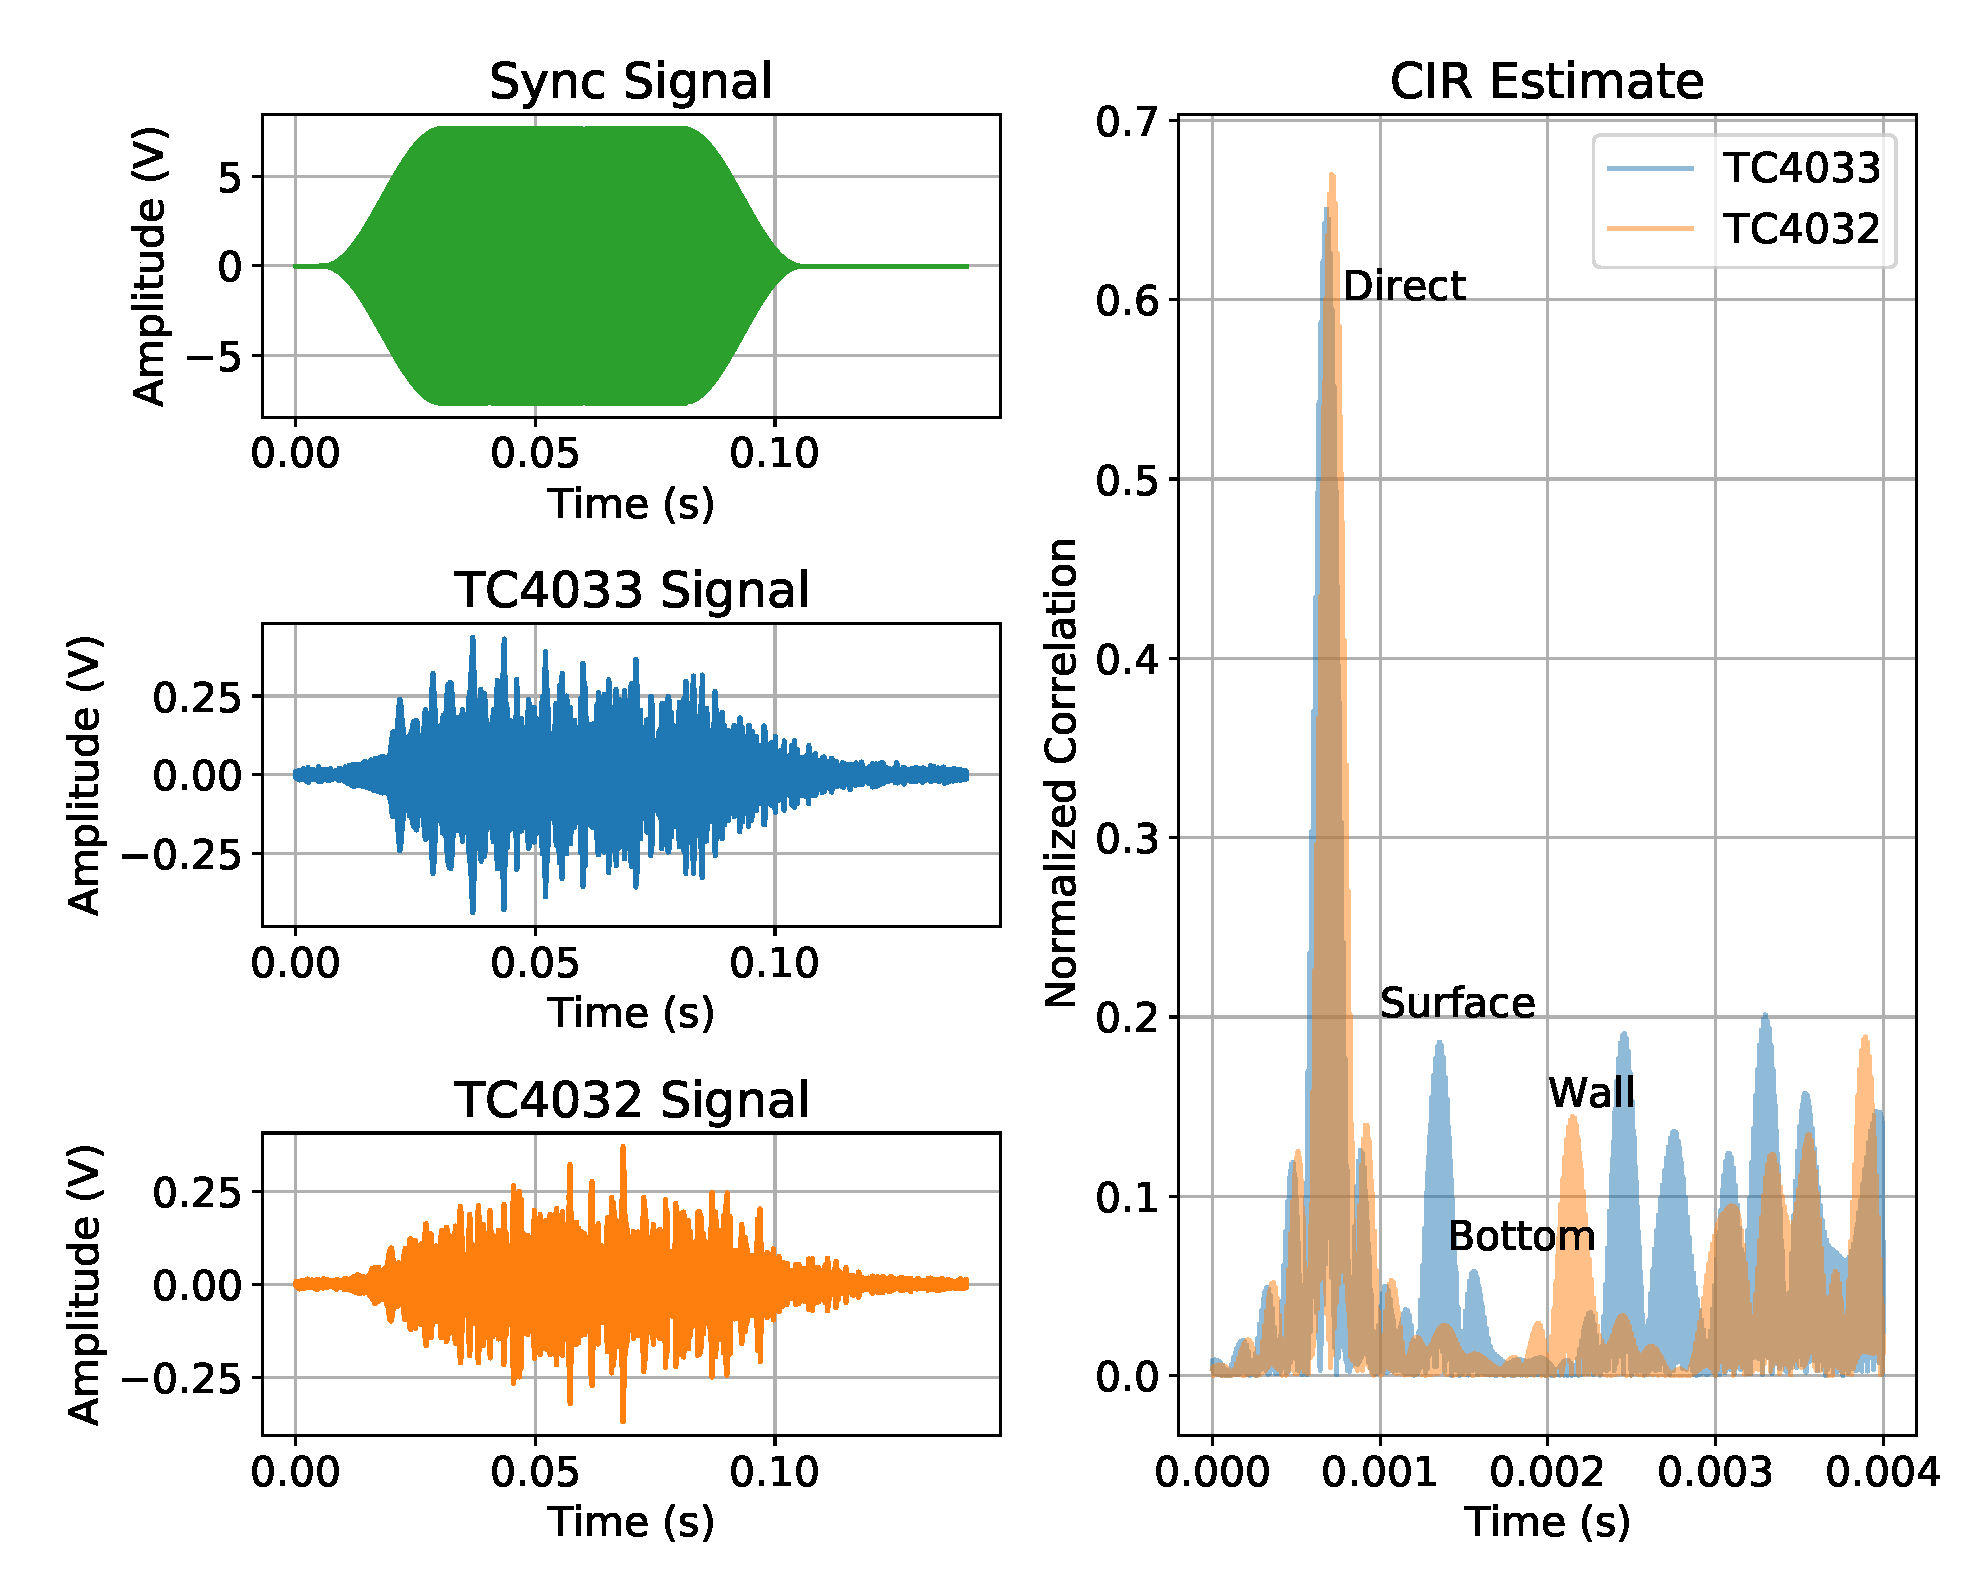
For synchronization and CIR estimate, a single linear chirp signal between 40 and 50 kHz, with 100 ms of duration, windowed with cosine squared shoulders for 50% of the signal duration [
6], was emitted in the four quadrants.
Figure 8, shows on the left side the acquired signals, from top to bottom: the synchronization signal, the signal received in the TC4033 hydrophone, and the signal received in the TC4032 hydrophone; and on the right side a zoom of the estimated CIR obtained by cross-correlating the synchronization signals with the signal received in the TC4033 (blue) and in the TC4032 (orange). The TC4033 signal has the first four arrivals at 0.68 ms, 1.35 ms, 1.56 ms, and 2.46 ms, which correspond to travel distances of 1.02 m, 2.03 m, 2.34 m, and 3.69 m, assuming a sound speed underwater of 1500 m/s, which is in good agreement with the pool and setup dimensions sketched in
Figure 6. These calculations suggest that the TC4033 first arrival is the direct path (expected value of 1 m), the second arrival is the path with one surface reflection (expected value of 1.96 m), the third arrival is the path with one bottom reflection (expected value of 2.02 m), and the fourth arrival is the path with one wall reflection (expected value of 3.60 m), as sketched in
Figure 8. The TC4032 signal has the first two relevant arrivals at 0.72 ms and 2.15 ms, which correspond to travel distances of 1.08 m and 3.23 m. Since the TC4032 becomes directional in the vertical direction when the frequency increases, the surface and bottom reflections can not be observed, thus resulting that the first path is the direct path and the second relevant path should be the path with one wall reflection.
Since, in the TC4033, the time between the first and second paths is approximately 0.67 ms, the transmitted signal duration should be smaller than 0.67 ms to avoid multipath overlap at the reception. However, for having a reasonable number of cycles (16) for the lower frequency signal (20 kHz) a signal duration of 0.8 ms was used. Due to the cosine squared shoulder attenuation the excess of 0.13 ms does not generates a relevant overlapping problem. The full multipath CIR estimate of the TC4033 and TC4032 signals suggests that after 50 ms the intensity of the multipath is almost negligible. These notes were relevant to define the duration and the time interval between the transmitted signals, which are described in
Section 4.1.
4. Spiral Signal Processing
The signal processing involved in this work was divided in three phases: Transmission, Reception, and the Receiving Calibration (phase adjustments on the reception side).
4.1. Signal Transmission
Since the developed spiral source has 4 quadrants, it is necessary to apply four electric signals simultaneously to the spiral source, one in each quadrant. Similarly to [
6] chirp signals were used for allowing an accurate synchronization between the circular and the spiral signals at the receiving side. The four-quadrant signals, for the circular wave generation, are equal and given by
where
,
and
are the start and end frequencies, respectively, and
is the chirp duration. The four chirps for the spiral wavefront emission, are given by
where
is the initial phase of each quadrant (
,
,
,
).
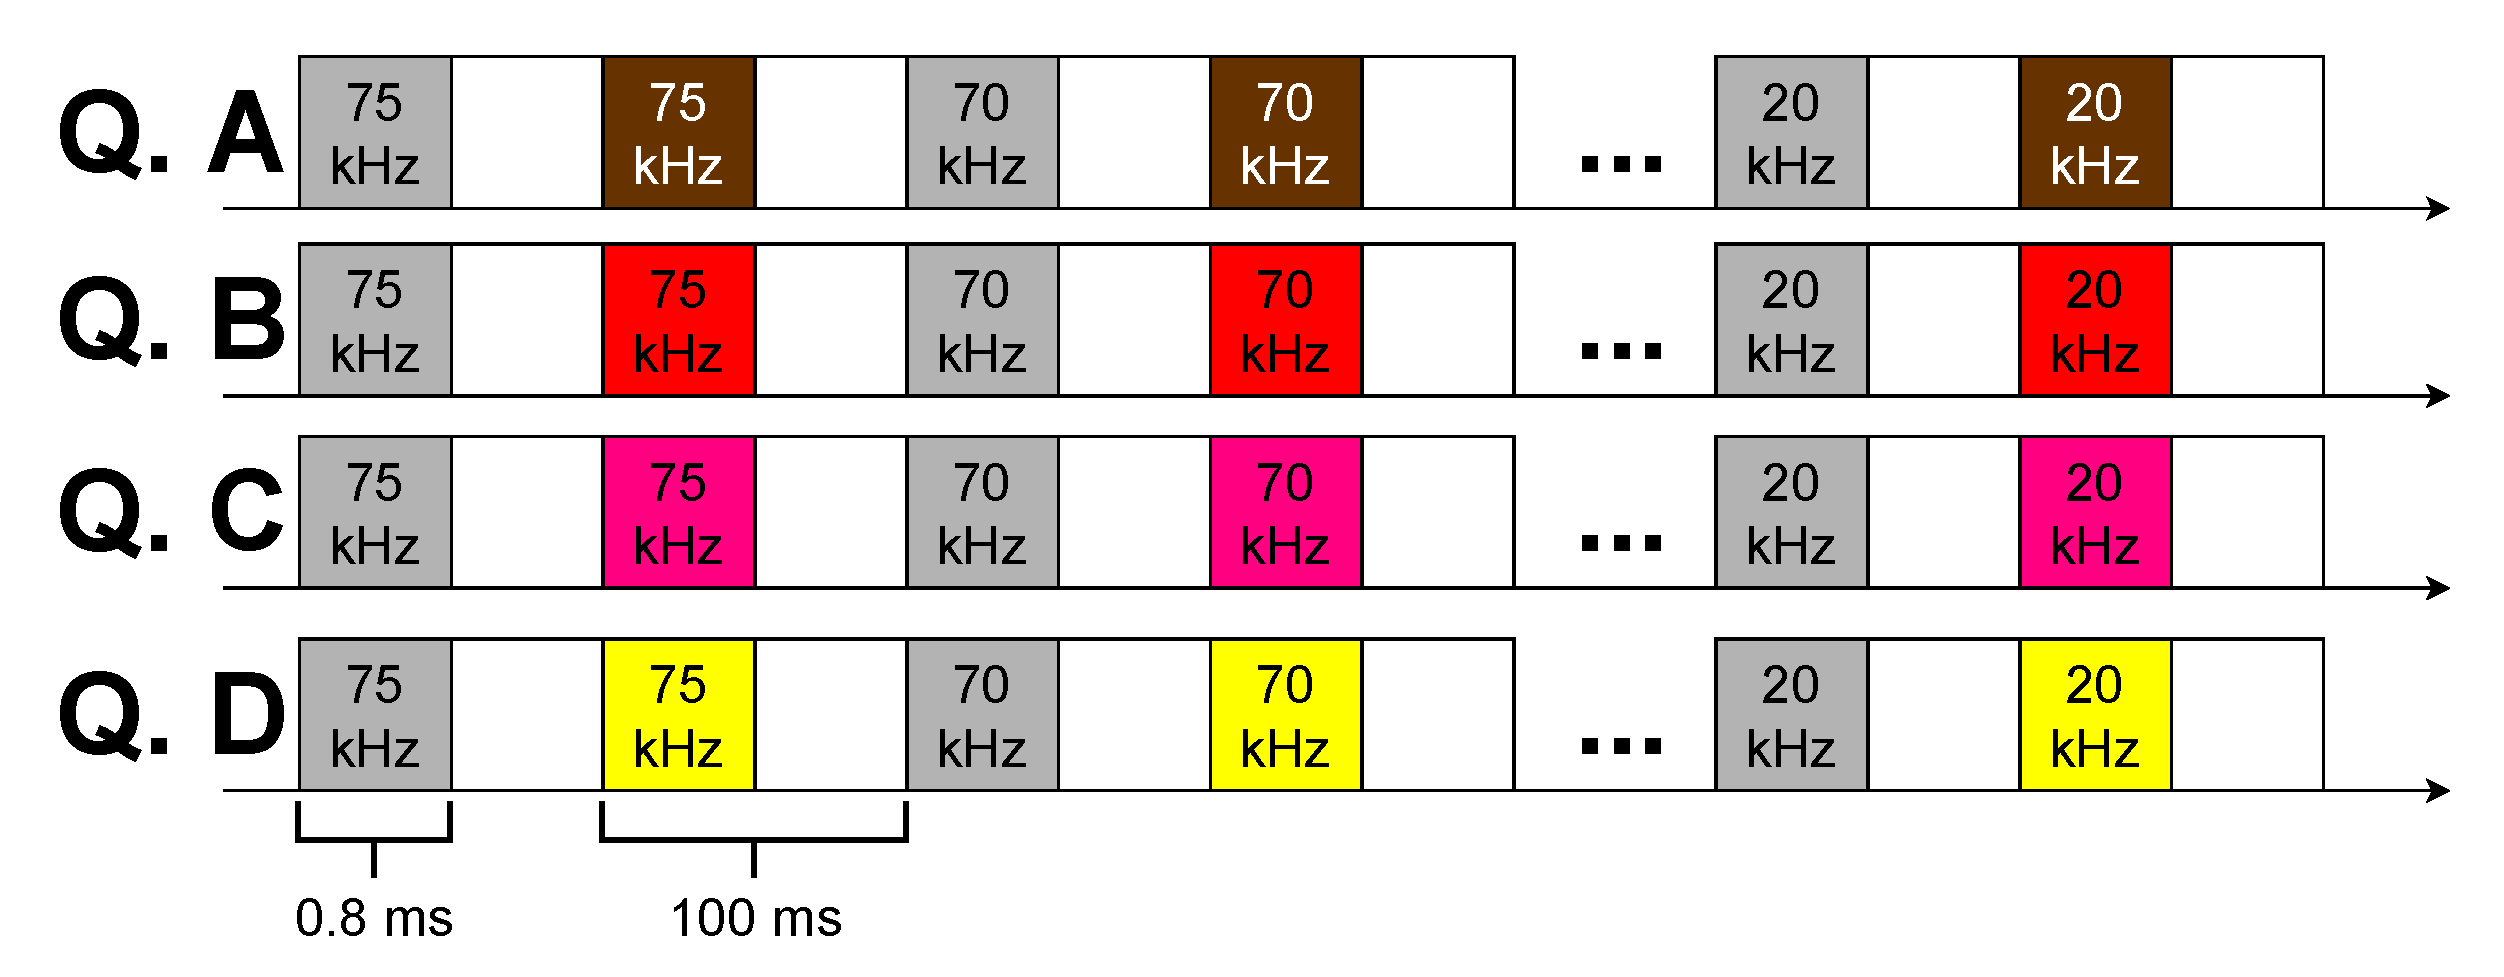
All chirps have a 500 Hz band and 0.8 ms duration windowed with cosine squared shoulders for 50% of the signal duration (see
Figure 8: "Sync Signal"). For evaluating the spiral source performance along the frequency the above chirps were transmitted with starting frequencies from 20 kHz to 75 kHz, every 5 kHz.
Figure 9 shows the sequences of transmitted signals for each quadrant ("Q. A", "Q. B", "Q. C", and "Q. D"): the white blocks represent pauses of 99.2 ms, the gray blocks represent the chirps for generating a circular wavefront, and the blocks with the other four colors represent the chirps for generating the spiral wavefront.
4.2. Signal Reception
On the reception side, each hydrophone receives the transmitted circular and spiral wavefronts together with multipath. Since this work aims at performing the spiral source calibration, the pulse due to the direct path should be isolated and synchronized for the circular and spiral wavefronts. In the following, the direct path signal due to the circular wavefront and the one due to the spiral wavefront will be termed
and
, respectively. The phase difference between the two signals (reference and spiral) is given by
where
and
are the Fourier transforms of
and
, respectively,
is a bounding operation that bounds the angle in the range
,
is the complex argument function, and
is the spiral source bearing angle relatively to the hydrophone. If there is no systematic and random errors the bearing angle of the spiral source would be given by
4.3. Receiving Phase Calibration
The receiving calibration, or phase adjustment, aims at compensating the systematic errors generated by the spiral source. Those phase systematic errors are bearing angle,
, and frequency,
, dependent, thus resulting that
is also given by
where
is the phase systematic error, and can be determined if the "measured"
and the "true"
are known.
Considering that only a subset of bearing angles are available, the phase systematic error for the frequency
can be estimated using, e.g., a one-dimensional interpolation for each frequency, thus resulting
. The estimated phase systematic error
is then used to estimate the spiral source bearing angle,
, which is given by
where
can be computed based on a one-dimensional linear interpolation given by
where the pairs
and
were previously computed for known
and
bearing angles, respectively, and
. Thus resulting that the receiving calibrations proposed method requires a "previous dataset" for computing the pairs
with known
, and a "current dataset" with the
measurements. Those values allows the phase systematic error estimate with (
8) and the bearing angle estimate with (
7).
The performance of the receiving calibration method can be measured by the angle error, at frequency
, and is given by
where
and
are the true and estimated spiral source bearing angles, respectively.
5. Acoustic Spiral Source Experiments
After analyzing the acoustic multipath and defining the signal features, four sets of signals acquired during the experiment are reported in this work. In all the acquisitions, the spiral source was hand rotated, with the aid of a protractor placed on top of the spiral source, while the calibrated hydrophones remain static, thus resulting in a variable bearing angle.
For
subsection 5.1, datasets 1 and 2 where recorded with 8 rotations of the spiral source (from 0 to 360 every 45, with two acquisitions for each angle). Those datasets were used to measure the Transmitting Voltage Response (TVR) and to calibrate the bearing angle using the proposed receiving calibration method of
subsection 4.3.
For
subsection 5.2, dataset 3 was acquired with 16 rotations (from 0 to 360 every 22.5). This dataset was acquired two days after datasets 1 and 2, and was used for evaluating the horizontal directivity pattern and the persistence of the receiving calibration along time.
For
subsection 5.3, dataset 4 was acquired with the hydrophone TC4032 placed approximately 1.5 m away from the spiral source, and hanged from an electric hook, which allows moving the hydrophone up and down for evaluating the vertical directivity pattern.
5.1. Amplitude and phase calibration
The Transmitting Voltage Response (TVR) characterizes the power generated by an acoustic source over the frequency. The TVR of the spiral source for each frequency
, can be computed, with all quantities in dB, by
where
is the received signal amplitude,
is the calibrated hydrophone’s Open Circuit Voltage Response (OCVR),
is the preamplifier gain, and
is the input signal amplitude. Regarding the electronic setup of
Figure 7, the pre-amplifier gain for the TC4033 and TC4032 was 42 dB and 0 dB, respectively, and the voltage applied to the transducer was 19.78 dB relative to 1 V.
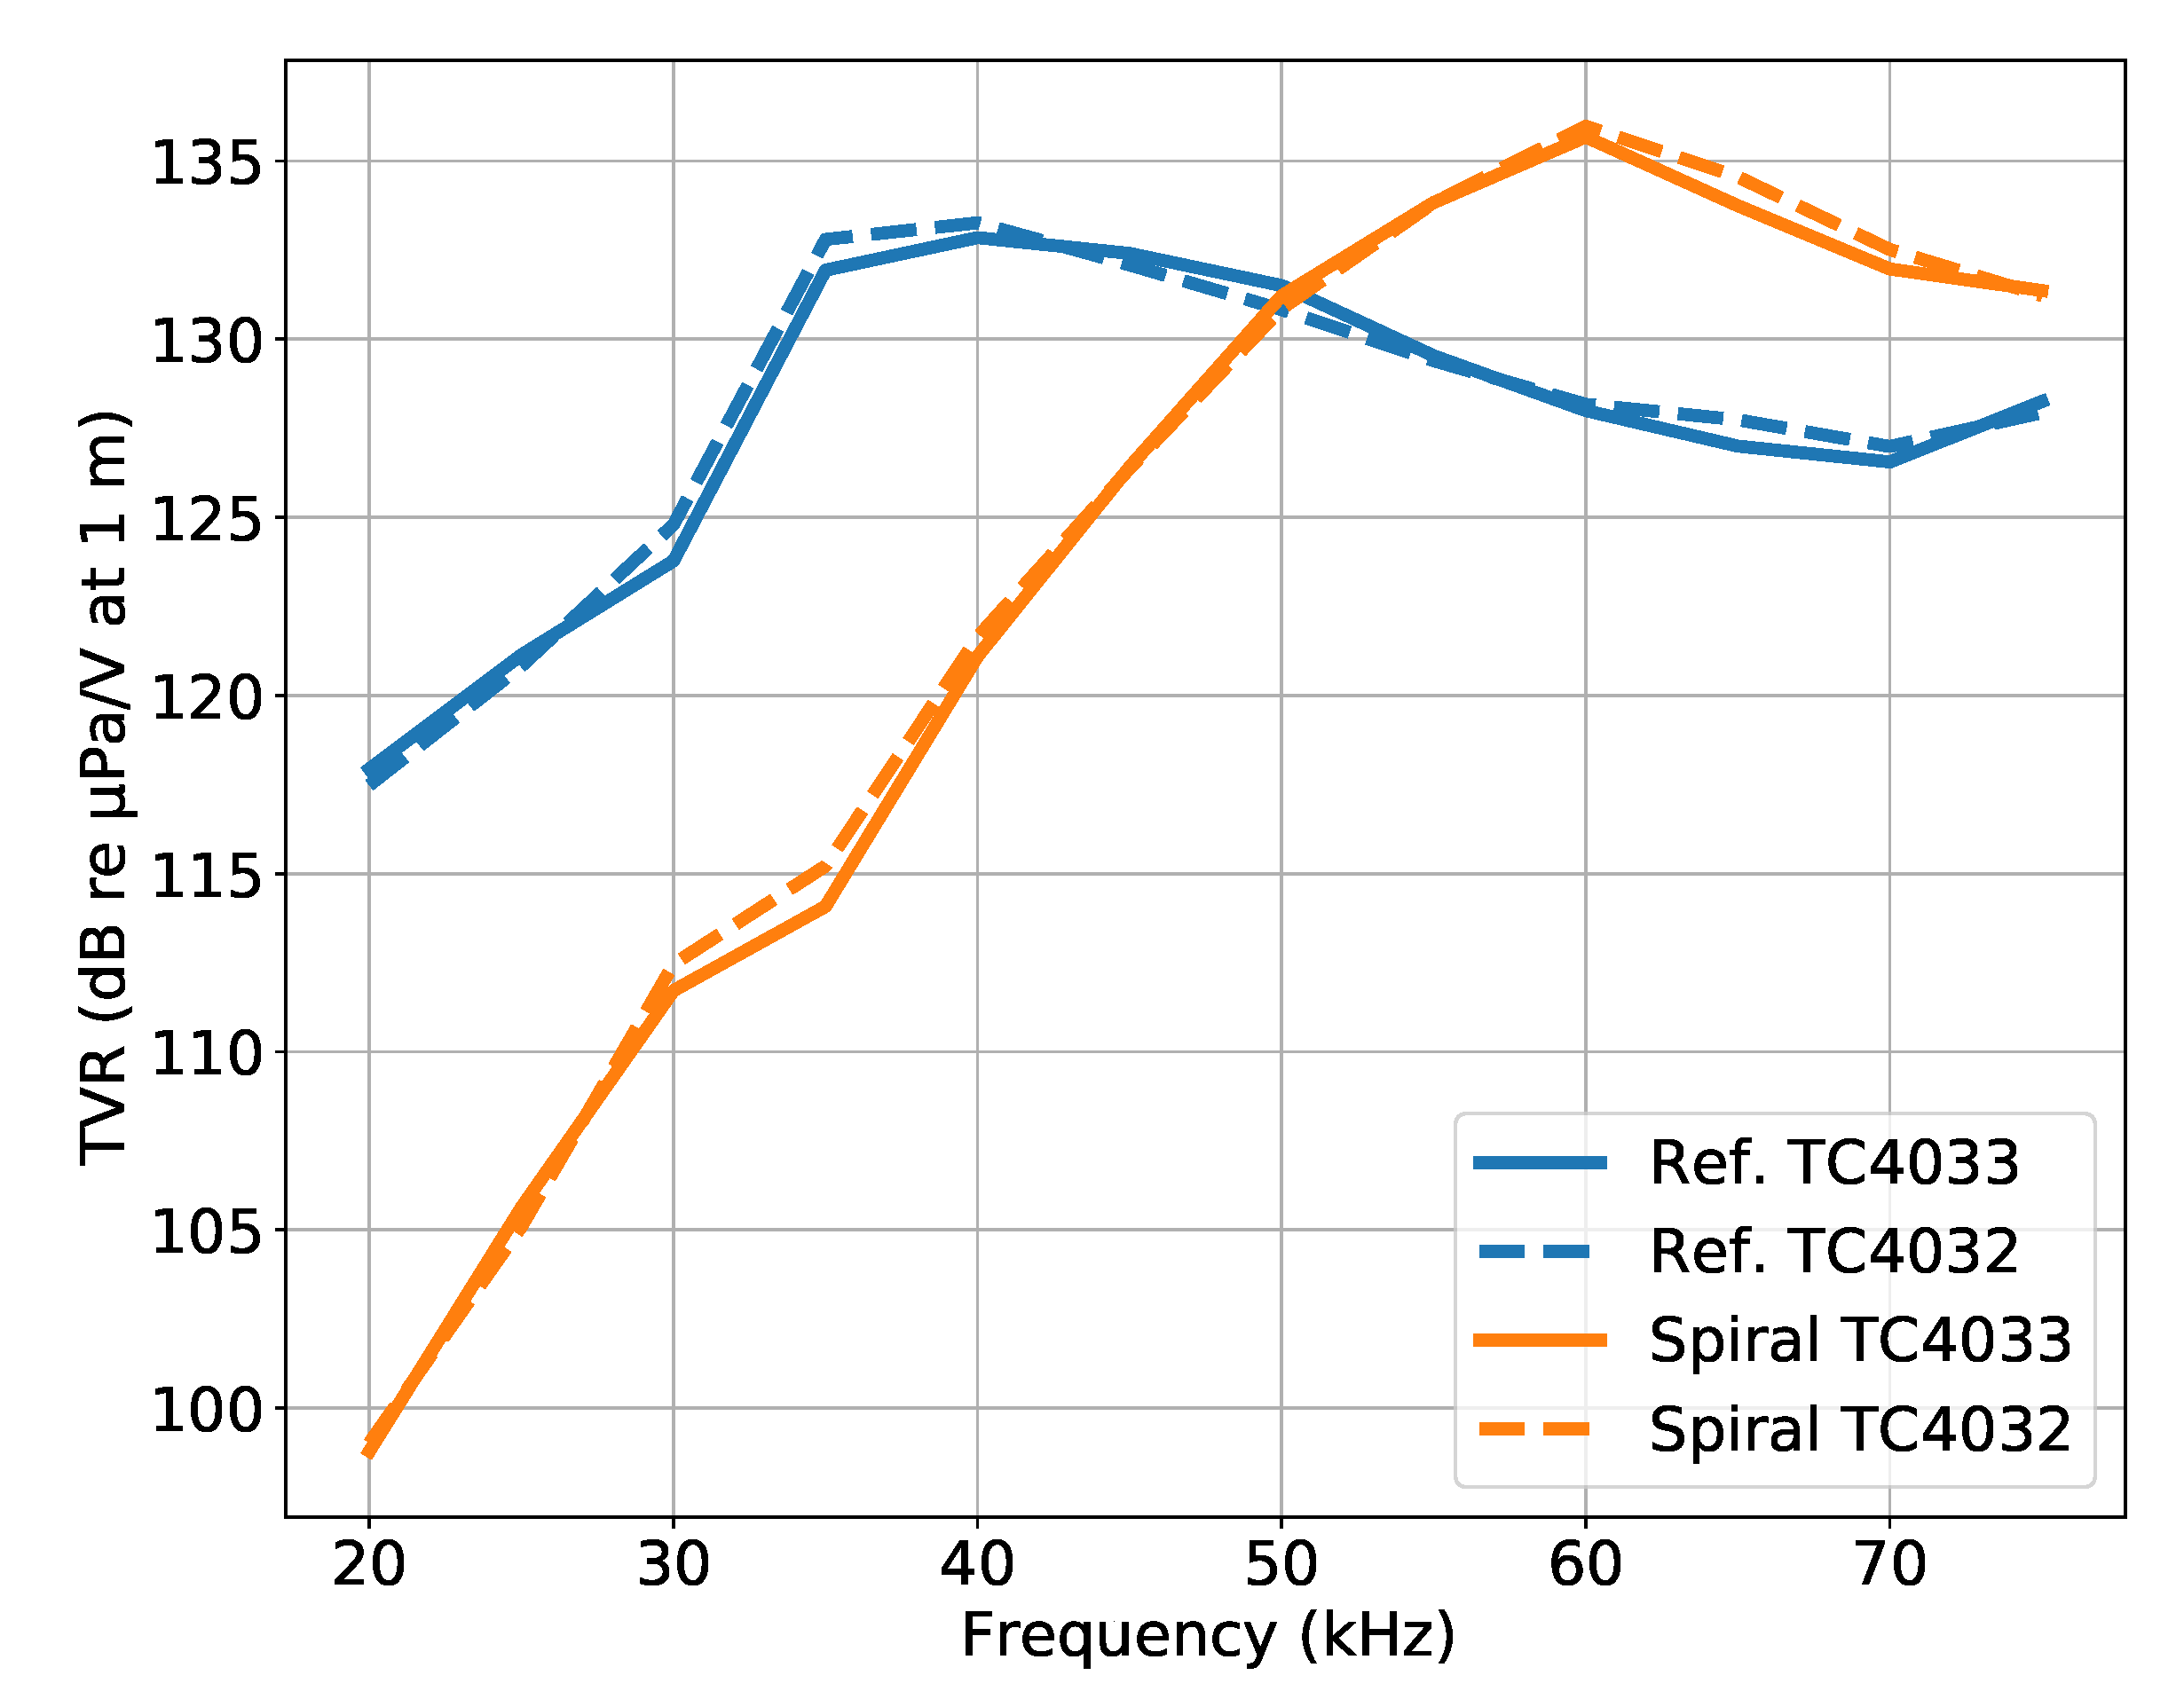
Figure 10 shows the TVR of the developed spiral source for the circular wavefront ("Ref." in blue) and for the spiral wavefront ("Spiral" in orange), based on the Dataset 1 signals for the two hydrophones, at a bearing angle of 0. Both hydrophones present similar results, which serves to confirm that the absolute values obtained are reliable. The circular wavefront have a maximum TVR of 133 dB at approximately 40 kHz, and the spiral wavefront have a maximum TVR of 136 dB at approximately 60 kHz, which confirms, with a reasonable agreement, the estimated resonance frequencies from the Q factor measurements shown in
Figure 5.
At a frequency of, approximately, 50 kHz the circular and spiral wavefronts present a similar TVR, suggesting that would be the preferable frequency for the spiral source operation. Moreover for frequencies bellow 40 kHz the spiral wavefront is projected with a lower power suggesting that the operation at those frequencies will suffer a poor performance.
Figure 11a shows a polar plot of the phase differences calculated for the hydrophone TC4033 with (
4) for the Dataset 1. In the figure, the 8 different colors represents the 8 different bearing angels of the spiral source. When analysed for a single frequency (e.g. the external value corresponding to 75 kHz),
Figure 11a revels that the spiral wavefront is being generated because the blue line is close to 0 and the subsequent lines have an approximate separation of 45 up to green line at 315. A similar behavior can be observed for the remaining frequencies, but with a strong variation along the frequency, which requires calibration.
The receiving calibration, or phase adjustment method, described in
Section 4.3 was applied with dataset 1 as "previous dataset" and dataset 2 as "current dataset".
Figure 11b shows the bearing angle estimates for the hydrophone TC4033 signals. After calibration it is possible to observe that the lines representing the bearing angle are not completely straight lines as would be expected if the calibration perform accurately. However a good adjustment is verified.
Figure 12 shows the angle error
given by (
9), over the frequency
, after the calibration, for the bearing angle estimates of
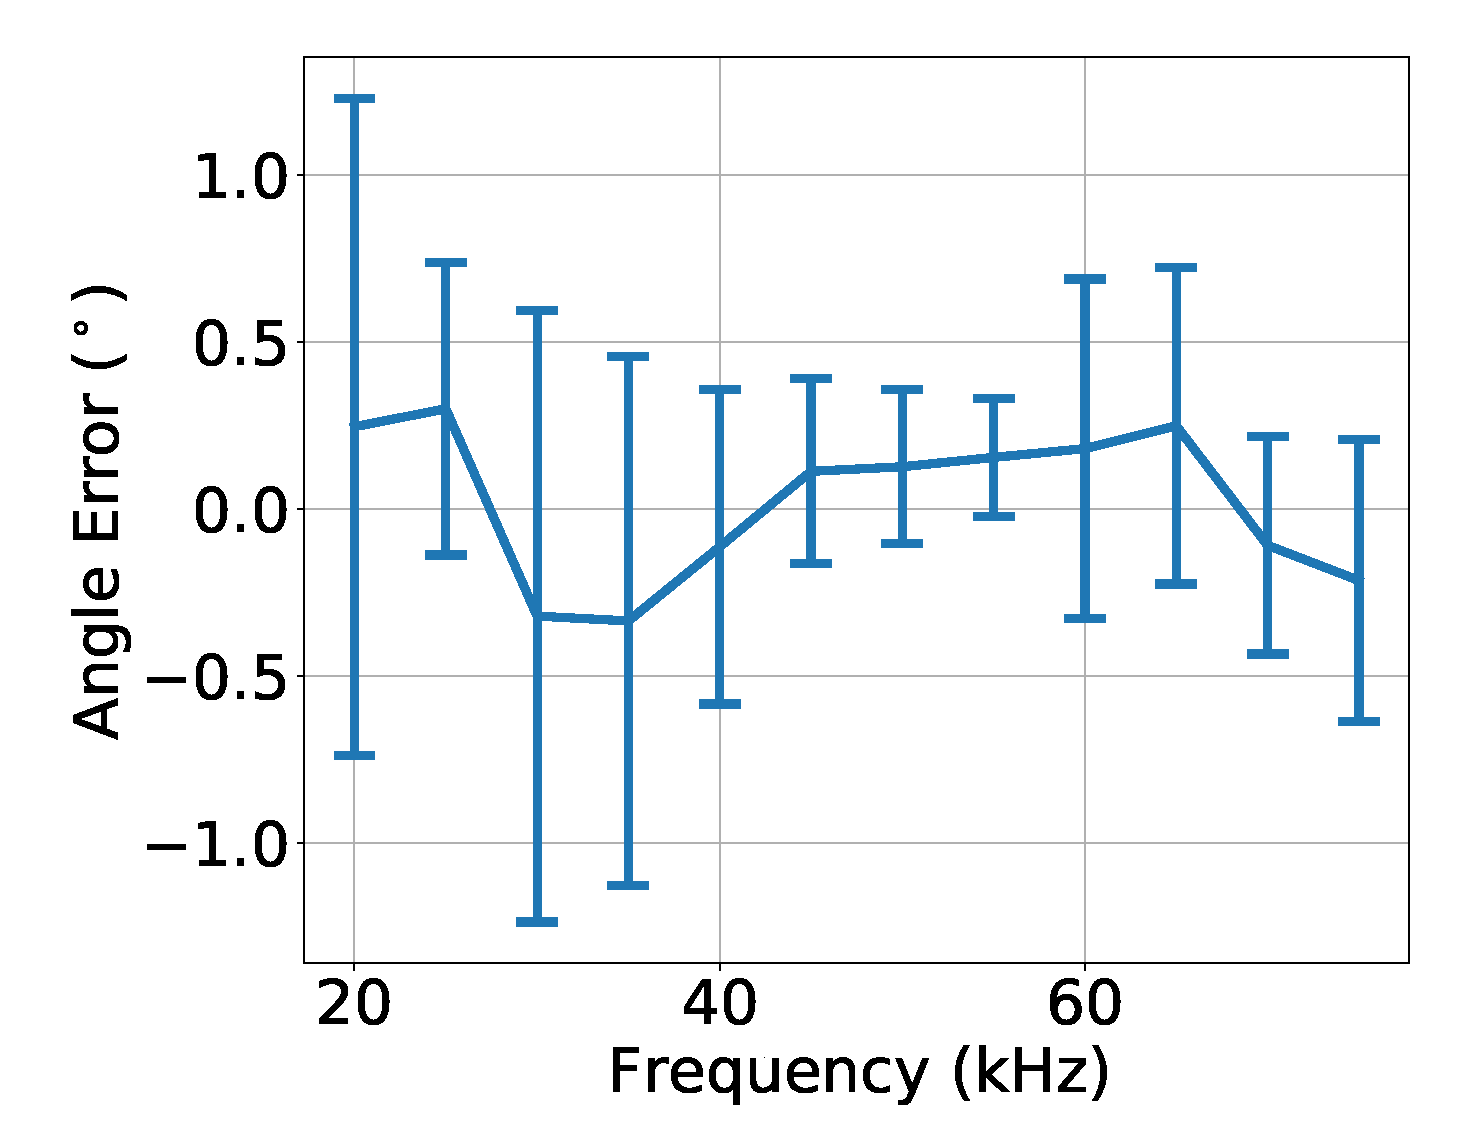
Figure 11b. In the figure, the line represents the mean angle error, and the vertical bars represent the corresponding standard deviation. It is possible to observe that between 45 kHz and 55 kHz, where the TVR of
Figure 10 is favorable, the absolute mean angle error is less than 0.2, and that the phase variability is greater for low frequencies, where the standard deviation increases up to 1 and the TVR for the spiral wavefront has a strong reduction.
5.2. Horizontal Directivity evaluation
The Horizontal Directivity Pattern is the representation of the TVR values at different bearing angles relative to the acoustic source.
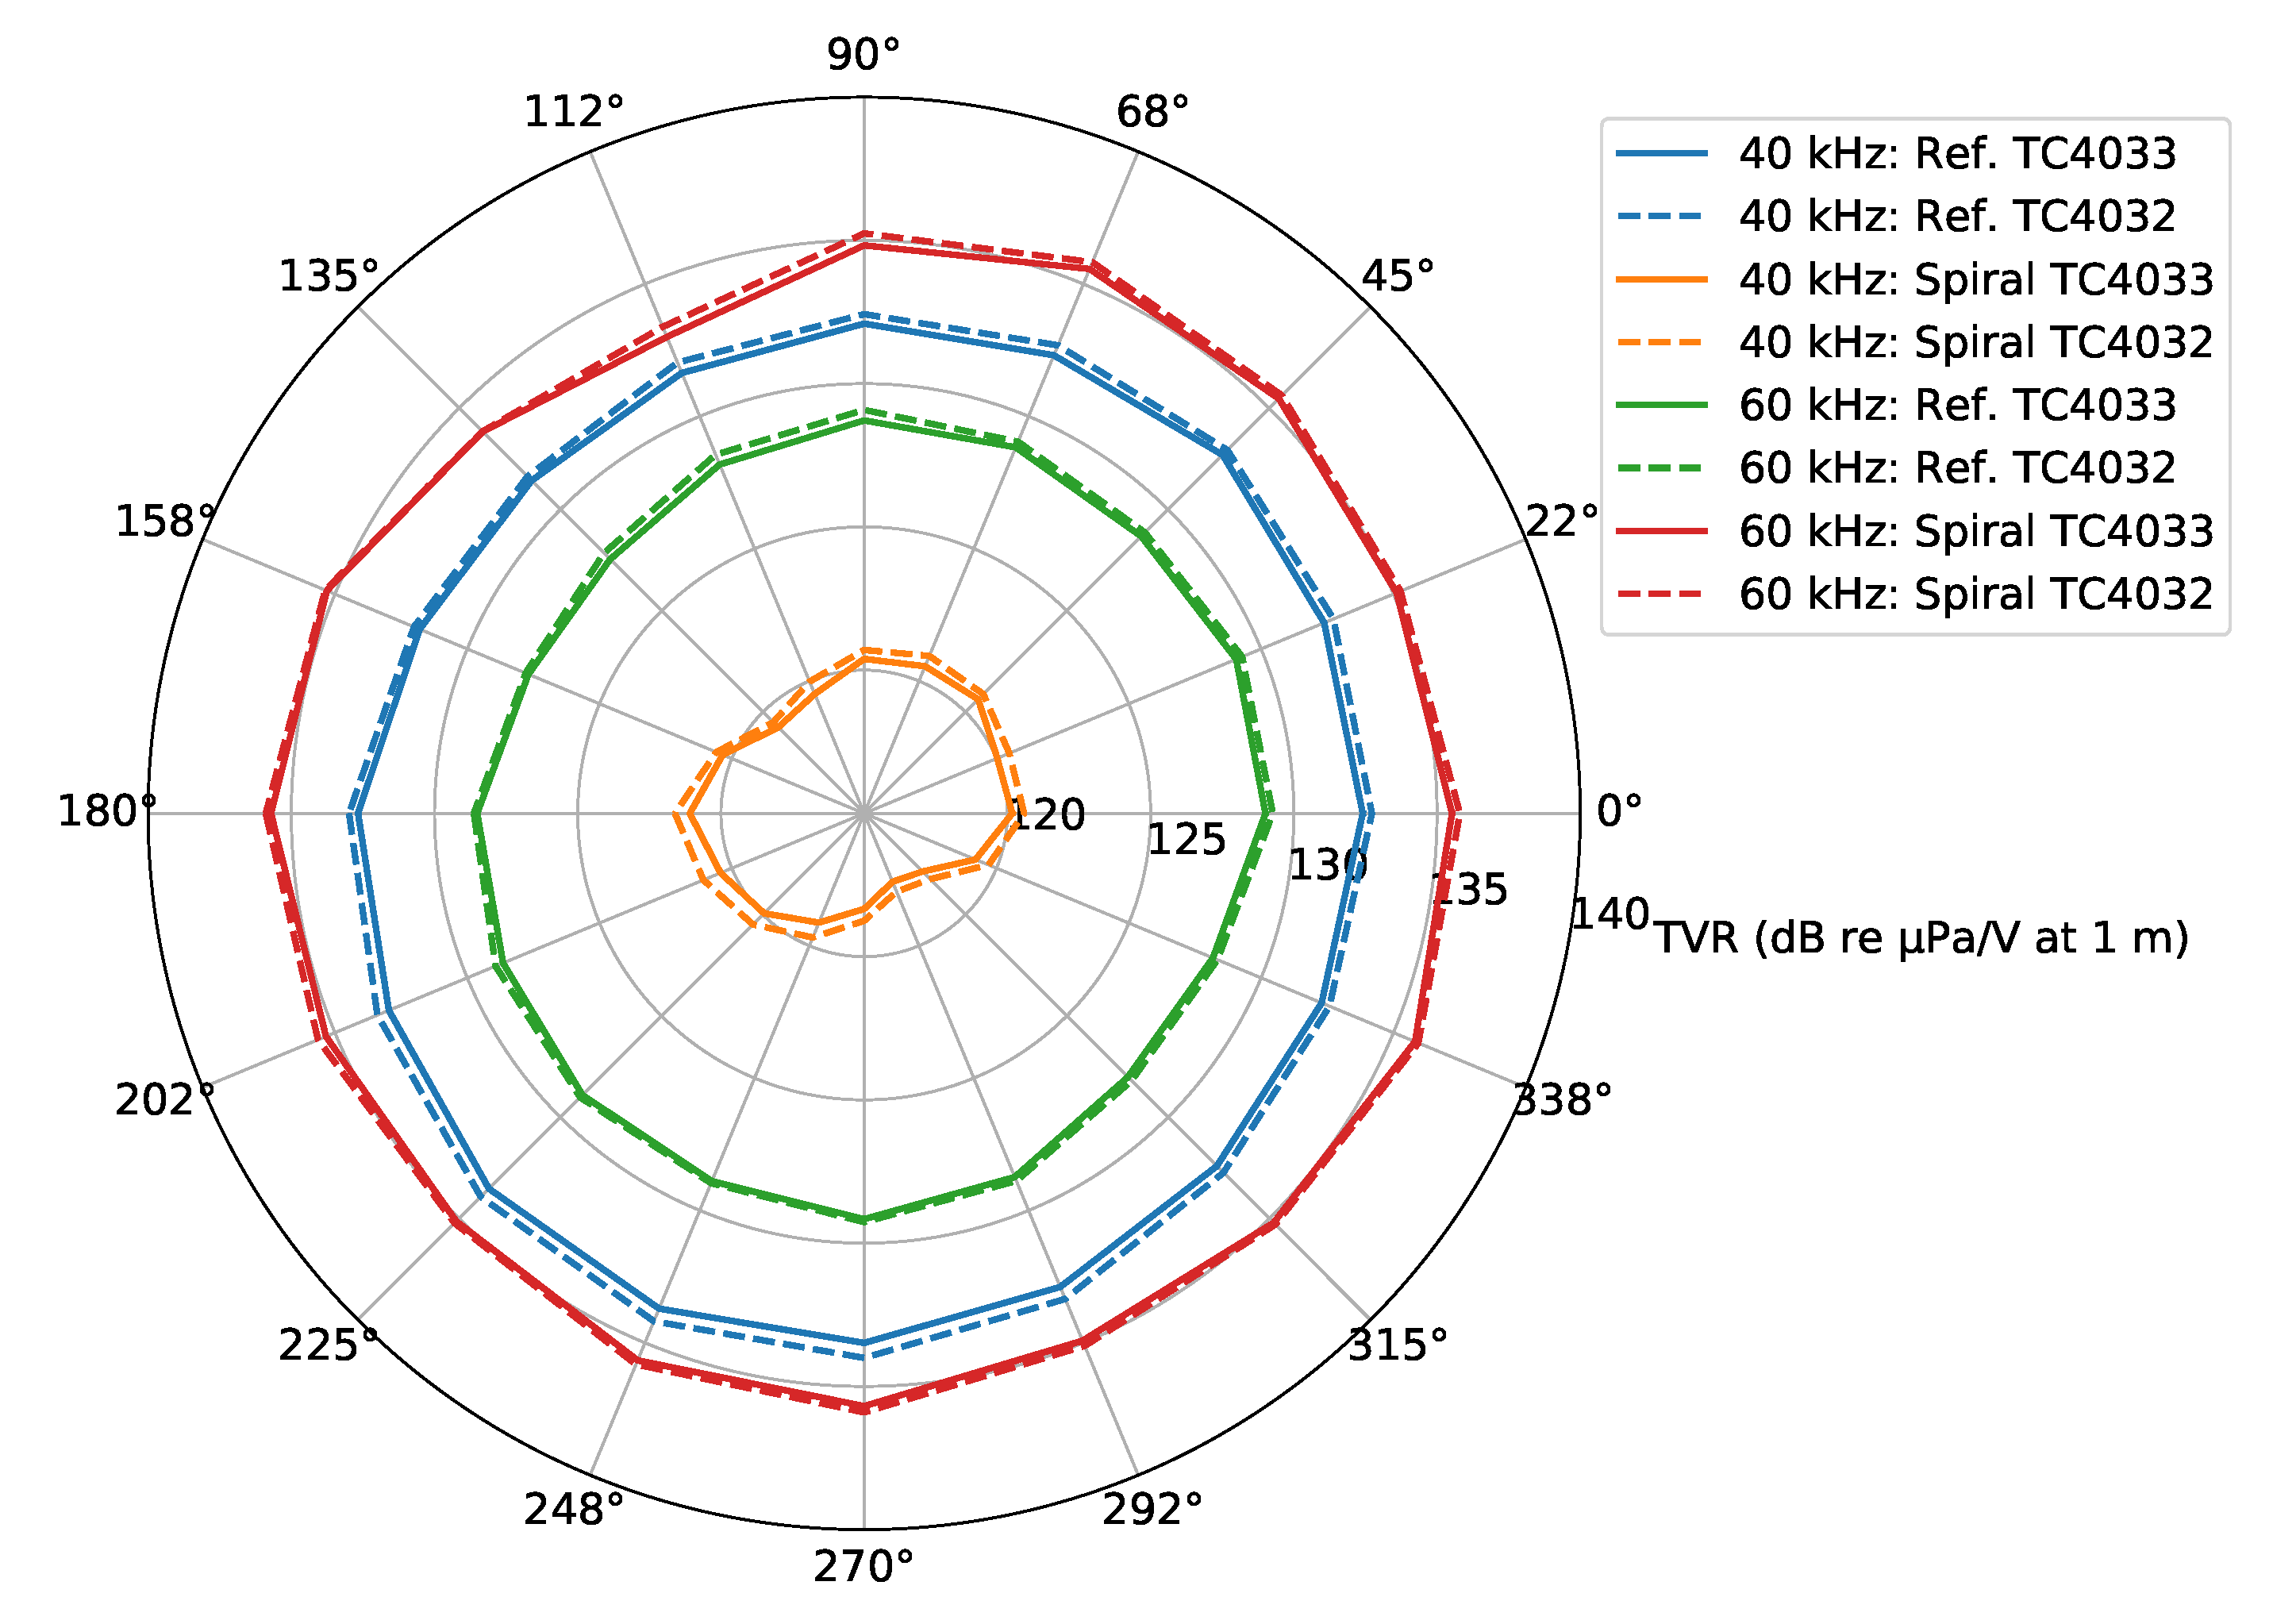
Figure 13 shows the Horizontal Directivity Pattern of the developed spiral source for the circular wavefront ("Ref.") and for the spiral wavefront ("Spiral"), based on the Dataset 3 signals of the two hydrophones (TC4033 and TC4032), for two frequencies: 40 kHz (blue-circular and orange-spiral curves) and 60 kHz (green-circular and red-spiral curves). In the figures it would be desirable to have a circular shape for the directivity pattern, however a flattening can be observed for certain bearing angles. The figure, shows that the TVRs computed with both hydrophones are similar which excludes that the flattening abnormalities would be due to hydrophones. Comparing the circular and spiral directivity patterns the flattening for the spiral wavefront is bigger. Despite the flatness could be due to the hand made construction of the spiral source, other hypothesis like any unknown type of interference between the quadrants can not be excluded.
The values of
Figure 13 are in agreement with the TVR values of
Figure 10: at 40 kHz the spiral wavefront is lower than the circular wavefront, and at 60 kHz the opposite occurs.
In order to test the persistence of the phase calibration for long time periods, the same receiving calibration procedure described in
Section 4.3 was performed with dataset 1 as "previous dataset" and dataset 3 as "current dataset", which was acquired two days later.
Figure 14 shows the bearing angle estimates where, despite the 16 bearing angles of the experiment are clearly visible and distinguishable, a strong variability can be observed.
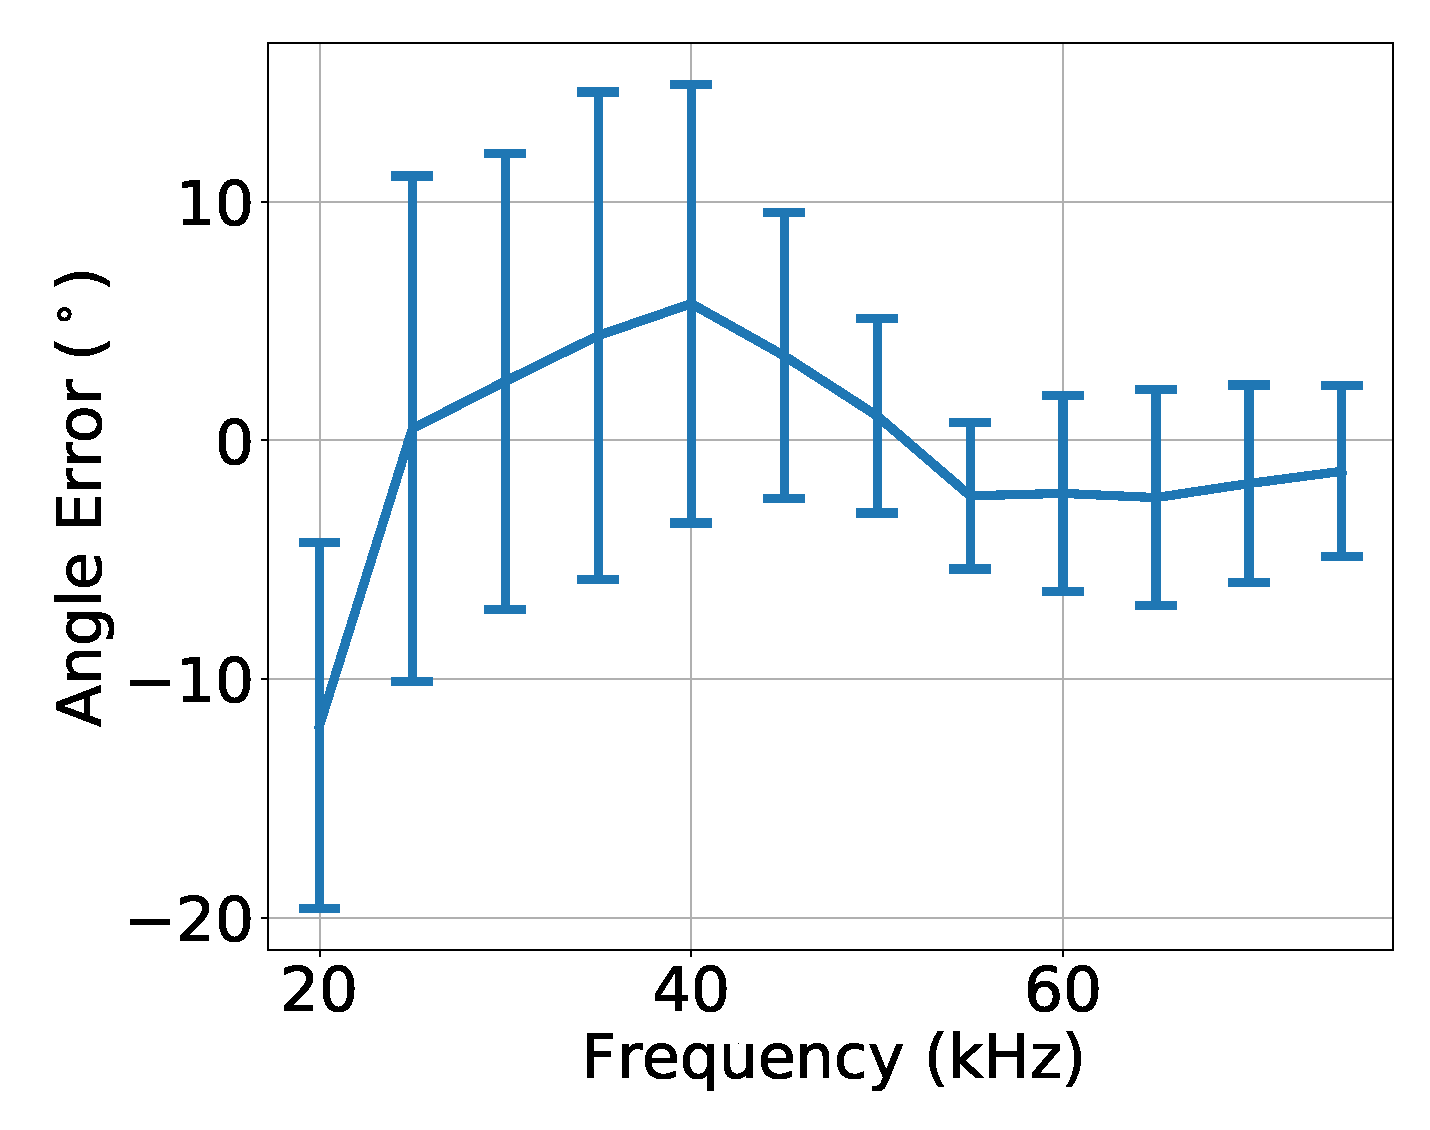
Figure 15 shows the angle error
given by (
9), over the frequency
, after the calibration, for the bearing angle estimates of
Figure 14. Those results show that above 50 kHz the absolute mean angle error is less than 2.5 with standard deviations less than 5, and that the absolute mean angle error can reach almost 11 below 50 kHz, with standard deviations greater than 6.
Figure 14 and
Figure 15 show the receiving calibration performance for Dataset 3 where the signals were recorded under conditions that may not be exactly the same as the recording conditions of dataset 1. Moreover, the calibration behavior is evaluated for recordings at bearing angles that were not considered in the "previous dataset": 22.5, 67.5, 112.5, etc. Unfortunately, the same conditions are not guaranteed due to the manual rotation of the source, since the verification of the spiral source bearing angle presents a considerable uncertainty. These uncertainties are a plausible explanation for the strong variability of the results along the frequency of
Figure 14. An experiment with less uncertainties is required for an accurate evaluation of the proposed calibration method. As a positive fact, the performance around 50 kHz is better, suggesting that the region where the circular and spiral TVRs are similar (see
Figure 10) is the preferable region for operating the spiral source.
5.3. Vertical Directivity evaluation
For a full evaluation of the spiral source and to confirm that the bearing angel estimated at the receiver does not vary with depth, since the spiral wavefront is only generated in the horizontal direction, the vertical diretivity was evaluated with Dataset 4.
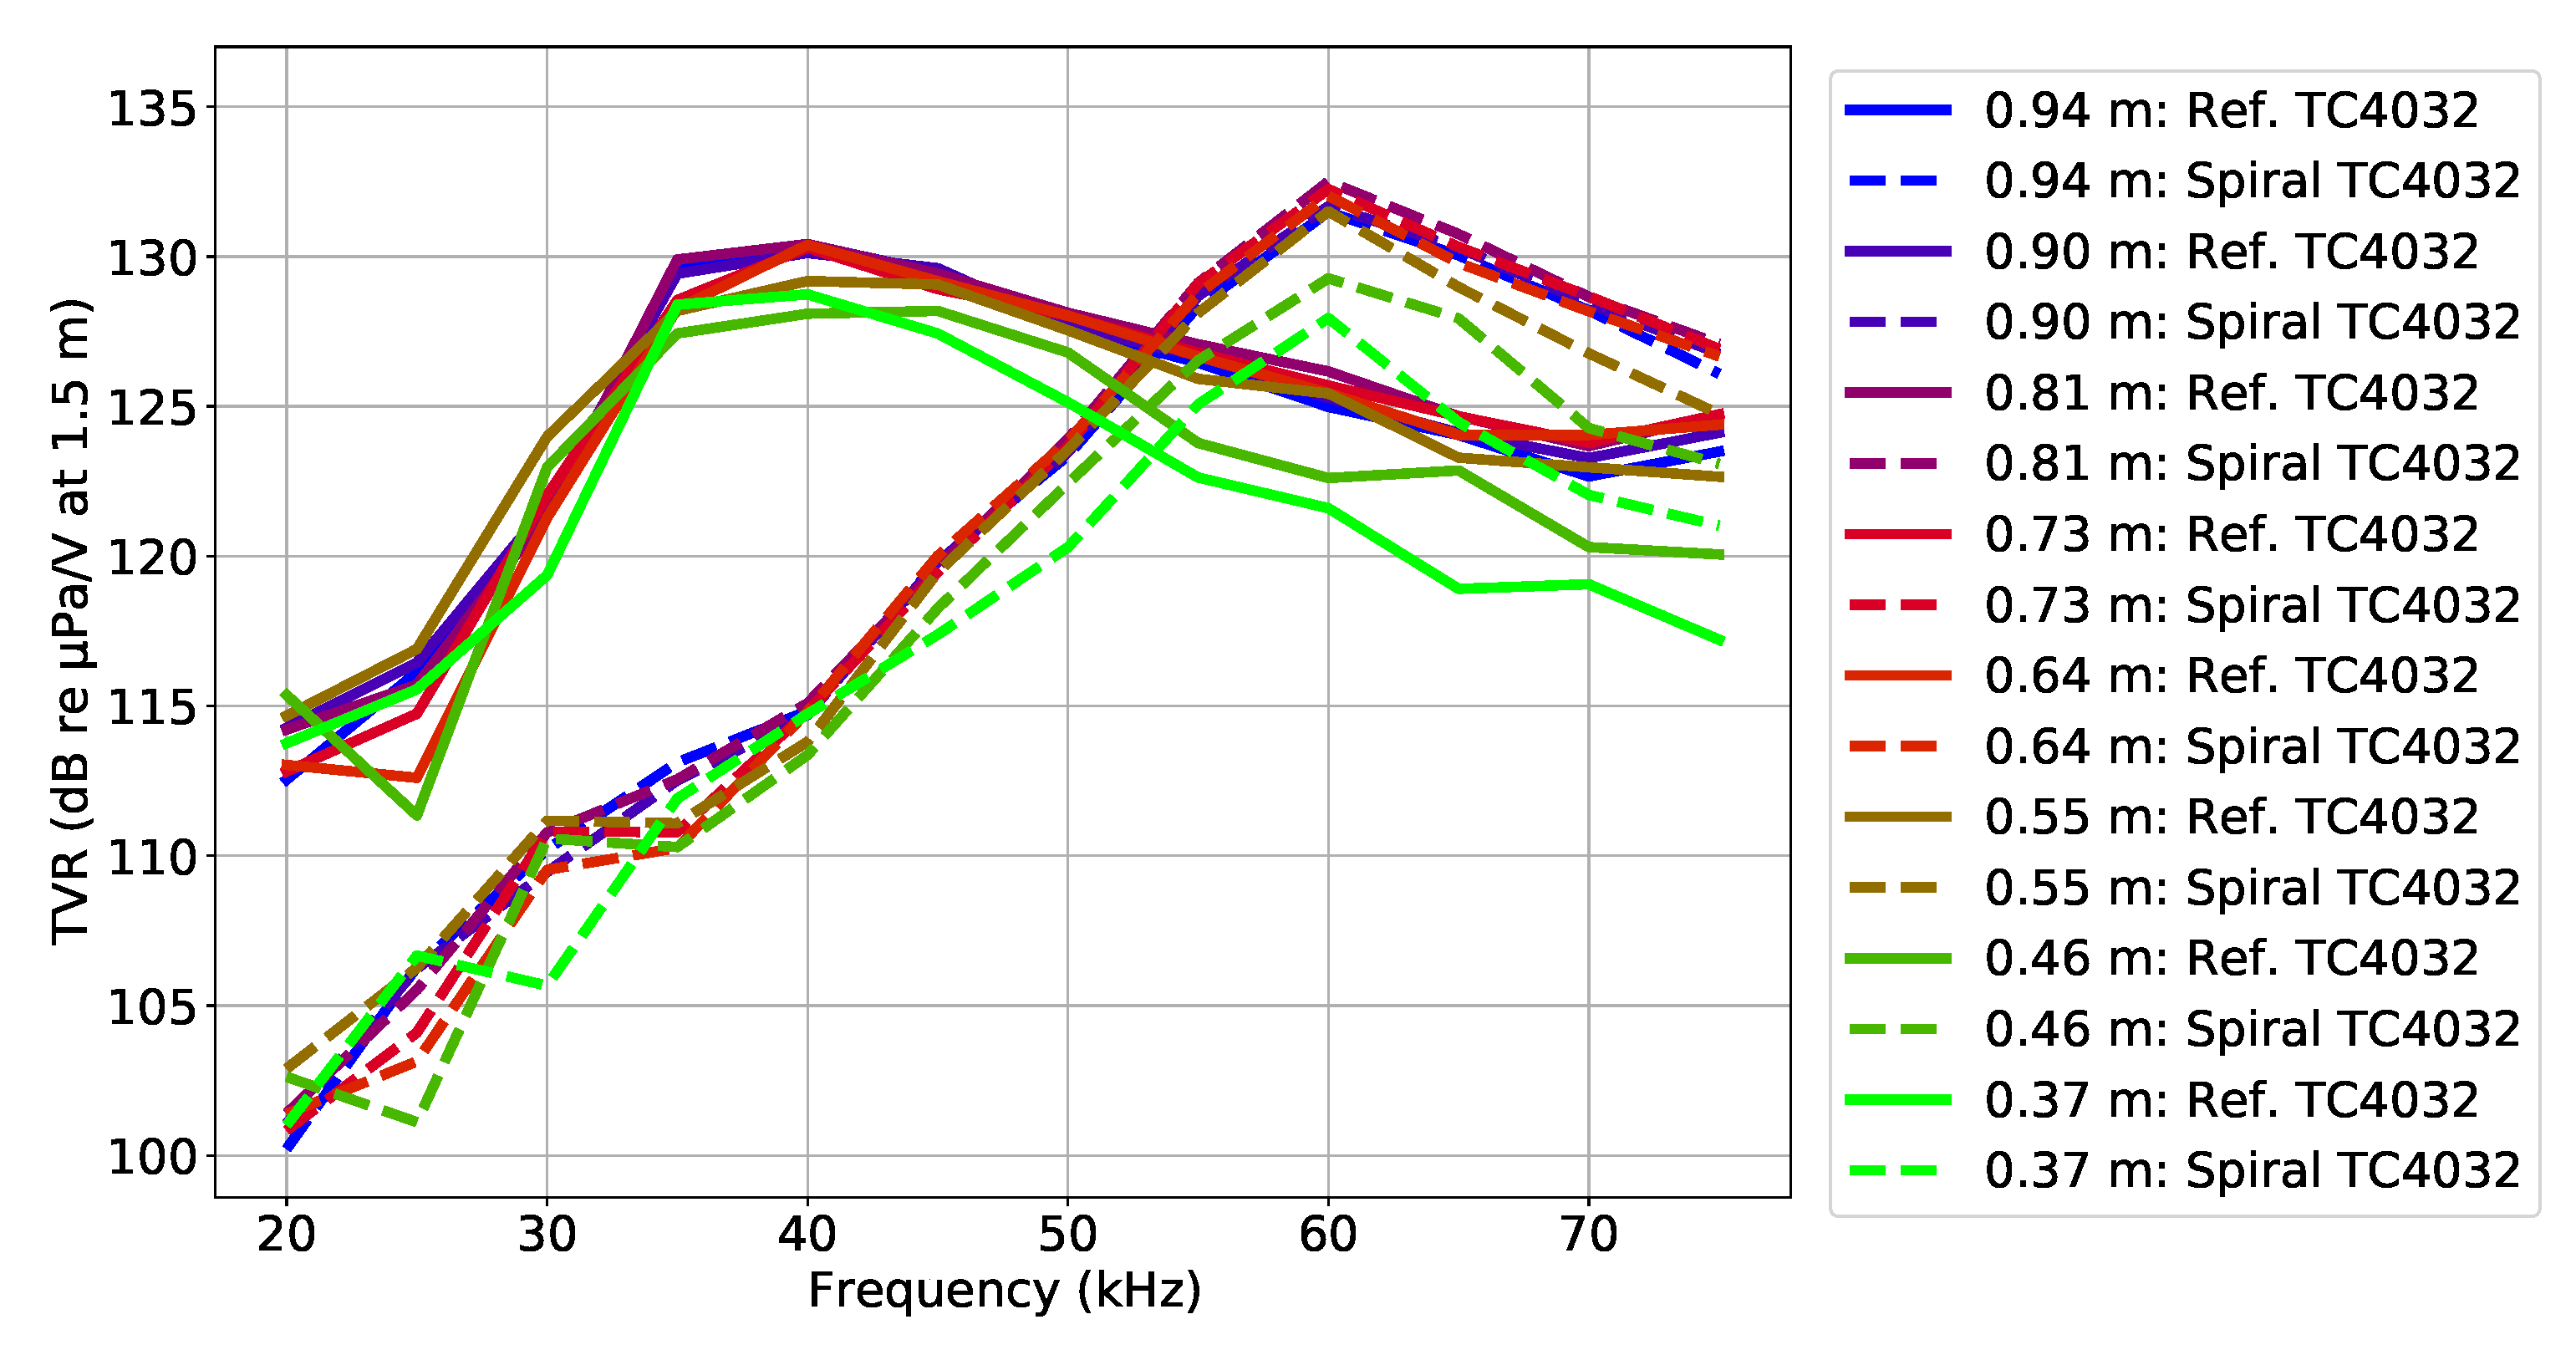
Figure 16 shows the Vertical Directivity pattern in terms of TVR: for the circular and spiral waveform along the frequency at multiple depths. In the figure it is possible to observe that for the lower depths of 0.37 m and of 0.46 m, there is a drop up to 8 dB at frequencies higher than 50 kHz, both in the circular and spiral wavefront generation, which is due to vertival directivity of the TC4032 that becomes directional with the frequency increase.
In order to evaluate a vertical directivity phase in terms of bearing angle estimate, the same receiving calibration procedure described in
Section 4.3 was performed with dataset 1 as "previous dataset" and dataset 4 as "current dataset".
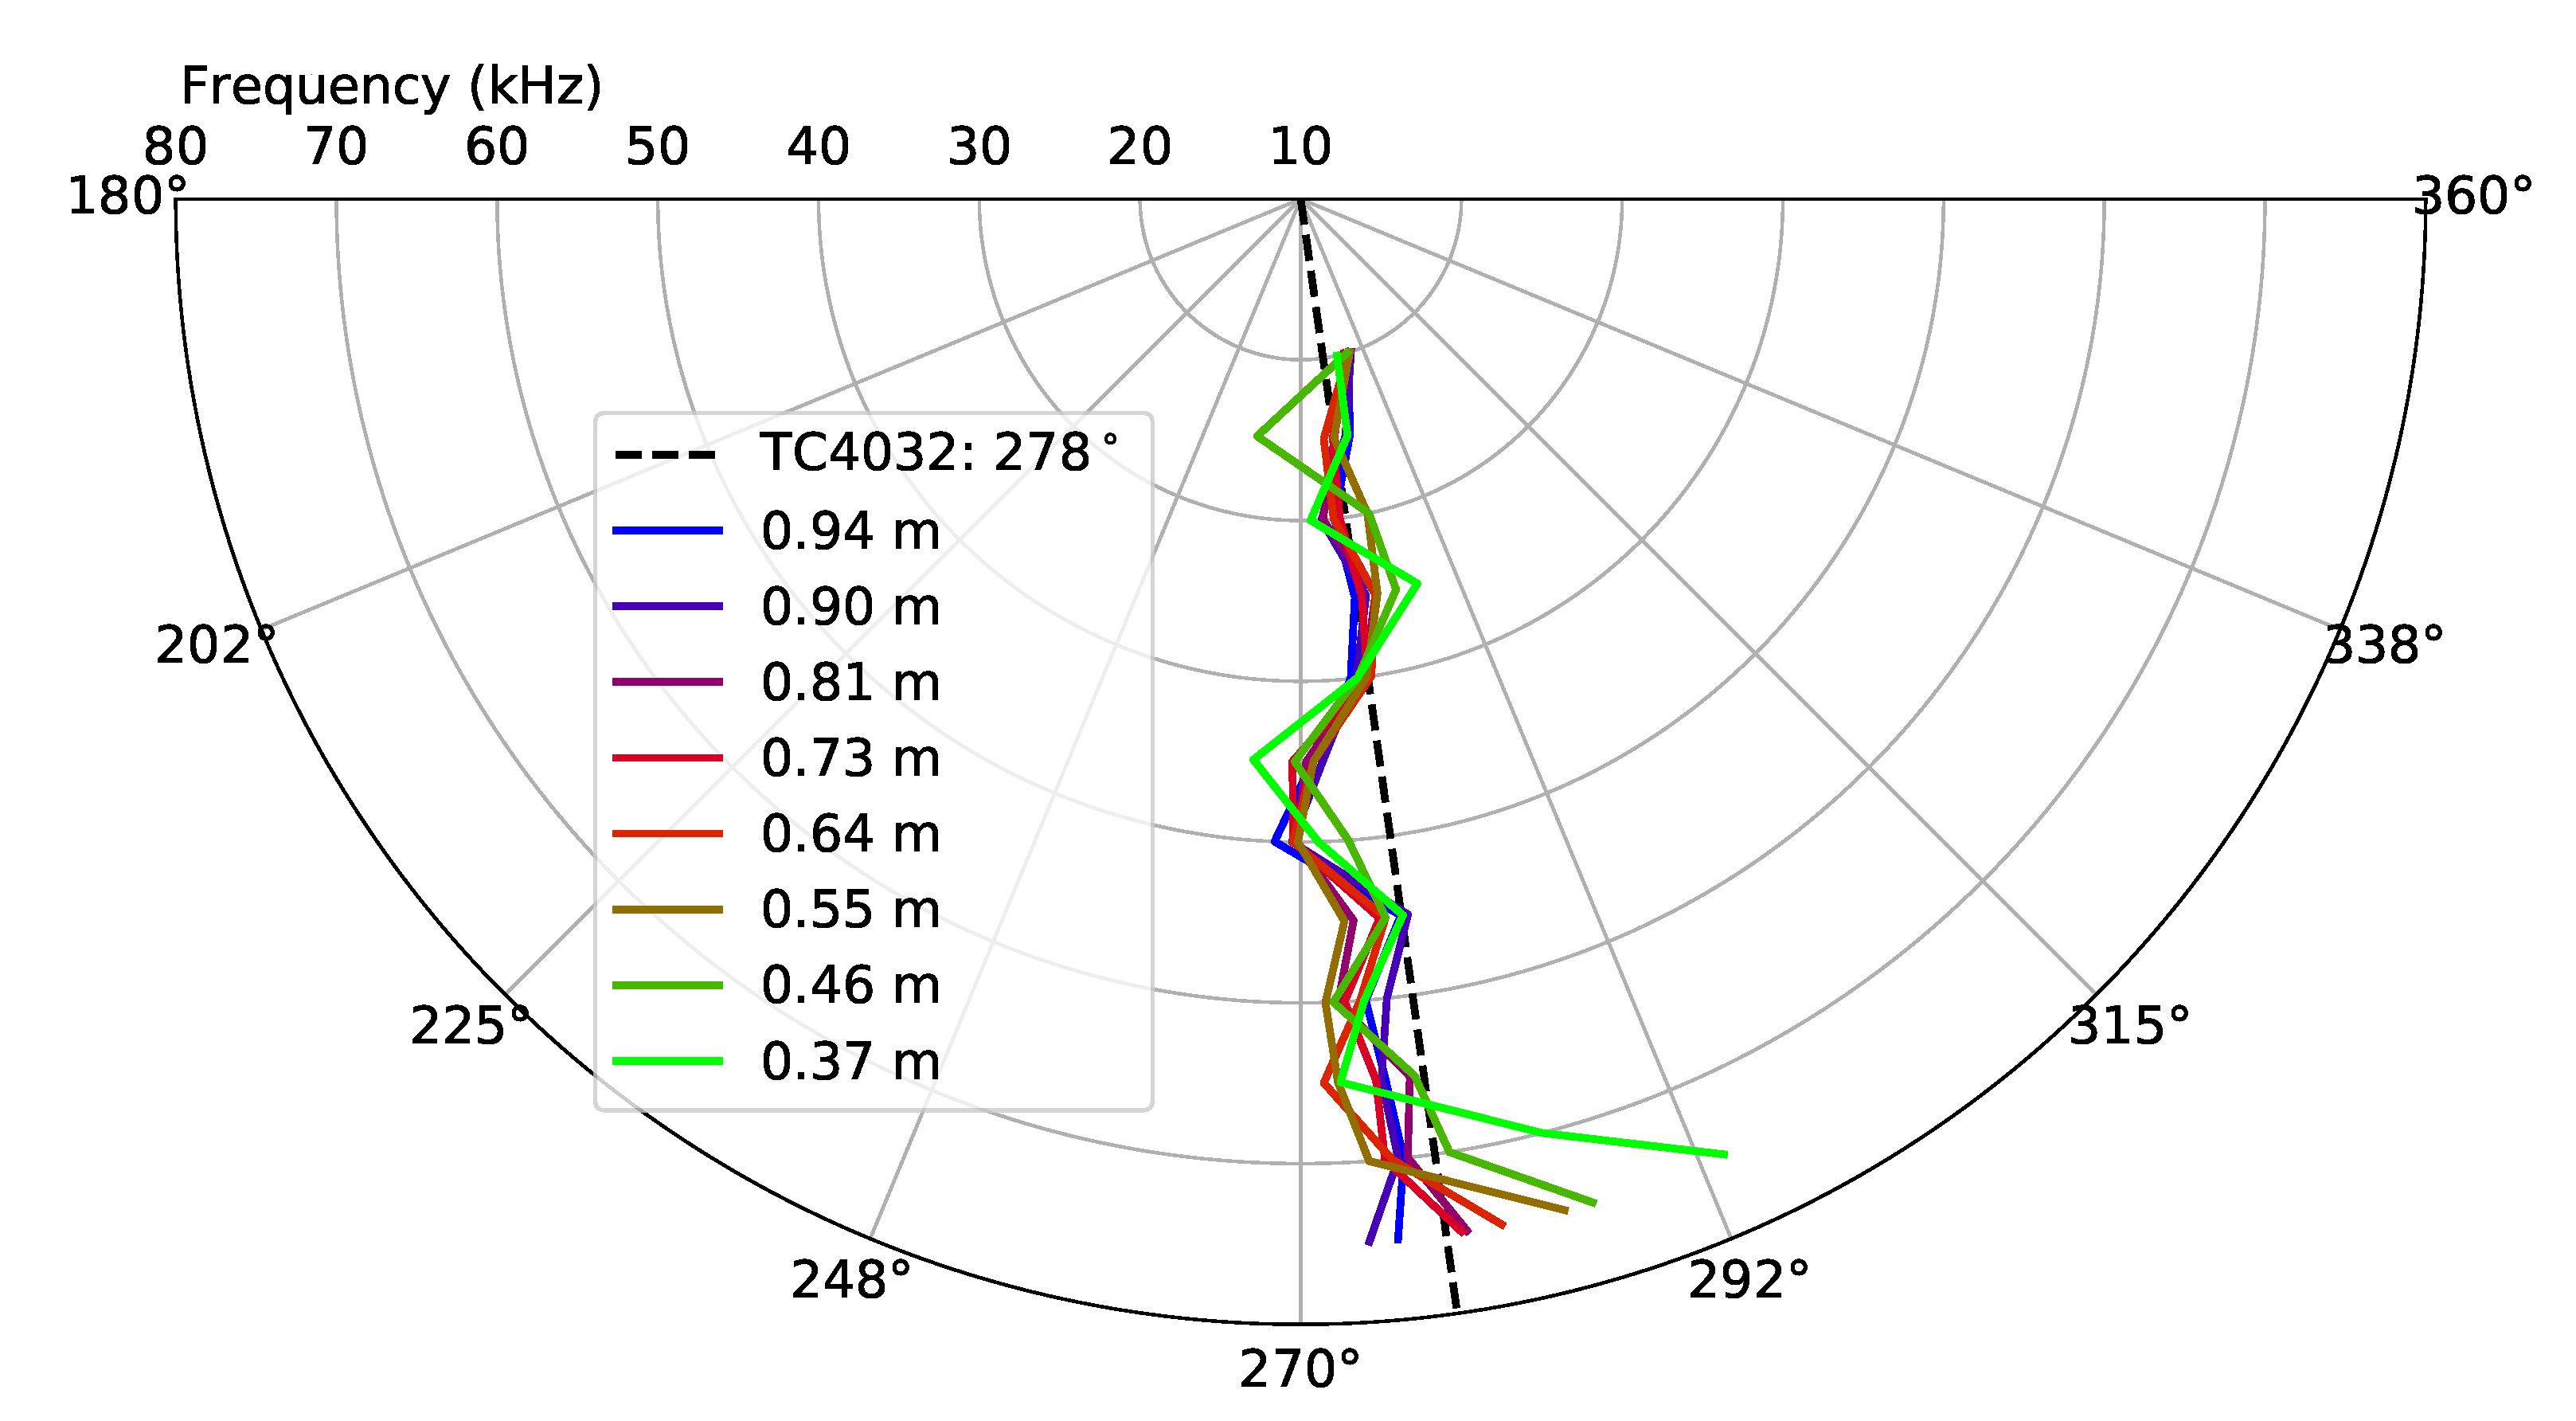
Figure 17 shows the bearing angle estimates where it is possible to observe that there is a good agreement for almost all depths with exception for the depths smaller than 0.46 m, which is possibly due to the power loss observed for those depths in the TVR of
Figure 16.
6. Conclusions
UUV localization and navigation using spiral acoustic sources has shown to be a promising solution. In this work, a new spiral source prototype is presented together with its characterization in TVR and bearing angle estimate. This spiral prototype is able to generate circular and spiral wavefronts, and stands out from previous implementations for being made over a standard piezoceramic cylinder. It comprises four monopoles in the same piezoelectric ceramic and is able to operate in mode 0 of vibration for generating a circular wavefront and mode 1 for generating a spiral wavefront. Acoustic experiments were carried out to calibrate and characterize the spiral source in terms of: amplitude, phase, Horizontal Directivity, and Vertical Directivity.
The TVR values confirmed the existence of two resonances, one for each type of wavefront mode of vibration. The phase analysis shows that the phase difference (between the circular and spiral wavefront) values, for a given frequency, varies approximately linearly with the bearing angle of the spiral source, and that the phase difference variation along frequency is relevant. Thus, is important to perform a phase adjustment/calibration in order to achieve accurate bearing angle estimate for a wide range of frequencies.
The proposed receiving calibration method, along the frequency, showed that the horizontal bearing angle estimate has a maximum absolute angle error of 1 for recordings under the same conditions, and 11 when the same conditions are not guarantee, nevertheless with a much better performance at frequencies above 50 kHz where the circular and spiral wavefront TVRs have similar values. The Vertical Directivity evaluation results showed that the bearing angle estimate has a low variability with depth. Therefore, the results show that the developed spiral source bearing angle can be determined using the proposed receiving calibration and that it can be used in localization systems with a single acoustic source/ hydrophone pair.
In future works an accurate spiral source bearing angle positioning system should be used for a better receiving calibration and a transmitting calibration methodology should be developed. Moreover, a better data model for the spiral source should be developed for allowing new applications, e.g., SONAR and underwater communications.
Funding
This work was supported by the project K2D: Knowledge and Data from the Deep to Space with reference POCI-01-0247-FEDER-045941, cofinanced by the European Regional Development Fund (ERDF), through the Operational Program for Competitiveness and Internationalization (COMPETE2020), and by the Portuguese Foundation for Science and Technology (FCT) under the MIT Portugal Program.
Institutional Review Board Statement
Not applicable.
Informed Consent Statement
Not applicable.
Data Availability Statement
Not applicable.
Acknowledgments
We would like to thank Dr. Nuno Cruz from Robotics and Autonomous Systems (CRAS) at FEUP, Porto, Portugal for the invitation to carry out the acoustic experiments at the CRAS’s water tank facilities.
Conflicts of Interest
The authors declare no conflict of interest.
Abbreviations
The following abbreviations are used in this manuscript:
| CIR |
Channel Impulse Response |
| LBL |
Long Baseline |
| OCVR |
Open Circuit Voltage Response |
| SBL |
Short baseline |
| TOF |
Time of Flight |
| TVR |
Transmitting Voltage Response |
| USBL |
Ultra-short Baseline |
| USV |
Unmanned Surface Vehicle |
| UUV |
Unmanned Underwater Vehicle |
| VOR |
Very High Frequency Omnidirectional Range |
References
- Paull, L.; Saeedi, S.; Seto, M.; Li, H. AUV Navigation and Localization: A Review. IEEE Journal of Oceanic Engineering 2014, 39, 131–149. [Google Scholar] [CrossRef]
- Su, X.; Ullah, I.; Liu, X.; Choi, D. A Review of Underwater Localization Techniques, Algorithms, and Challenges. Journal of Sensors 2020, 2020, 1–24. [Google Scholar] [CrossRef]
- Santos, P.; Felisberto, P.; Jesus, S.M.; Zabel, F.; Matos, A. Azimuth angle estimation using a Dual Accelerometer Vector Sensor with active and passive underwater signals. SENSORCOMM 2018, 2018. [Google Scholar]
- Dzikowicz, B.R.; Hefner, B.T.; Leasko, R.A. Underwater Acoustic Navigation Using a Beacon With a Spiral Wave Front. IEEE Journal of Oceanic Engineering 2015, 40, 177–186. [Google Scholar] [CrossRef]
- Djapic, V.; Dong, W.; Spaccini, D.; Cario, G.; Casavola, A.; Gjanci, P.; Lupia, M.; Petrioli, C. Cooperation of coordinated teams of Autonomous Underwater Vehicles. IFAC-PapersOnLine 2016, 49, 88–93. [Google Scholar] [CrossRef]
- Dzikowicz, B.R.; Yoritomo, J.Y.; Heddings, J.T.; Hefner, B.T.; Brown, D.A.; Bachand, C.L. Demonstration of Spiral Wavefront Navigation on an Unmanned Underwater Vehicle. IEEE Journal of Oceanic Engineering 2023, 1–10. [Google Scholar] [CrossRef]
- Hefner, B.T.; Dzikowicz, B.R. A spiral wave front beacon for underwater navigation: Basic concept and modeling. The Journal of the Acoustical Society of America 2011, 129, 3630–3639. [Google Scholar] [CrossRef] [PubMed]
- Hefner, B.T.; Marston, P.L. Acoustical helicoidal waves and Laguerre–Gaussian beams: Applications to scattering and to angular momentum transport. The Journal of the Acoustical Society of America 1998, 103, 2971–2971. [Google Scholar] [CrossRef]
- Hefner, B.T.; Marston, P.L. An acoustical helicoidal wave transducer with applications for the alignment of ultrasonic and underwater systems. The Journal of the Acoustical Society of America 1999, 106, 3313–3316. [Google Scholar] [CrossRef]
- Dzikowicz, B.R.; Hefner, B.T. A spiral wave front beacon for underwater navigation: Transducer prototypes and testing. The Journal of the Acoustical Society of America 2012, 131, 3748–3754. [Google Scholar] [CrossRef] [PubMed]
- Brown, D.A.; Aronov, B.; Bachand, C. Cylindrical transducer for producing an acoustic spiral wave for underwater navigation (L). The Journal of the Acoustical Society of America 2012, 132, 3611–3613. [Google Scholar] [CrossRef] [PubMed]
- Brown, D.; Bachand, C.; Aronov, B. Design, development and testing of transducers for creating spiral waves for underwater navigation. Meetings on Acoustics. ASA, 2013. [CrossRef]
- Dzikowicz, B.R.; Tressler, J.F.; Brown, D.A. Demonstration of spiral wave front sonar for active localization. The Journal of the Acoustical Society of America 2019, 146, 4821–4830. [Google Scholar] [CrossRef] [PubMed]
- Lu, W.; Lan, Y.; Guo, R.; Zhang, Q.; Li, S.; Zhou, T. Spiral Sound Wave Transducer Based on the Longitudinal Vibration. Sensors 2018, 18, 3674. [Google Scholar] [CrossRef] [PubMed]
- Lu, W.; Guo, R.; Lan, Y.; Sun, H.; Li, S.; Zhou, T. Underwater Spiral Wave Sound Source Based on Phased Array with Three Transducers. Sensors 2019, 19, 3192. [Google Scholar] [CrossRef] [PubMed]
- Davis, R. A simplified approach for predicting interaction between flexible structures and acoustic enclosures. Journal of Fluids and Structures, 70, 276–294. [CrossRef]
Figure 1.
Underwater propagation of (a) a circular wavefront, and (b) a spiral wavefront. While in the circular wavefront the phase is constant at any direction, in the spiral wavefront the phase varies linearly with the bearing angle relative to the acoustic source at the center of the figure.
Figure 1.
Underwater propagation of (a) a circular wavefront, and (b) a spiral wavefront. While in the circular wavefront the phase is constant at any direction, in the spiral wavefront the phase varies linearly with the bearing angle relative to the acoustic source at the center of the figure.
Figure 2.
Spiral Source quadrants A, B, C and D: grey is the piezoceramic material, and each color represents the electrodes of each quadrant.
Figure 2.
Spiral Source quadrants A, B, C and D: grey is the piezoceramic material, and each color represents the electrodes of each quadrant.
Figure 3.
Prototype manufacturing: (a) piezoceramic hollow cylinder made of PZT-4; (b) piezoceramic cylinder, with eight aligned rips; (c) prototype of the spiral source in the potting frame, before the polyurethane potting; and (d) prototype of the spiral source after the polyurethane potting, with a bearing angle reference frame on the top.
Figure 4.
Emission of (a) circular and (b) spiral wavefronts: (at the top) the signals applied in each quadrant, and (below) the displacements caused by the application of the signals, for times , , , and .
Figure 4.
Emission of (a) circular and (b) spiral wavefronts: (at the top) the signals applied in each quadrant, and (below) the displacements caused by the application of the signals, for times , , , and .
Figure 5.
Base 10 logarithm of Q factor along the frequency: for each single quadrant (blue), and for the four quadrants connected in parallel (orange).
Figure 5.
Base 10 logarithm of Q factor along the frequency: for each single quadrant (blue), and for the four quadrants connected in parallel (orange).
Figure 6.
Underwater experiment setup with the Spiral Source (in the center), and the hydrophones TC4033 and TC4032. The color arrows show the underwater acoustic paths illustrated for the hydrophone TC4033: direct path (dark green), path with one surface reflection (orange), path with one bottom reflection (yellow), and path with one wall reflection (blue).
Figure 7.
Electronic setup for the signal generation and signal acquisition: one DAQ USB-1208HS-4AO, and two DAQs USB-1602HS-2AO. The USB-1208HS-4AO was used to generate four analog output signals (spiral source input signals). One USB-1602HS-2AO was used to record the single-ended signal from the TC4033’s 42 dB pre-amplifier and one of the spiral source input signals (the synchronization signal); and the other USB-1602HS-2AO was used to record the differential signal directly from the TC4032.
Figure 8.
CIR estimate and transmitted and received signals. On the left side from top to bottom: Synchronization Signal, TC4033 signal, TC4032 signal. On the right side the CIR estimate for TC4033 in blue and TC4032 in orange.
Figure 8.
CIR estimate and transmitted and received signals. On the left side from top to bottom: Synchronization Signal, TC4033 signal, TC4032 signal. On the right side the CIR estimate for TC4033 in blue and TC4032 in orange.
Figure 9.
The signal sequence emitted in the four quadrants of the spiral source ("Q. A", "Q. B", "Q. C", and "Q. D"): the white blocks represent pauses, the gray blocks represent the chirps for generating a circular wavefront, and the chirps with the other four colors represent the chirps for generating a spiral wavefront.
Figure 10.
TVR of the circular wavefront, Reference (blue lines), and Spiral wavefront (orange lines), for hydrophones TC4033 (continuous lines) and TC4032 (dashed lines). Generated from Dataset 1 at a bearing angle of 0.
Figure 10.
TVR of the circular wavefront, Reference (blue lines), and Spiral wavefront (orange lines), for hydrophones TC4033 (continuous lines) and TC4032 (dashed lines). Generated from Dataset 1 at a bearing angle of 0.
Figure 11.
Bearing angle estimates: (a) without phase adjustment, generated from Dataset 1, and (b) with phase adjustment for the Dataset 2 signals. The 8 different colors represents the 8 different bearing angles of the spiral source.
Figure 11.
Bearing angle estimates: (a) without phase adjustment, generated from Dataset 1, and (b) with phase adjustment for the Dataset 2 signals. The 8 different colors represents the 8 different bearing angles of the spiral source.
Figure 12.
Angle error over frequency, for the bearing angle estimates of
Figure 11. The lines represent the mean angle error, and the vertical bars represent the standard deviation of the angle error.
Figure 12.
Angle error over frequency, for the bearing angle estimates of
Figure 11. The lines represent the mean angle error, and the vertical bars represent the standard deviation of the angle error.
Figure 13.
Horizontal Directivity Pattern of the Reference and Spiral wavefronts for 40 kHz (blue-circular and orange-spiral curves) and 60 kHz (green-circular and red-spiral curves), based on the hydrophones TC4033 (continuous lines) and TC4032 (dashed lines) from Dataset 3.
Figure 13.
Horizontal Directivity Pattern of the Reference and Spiral wavefronts for 40 kHz (blue-circular and orange-spiral curves) and 60 kHz (green-circular and red-spiral curves), based on the hydrophones TC4033 (continuous lines) and TC4032 (dashed lines) from Dataset 3.
Figure 14.
Bearing angle estimates, generated from Dataset 3 (hydrophone TC4033). The 16 different colors represents the 16 different bearing angles of the spiral source.
Figure 14.
Bearing angle estimates, generated from Dataset 3 (hydrophone TC4033). The 16 different colors represents the 16 different bearing angles of the spiral source.
Figure 15.
Angle error over frequency, for the bearing angle estimates of
Figure 14. The lines represent the mean angle error, and the vertical bars represent the standard deviation of the angle error.
Figure 15.
Angle error over frequency, for the bearing angle estimates of
Figure 14. The lines represent the mean angle error, and the vertical bars represent the standard deviation of the angle error.
Figure 16.
Vertical Directivity pattern: TVR of the circular and spiral wavefront generated at multiple depths along the frequency, from the Dataset 4 signals. The continuous and dashed lines represent the TVR values for the circular and spiral wavefronts, respectively, and each line color represent a specific depth of the hydrophone TC4032.
Figure 17.
Bearing angle estimates, generated from Dataset 4 (hydrophone TC4032). The 8 different colors represents the 8 different depths of hydrophone TC4032. The black dashed line represent the true bearing angle of the spiral source relative to the hydrophone TC4032.
Figure 17.
Bearing angle estimates, generated from Dataset 4 (hydrophone TC4032). The 8 different colors represents the 8 different depths of hydrophone TC4032. The black dashed line represent the true bearing angle of the spiral source relative to the hydrophone TC4032.
|
Disclaimer/Publisher’s Note: The statements, opinions and data contained in all publications are solely those of the individual author(s) and contributor(s) and not of MDPI and/or the editor(s). MDPI and/or the editor(s) disclaim responsibility for any injury to people or property resulting from any ideas, methods, instructions or products referred to in the content. |
© 2023 by the authors. Licensee MDPI, Basel, Switzerland. This article is an open access article distributed under the terms and conditions of the Creative Commons Attribution (CC BY) license (http://creativecommons.org/licenses/by/4.0/).
