1. Introduction
Urban traffic is one of the main causes of the presence of pollutants such as nitrogen oxides (NO
X) and particulate matter (PM) in the atmosphere [
1]. Following the increase in international trade, the type of air pollution generated at sea risks being no less worrying than that generated on land [
2]. While for the terrestrial field there are two characteristic emissions of the diesel engine, the same cannot be said of traditional marine engines whose emissions also include SO
X following the use of heavy fuels containing sulphur.
In recent years, the international community has shown itself to be particularly attentive to emissions into the air by issuing an international directive on the reduction of emissions (National Emissions reduction Commitments, NEC) Directive which implements the commitments agreed under the 2020 Gothenburg protocol. Then in the context of the reduction of sulphur oxides emitted into the atmosphere by exhaust gases produced by the combustion of fuels with a high sulphur content, the 2016 EU environmental directive indicated the reduction of the sulphur content in fuels as a preferential route, especially for those with a naval use. The directive was first published in 1999 and last amended in 2012 to further adapt it to international developments under MARPOL Annex VI (EU, 2016b) [
3] which establishes, among others, a maximum limit of 0.50% m/m of sulphur in fuels, creator of SO
X, which is the pollutant of which this article is concerned. Areas called ECAS have already been created under the pollutant reduction program referring to the 2016 EU directive. Currently, four of these areas exist under the MARPOL (Maritime Pollution) convention, two of which are in the EU: the Baltic Sea area (MARPOL Annex I, 2006) and the North Sea area (MARPOL Annex VI, 2006). Home emission control areas can also be established by states to improve the air quality of coastal areas and inland rivers [
4].
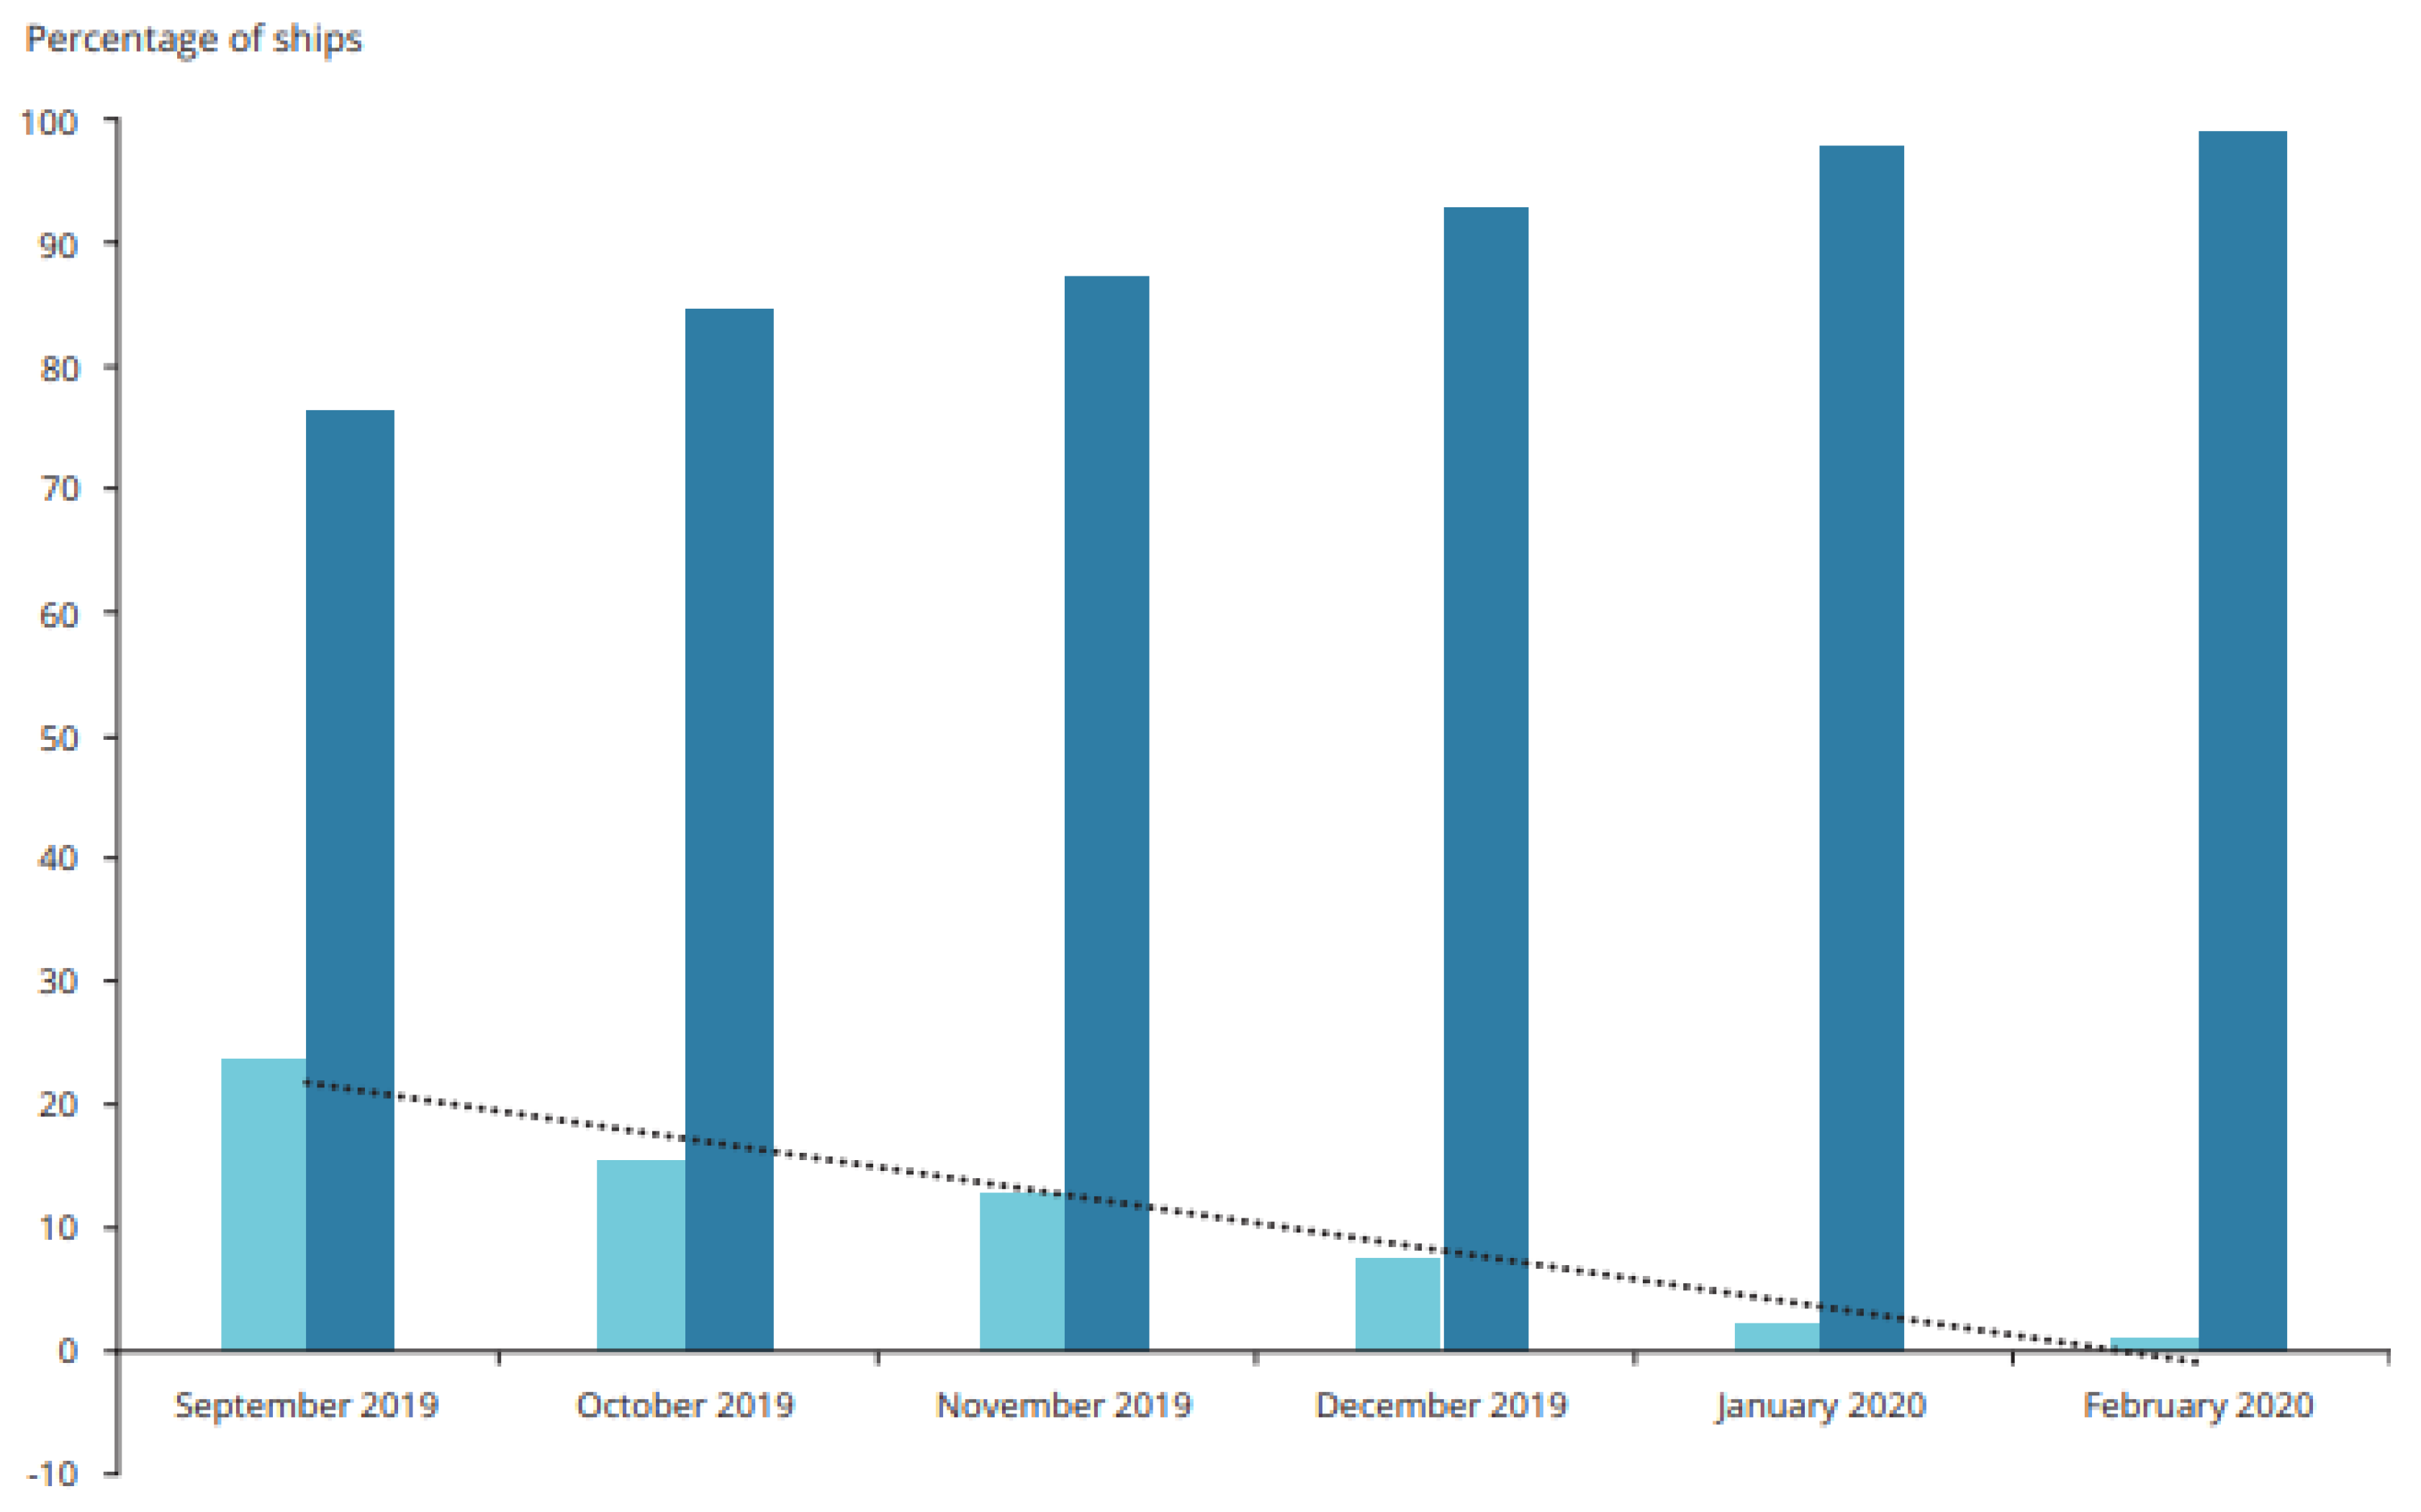
It must be said that the percentage of ships that carry out bunkering of fuels with a high sulphur content is constantly decreasing. In September 2019 it was 23.8%, while in February 2020 it had fallen to 1.1%.Conversely, there was a significant increase in fuel vessels refuelling with low sulphur fuel (i.e., from 0.10% to 0.50% m/m), which rose from 76.2% in September 2019 to 98.9% of all vessels in [
4] (
Figure 1).
We can therefore state that we are in full transition as regards fuels with a low sulphur content, for which there are still naval units that use fuels with a high sulphur content and therefore, to be able to comply with the MARPOL convention, they need to equip themselves with sulphur abatement systems, such as wet scrubber. The capacity to absorb sulphur dioxide from exhaust gases strongly depends on the ability of sulphur dioxide to be soluble in water and to be able to bind to it forming HSO
3 [
5]. One way to increase the quantity of SO
2 to be extracted from the flue gases is to increase the contact surface between the gaseous phase and the liquid phase [
6]. This generally takes place by injecting nebulised water into the exhaust gas stream. It is very important to understand which diameters of droplets can optimize the SO
2 capture process or better, once the thermodynamic conditions of the exhaust and the aqueous phase have been defined, which diameters are not involved in the SO2 capture phase. A. Tomaszewski and Al. [
7] analyzed the scrubber optimization determining the effect of the number of demisters used on the particle removal efficiency and to determine the probability of coalescence depending on the size of liquid droplets. The same problem has been studied by Jiarui Wang et Al by using the genetic algorithm to optimize the interaction between the geometry of the scrubber and the droplet size distribution. R. Kaesemann et Al. [
8] in addition to the problem of the distribution of drops, they also addressed the problem of the interaction of the drops which, due to the overlapping effect, can coalesce and form drops of larger diameter. The overlapping phenomenon obviously modifies the effective distribution of the diameters, giving rise to dynamic phenomena that are not always favorable. Kumaresh Selvakumar et al. [
9] instead, they analyzed the interaction between drops and stream of hot gases not from the point of view of the drops of water which absorb the sulfur dioxide but from the point of view of the stream of exhausted gases which, due to the request of the drops of water to evaporate tend to massively cool the combustion gases. Exhaust gas temperature control provides another method of pollutant analysis and control. The problem of optimizing a scrubber therefore presents various aspects, furthermore there is a distinction between heavy duty scrubbers which can certainly have optimized dimensions in terms of height and width and scrubbers for naval use. The latter are obviously not very welcome to owners as they take up space. For this reason the optimization of water scrubbers for the abatement of sulfur dioxide still presents many uncertainties. Tibor Bešenić et Al. [
10] analyzed the dynamic process of evaporation and condensation of water droplets introduced into a known concentration stream of SO2 and characterized its behavior in the evaporative phase. The present work has been developed paying particular attention to the interaction between a drop of water and a current whose boundary conditions are known in terms of pressure, temperature, and relative speed. Particular attention is paid to diffusion mechanisms and chemical kinetics to simulate the absorption phenomenon and to simulate the absorption concentrations of sulfur dioxide in a single water droplet. The simulation is carried out considering the dynamics of the drop and its interaction with the exhaust gases which tend to make the droplet evaporate and transport it. The droplet dynamics analysis highlights the diameters below which the droplets make no contribution to the stream cleaning phenomenon and therefore identifies a lower limit in the droplet diameter distribution curve.
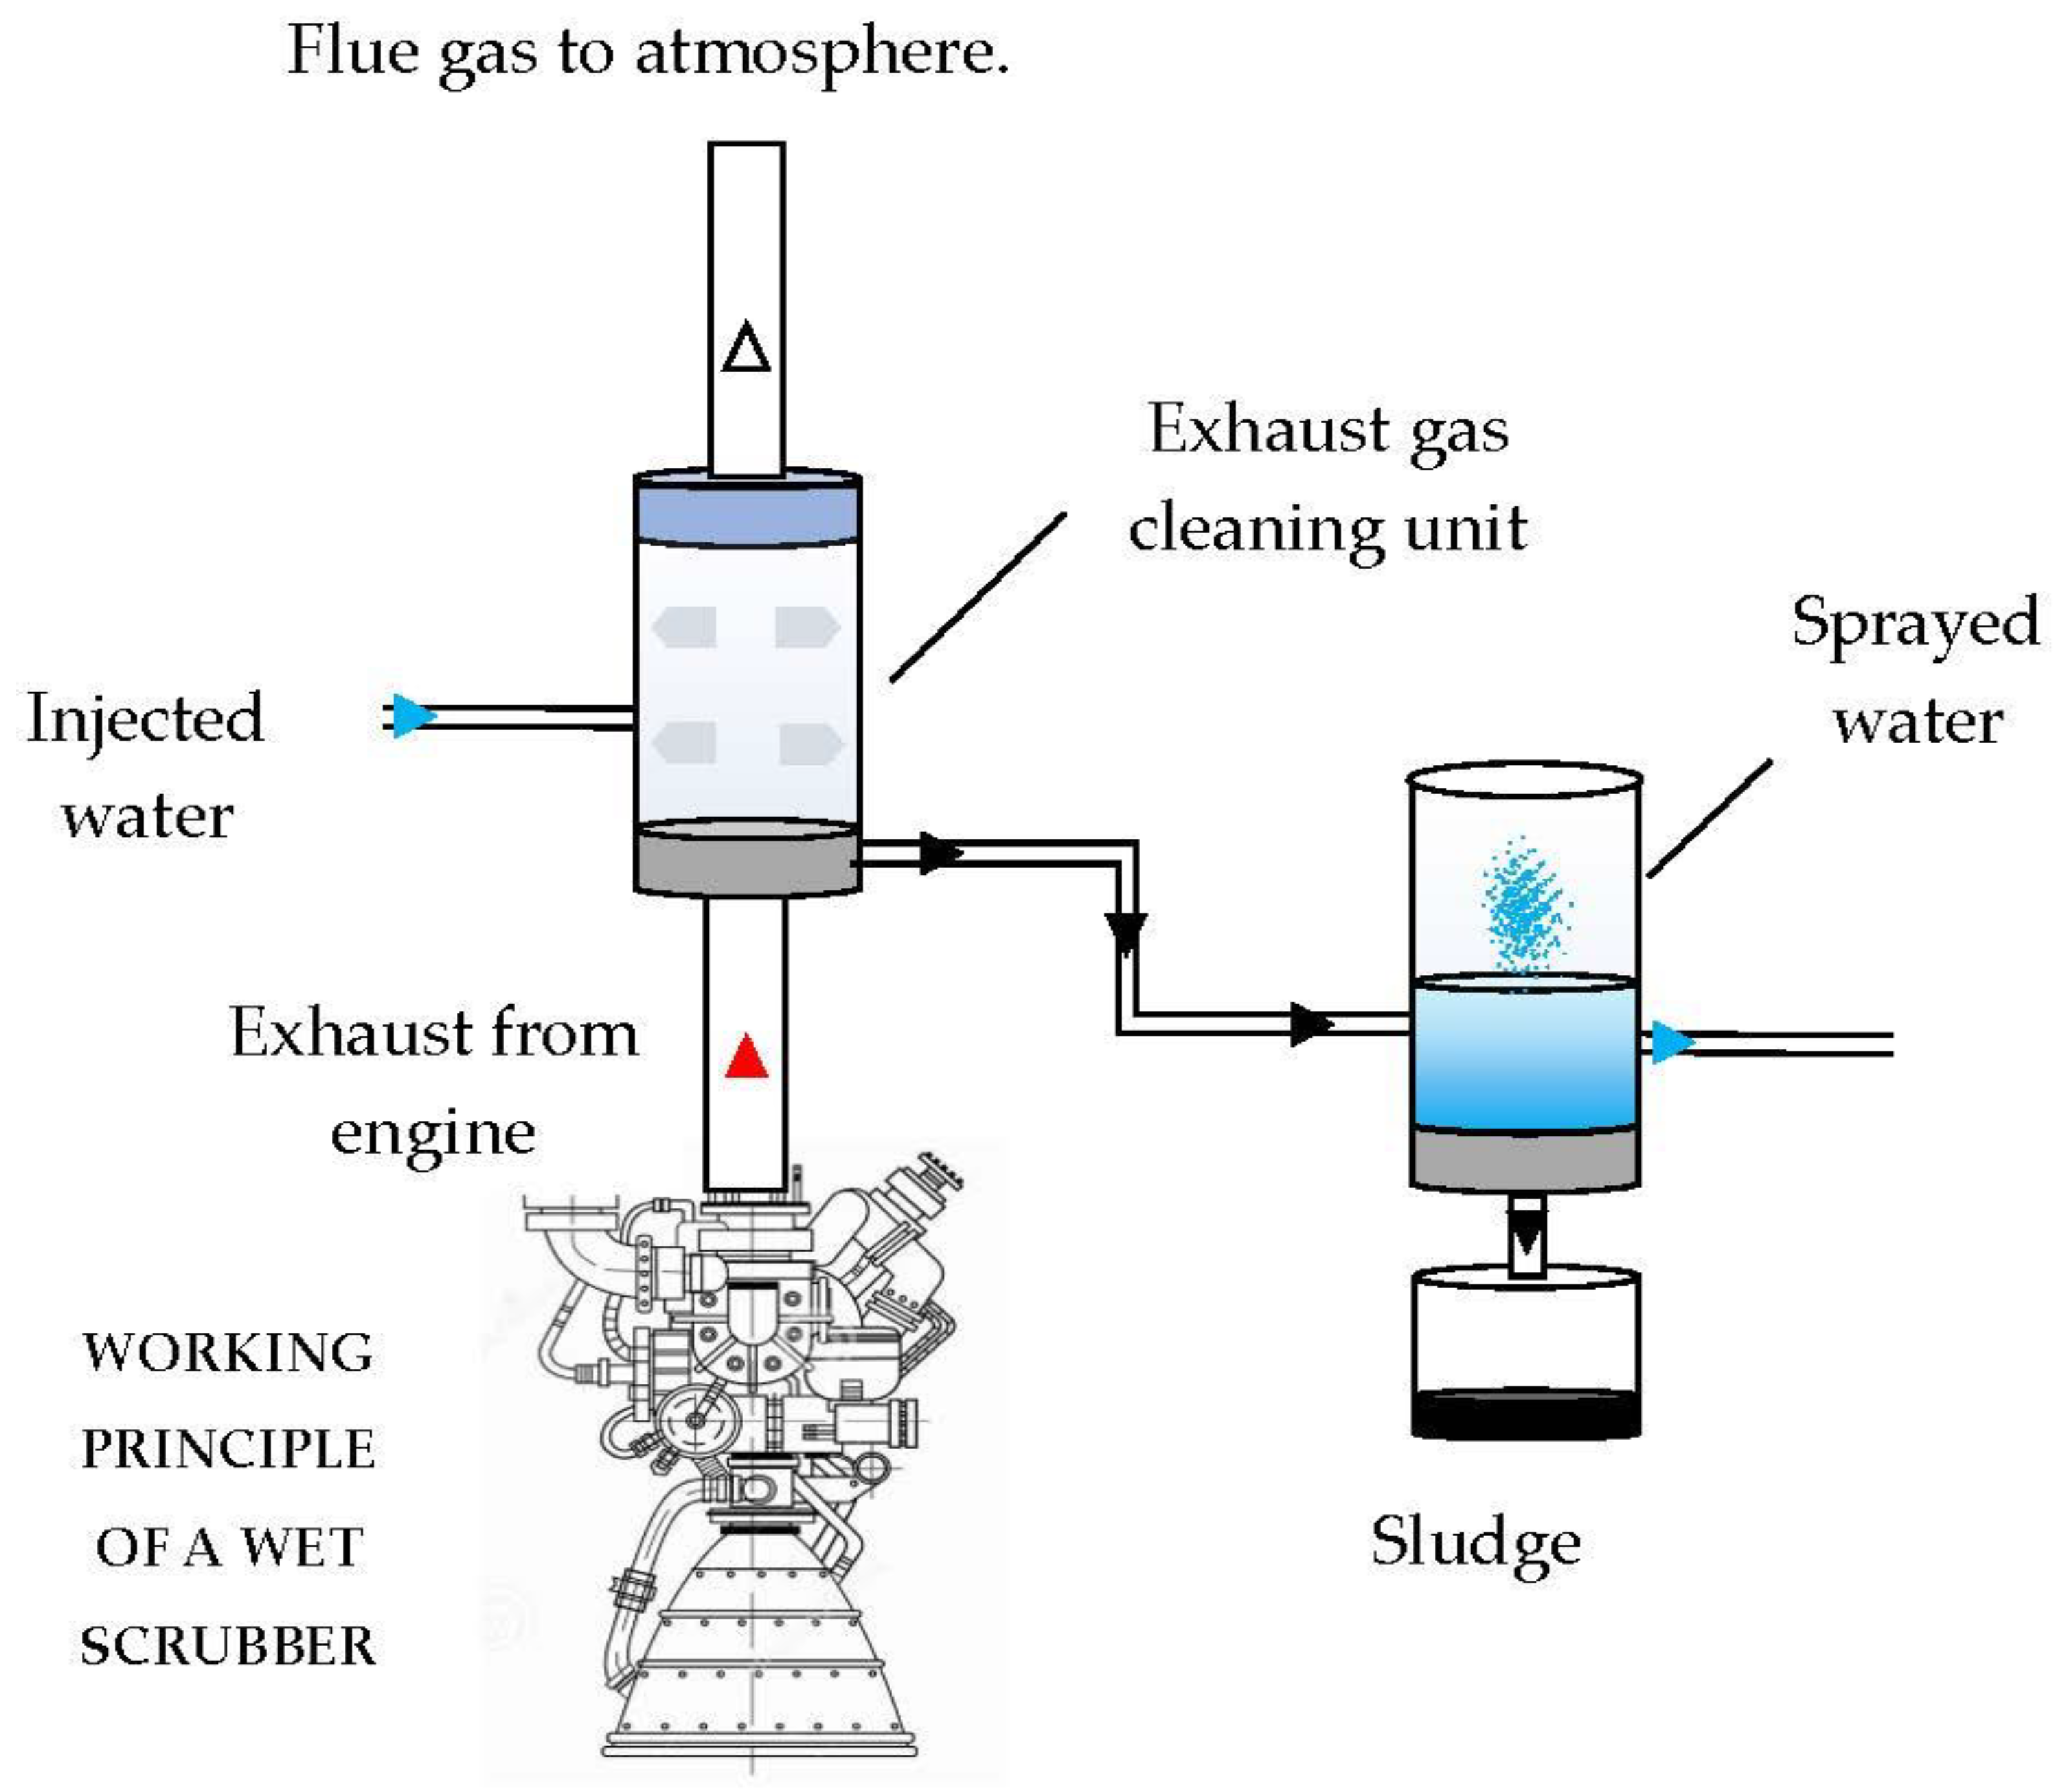
To reduce sulphur dioxide, the use of fuels with a low sulphur content would be preferable to scrubbing the burnt gases for reasons of space, but system problems and the increase in the cost of fossil fuels have renewed interest in the development of specific washing systems, such as seawater scrubber (SWS). SWS is a wet Exhaust Gas Cleaning System (EGCS) [
11], for which a schematic representation of the open loop type is shown in
Figure 2. The engine exhaust gases are directed towards the scrubbing column, where inside nozzles that introduce sea water in the form of a counter-current spray are set up. Here the absorption process takes place, and the sulphur dioxide molecules are trapped in the water droplets making the gases low in SO
X before reaching the atmosphere. Contaminated droplets are collected at the bottom of the scrubber tower and then treated before being returned to the sea. Depending on the design and scrubbing liquid used, the sulphur dioxide removal efficiency in scrubber towers can reach over 90%[
12].
Absorption represents the phenomenon at the basis of desulphurization, and over the years various models of both an empirical and numerical nature have been developed to be able to study it and describe its physical and chemical interactions during exposure to exhaust gases [
13,
14,
15,
16,
17,
18,
19]. This article describes a simplified numerical model that simulates the absorption of SO
X by a water spray in a scrubbing process under variable conditions.
2. Absorption operation
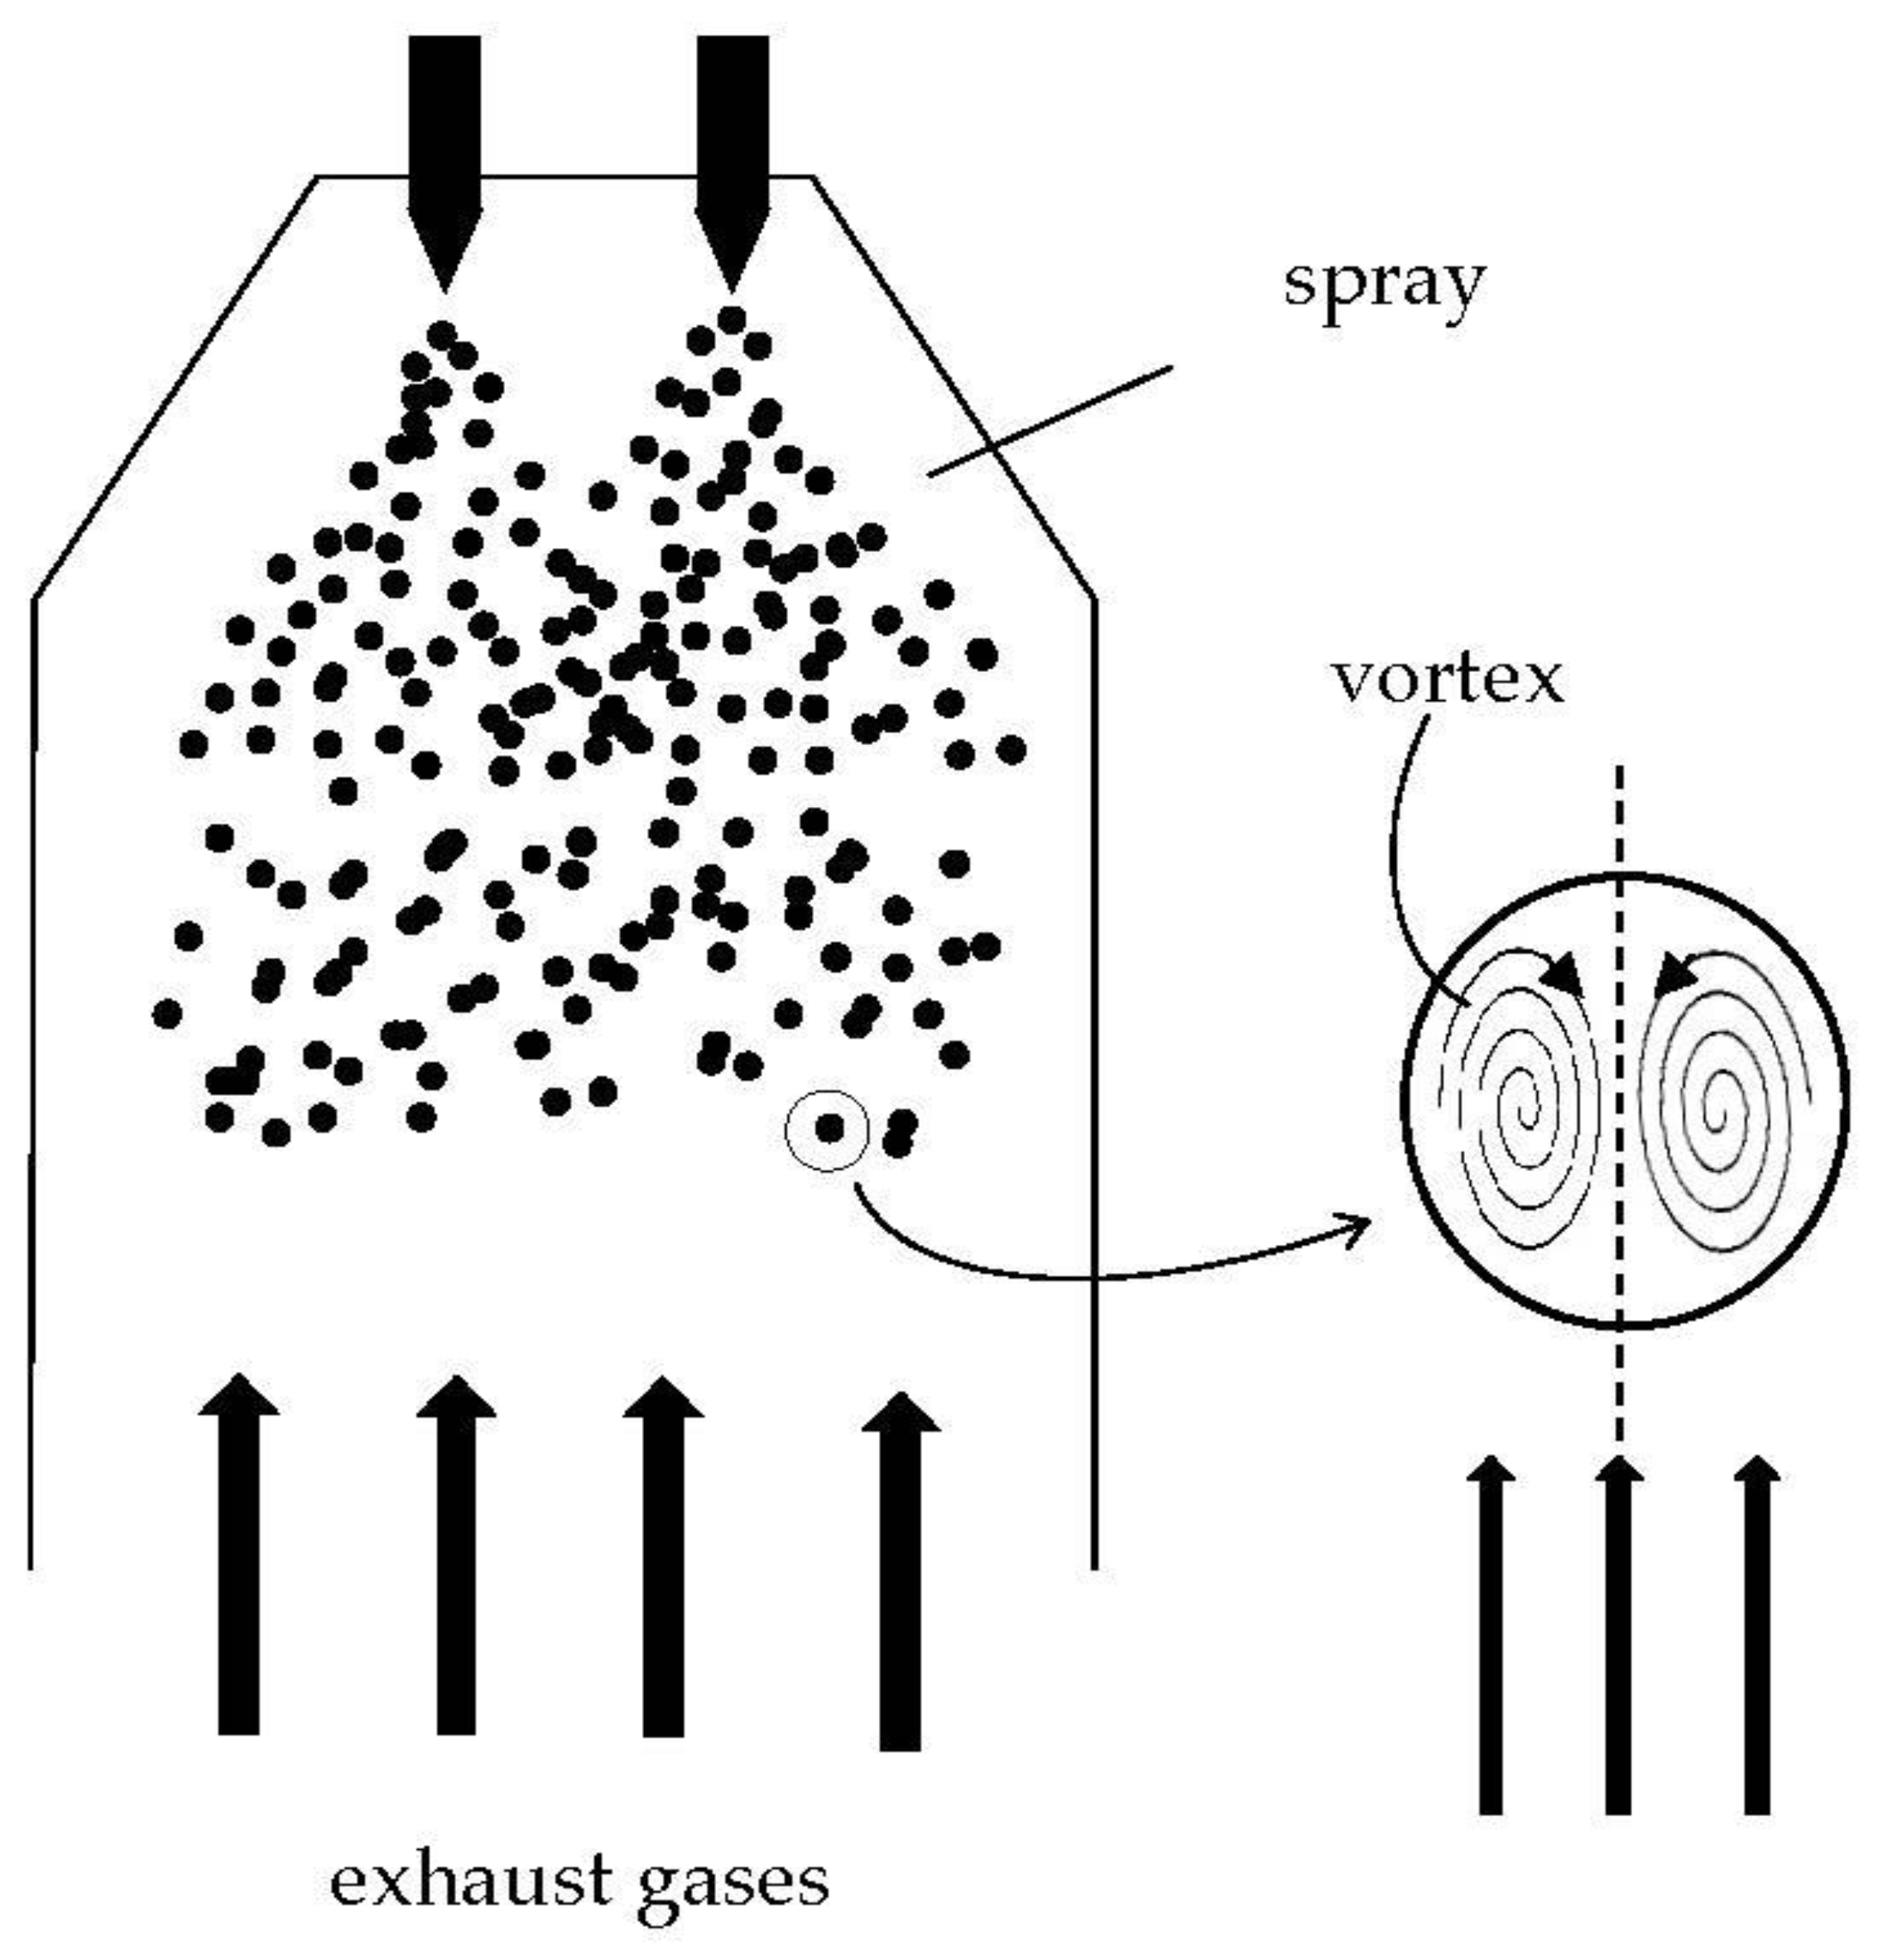
The scheme taken in reference is shown in
Figure 3. A single drop of seawater has been considered, spherical and falling inside the scrubbing column. The gases leaving the engine combustion chamber are in counter-current concerning the motion of the drop. The desulphurization mechanism in a seawater scrubber is based on three concomitant phenomena: the dissolution of the SO
2 in the water, the subsequent transport inside the drops [
20,
21] and the chemical reaction between alkalis and dissolved SO
2. The alkalinity of the water is closely linked to the average temperature of the sea and is defined as the sum of the concentrations of the alkaline species contained within it [
22]. Between them,
represents the preponderant one and it is possible to set it equal to the total alkalinity at 2.4 mmol/kg
H2O [
23,
24].
When the droplet is exposed to a gaseous flow containing sulphur dioxide, a flow of SO
2 is established at the liquid-gas interface following its dissolution governed by Henry’s law:
with [SO
2(aq)] equilibrium SO
2 concentration in kmol/m
3, p
SO2 partial pressure of sulphur dioxide in atm, k
H Henry’s constant in kmol/(atm m
3). The sulphur dioxide dissolved in water accumulates in the peripheral area of the drop causing its saturation at first, thus preventing the entry of new molecules. However, chemical reactions reported in 2.1–2.6 take place between seawater, which contains alkalis, and SO
2 [
15,
24]:
(2.1) represents the dissolution of gaseous SO
2 in water, within the limits imposed by Henry’s law. Following (2.2-2.4) the sulphur dioxide molecules on the surface of the droplet tend to decrease because of the reaction between these and water molecules, allowing new SO
2 molecules to dissolve at the surface. (2.5) expresses the reaction of the alkalis contained in seawater with the hydronium ion producing carbon dioxide. The CO
2 is initially dissolved in the drop, then it is released in the gas using (2.6), governed by Henry’s law.
In conjunction with the chemical mechanism, the Hill’s vortex takes action [
20,
21,
24,
25] due to the shear stress induced by the relative motion between the drop and the gaseous flow in counter current. The swirling motion transports the reacting species inwards and ensures a continuous supply of seawater molecules on the liquid-gas interface ready to react, causing a convective motion of matter.
Given the difference in concentration between two contiguous areas of the drop, there is also a diffusive motion of matter, the entity of which is closely linked to the concentration gradient between the two close areas.
Known as the mechanics through which the molecules of SO2 are absorbed in the drop of water, there are boundary conditions that affect the process. When the droplet goes in the scrubbing column, it has an initial temperature of roughly 298 K, which is substantially lower than the temperature of the gas it encounters. This involves a sudden increase in the temperature of the drop itself, causing evaporation. The decrease in volume causes the average concentrations of the products of (2.1–2.6) to increase, bringing the drop closer to saturation conditions and making the absorption of new SO2 molecules more difficult.
The concentration of SO2 in the burnt gases also affects absorption, this being closely linked to the concentration gradient between the drop, with zero initial SO2 concentration, and the gases. As the concentration of sulfur dioxide in the gas varies, there is a different number of SO2 molecules ready to react, affecting the phenomenon speed, i.e., bringing the drop closer to saturation conditions slower or faster.
Finally, the drop is given a certain speed by the nozzle. This has the opposite sign about the velocity of the burnt gases since these exit towards the top of the scrubber tower and the droplet falls towards the bottom. The relative velocity between both affects the amount of heat exchanged by means of the Reynolds number, as will become clearer later.
3. Numerical model
The numerical model simulates the absorption process in a drop of fresh water falling inside the scrubbing column. Once introduced, the droplet is immersed in the flue gas flow characterized by a certain speed, temperature, and concentration of sulphur dioxide. Drop itself has initial characteristics such as the speed of fall, temperature and diameter that change because of the interaction between the particle and the exhausted gases causing their evaporation. Their variation was computed through a tracking model whose results represent the foundations of the absorption model.
3.1. Started conditions and calculation scheme
The initial conditions assumed are shown in
Table 1. Temperature and speed of flue gases have been supposed to be constant during the simulation.
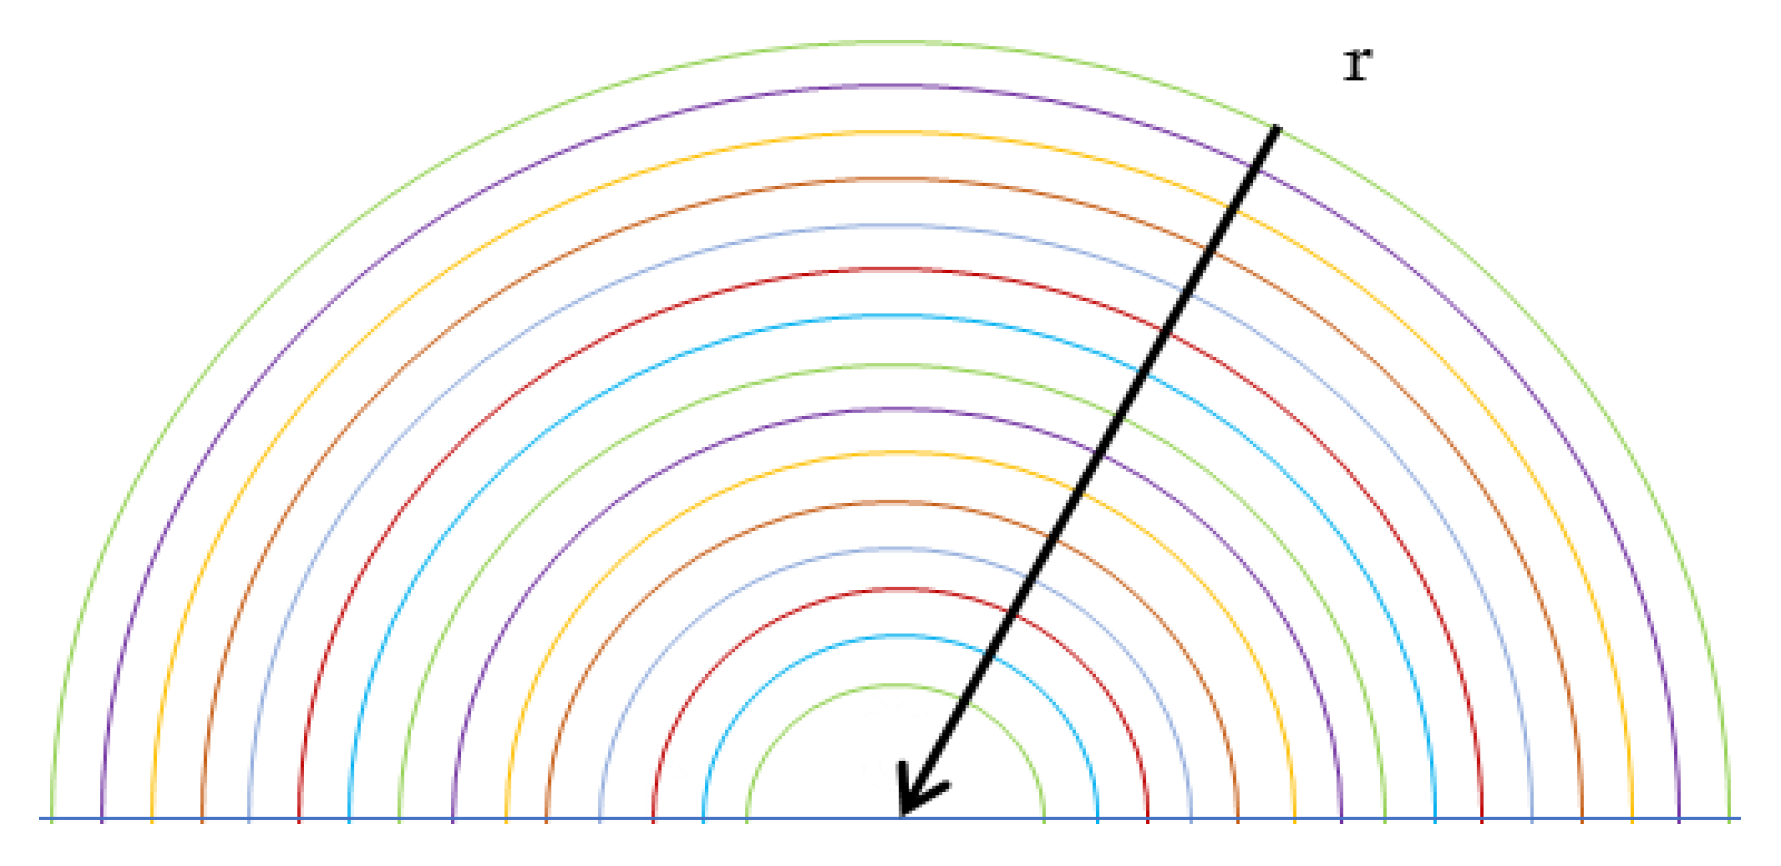
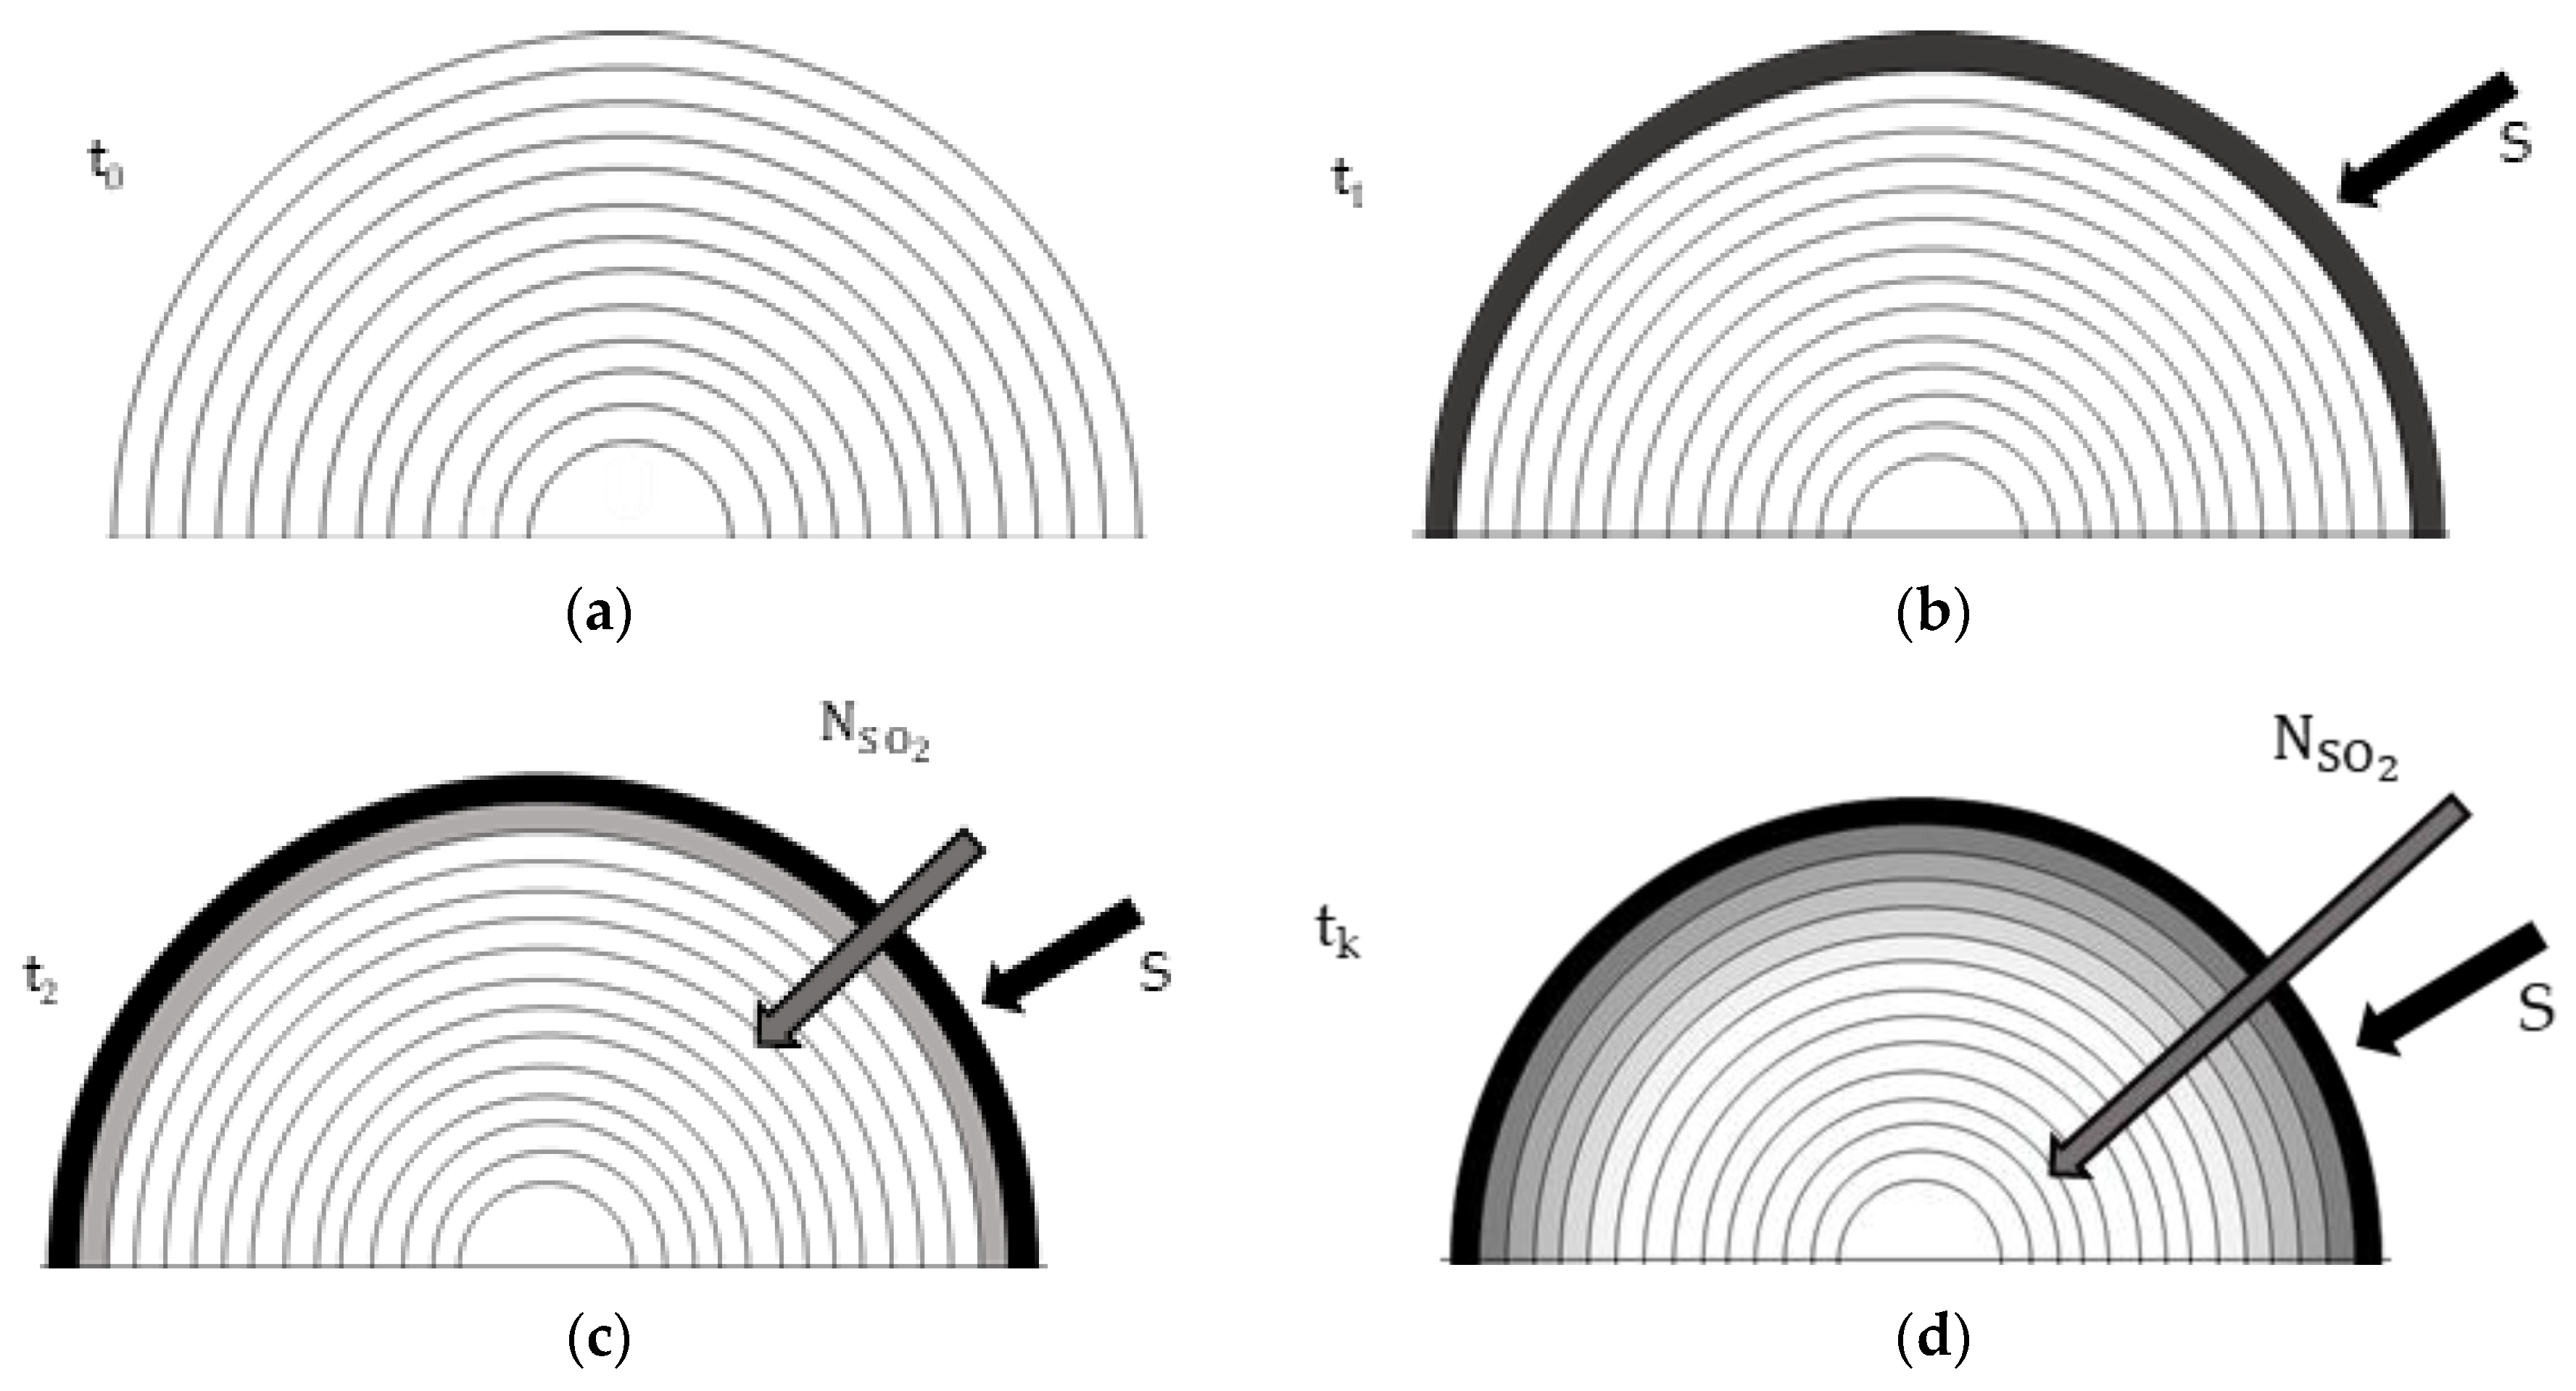
The calculation scheme is represented by half spherical drop divided in a NR number of concentric shells of equal thickness, as shown in
Figure 4. The change in concentration is only evaluated radially to have a one-dimensional problem, therefore the Hill’s vortex is not evaluated. Furthermore, a drop of fresh water, without alkalis, has been considered, hence (2.5–2.6) have not been considered. Analysing the (2.3) and (2.4) it has been found that the equilibrium constant of (2.3) equal to 1.4 × 10
−2 kmol/m
3 at 25 °C is much greater of 6.5 × 10
−8 kmol/m
3 of (2.4) at the same temperature. This implies that (2.4) is much slower than (2.3), which is why it has been considered negligible [
26]. In these conditions only (2.1–2.3) have been considered, but the instability of H
2SO
3 allows to write a different formulation combining the reactions (2.2) and (2.3):
(3) is the reaction considered during the simulation in the absorption model for the interaction between sulfur dioxide and water. The chemical mechanism is summarized in:
3.2. Droplet Tracking
For a variable droplet system, various elaborations must be considered, including the motion of the particle in the scrubber and the consequent heat exchange between it and the burnt gases as well as absorption. This has been done through a water drop tracking model which has the aim of calculating the drop speed, temperature and diameter variation over the simulation time. The subscripts d and g respectively identify the quantities relating to the drop and to the burnt gases.
3.2.1. Droplet motion
The droplet inside scrubbing tower is invested by burnt gas in counter motion. One-dimensional problem has been supposed, and the vertical x axis is parallel to the walls of the wash column, with origin at the outlet of the water spray nozzle and in a positive direction downwards. Due to the relative motion between the drop and the gas it is necessary to take into account the resistance force that is established which influences the motion, and this has been done with the drag coefficient C
D through the following differential equations: [
19,
25,
27]
with u velocity in m/s, x position in m, τ characteristic time in s, a acceleration in m/s
2,
density in kg/m
3 and µ
g dynamic viscosity in Pa s. The terms C
D and Re are drag coefficient and Reynolds number respectively. The first has been calculated by Hadier -Levenspiel equations [
28]:
Φ is the ratio between spherical surface and the surface of deformed droplet. Spherical droplet has been supposed; hence the constant is unitary. Concerning Reynolds number, it has been calculated as:
The solutions of (4) and (5) allow to describe the motion of the drop inside the scrubbing column at instant t:
3.2.2. Heat and mass exchange between droplet and exhaust gases
The conditions in which the drop is during the scrubbing process are variable and strictly dependent on the temperature of the drop itself. Indeed, if this is lower than the evaporation temperature, generally equal to 304 K, there is no exchange of mass of water between the drop and the gas, but only a sudden increase in temperature regulated by the energy balance equation:
where m is the mass in kg, c
p,w specific heat at constant pressure in J/(kg K) of water, h convection coefficient in W/(m
2K), A
d droplet surface in m
2. To evaluate the droplet temperature variation over time, (11) has been solved:
The convection coefficient h has been carried out through the Ranz–Marshall equation [
29]:
Kg is the thermal conductivity of gases in W/(K m), ReF and PrF are Reynolds number and Prandtl number at the film of droplet respectively.
When the droplet temperatures overtake the evaporation temperature, mass transfer happens. The relationship that quantifies the vaporization is governed by the molar concentration gradient of the vapor between droplet surface and exhaust gases:
with N
w vapor flow between water drop and gas bulk in kmol/(m
2s), K
w mass transfer coefficient in m/s, C
w,S and C
w,g molar concentration of vapor at the surface of the droplet and in the exhaust gas respectively, in kmol/m
3. C
w,S term has been evaluated assuming the partial pressure of the vapor at the liquid-gas interface equal to the saturation pressure p
sat at the same temperature:
with R universal gas constant equal to 8310 m
3 Pa/(kmol K), p
sat in Pa.
The concentration of water inside the burnt gas was calculated considering the molar fraction x
w,g of water contained therein.
The bulk gas pressure pg has been supposed equal to 1 bar.
Known the molar weight of water equal to 18 kg/kmol, the mass variation of the droplet in the scrubbing column over time has been obtained from (14):
Under these conditions, equation (11) should be modified to consider the mass variation that the drop undergoes due to evaporation:
where L
g is latent heat of vaporization of water, equal to 23 × 10
5 J/kg. The solution of (19) is:
When the temperature of the drop reaches the boiling point T
bp (approximately 373 K at atmospheric pressure), boiling takes place and the temperature of the drop remains constant and equal to the boiling value for the entire duration of this phenomenon. The law of diameter reduction is (18), while the mass variation is given by:
3.3. Absorption model
The results of the tracking model represent the basis for the calculation of the SO2 absorbed by the drop, being these representatives of the variation of the physical characteristics, such as temperature and speed, and geometric, such as the volume, of the drop instant by instant.
To make the approach used as clear as possible,
Figure 5 shows the first three steps of the model (from a to c) with a generic step in d. In (a) the droplet has just entered the scrubbing column and is completely invested by the bulk gases. The drop is still in its initial conditions shown in
Table 1. In (b) a flow is established at the interface through the source term S, therefore SO
2 is absorbed because of the difference in concentration between the drop and the gas. Given the absence of Hill’s vortex, hence of the continuous turnover of molecules at the periphery, the saturation of the surface layer occurs instantaneously. Despite the saturation condition at the surface, during the process the entry of new molecules of sulfur dioxide occurs for two reasons:
i) chemical reaction and
ii) diffusive phenomenon. With regards to
i) when SO
2 goes in the drop it reacts with water to form
according to (3). The reaction transforms SO
2 creating space for new molecules. According to (3), the amount of SO
2 concentration that goes to react is equal to that of
, which can be determined note the equilibrium constant of the reaction and its equation:
The concentration of SO2 at equilibrium is determined by Henry’s law by mean (1). By solving (22) two solutions are obtained, of which only one is admissible and it is the one satisfying two main conditions: since x is representative of a concentration, it cannot be a negative number and the denominator must be positive.
With regards to ii) the continuous entry of SO2 into the drop despite the saturation conditions is that in the third step (c) the diffusion phenomenon takes place due to the concentration gradient between the outermost shell and the immediately following one. Diffusion acts later than the chemical reaction because it is a slower phenomenon. Furthermore, it has been assumed that the chemical reaction and the new entry are instantaneous, which is why there is a continuous saturation condition in correspondence.
The SO2 diffuse inwards and evaporation of the drop is in progress, therefore a reduction in volume.
To calculate the sulphur dioxide concentration variation over time, the species equation can be used [
18]:
with C concentration of SO
2 in kmol/m
3, t time in s,
u velocity vector of sulphur dioxide molecules inside the droplet in m/s, D diffusion coefficient of SO
2 in m
2/s, S source term in kmol/m
3 s in the examined case. ∇·(C
u) is the convective term, while D∇
2C is the diffusive term.
Given the one-dimensional problem, (23) can be written:
The diffusive term in (23) and (24) is Fick’s second law, i.e., the one that refers to a non-stationary motion [
30]. The minus sign is given by the direction moving from the highest to the lowest concentration.
The two terms, source and diffusive, will be reported analytically in the following sections.
3.3.1. Source term
The source term determines the flow of matter between the bulk gas and the droplet; therefore, it acts only on the surface volume. In this case the flow takes place between two different states, therefore different mass transfer coefficients should be considered compared to the previous case. Also, the lack of a Hill vortex suggests a very quick saturation of the surface volume, reducing absorption.
If the chemical reaction takes place faster than diffusion, not all SO
2 diffuse instantaneously inside the drop but only a small part obtained from the difference between reactants and products of the (3). The equilibrium concentration of the
has been obtained from the equilibrium constant formulation of the reaction (3):
The concentration in aqueous solution of sulphur dioxide, in saturation conditions, is regulated by (1):
with k
H equal to 1.2 kmol/m
3 atm under standard conditions. It slaw of variation is [
31]:
where K
0 is the equilibrium constant at the reference conditions, ∆H
soln is the enthalpy of the solution, T is the temperature in K, and T
0 is the reference temperature (298.15 K).
The concentration of
at equilibrium represents the quantity of SO
2 which reacts in (3), therefore only the remaining part diffuses inside the drop. Assuming that the saturation concentration to the surface volume is reached at the first instant, it is assumed that the drop is able to absorb the quantity of SO
2 that reacted in the previous instant therefore a constant saturation happens on the surface volume. The flow of sulphur dioxide entering at time t is equal to:
3.3.2. Diffusive term
The diffusive term describes the flow of SO
2 in the drops, from the external to the internal layers. In order to further simplify the model, a different formulation, instead of (24) is used [
10]:
With NSO2 molar flow of sulphur dioxide between two contiguous volumes in kmol/m2 s, Cb concentration term of volume i-1 with respect to volume ith under examination, at the same instant, Ca concentration at volume ith, following volume i-1 going towards the centre of the drop, kl is the local mass transfer coefficient of SO2 in water in m/s
The flow of matter entering (29.1) and exiting (29.2) this volume has been assessed by performing a mass balancing in volume i, with i = 1, ..., NR going towards the inside of the drop:
The amount of matter remaining in i in ∆t interval is:
The concentration in i is given by:
with A
i,t the surface through which the incoming and outgoing flows pass at the instant t. Since the thickness of the shell is neglectable, an approximation was made by assuming that for the same volume V
i,t the inlet and outlet surfaces have the same size at the same instant.
Reaction (3) also takes place in the internal volumes of the drop, therefore the volumes have been subtracted by an amount
when the diffusive flux is evaluated too. (30) has been modified:
4. Results
The simulations for both models, droplet tracking and absorption, has been performed varying the initial values of drop diameter, temperature of flue gas and their SO
2 concentration, according to the interval reported in
Table 1
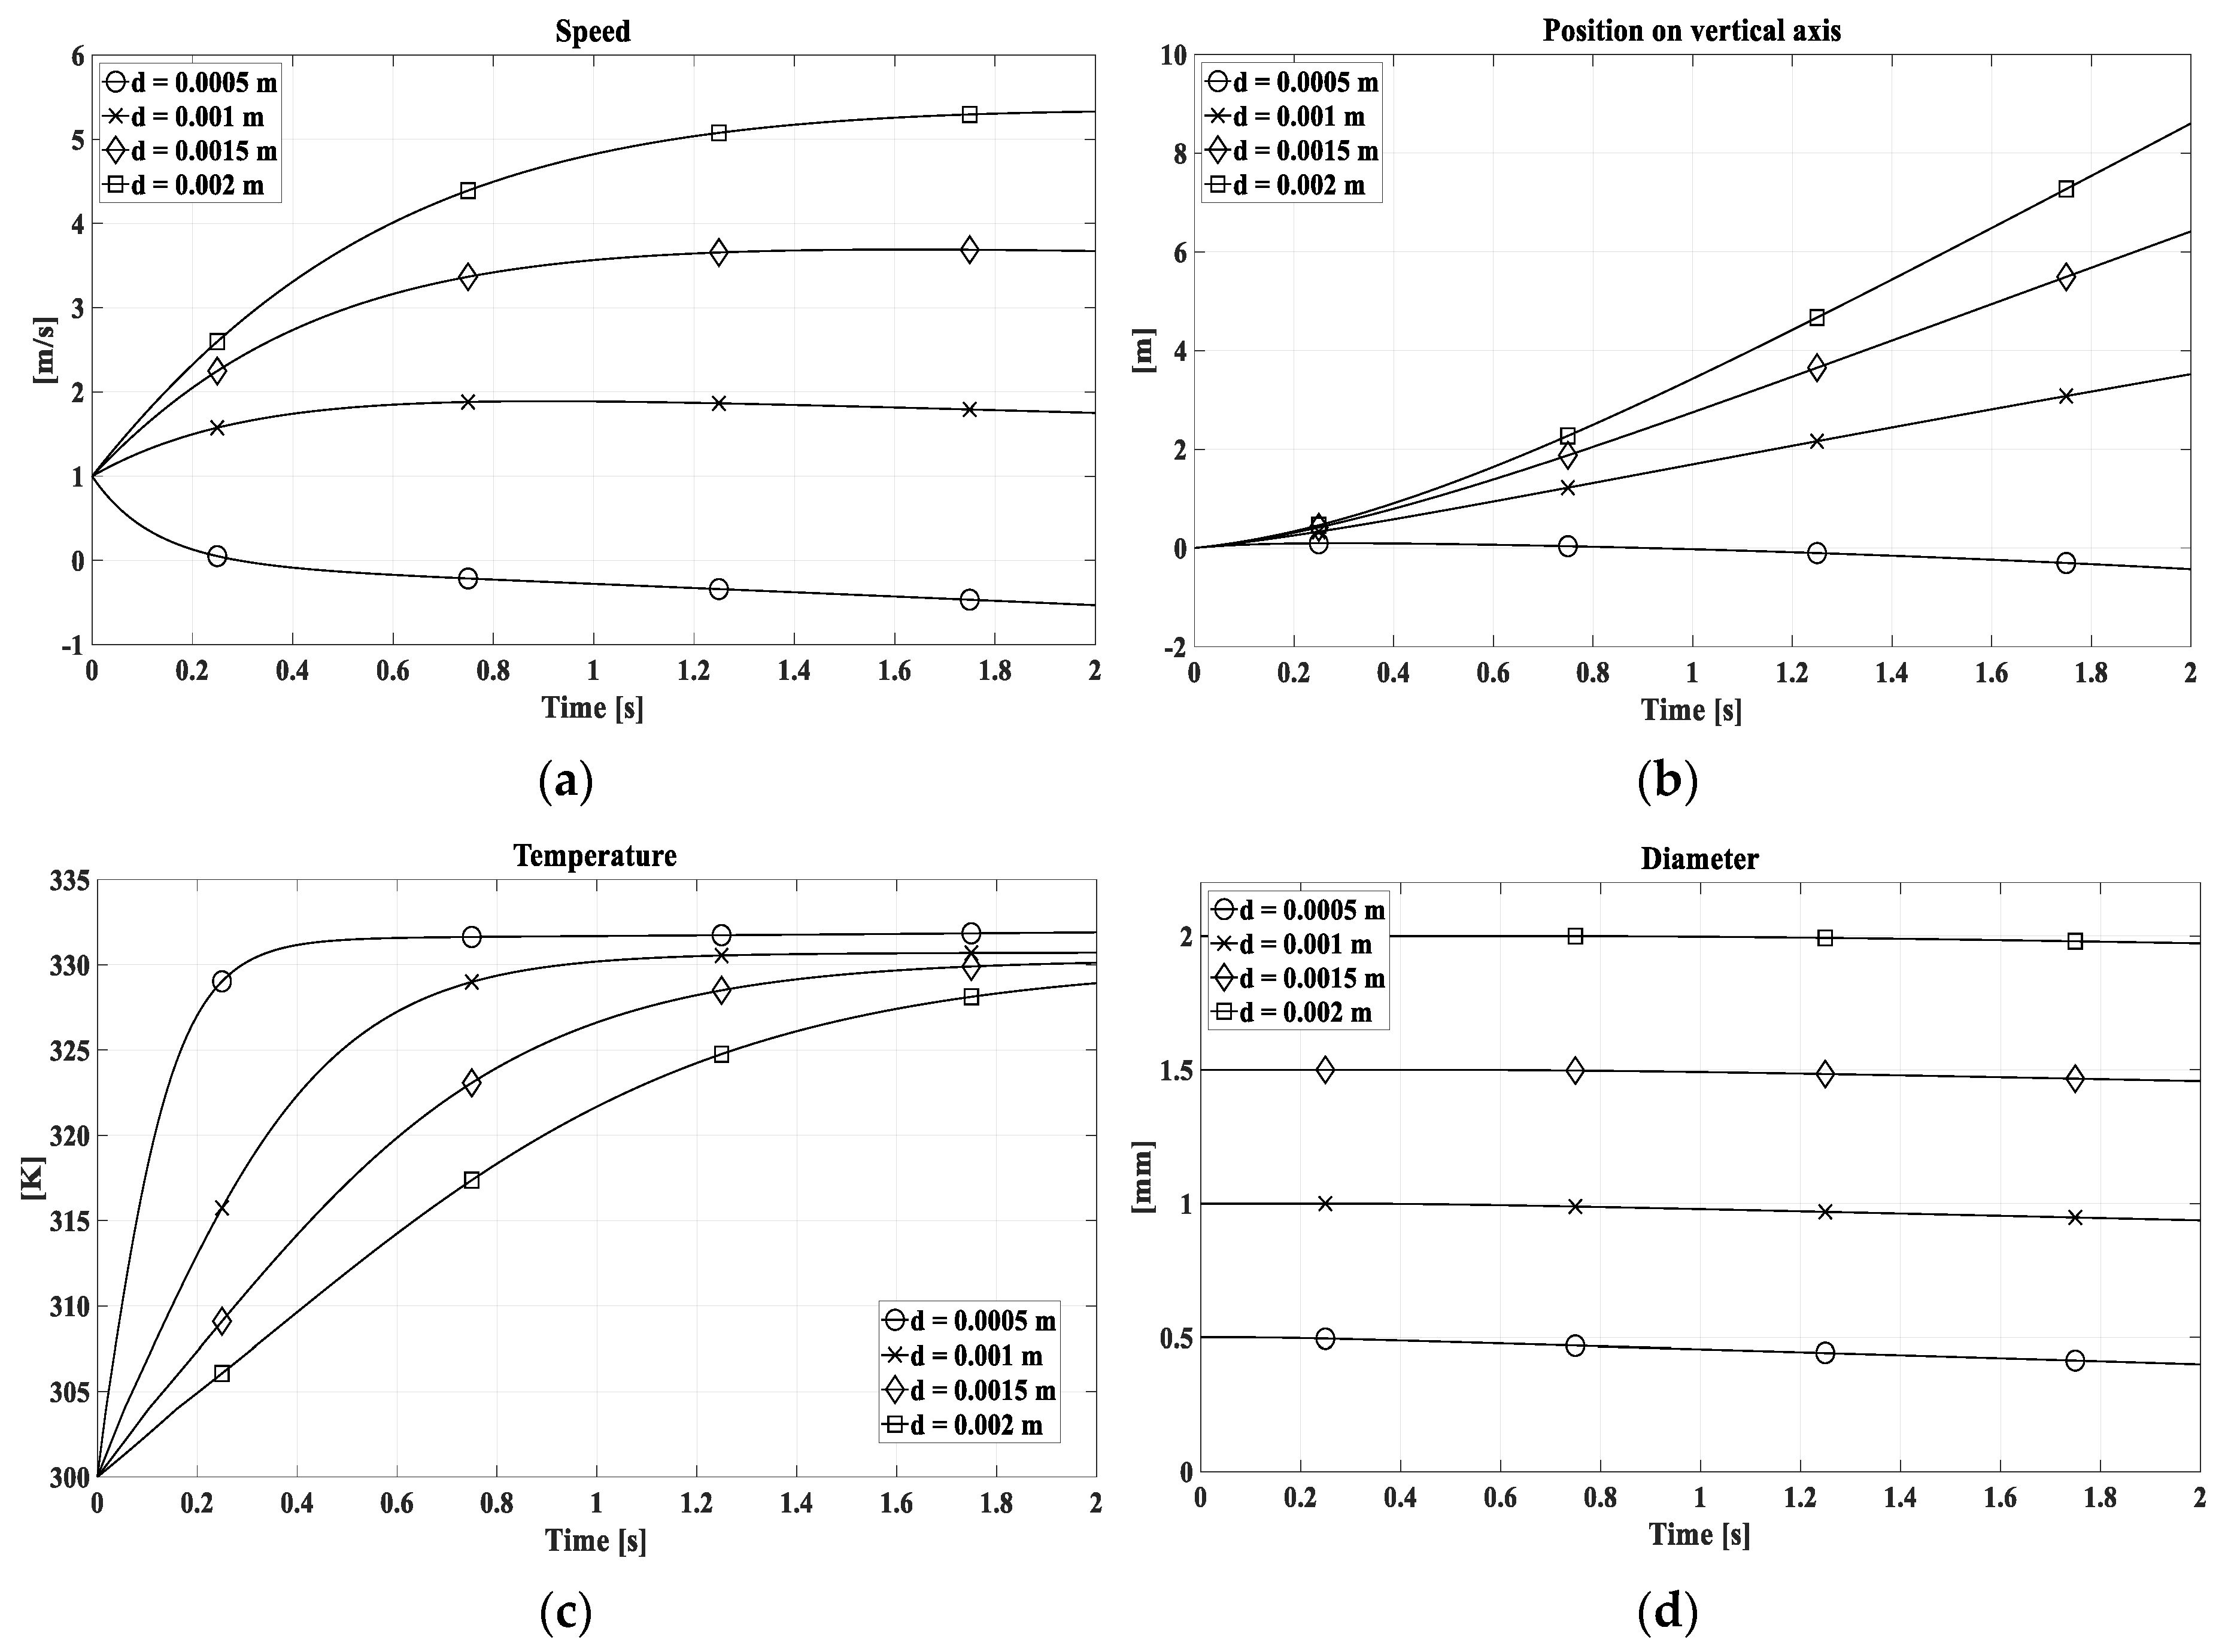
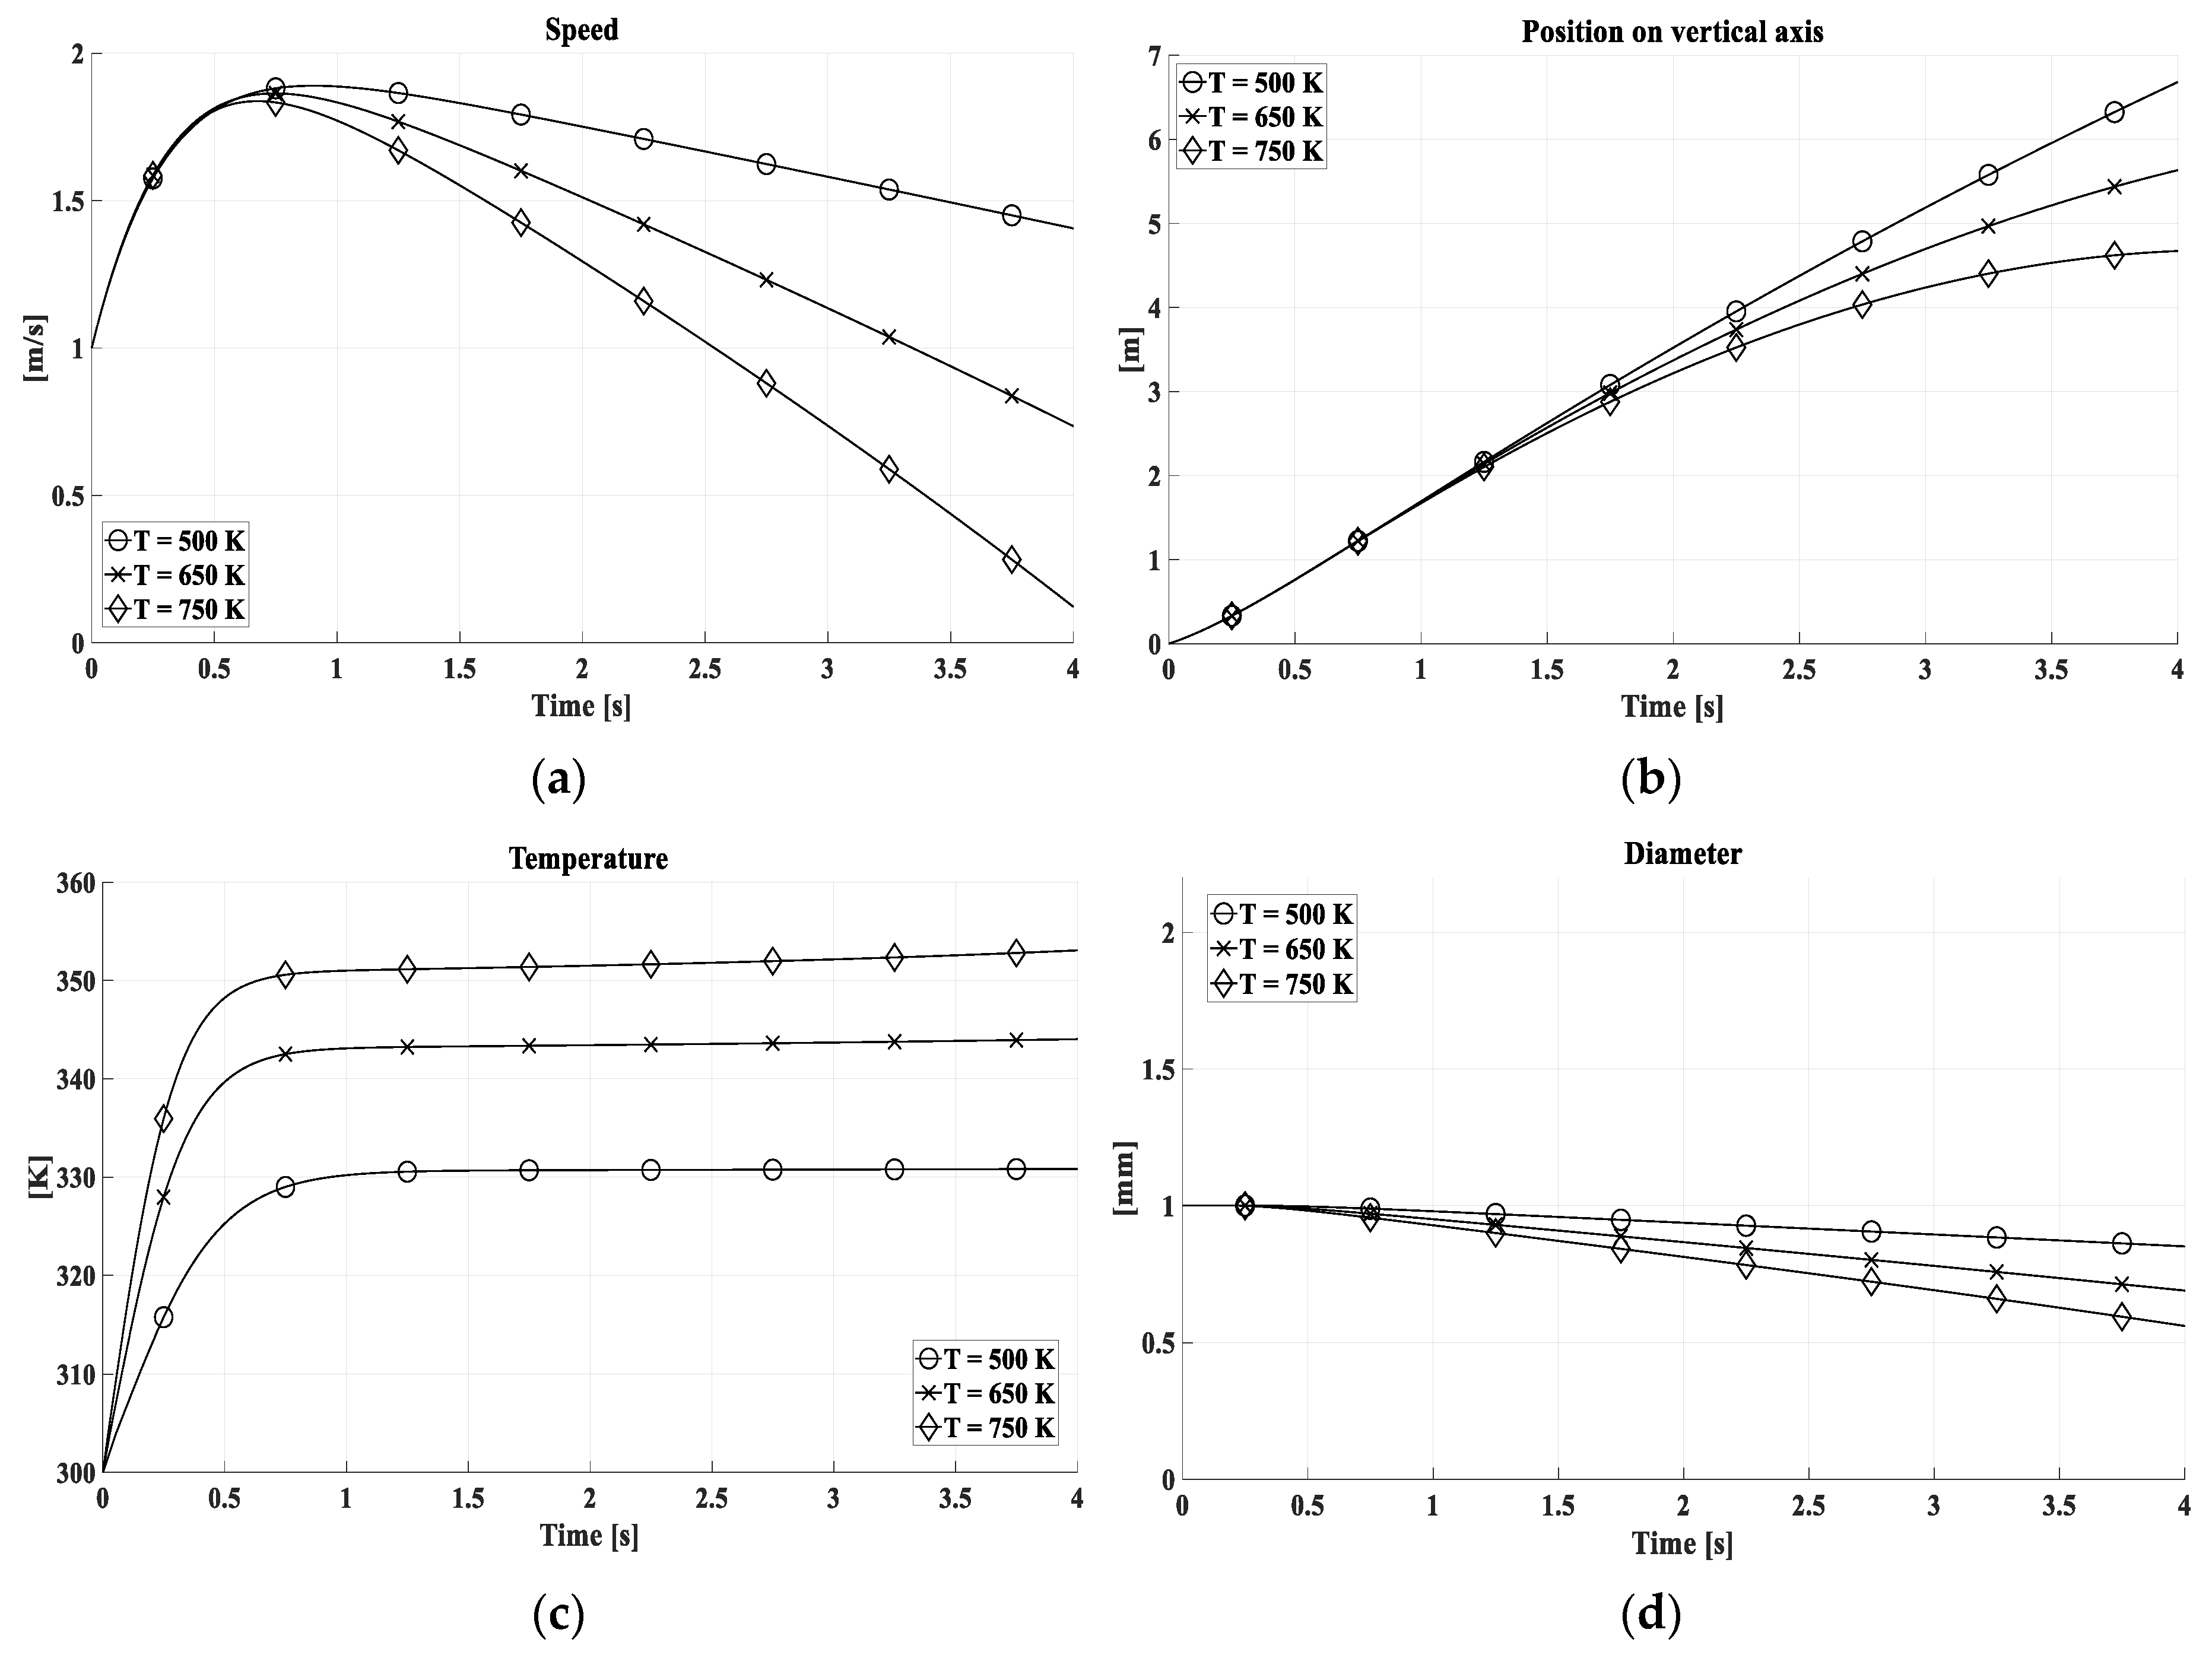
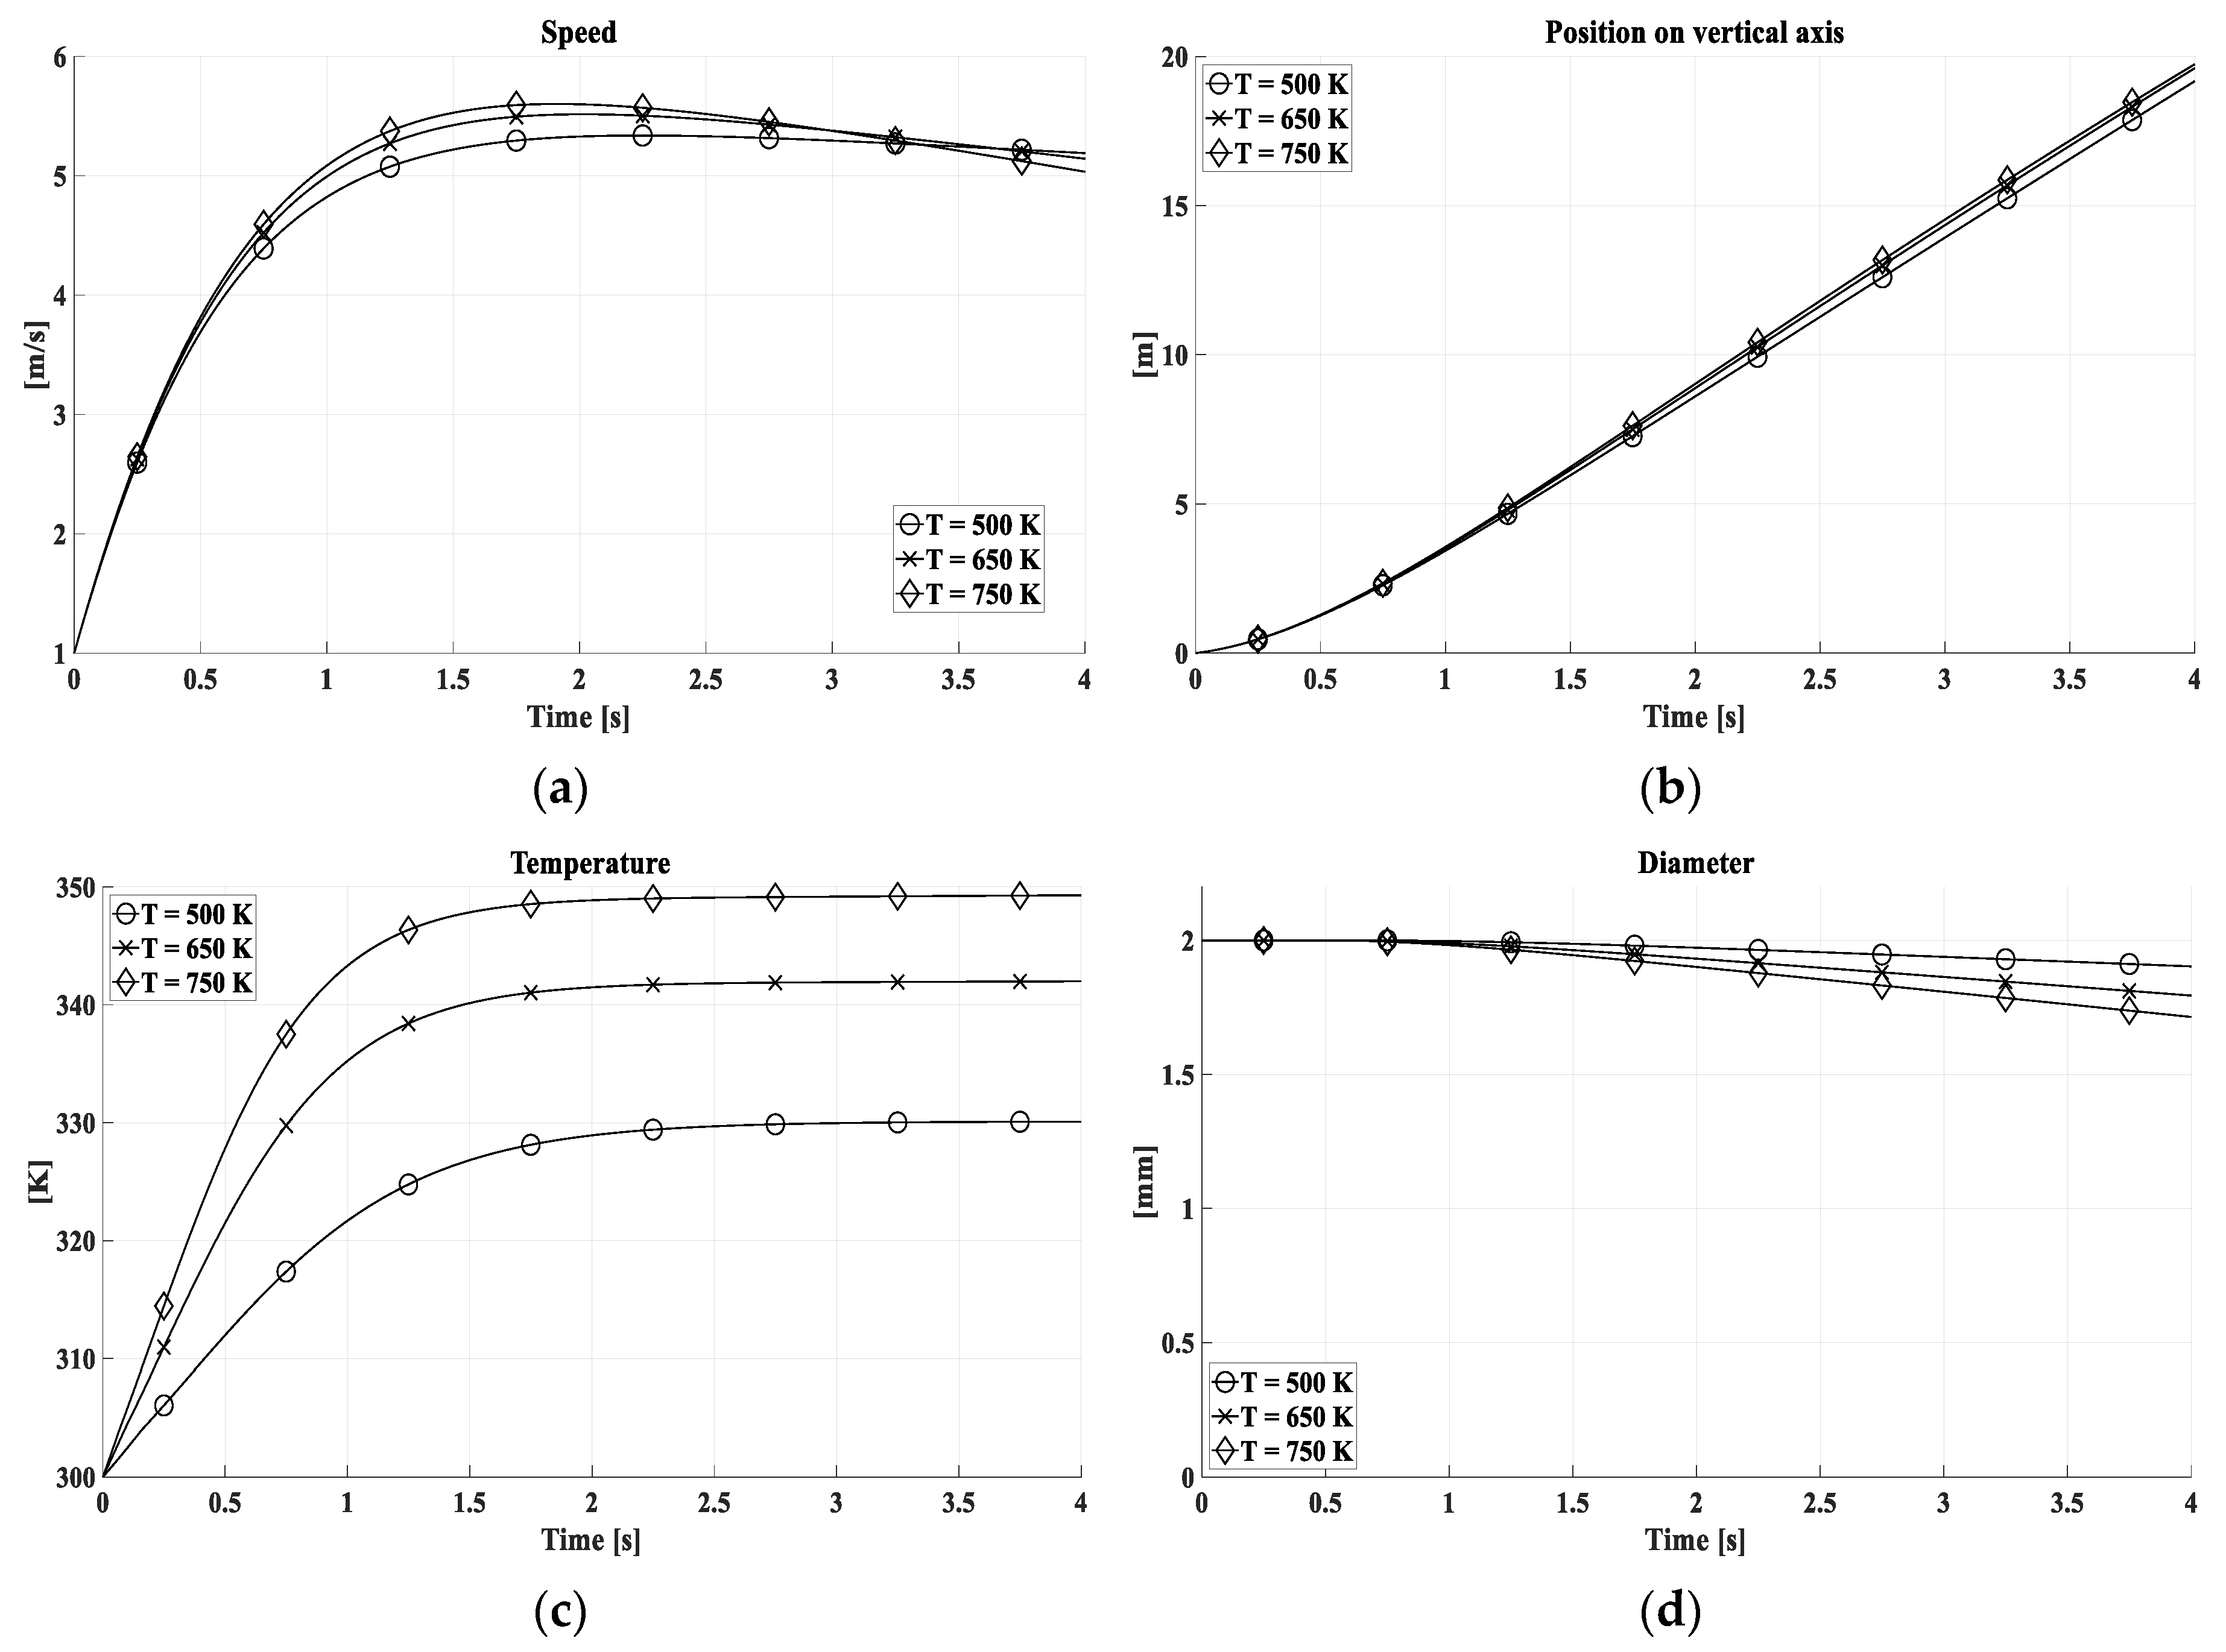
The evaluation on the droplet tracking model has been performed considering four variables: a) velocity, b) position, c) temperature and d) diameter. In this model the ∆t used was set equal to 0.0005 s for a simulation time of 4 seconds. In the graphical representation, the output variables has been reported for the first 2 seconds of the simulation when they are related to the variation of diameter while in the figures reporting the variables according to temperature variation the full 4 seconds simulation time has been used. The two different x-axis limits are due to the evaporation of the drop with an initial diameter of 0.5 mm.
Elaborations shown that the different concentrations of sulphur dioxide examinated do not alter the model so has been reported just the results relating to the concentration of 620 ppm.
Figure 6 shows the drop properties trend for different diameters, with a combustion gas temperature equal to 500 K. It is highlighted that for the diameter of 0.5 mm the drop tends to be dragged by the gaseous stream and to evaporate quickly.
In
Figure 7 and
Figure 8, the kinematic and thermodynamic properties of the drop have been evaluated for different temperatures for the diameter of 1 mm and 2 mm respectively. At 750 K the thermal equilibrium between water and gas is established at higher temperatures, by (11) and (19), and involves a faster reduction of the volume and consequently of the speed.
With regards to the absorption model the elaborations were performed with a time interval of 0.0004 s for a total of 3.2 s, therefore 8000 iterations were performed for each case study. The drops were divided into 50 concentric shells. In the droplet-tracking has been emerged that the evaporation time of a 0.5mm drop is smaller than 3.2s so in the absorption model this diameter value has been excluded.
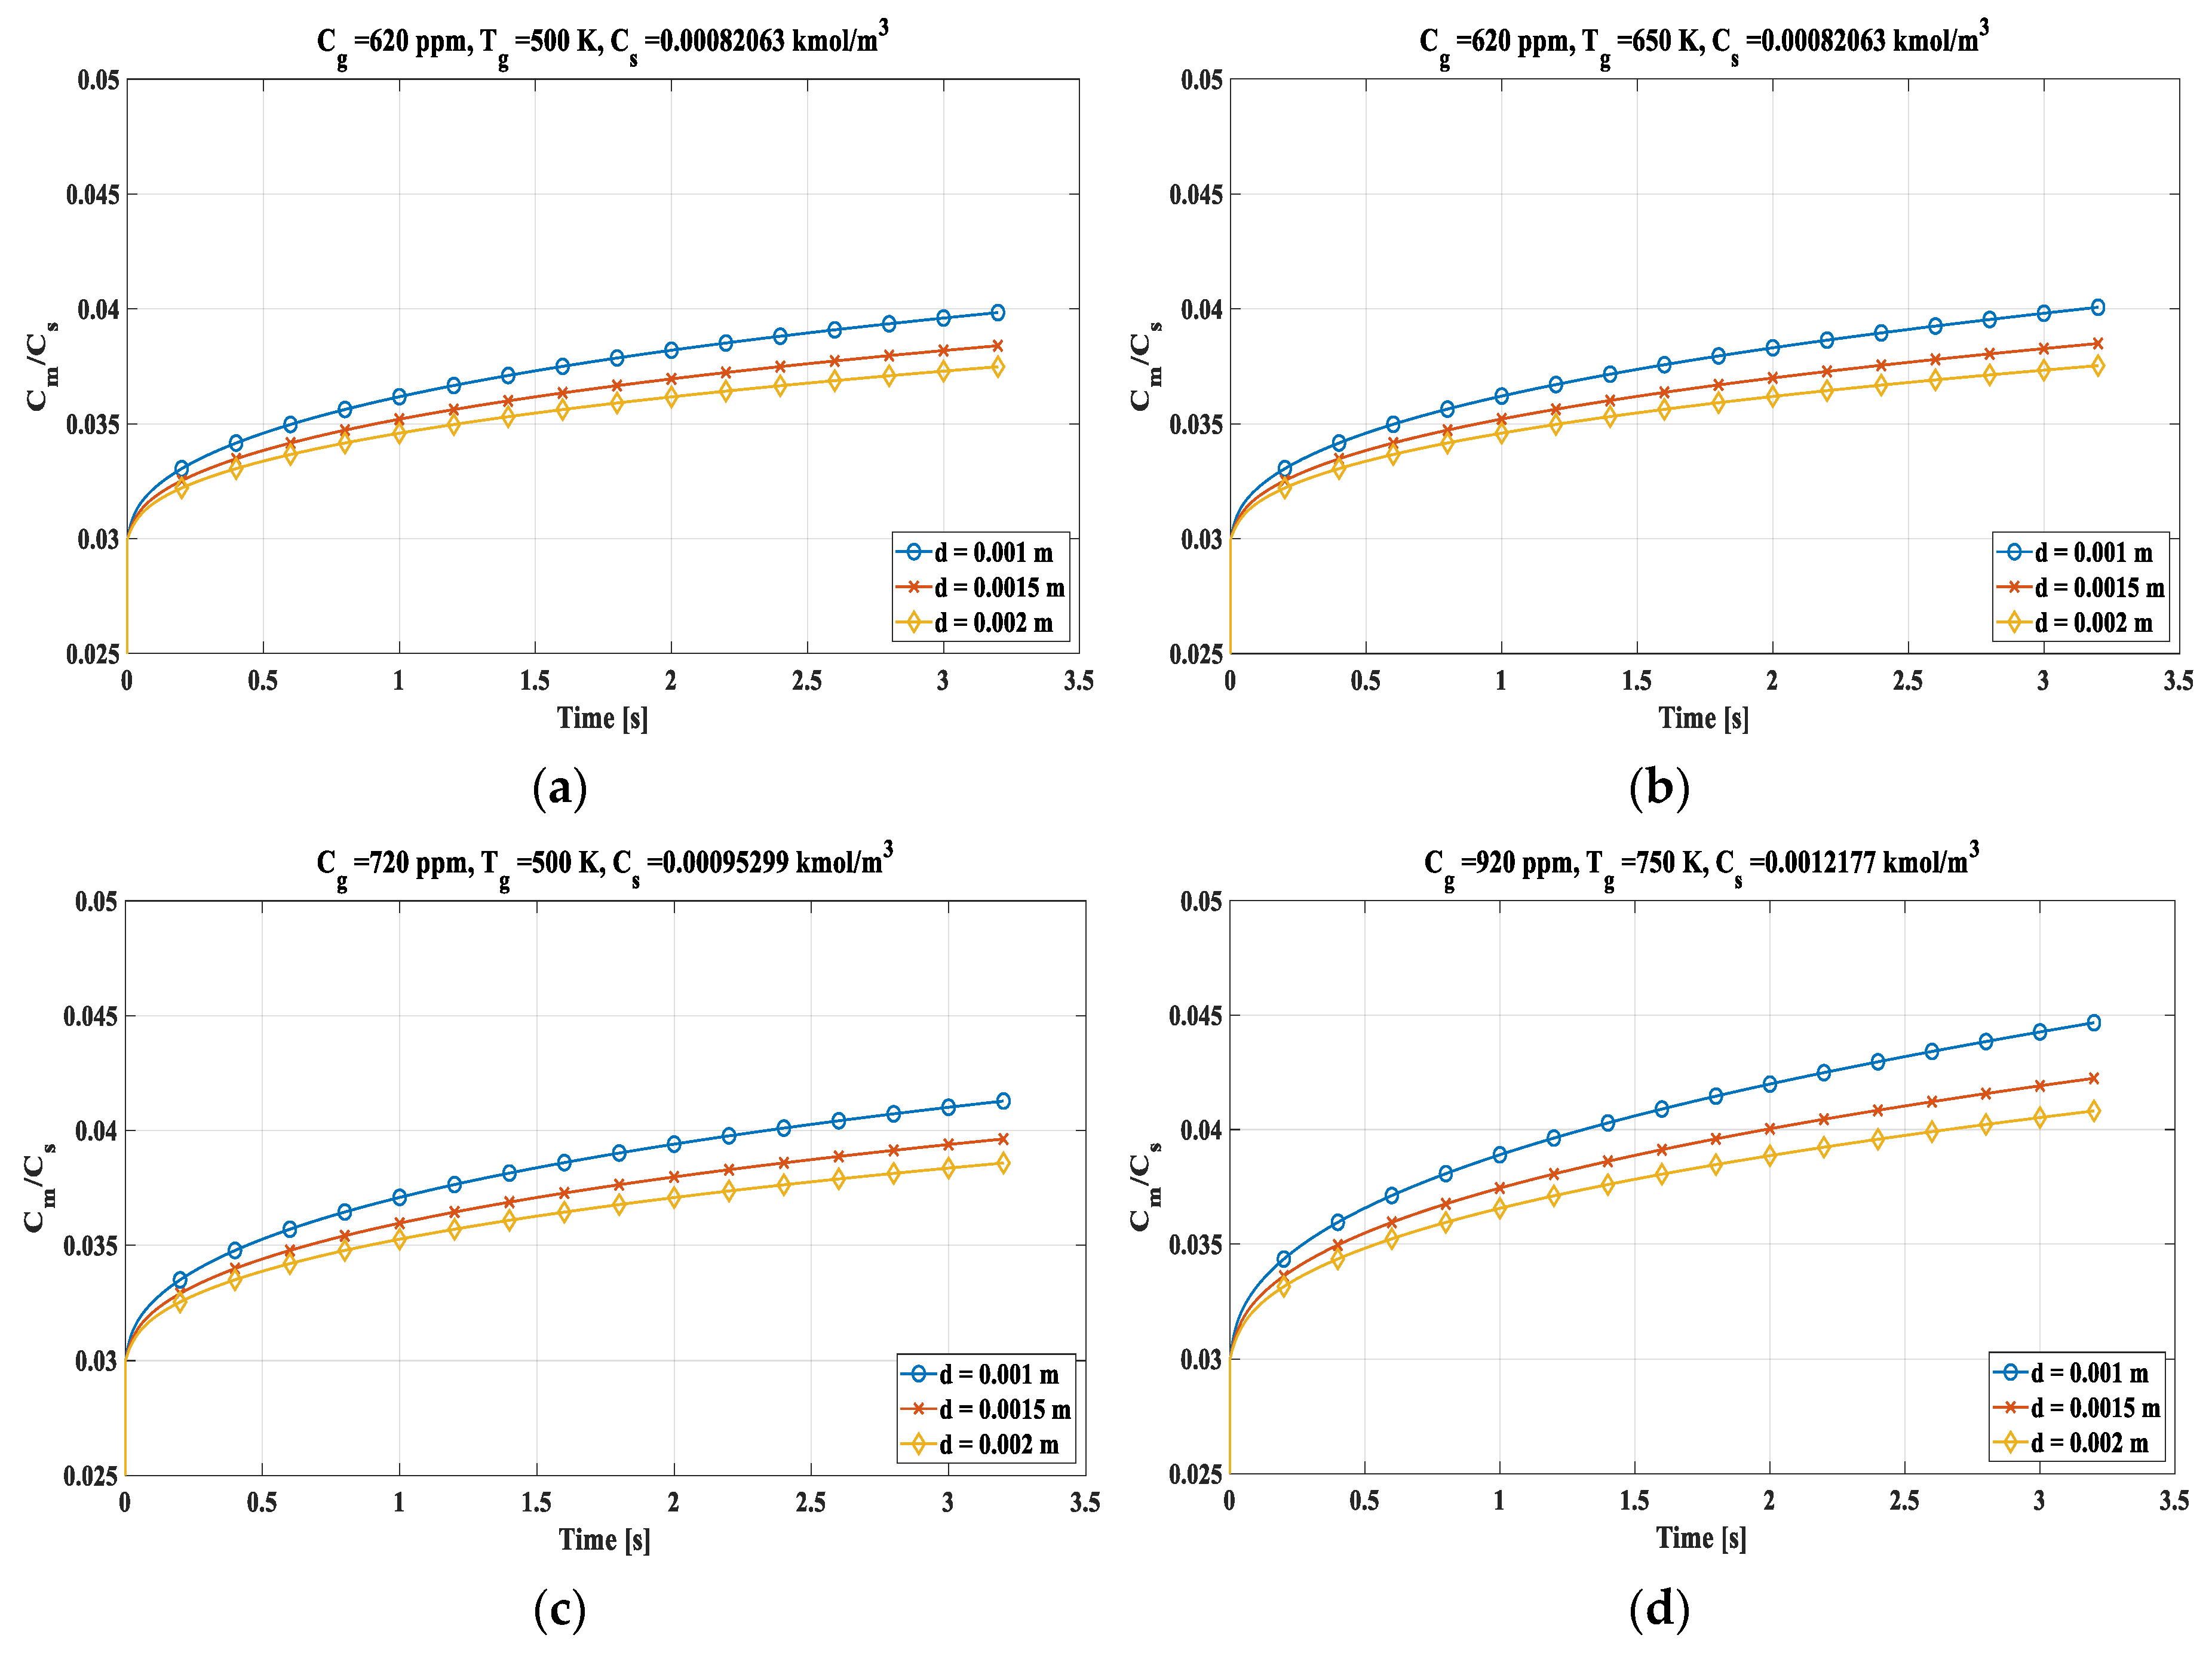
The average concentration of sulphur dioxide, in the drop, is calculated in relation to the saturation concentration as time varies. Analysing (
Figure 9) the smaller drops accumulate more SO
2 in less time and a variation in the concentration of sulphur dioxide inside the exhaust gases has a greater impact on the quantity absorbed than an increase in temperature of the bulk gases, but in all cases saturation condition is far. Case (a) is representative of the initial conditions:620 ppm and 500 K that are typical values for the exhaust gases of the marine engine. It should be noted that the 1 mm drop has the highest average concentration of SO
2. In (b) emerged, with a temperature of 650 K and a equal value of concentration, a slight increase in the mean concentrations of sulphur dioxide in the droplets due to the faster evaporation of the droplet while increasing the concentration, moved to 720 ppm and maintaining constant the temperature, as reported in (c) the increase in mean concentration is greater than in (b). Therefore, an increase in the concentration of SO
2 in the gases is more significant than the increase in temperature for a 1mm drop. Lastly, in (d) the most severe case evaluated has been represented, with a sulphur dioxide concentration of 920 ppm and a temperature of 750 K. These are unusual values for flue gases, but the increase in average concentration is the most significant but still. the saturation concentration is far to be reached. Such low ratio values are due in part to the absence, in the model, of the Hill vortex and in part to the absence of the alkalis which bind with the SO
2, making the absorption phenomenon slow.
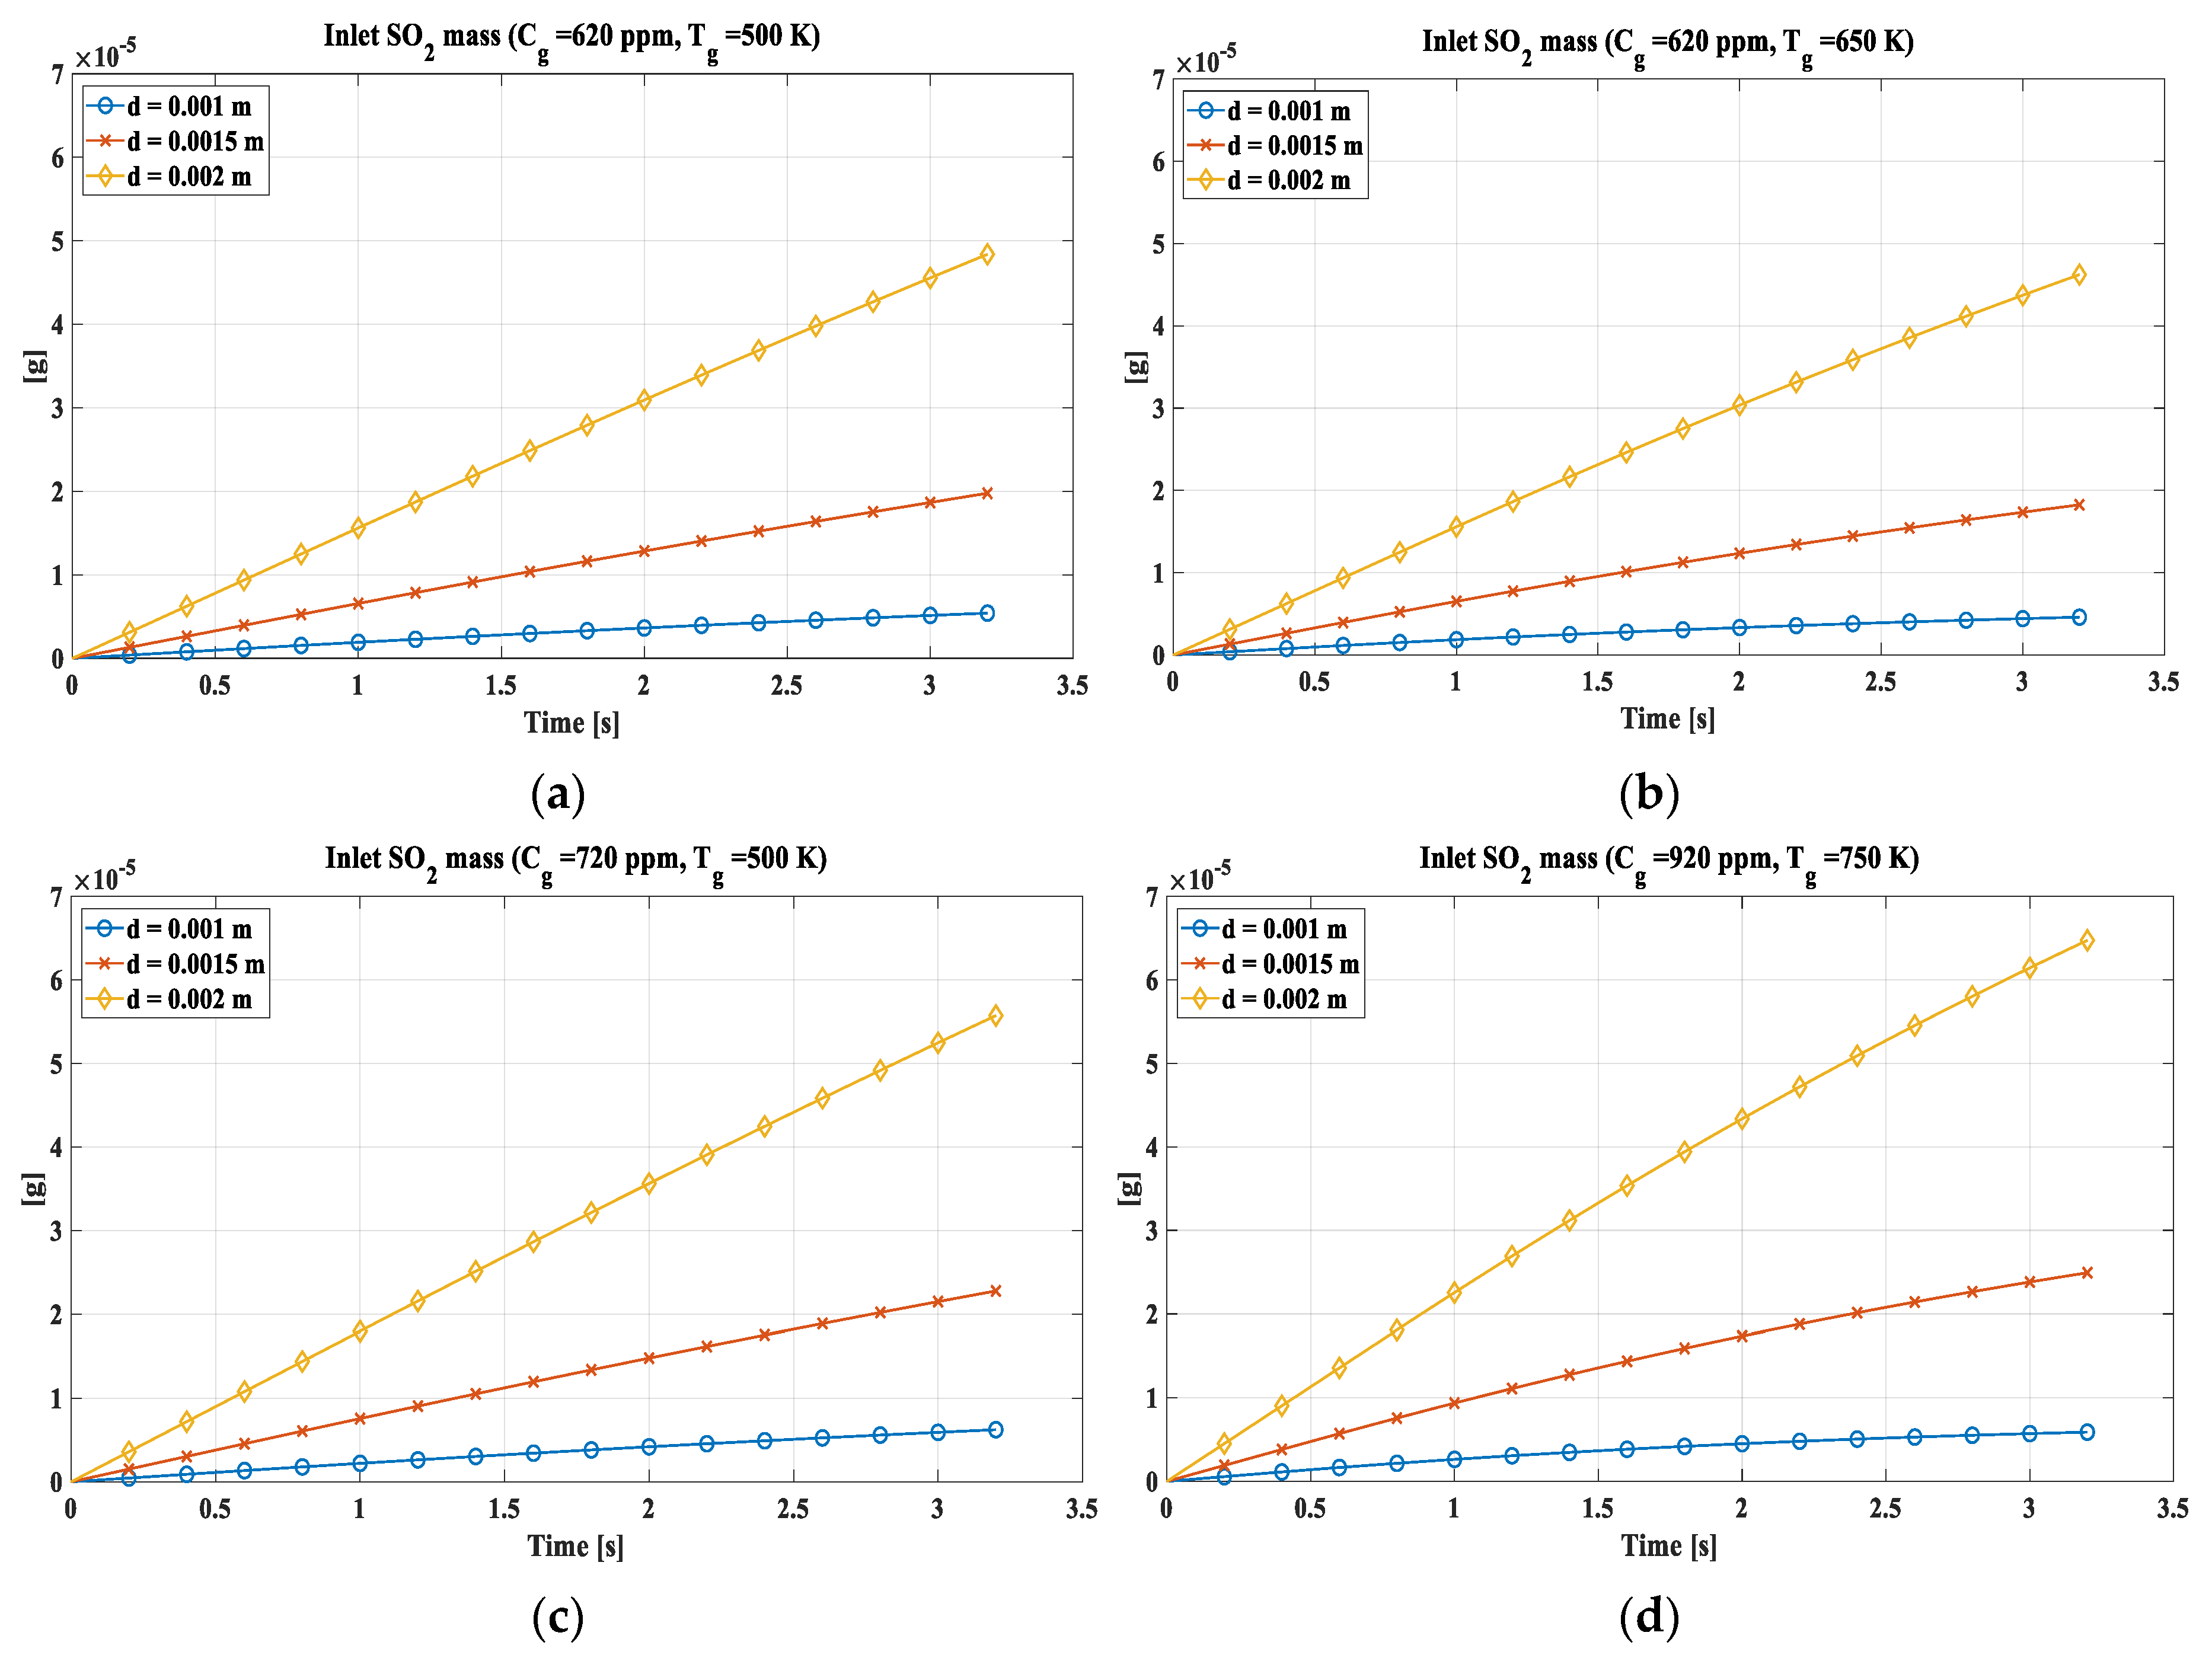
More, for absorption model the inlet of sulfur dioxide, during the simulation, were also evaluated (
Figure 10). The trend presents a slight curvature, more accentuated for the higher temperatures, due to the evaporation of the drop and the consequent decrease in volume which induces the single shell to go into saturation more easily, thus slowing down the entry of SO
2.In
Figure 10a are reported the trend for a concentration of 620 ppm and a temperature of 500 K. Analysing it emerged that the drop of 2 mm as diameter absorbs almost 5 × 10
−5 g of SO
2, while the one of 1.5 mm diameter absorbs about 2 × 10
−5 g, and the 1 mm one does not reach 10
−5 g. The different behaviour is mainly due to the size of the heat exchange surface, which is higher in the 2 mm drop. In
Figure 10b, with an increment of the temperature, the quantity of absorbed SO
2 decreases slightly following the evaporation of the drop that led to a decrement in volume with a limitation of the inlet. In
Figure 10c, SO
2 concentration has been set to 720 ppm and this induced an increase of SO
2 absorbed in the drop. The value is comparable to the one observed in 9(a). In
Figure 10d the most severe conditions are evaluated with a concentration of 920 ppm and a temperature of 750 K. Here although the temperature has increased leading to a decrease in absorption, the increase in concentration is a predominant phenomenon which in any case leads to an increase in the absorbed SO
2.
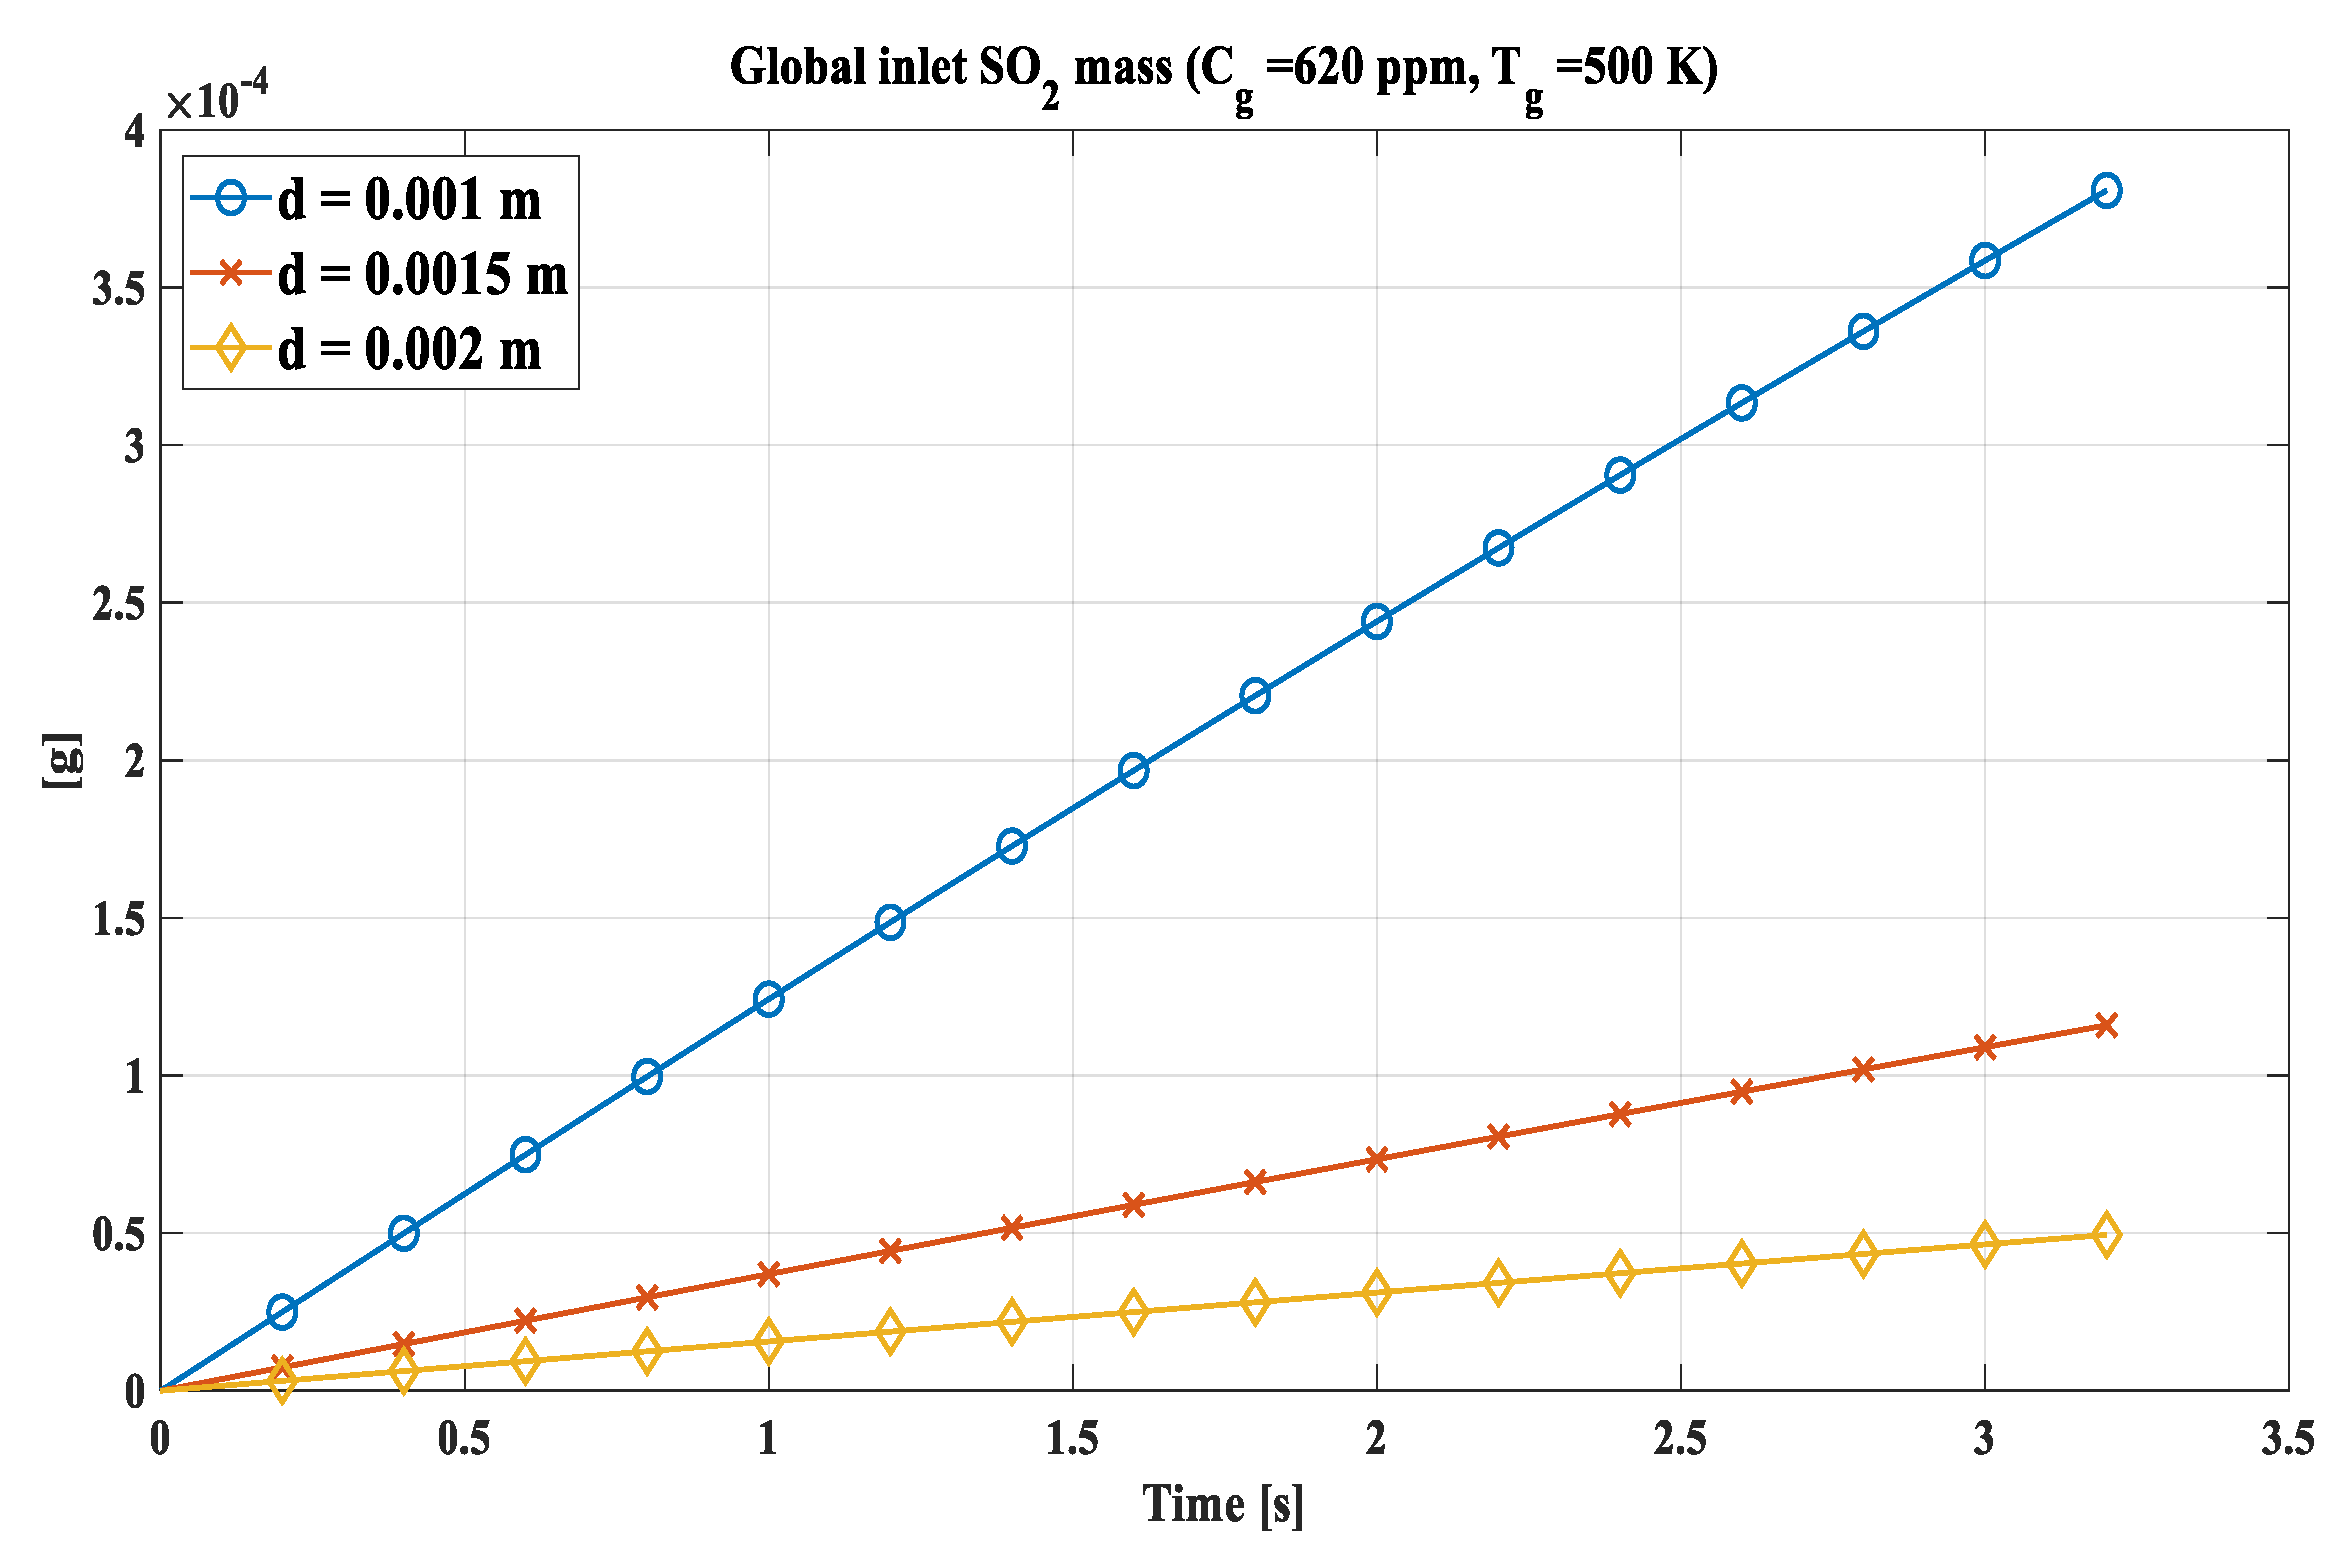
According to those results, the inlet SO2 has been calculated referring to the same mass of water. The value used is the mass of a single 2 mm drop and based on it, the number of drops (N
i) of 1 and 1.5 mm required to reach it has been calculated. N
i for 1 mm drops is equal to 8, while for 1.5 mm it is 2. 3704.. The trend is shown in
Figure 11, where the graph is shown for 620 ppm and 500 K, probable values for a stream of exhaust gases.
5. Conclusions
In this article a simplified numerical model has been described for the simulation of the sulphur dioxide absorption phenomenon by a drop of water falling inside a scrubbing column, and completely invested by the exhaust gases of a diesel engine naval type. The absence of Hill’s vortex and a simplified chemical model has been supposed.
The saturation condition on the whole drop is very far due to the absence of the convective term, thus leading to the saturation of only the outermost shells making the absorption slow. This is also accentuated by the decrease in droplet volume due to evaporation, which increases the average concentrations.
Inherently the mass of SO2 captured, it was found that the Ni drops with the smallest diameter computed are able to absorb more sulphur dioxide for the same mass of water given the greater surface-volume ratio, reaching about 3.8 × 10⁻⁴ g for the 8 drops of 1 mm compared to 4.9 × 10⁻⁵ g of the 2 mm drop at the conditions of SO2 concentration and temperature of 620 ppm and 500 K respectively, representing typical values for naval bulk gases.
References
- İ. A. Reşitoğlu, K. Altinişik, and A. Keskin, ‘The pollutant emissions from diesel-engine vehicles and exhaust aftertreatment systems’, Clean Techn Environ Policy, vol. 17, no. 1, pp. 15–27, Jan. 2015. [CrossRef]
- G. Langella, P. Iodice, A. Amoresano, and A. Senatore, ‘Marine Engines Emission and Dispersion in Fuel Switching Operation: A Case Study for the Port of Naples’, Energy Procedia, vol. 101, pp. 368–375, Nov. 2016. [CrossRef]
- MEPC.320(74): Guidelines for consistent implementation of the 0.50% sulphur limit under MARPOL Annex VI. Available online: Index of MEPC Resolutions and Guidelines related to MARPOL Annex VI (imo.org).
- European Maritime Transport Environmental Report 2021. Available online: European Maritime Transport Environmental Report 2021 — European Environment Agency (europa.eu).
- L. W. Nannen, R. E. West, and F. Kreith, ‘Removal of SO 2 from Low Sulfur Coal Combustion Gases by Limestone Scrubbing’, Journal of the Air Pollution Control Association, vol. 24, no. 1, pp. 29–39, Jan. 1974. [CrossRef]
- T. L. Tarbuck and G. L. Richmond, ‘Adsorption and Reaction of CO 2 and SO 2 at a Water Surface’, J. Am. Chem. Soc., vol. 128, no. 10, pp. 3256–3267, Mar. 2006. [CrossRef]
- A. Tomaszewski, T. Przybylinski, P. Kapica, and M. Lackowski, ‘Influence of the Spray Scrubber Geometry on the Efficiency of Dust Removal – Theoretical Predictions and CFD Analysis’, Journal of Applied Fluid Mechanics, vol. 13, no. 4, pp. 1055–1066, Jan. 2020.
- R. Kaesemann, J. Neumann, H. Fahlenkamp ‘Optimisation of the wet flue gas cleaning process through modelling the use of droplet interactions in overlapping sprays’ ILASS-Europe 2002 Zaragoza 9 –11 September.
- K. Selvakumar and M. Y. Kim, ‘A numerical study on the fluid flow and thermal characteristics inside the scrubber with water injection’, J Mech Sci Technol, vol. 30, no. 2, pp. 915–923, Feb. 2016. [CrossRef]
- T. Bešenić, M. Vujanović, J. Baleta, K. Pachler, N. Samec, and M. Hriberšek, ‘Numerical analysis of sulfur dioxide absorption in water droplets’, Open Physics, vol. 18, no. 1, pp. 104–111, Jan. 2020. [CrossRef]
- Exhaust gas scrubber washwater effluent. Available online: Exhaust Gas Scrubber Washwater Effluent (epa.gov).
- R. K. Srivastava, W. Jozewicz, and C. Singer, ‘SO2 scrubbing technologies: A review’, Environmental Progress, vol. 20, no. 4, pp. 219–228, 2001. [CrossRef]
- C. J. Walcek and H. R. Pruppacher, ‘On the scavenging of SO2 by cloud and raindrops: I. A theoretical study of SO2 absorption and desorption for water drops in air’, J Atmos Chem, vol. 1, no. 3, pp. 269–289, Sep. 1983. [CrossRef]
- C. Walcek, P. K. Wang, J. H. Topalian, S. K. Mitra, and H. R. Pruppacher, ‘An Experimental Test of a Theoretical Model to Determine the Rate at which Freely Falling Water Drops Scavenge SO2 in Air’, Journal of the Atmospheric Sciences, vol. 38, no. 4, pp. 871–876, Apr. 1981. [CrossRef]
- A. Saboni and S. Alexandrova, ‘Sulfur dioxide absorption and desorption by water drops’, Chemical Engineering Journal, vol. 84, no. 3, pp. 577–580, Dec. 2001. [CrossRef]
- R. Kaji, Y. Hishinuma, and H. Kuroda, ‘SO2 absorption by water droplets.’, J. Chem. Eng. Japan/JCEJ, vol. 18, no. 2, pp. 169–172, 1985. [CrossRef]
- M. R. Talaie, J. Fathikalajahi, and M. Taheri, ‘Mathematical Modeling of SO 2 Absorption in a Venturi Scrubber’, Journal of the Air & Waste Management Association, vol. 47, no. 11, pp. 1211–1215, Nov. 1997. [CrossRef]
- M. I. Lamas, C. G. Rodríguez, J. D. Rodríguez, and J. Telmo, ‘Numerical Model of SO Scrubbing with Seawater Applied to Marine Engines’, Polish Maritime Research, vol. 23, no. 2, pp. 42–47, Apr. 2016. [CrossRef]
- G. Caiazzo, A. Di Nardo, G. Langella, and F. Scala, ‘Seawater scrubbing desulfurization: A model for SO2 absorption in fall-down droplets’, Environmental Progress & Sustainable Energy, vol. 31, no. 2, pp. 277–287, 2012. [CrossRef]
- W.-H. Chen, ‘Air pollutant absorption by single moving droplets with drag force at moderate Reynolds numbers’, Chemical Engineering Science, vol. 61, no. 2, pp. 449–458, Jan. 2006. [CrossRef]
- W.-H. Chen, ‘Unsteady absorption of sulfur dioxide by an atmospheric water droplet with internal circulation’, Atmospheric Environment, vol. 35, no. 13, pp. 2375–2393, May 2001. [CrossRef]
- H.-C. Kim and K. Lee, ‘Significant contribution of dissolved organic matter to seawater alkalinity’, Geophysical Research Letters, vol. 36, no. 20, 2009. [CrossRef]
- Flagiello Domenico, Di Natale Francesco, Lancia Amedeo, and Salo Kent, ‘Effect of Seawater Alkalinity on the Performances of a Marine Diesel Engine Desulphurization Scrubber’, Chemical Engineering Transactions, vol. 86, pp. 505–510, Jun. 2021. [CrossRef]
- G. Caiazzo, Seawater scrubber per la desolforazione di gas combusti prodotti da un motore navale; analisi numerica, sperimentazione, confronto con l’utilizzo di combustibili a basso tenore di zolfo. PhD Thesis, University of Naples ‘Federico II’, Naples, 2011.
- A. S. Simonsen, Modelling and Analysis of Seawater Scrubbers for Reducing SOx Emissions from Marine Engines, Phd Thesis, Aalborg University, 2018. [CrossRef]
- L. B. Baboolal, H. R. Pruppacher, and J. H. Topalian, ‘A Sensitivity Study of a Theoretical Model Of SO2 Scavenging by Water Drops in Air’, Journal of the Atmospheric Sciences, vol. 38, no. 4, pp. 856–870, Apr. 1981. [CrossRef]
- Y. Bozorgi, P. Keshavarz, M. Taheri, and J. Fathikaljahi, ‘Simulation of a spray scrubber performance with Eulerian/Lagrangian approach in the aerosol removing process’, Journal of Hazardous Materials, vol. 137, no. 1, pp. 509–517, Sep. 2006. [CrossRef]
- A. Haider and O. Levenspiel, ‘Drag coefficient and terminal velocity of spherical and nonspherical particles’, Powder Technology, vol. 58, no. 1, pp. 63–70, May 1989. [CrossRef]
- N. Ellendt, A. M. Lumanglas, S. I. Moqadam, and L. Mädler, ‘A model for the drag and heat transfer of spheres in the laminar regime at high temperature differences’, International Journal of Thermal Sciences, vol. 133, pp. 98–105, Nov. 2018. [CrossRef]
- R. B. Bird, W. E. Stewart and E. N. Lightfoot. Chapter 17: Diffusivity and the mechanism of mass transport. In Transport Phenomena, 2nd edition; John Wiley & Sons, Inc, United States of America.
- R. Sander, ‘Compilation of Henry’s law constants, version 3.99′, Atmospheric Chemistry and Physics Discussions, vol. 14, pp. 29615–30521, Nov. 2014. [CrossRef]
|
Disclaimer/Publisher’s Note: The statements, opinions and data contained in all publications are solely those of the individual author(s) and contributor(s) and not of MDPI and/or the editor(s). MDPI and/or the editor(s) disclaim responsibility for any injury to people or property resulting from any ideas, methods, instructions or products referred to in the content. |
© 2023 by the authors. Licensee MDPI, Basel, Switzerland. This article is an open access article distributed under the terms and conditions of the Creative Commons Attribution (CC BY) license (http://creativecommons.org/licenses/by/4.0/).
