1. Introduction
In recent years, the situation of heavy metal pollution in soils has become increasingly serious, and the levels of heavy metals in soils and crops are increasing, which has a major negative impact on human health. A soil plan in China reports that lead (Pb) and cadmium (Cd) are the two major metal contaminants in soil (China's Ministry of Environmental Protection, 2016). They are toxic, widespread and non-biodegradable [
1]. It is reported that millions of people may be at risk from heavy metal pollution [
2]. Pb can damage the human nervous and digestive systems, and Cd can lead to chronic cardiovascular and neurological diseases [
3]. The environment becomes contaminated when the accumulation of heavy metals exceeds the self-purification capacity of the environment. Therefore, once these contaminants have been identified, methods to remove them become critical [
4,
5].
Treatment methods for heavy metals include chemical precipitation, ion exchange, reverse osmosis and adsorption. Adsorption is considered to be an economical and effective method for decontaminating soil and environmental due to its low cost, high efficiency and environmental friendliness [
6]. In recent years, adsorption technology using biochar as adsorbent has attracted much attention due to its advantages of low cost, convenient preparation, superior physical and chemical properties, high removal capacity and high cation exchange capacity [
7,
8,
9,
10]. Biochar is a black solid product produced by the decomposition of organic matter under anoxic or anaerobic high temperature conditions (< 700℃). Raw materials for biochar production come from a wide range of biomass sources. Agricultural and forestry wastes (crop straw, pig manure, cow manure, wood chips, kitchen waste, industrial waste and municipal sludge) can be used as feedstocks for biochar preparation [
11,
12]. Studies have shown that the adsorption capacity of biochar based on wood and bark is very low for Cd
2+ (0.34-5.40 mg·g
-1) [
13]. In contrast, biochar produced from cow dung had a high maximum adsorption capacity for Cd
2+ (51.4 mg·g
-1) [
14]. Biochar extracted from different crop straws showed a higher adsorption capacity for Cd
2+ (57.7-96.4 mg·g
-1) in aqueous solution [
15]. Obviously, the choice of biochar raw materials is crucial, it usually determines the adsorption capacity and the performance of the biochar.
Crop straws as important plant sources of biomass was once treated as agricultural wastes that can be easily obtained in rural environment in China. Biochars are normally produced from waste materials because of the low cost. Many studies have shown that maize straw, rice straw and wheat straw have good adsorption capacity for heavy metals [16-18]. However, few studies have been focused on the comparison of metal adsorption capacity of plant biomass obtained from crop straw as a sorbent. In particular, there is little research on sorghum straw as a material with high sorption capacity and low cost.
The adsorption capacity of plant-derived biochar is affected by characteristic of biochar, such as biochar pH, specific surface area, element composition, cation exchange, oxygen-containing functional groups [19-21], as well as preparation condition, such as temperature, rate and time [
22], and adsorption conditions, such as initial pH value and initial dosage [
23,
24], and heavy metal ion types, properties [
18,
25]. The differences in these factors have a significant impact on the properties and the adsorption capacities of biochar for metal ions. In addition, the adsorption performance of the biochar obtained under different preparation conditions could not be compared horizontally.
Therefore, the objective of the present study is to compare the adsorption characteristics of Pb2+ and Cd2+ using different plant-derived biochars through biochar properties, batch adsorption tests and kinetic modelling, to analyze the reasons for the differences and to select suitable adsorption materials.
2. Materials and Methods
2.1. Biochar Preparation
In this research, biochars were obtained from crop straws of five plant species (i. e. Oryza sativa L., Zea mays L., Sorghum bicolor L. Moll., Triticum aestivum L., Phragmites australis (cav.) Trin. Ex. Steud.) through slow pyrolysis at 600 °C., all collected from a farm in Donghai County, Lianyungang City, Jiangsu Province. This temperature was selected based on previous studies [
26,
27], at which the produced biochars had a greater sorption capacity for contaminants and better balance between the yield and energy costs. The five raw materials were washed, dried to constant weight in an oven at 105 °C, and ground through a 40 mesh (0.425 mm) sieve using a grinder.
The biochar was prepared by the oxygen-limited temperature-controlled pyrolysis method: the ground material was placed in a crucible and heated to 600 ℃ in a muffle furnace at a heating rate of 5 ℃·min-1 for 2 h. The grey part of the sample surface was removed, leaving the black carbonaceous component. Soaked in 0.1 mol·L-1 hydrogen chloride solution for 12 h, filtered through a Brinell funnel, washed with deionized water, removed after drying in an oven, ground through a 100 mesh (0.150 mm) sieve, placed in a sealed bag and placed in a dryer as a reserve. Sorghum straw, rice straw, wheat straw, reed straw and corn straw were labelled as GBC, SBC, XBC, LBC and YBC, respectively.
2.2. Biochar Characterization
The prepared biochar was heated in a muffle furnace at 800 ℃ for 4 h to calculate its ash content; Atomic absorption spectrometer(ContrAA 700)was used to determine the Na+ content in the solution, and the total cation exchange volume could be calculated; The contents of C, H, N and S elements in biochar were analyzed by organic element analyzer (SHG-100); The specific surface area (SA) of biochar was calculated by multi-point BET method (0.1-0.35 P/P0), the micropore surface area (A micro) was calculated by t-plot method, and the micropore volume (V micro) was calculated by DFT method, the pore volume (V total) was measured when the relative pressure (P/P0) was about 0.99; The average micropore size (D) is obtained from the ratio of micropore volume to specific surface area of 4 times; The surface pore characteristics of biochar samples were observed by scanning electron microscope (JSM-6700F); Biochar functional groups were determined by Fourier transform infrared spectroscopy (FTIR) (VERTEX 70, Bruker, Germany); An X-ray diffractometer (Bruker D8 ADVANCE) was used to analyze the crystal structure of biochar.
2.3. Adsorption Experiments
2.3.1. The effect of initial pH value and initial dosage on the adsorption
Zero point six grams of biochar was placed in a 50 mL conical flask, 20 ml of 400 mg·L-1 Pb (NO3)2 and 100 mg·L-1 Cd (NO3)2 solution was added, and the pH was adjusted to 2, 3, 4, 5, 6 with HNO3 or HCl. The concentrations of Pb2+ and Cd2+ in the filtrate were determined by ICP-MS, and the effect of pH on the adsorption of Pb2+ and Cd2+ by biochar was investigated.
2.3.2. Isothermal Adsorption Experiment
Zero point six grams of biochar was weighed into a 50 mL conical flask, 20 ml of Pb (NO3)2 solution was added at 10, 20, 30, 50, 75, 100, 200 and 400 mg·L-1. Cd (NO3)2 was added at the mass concentrations of 5, 10, 15, 25, 50, 80, 100 and 120 mg·L-1, and the pH of the solution was adjusted to 5.0 with 0.1 mol·L-1 of HNO3 and NaOH.
2.3.3. Adsorption Kinetics Experiment
Five hundred milliliters of Pb (NO3)2 and Cd (NO3)2 solutions were added to a constant temperature magnetic stirrer for stirring to adjust the pH of the solution. Samples were taken at 5, 10, 20, 30, 60, 90, 120, 180, 240, 300, 360, 420, 480 and 720 min, respectively, and the absorbance value of the filtrate was determined by ICP-MS after filtration.
2.3.4. Thermodynamic Adsorption Experiment
Zero point six grams of biochar was weighed and add 20 ml of Pb (NO3)2 solution was added at 10, 20, 30, 50, 75, 100, 200 and 400 mg·L-1. Cd (NO3)2 was added at 5, 10, 15, 25, 50, 80, 100 and 120 mg·L-1 to adjust the pH value. Isothermal adsorption experiments were carried out at 25, 35 and 45 ℃.
2.3.5. Infrared Spectral Analysis
After filtration and drying of the five biochar samples before and after adsorption, the infrared spectra of the samples were determined by Fourier transform infrared spectrometer. The wavelength range was 4000~500 cm-1 and the scan time was 64.
2.4. Data Analysis
The amount of Pb and Cd adsorption was calculated by using the following equation per unit mass:
Where qt is the amount of biochar absorbed on heavy metals per unit mass (mg·g-1), C0 is the initial concentration of the heavy metal solution (mg·L-1), Ct is the concentration of the heavy metal solution at sampling time T (mg·L-1), V is the volume of the heavy metal solution (L), and m is the dosage of biochar (g).
Pseudo-first-order kinetic model, pseudo-second-order kinetic model and intra-particle diffusion model were used to fit the experimental results, and the kinetic characteristics of heavy metal adsorption by biochar were analyzed.
Pseudo-first-order kinetic equation:
pseudo-second-order kinetic equation:
intra-particle diffusion model:
Where qe is the amount of heavy metal removed at equilibrium (mg·g-1), K1 is the pseudo-first-order rate constant (min-1), and K2 is the pseudo-second-order rate constant (g·mg-1·min-1).
The equilibrium data can be fitted by using the following Langmuir model, Freundlich model, Temkim adsorption equation and Dubinin-Radushkevich (D-R) adsorption equation.
Freundlich model equation:
Temkim adsorption equation:
Dubinin-Radushkevich (D-R) adsorption equation:
Where Qe is the amount of heavy metal removed at equilibrium (mg·g-1), Ce represents the concentration of heavy metals at equilibrium (mg·L-1), KF is the affinity between adsorbent and heavy metals (g-1), 1/n is the Freundlich constant, Qm is the maximum adsorption amount of heavy metals (mg·g-1), KL is the Langmuir constant related to the binding energy, A is the equilibrium binding constant (mg·g-1), and B is the coefficient of the Temkim equation related to the heat of adsorption. β is the D-R equation coefficient (mol2·J-2), Q0 is the maximum unit adsorption capacity (mmol·g-1), ε is the Polanyi adsorption potential, R is the ideal gas constant (8.314 J·mol-1·K-1), T is the absolute temperature, E is the adsorption free energy (J·mol-1).
By studying the thermodynamic properties, it is determined whether the adsorption process of five biochars on heavy metals is spontaneous. The method of calculating the thermodynamic parameters is as follows:
Where ΔGθ is the Gibbs free energy change (kJ·mol-1), ΔHθ is the enthalpy change (J·mol-1), ΔSθ is the entropy change (kJ·mol-1·K-1), T is the thermodynamic temperature of the reaction system (K), R is the gas constant (8.314 J·mol-1·K-1), Kd is the adsorbent distribution coefficient of the adsorbent in the solid-liquid phase (mL·g-1).
3. Results
3.1. Biochar Characterization
The characteristics of the different plant-based biochar obtained in the same pyrolysis system were different (
Table 1). The five biochars were alkaline, the ash content of GBC was relatively high, the specific surface area was significantly higher than that of the other four biochar types, and the total pore volume was relatively large. Among the five biochars, LBC had the lowest H/C (0.346), indicating a strong aromaticity [
28]. SBC had the highest O/C (0.479) and (N+O)/C (0.507), indicating that SBC has strong hydrophilicity and polarity [
29]. The cation exchange capacity (CEC) of the five biochar types was XBC > SBC > GBC > YBC > LBC in order.
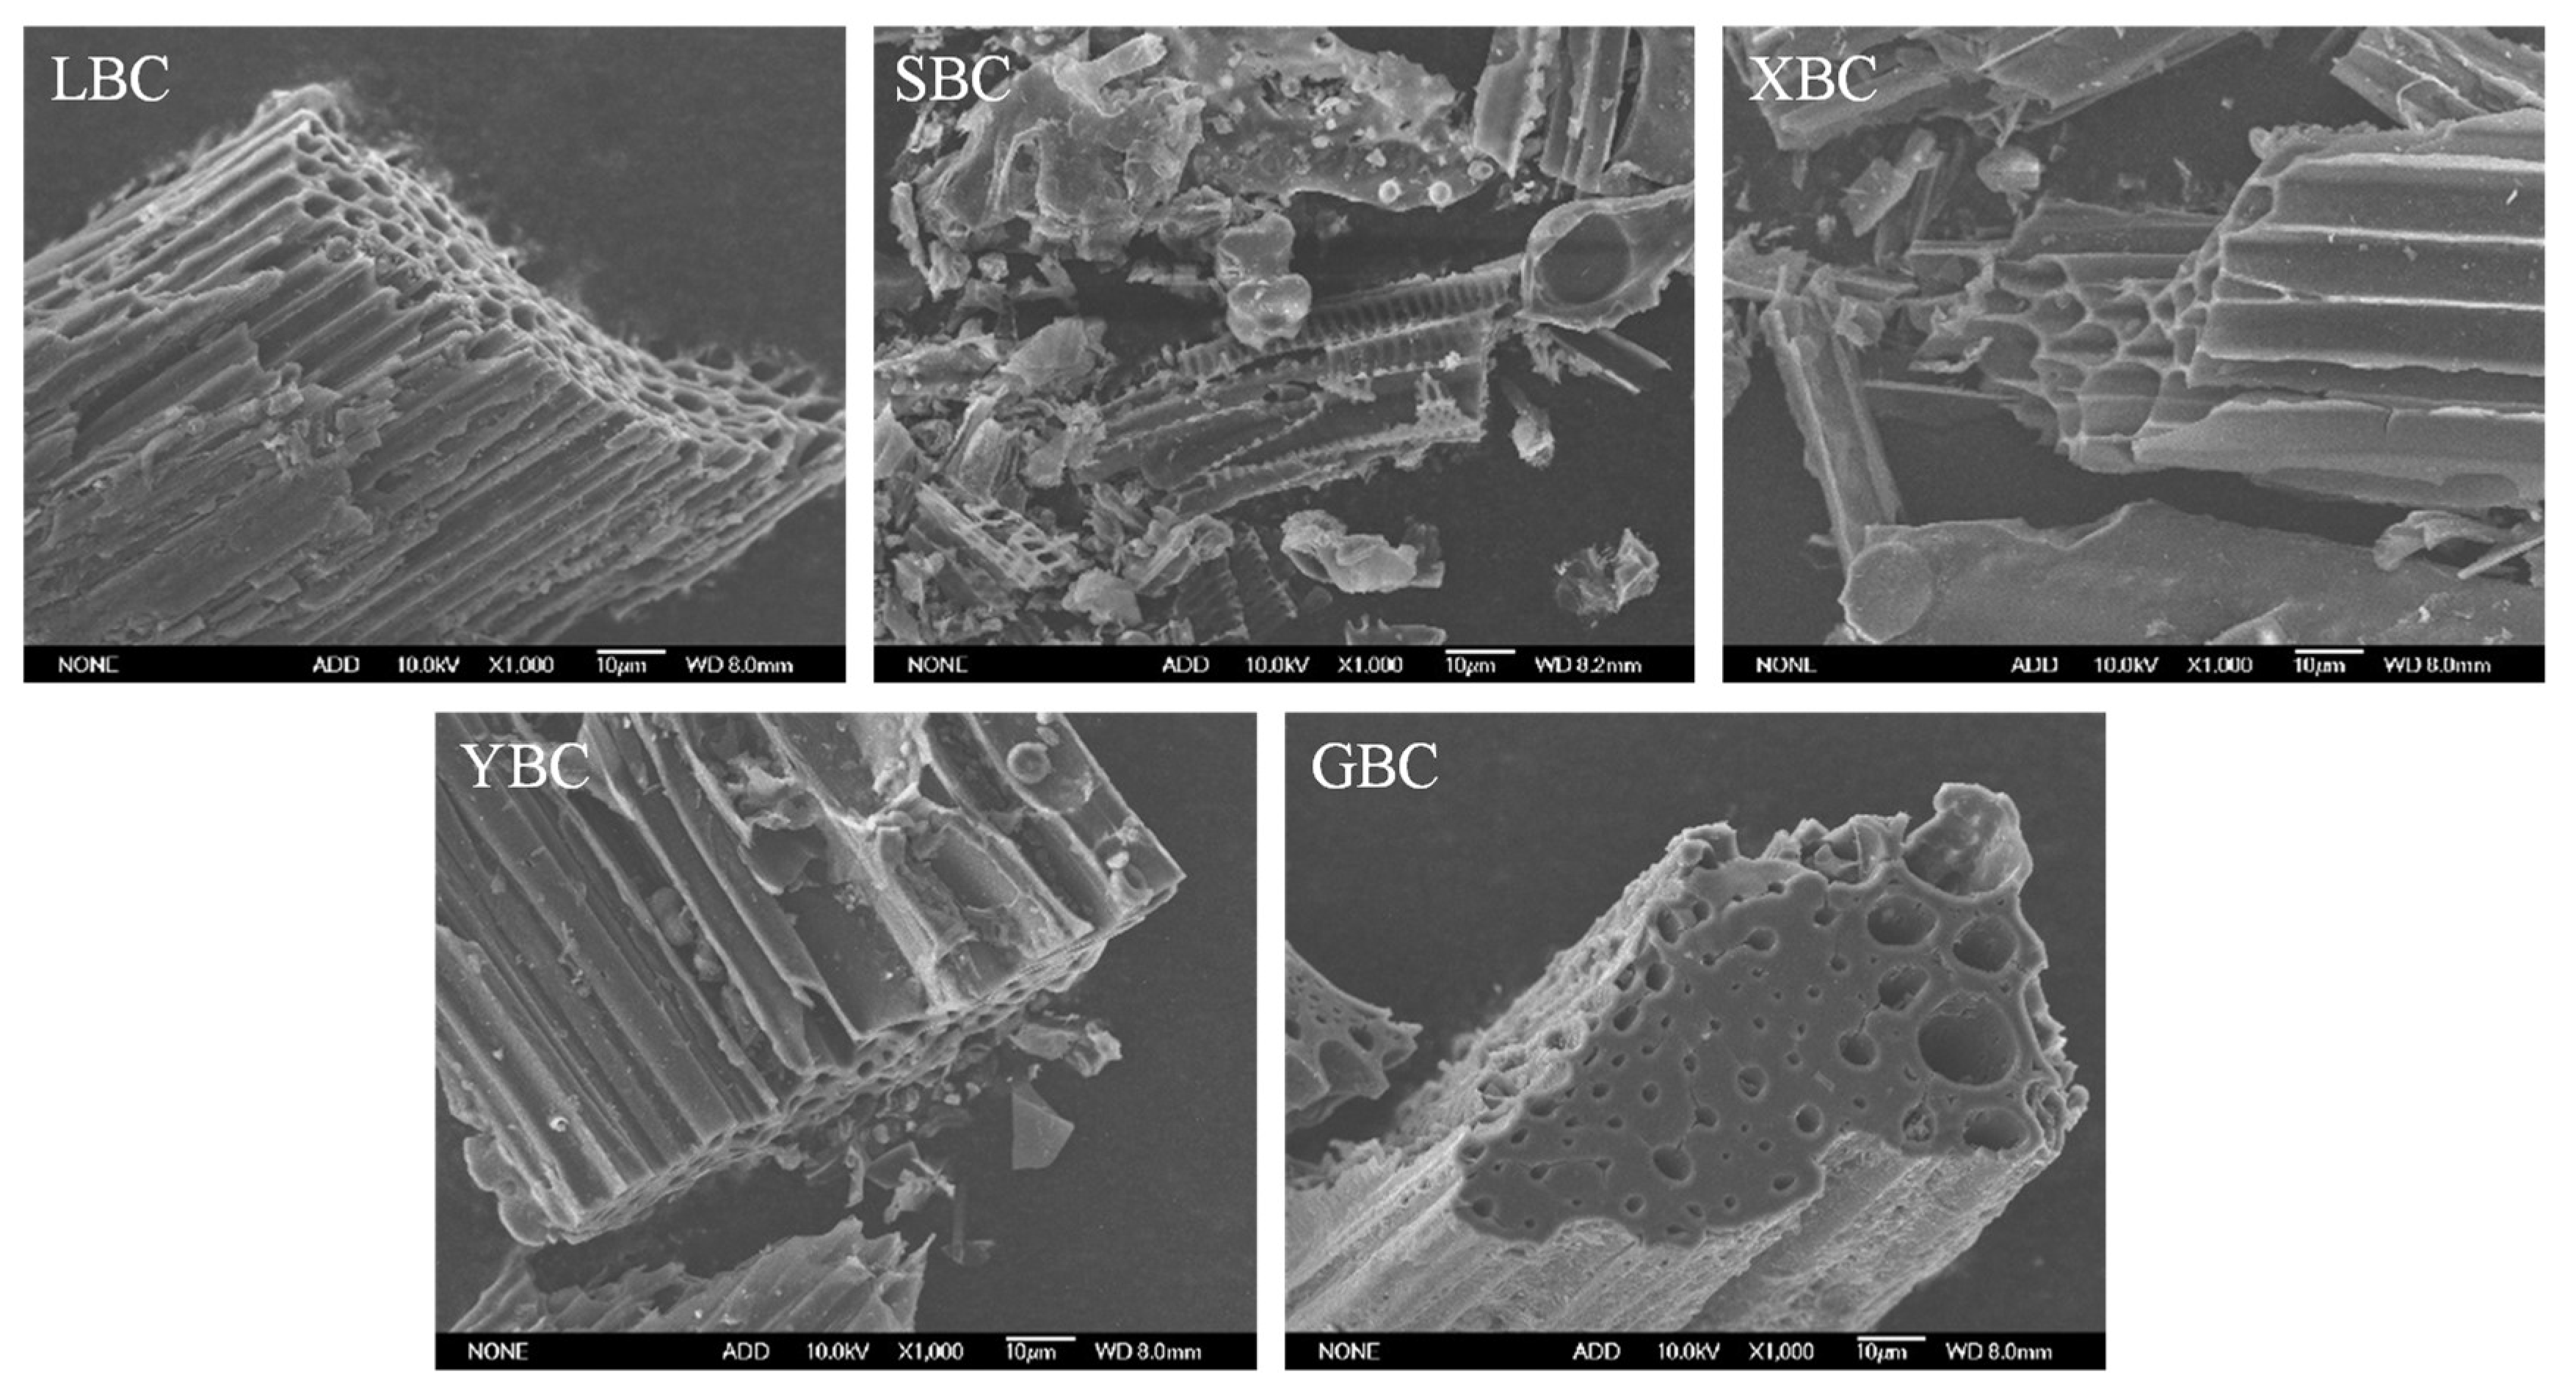
The SEM images of biochar from different plant sources are shown in
Figure 1 (magnification: 1000x). Due to the different types of biomasses, there are some differences in the pore structure and pore size of biochar. XBC had a larger pore size and a loosely arranged pore structure, and the basic structure was not significantly different. The structure of SBC was similar to that of XBC, but there was a parallel network structure on the pore wall of SBC, while the surface of the pore wall of XBC was smooth and flat, and there was no similar structure. Unlike the honeycomb pore arrangement of XBC, LBC, SBC and YBC, GBC had a large distance between the pore walls, different pore sizes and irregular arrangement.
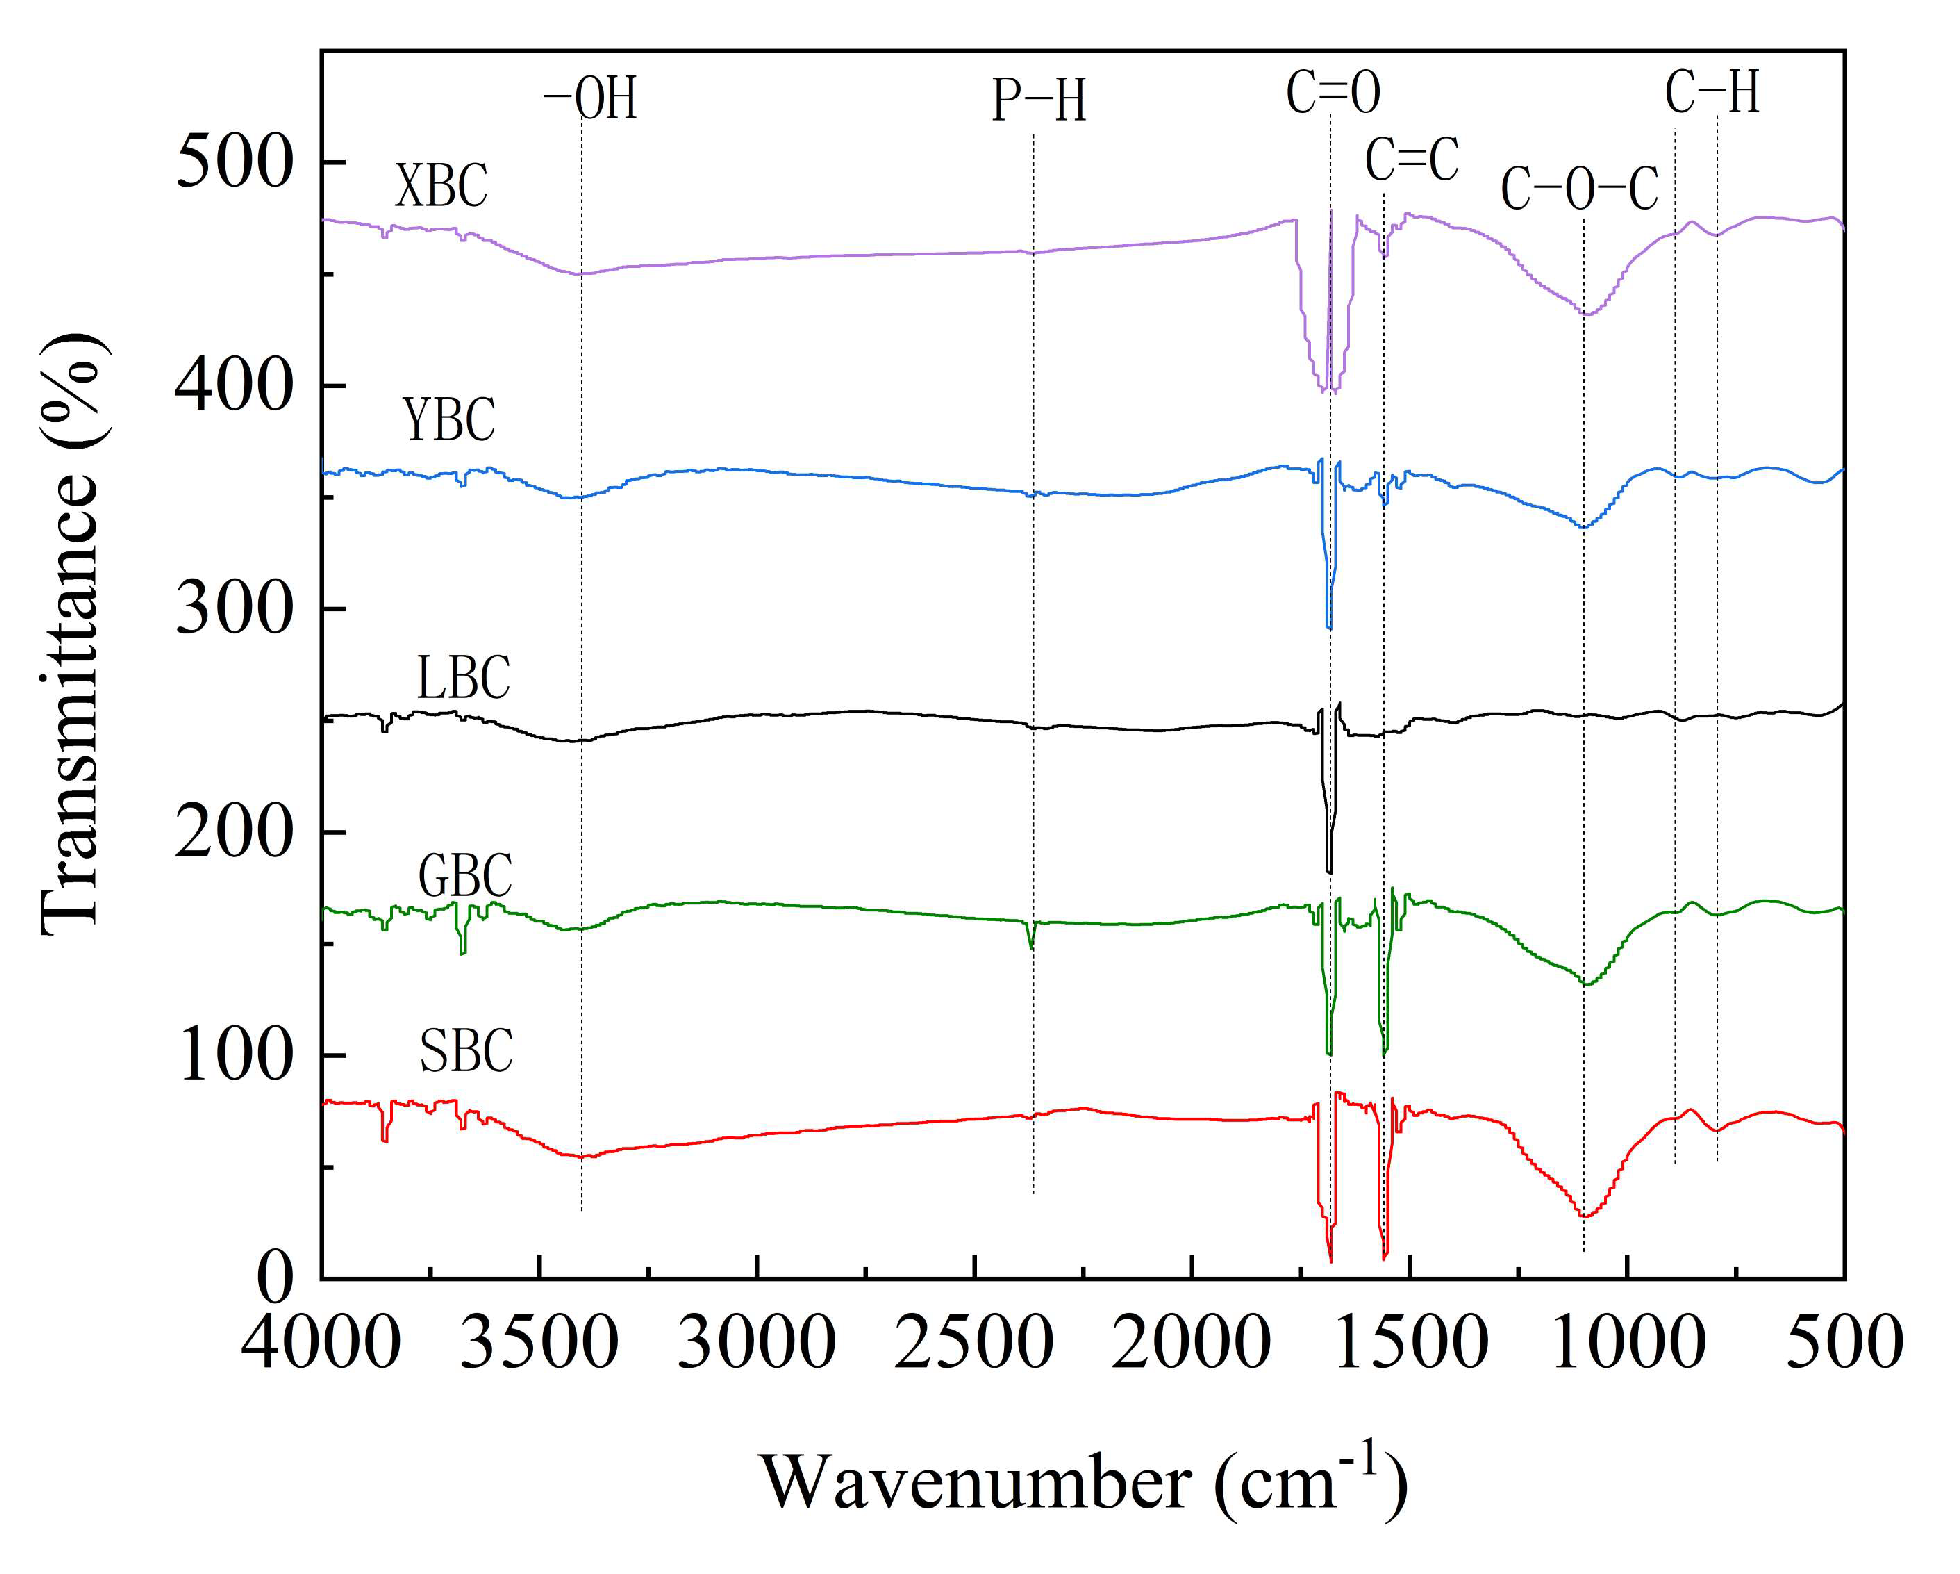
The FTIR spectra of five biochars are similar to some extent (
Figure 2). The strong and broad absorption peak at 3420 cm
-1 and the weak absorption peak at 1400cm
-1 are due to the stretching and bending vibrations of hydroxyl (-OH) [
5]. It is generally believed that biochar contains lignocellulosic components, and the weak peak at 2360 cm
-1 is a vibrational absorption peak of P-H, demonstrating that the biomass surface contains a small amount of phosphorus. The sharp peak at 1685 cm
-1 is produced by the stretching vibration of C=O in carboxylic acids or ketones, which may come from carboxylic acid esters or ketones in the biomass [
30]. All biochars produced absorption peaks of benzene ring C=C near 1560 cm
-1, indicating that the benzene ring in the other four biochars underwent different degrees of rearrangement and condensation reaction or breakage [
31]. Bending vibrational peaks of the aromatic ring (C-H) were found near 870 cm
-1 and 795 cm
-1 [
32], and LBC showed several vibrational peaks in this region. The above two absorption peaks indicate that biochar formed stable aromatic structure during the high temperature pyrolysis. Except for LBC, all the other four biochars produced obvious C-O-C vibrational absorption peaks at 1098 cm
-1, while C-O-C was generally present in the main chain of cellulose and hemicellulose, indicating that LBC lost more cellulose and hemicellulose during the carbonization process.
The XRD patterns of the five biochars (
Figure 3) show the formation of broad diffraction peaks with amorphous structures at 24° (2θ) and 43° (2θ), corresponding to the (002) and (101) peaks for the carbon fibres, respectively, are considered to reflect the degree of graphitisation of the material. SBC, XBC, YBC and GBC have sharp diffraction peaks near 22° (2θ) or 27° (2θ), which belong to the SiO
2 amorphous structure [
33]. However, no such diffraction peaks were found in the XRD patterns of LBC, which may be due to the fact that the minerals in the ash of reed straw are mainly amorphous [
34]. Diffraction peaks belonging to KCl crystals appear at 28° (2θ) in GBC and YBC, which may be due to the decomposition of some unstable tissues in the biomass during high-temperature pyrolysis, resulting in the enrichment of the K element on the surface of the biochar.
3.2. Adsorption Studies
3.2.1. Effect of the Initial pH
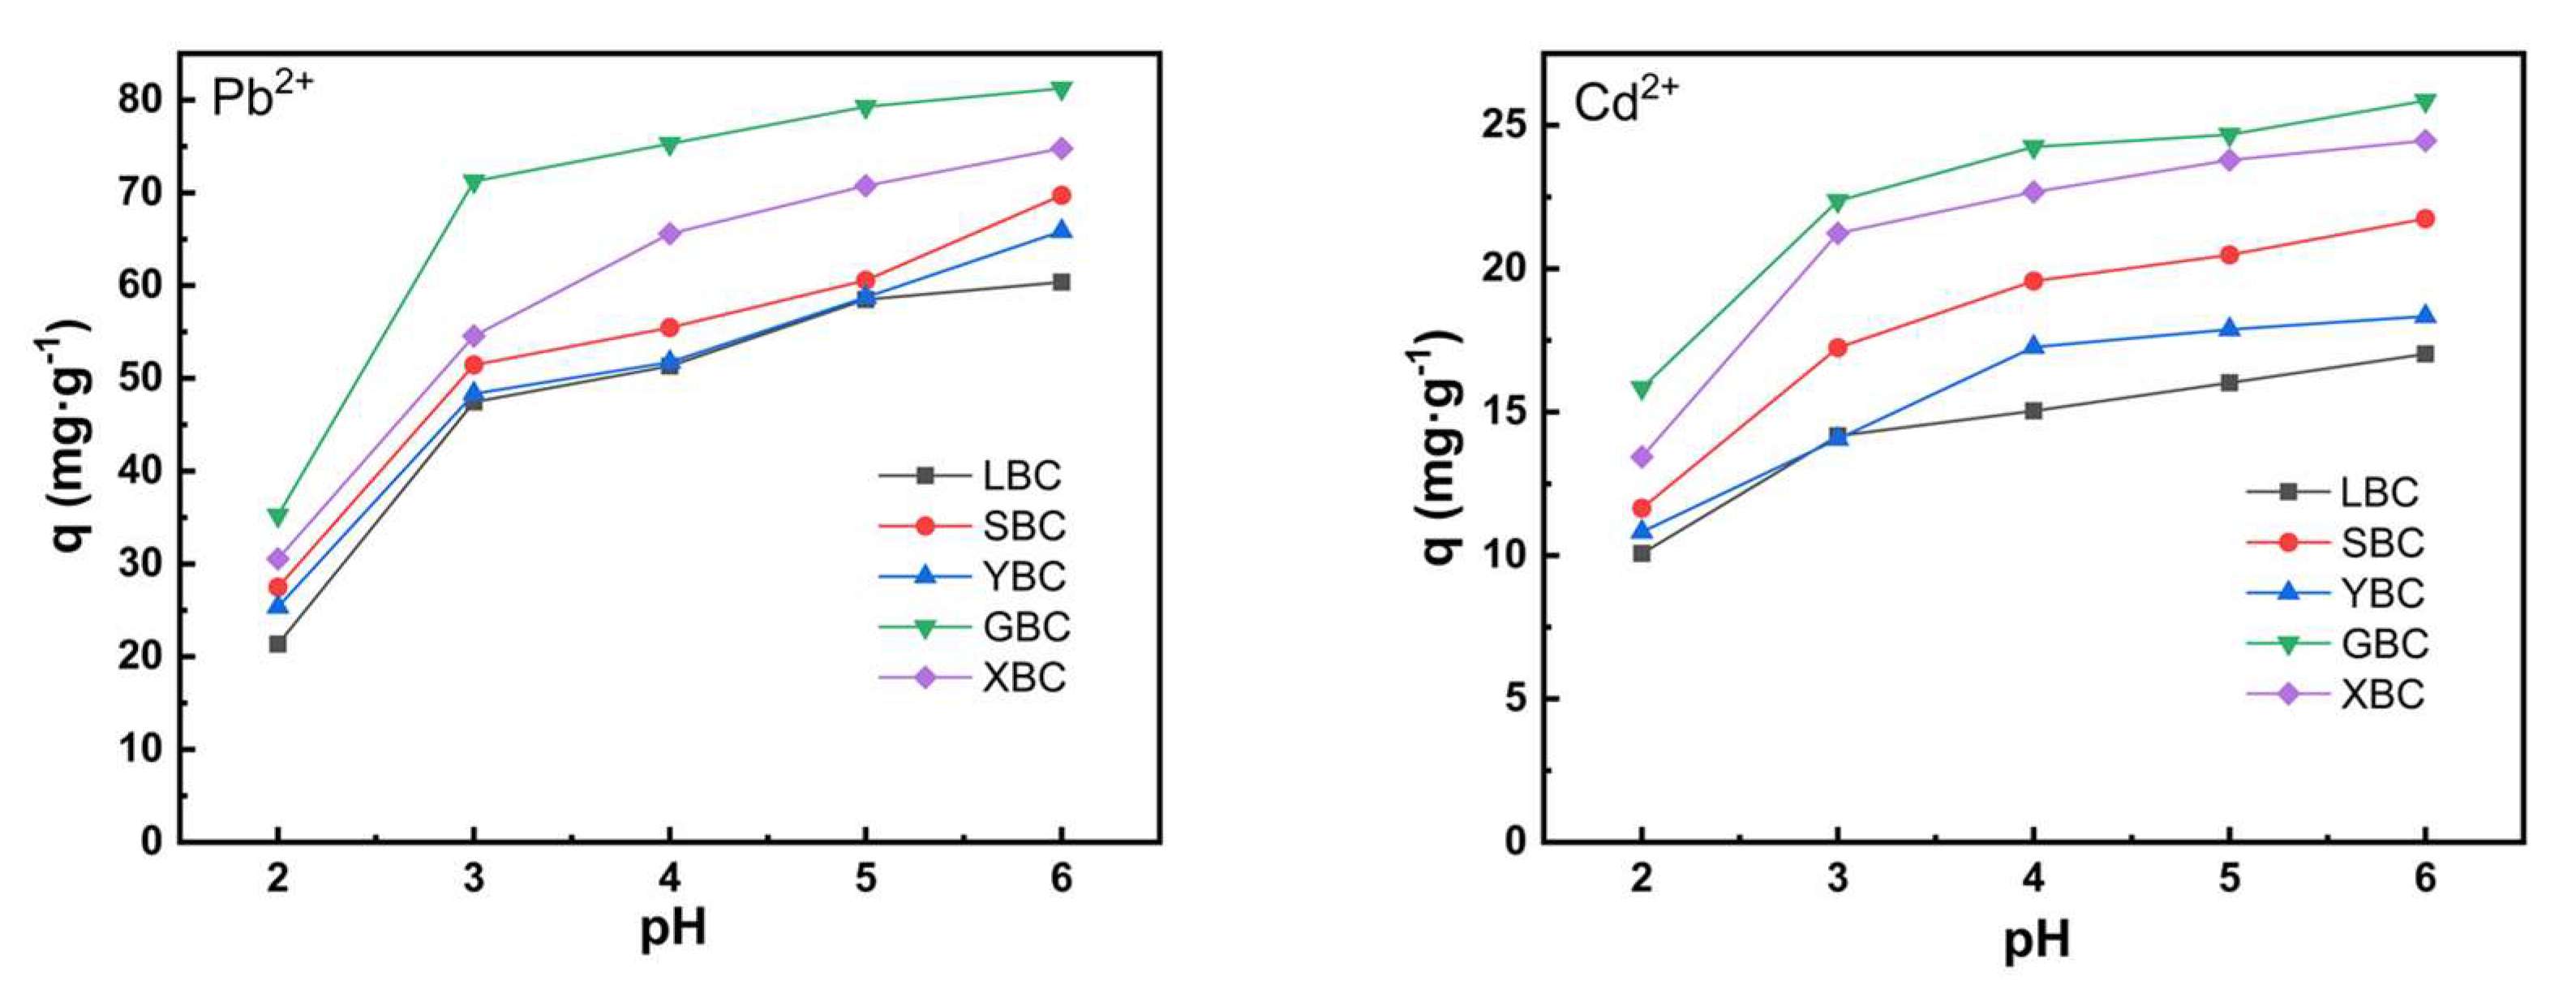
It is generally accepted that pH is one of the most important parameters as it can affect the surface charge of adsorbents and metal speciation [
35].
Figure 4 also shows that the removal of Pb
2+ and Cd
2+ increased as the solution pH increased from 2-6. The unit adsorption of Pb
2+ and Cd
2+ by the five biochars increased sharply at pH<3, with the increase of pH, the unit adsorption of Pb
2+ and Cd
2+ by the five biochars tended to increase slowly with the increase of pH of the solution, and the unit adsorption amount basically stabilized at pH>4.
3.2.2. Effect of Initial Dosage
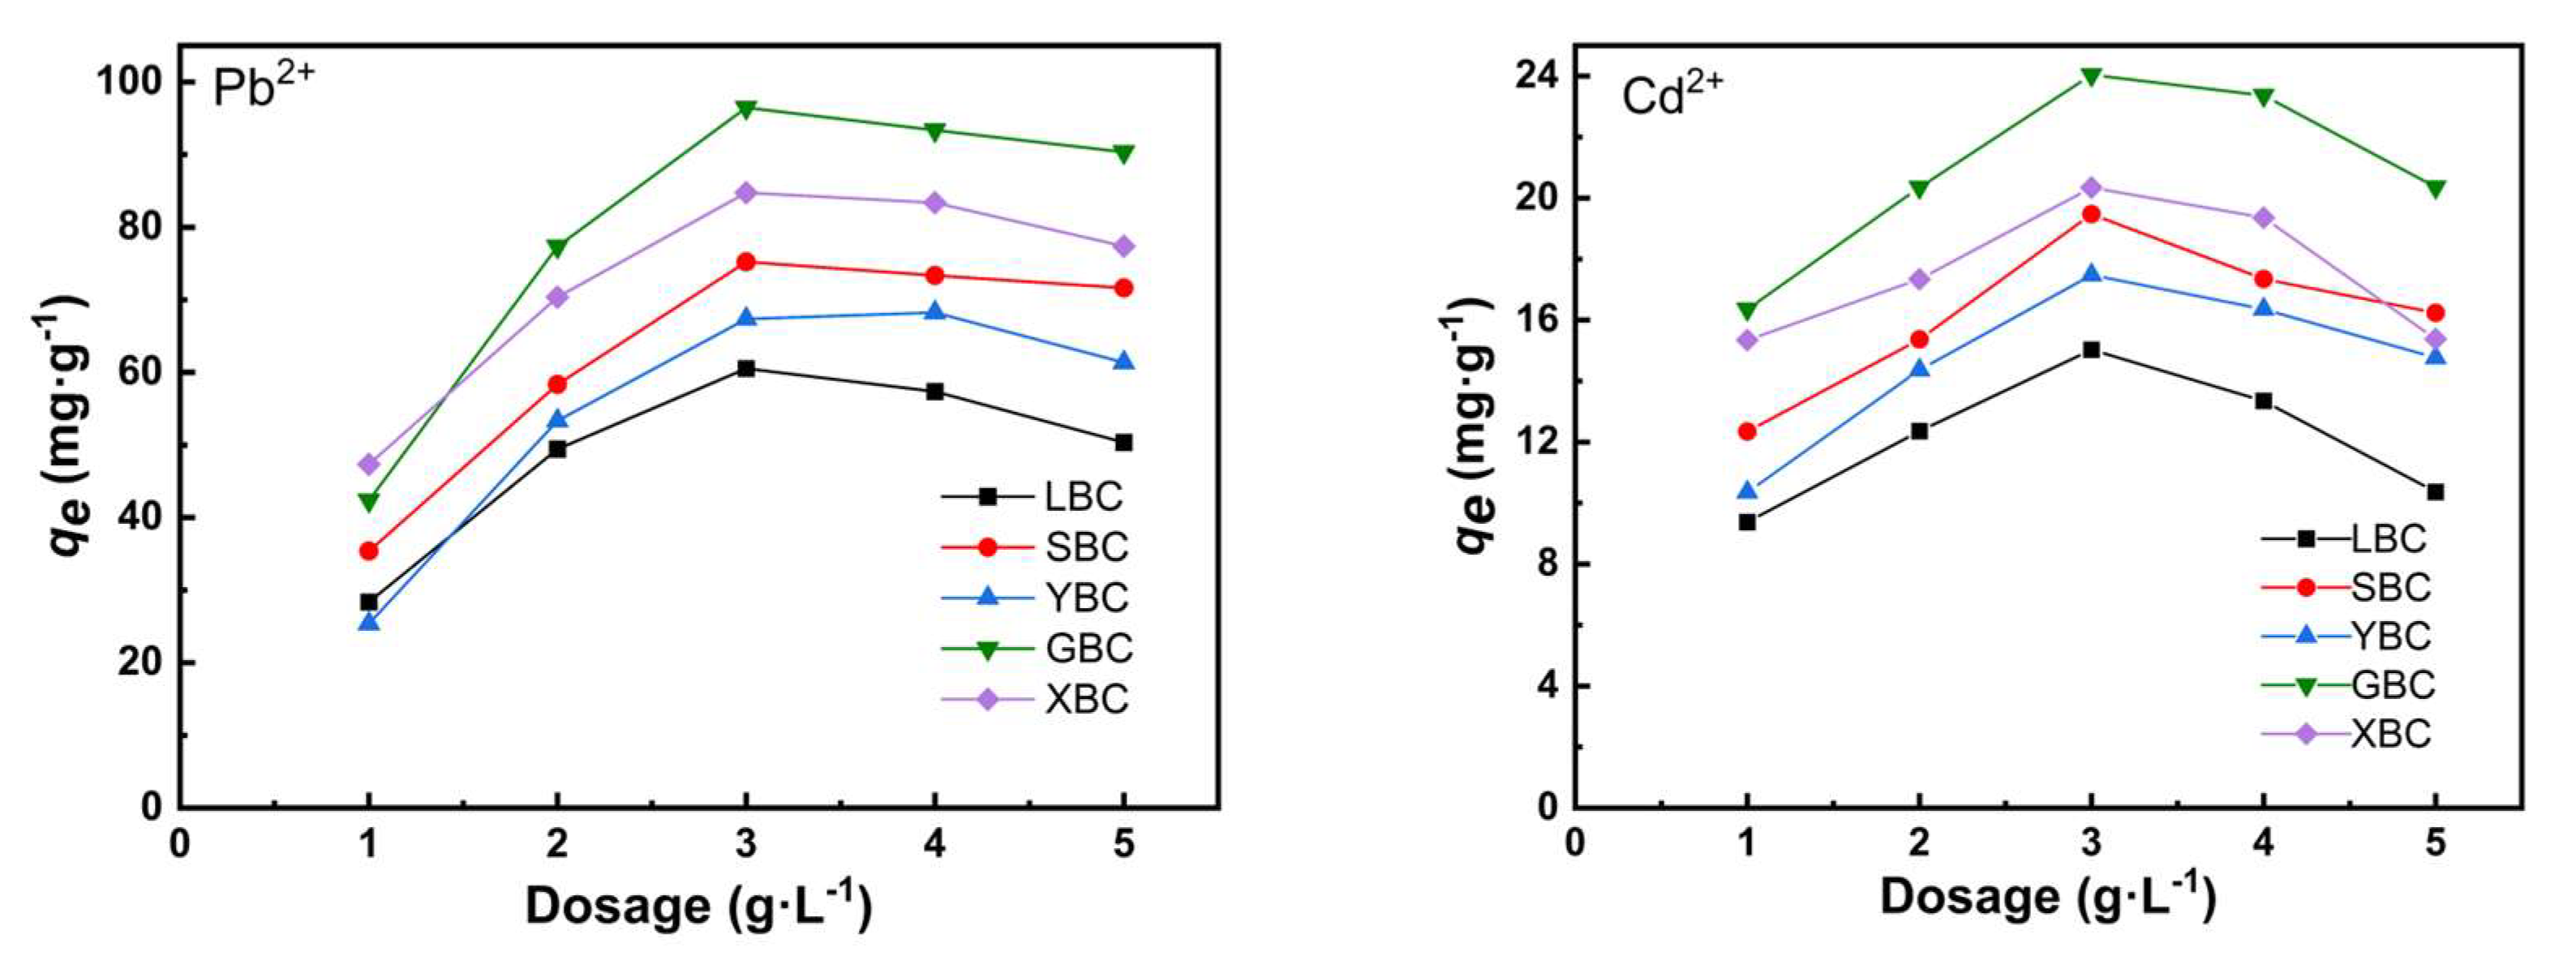
Biochar dosage is one of the significant factors that influences adsorption capacity. According to the data in
Figure 5, the unit adsorption capacity of Pb
2+ and Cd
2+ increased sharply when the dose of the five biochars was less than 3 g·L
-1. Then, the dose of biochar was increased from 3-5 g·L
-1 and the unit adsorption capacity of Pb
2+ decreased. The best adsorption effect was achieved at an initial dosage rate of 3 g·L
-1. Under the influence of the initial dosage, the maximum adsorption of the five biochar species was 96.468 mg·g
-1 for Pb
2+ and 24.036 mg·g
-1 for Cd
2+.
3.2.3. Adsorption Kinetics
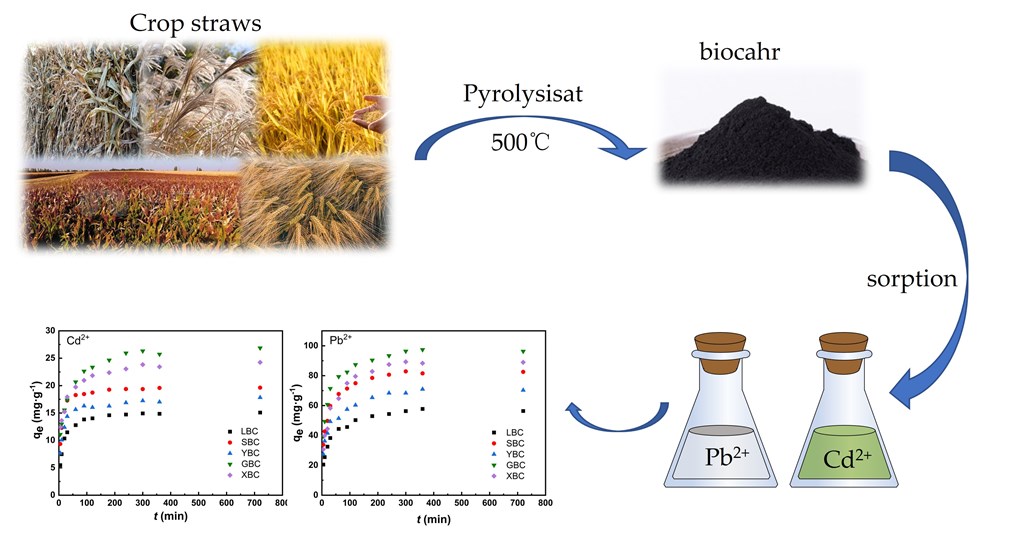
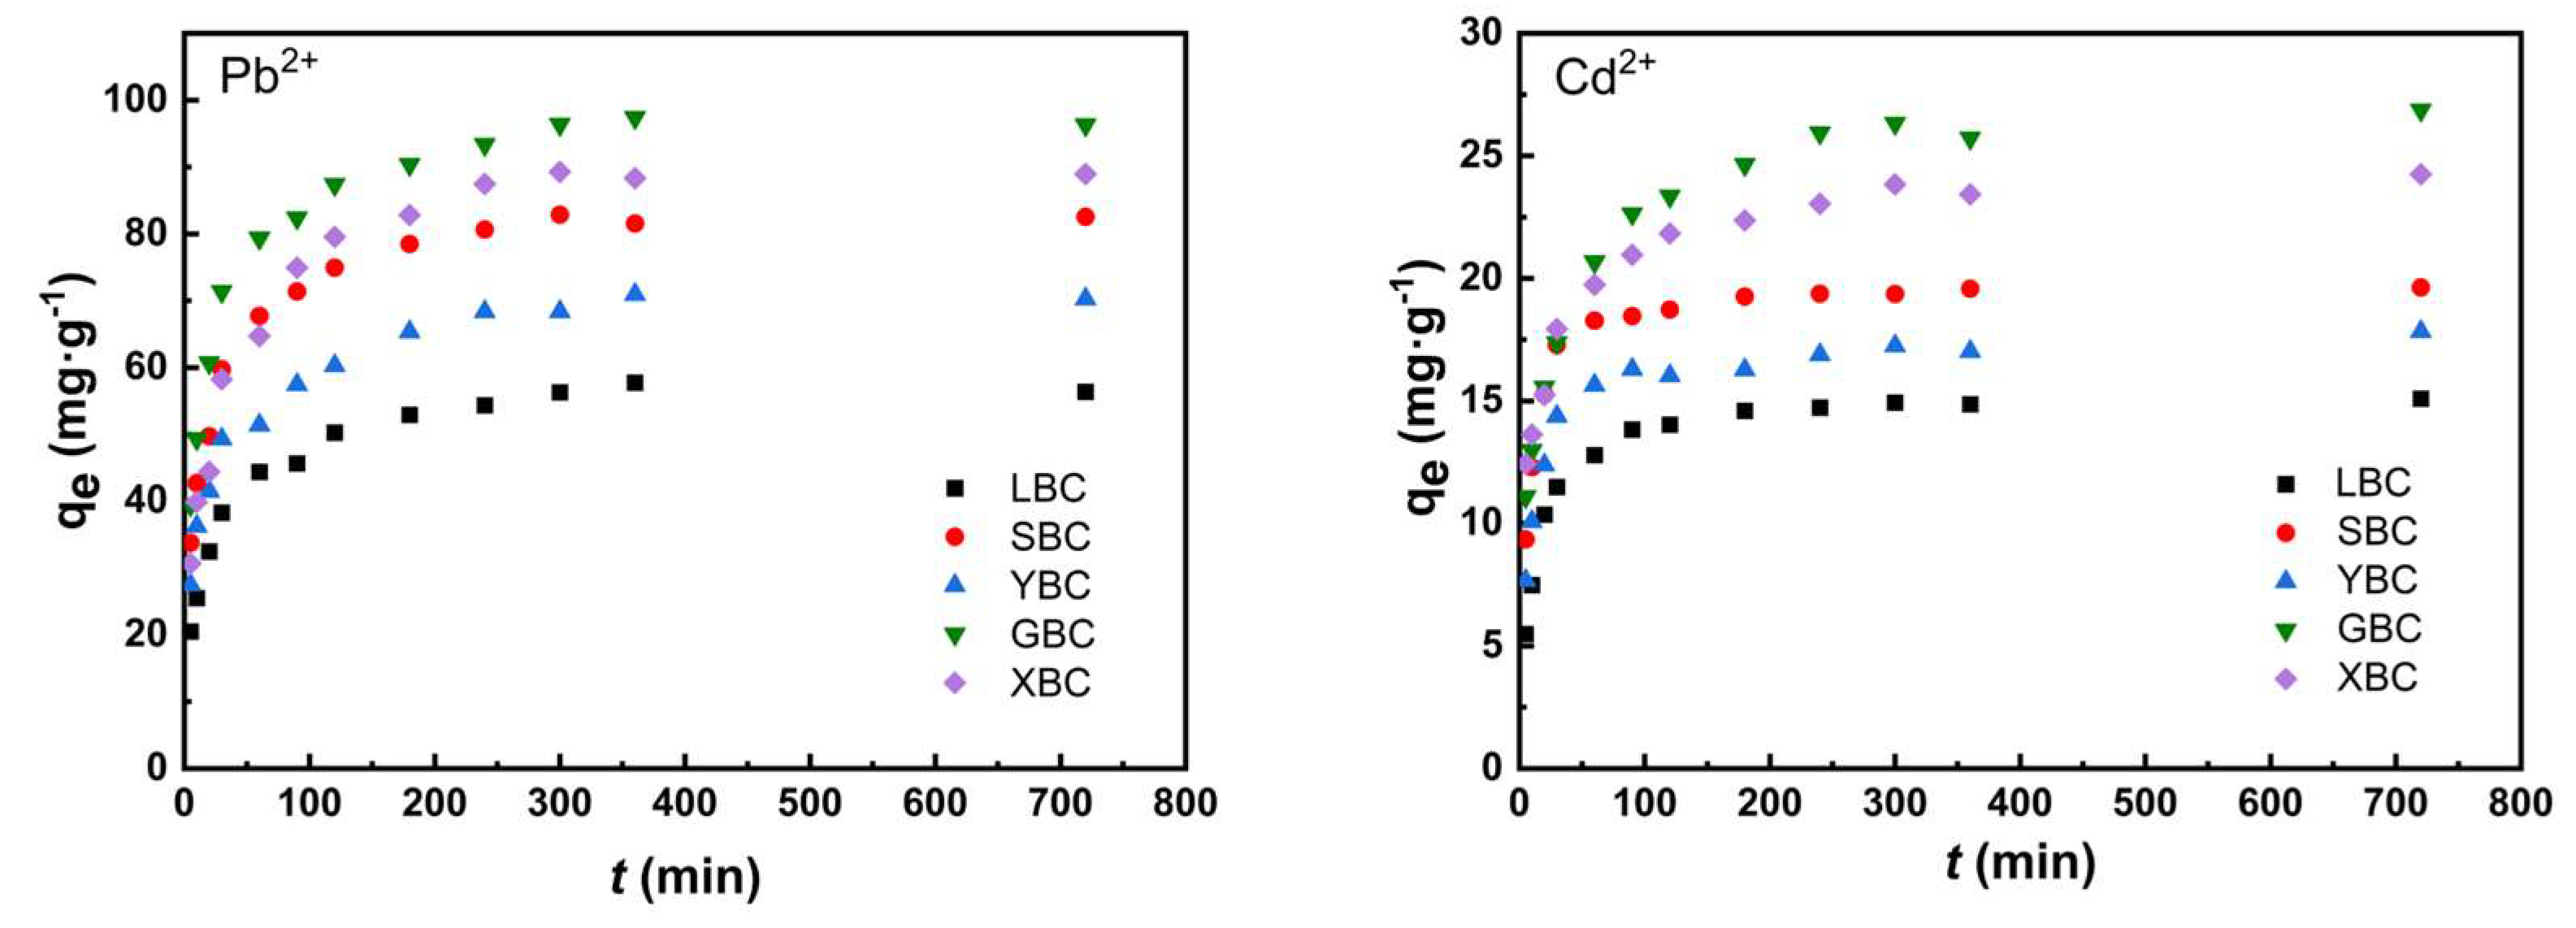
The kinetics data for Pb
2+ and Cd
2+ adsorption by the five biochars were fitted to pseudo-first-order and pseudo-second-order models (
Figure 6). The parameters fitted by the kinetic model were given in
Table 2. In the initial phase, the adsorption of heavy metal ions by biochar was faster because the adsorption took place mainly on the surface of the biochar. Pb
2+ and Cd
2+ gradually diffused into the carbon pores and further reacted with the active sites on the inner surface, this adsorption process was relatively slow [
36]. The best fit of the second-order kinetic model, with R
2 = 0.99, could well reflect that the adsorption process of Pb
2+ and Cd
2+ on biochar was mainly controlled by chemisorption. The reaction rate constants (K2 > 1) indicating that the adsorption process was a fast reaction. The adsorption of metals by the five biochars followed the trend: Pb
2+ > Cd
2+.
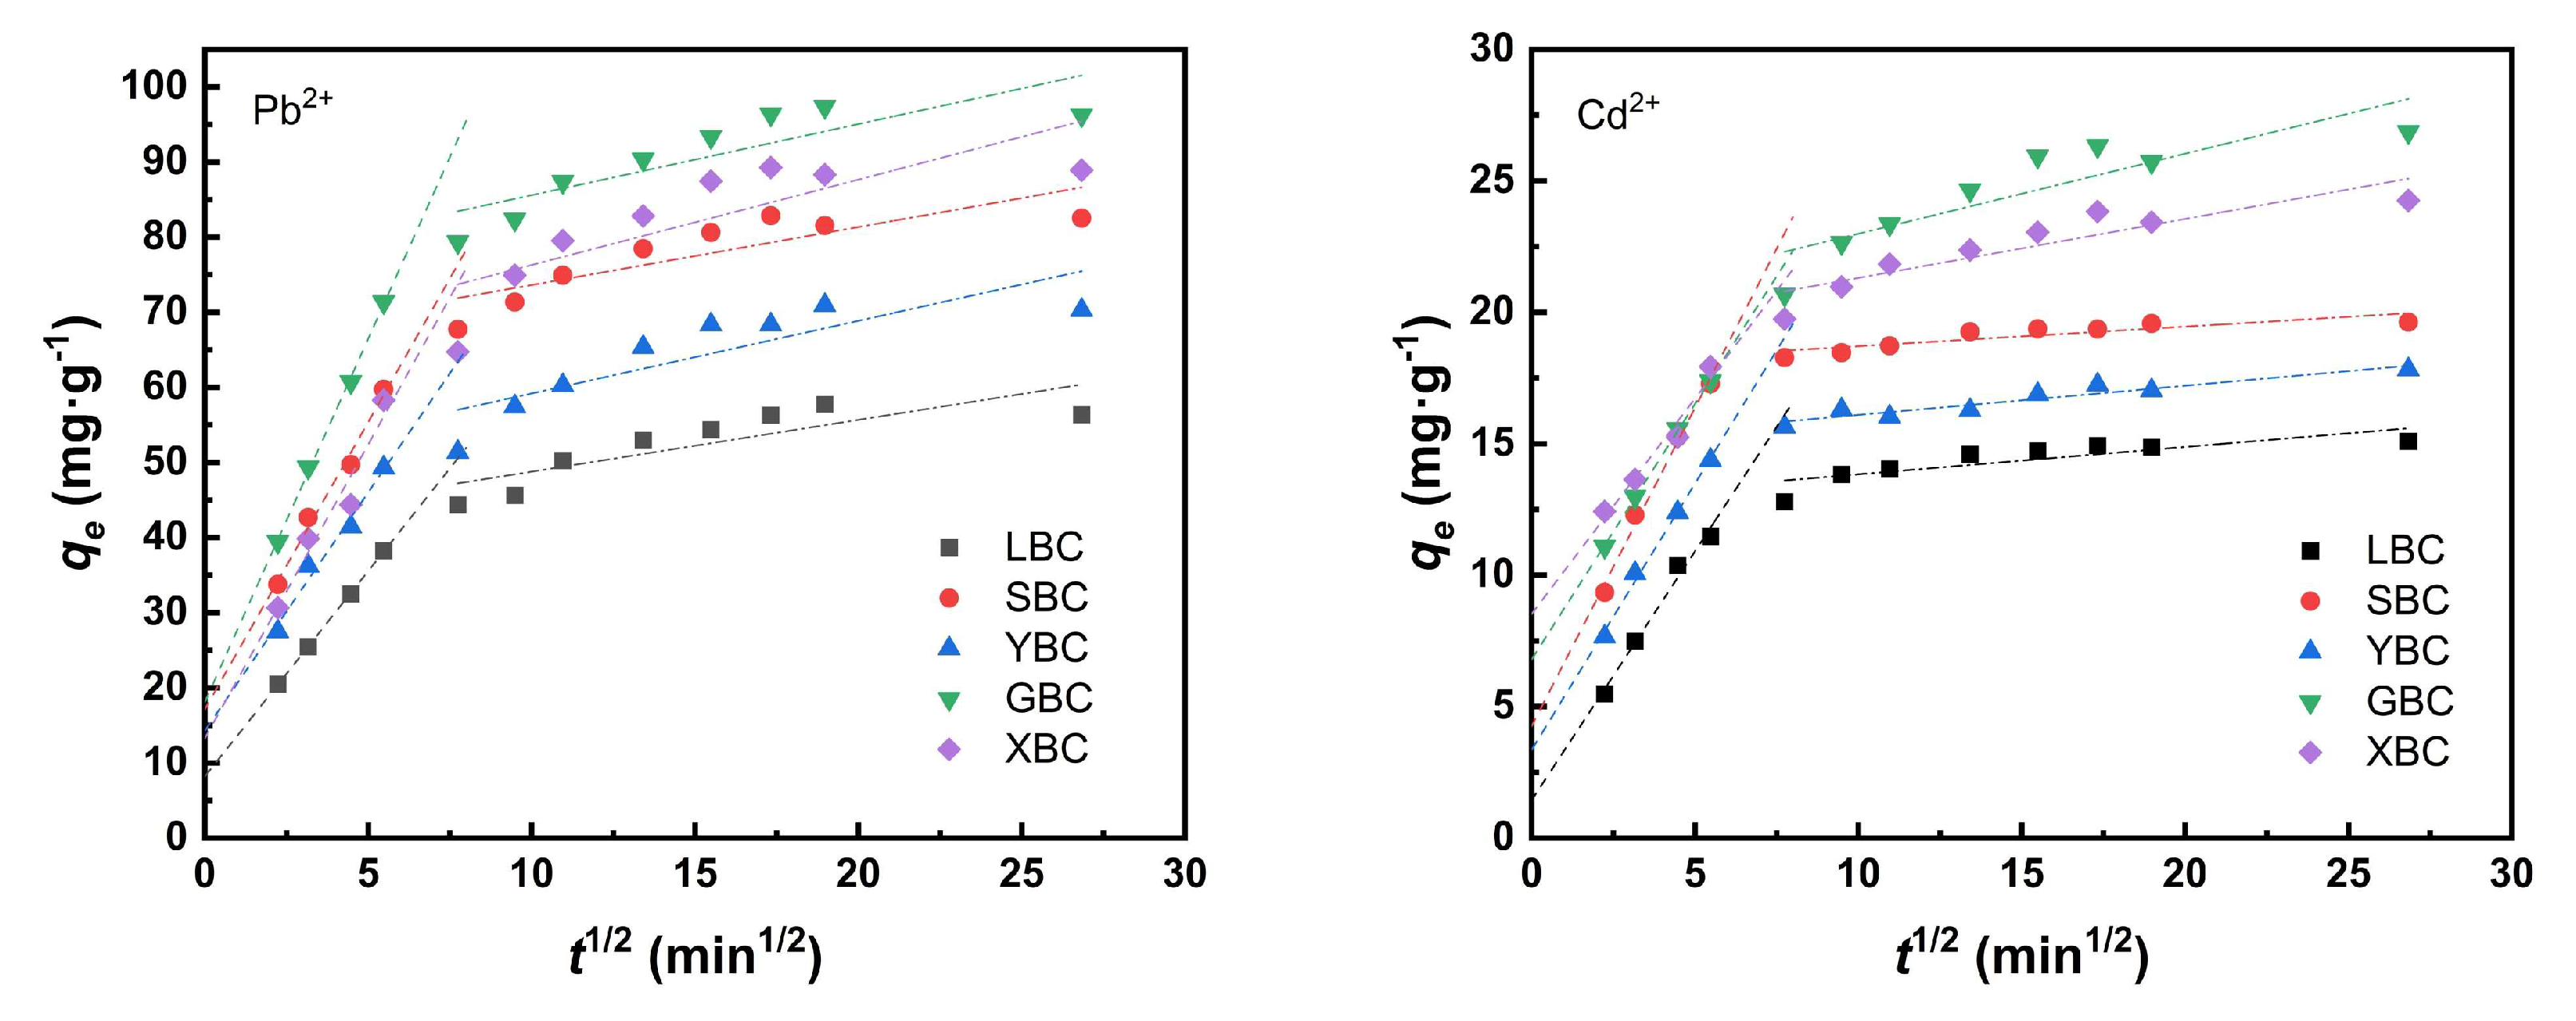
Table 3 and
Figure 7 show the intraparticle diffusion results of Pb
2+ and Cd
2+ on the adsorbents. The whole adsorption process was mainly divided into two stages: the first stage was the process of diffusion of heavy metals to the surface of biochar, and the slope of the fitted line was larger in this stage, indicating that the boundary diffusion process was faster. In the second stage, the slope of the fitted line decreased significantly, indicating that the control step of the adsorption rate of heavy metals by biochar was in this stage. The line did not passed through the origin of the coordinates, indicating that diffusion within the particle was not the only controlling step in the adsorption process [
37]. The intercept C
2 >> C
1 indicating that the effect of five biochars on Pb
2+ and Cd
2+ adsorption was greater in the second stage than in the first stage.
3.2.4. Isothermal Adsorption
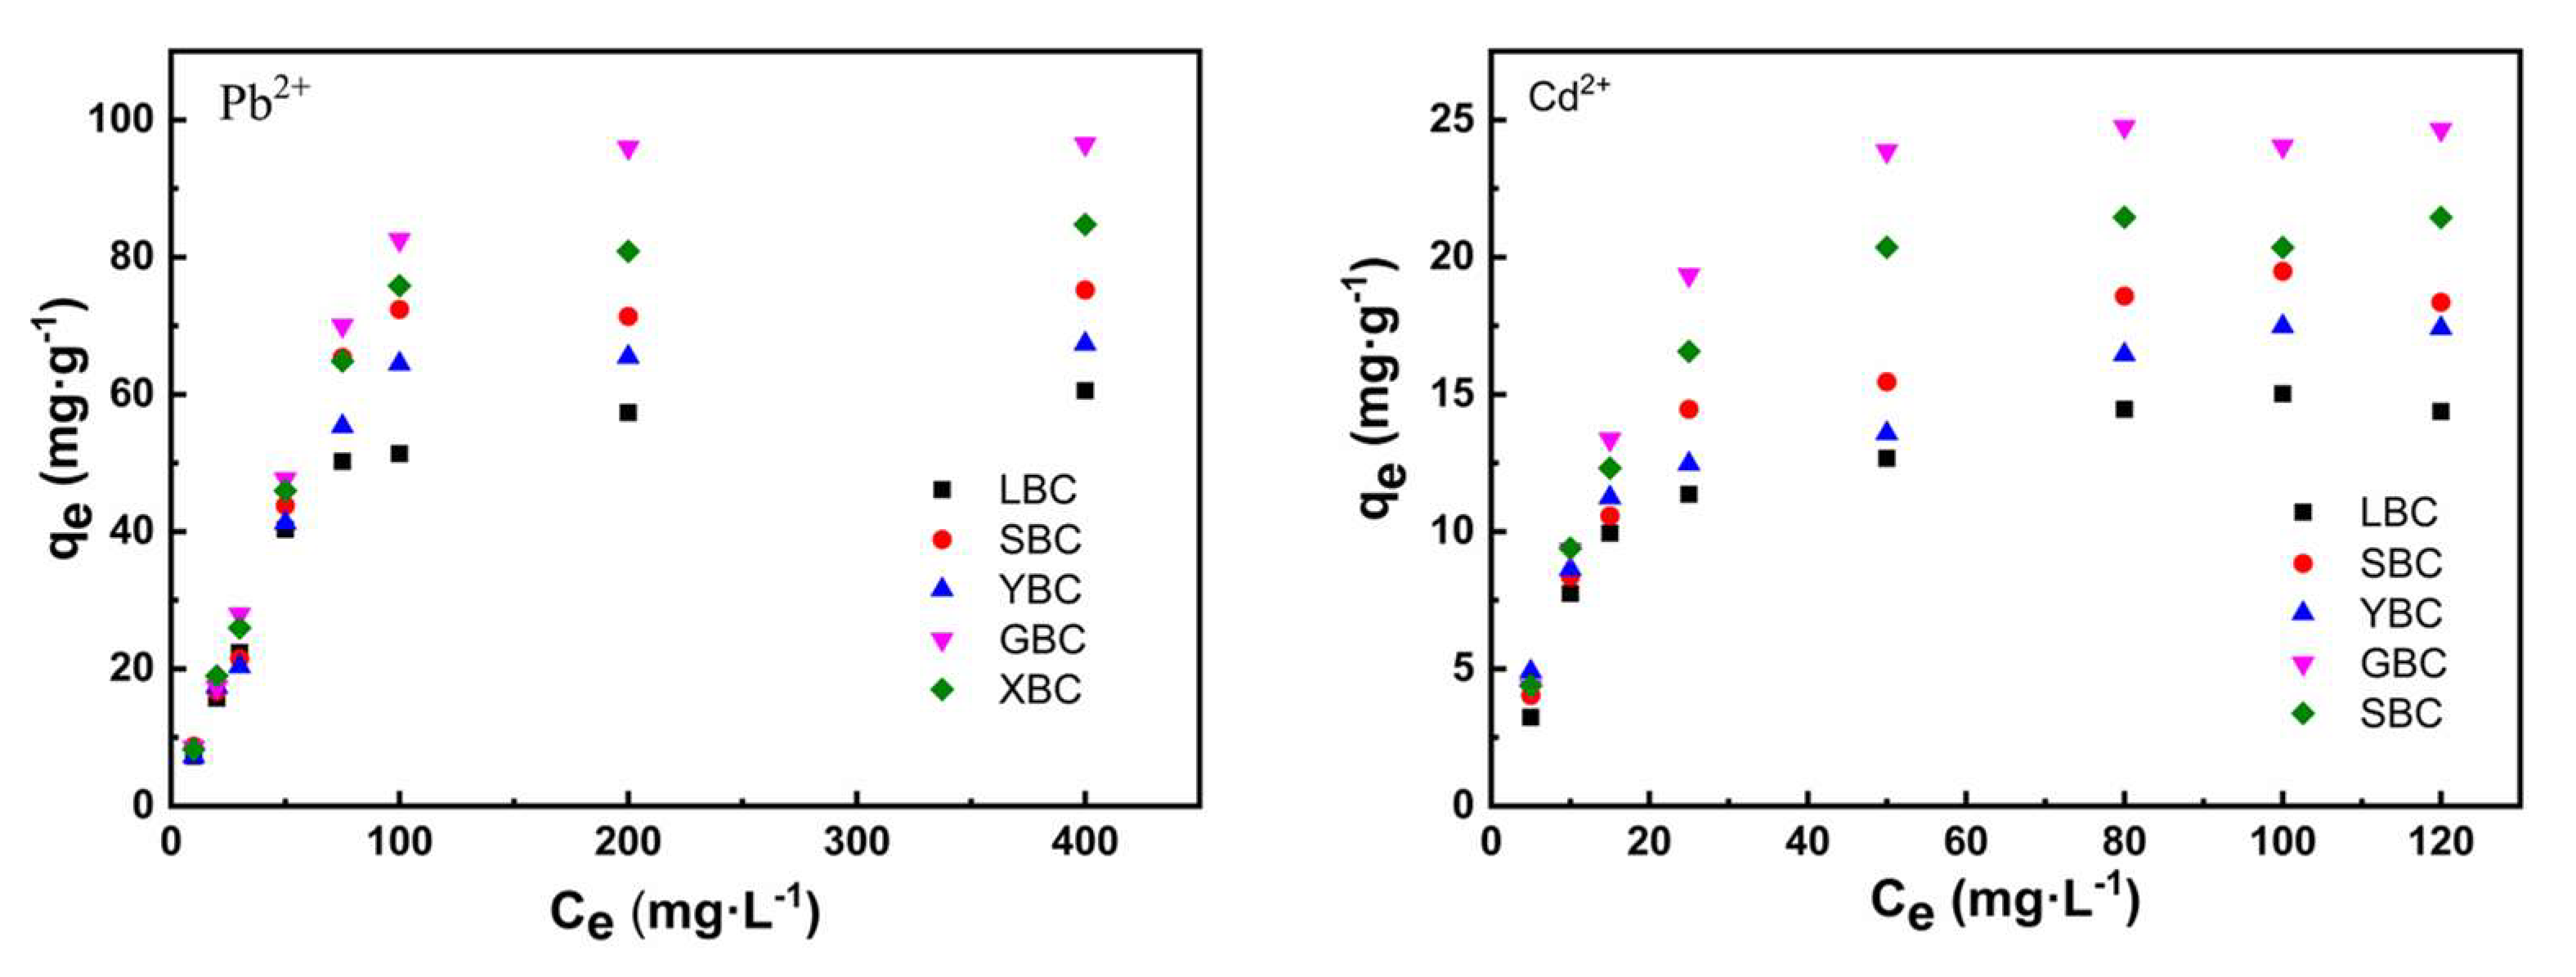
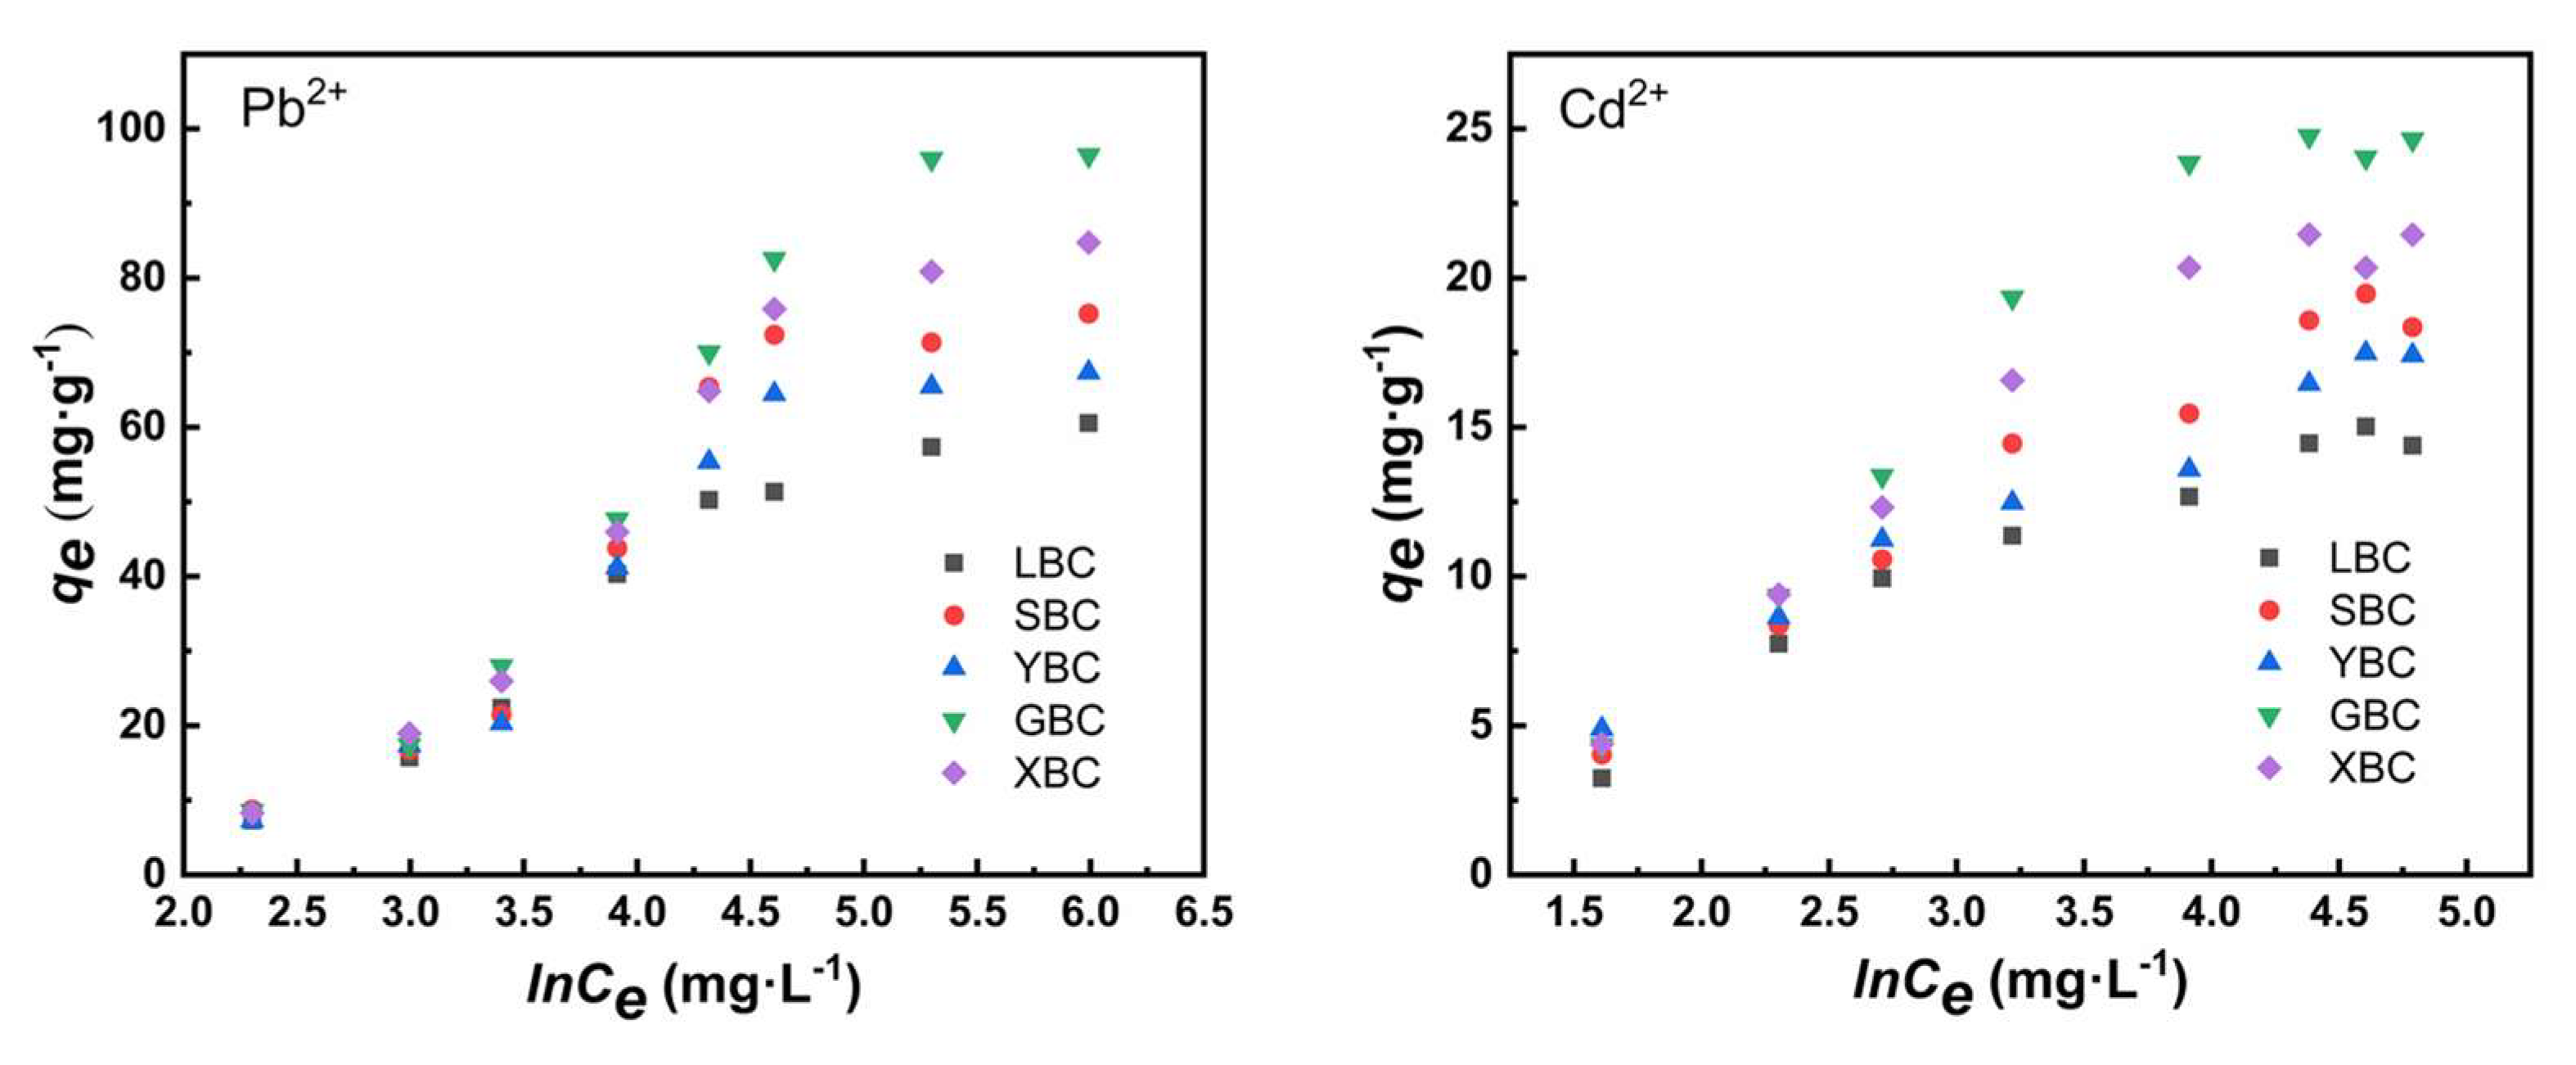
Table 4,
Table 5 and
Figure 8 show the adsorption isotherm results of the heavy metals on the adsorbents. At low initial concentrations, the adsorption capacity of biochar increased with the initial concentration of Pb
2+ and Cd
2+ and then gradually reached saturation. XBC and GBC have a higher adsorption capacity for Pb
2+ and Cd
2+ because they contain relatively high amounts of phosphorus and silicon and other inorganic mineral components that can form precipitates. Also, the higher the CEC, the more negative charges carried on the biochar surface and the stronger the electrostatic adsorption of cations. The Langmuir model fit was better due to its high correlation coefficient (R
2 = 0.879-0.941), the adsorption process is monolayer adsorption. When 1 < n < 10 in the Freundlich model, the adsorption was favored. The higher the K
L value, the higher the adsorption capacity, so the adsorption capacity for heavy metals followed this order: Pb
2+ > Cd
2+.
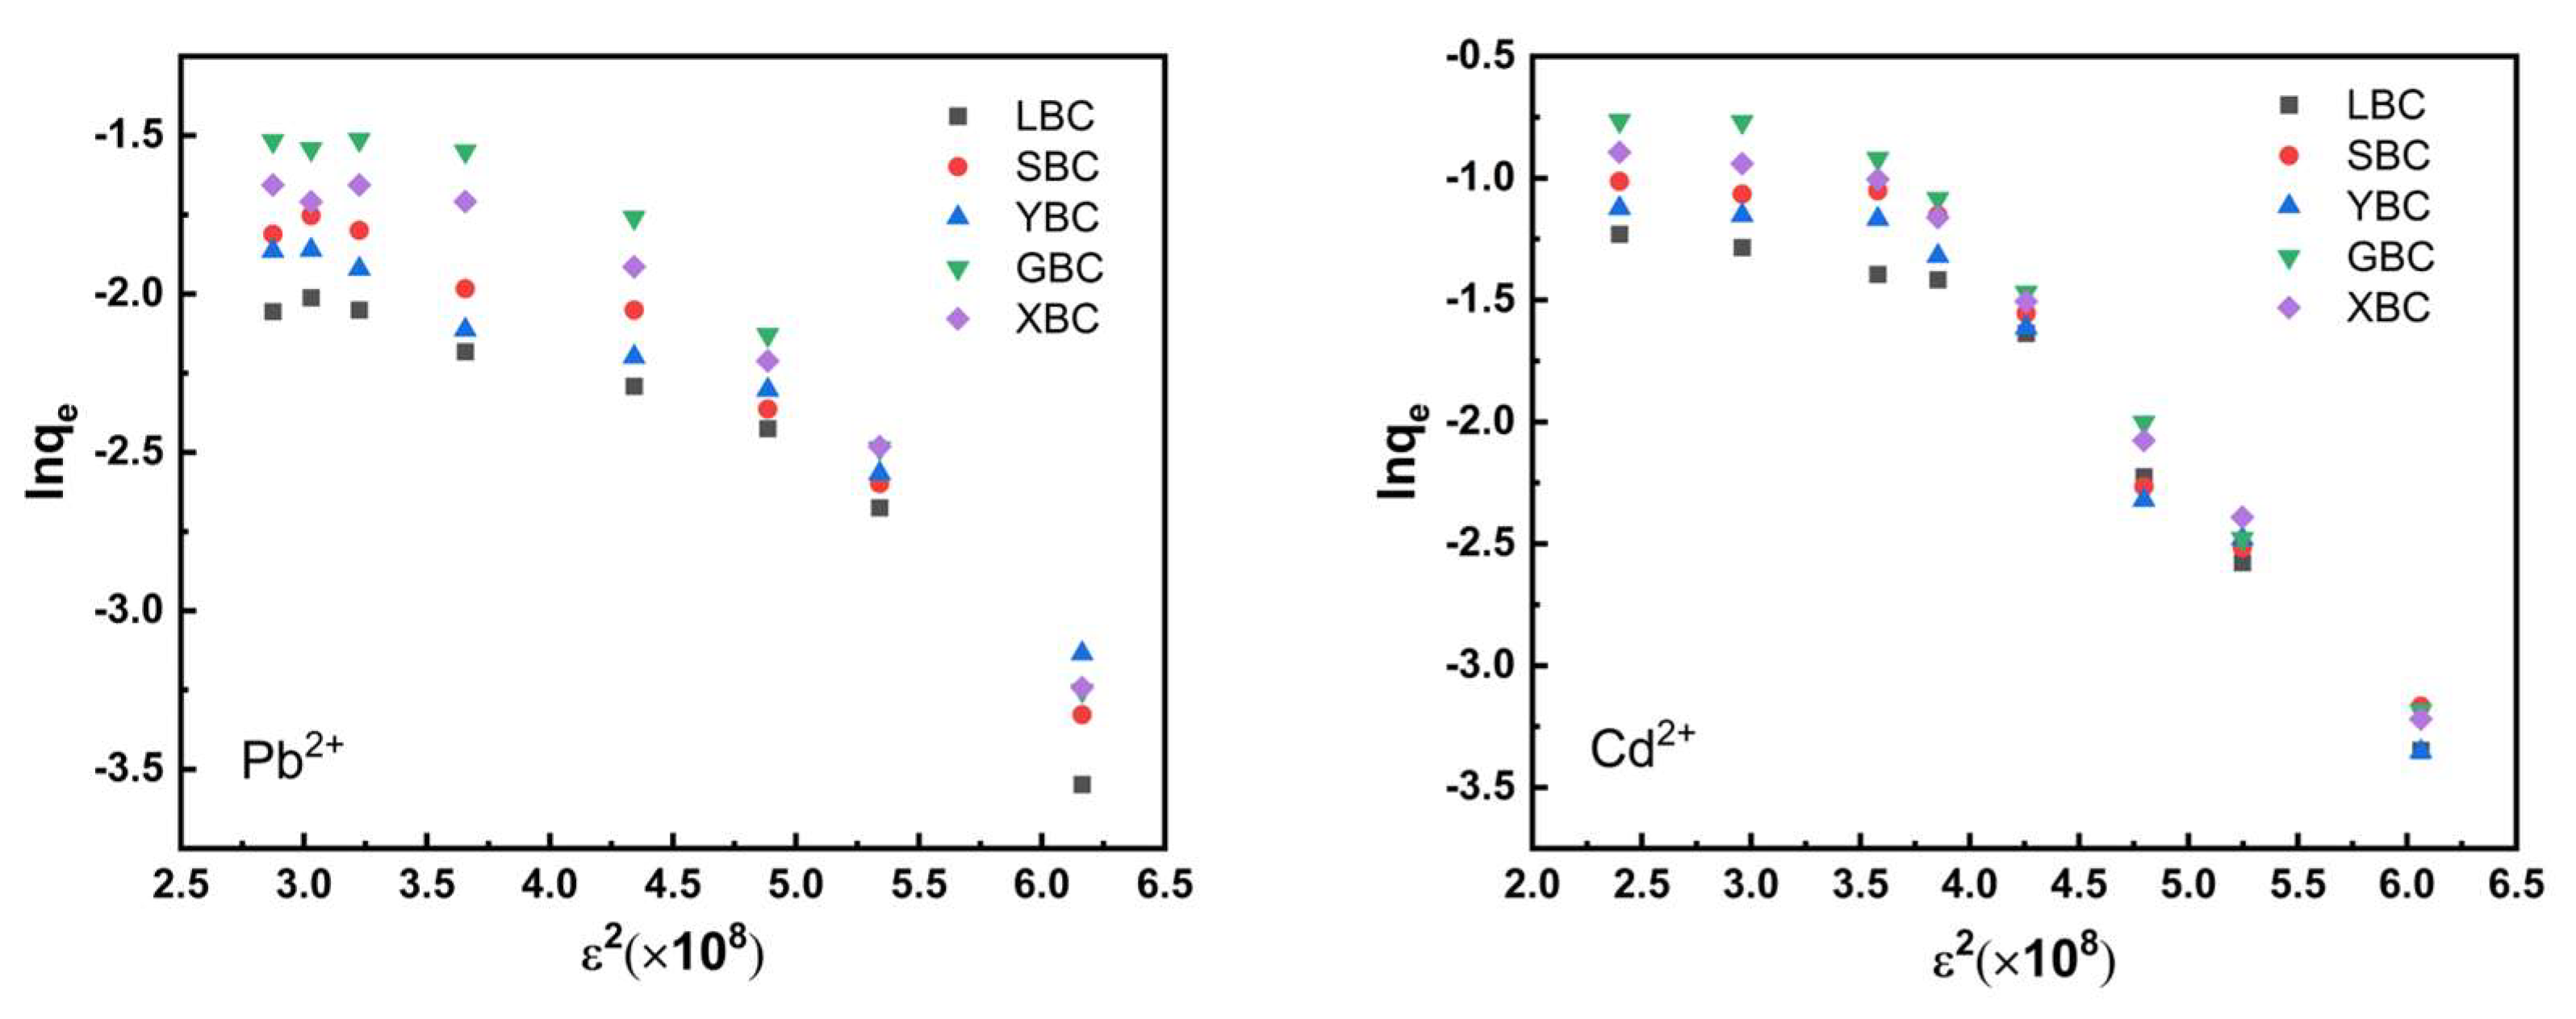
The adsorption of five biochars shows an increasing trend in the D-R model and the Temkim model (
Figure 9 and
Figure 10). In the D-R model, the process was physical adsorption when the average adsorption energy E < 8 KJ·mol
-1, chemical adsorption when 8 < E < 16 KJ·mol
-1 (
Table 6). From the fitted parameters of the D-R model, the E values of adsorption of Pb
2+ and Cd
2+ by five biochars were greater than 8, indicating that the adsorption behavior was mainly chemical adsorption and the driving force of the adsorption process was mainly chemical ion exchange adsorption. The fit of the four models was compared, and the Langmuir isothermal adsorption model was the best fit.
3.2.5. Thermodynamics of Adsorption
The adsorption capacity of Pb
2+ and Cd
2+ on biochar gradually increased with increasing temperature (
Table 7,
Table 8), indicating that the adsorption of Pb
2+ and Cd
2+ on biochar was an endothermic process. △H
0 was positive, indicating that the adsorption process of Pb
2+ and Cd
2+ was an endothermic reaction. When the temperature is increased from 298 K to 318 K, the Gibbs free energy △G
0 is negative, indicating that the adsorption of Pb
2+ and Cd
2+ by five biochars is a spontaneous process and was mainly physical adsorption [
38]. The entropy change △S
0 was positive, indicating that the degree of freedom at the solid-liquid interface increased during the adsorption process. The results of adsorption kinetics and adsorption isotherm indicated that the adsorption of Pb
2+ and Cd
2+ by biochar was mainly chemical adsorption, while the thermodynamic results showed that the adsorption process was mainly physical adsorption. Therefore, the adsorption process of Pb
2+ and Cd
2+ by biochar is both physical and chemical adsorption.
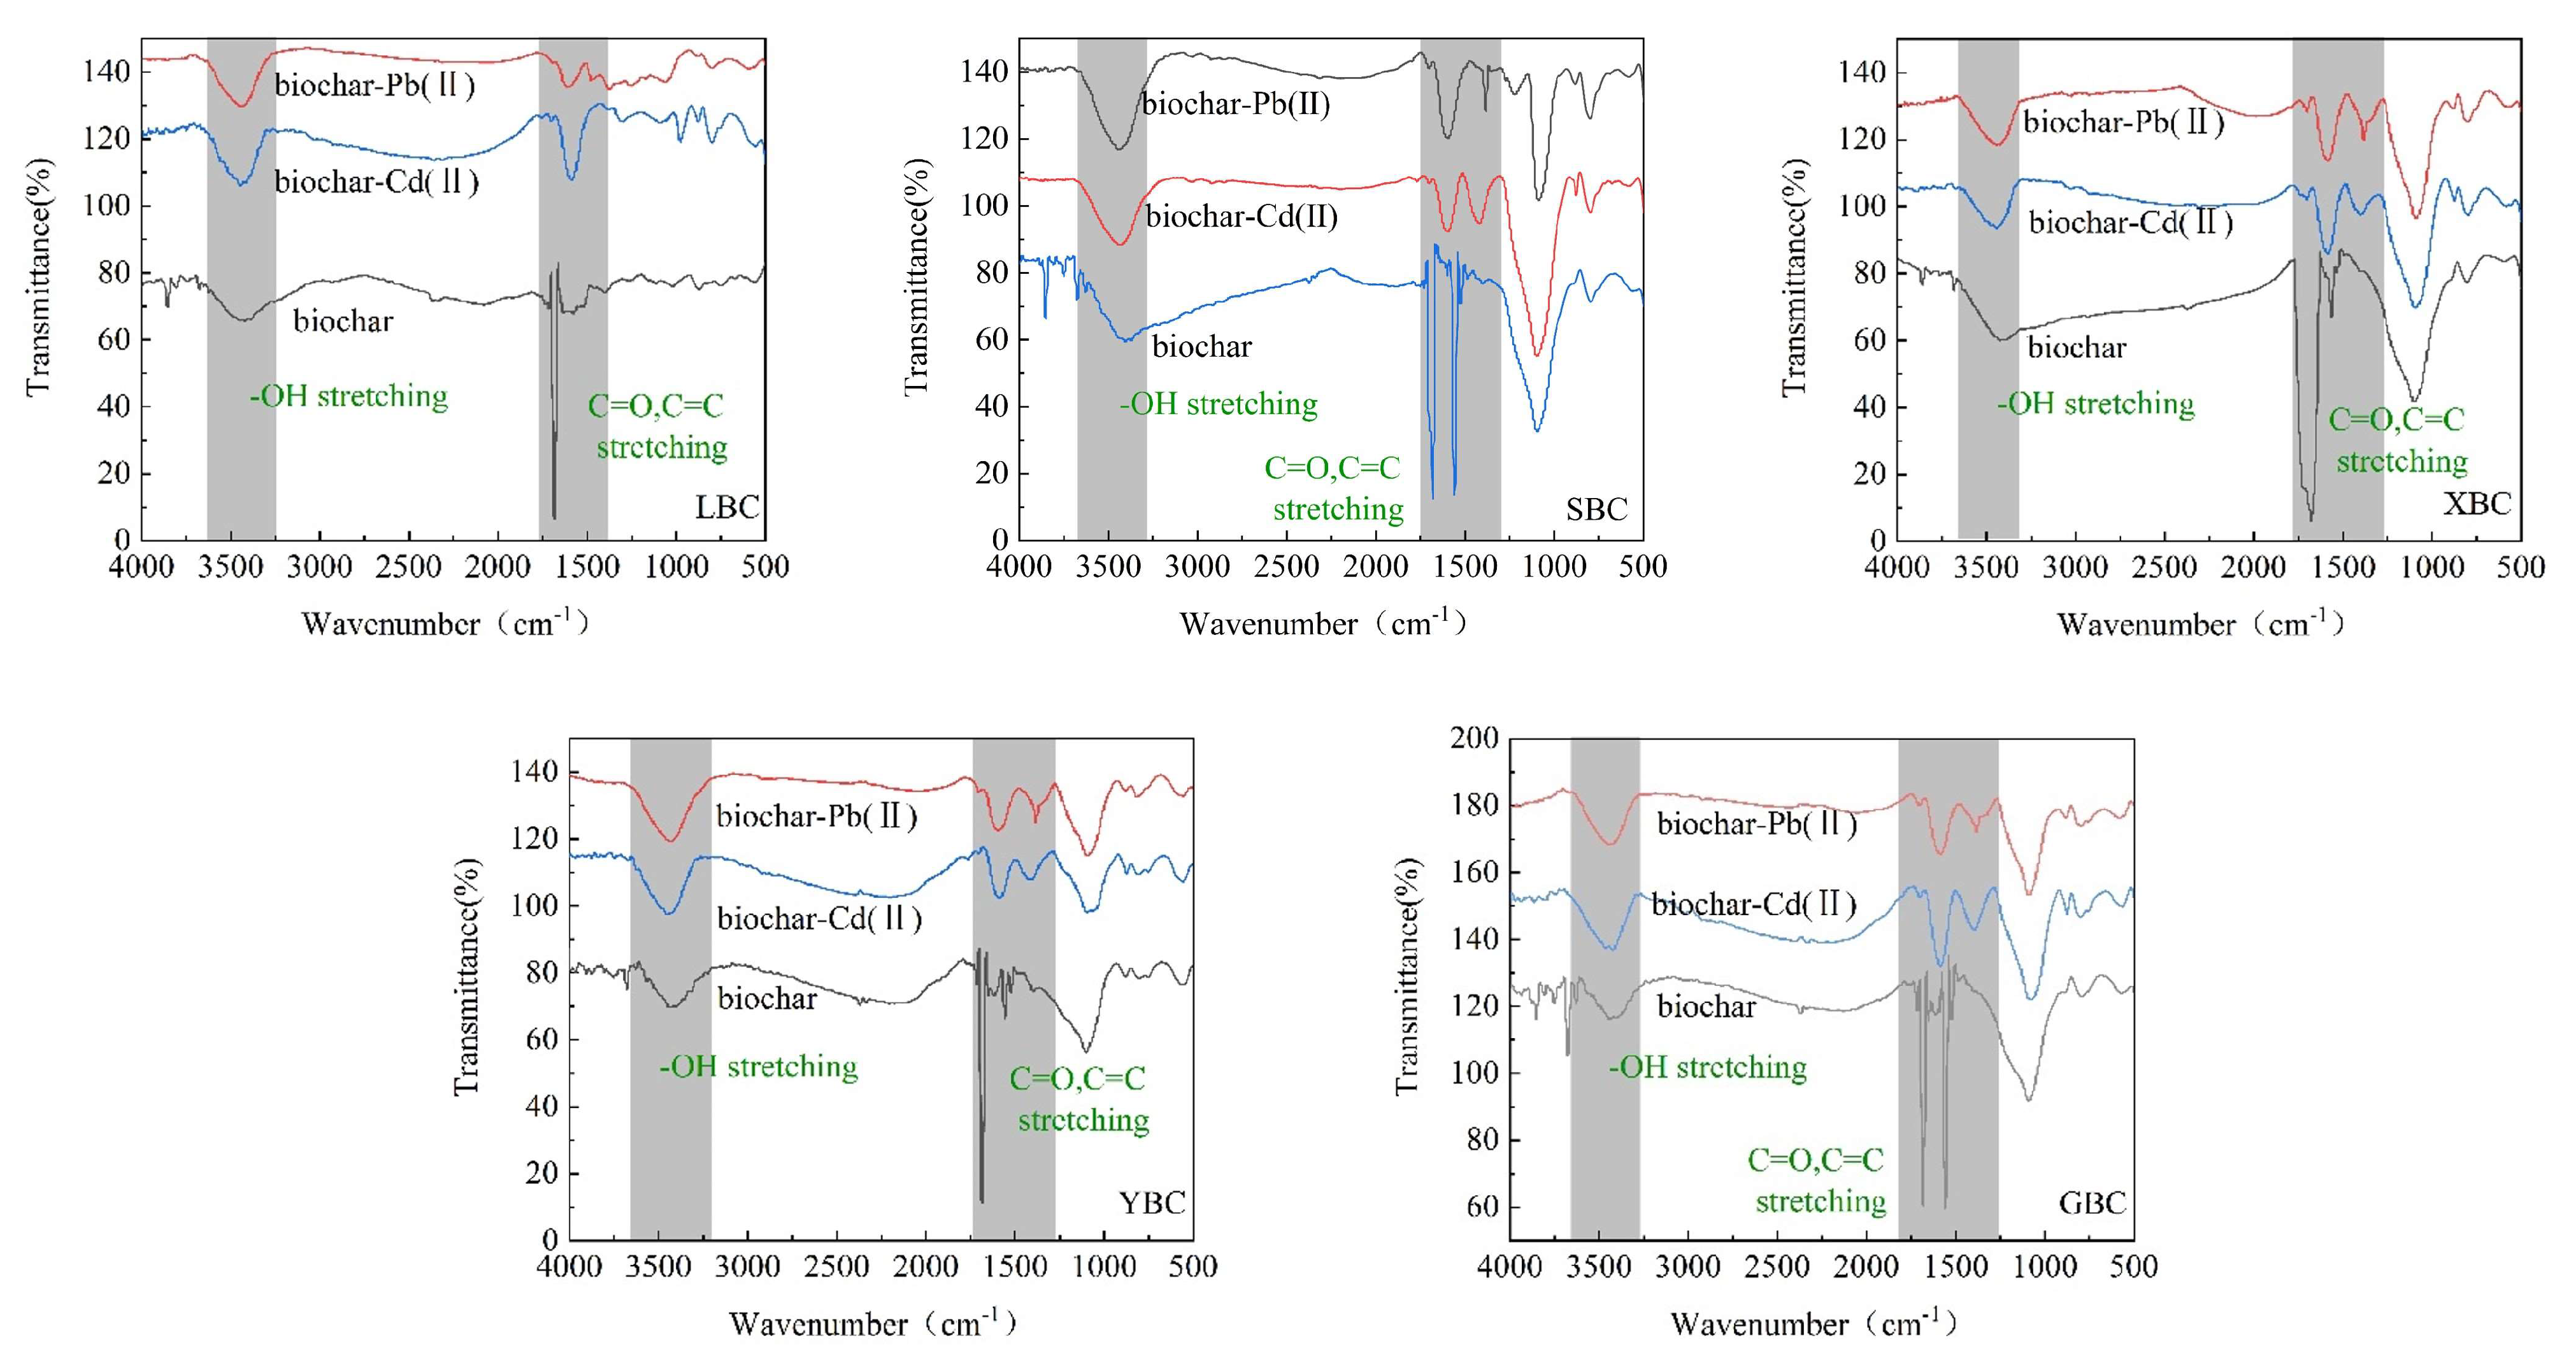
3.2.6. FTRI Analysis before and after Adsorption
The changes in functional groups before and after the adsorption of Pb
2+ and Cd
2+ on biochar were determined by infrared spectroscopy (
Figure 11). The positions of the peaks before and after the adsorption of Pb
2+ and Cd
2+ by five biochars were consistent, and the intensities of the absorption peaks were basically the same, indicating that the biochars have similar adsorption mechanisms for Pb
2+ and Cd
2+ [
39]. Among them, the -OH absorption peaks of SBC, LBC and XBC were significantly narrowed after the adsorption of Pb
2+ and Cd
2+, and the absorption peaks of all five biochars were shifted to the left, indicating that Pb
2+ and Cd
2+ occupied the -OH on the surface of biochar, it can be involved in complexation reaction (Lu et al., 2012). The strong absorption peak of C=O in carboxylic acid or ketone at 1685 cm
-1 also changed significantly [
1]. The vibrational peaks of the C=C bond and other groups at 1560 cm
-1 also changed significantly, and the intensity of the absorption peaks decreased significantly and all shifted to the right, indicating that the π electrons provided by the C=C bond formed a stable structure with heavy metals, and the role of cationic π-bonding in the adsorption process of the two heavy metal ions could be determined [
40,
41].
4. Discussion
4.1. Characteristics of the Five Plant-Based Biochars
Among the five biochars, the ash content of GBC was the highest (29.7 %), indicating that the inorganic mineral components of sorghum straw were relatively high, and biochar with high ash content is more suitable for heavy metal pollution [
42]. pH value is one of the important properties of biochar, biochar is applied to soil as a soil amendment, it will cause the change of soil pH value, which will lead to a series of problems such as soil nitrogen mineralization, waste material precipitation and greenhouse gas emission. Therefore, when biochar is used as a soil amendment, pH value is a non-negligible factor. The main reason for the alkaline pH value of biochar is that the materials used to make biochar contain a variety of plant acids, and the raw materials are acidic. However, during the pyrolysis process, the biological acids are continuously broken down, resulting in a continuous increase in the pH of the biochar [
43]. In addition, the concentration of these mineral elements gradually increases, making the biochar alkaline [
44]. pH is related to some alkaline substances and functional groups in the ash of biochar [
45]. This suggests that the differences in biochar pH are due to changes in the ash content of different biochar [
46].
CEC is generally considered to be an important index of soil cation retention capacity, and an increase in CEC is beneficial to the cation exchange process in biochar [
47]. The high CEC of GBC is beneficial for the ion exchange of biochar. This is related to the functional groups present on the surface of biochar, and the ash content may also affect the cation exchange capacity of biochar [
47,
48].
GBC has the largest specific surface area, micropore volume and total pore volume, which may be related to the high volatile fraction content of sorghum straw. Compared to other biochars, GBC has a smaller pore structure on the surface, which increases the specific surface area. GBC has the smallest average pore diameter, and the smaller the particle size of biochar, the larger the specific surface area, which is similar to the experimental results [
49]. This porosity is caused by the tubular structure formed by the plant cells [
50] .
It can be seen from the FTIR that the functional groups on the surface of the biochar have a great influence on its adsorption performance. Among the five biochars, GBC and SBC contain more oxygen-containing functional groups, and GBC has the largest specific surface area, which can expose more active sites in the adsorbed species and is more conducive to the chemical adsorption, oxygen-containing functional groups on the biochar surface play an important role in the redox process [
51,
52]. The electrochemical properties of functional groups (-OH, -COOH, etc.) on the surface of biochar play an important role in adsorption [
53].
The XRD pattern showed that GBC had more absorption peaks than the other four biochars, indicating that it is rich in SiO2 and KCl and contains many types of minerals. However, no KCl crystals were found in SBC, and LBC had the fewest mineral phases, which is consistent with the ash content of biochar. The higher the ash content, the richer the mineral phase composition of biochar.
Therefore, the high adsorption capacity and affinity of GBC are the result of long term pyrolysis [
54], its high ash content, pH, high cation exchange capacity, as well as a higher specific surface area and a large number of oxygen-containing functional groups.
4.2. Adsorption Characteristics of the Biochars for Pb2+ and Cd2+
The pH of the solution affects the adsorption of heavy metal ions in the solution by changing the charge distribution on the surface of biochar [
55]. When the solution pH is low, the adsorption sites on the surface of carbon particles are occupied by a large amount of H
+, which hinders the approach of Pb
2+ and Cd
2+, so the unit adsorption amount of Pb
2+ and Cd
2+ is small. As the pH of the solution increases, the negative charge on the carbon surface increases, and the electrostatic attraction of Pb
2+ and Cd
2+ increases. It can be seen that the adsorption amount of the five biochars was Pb
2+ > Cd
2+, the results showed that the presence of a large amount of H+ could inhibit the adsorption of heavy metal ions by biochar, and the adsorption amount of Pb
2+ was less affected by H
+ than other ions [
56].
Initially, the adsorption sites and specific surface area increased with increasing biochar dosage. However, as the amount of biochar added continued to increase, the equilibrium concentrations of Pb
2+ and Cd
2+ in the solution decreased relatively. According to the adsorption equilibrium law, Pb
2+ and Cd
2+ decreased. In addition, as the biochar dosage increased, Ca
2+, Mg
2+ and other cations released into the solution also increased, resulting in increased competition between the cations in the solution and Pb
2+ and Cd
2+, which is another reason for the decrease in of the unit adsorption capacity of Pb
2+ and Cd
2+ at the late biochar dosage [
57]. Under the influence of initial dosage, the adsorption amount of Pb
2+ by the five biochar was still greater than that of Cd
2+, and the affinity of Pb
2+ was stronger as the adsorption sites increased [
25]. This is due to the fact that the hydration ionic radius of Pb
2+ (0.401 Å) is smaller than that of Cd
2+ (0.426 Å), and the pKH (negative logarithm of the hydrolysis constant) of Pb
2+ (7.71) is lower than that of Cd
2+ (10.1) [58-60]. The properties of these heavy metals themselves cause the difference in adsorption. On the other hand, Pb
2+ has a stronger affinity and is less affected by a large amount of H
+ than Cd
2+, which will also affect its adsorption capacity.
The kinetic model corresponds to the pseudo-second-order kinetics, and the isothermal adsorption model corresponds to the Langmuir model. The adsorption capacity of the five biocahrs for heavy metal was compared with that of other biochars in the literature. In most cases, the adsorption of heavy metals by the five biochars was higher than that of some adsorbents, and the adsorption affinities were considerably lower as indicated by K
L values [
3,
61,
62]. The K
L value is related to the binding strength between an adsorbent and pollutant. The difference in adsorption can be attributed to temperature, pyrolysis time and other biochar preparation conditions, as well as different biochar doses. The adsorption process is monolayer adsorption. Combined with the thermodynamic results of adsorption, the adsorption behavior is both physical adsorption and chemical adsorption, and the adsorption process also has complex reaction, cationic π-bonding, ion precipitation and electrostatic adsorption.
5. Conclusions
We conclude that the five straws are appropriate for biochar preparation and for heavy metals, i.e., Pb2+ and Cd2+ removal from aqueous media. Among the five biochar species, GBC has a better adsorption capacity for Pb2+ and Cd2+. Due to its relatively high content of inorganic mineral components, GBC can precipitate with Pb2+ and Cd2+. In addition, it has more oxygen-containing functional groups, high cation exchange capacity, larger specific surface area and pore volume, and can expose more active sites during adsorption, which is more conducive to physical adsorption and chemical adsorption. The adsorption kinetics of the biochars for Pb2+ and Cd2+ could be expressed and explained by a pseudo-second-order model. The Langmuir model suggested that the five biochars exhibited the highest adsorption capacities compared to other biochars, solution pH, biochar dosing, pyrolysis temperature and the properties of these heavy metals were responsible for adsorption capacity. In conclusion, in this study, sorghum biochar was selected as an adsorbent material according to the differences in Pb2+ and Cd2+ properties, which provided a basis for selecting suitable plant biochar for different heavy metals in the future.
Author Contributions
Conceptualization, Y.Y. and J.H.; methodology, J.H.; software, J.H.; validation, J.S., Z.P. and Q.W.; formal analysis, R.Y.; investigation, Z.P.; resources, R.Y.; data curation, J.H.; writing—original draft preparation, J.H.; writing—review and editing, Y.Y.; visualization, J.S.; supervision, Q.W.; project administration, Z.P.; funding acquisition, R.Y. All authors have read and agreed to the published version of the manuscript.
Funding
This research was funded by National Key Research and Development Project of China (No. 2019YFC1805503).
Institutional Review Board Statement
Not applicable.
Informed Consent Statement
Not applicable.
Data Availability Statement
Not applicable.
Acknowledgments
The authors are grateful for financial support of the National Key Research and Development Project of China (No. 2019YFC1805503).
Conflicts of Interest
The authors declare no conflict of interest.
References
- Cui, X.; Hao, H.; Zhang, C.; He, Z.; Yang, X. Capacity and mechanisms of ammonium and cadmium sorption on different wetland-plant derived biochars. Science of the Total Environment 2016, 539, 566–575. [Google Scholar] [CrossRef] [PubMed]
- Nazari, S.; Rahimi, G.; Khademi Jolgeh Nezhad, A. Effectiveness of native and citric acid-enriched biochar of Chickpea straw in Cd and Pb sorption in an acidic soil. Journal of Environmental Chemical Engineering 2019, 7. [Google Scholar] [CrossRef]
- Yin, K.; Wang, J.; Zhai, S.; Xu, X.; Li, T.; Sun, S.; Xu, S.; Zhang, X.; Wang, C.; Hao, Y. Adsorption mechanisms for cadmium from aqueous solutions by oxidant-modified biochar derived from Platanus orientalis Linn leaves. J Hazard Mater 2022, 428, 128261. [Google Scholar] [CrossRef] [PubMed]
- Rötting, T.S.; Mercado, M.; García, M.E.; Quintanilla, J. Environmental distribution and health impacts of As and Pb in crops and soils near Vinto smelter, Oruro, Bolivia. International Journal of Environmental Science and Technology 2013, 11, 935–948. [Google Scholar] [CrossRef]
- Xie, Y.; Zhou, G.; Huang, X.; Cao, X.; Ye, A.; Deng, Y.; Zhang, J.; Lin, C.; Zhang, R. Study on the physicochemical properties changes of field aging biochar and its effects on the immobilization mechanism for Cd(2+) and Pb(2). Ecotoxicol Environ Saf 2021, 230, 113107. [Google Scholar] [CrossRef]
- Wu, Q.; Xian, Y.; He, Z.; Zhang, Q.; Wu, J.; Yang, G.; Zhang, X.; Qi, H.; Ma, J.; Xiao, Y.; et al. Adsorption characteristics of Pb(II) using biochar derived from spent mushroom substrate. Sci Rep 2019, 9, 15999. [Google Scholar] [CrossRef]
- Deng, J.; Liu, Y.; Liu, S.; Zeng, G.; Tan, X.; Huang, B.; Tang, X.; Wang, S.; Hua, Q.; Yan, Z. Competitive adsorption of Pb(II), Cd(II) and Cu(II) onto chitosan-pyromellitic dianhydride modified biochar. Journal of Colloid and Interface Science 2017, 506, 355–364. [Google Scholar] [CrossRef]
- Chandraiah, M.R. Facile synthesis of zero valent iron magnetic biochar composites for Pb(II) removal from the aqueous medium. Alexandria Engineering Journal 2016, 55, 619–625. [Google Scholar] [CrossRef]
- Li, R.; Wang, J.J.; Zhou, B.; Awasthi, M.K.; Ali, A.; Zhang, Z.; Gaston, L.A.; Lahori, A.H.; Mahar, A. Enhancing phosphate adsorption by Mg/Al layered double hydroxide functionalized biochar with different Mg/Al ratios. Science of the Total Environment 2016, 559, 121–129. [Google Scholar] [CrossRef]
- Wang, H.; Gao, B.; Wang, S.; Fang, J.; Xue, Y.; Yang, K. Removal of Pb(II), Cu(II), and Cd(II) from aqueous solutions by biochar derived from KMnO4 treated hickory wood. Bioresource Technology 2015, 197, 356–362. [Google Scholar] [CrossRef]
- Abdul, G.; Zhu, X.; Chen, B. Structural characteristics of biochar-graphene nanosheet composites and their adsorption performance for phthalic acid esters. Chemical Engineering Journal 2017, 319, 9–20. [Google Scholar] [CrossRef]
- Liu, W.J.; Jiang, H.; Yu, H.Q. Development of Biochar-Based Functional Materials: Toward a Sustainable Platform Carbon Material. Chem Rev 2015, 115, 12251–12285. [Google Scholar] [CrossRef] [PubMed]
- Mohan, D.; Pittman, C.U., Jr.; Bricka, M.; Smith, F.; Yancey, B.; Mohammad, J.; Steele, P.H.; Alexandre-Franco, M.F.; Gomez-Serrano, V.; Gong, H. Sorption of arsenic, cadmium, and lead by chars produced from fast pyrolysis of wood and bark during bio-oil production. Journal of Colloid and Interface Science 2007, 310, 57–73. [Google Scholar] [CrossRef]
- Xu, X.; Cao, X.; Zhao, L.; Wang, H.; Yu, H.; Gao, B. Removal of Cu, Zn, and Cd from aqueous solutions by the dairy manure-derived biochar. Environmental Science and Pollution Research 2013, 20, 358–368. [Google Scholar] [CrossRef] [PubMed]
- Ahmad, M.; Rajapaksha, A.U.; Lim, J.E.; Zhang, M.; Bolan, N.; Mohan, D.; Vithanage, M.; Lee, S.S.; Ok, Y.S. Biochar as a sorbent for contaminant management in soil and water: A review. Chemosphere 2014, 99, 19–33. [Google Scholar] [CrossRef] [PubMed]
- Mohan, D.; Rajput, S.; Singh, V.K.; Steele, P.H.; Pittman, C.U., Jr. Modeling and evaluation of chromium remediation from water using low cost bio-char, a green adsorbent. Journal of Hazardous Materials 2011, 188, 319–333. [Google Scholar] [CrossRef] [PubMed]
- Pan, J.; Jiang, J.; Xu, R. Adsorption of Cr(III) from acidic solutions by crop straw derived biochars. Journal of Environmental Sciences 2013, 25, 1957–1965. [Google Scholar] [CrossRef]
- Soria, R.I.; Rolfe, S.A.; Betancourth, M.P.; Thornton, S.F. The relationship between properties of plant-based biochars and sorption of Cd(II), Pb(II) and Zn(II) in soil model systems. Heliyon 2020, 6, e05388. [Google Scholar] [CrossRef]
- Nie, T.H.; Yang, X.; Chen, H.B.; Muller, K.; Shaheen, S.M.; Rinklebe, J.; Song, H.; Xu, S.; Wu, F.C.; Wang, H.L. Effect of biochar aging and co-existence of diethyl phthalate on the mono-sorption of cadmium and zinc to biochar-treated soils. Journal of Hazardous Materials 2021, 408. [Google Scholar] [CrossRef]
- Khan, Z.H.; Gao, M.L.; Qiu, W.W.; Islam, M.S.; Song, Z.G. Mechanisms for cadmium adsorption by magnetic biochar composites in an aqueous solution. Chemosphere 2020, 246. [Google Scholar] [CrossRef]
- Esfandiar, N.; Suri, R.; McKenzie, E.R. Competitive sorption of Cd, Cr, Cu, Ni, Pb and Zn from stormwater runoff by five low-cost sorbents; Effects of co-contaminants, humic acid, salinity and pH. Journal of Hazardous Materials 2022, 423. [Google Scholar] [CrossRef] [PubMed]
- Raj, A.; Yadav, A.; Arya, S.; Sirohi, R.; Kumar, S.; Rawat, A.P.; Thakur, R.S.; Patel, D.K.; Bahadur, L.; Pandey, A. Preparation, characterization and agri applications of biochar produced by pyrolysis of sewage sludge at different temperatures. Sci Total Environ 2021, 795, 148722. [Google Scholar] [CrossRef] [PubMed]
- Paranavithana, G.N.; Kawamoto, K.; Inoue, Y.; Saito, T.; Vithanage, M.; Kalpage, C.S.; Herath, G.B.B. Adsorption of Cd2+ and Pb2+ onto coconut shell biochar and biochar-mixed soil. Environmental Earth Sciences 2016, 75. [Google Scholar] [CrossRef]
- Aschale, M.; Tsegaye, F.; Amde, M. Potato peels as promising low-cost adsorbent for the removal of lead, cadmium, chromium and copper from wastewater. Desalination and Water Treatment 2021, 222, 405–415. [Google Scholar] [CrossRef]
- Ni, B.-J.; Huang, Q.-S.; Wang, C.; Ni, T.-Y.; Sun, J.; Wei, W. Competitive adsorption of heavy metals in aqueous solution onto biochar derived from anaerobically digested sludge. Chemosphere 2019, 219, 351–357. [Google Scholar] [CrossRef] [PubMed]
- Medha, I.; Chandra, S.; Vanapalli, K.R.; Samal, B.; Bhattacharya, J.; Das, B.K. (3-Aminopropyl)triethoxysilane and iron rice straw biochar composites for the sorption of Cr (VI) and Zn (II) using the extract of heavy metals contaminated soil. Sci Total Environ 2021, 771, 144764. [Google Scholar] [CrossRef]
- Das, S.K.; Ghosh, G.K.; Avasthe, R. Conversion of crop, weed and tree biomass into biochar for heavy metal removal and wastewater treatment. Biomass Conversion and Biorefinery 2021. [CrossRef]
- Chen, B.L.; Johnson, E.J.; Chefetz, B.; Zhu, L.Z.; Xing, B.S. Sorption of polar and nonpolar aromatic organic contaminants by plant cuticular materials: Role of polarity and accessibility. Environmental Science & Technology 2005, 39, 6138–6146. [Google Scholar] [CrossRef]
- Singh, B.; Singh, B.P.; Cowie, A.L. Characterisation and evaluation of biochars for their application as a soil amendment. Australian Journal of Soil Research 2010, 48, 516–525. [Google Scholar] [CrossRef]
- Xue, C.; Zhu, L.; Lei, S.; Liu, M.; Hong, C.; Che, L.; Wang, J.; Qiu, Y. Lead competition alters the zinc adsorption mechanism on animal-derived biochar. Science of the Total Environment 2020, 713. [Google Scholar] [CrossRef]
- Ozbay, N.; Putun, A.E.; Putun, E. Bio-oil production from rapid pyrolysis of cottonseed cake: product yields and compositions. International Journal of Energy Research 2006, 30, 501–510. [Google Scholar] [CrossRef]
- Zhang, W.; Tan, X.; Gu, Y.; Liu, S.; Liu, Y.; Hu, X.; Li, J.; Zhou, Y.; Liu, S.; He, Y. Rice waste biochars produced at different pyrolysis temperatures for arsenic and cadmium abatement and detoxification in sediment. Chemosphere 2020, 250. [Google Scholar] [CrossRef] [PubMed]
- Das, S.K.; Ghosh, G.K.; Avasthe, R.; Sinha, K. Morpho-mineralogical exploration of crop, weed and tree derived biochar. Journal of Hazardous Materials 2021, 407. [Google Scholar] [CrossRef] [PubMed]
- Su, Y.; Wen, Y.; Yang, W.; Zhang, X.; Xia, M.; Zhou, N.; Xiong, Y.; Zhou, Z. The mechanism transformation of ramie biochar? s cadmium adsorption by aging. Bioresource Technology 2021, 330. [Google Scholar] [CrossRef]
- Fan, J.; Cai, C.; Chi, H.; Reid, B.J.; Coulon, F.; Zhang, Y.; Hou, Y. Remediation of cadmium and lead polluted soil using thiol-modified biochar. J Hazard Mater 2020, 388, 122037. [Google Scholar] [CrossRef] [PubMed]
- Kołodyńska, D.; Wnętrzak, R.; Leahy, J.J.; Hayes, M.H.B.; Kwapiński, W.; Hubicki, Z. Kinetic and adsorptive characterization of biochar in metal ions removal. Chemical Engineering Journal 2012, 197, 295–305. [Google Scholar] [CrossRef]
- Hong, M.; Yu, L.; Wang, Y.; Zhang, J.; Chen, Z.; Dong, L.; Zan, Q.; Li, R. Heavy metal adsorption with zeolites: The role of hierarchical pore architecture. Chemical Engineering Journal 2019, 359, 363–372. [Google Scholar] [CrossRef]
- Maszkowska, J.; Wagil, M.; Mioduszewska, K.; Kumirska, J.; Stepnowski, P.; Bialk-Bielinska, A. Thermodynamic studies for adsorption of ionizable pharmaceuticals onto soil. Chemosphere 2014, 111, 568–574. [Google Scholar] [CrossRef]
- Chakravarty, S.; Mohanty, A.; Sudha, T.N.; Upadhyay, A.K.; Konar, J.; Sircar, J.K.; Madhukar, A.; Gupta, K.K. Removal of Pb(II) ions from aqueous solution by adsorption using bael leaves (Aegle marmelos). Journal of Hazardous Materials 2010, 173, 502–509. [Google Scholar] [CrossRef]
- Li, H.; Dong, X.; da Silva, E.B.; de Oliveira, L.M.; Chen, Y.; Ma, L.Q. Mechanisms of metal sorption by biochars: Biochar characteristics and modifications. Chemosphere 2017, 178, 466–478. [Google Scholar] [CrossRef]
- Peng, H.; Gao, P.; Chu, G.; Pan, B.; Peng, J.; Xing, B. Enhanced adsorption of Cu(II) and Cd(II) by phosphoric acid-modified biochars. Environmental Pollution 2017, 229, 846–853. [Google Scholar] [CrossRef] [PubMed]
- Ji, M.; Wang, X.; Usman, M.; Liu, F.; Dan, Y.; Zhou, L.; Campanaro, S.; Luo, G.; Sang, W. Effects of different feedstocks-based biochar on soil remediation: A review. Environmental Pollution 2022, 294. [Google Scholar] [CrossRef]
- Li, L.; Long, A.; Fossum, B.; Kaiser, M. Effects of pyrolysis temperature and feedstock type on biochar characteristics pertinent to soil carbon and soil health: A meta-analysis. Soil Use and Management 2022. [CrossRef]
- Wei, J.; Tu, C.; Yuan, G.; Liu, Y.; Bi, D.; Xiao, L.; Lu, J.; Theng, B.K.G.; Wang, H.; Zhang, L.; et al. Assessing the effect of pyrolysis temperature on the molecular properties and copper sorption capacity of a halophyte biochar. Environmental Pollution 2019, 251, 56–65. [Google Scholar] [CrossRef] [PubMed]
- Huang, F.; Gao, L.-Y.; Deng, J.-H.; Chen, S.-H.; Cai, K.-Z. Quantitative contribution of Cd2+ adsorption mechanisms by chicken-manure-derived biochars. Environmental Science and Pollution Research 2018, 25, 28322–28334. [Google Scholar] [CrossRef] [PubMed]
- Jian, M.; Gao, K.; Yu, H. Effects of different pyrolysis temperatures on the preparation and characteristics of bio-char from rice straw. Acta Scientiae Circumstantiae 2016, 36, 1757–1765. [Google Scholar]
- Ren, X.H.; He, J.Y.; Chen, Q.; He, F.; Wei, T.; Jia, H.L.; Guo, J.K. Marked changes in biochar's ability to directly immobilize Cd in soil with aging: implication for biochar remediation of Cd-contaminated soil. Environmental Science and Pollution Research 2022, 29, 73856–73864. [Google Scholar] [CrossRef] [PubMed]
- Lee, J.W.; Kidder, M.; Evans, B.R.; Paik, S.; Buchanan, A.C., III; Garten, C.T.; Brown, R.C. Characterization of Biochars Produced from Cornstovers for Soil Amendment. Environmental Science & Technology 2010, 44, 7970–7974. [Google Scholar] [CrossRef]
- He, Z.; Zhang, Y.; Wei, W. Formaldehyde and VOC emissions at different manufacturing stages of wood-based panels. Building and Environment 2012, 47, 197–204. [Google Scholar] [CrossRef]
- Puga, A.P.; Abreu, C.A.; Melo, L.C.A.; Beesley, L. Biochar application to a contaminated soil reduces the availability and plant uptake of zinc, lead and cadmium. Journal of Environmental Management 2015, 159, 86–93. [Google Scholar] [CrossRef]
- Tang, J.; Zhu, W.; Kookana, R.; Katayama, A. Characteristics of biochar and its application in remediation of contaminated soil. Journal of Bioscience and Bioengineering 2013, 116, 653–659. [Google Scholar] [CrossRef] [PubMed]
- Zhu, M.; Liu, Y.; Xu, J.; He, Y. Compound-specific stable isotope analysis for characterization of the transformation of gamma-HCH induced by biochar. Chemosphere 2023, 137729–137729. [Google Scholar] [CrossRef] [PubMed]
- Machado, F.M.; Bergmann, C.P.; Fernandes, T.H.M.; Lima, E.C.; Royer, B.; Calvete, T.; Fagan, S.B. Adsorption of Reactive Red M-2BE dye from water solutions by multi-walled carbon nanotubes and activated carbon. Journal of Hazardous Materials 2011, 192, 1122–1131. [Google Scholar] [CrossRef] [PubMed]
- Thomas, E.; Borchard, N.; Sarmiento, C.; Atkinson, R.; Ladd, B. Key factors determining biochar sorption capacity for metal contaminants: a literature synthesis. Biochar 2020, 2, 151–163. [Google Scholar] [CrossRef]
- Kocaoba, S.; Arisoy, M. Biosorption of cadmium(II) and lead(II) from aqueous solutions using Pleurotus ostreatus immobilized on bentonite. Separation Science and Technology 2018, 53, 1703–1710. [Google Scholar] [CrossRef]
- Zhang, W.; Mao, S.; Chen, H.; Huang, L.; Qiu, R. Pb(II) and Cr(VI) sorption by biochars pyrolyzed from the municipal wastewater sludge under different heating conditions. Bioresource Technology 2013, 147, 545–552. [Google Scholar] [CrossRef] [PubMed]
- Wang, X.; Xue, Y.; Cheng, X.; Liu, Y. An overview of heavy metal removal using biochar. China Rural Water Hydropower 2013, 12, 51–56. [Google Scholar]
- Mehellou, A.; Delimi, R.; Benredjem, Z.; Innocent, C. Affinity of Cation-Exchange Membranes Towards Metallic Cations: Application in Continuous Electropermutation. Separation Science and Technology 2015, 50, 495–504. [Google Scholar] [CrossRef]
- Kouotou, D.; Gharibi, E.K.; Bailon-Garcia, E.; Ghalit, M. Improved Cd (II) ions removal performance from aqueous solution using cerium doped activated carbon. In Proceedings of the International Conference on Phosphates (ICP) - Fundamentals, Processes and Technologies (ICP), Mohammed VI Polytechn Univ, Benguerir, MEXICO, 15-17 October 2022; pp. 1957–1965. [Google Scholar]
- Zhang, B.-L.; Qiu, W.; Wang, P.-P.; Liu, Y.-L.; Zou, J.; Wang, L.; Ma, J. Mechanism study about the adsorption of Pb(II) and Cd(II) with iron-trimesic metal-organic frameworks. Chemical Engineering Journal 2020, 385. [Google Scholar] [CrossRef]
- Hu, X.; Zhang, R.; Xia, B.; Ying, R.; Hu, Z.; Tao, X.; Yu, H.; Xiao, F.; Chu, Q.; Chen, H.; et al. Effect of Pyrolysis Temperature on Removal Efficiency and Mechanisms of Hg(II), Cd(II), and Pb (II) by Maize Straw Biochar. Sustainability 2022, 14. [Google Scholar] [CrossRef]
- Lee, M.E.; Park, J.H.; Chung, J.W. Comparison of the lead and copper adsorption capacities of plant source materials and their biochars. J Environ Manage 2019, 236, 118–124. [Google Scholar] [CrossRef] [PubMed]
Figure 1.
Scanning electron micrographs (SEM) of the five plant-derived biochars.
Figure 1.
Scanning electron micrographs (SEM) of the five plant-derived biochars.
Figure 2.
FTIR spectra of the biochars derived from five plants.
Figure 2.
FTIR spectra of the biochars derived from five plants.
Figure 3.
Five plant-derived biochars’ XRD patterns.
Figure 3.
Five plant-derived biochars’ XRD patterns.
Figure 4.
The effect of dosage of biochars on the Pb2+ and Cd2+ removal efficiency of the five plant-derived biochars.
Figure 4.
The effect of dosage of biochars on the Pb2+ and Cd2+ removal efficiency of the five plant-derived biochars.
Figure 5.
The effect of dosage of biochars on the Pb2+ and Cd2+ removal efficiency of the five plant-derived biochars.
Figure 5.
The effect of dosage of biochars on the Pb2+ and Cd2+ removal efficiency of the five plant-derived biochars.
Figure 6.
Adsorption kinetic models of the five plant-derived biochars for Pb2+ and Cd2+.
Figure 6.
Adsorption kinetic models of the five plant-derived biochars for Pb2+ and Cd2+.
Figure 7.
Intraparticle diffusion model of adsorption of Pb2+, Cd2+ by the five plant-derived biochars.
Figure 7.
Intraparticle diffusion model of adsorption of Pb2+, Cd2+ by the five plant-derived biochars.
Figure 8.
Adsorption isotherm fittings of the five plant-derived biochars.
Figure 8.
Adsorption isotherm fittings of the five plant-derived biochars.
Figure 9.
Temkin model fittings of the five plant-derived biochars.
Figure 9.
Temkin model fittings of the five plant-derived biochars.
Figure 10.
D-R model fittings of the five plant-derived biochars.
Figure 10.
D-R model fittings of the five plant-derived biochars.
Figure 11.
FTIR spectra of Pb2+, Cd2+ before and after adsorption of the five biochars.
Figure 11.
FTIR spectra of Pb2+, Cd2+ before and after adsorption of the five biochars.
Table 1.
Characterization of the five plant-derived biochars.
Table 1.
Characterization of the five plant-derived biochars.
| Parameters |
Plant-derived biochar |
| YBC |
GBC |
XBC |
LBC |
SBC |
| pH |
9.23 |
9.86 |
9.51 |
8.21 |
9.64 |
| Ash (%) |
21.3 |
29.7 |
24.1 |
19.6 |
27.2 |
| BET surface area (m2·g−1) |
97.841 |
245.434 |
180.714 |
95.934 |
100.820 |
| Average pore diameter (nm) |
4.517 |
3.501 |
3.068 |
5.747 |
5.455 |
| Micropore volume (cm3·g−1) |
0.004 |
0.080 |
0.055 |
0.003 |
0.006 |
| Total pore volume (cm3·g−1) |
0.110 |
0.215 |
0.139 |
0.103 |
0.137 |
| C (%) |
64.00 |
66.72 |
59.77 |
65.54 |
58.61 |
| H (%) |
2.07 |
2.21 |
1.92 |
1.89 |
1.91 |
| O (%) |
31.91 |
29.90 |
37.12 |
30.61 |
37.44 |
| N (%) |
1.81 |
1.03 |
0.90 |
1.73 |
1.92 |
| H/C |
0.032 |
0.033 |
0.032 |
0.029 |
0.033 |
| O/C |
0.499 |
0.448 |
0.621 |
0.467 |
0.639 |
| (N+O)/C |
0.527 |
0.464 |
0.636 |
0.493 |
0.672 |
| CEC (cmol·kg−1) |
9.79 |
9.89 |
22.50 |
4,60 |
12.50 |
Table 2.
Kinetic parameters for Pb2+ and Cd2+ adsorption onto five plant-derived biochars.
Table 2.
Kinetic parameters for Pb2+ and Cd2+ adsorption onto five plant-derived biochars.
| Biochar |
Pseudo-first-order kinetic model |
Pseudo-second-order kinetic model |
qe
(mg·g-1) |
K1
(min-1) |
R2
|
qe
(mg·g-1) |
K2
(10-3·g·mg-1·min-1) |
R2
|
| Pb2+
|
| LBC |
52.566 |
0.052 |
0.851 |
56.77 |
1.337 |
0.961 |
| SBC |
77.234 |
0.065 |
0.839 |
82.44 |
1.192 |
0.963 |
| YBC |
63.937 |
0.064 |
0.766 |
68.77 |
1.345 |
0.924 |
| GBC |
89.962 |
0.068 |
0.846 |
96.02 |
1.072 |
0.967 |
| XBC |
83.468 |
0.043 |
0.852 |
90.44 |
0.696 |
0.952 |
| Cd2+
|
| LBC |
14.331 |
0.068 |
0.935 |
15.27 |
6.687 |
0.996 |
| SBC |
18.916 |
0.105 |
0.934 |
19.828 |
8.827 |
0.993 |
| YBC |
16.503 |
0.089 |
0.904 |
17.409 |
8.172 |
0.986 |
| GBC |
24.499 |
0.058 |
0.788 |
26.241 |
3.368 |
0.935 |
| XBC |
22.052 |
0.089 |
0.685 |
23.321 |
6.119 |
0.900 |
Table 3.
Intraparticle diffusion model parameters of the five plant-derived biochars.
Table 3.
Intraparticle diffusion model parameters of the five plant-derived biochars.
| Biochar |
Intra-particle diffusion model |
| k1
|
C1
|
R2
|
k2
|
C2
|
R2
|
| Pb2+
|
| LBC |
1.893 |
1.435 |
0.976 |
0.104 |
12.795 |
0.632 |
| SBC |
2.422 |
4.253 |
0.986 |
0.075 |
17.961 |
0.733 |
| YBC |
2.026 |
3.351 |
0.991 |
0.111 |
14.978 |
0.888 |
| GBC |
1.943 |
6.793 |
0.999 |
0.305 |
19.939 |
0.726 |
| XBC |
1.639 |
8.521 |
0.946 |
0.225 |
19.059 |
0.780 |
| Cd2+
|
| LBC |
5.470 |
8.177 |
0.996 |
0.689 |
41.878 |
0.652 |
| SBC |
7.648 |
17.127 |
0.979 |
0.772 |
65.910 |
0.661 |
| YBC |
6.347 |
14.272 |
0.964 |
0.967 |
49.514 |
0.670 |
| GBC |
9.677 |
18.084 |
0.997 |
0.947 |
76.119 |
0.685 |
| XBC |
7.823 |
13.266 |
0.912 |
1.138 |
64.897 |
0.590 |
Table 4.
Isotherm parameters for Pb2+ adsorption onto the biochars.
Table 4.
Isotherm parameters for Pb2+ adsorption onto the biochars.
| Biochar |
temperature
(℃) |
Langmuir Model |
Freundlich Model |
Qm
(mg·g-1) |
KL
(L·mg-1) |
R2
|
n |
KF
(mg·g-1) |
R2
|
| LBC |
25 |
72.575 |
0.0199 |
0.936 |
2.849 |
8.481 |
0.763 |
| 35 |
74.522 |
0.0207 |
0.934 |
2.892 |
9.033 |
0.760 |
| 45 |
78.694 |
0.0239 |
0.934 |
2.845 |
9.176 |
0.760 |
| XBC |
25 |
106.263 |
0.0156 |
0.932 |
2.558 |
9.427 |
0.776 |
| 35 |
109.028 |
0.0153 |
0.935 |
2.537 |
9.457 |
0.783 |
| 45 |
111.289 |
0.0187 |
0.940 |
2.568 |
9.979 |
0.789 |
| YBC |
25 |
84.346 |
0.0178 |
0.904 |
2.726 |
8.785 |
0.726 |
| 35 |
86.522 |
0.0181 |
0.898 |
2.749 |
9.193 |
0.716 |
| 45 |
91.523 |
0.0190 |
0.915 |
2.661 |
8.998 |
0.750 |
| SBC |
25 |
94.475 |
0.0174 |
0.879 |
2.692 |
9.532 |
0.701 |
| 35 |
96.932 |
0.0180 |
0.883 |
2.735 |
10.186 |
0.701 |
| 45 |
102.297 |
0.0204 |
0.895 |
2.693 |
10.334 |
0.713 |
| GBC |
25 |
125.483 |
0.0132 |
0.937 |
2.386 |
9.144 |
0.794 |
| 35 |
126.386 |
0.0137 |
0.931 |
2.403 |
9.4121 |
0.783 |
| 45 |
132.312 |
0.0152 |
0.941 |
2.370 |
9.484 |
0.840 |
Table 5.
Isotherm parameters for Cd2+ adsorption onto the biochars.
Table 5.
Isotherm parameters for Cd2+ adsorption onto the biochars.
| Biochar |
temperature
(℃) |
Langmuir Model |
Freundlich Model |
Qm
(mg·g-1) |
KL
(L·mg-1) |
R2
|
n |
KF
(mg·g-1) |
R2
|
| LBC |
25 |
16.463 |
0.081 |
0.957 |
3.388 |
3.844 |
0.846 |
| 35 |
18.300 |
0.086 |
0.971 |
3.259 |
4.026 |
0.885 |
| 45 |
20.112 |
0.096 |
0.988 |
3.294 |
4.272 |
0.926 |
| XBC |
25 |
24.987 |
0.064 |
0.966 |
3.031 |
4.800 |
0.846 |
| 35 |
27.472 |
0.057 |
0.983 |
2.850 |
4.720 |
0.888 |
| 45 |
31.073 |
0.079 |
0.992 |
2.642 |
4.582 |
0.919 |
| YBC |
25 |
18.955 |
0.079 |
0.965 |
3.322 |
4.315 |
0.925 |
| 35 |
20.726 |
0.080 |
0.966 |
3.356 |
4.778 |
0.878 |
| 45 |
22.302 |
0.098 |
0.925 |
3.541 |
5.565 |
0.806 |
| SBC |
25 |
21.823 |
0.061 |
0.971 |
2.939 |
3.989 |
0.891 |
| 35 |
24.497 |
0.069 |
0.965 |
2.860 |
4.269 |
0.883 |
| 45 |
27.947 |
0.082 |
0.959 |
2.684 |
4.291 |
0.883 |
| GBC |
25 |
29.802 |
0.055 |
0.954 |
2.800 |
4.933 |
0.834 |
| 35 |
31.584 |
0.053 |
0.954 |
2.755 |
5.068 |
0.840 |
| 45 |
33.305 |
0.063 |
0.963 |
2.759 |
5.368 |
0.854 |
Table 6.
D-R and Temkim parameters for Pb2+ and Cd2+ adsorption onto the biochars.
Table 6.
D-R and Temkim parameters for Pb2+ and Cd2+ adsorption onto the biochars.
| Biochar |
Temkim Model |
D-R Model |
| A |
B |
R2
|
Q0/mmol·g-1
|
E/ kJ·mol-1
|
R2
|
| Pb2+
|
| LCB |
0.177 |
16.084 |
0.904 |
1.758 |
9.191 |
0.863 |
| SCB |
0.148 |
21.384 |
0.847 |
2.553 |
8.826 |
0.865 |
| YBC |
0.153 |
18.977 |
0.872 |
2.282 |
8.858 |
0.843 |
| GBC |
0.119 |
28.181 |
0.924 |
3.890 |
8.392 |
0.908 |
| XBC |
0.137 |
23.885 |
0.913 |
3.001 |
8.684 |
0.890 |
| Cd2+
|
| LBC |
0.877 |
3.354 |
0.924 |
0.469 |
11.278 |
0.813 |
| SBC |
0.600 |
4.660 |
0.957 |
0.664 |
10.784 |
0.894 |
| YBC |
0.942 |
3.776 |
0.966 |
0.455 |
11.983 |
0.911 |
| GBC |
0.482 |
6.625 |
0.928 |
1.111 |
10.051 |
0.874 |
| XBC |
0.610 |
5.355 |
0.933 |
0.799 |
10.647 |
0.870 |
Table 7.
Thermodynamic parameters for Pb2+ adsorption onto the biochars.
Table 7.
Thermodynamic parameters for Pb2+ adsorption onto the biochars.
| Biochar |
Temperature
(K) |
ΔG0
(kJ·mol-1) |
ΔH0
(kJ·mol-1) |
ΔS0
(J·mol-1·K-1) |
| LBC |
298 |
-4.680 |
7.194 |
39.6902 |
| 308 |
-4.930 |
| 318 |
-5.480 |
| XBC |
298 |
-4.072 |
7.035 |
36.9715 |
| 308 |
-4.159 |
| 318 |
-4.824 |
| YBC |
298 |
-4.403 |
2.486 |
23.0746 |
| 308 |
-4.592 |
| 318 |
-4.866 |
| SCB |
298 |
-4.340 |
6.284 |
35.527 |
| 308 |
-4.579 |
| 318 |
-5.055 |
| GBC |
298 |
-3.668 |
5.283 |
29.914 |
| 308 |
-3.850 |
| 318 |
-4.272 |
Table 8.
Thermodynamic parameters for Cd2+ adsorption onto the biochars.
Table 8.
Thermodynamic parameters for Cd2+ adsorption onto the biochars.
| Biochar |
Temperature
(K) |
ΔG0
(kJ·mol-1) |
ΔH0
(kJ·mol-1) |
ΔS0
(J·mol-1·K-1) |
| LBC |
298 |
-7.333 |
6.926 |
47.728 |
| 308 |
-7.738 |
| 318 |
-8.292 |
| XBC |
298 |
-6.748 |
8.050 |
49.029 |
| 308 |
-6.685 |
| 318 |
-7.754 |
| YBC |
298 |
-7.279 |
8.345 |
52.123 |
| 308 |
-7.553 |
| 318 |
-8.334 |
| SCB |
298 |
-6.644 |
11.391 |
60.399 |
| 308 |
-7.170 |
| 318 |
-7.856 |
| GBC |
298 |
-6.370 |
5.769 |
40.424 |
| 308 |
-6.517 |
| 318 |
-7.191 |
|
Disclaimer/Publisher’s Note: The statements, opinions and data contained in all publications are solely those of the individual author(s) and contributor(s) and not of MDPI and/or the editor(s). MDPI and/or the editor(s) disclaim responsibility for any injury to people or property resulting from any ideas, methods, instructions or products referred to in the content. |
© 2023 by the authors. Licensee MDPI, Basel, Switzerland. This article is an open access article distributed under the terms and conditions of the Creative Commons Attribution (CC BY) license (http://creativecommons.org/licenses/by/4.0/).
