Submitted:
12 April 2023
Posted:
13 April 2023
You are already at the latest version
Abstract
Keywords:
1. Introduction
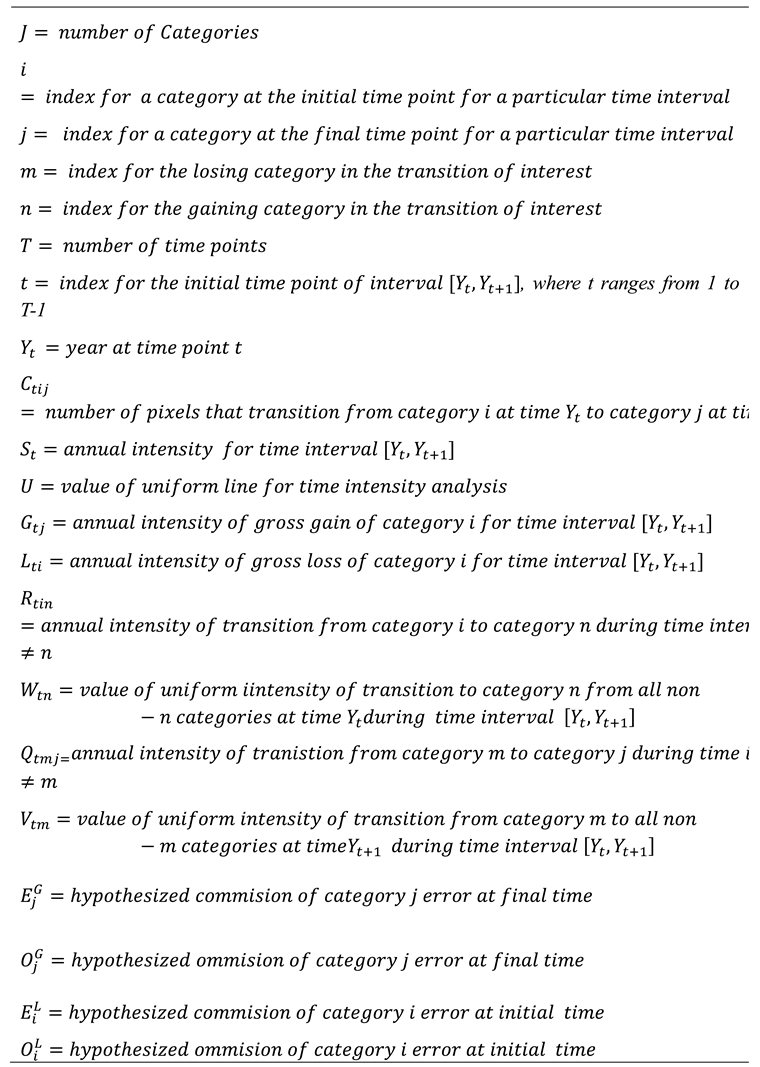
- 1)
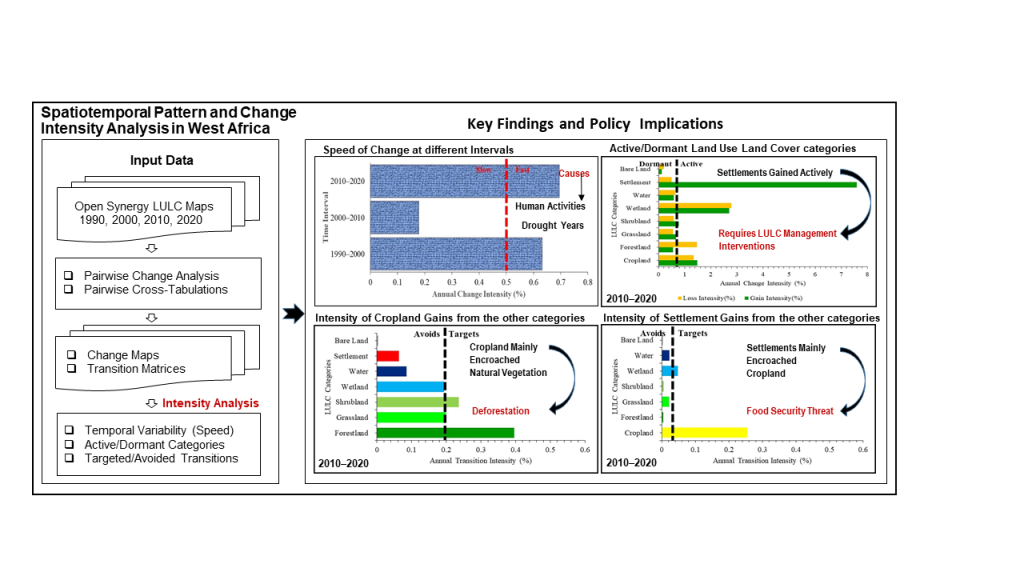
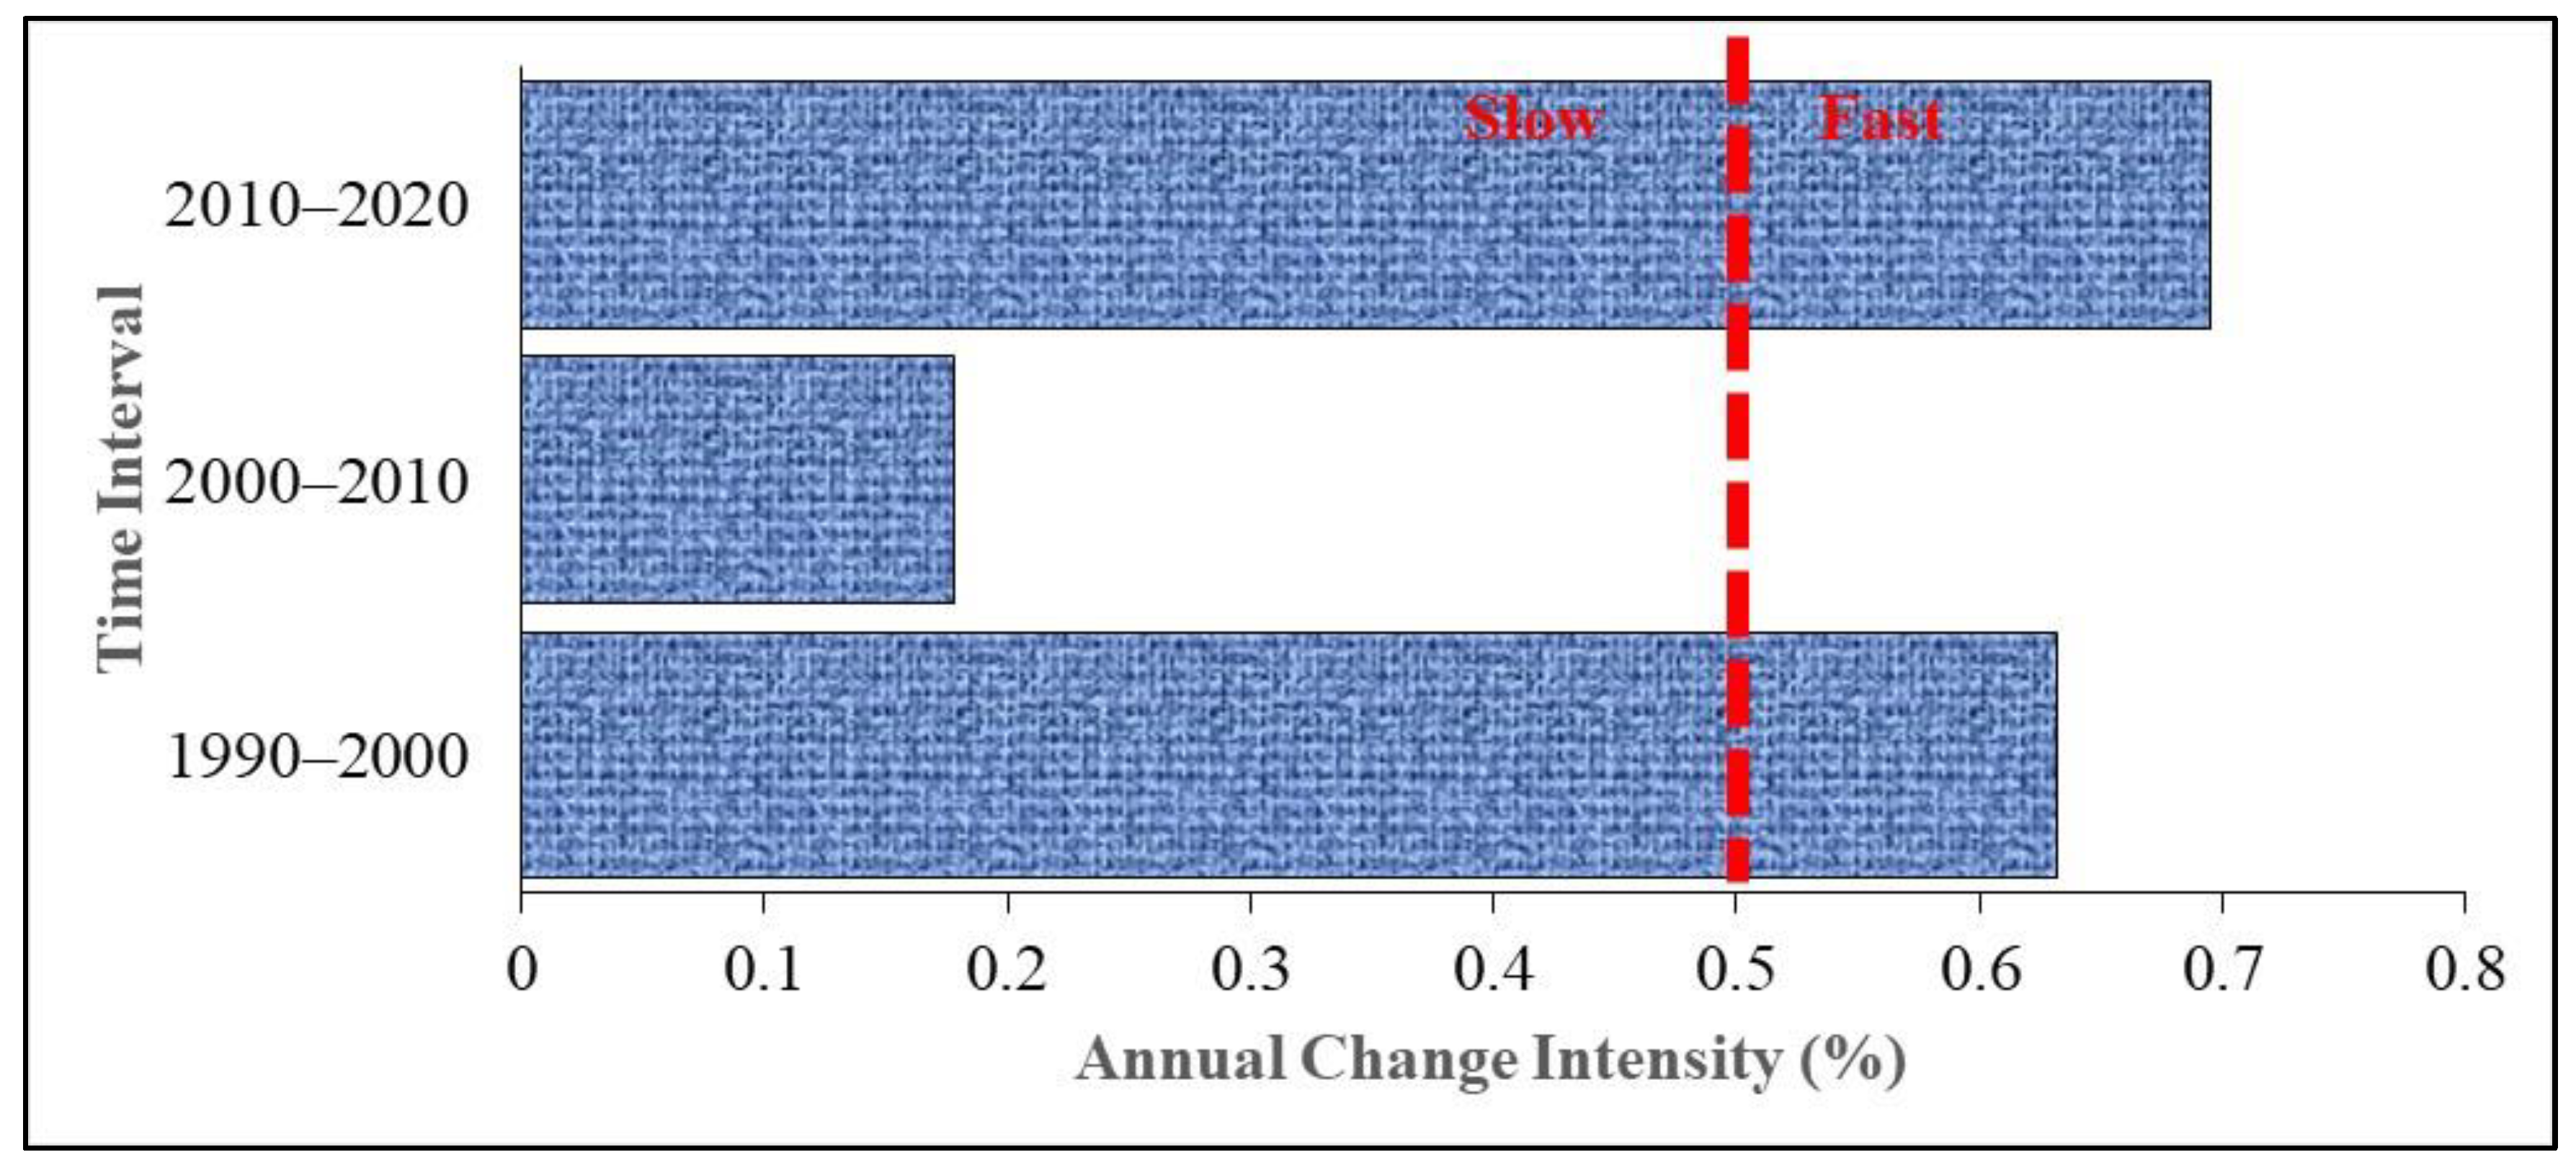
- Identify the time intervals with the slowest and fastest annual rate of change.
- 2)
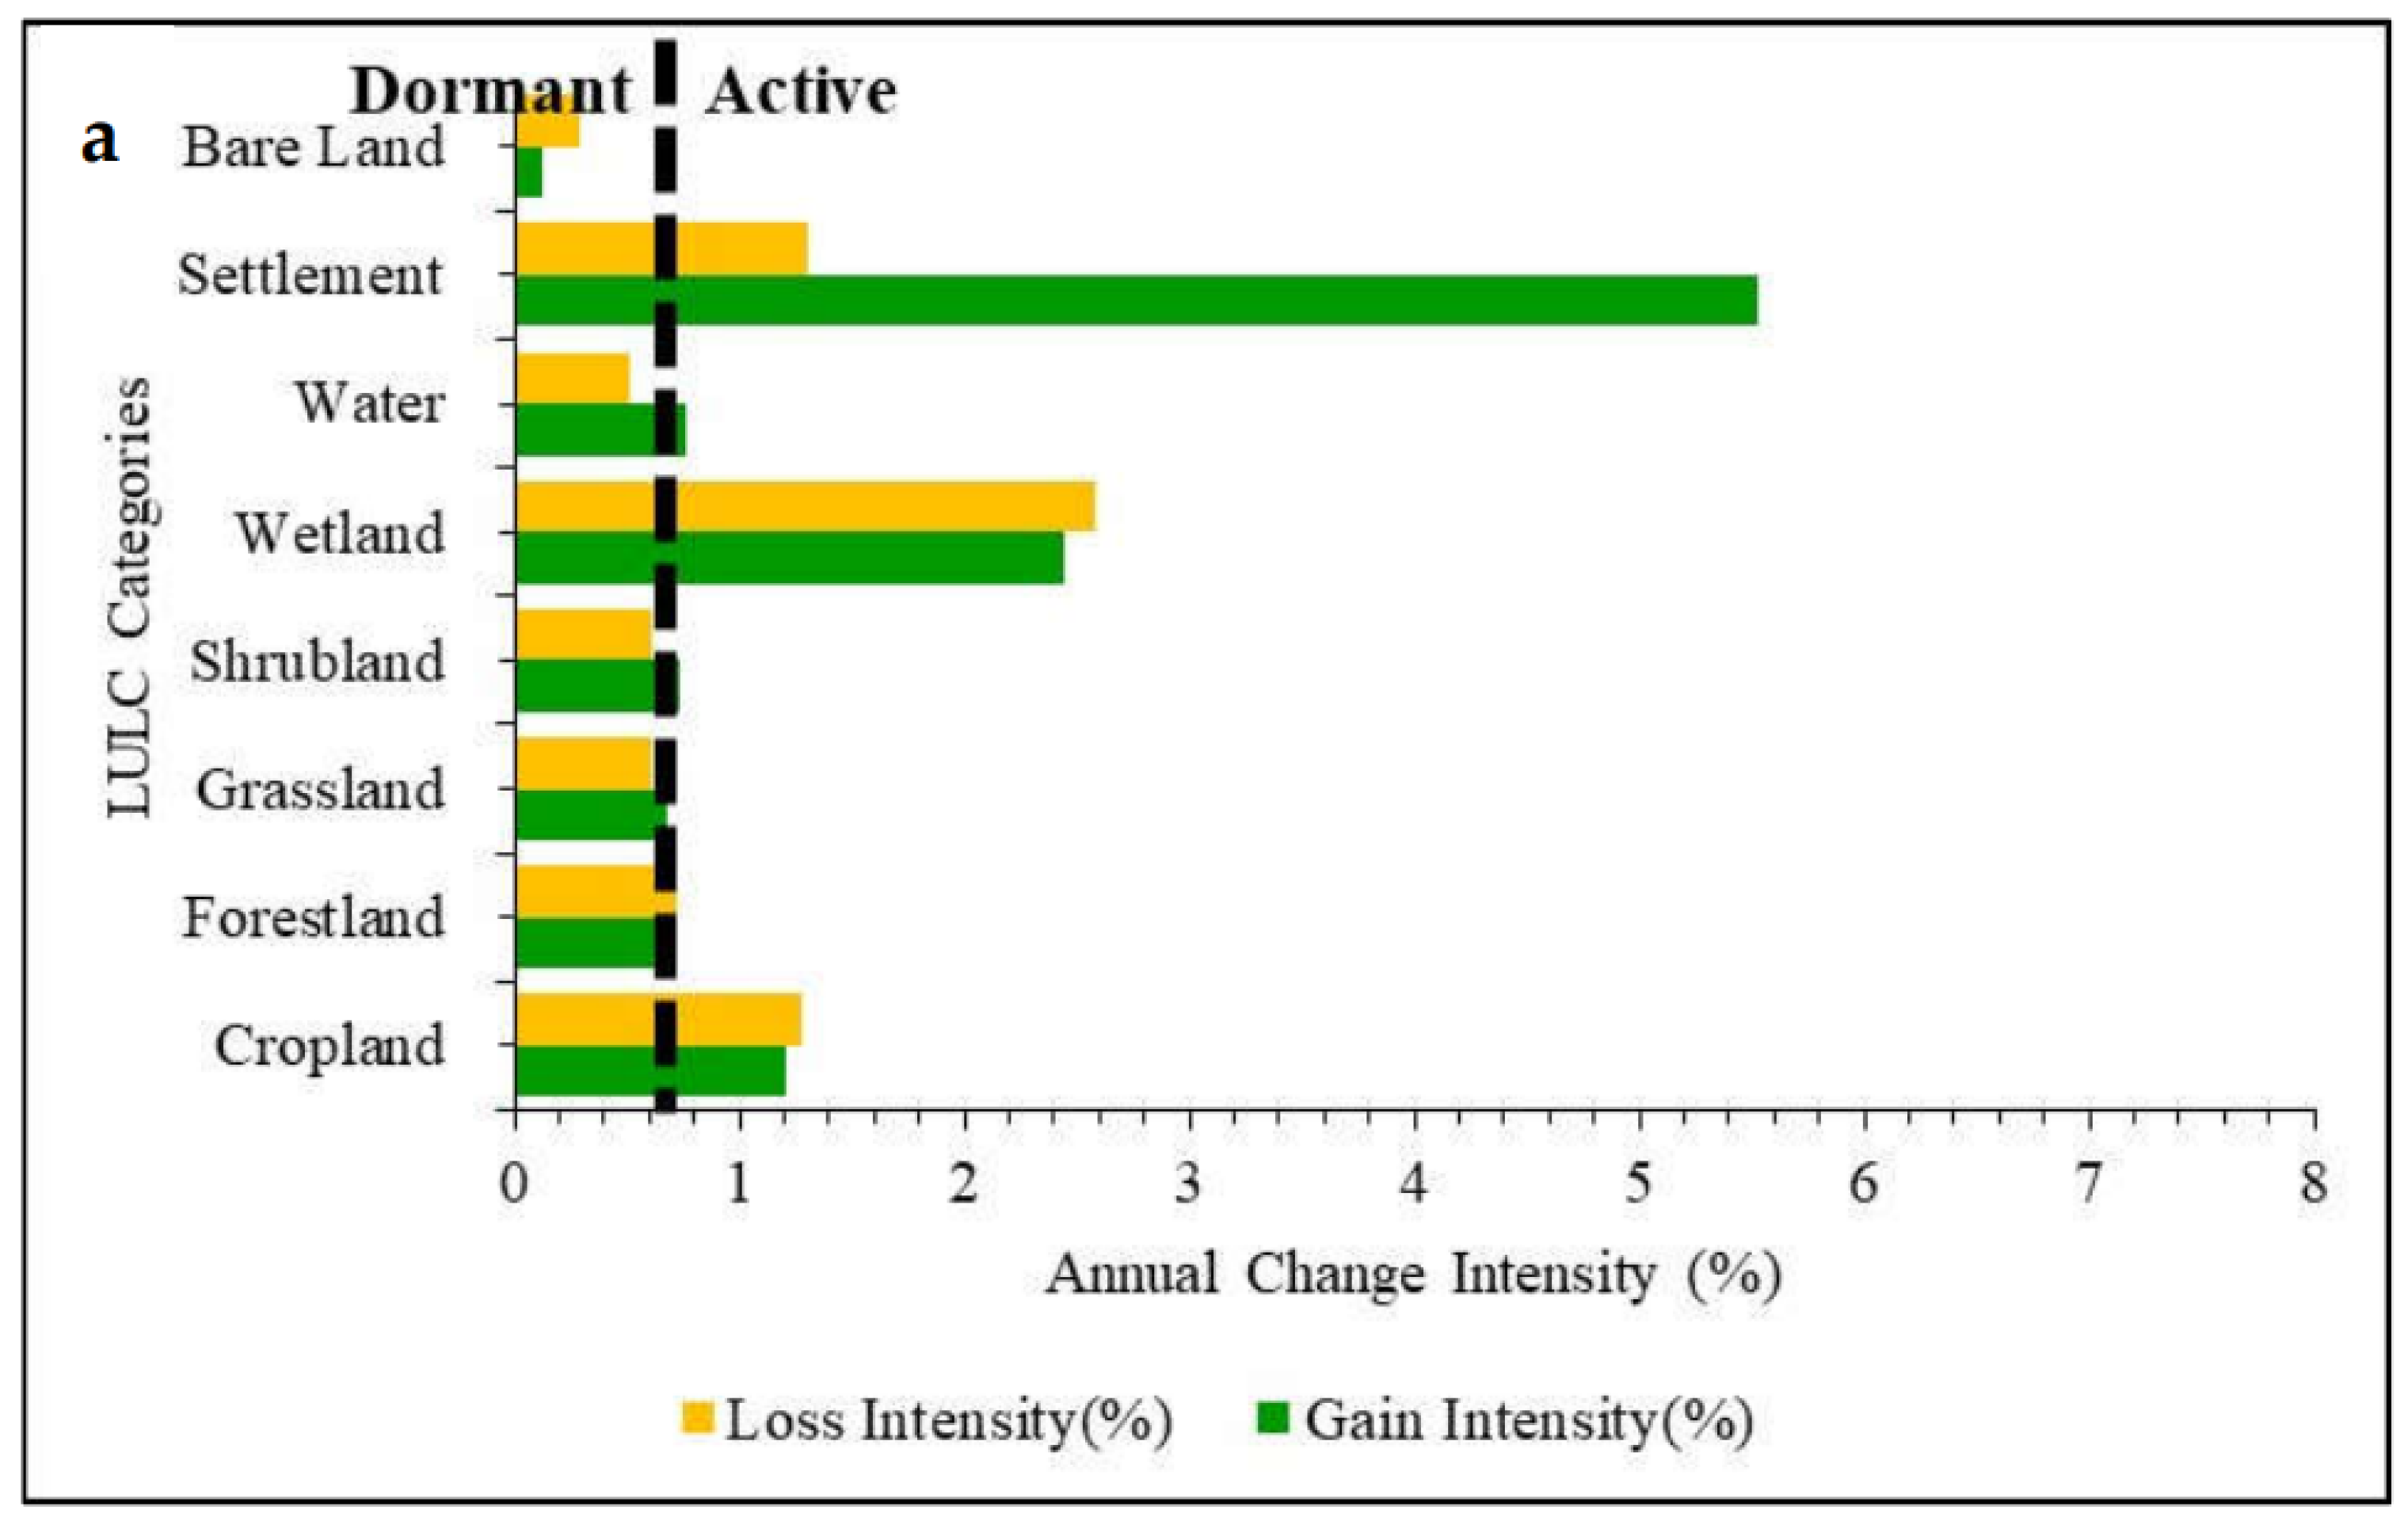
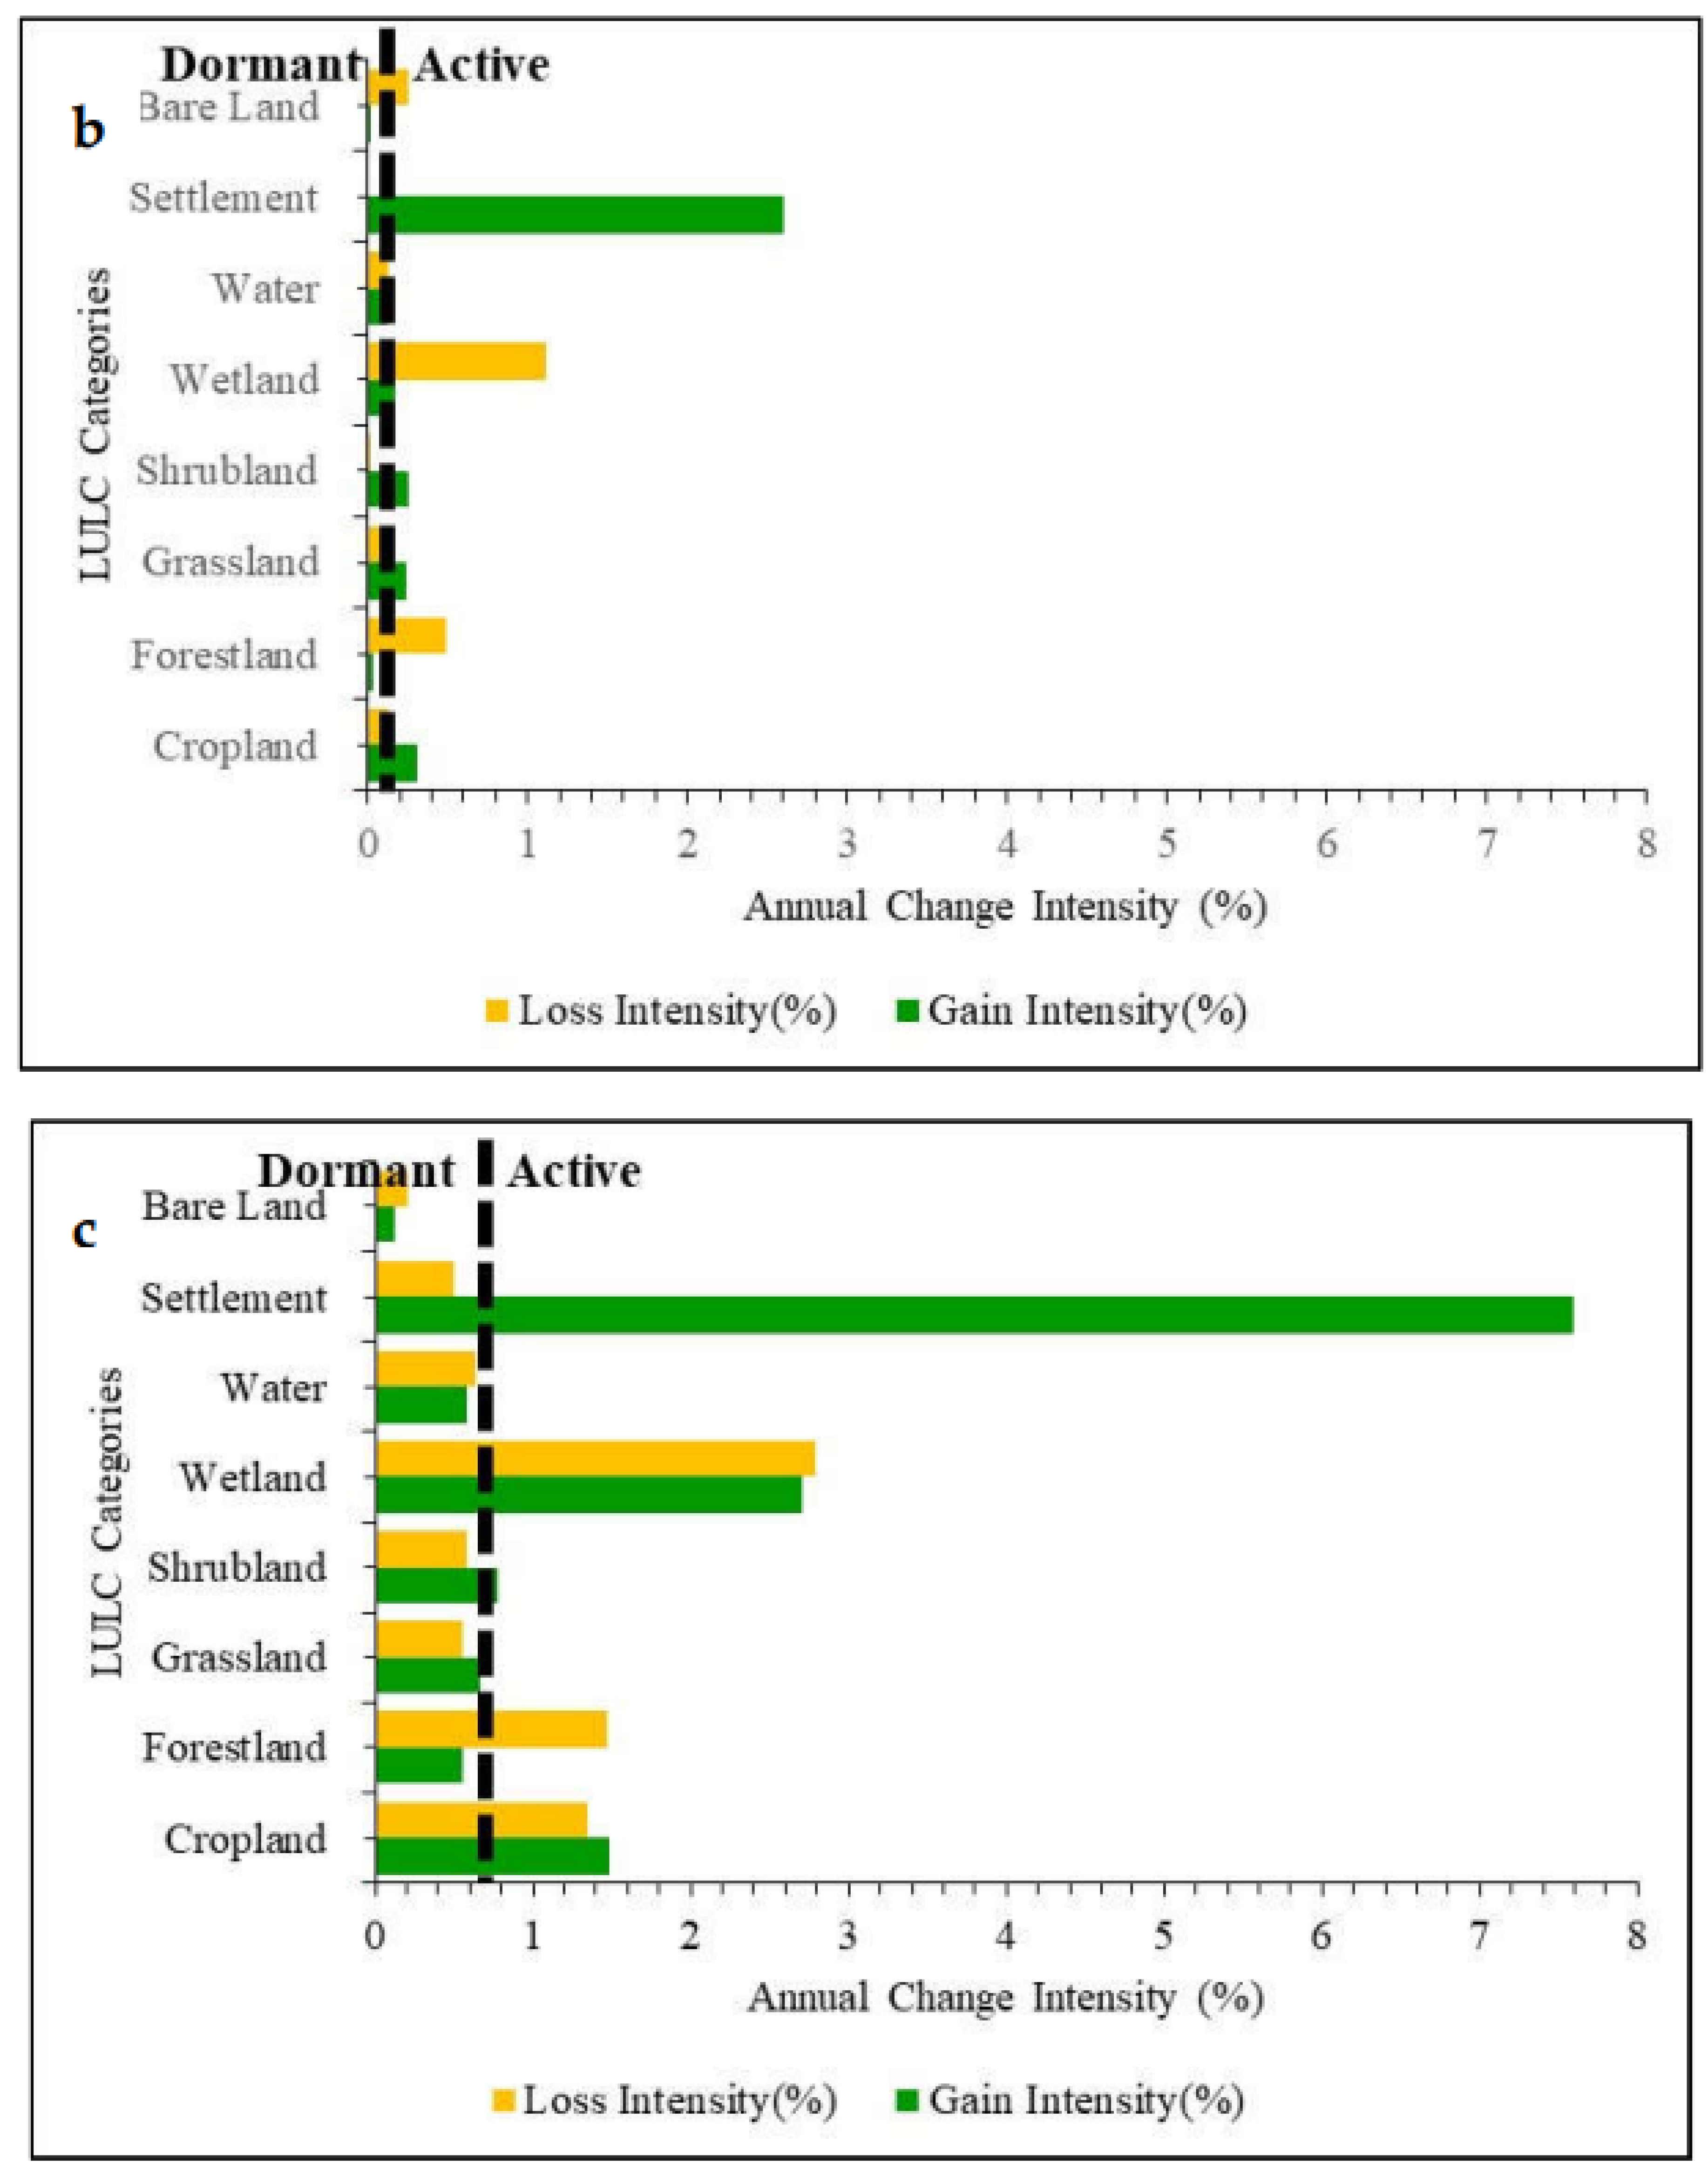
- Identify the LULC categories that were relatively dormant or active in a given interval, i.e., to examine the LULC categories that gained/lost more or less than expected.
- 3)
- Examine the LULC categories that were avoided or targeted by a given LULC category for a transition in a given interval.
2. Materials and Methods
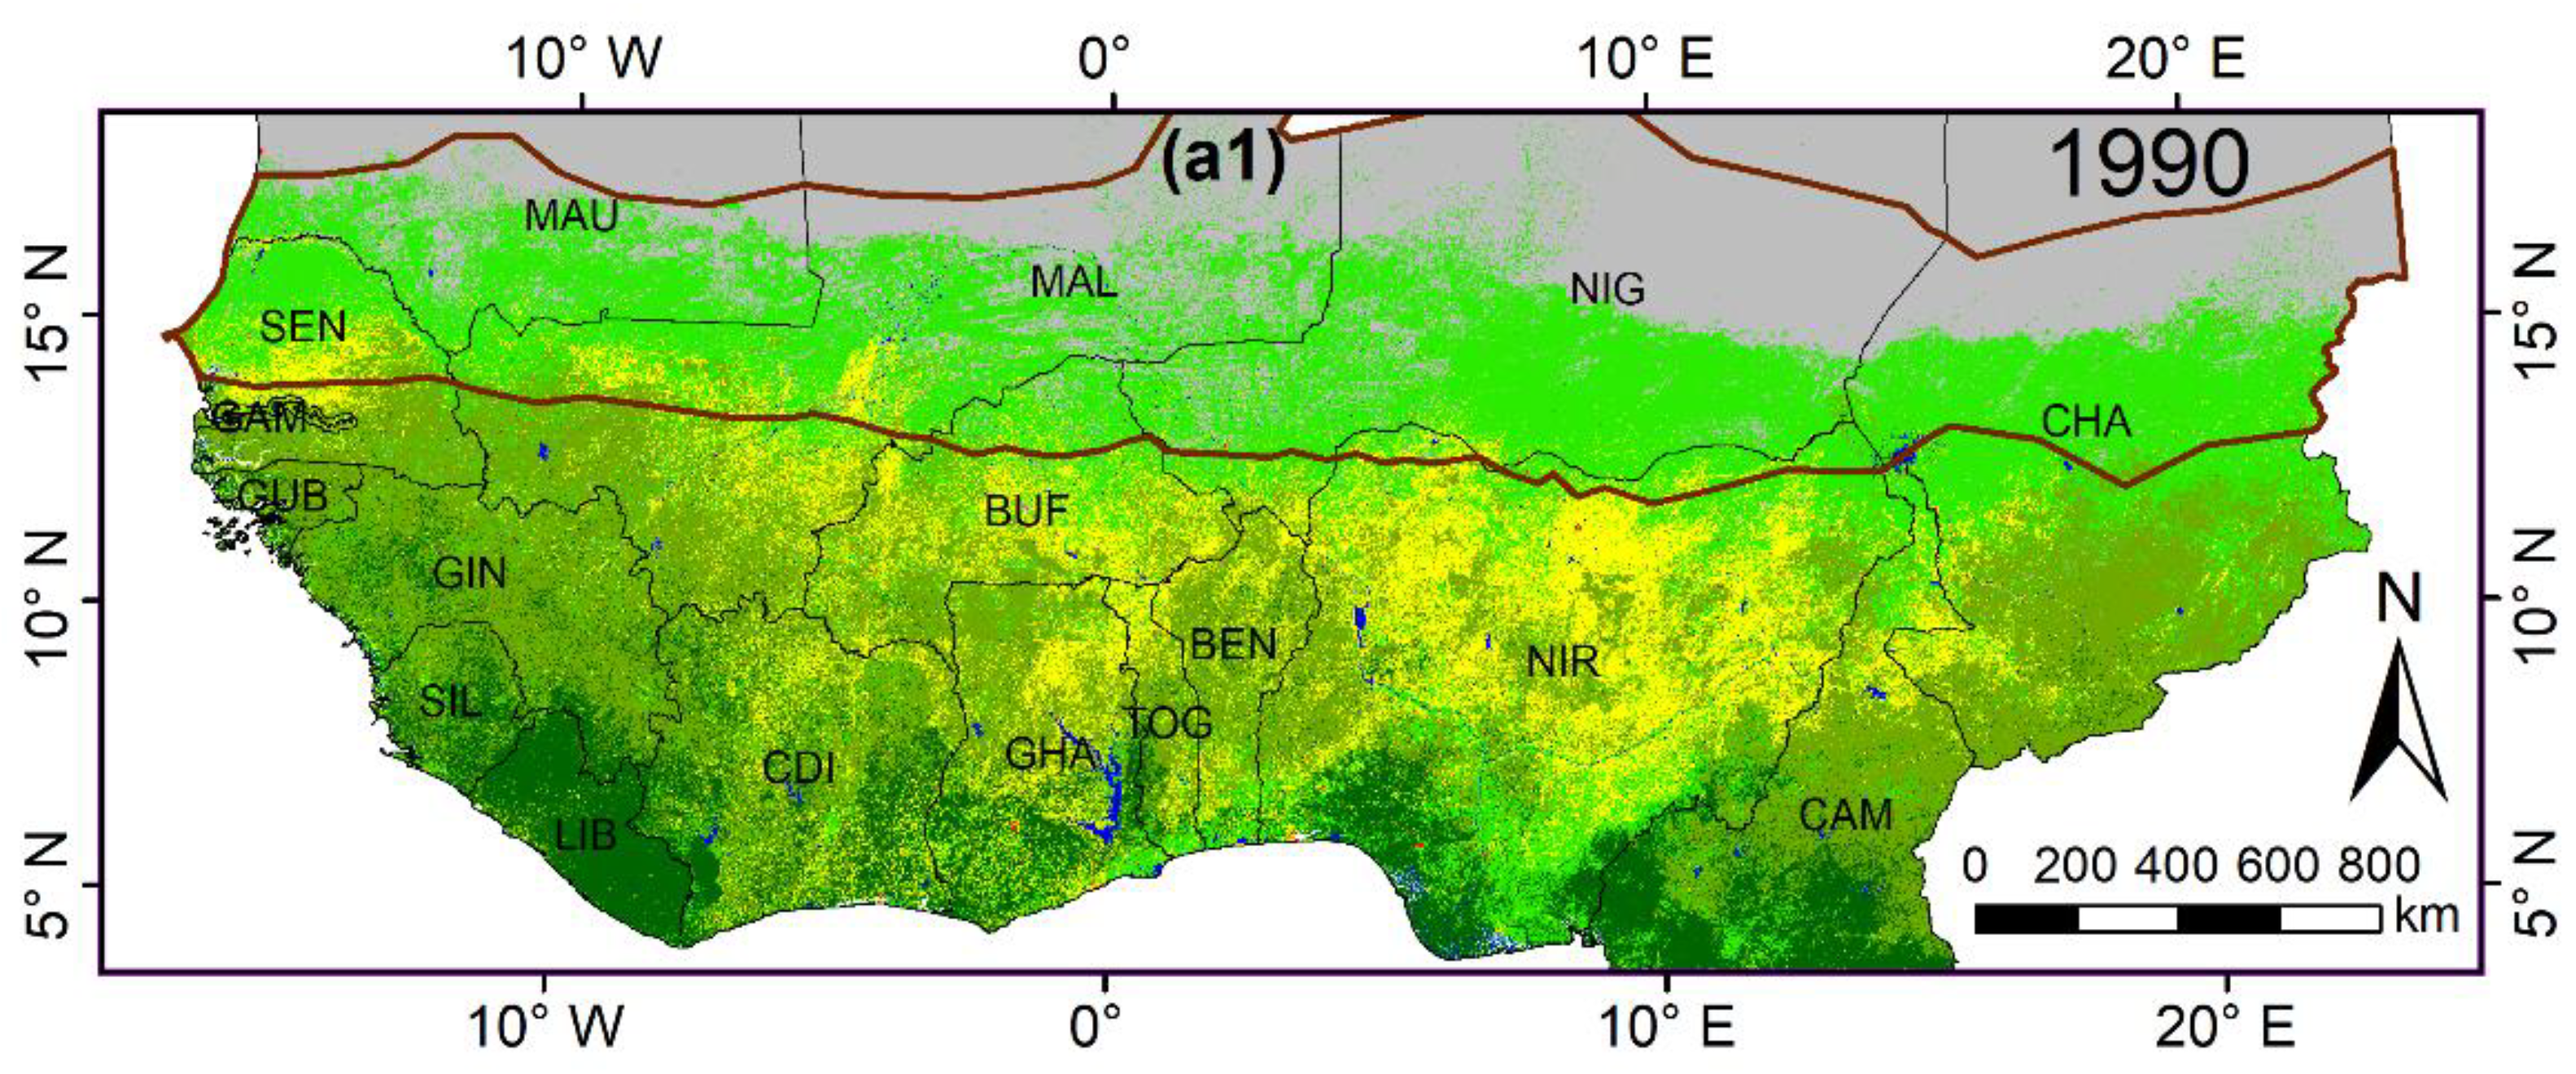
2.1. Study Area
2.2. Datasets
2.3. Re-classification of the Multi-Source LULC Data
2.3.1. Land Use Land Cover Change Detection
2.3.2. Development of a new Land Cover Classification
2.3.3. Data Aggregation and Mosaicking
2.4.Validation of the Land Use/ Land Cover Datasets
2.5. Development of a Transition Matrix
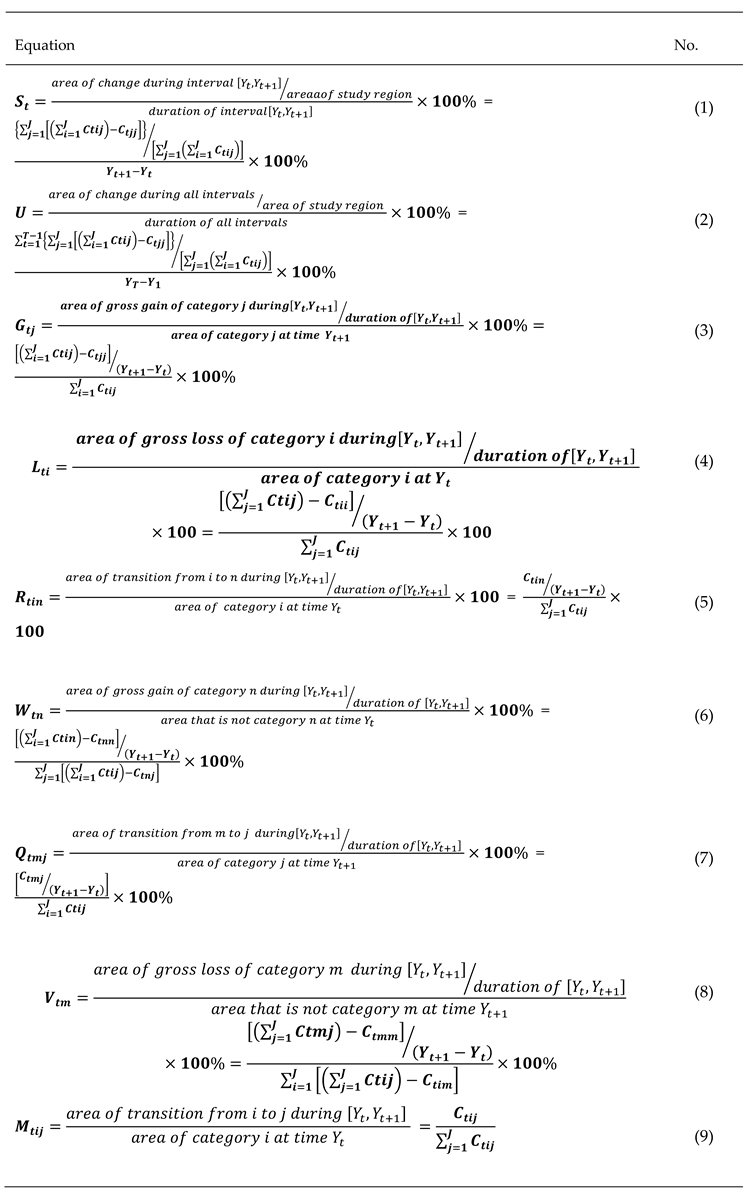
2.6. The intensity Analysis Framework
2.6.1. Identification of the time intervals with the slowest and fastest annual rate of change
2.6.2. Identification of the LULC categories that were relatively dormant or active
2.6.3. Examination of the LULC categories that were avoided or targeted for transitions
3. Results
3.1. Identification of the time intervals with the slowest and fastest annual rate of change
3.2. Identification of the LULC categories that were relatively dormant or active in a given interval
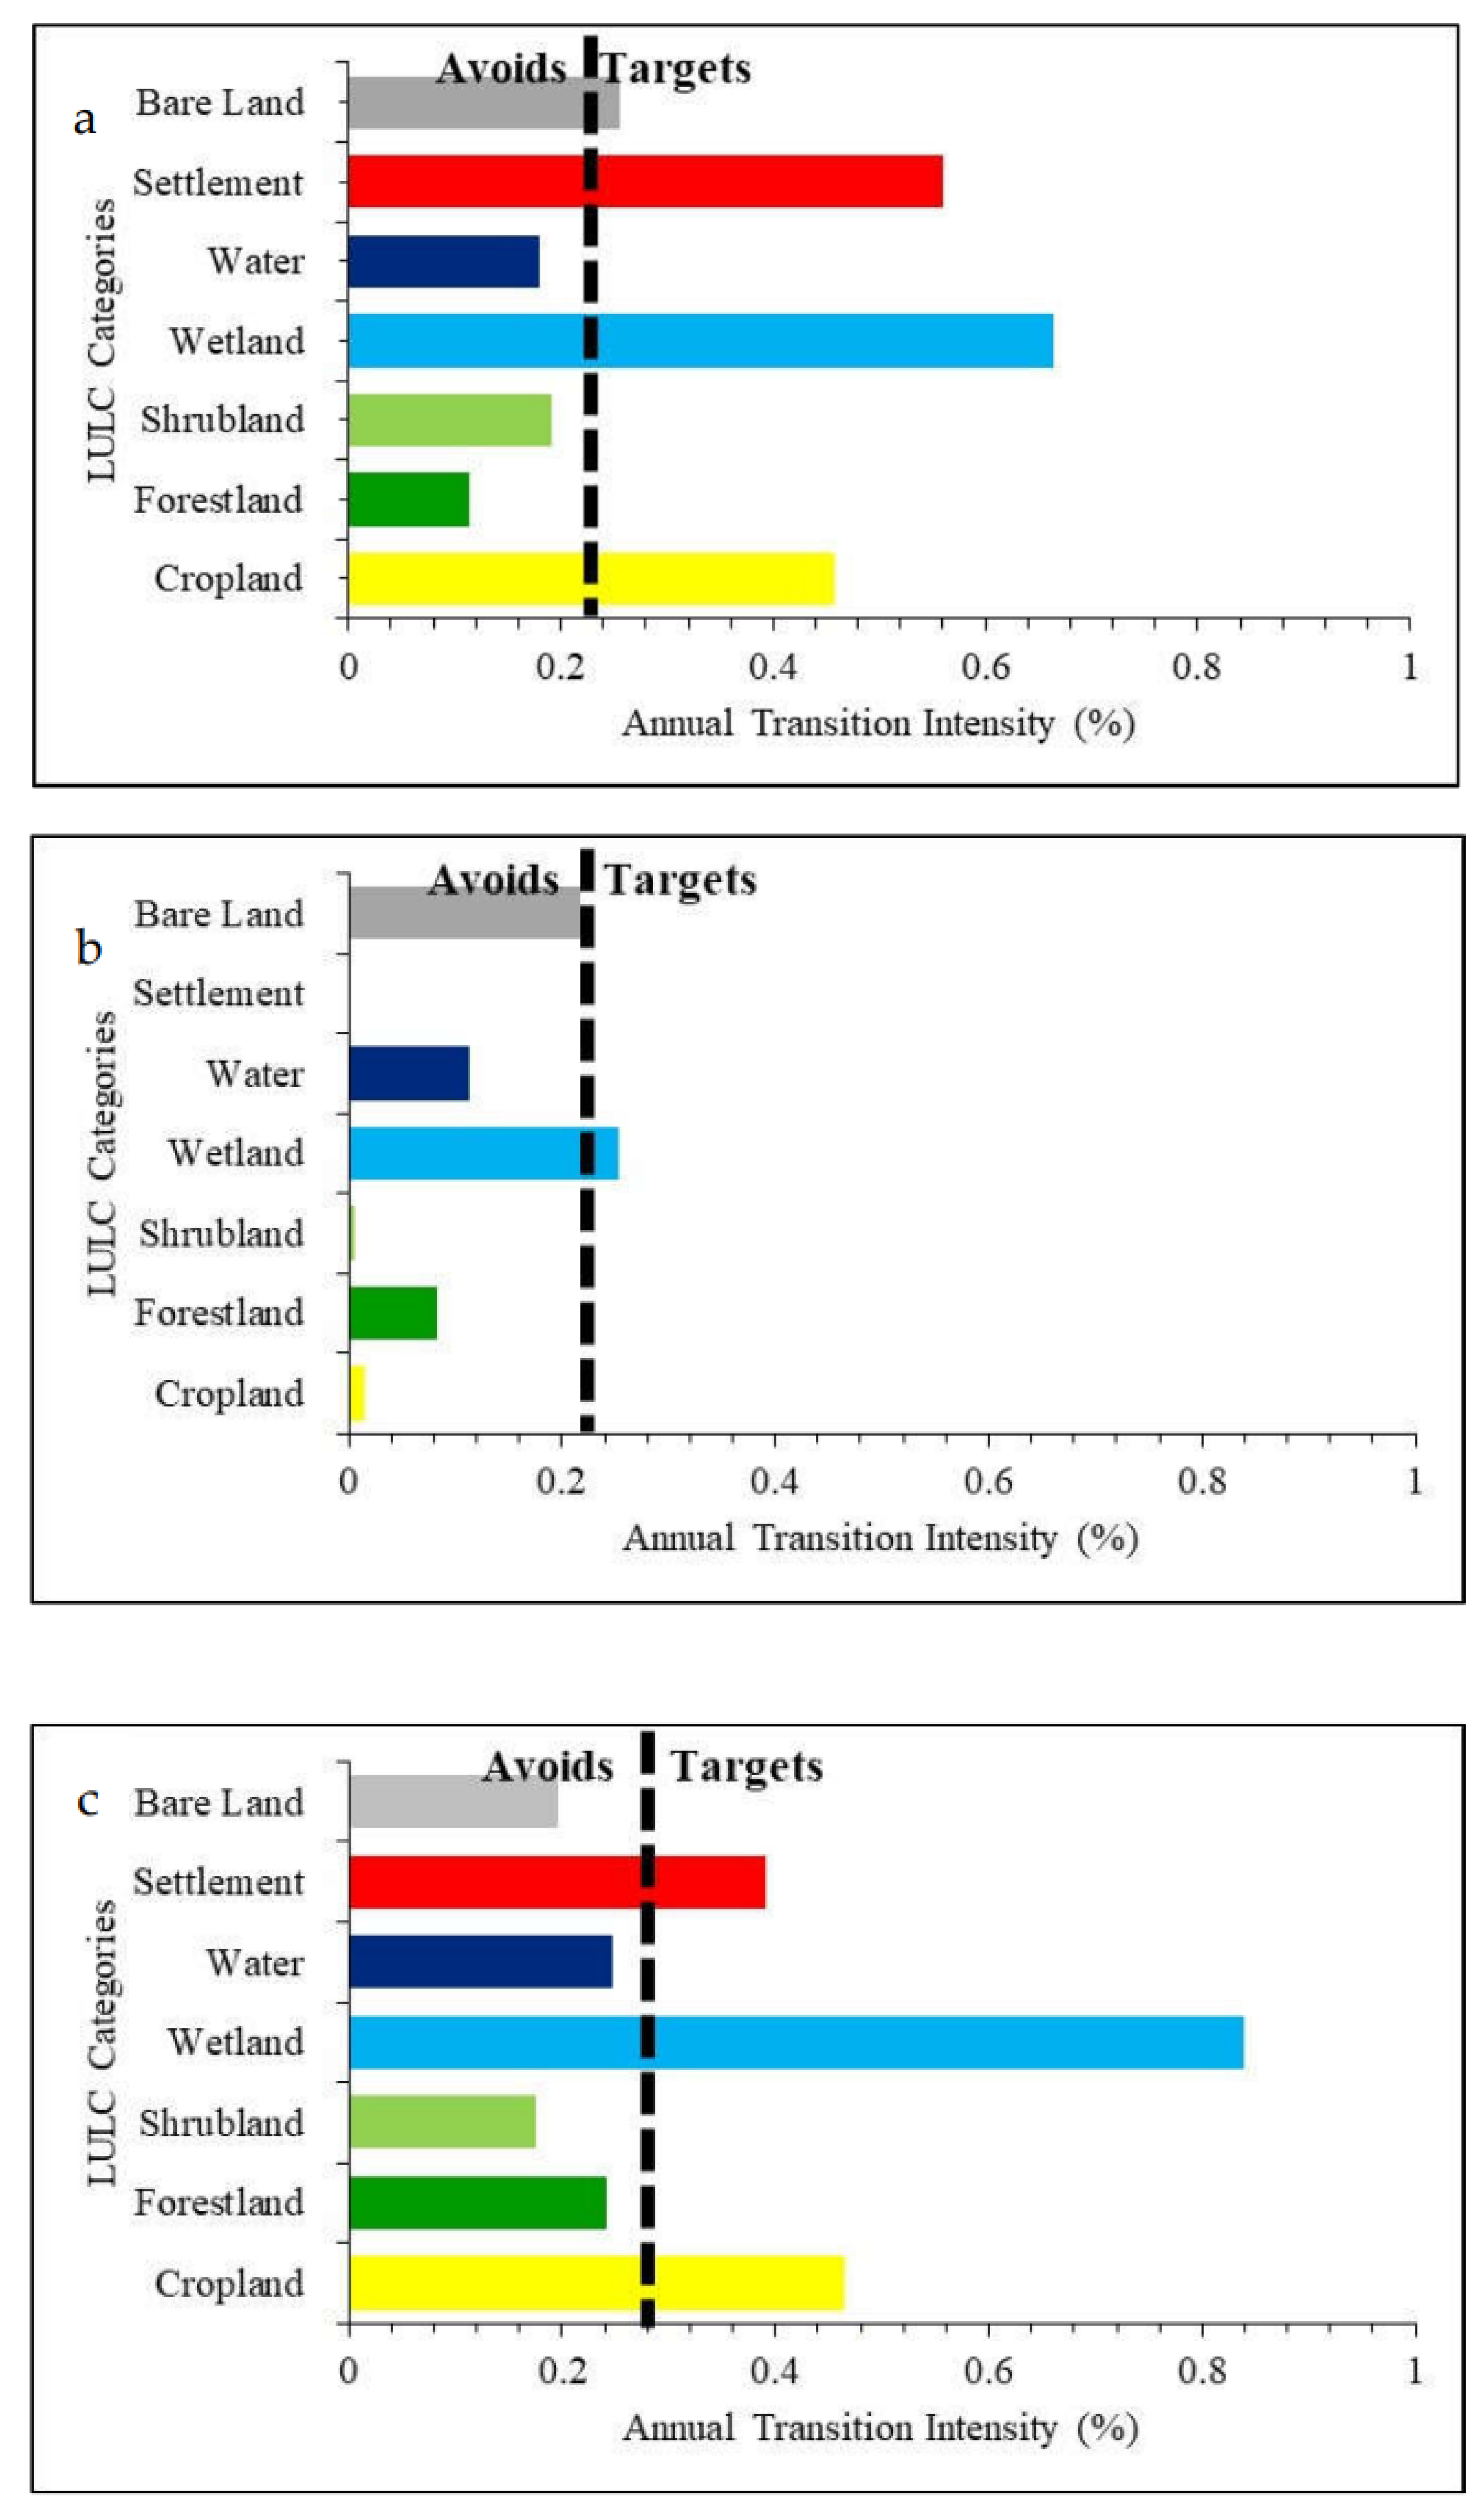
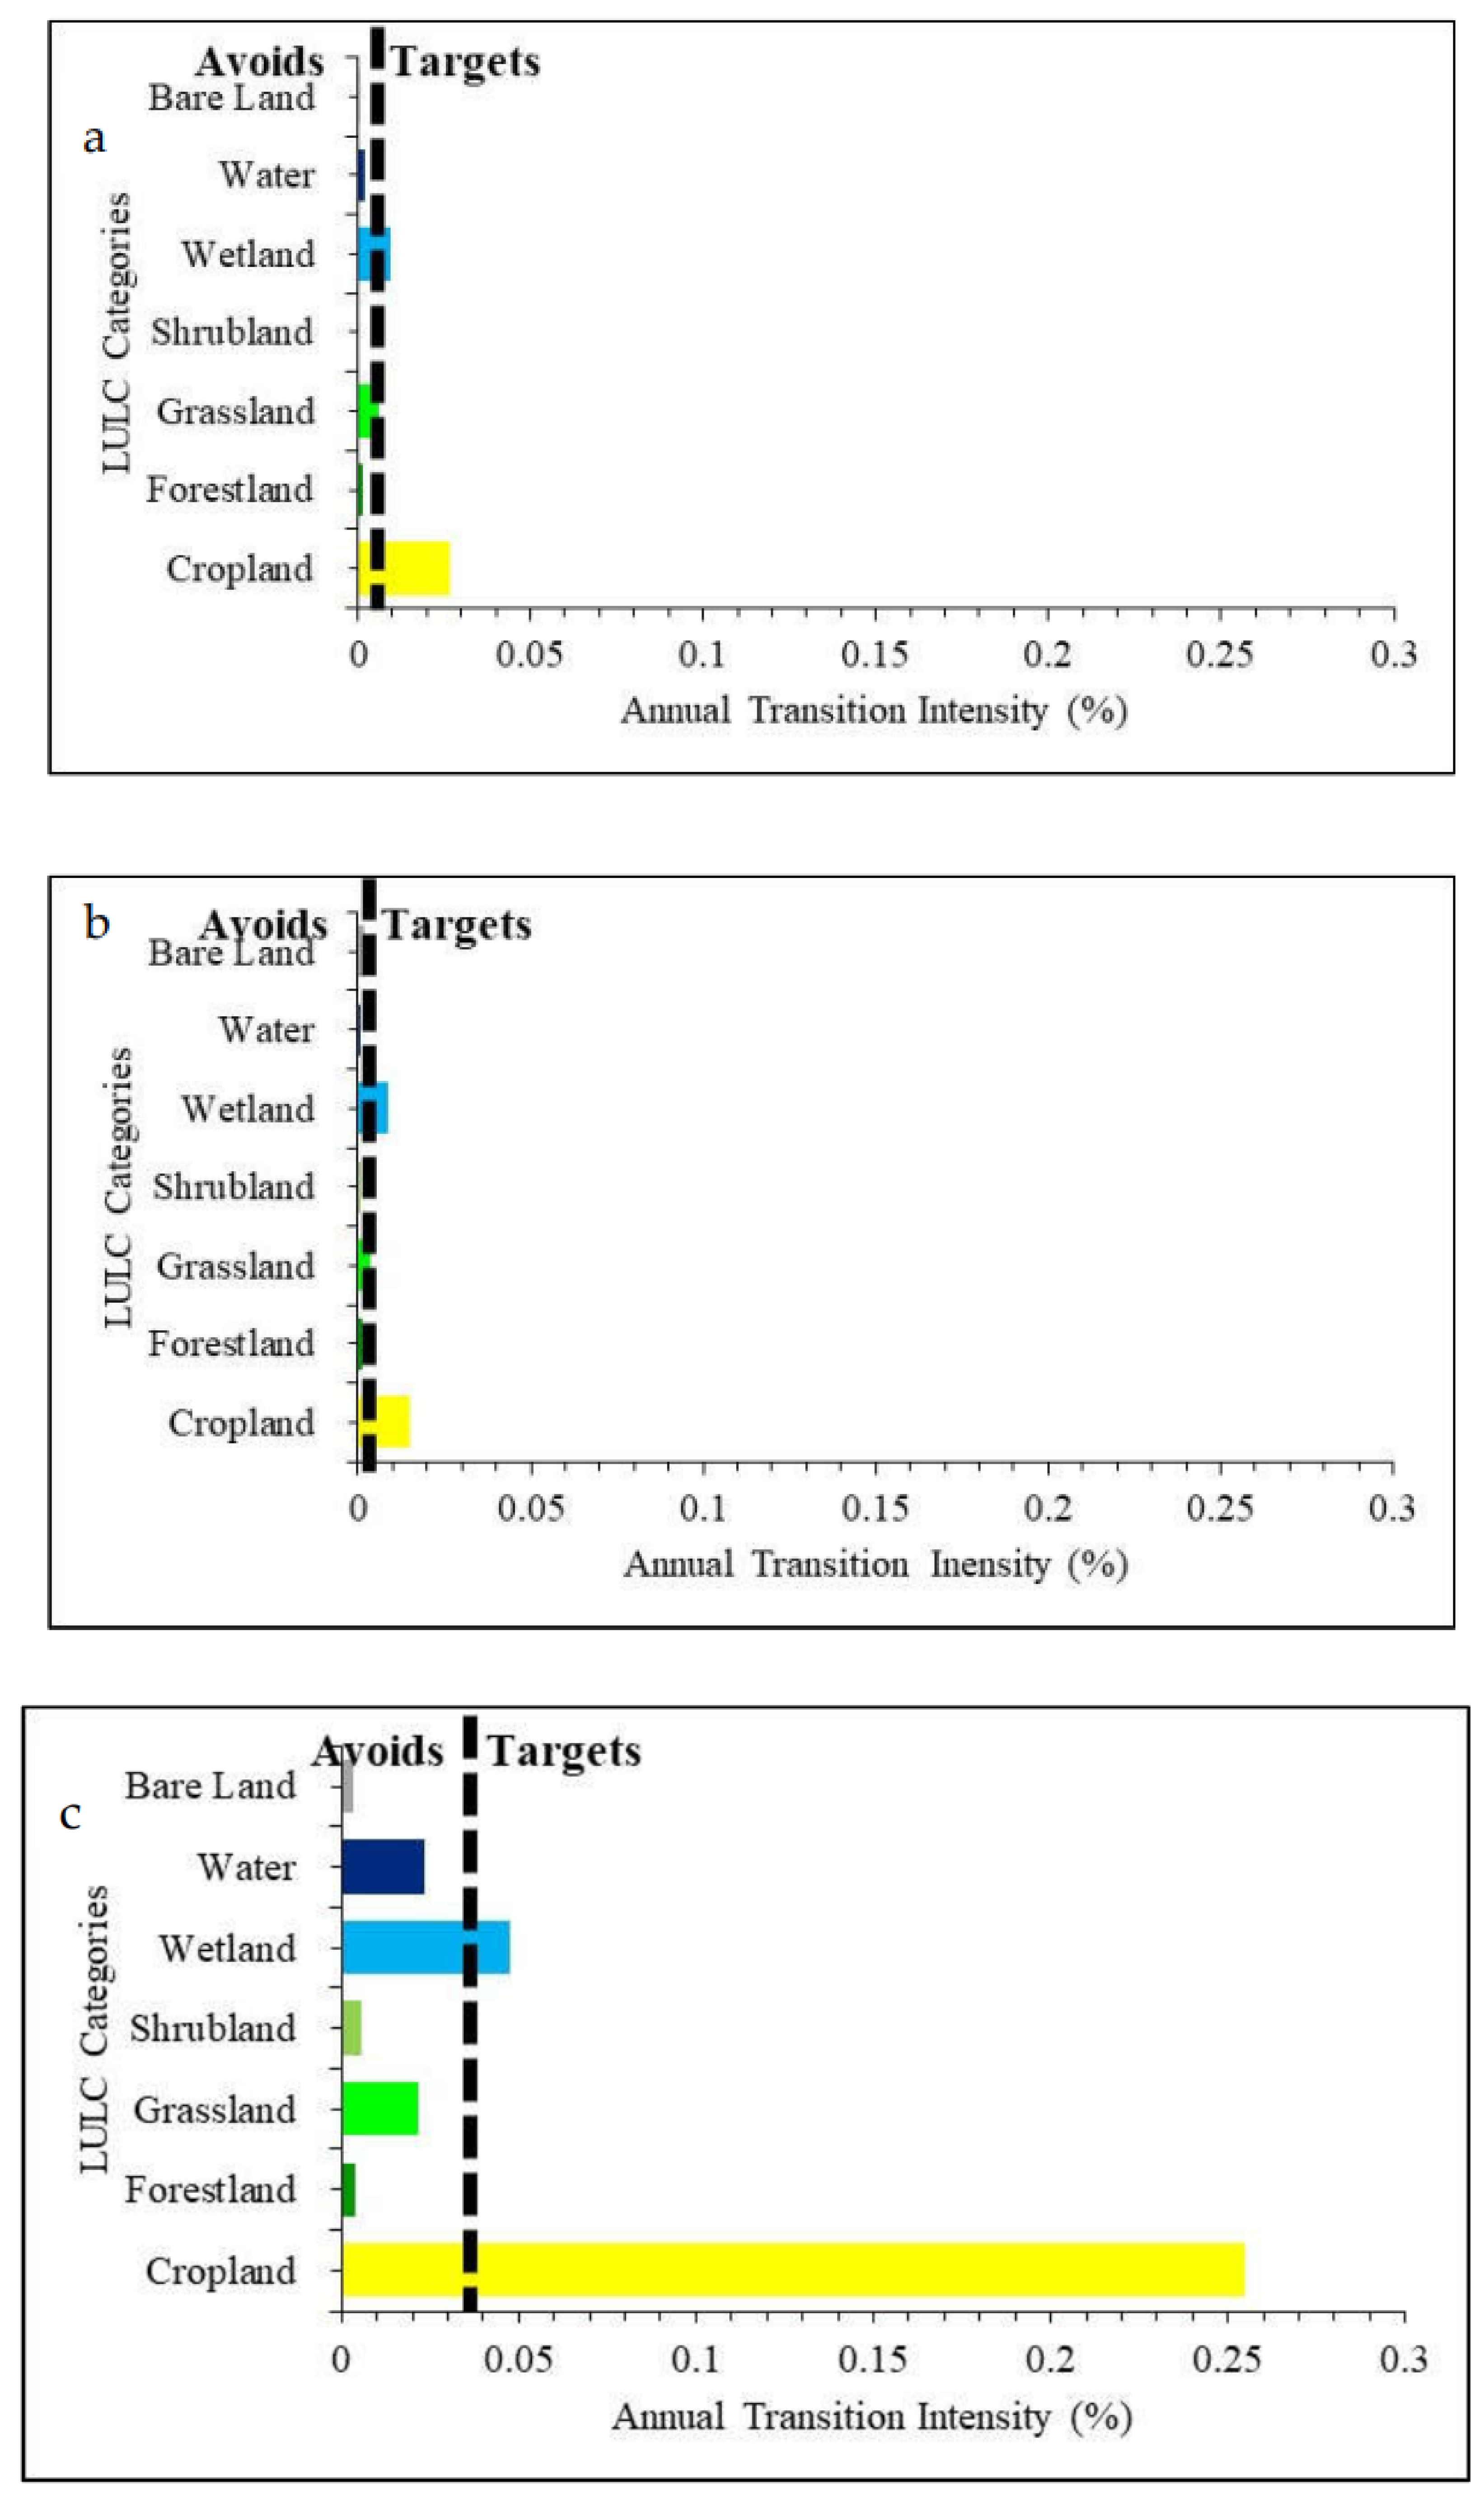
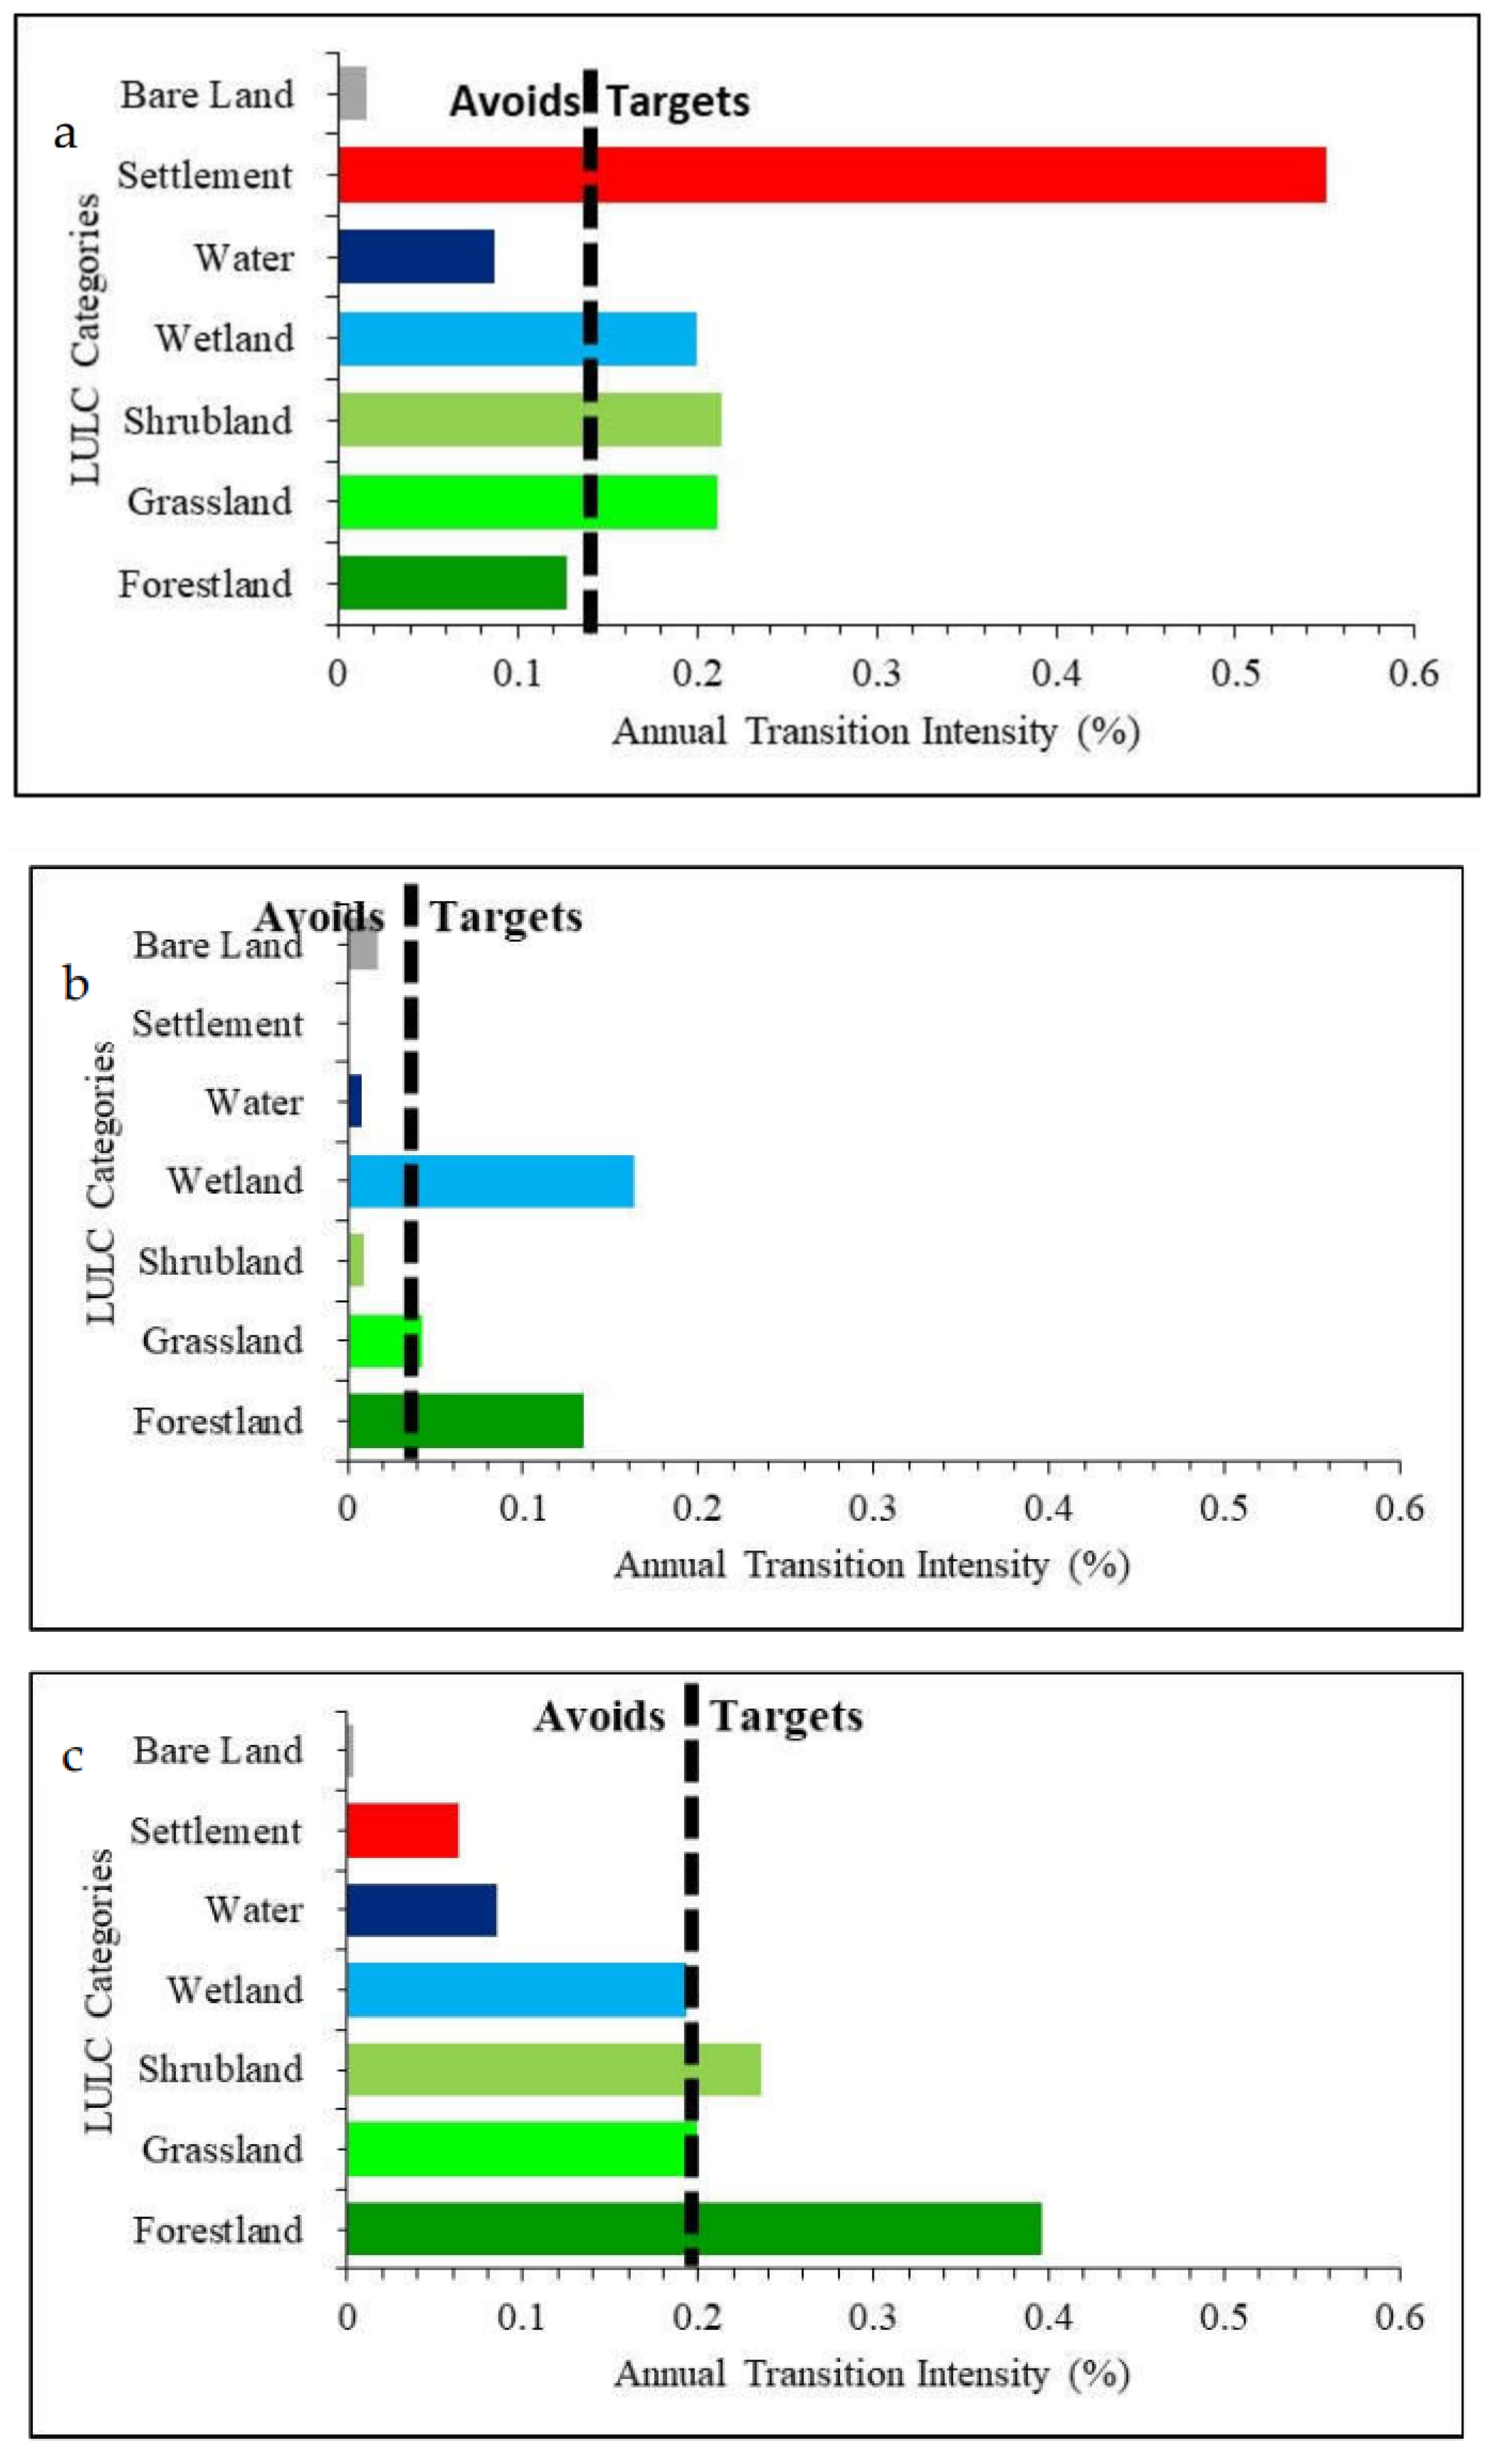
3.3. Examination of the LULC categories that were avoided or targeted for a transitions
3.3.1. Shrubland, Grassland, Cropland and Settlement Gains
3.3.2. Forestland, Wetland, Water Bodies and Bare land Losses
4. Discussion
4.1. Identification the time intervals with the slowest and fastest annual rate of change
4.2. Identification of the LULC categories that were relatively dormant or active in a given interval
4.3. Examination of the LULC categories that were avoided or targeted for transitions
5. Conclusion
Author Contributions
Funding
Data Availability Statement
Acknowledgments
Conflicts of Interest
References
- Lambin, E.F.; Geist, H.J.; Lepers, E. Dynamics of land-use and land-cover change in tropical regions. Annu. Rev. Environ. Resour. 2003, 28, 206–216. [CrossRef]
- Turner, A.B.L.; Meyer, W.B.; Skole, D.L. Global Land-Use/Land-Change: Towards an Integrated Study. Integr. Earth Syst. Sci. 2009, 23, 91–95.
- Ehlers, E.; Krafft, T. Earth System Science in the Anthropocene; Ehlers, E., Krafft, T., Eds.; Springer: Berlin Heidelberg, Germany, 2016; Vol. 53; ISBN 9788578110796.
- Steffen, W.; Sanderson, A.; Tyson, P.; Jäger, J.; Matson, P.; Moore III, B.; Oldfield, F.; Oldfield, F.; Department of Geography, University of Liverpool, UK Richardson, K.; Oldfield, F.; et al. Global Change and the Earth System: a Plane under Pressure; Springer: Heidelberg, 2005; ISBN 9783540265948.
- Nicholson, S.E.; Tucker, C.J.; Ba, M.B. Desertification, drought, and surface vegetation: An example from the West African sahel. Bull. Am. Meteorol. Soc. 1998.
- Hulme, M. Climatic perspectives on Sahelian desiccation : 1973 1998. Glob. Environ. Chang. 2001, 11, 19–29.
- Tucker, C.J.; Dregne, H.E.; Newcomb, W.W. Expansion and contraction of the Sahara Desert from 1980 to 1990. Science (80-. ). 1991, 253 (5017), 299−301.
- Nicholson, S.E. Land surface-atmosphere interaction: physical processes and surface changes and their impact. Prog. Phys. Geogr. 1988, 12, 36–65.
- Aldwaik, S.Z.; Pontius, R.G. Intensity analysis to unify measurements of size and stationarity of land changes by interval, category, and transition. Landsc. Urban Plan. 2012, 106, 103–114. [CrossRef]
- Versace, V.L.; Ierodiaconou, D.; Stagnitti, F.; Hamilton, A.J. Appraisal of random and systematic land cover transitions for regional water balance and revegetation strategies. Agric. Ecosyst. Envrionment 2008, 123, 328–336. [CrossRef]
- Braimoh, A.K. Random and systematic land-cover transitions in northern Ghana. Agric. Ecosyst. Environ. 2006, 113, 254–263. [CrossRef]
- Pontius Jr., R.G.; Shusas, E.; McEachern, M. Detecting important categorical land changes while accounting for persistence. Agric. Environ. 2004, 101, 251–268. [CrossRef]
- Pontius Jr., R.G. Component intensities to relate difference by category with difference overall. Int J Appl Earth Obs Geoinf. 2019, 77, 94–99. [CrossRef]
- Huang, B.; Huang, J.; Gilmore, R.; Jr, P.; Tu, Z. Comparison of Intensity Analysis and the land use dynamic degrees to measure land changes outside versus inside the coastal zone of Longhai , China. Ecol. Indic. 2018, 89, 336–347. [CrossRef]
- Aldwaik, S.Z.; Pontius Jr., R.G. Map errors that could account for deviations from a uniform intensity of land change. Int. J. Geogr. Inf. Sci. 2013, 27, 1717–1739. [CrossRef]
- Quan, B.; Pontius Jr., R.G.; Song, H.; Quan, B. Intensity Analysis to communicate land change during three time intervals in two regions of Quanzhou City , China two regions of Quanzhou City , China. GIScience Remote Sens. 2019, 1–16. [CrossRef]
- Akinyemi, F.O.; Pontius Jr., R.G.; Braimoh, A.K. Land change dynamics : insights from Intensity Analysis applied to an African emerging city Land change dynamics : insights from Intensity Analysis. J. Spat. Sci. 2017, 8596, 1–15. [CrossRef]
- Gyöngyi, O.; Gilmore, R.; Jr, P.; Kumar, S.; Szabó, S. Intensity Analysis and the Figure of Merit ’ s components for assessment of a Cellular Automata – Markov simulation model. Ecol. Indic. 2019, 101, 933–942. [CrossRef]
- Huang, J.; Gilmore, R.; Jr, P.; Li, Q.; Zhang, Y. Use of intensity analysis to link patterns with processes of land change from 1986 to 2007 in a coastal watershed of southeast China. Appl. Geogr. 2012, 34, 371–384. [CrossRef]
- Pontius, R.G.; Gao, Y.; Giner, N.M.; Kohyama, T.; Osaki, M.; Hirose, K. Design and Interpretation of Intensity Analysis Illustrated by Land Change in Central Kalimantan, Indonesia. 2013, 351–369. [CrossRef]
- Akinyemi, F.O.; Ikanyeng, M.; Muro, J. Land cover change effects on land surface temperature trends in an African urbanizing dryland region. City Environ. Interact. 2019, 4, 100029. [CrossRef]
- Asenso Barnieh, B.; Jia, L.; Menenti, M.; Zhou, J.; Zeng, Y. Mapping Land Use Land Cover Transitions at Different Spatiotemporal Scales in West Africa. Su 2020, 12, 8565. [CrossRef]
- Vittek, M.; Brink, A.; Donnay, F.; Simonetti, D.; Desclé, B. Land Cover Change Monitoring Using Landsat MSS/TM Satellite Image Data over West Africa between 1975 and 1990. Remote Sens. 2014, 6, 658–676. [CrossRef]
- Brink, A.B.; Eva, H.D. Monitoring 25 years of land cover change dynamics in Africa : A sample based remote sensing approach. Appl. Geogr. 2009, 29, 501–512. [CrossRef]
- Han, J.H.; Cao, X., Y.; Imura, H. Evaluating land-use change in rapidly urbanizing China: Case study of Shanghai. J. Urban Plan. Dev. 2009, 135, 166–171.
- Gergel, S.E.; Turner, M.G. Learning landscape ecology: A practical guide to concepts and techniques.; Springer US: New York, NY, 2000;
- Romero-Ruiz, M.H.; Flantua, S.G.A.; Tansey, K.; Berrio, J.C. Landscape transformations in savannas of northern South America: Land use/cover changes since 1987 in the Llanos Orientales of Colombia. Appl. Geogr. 2011, 32, 766–776.
- Munsi, M.; Malaviya, S.; Oinam, G.; Joshi, P.K. A landscape approach for quantifying land-use and land-cover change (1976–2006) in middle Himalaya. Reg. Environ. Chang. 2010, 10, 145–155.
- Mertens, B.; Lambin, E. Land-cover-change trajectories in southern Cameroon. Ann. Assoc. Am. Geogr. 2000, 90, 467–494.
- Enaruvbe, G.O.; Pontius Jr., R.G. Influence of classification errors on Intensity Analysis of land changes in southern Nigeria. Int. J. Remote 2015, 36, 244–261. [CrossRef]
- Shafizadeh-Moghadam, H.; Minaei, M.; Feng, Y.; Pontius Jr., R.G. GlobeLand30 Maps Show Four Times Larger Gross than Net Land Change from 2000 to 2010 in Asia. Int. J. Appl. Earth Obs. Geoinf. 2019, 78, 240–248. [CrossRef]
- Estoque, R.C.; Murayama, Y. Intensity and Spatial Pattern of Urban Land Changes in the Megacities of Southeast Asia. Land use policy 2015, 48, 213–222. [CrossRef]
- Feng, Y.; Tong., X. Dynamic Land Use Change Simulation Using Cellular Automata with Spatially Nonstationary Transition Rules. GIScience Remote Sens. 2018, 55, 678–698. [CrossRef]
- Karlson, M.; Ostwald, M. Remote sensing of vegetation in the Sudano- Sahelian zone : A literature review from 1975 to 2014. J. Arid Environ. 2015, 124, 257–269. [CrossRef]
- Mbow, C.; Brandt, M.; Ouedraogo, I.; Leeuw, J. De; Marshall, M. What Four Decades of Earth Observation Tell Us about Land Degradation in the Sahel? Remote Sens. 2015, 7, 4048–4067. [CrossRef]
- National Geomatics Center of China Global Land Cover Dataset (GlobleLand30m) Product Description Available online: http://www.globallandcover.com/GLC30Download/index.aspx) (accessed on Dec 6, 2018).
- Friedl, M.A.; Sulla-Menashe, D.; Tan, B.; Schneider, A.; Ramankutty, N.; Sibley, A.; Huang, X. MODIS Collection 5 global land cover: algorithm refinements and characterization of new datasets. Remote Sens. Environ. 2010, 114, 168–182. [CrossRef]
- Tateishi, R.; Uriyangqai, B.; Al-Bilbisi, H.; Ghar, M.A.; Tsend-Ayush, J. Kobayashi, T.; Kasimu, A.; Hoan, N.T.; Shalaby, A.; Alsaaideh, B.; Enkhzaya, T.; et al. Production of global land cover data-GLCNMO. Int. J. Digit. Earth 2011, 4, 22–49.
- Ruelland, D.; Tribotte, A.; Puech, C.; Dieulin, C. Comparison of methods for LUCC monitoring over 50 years from aerial photographs and satellite images in a Sahelian catchment. Int. J. Remote Sens. 2011, 32, 1747–1777.
- Gong, P.; Wang, J.; Yu, L.; Zhao, Y.; Zhao, Y.; Liang, L.; Niu, Z.; Huang, X.; Fu, H.; Liu, S.; et al. Finer resolution observation and monitoring of global land cover: First mapping results with Landsat TM and ETM+ data. Int. J. Remote Sens. 2013, 34, 2607–2654. [CrossRef]
- Yu, L.; Wang, J.; Gong, P. Improving 30 m global land-cover map FROM-GLC with time series MODIS and auxiliary data sets : a segmentation-based approach. Int. J. Remote Sens. 2017, 34, 5851–5867. [CrossRef]
- Church, R.J. West Africa: a study of the environment and of man’s use of it; Longman’s, Green and Co., Ltd, 1966;
- Zhao, J.; Yu, L.; Liu, H.; Huang, H.; Wang, J. Towards an open and synergistic framework for mapping global land cover. Peer J 2021, 1–18. [CrossRef]
- ESA-CCI-LC Land Cover CCI Product User Guide Version 2.0 Available online: http://maps.elie.ucl.ac.be/CCI/viewer/download/ESACCI-LC-QuickUserGuide-LC-Maps_v2-0-7.pd (accessed on Dec 6, 2017).
- Gong, P.; Li, X.; Wang, J.; Bai, Y.; Chen, B.; Hu, T.; Liu, X.; Xu, B.; Yang, J.; Zhang, W.; et al. Annual maps of global artificial impervious area (GAIA) between 1985 and 2018. Remote Sens. Environ. 2020, 236, 111510. [CrossRef]
- Hansen, M.; Potapov, P.; Moore, R.; Hancher, M.; Turubanova, SA Tyukavina, A.; Thau, D.; Stehman, S.; Goetz, S.; Loveland, T. High-resolution global maps of 21st-century forest cover change. Science (80-. ). 2013, 342, 850–853.
- Pekel, J.-F.; Cottam, A.; Gorelick, N.; Belward, A. High-resolution mapping of global surface water and its long-term changes. Nature 2016, 540, 418–422.
- Dinerstein, E.; Olson, D.; Joshi, A.; Vynne, C.; Burgess, N.D Wikramanayake, E.; Hahn, N.; Palminteri, S.; Hedao, P.; Noss, R. An ecoregion-based approach to protecting half the terrestrial realm. Bioscience 2017, 67 (6), 534–545. [CrossRef]
- Li, C.; Gong, P.; Wang, J.; Zhu, Z.; Biging, G.S.; Yuan, C.; Hu, T.; Zhang, H.; Wang, Q.; Li, X.; et al. The first all-season sample set for mapping global land cover with Landsat-8 data. Sci. Bull. 2017, 62, 508–515. [CrossRef]
- Runfola, D.S.M.; Pontius Jr., R.G. Measuring the temporal instability of land change using the Flow matrix. Int. J. Geogr. Inf. Sci. 2013, 27, 1696–1716. [CrossRef]
- Comité Inter-états de Lutte contre la Sécheresse dans le Sahel (CILSS) Landscapes of West Africa – A Window on a Changing World.; United States Geological Survey: Garretson, SD, United States, 2016;
- Asenso Barnieh, B.; Jia, L.; Menenti, M.; Jiang, M.; Zhou, J.; Lv, Y.; Zeng, Y.; Bennour, A. Quantifying spatial reallocation of land use / land cover categories in West Africa. Ecol. Indic. 2022, 135, 108556. [CrossRef]
- Sendzimir, J.; Reij, C.P.; Magnuszewsk, P. Rebuilding Resilience in the Sahel : Regreening in the Maradi and Zinder Regions of Niger. Ecol. Soc. 2011, 16. [CrossRef]
- Reij, C.; Tappan, G.; Smale, M. Agroenvironmental Transformation in the Sahel:Another Kind of “Green Revolution”; 00914; IFPRI: Washington DC-USA, 2009;
- Costa, F.; Cabral, A.I.R.; Lagos, F. Land cover changes and landscape pattern dynamics in Senegal and Guinea Bissau borderland Land cover changes and landscape pattern dynamics in Senegal and Guinea Bissau borderland. Appl. Geogr. 2017, 82, 115–128. [CrossRef]
- Olsson, L.; Eklundh, L.; Ardo, J. A recent greening of the Sahel — trends , patterns and potential causes. J. Arid Environ. 2005, 63, 556–566. [CrossRef]
- Dardel, C.; Kergoat, L.; Hiernaux, P.; Mougin, E.; Grippa, M.; Tucker, C.J. Re-greening Sahel: 30 years of remote sensing data and field observations (Mali, Niger). Remote Sens. Environ. 2014, 140, 350–364. [CrossRef]
- Aniekwe, S.; Igu, N. A Geographical Analysis of Urban Sprawl in Abuja, Nigeria. J. Geogr. Res. 2019, 02, 13–19. [CrossRef]
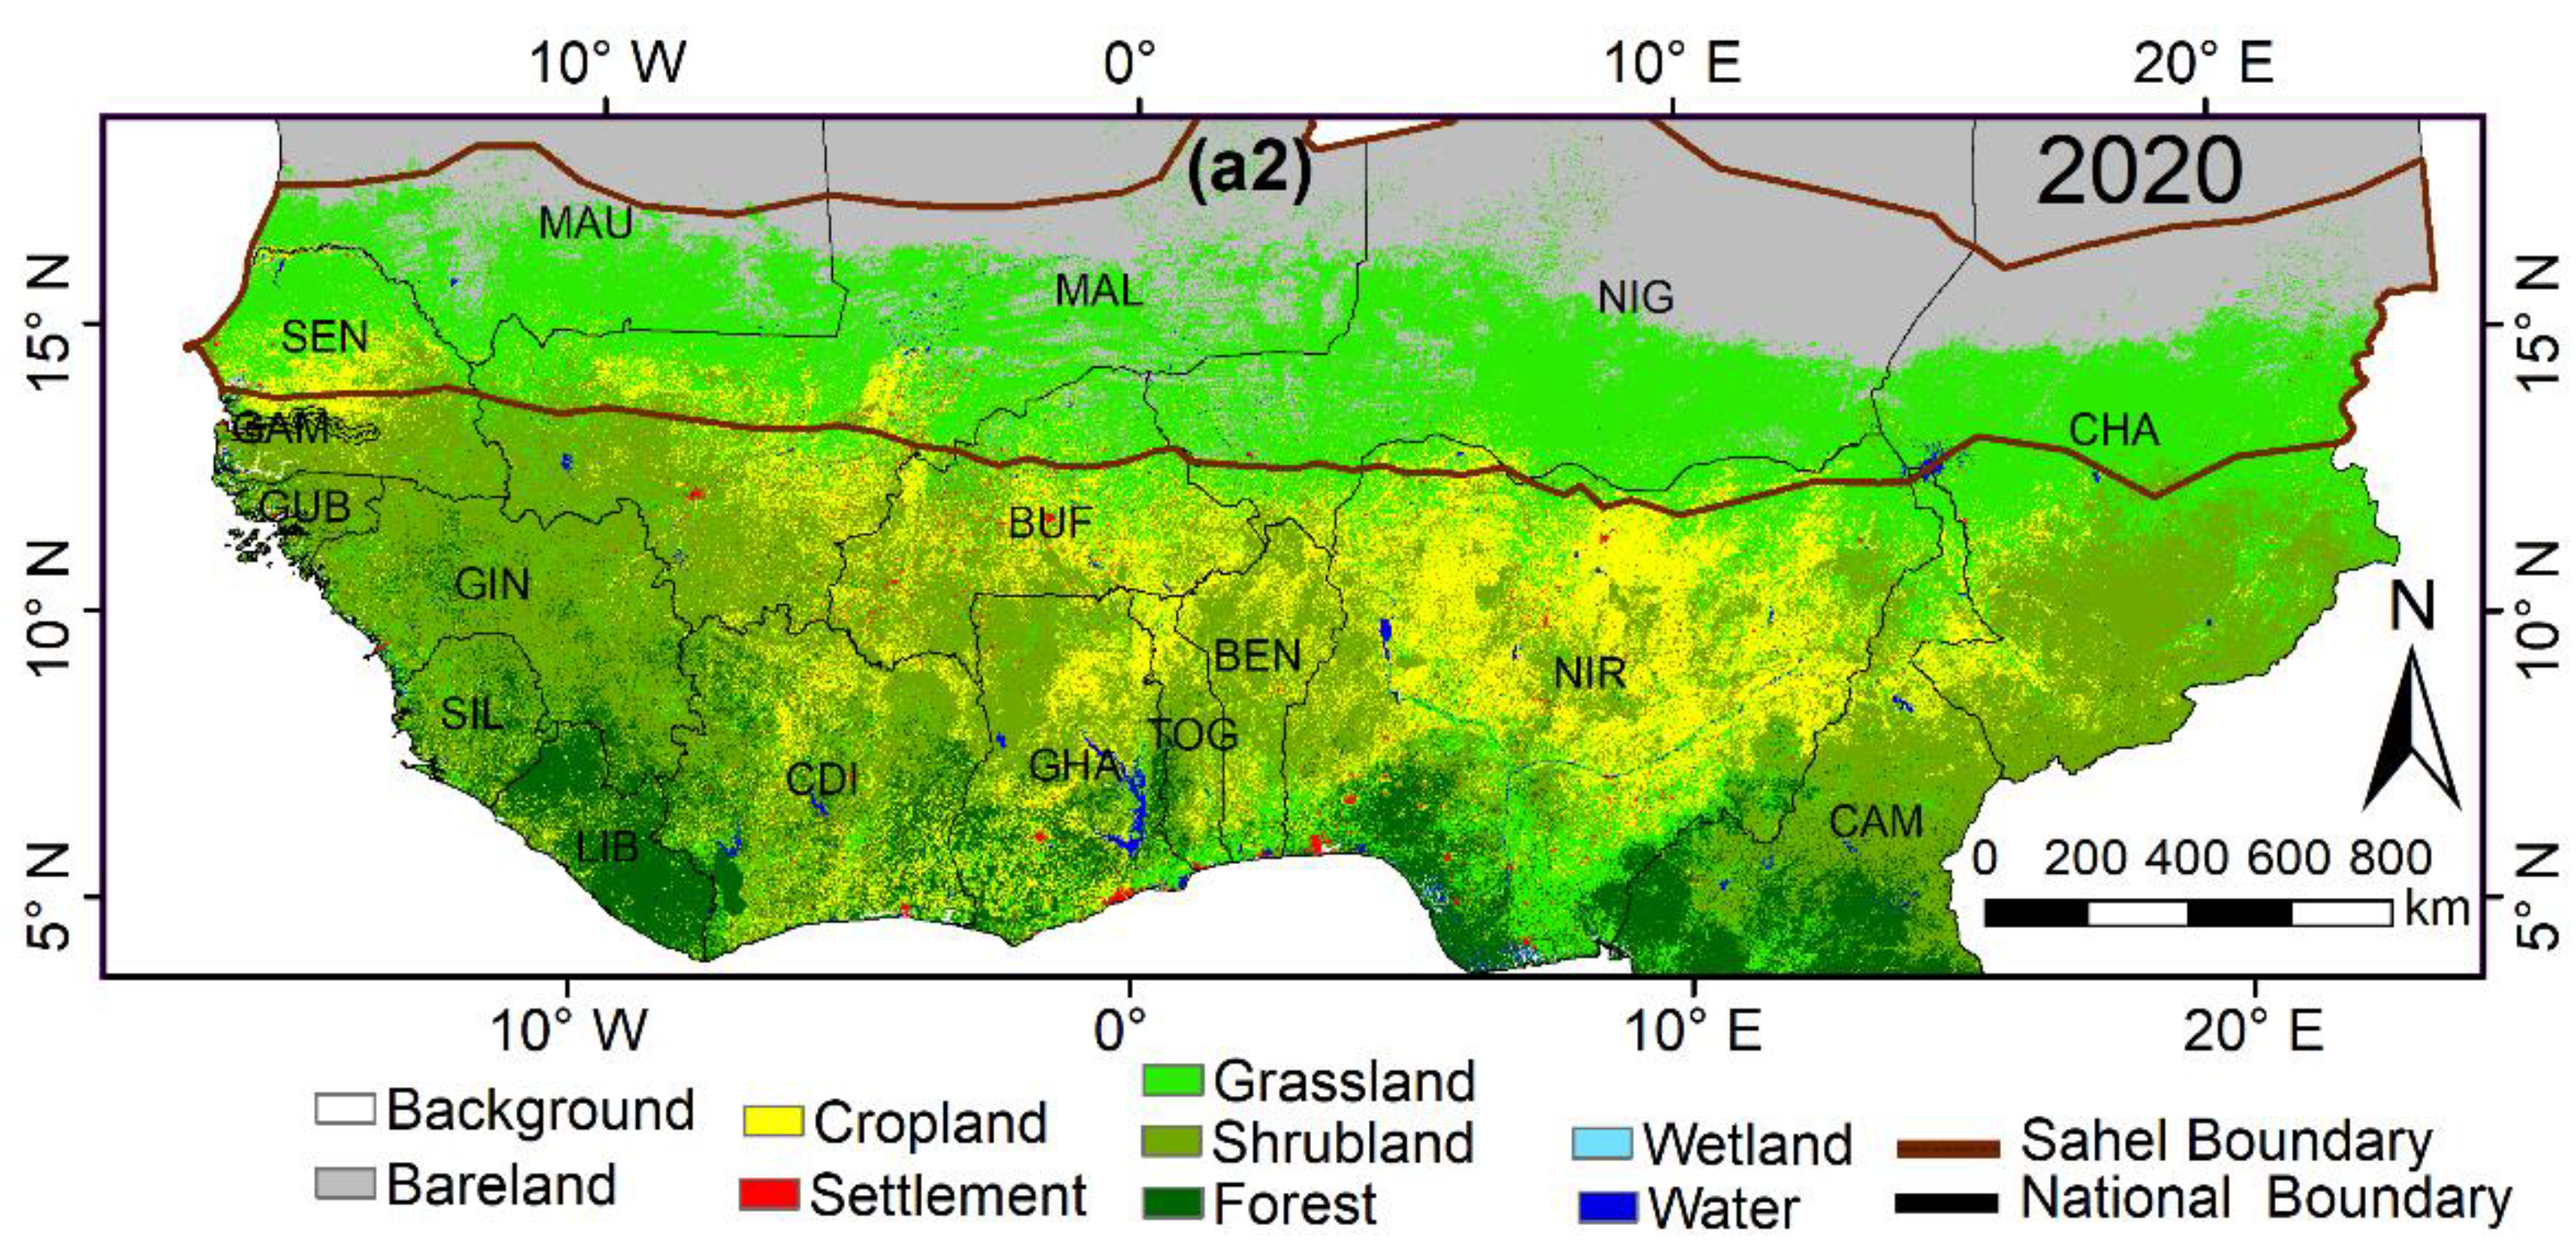

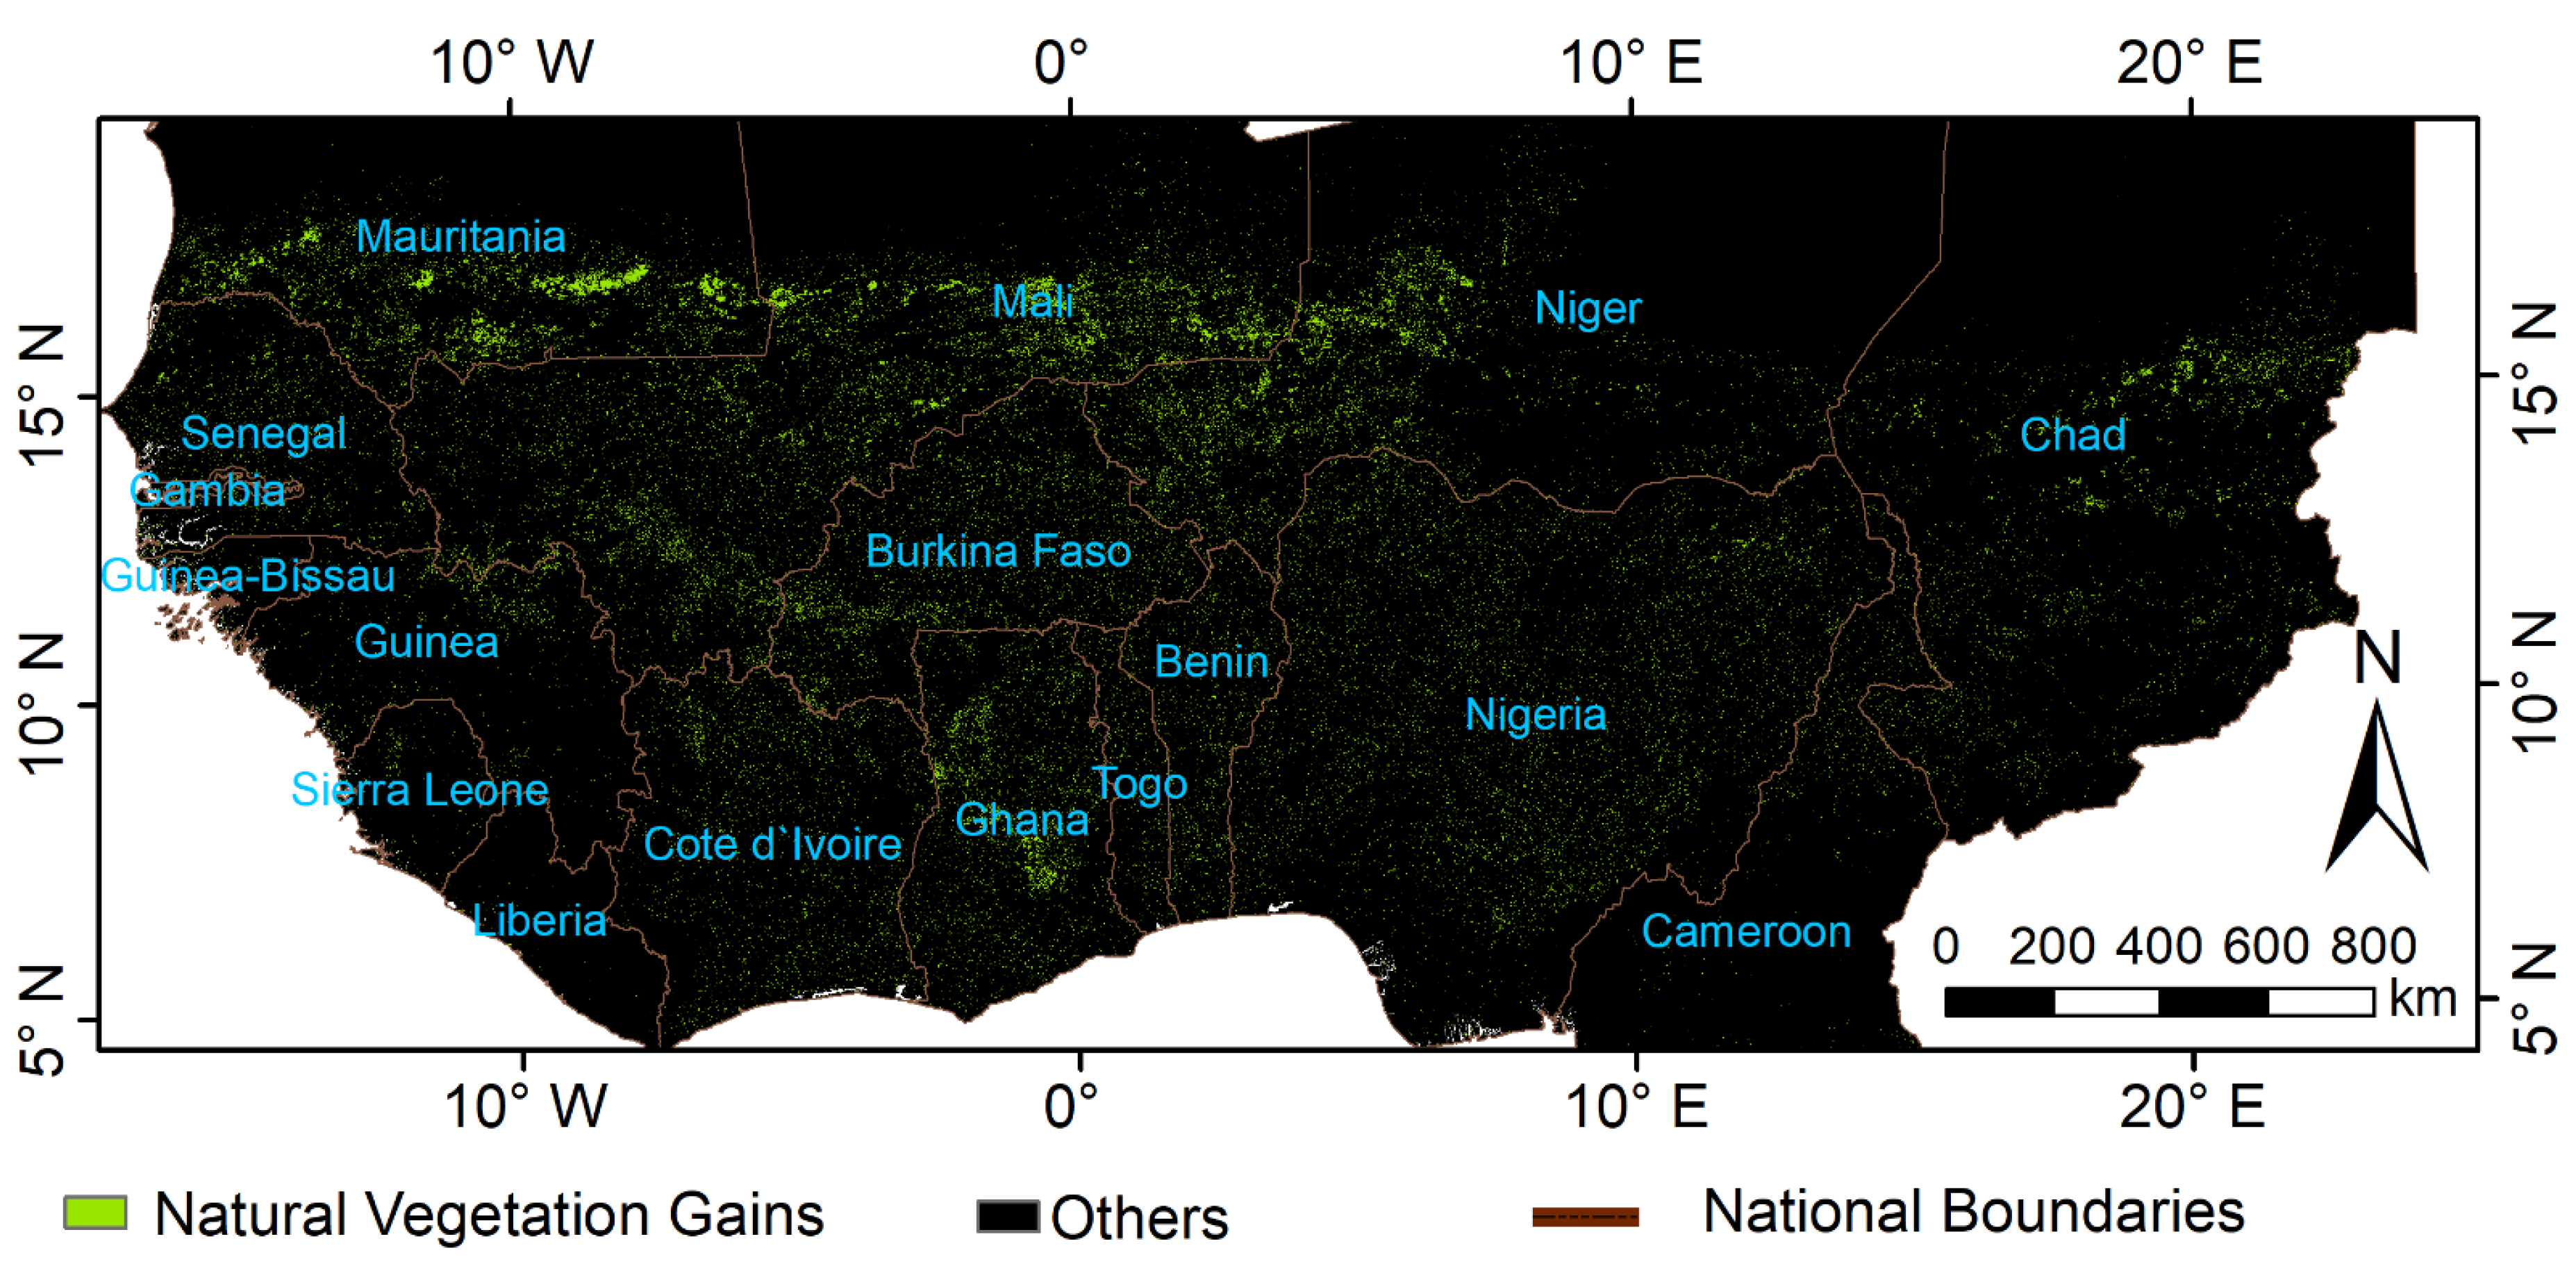
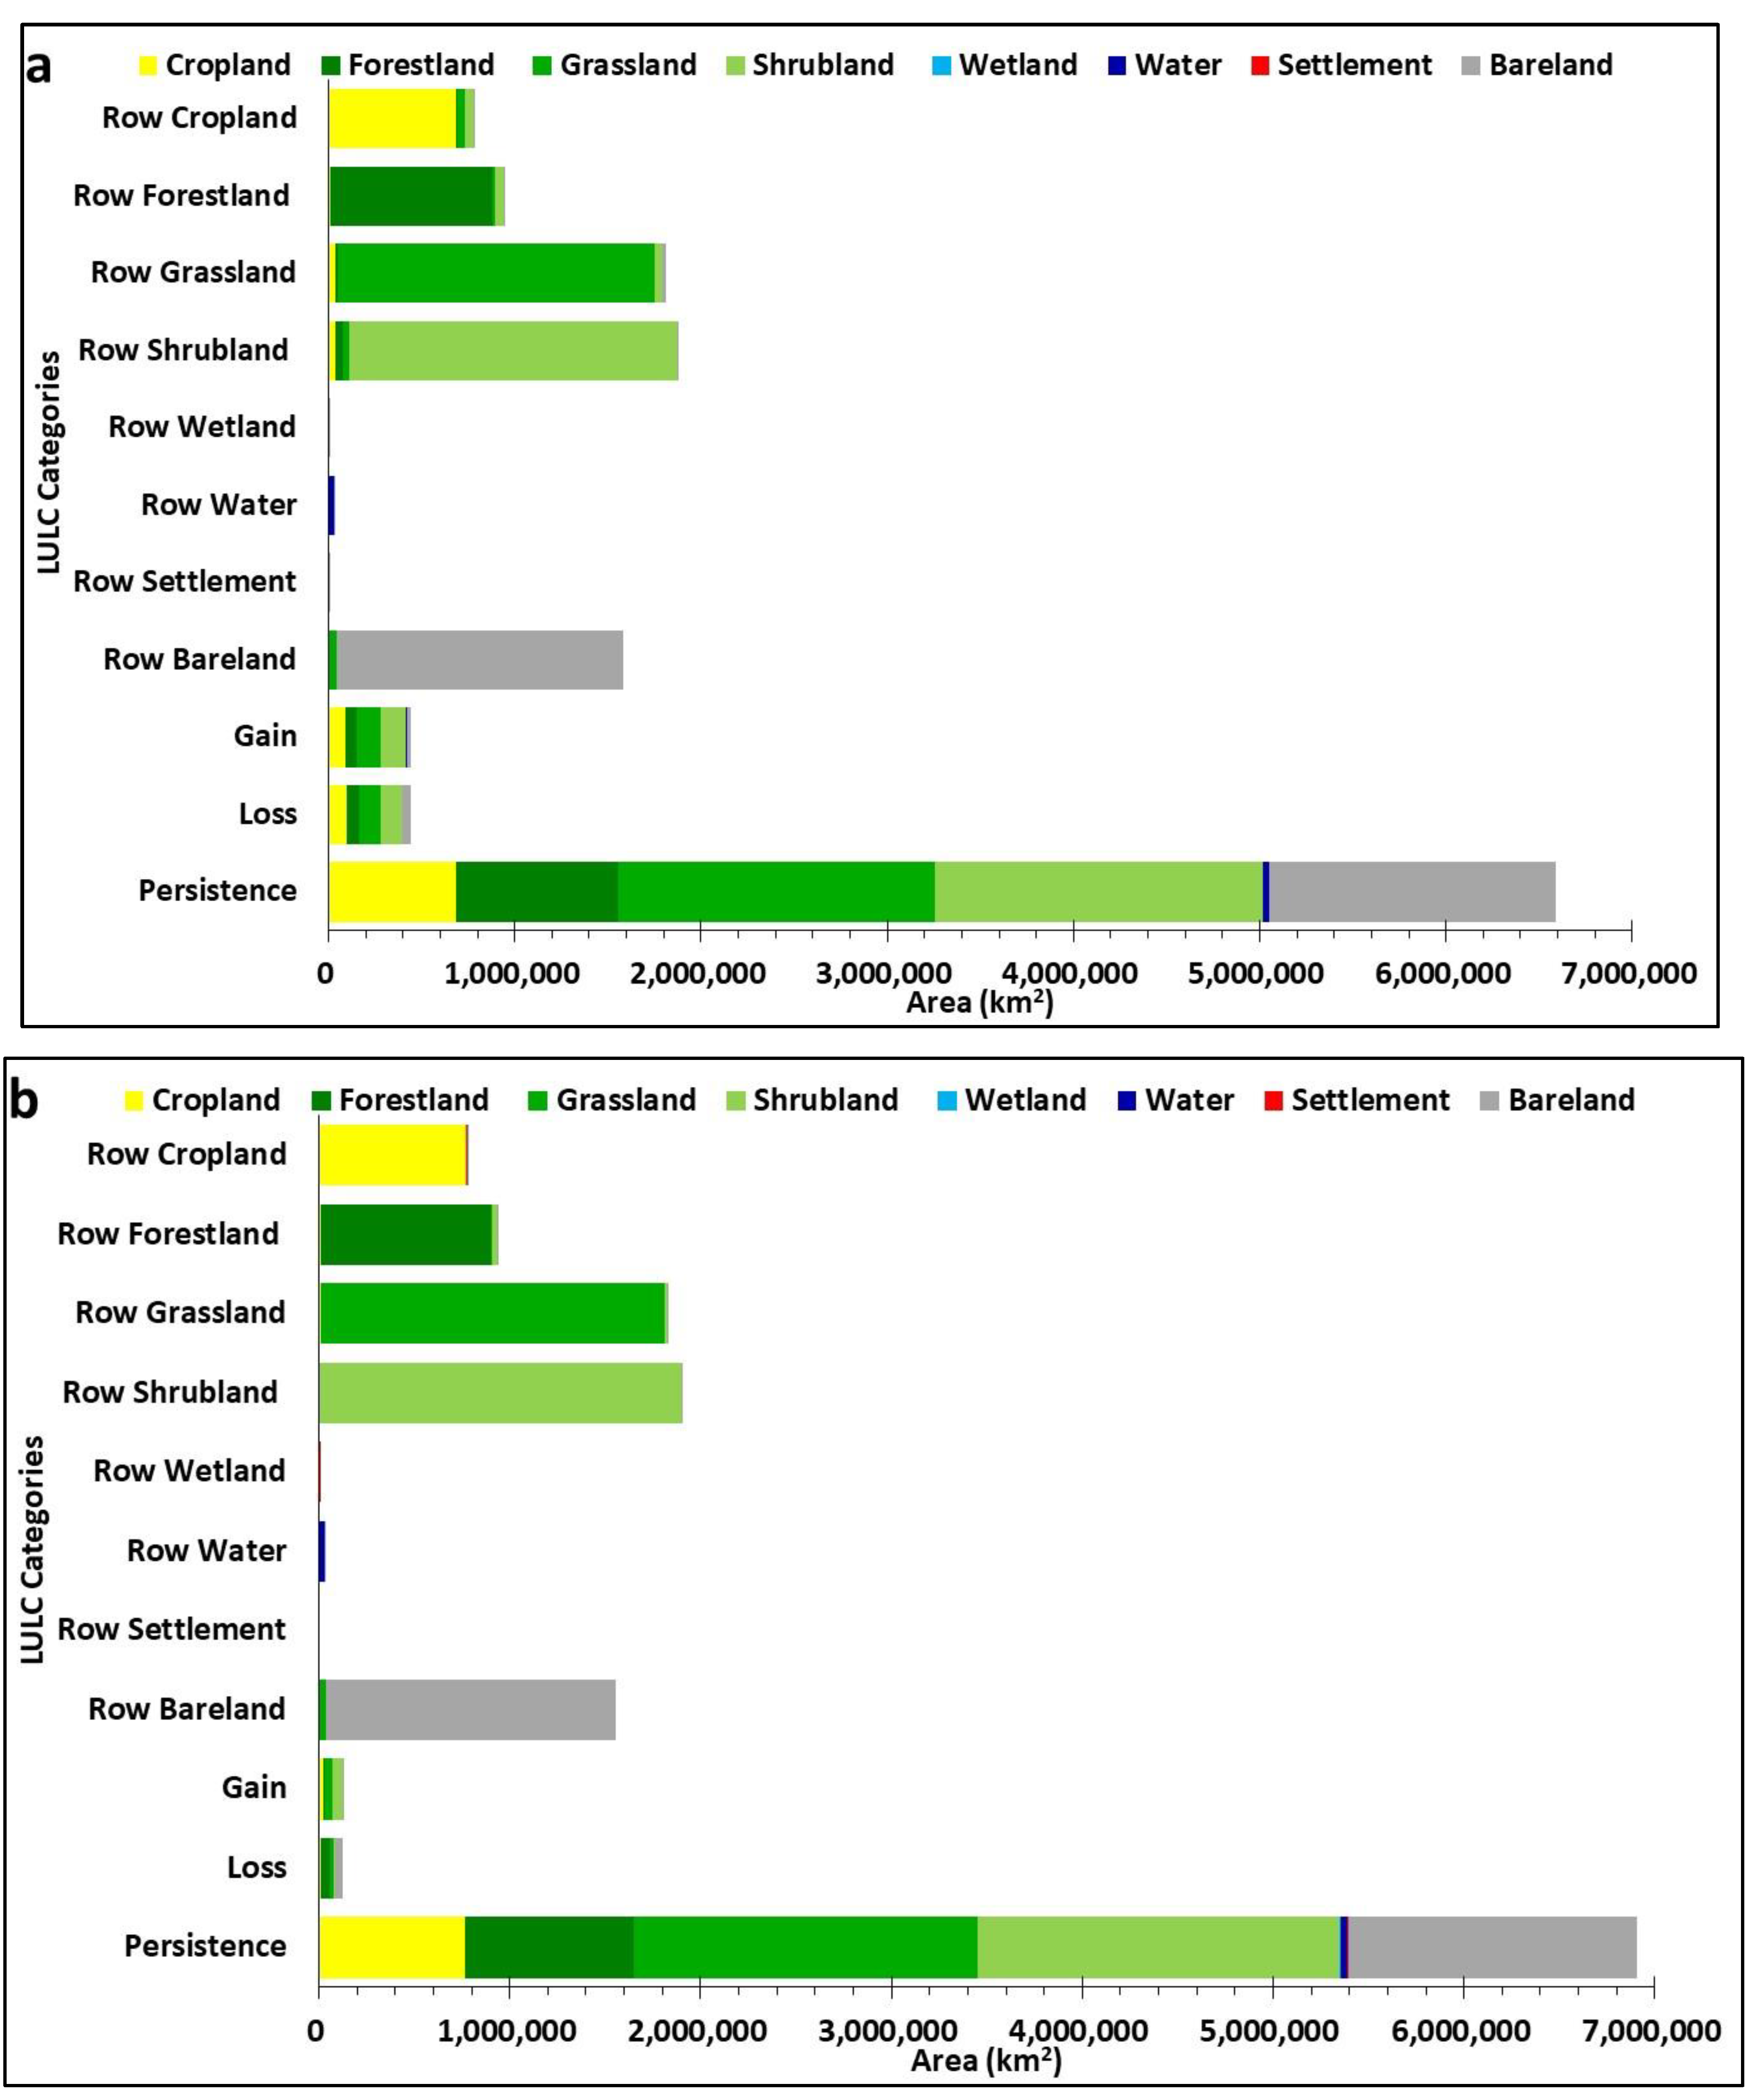
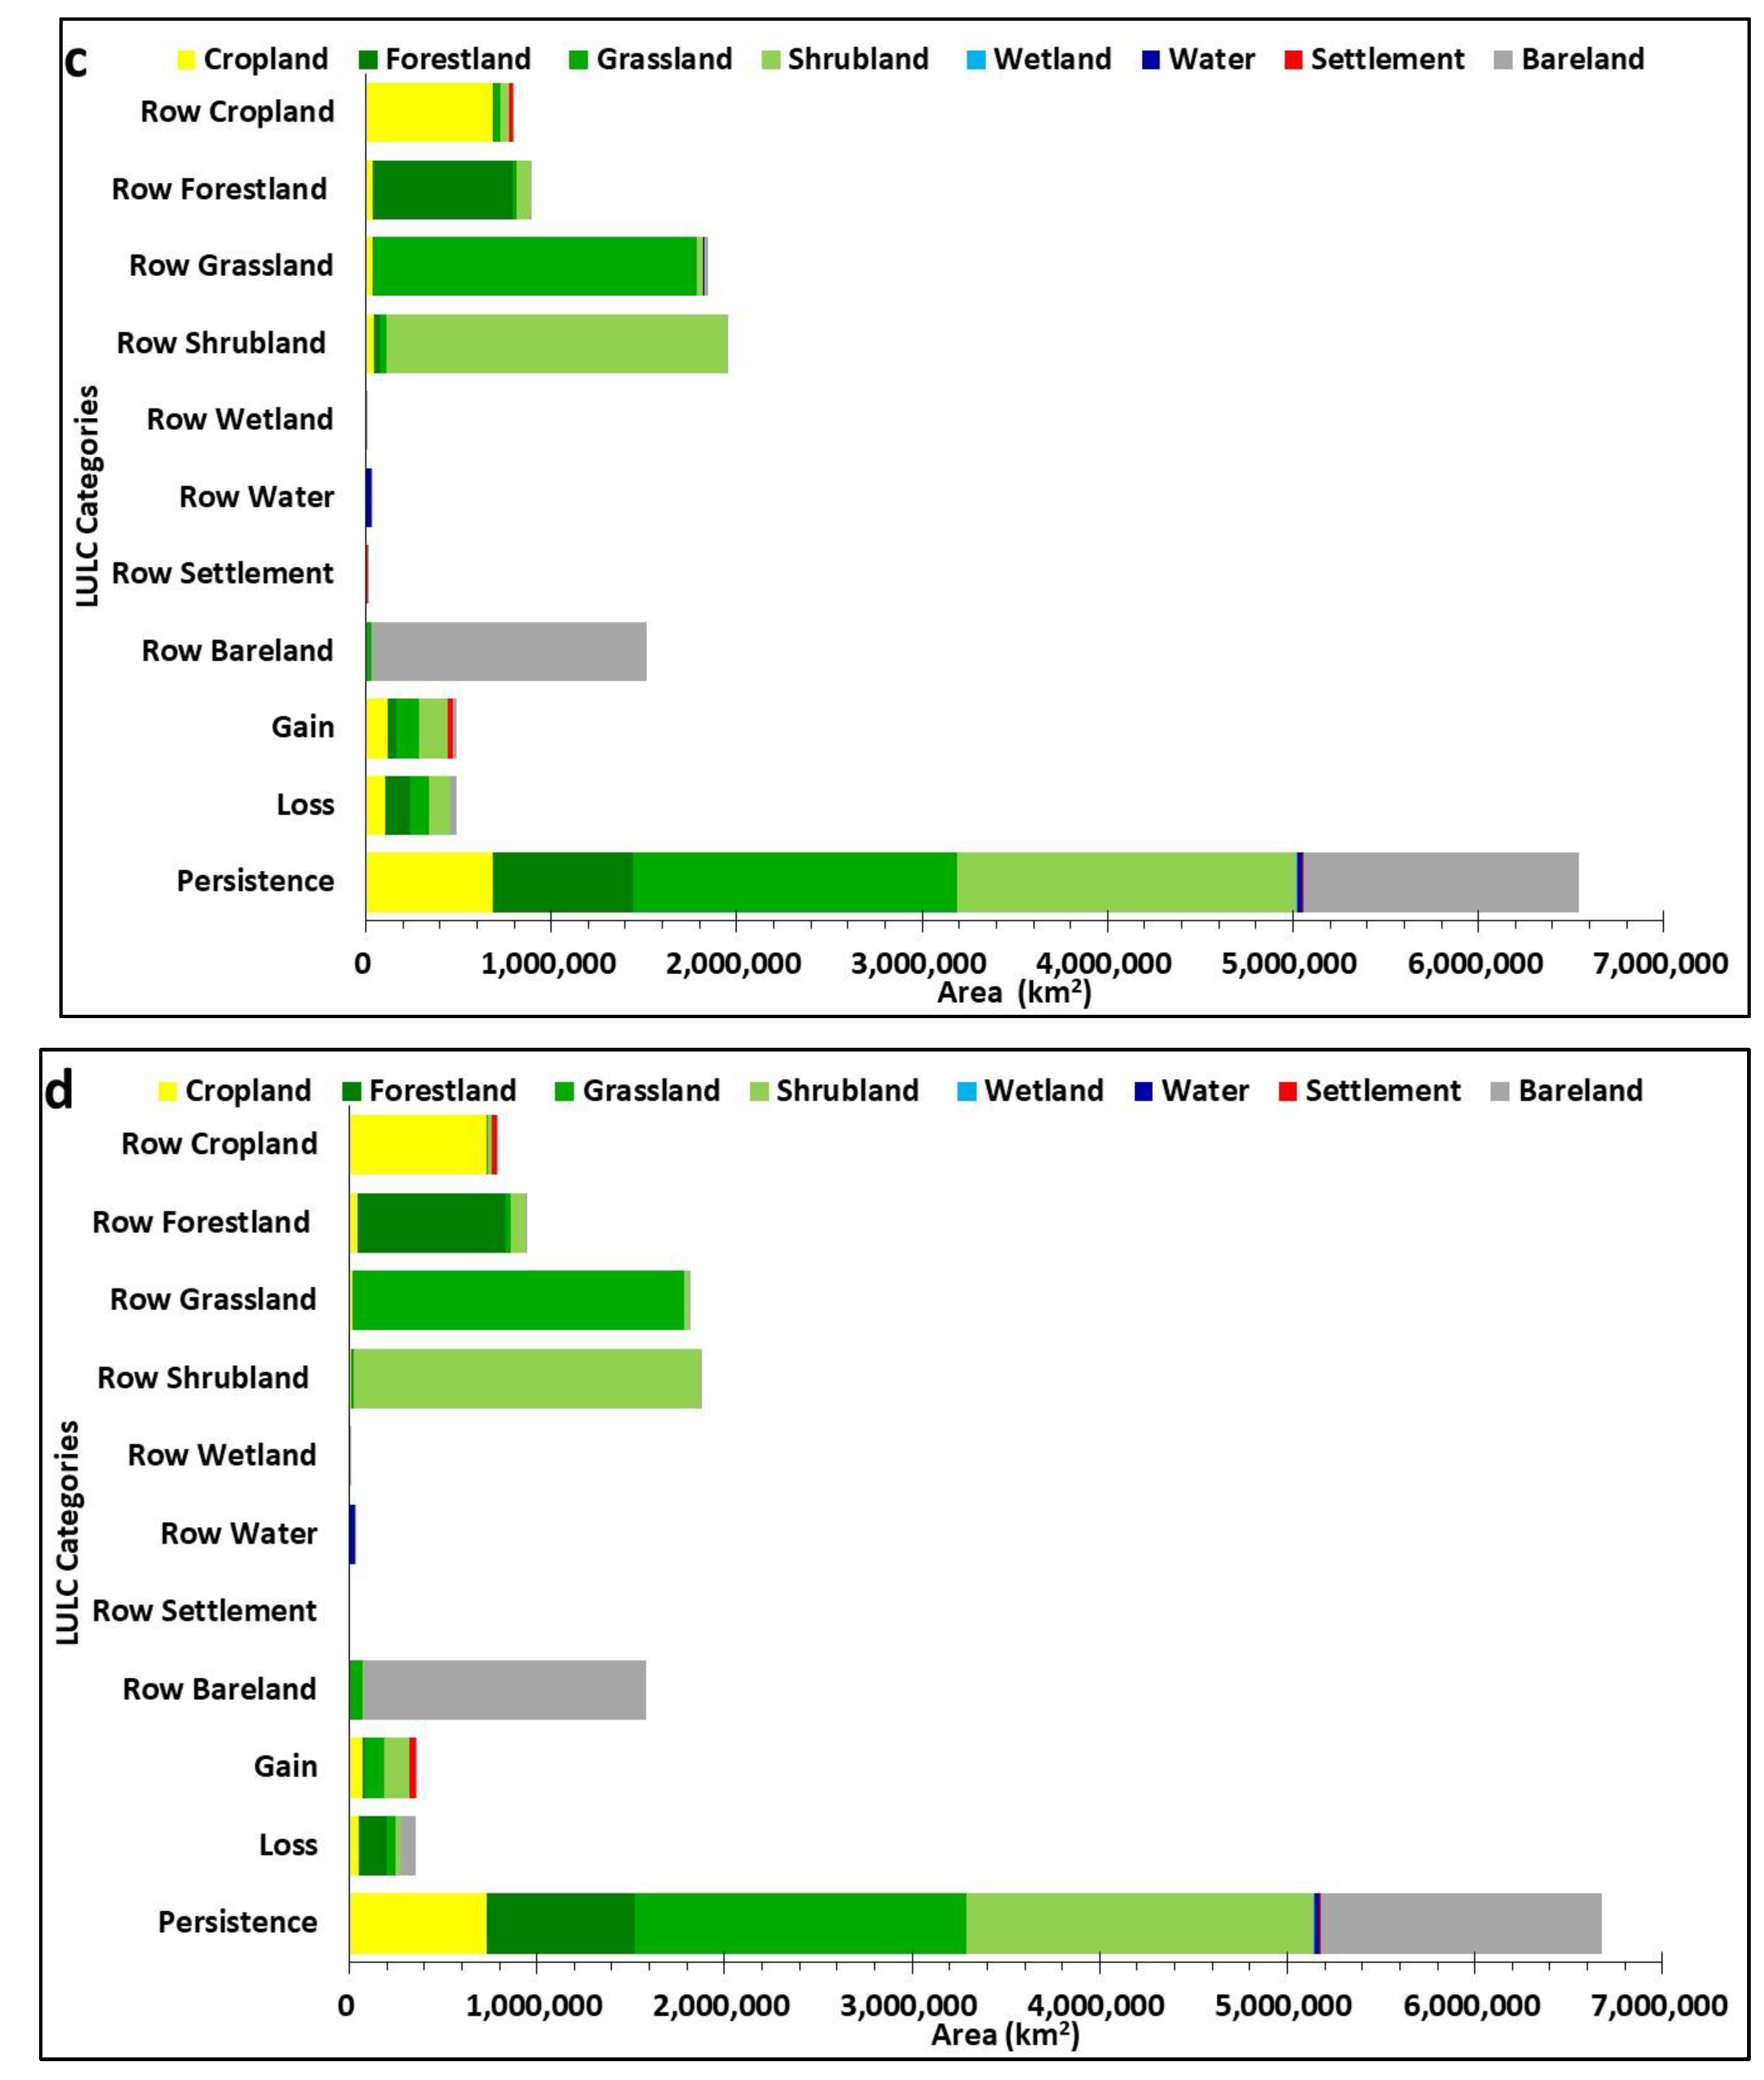
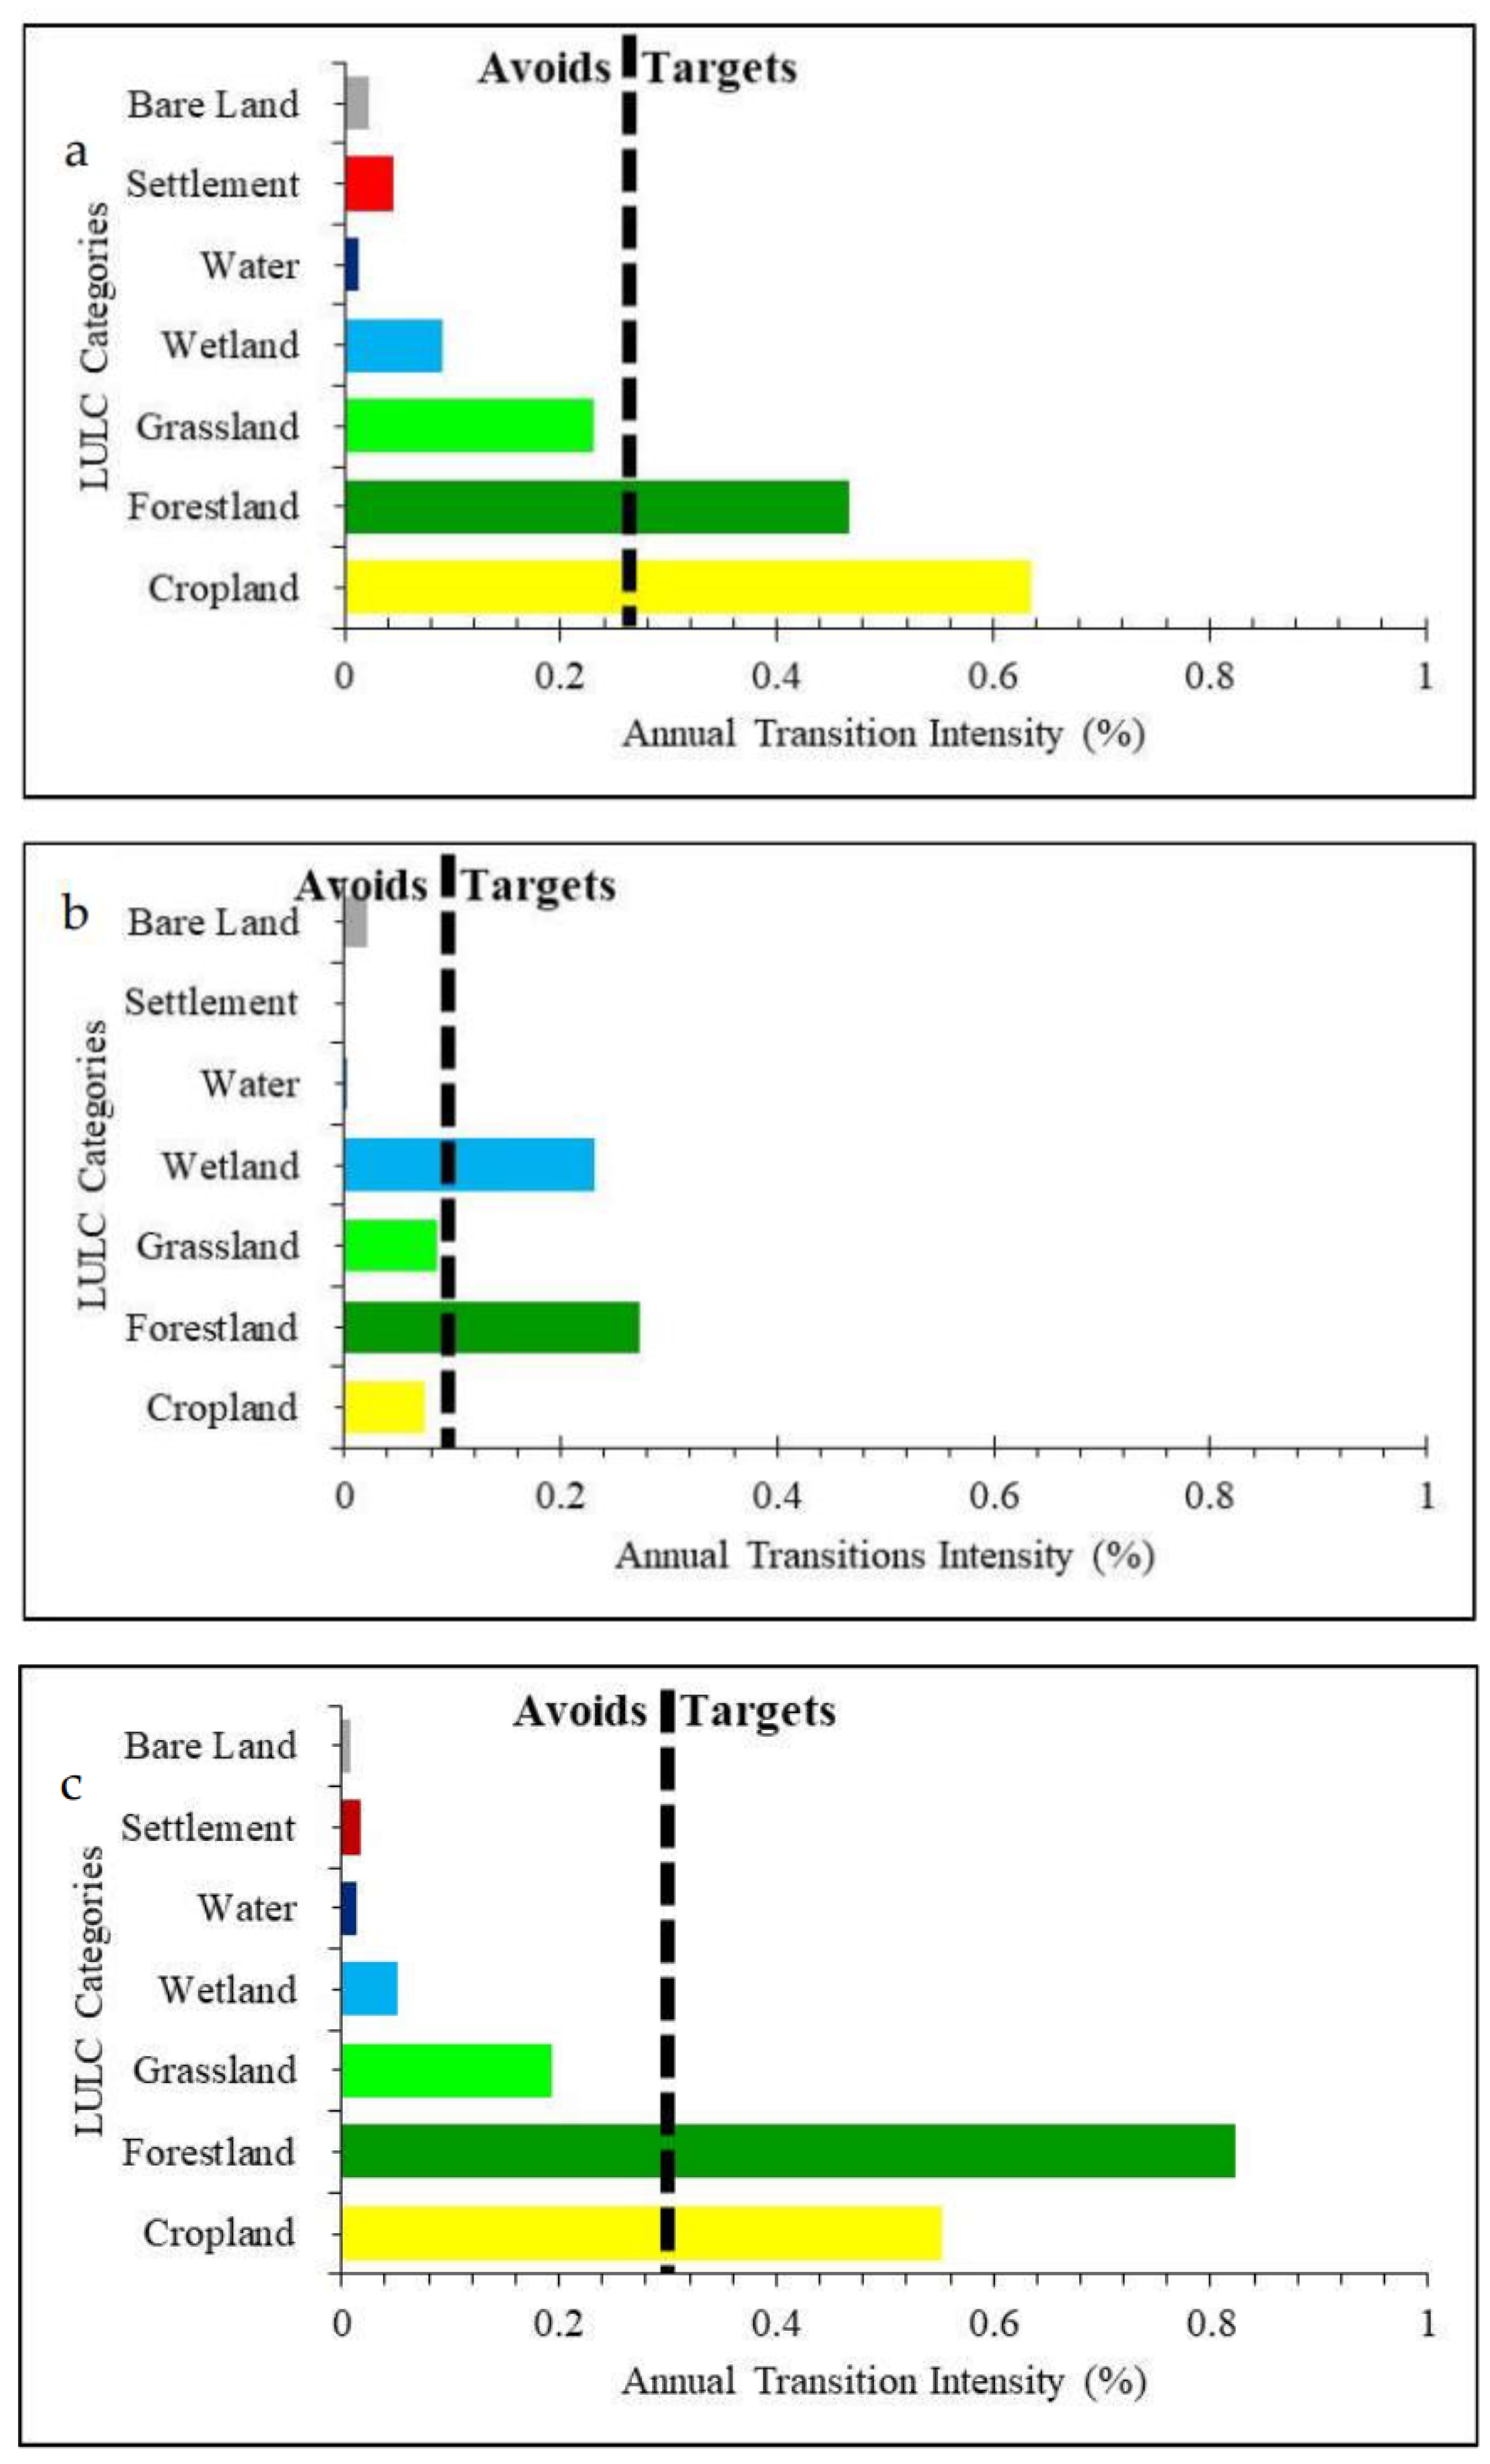
| FROM GLC | ESA-CCI |
| Cropland | Rainfed cropland, irrigated/post-flooding cropland |
| Mosaic cropland (>50%)/natural vegetation (tree, shrub, herbaceous cover), | |
| Mosaic cropland/natural vegetation (tree, shrub, herbaceous cover) (>50%) | |
| Forest | Tree cover, broadleaved, deciduous, closed to open (>15%), |
| Tree cover, needle leaved, evergreen, closed to open (>15%), | |
| Tree cover, needle leaved, deciduous, closed to open (>15%), | |
| Tree cover, mixed leaf type (broadleaved and needle leaved), | |
| Mosaic tree and shrub (>50%)/herbaceous cover | |
| Grassland | Mosaic tree and shrub/herbaceous cover (>50%), grassland, |
| Shrubland | Shrubland |
| Wetland | Tree cover flooded with fresh/ brackish water/saline, |
| Shrub or herbaceous cover flooded with fresh/saline/brackish water | |
| Water | Water bodies |
| Impervious surface | Urban areas/Settlements |
| Bare land | Sparse vegetation (tree, shrub, herbaceous cover) (<15%), Bare areas |
| Areas (km2) | ||||||||
|---|---|---|---|---|---|---|---|---|
| LULC Categories | Cropland | Forestland | Grassland | Shrubland | Wetland | Water | Settlement | Bareland |
| Period (1990–2000) | ||||||||
| Cropland | 683079.7 | 11425.1 | 35915.9 | 49784.1 | 78.5 | 318.7 | 2077.3 | 447.8 |
| Forestland | 11912.5 | 871949.0 | 10700.1 | 43885.1 | 266.2 | 592.7 | 118.1 | 40.3 |
| Grassland | 38283.2 | 10058.5 | 1701829.6 | 41800.1 | 230.3 | 998.7 | 1099.8 | 18927.6 |
| Shrubland | 40121.7 | 38255.9 | 35852.0 | 1760458.1 | 38.6 | 95.1 | 94.9 | 847.4 |
| Wetland | 71.3 | 266.4 | 236.2 | 32.1 | 2639.0 | 304.7 | 3.4 | 5.8 |
| Water | 274.2 | 499.2 | 571.4 | 38.9 | 216.0 | 30011.8 | 6.3 | 27.2 |
| Settlement | 183.1 | 12.0 | 186.4 | 15.0 | 0.8 | 2.2 | 2892.9 | 32.8 |
| Bareland | 2375.1 | 55.2 | 40396.0 | 3594.0 | 25.0 | 149.3 | 172.8 | 1533969.7 |
| Period (2000–2010) | ||||||||
| Cropland | 766466.1 | 1626.2 | 1139.2 | 5778.0 | 8.6 | 110.6 | 1179.4 | 12.0 |
| Forestland | 12584.7 | 886525.1 | 7709.2 | 25592.9 | 11.6 | 79.6 | 92.2 | 31.5 |
| Grassland | 7814.3 | 550.0 | 1800830.4 | 15678.6 | 7.3 | 91.9 | 651.1 | 93.6 |
| Shrubland | 1689.9 | 688.6 | 874.0 | 1896309.1 | 3.1 | 17.9 | 26.8 | 6.1 |
| Wetland | 57.3 | 136.6 | 88.5 | 81.5 | 3107.2 | 25.5 | 3.0 | 0.1 |
| Water | 24.5 | 15.6 | 369.6 | 13.4 | 12.8 | 32104.8 | 1.1 | 3.1 |
| Settlement | 0.0 | 0.0 | 0.0 | 0.0 | 0.0 | 0.0 | 6469.4 | 0.0 |
| Bareland | 2652.8 | 27.6 | 33754.7 | 3438.4 | 11.0 | 85.0 | 314.2 | 1514015.4 |
| Period (2010–2020)) | ||||||||
| Cropland | 684571.6 | 5625.1 | 36765.2 | 43704.5 | 59.2 | 221.4 | 20149.2 | 174.8 |
| Forestland | 35172.1 | 758458.0 | 21447.7 | 73246.4 | 214.2 | 564.6 | 357.1 | 4.2 |
| Grassland | 36678.5 | 6528.8 | 1742692.8 | 35766.6 | 216.0 | 737.1 | 4029.5 | 18086.8 |
| Shrubland | 45865.7 | 31791.0 | 34090.9 | 1833569.1 | 14.6 | 40.5 | 1133.7 | 377.8 |
| Wetland | 61.2 | 252.22 | 264.9 | 16.3 | 2277.7 | 269.2 | 15.0 | 0.8 |
| Water | 276.1 | 503.0 | 801.6 | 43.8 | 332.3 | 30387.6 | 75.4 | 23.3 |
| Settlement | 55.7 | 3.5 | 341.6 | 14.3 | 0.6 | 7.6 | 8301.5 | 7.1 |
| Bareland | 509.5 | 0.8 | 29709.5 | 1067.0 | 6.0 | 47.7 | 523.9 | 1482297.0 |
| Period | 1990-2000 | 2000-2010 | 2010-2020 | 1990-2020 | |
| LULC Category | Net Change (%) | Net Change (%) |
Net Change (%) |
Net Change (%) | |
| Cropland | -0.87 | 1.89 | 1.48 | 2.50 | |
| Forestland | -0.74 | -4.62 | -9.70 | -14.51 | |
| Grassland | 0.68 | 1.03 | 1.15 | 2.83 | |
| Shrubland | 1.26 | 2.43 | 2.04 | 5.62 | |
| Wetland | -1.81 | -9.65 | -1.16 | -12.33 | |
| Water | 2.55 | -0.09 | -0.52 | 1.95 | |
| Settlement | 48.57 | 25.96 | 74.75 | 90.39 | |
| Bareland | -1.67 | -2.58 | -0.87 | -5.05 |
Disclaimer/Publisher’s Note: The statements, opinions and data contained in all publications are solely those of the individual author(s) and contributor(s) and not of MDPI and/or the editor(s). MDPI and/or the editor(s) disclaim responsibility for any injury to people or property resulting from any ideas, methods, instructions or products referred to in the content. |
© 2023 by the authors. Licensee MDPI, Basel, Switzerland. This article is an open access article distributed under the terms and conditions of the Creative Commons Attribution (CC BY) license (http://creativecommons.org/licenses/by/4.0/).


