Preprint
Article

A Strong 2023/24 El Niño Is Staged by Tropical Pacific Warm Water Buildup

Altmetrics

Downloads

275

Views

166

Comments

0

This version is not peer-reviewed

Submitted:

13 April 2023

Posted:

13 April 2023

You are already at the latest version

Alerts
Abstract
The upper ocean heat content in the equatorial Pacific usually serves as a primary precursor for an upcoming El Niño, while the strong atmospheric perturbations such as westerly wind burst and easterly wind surge sometimes play a decisive role in determining the final intensity of the event. The tropical Pacific Ocean has just experienced a rare 3-year La Niña, which accumulated a huge amount of warm water in the western basin by the winter of 2022. Using a state-of-the-art climate prediction system, here we show that the restored warm water is sufficient to boost a strong El Niño toward the end of 2023, and that an extreme event could take place if a few sizable westerly wind bursts would occur in spring and early summer. This prediction is not sensitive to initial errors within the tropical Pacific, but may be subject to some uncertainties brought about by influences from elsewhere.
Keywords: 
Subject: Environmental and Earth Sciences  -   Other

Introduction

The El Niño–Southern Oscillation (ENSO) is the strongest interannual variability on the Earth and has widespread impacts on the global climate and human society [1,2]. It has long been recognized that the occurrence of an El Niño is often preconditioned by the buildup of the upper ocean heat content (HC) in the equatorial western Pacific 6-9 months or even longer in advance[3,4]. The regular recharge and discharge of the HC[5] makes it possible to predict ENSO at long lead-times for dynamical models that include such a mechanism[6], while atmospheric high-frequency perturbations (HFPs) may cause large uncertainty in real-time forecasts, especially for strong El Niño events[7]. Now the buildup of HC seems ripe for the development of a strong El Niño in the coming months. To confirm this, we evaluate the effects of both HC and HFPs, as well as the uncertainty in initial conditions, by data analysis and a series of real-time forecast experiments.

Tropical Pacific Ocean HC in winter 2022

The Climate Prediction Center (CPC) issued a final La Niña advisory in March 2023, signaling the end of the unusually long cold event which lasted from winter 2020 to spring 2023[8]. Because the large-scale tropical atmospheric and oceanic circulations are closely coupled to each other during ENSO[9], this rare La Niña was featured by strong and long-lasting easterly anomalies over the equatorial western-central Pacific which, by inducing equatorward Sverdrup transport[10], have maintained positive thermocline depth anomalies in the western equatorial Pacific (Figure 1a-c).
Observations and classic ENSO theories suggest that when the thermocline depth in the western basin is deeper than normal in winter, an El Niño is likely to occur at the end of the following year[4,5,11]. We therefore examine the thermocline depth denoted by the 20°C isotherm (D20) averaged from December 2022 to February 2023 (Figure 1d). For comparison, the averaged thermocline depth from December of the preceding year (referred to as year (-1)) to February of the current year (year (0)) of 1982, 1997, and 2015 are also given (Figure 1e-g). Deeper-than-normal thermocline was observed in the entire warm pool this winter, with an intensity much stronger than those preceding the onset of the three extreme El Niño events. Note that the spatial pattern of this winter’s thermocline depth anomaly bears a resemblance to that of 1982, a year when HC rather than HFPs was the deciding factor for the subsequent occurrence of super El Niño[12].
The strong positive thermocline depth anomaly indicates that the western tropical Pacific has accumulated an abnormally large amount of warm water in the upper layer (Extended Data Figure 1). Figure 1h displays the integrated warm water volume (WWV) over the equatorial Pacific (120°E-80°W, 5°S-5°N) in D(-1)JF(0), an index often used as a precursor for ENSO event[3], for every El Niño onset year since 1982, as well as for 2023 (Methods). While not all El Niño events were preceded by WWV/HC buildup, the strong ones certainly did. It is clear that the Pacific Ocean restored the largest HC in winter 2022, and such a large HC buildup appeared in all of the datasets we have analyzed (Extended Data Figure 2 and Figure 3).

Impact of HC on the upcoming El Niño

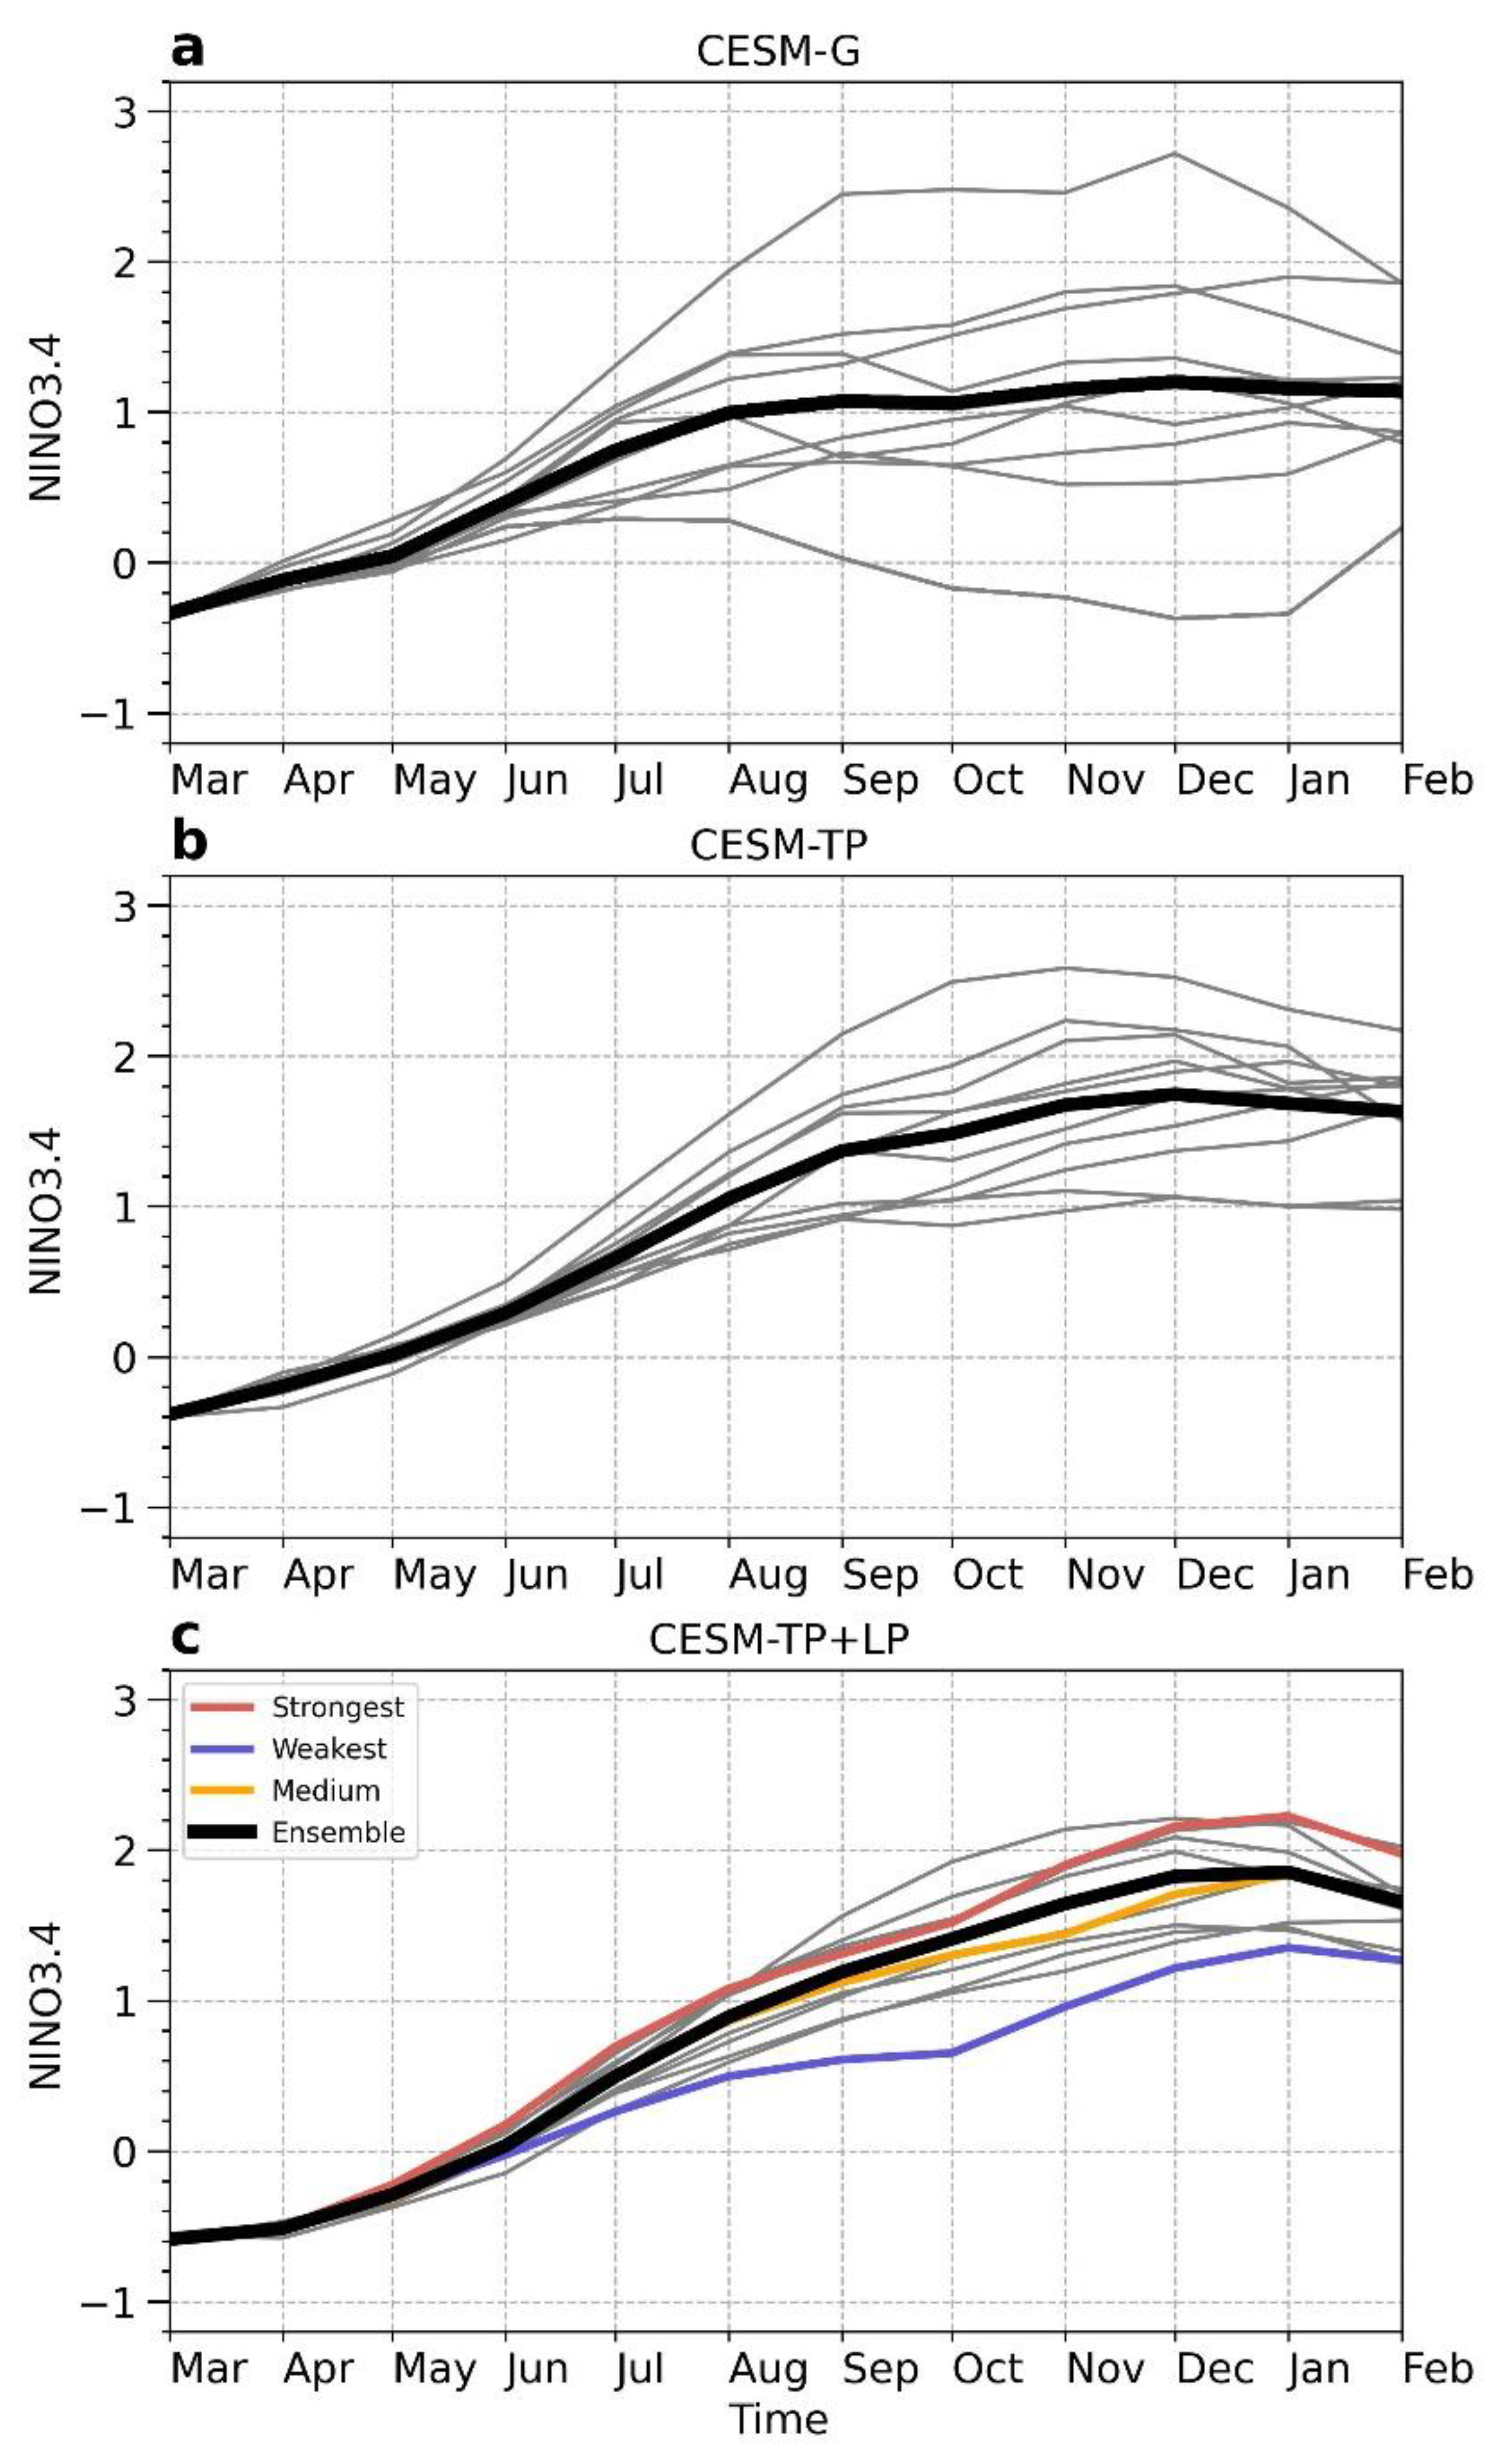
We next conduct a forecast experiment from March 1st, 2023 using a state-of-the-art ENSO ensemble prediction system which consists of a global coupled model and a data assimilation system (Methods), termed CESM-G here. The NINO3.4 index, which is the average SST anomaly in the central-eastern equatorial Pacific (170°W-120°W, 5°S-5°N), is used to measure ENSO intensity. An event with NINO3.4 greater than 0.5°C is defined as an El Niño, which can be further divided into weak (0.5 to 0.9 °C), moderate (1.0 to 1.4°C), strong (1.5 to 1.9°C) and extreme (>2.0°C) categories[13]. As shown in Figure 2a, most ensemble members from CESM-G predict the coming of an El Niño in late 2023. The ensemble-mean of predicted NINO3.4 is ~1.17°C in D(0)JF(1) 2023, meeting the criterion of a moderate event. One notable feature is the level-off of the predictions after September 2023, lacking a distinct peak in winter that is often observed[11]. Another feature is the rather large spread among 11 ensemble members, with predictions falling into all El Niño categories, and even a case of negative NINO3.4.
The uncertainty in the predicted ENSO intensity resides in the fact that ENSO is a nonlinear system and is affected by many processes at various spatiotemporal scales[14,15]. First, a slight initial perturbation may grow fast due to nonlinearity and take the prediction away from its unperturbed track. It is suggested that an initial perturbation close to the optimal growth pattern is more likely to trigger an ENSO event[16]. Second, the multiplicative HFPs, especially those occurring in sensitive areas and seasons[17], also have considerable impact on ENSO evolution and intensity[7]. Finally, some processes out of the tropical Pacific, such as the Pacific meridional mode[18] and the SST warming in the northern Atlantic[19], are thought to influence ENSO development.
To focus on the impact of current tropical Pacific Ocean HC on the 2023/24 El Niño, we first try to reduce the uncertainty associated with the processes out of the tropical Pacific by replacing the surface wind stress outside of (100°E-70°W, 30°S-30°N) by the climatology. The predictions using this model setup, termed CESM-TP, are given in Figure 2b. While considerable forecast spread still exists, the uncertainty is apparently reduced as compared to that of CESM-G. The NINO3.4 index in D(0)JF(1) 2023 is now ~1.69°C, meeting the criterion of a strong El Niño. The increase of El Niño intensity in CESM-TP is clearly a result of reduced active influences from outside of the tropical Pacific, which is probably a mixture of signal and noise[20]. Considering the fact that the predicted 2023/24 El Niño from CESM-TP also shows a more realistic evolution pattern with a peak around December 2023, we tend to believe that the prediction of CESM-TP is likely to be more robust than that of CESM-G.
To further reduce the uncertainty and isolate the impact of HC buildup, we apply an online low-pass filtering scheme to the CESM-TP (Methods). This scheme is designed to filter out the internal HFPs produced by the model itself which are usually unrealistic[21], thus letting the predicted ENSO depend on the influence from the low-frequency tropical ocean-atmosphere coupling alone[22]. The predictions of NINO3.4 using this model setup, termed CESM-TP+LP, are given in Figure 2c. The forecast spread is sharply reduced in this case, with a more prominent peak phase. The evolution of the predicted El Niño is in strong resemblance to the extreme El Niño events in history[6]. The ensemble-mean NINO3.4 averaged in D(0)JF(1) 2023 is ~1.78°C, indicating that without the influences from outside of the tropical Pacific and HFPs, the tropical Pacific Ocean HC buildup in winter 2022 unambiguously sets the stage for the coming of a strong El Niño toward the end of 2023.

Forecast uncertainty due to HFPs

The occurrence and intensity of El Niño do not solely depend on the HC buildup. Many studies have shown that ENSO is strongly modulated by atmospheric HFPs, especially the westerly wind burst (WWB) in the western-central equatorial Pacific[23]. As a matter of fact, every El Niño event during the past 50 years was accompanied by WWB activities[24,25]. In particular, the strong WWBs in spring 1997 and 2015 are found to be essential to the genesis of the 1997/98 and 2015/16 extreme El Niño events[26,27,28]. Aside from WWB, the easterly wind surge (EWS) is also found to influence ENSO evolution substantially[29]. For example, it is argued that the strong EWS in July 2014 played a key role in punctuating the 2014/15 El Niño[30], though this EWS might be overestimated[28]. For reliable predictions of El Niño, we have to account for the effects of HFPs[7,22,25,29], especially WWB and EWS, in addition to the HC buildup.
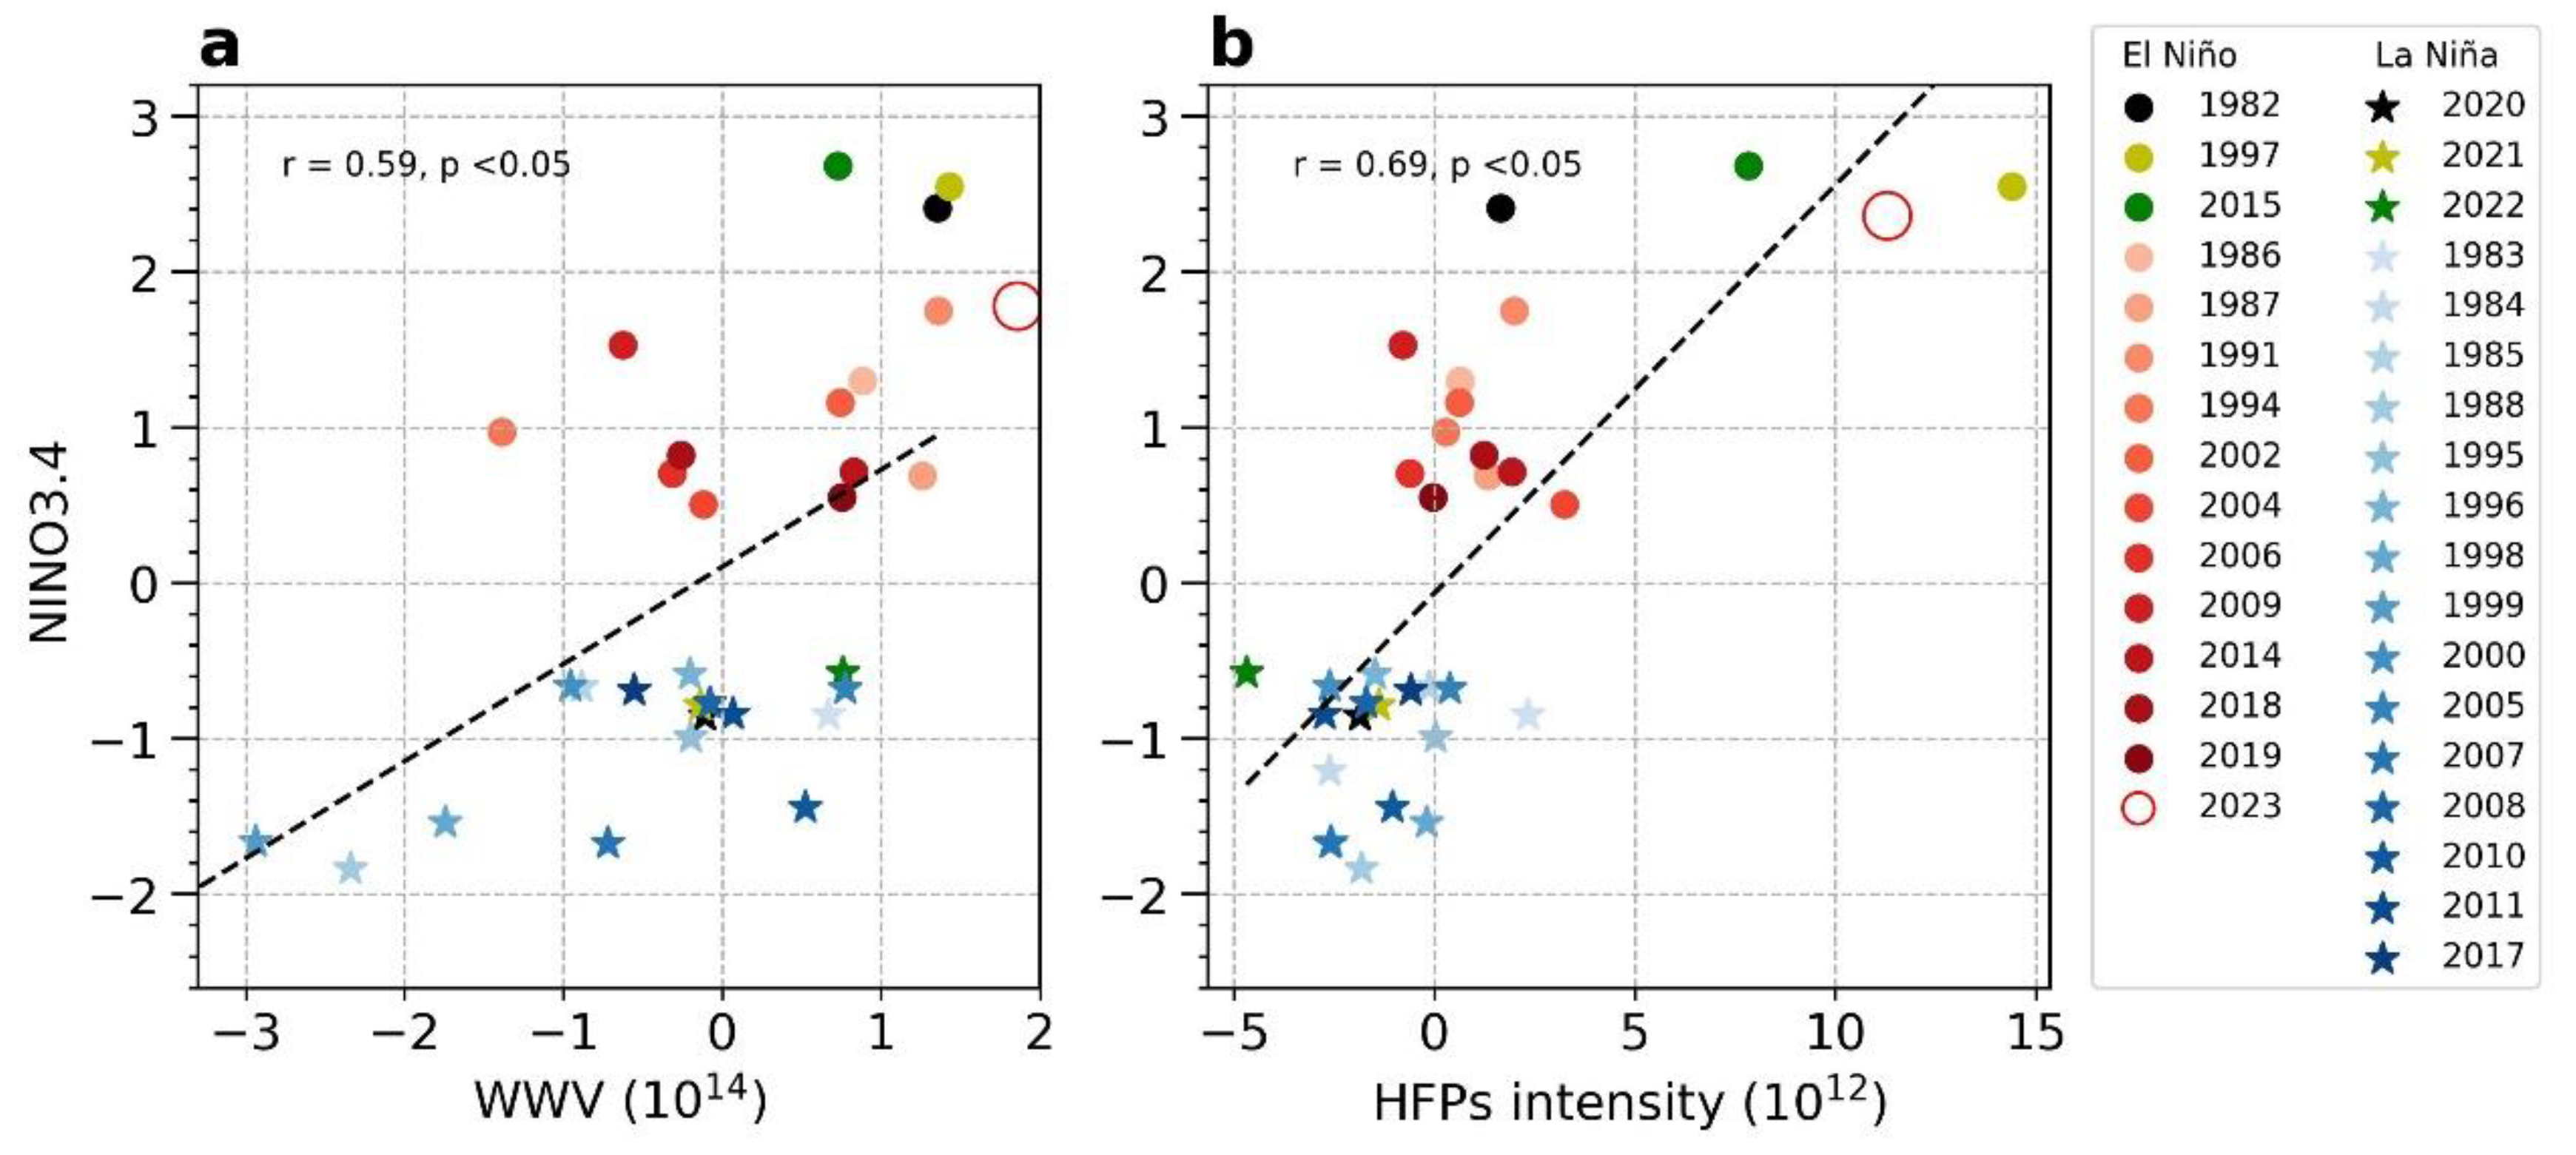
Figure 3 presents the scatterplots of the HC averaged in D(-1)JF(0) and the integrated HFPs in MAMJ(0) versus the NINO3.4 index averaged in D(0)JF(1) for every El Niño and La Niña event since 1982. Here we take HFPs in June into account because the strong EWS mentioned above occurred in late June 2014. From Figure 3a, it is clear that although ENSO intensity is positively and significantly correlated to the HC, the degree of HC buildup is not the only determining factor. For example, while the 1982/83 and 1997/98 extreme El Niño events were preceded by a very large HC buildup in the previous winter, the even stronger 2015/16 extreme El Niño was preceded by a moderate HC buildup. On the other hand, Figure 3b shows that ENSO intensity is also positively correlated with the spring and early summer HFPs. For instance, the WWBs in spring 2015 were strong enough to compensate for the weak HC buildup in the preceding winter, and to trigger and maintain the extreme 2015/16 El Niño event[28]. The results shown in Figure 3 can also be found using other datasets (Extended Data Figure 4).
Given the importance of HFPs to ENSO, it is desirable to include them in forecast models. Unfortunately, present climate models can hardly simulate HFPs in a realistic manner due to their multiplicative nature [7], as they are closely related to various synoptic and sub-seasonal processes. For example, WWBs are found to be associated with the western Pacific tropical cyclones[31,32], East Asian cold surge[33,34], and the Madden-Julian Oscillation[35,36]. Since WWBs are modulated by ENSO with stronger and more frequent bursts to occur during large El Niño events, it is possible to formulate semi-stochastic, environment-dependent parameterization for them[37]. The response of ENSO to WWBs is sensitive to the timing of their occurrence[17], and we have shown previously that the consecutive WWBs in spring and early summer are most effective drivers[17,22,25].
Here we take a simple approach to investigate how HFPs influence the 2023/24 El Niño by randomly adding a set of HFPs to our forecast model in MAMJ(0) (Methods). The number of HFPs are within the range of observations related to ENSO events (Extended Data Table 1), and the location, duration and intensity of them are statistically consistent with observed values. In order to reduce the uncertainty associated with the internal HFPs in the model itself, the forced experiments are conducted using the aforementioned low-pass filtering scheme, and are termed as CESM-TP+LP+HFPs. Thus the impact of the stochastic forcing of HFPs that may occur in spring and early summer can be evaluated on top of the deterministic low-frequency atmosphere-ocean coupling started from the current tropical Pacific Ocean HC buildup. The experiments are carried out from three initial conditions which predict the strongest, weakest, and medium event in D(0)JF(1) 2023 in the CESM-TP+LP (Figure 2d).
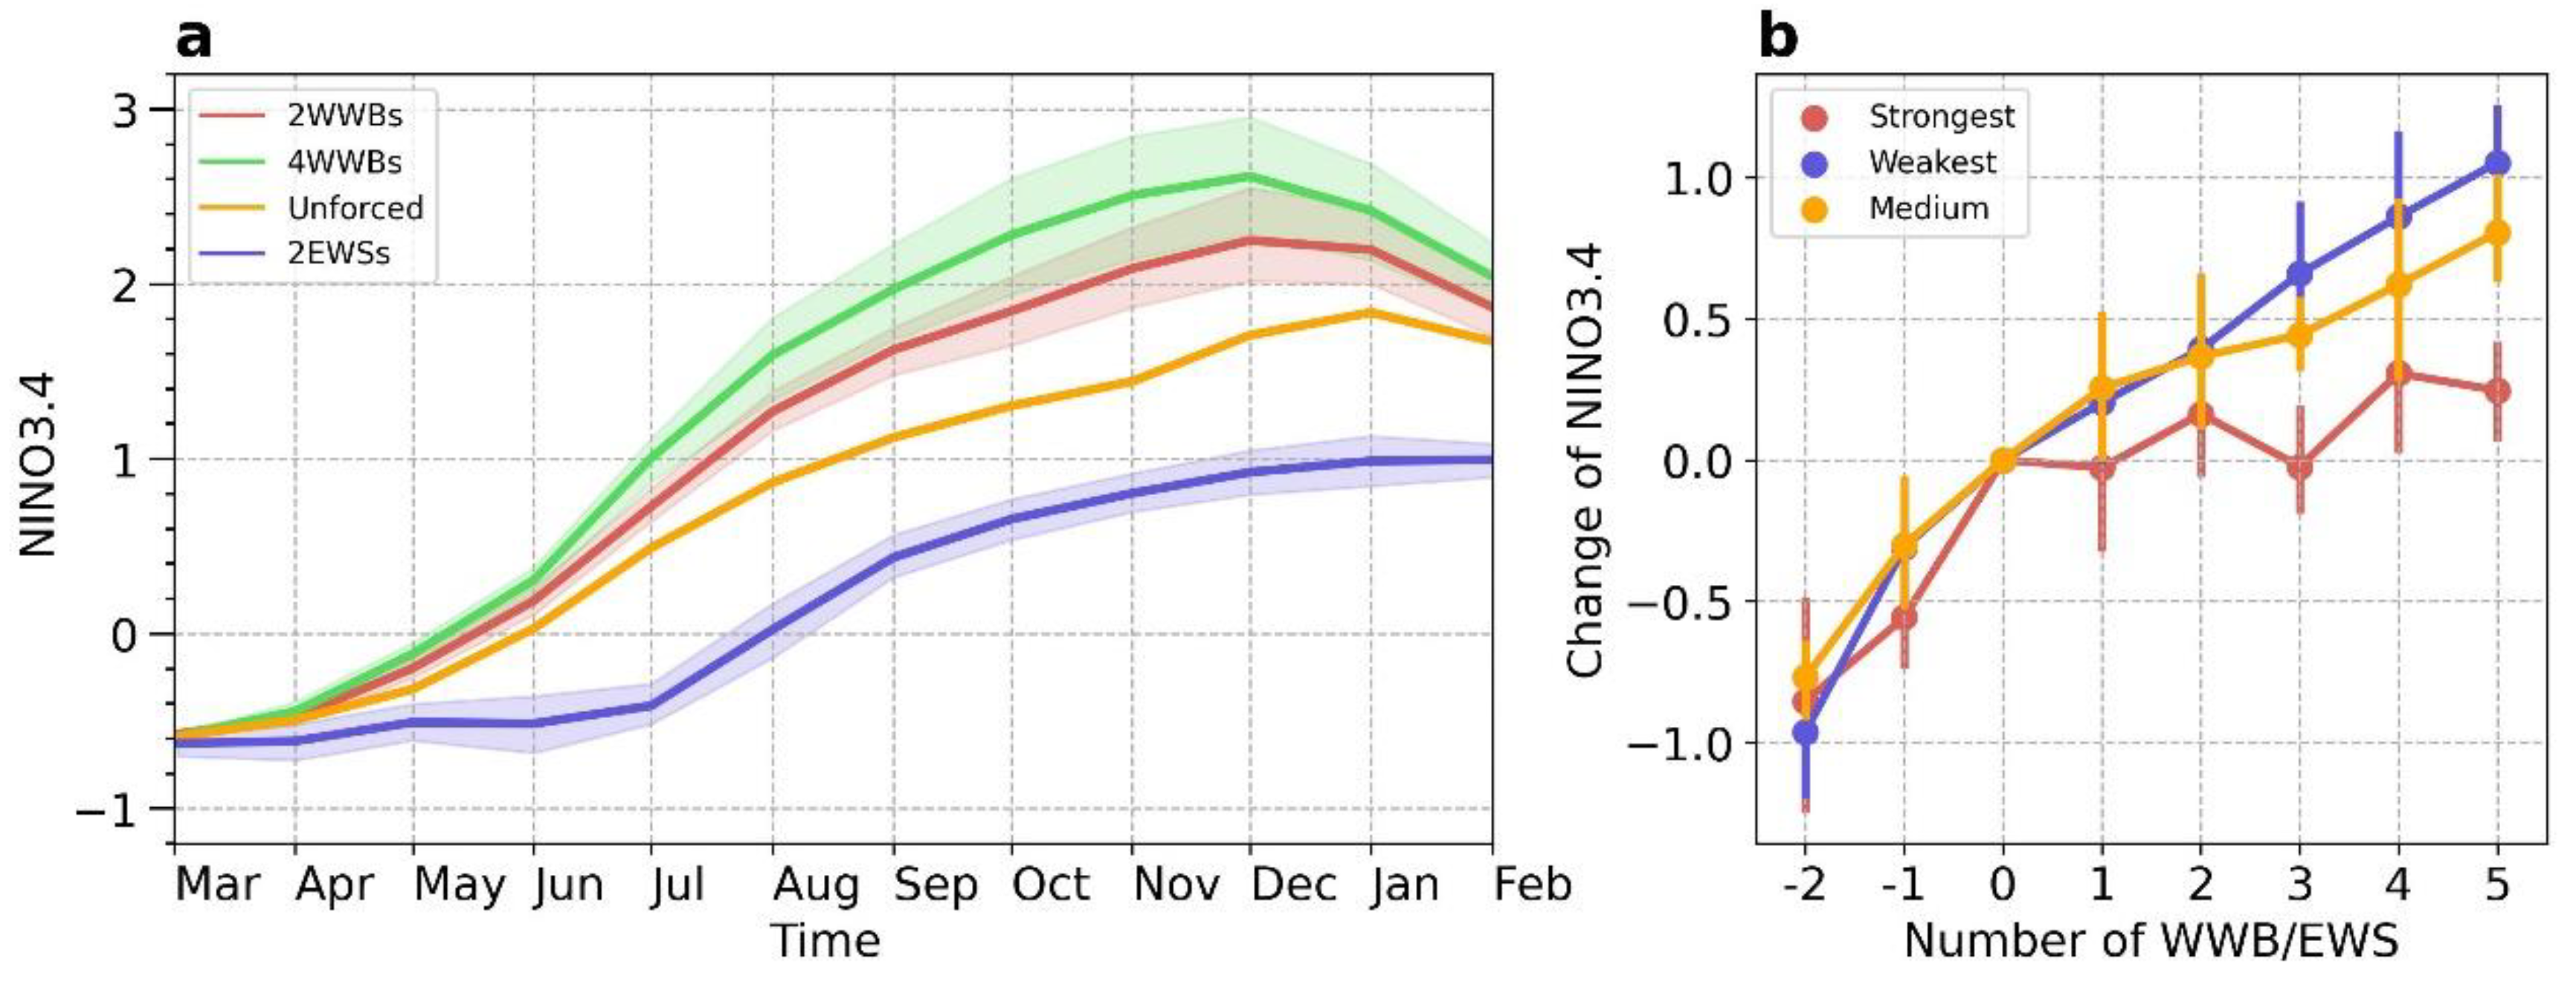
The predictions from the medium case are shown in Figure 4a for different number and type of HFPs. In general, El Niño intensity increases with more WWBs and decreases with more EWSs. In the case where four WWBs occur in MAMJ(0), the ensemble-mean of NINO3.4 in D(0)JF(1) is ~2.36°C. For reference, the WWB forcing in MAMJ(0) 1997 was equivalent to 5.04 WWBs used this experiment (Extended Data Table 1), and the intensity of 1997/98 El Niño was ~2.24°C. Another point worth noting is that adding two EWSs in MAMJ(0) prolongs the negative NINO3.4 to July 2023, yet the model still predicts a moderate El Niño in D(0)JF(1). This is different from Hu and Fedorov[30] who showed that the cease of the 2014/15 El Niño event was due to one shot of EWS. This is probably because the HC buildup in winter 2022 was much larger than that in winter 2013 so that even two strong EWSs cannot stop the warming tendency.
The changes of El Niño intensity from unforced to forced runs for all three groups of experiments are given in Figure 4b. Just like what we have seen in Figure 4a, adding WWBs (EWSs) increases (decreases) the 2023/24 El Niño intensity in all groups of model runs. However, the impact of WWBs decreases as the original intensity of El Niño increases. In other words, WWBs matter less when the HC buildup is large enough for a strong El Niño to come (as in 1982), but they are essential for the development of a strong El Niño when the HC buildup is relatively small (as in 2015)[12]. Considering the unprecedentedly large HC buildup this winter, we can reasonably expect the coming of a strong El Niño in spite of what would happen with the HFPs, as long as their number and magnitude are within the range of historically observed values.
In summary, the analyses presented here reveal that the buildup of the equatorial Pacific Ocean HC in winter 2022 ranks the largest over the past 40 years (Figure 1h). This HC buildup alone is sufficient to boost a strong El Niño event in late 2023, and such a daring prediction is not sensitive to the uncertainty in initial conditions (Figure 2c). Other uncertainties mostly come from two sources. One is the effects of randomly appearing HFPs, which would enhance the intensity of El Niño and even push it into an extreme event in the case of WWB, and would lower the magnitude of El Niño in the case of EWS (Figure 4). The other source of uncertainty is the influences from the processes outside of the tropical Pacific, which might degrade the 2023/24 El Niño to a moderate event if the prediction of our global model is to be trusted (Figure 2a). At any rate, the stage is set and the curtain is drawn for an El Niño to make its grand appearance.

Methods

Datasets

The ocean temperature datasets used in this study include the monthly Ocean Reanalysis System 5 (ORAS5)[38] from 1981 to present with a resolution of 0.25° × 0.25°(https://www.ecmwf.int/en/forecasts/dataset/ocean-reanalysis-system-5), and the monthly NCEP Global Ocean Data Assimilation System (GODAS) reanalysis [39] in the same period with a resolution of 0.33° × 1.0° (http://www.esrl.noaa.gov/psd/data/gridded /data.godas.html). The daily surface wind is from the fifth generation European Centre for Medium–Range Weather Forecasts reanalysis (ERA5)[40] with a resolution of 0.25° × 0.25° (https://www.ecmwf.int/en/forecasts/dataset/ecmwf-reanalysis-v5).

Statistics

Anomalies are obtained by removing climatological seasonal cycle based on period 1981-2010, and all datasets are de-trended by means of least-squares regression prior to analysis. The current year is defined as year (0), and the year before and after the current year as year (-1) and year (1), respectively. The correlation coefficients used in Figure 3 and Extended Figure 4 are the two-sided Pearson correlation coefficients, and the p-values are calculated using the cumulative distribution function (cdf) of the test statistic's distribution under the null hypothesis. The number of samples used in the bootstrap resampling in Figure 4 is 1000.

Definition of index and event

The thermocline depth is referred to as the depth of the 20°C isotherm (D20). The integral of the water volume above the D20 is termed as the warm water volume (WWV)[3]. A WWB/EWS event is defined as a westerly/easterly wind gust with surface wind stress anomaly exceeding three standard deviation, and the integral of surface wind stress during a WWB/EWS event over the equatorial Pacific (120°E-80°W, 5°S-5°N) stands for its intensity.

Model experiments

The CESM-G ENSO ensemble prediction system consists of the CESM coupled model[41] and a data assimilation system which assimilates wind below 500 hPa and the subsurface ocean temperature in the upper 500m provided by the GODAS and ERA5 datasets[42]. The random linear combinations of the first three leading relevant singular vectors[43] of ocean temperature in the upper 200m are used to generate 10 ensemble members, which are used to measure the influence of uncertainty in the upper ocean temperature on ENSO prediction. Along with the undisturbed initial condition, the ensemble ENSO prediction system contains 11 ensemble members. It has been demonstrated that this prediction system has a high ENSO hindcast skill in the recent decades[44].
The online low-pass filtering scheme is designed as follows. On each prediction day, the wind stress used to force the tropical Pacific Ocean is the averaged wind stress anomaly in the previous 60 days, along with the daily climatological wind stress on the current day. In this way, the wind stress perturbations with periods less than 60 days can be reduced. Since the duration of HFPs in observations and the CESM model are about 2 weeks[21], taking the 60-days average can effectively reduce the HFPs generated by the model itself during prediction[22].
In the CESM-TP+LP+HFPs experiments, we add idealized HFPs into model wind stress in MAMJ(0). The modeled HFPs preserve a Gaussian shape at the equator[37], with a magnitude of 0.2 Nm-2. The duration and spatial scales are set to 6 days, 20 degrees in longitude, and 5 degrees in latitude, respectively. The intensity of one HFP as measured by the integral of the wind stress over the equatorial Pacific is about 2.82×10¹² N. The longitudinal center of WWB and EWS are randomly selected within 120°E-180° and 180-120°W, respectively[23,29,30].

Author Contributions

T.Lian conceived the work. T. Lian, J.W. and T. Liu carried out model experiments. T. Lian and D.C. wrote the paper. D.W. carried out data analyses. All authors contributed to the interpretation of the analysis and model results, and to the improvement of the manuscript.

Acknowledgments

This work is supported by grants from the National Natural Science Foundation of China (42227901, 42022043), and the Scientific Research Fund of the Second Institute of Oceanography, MNR (QNYC2101).

Data Availability and Code Availability

The datasets and code of model experiments are available on request directed to T. Lian (liantao@sio.org.cn).

Conflicts of Interest

The authors declare that they have no competing interests.

References

  1. Sarachik, E.S.; Cane, M.A. The El Niño-Southern Oscillation Phenomenon; Cambridge University Press: London, 2010; 384p. [Google Scholar]
  2. Yeh, S.W.; et al. ENSO Atmospheric Teleconnections and Their Response to Greenhouse Gas Forcing. Rev. Geophys. 2018, 56, 185–206. [Google Scholar] [CrossRef]
  3. Meinen, C.S.; McPhaden, M.J. Observations of warm water volume changes in the equatorial Pacific and their relationship to El Niño and La Niña, J. Clim. 2000, 13, 3551–3559. [Google Scholar] [CrossRef]
  4. Ramesh, N.; Murtugudde, R. All flavours of El Niño have similar early subsurface origins. Nat. Clim. Chang. 2013, 3, 42–46. [Google Scholar] [CrossRef]
  5. Jin, F.F. An equatorial ocean recharge paradigm for ENSO. Part I: Conceptual model. J. Atmos. Sci. 1997, 54, 811–829. [Google Scholar]
  6. Chen, D.; Cane, M.A.; Kaplan, A.; et al. Predictability of El Niño over the past 148 years. Nature 2004, 428, 733–736. [Google Scholar] [CrossRef]
  7. Puy, M.; Vialard, J.; Lengaigne, M.; et al. Influence of westerly wind events stochasticity on El Niño amplitude: The case of 2014 vs. 2015. Clim. Dyn. 2019, 52, 7435–7454. [Google Scholar]
  8. A brief report of global ocean monitoring by the Climate Prediction Center, NCEP/NOAA released on March 10, 2023. Available online: https://www.cpc.ncep.noaa.gov/products/GODAS/ocean_briefing_gif/global_ocean_monitoring_2023_03.ppt.
  9. Bjerknes, J. Atmospheric teleconnections from the equatorial Pacific. Mon. Wea. Rev. 1969, 97, 163–172. [Google Scholar] [CrossRef]
  10. Levine, A.F.Z.; McPhaden, M.J. How the 14 easterly wind burst gave the 2015–2016 El Niño a head start. Geophys. Res. Lett. 2016, 43, 2016GL069204. [Google Scholar] [CrossRef]
  11. Rasmusson, E.M.; Carpenter, T.H. Variations in tropical sea surface temperature and surface wind fields associated with the Southern Oscillation/El Niño. Mon. Wea. Rev. 1982, 110, 354–384. [Google Scholar] [CrossRef]
  12. Lian, T.; Chen, D.; Tang, Y. The Genesis of the 2014-2016 El Niño events, Sci. China Earth Sci. 2016, 60, 1589–1600. [Google Scholar] [CrossRef]
  13. A reference defining ENSO strength category. Available online: https://climatedataguide.ucar.edu /climate-data/Niño-sst-indices-Niño-12-3-34-4-oni-and-tni.
  14. Timmermann, A.; An, S.; Kug, J.-S.; et al. El Niño–Southern Oscillation complexity. Nature 2018, 559, 535–545. [Google Scholar] [CrossRef] [PubMed]
  15. Cai, W.; Wu, L.; Lengaigne, M.; et al. Pantropical climate interactions. Science 2019. [Google Scholar] [CrossRef] [PubMed]
  16. Penland, C.; Sardeshmukh, P. D. The optimal growth of tropical sea surface temperature anomalies. J. Clim. 1995, 8, 1999–2024. [Google Scholar] [CrossRef]
  17. Hayashi, M.; Watanabe, M. Importance of background seasonality over the eastern equatorial Pacific in a coupled atmosphere-ocean response to westerly wind events. Clim. Dyn. 2019, 52, 7309–7327. [Google Scholar] [CrossRef]
  18. Chang, P.; Zhang, L.; Saravanan, R.; et al. Pacific meridional mode and El Niño–Southern Oscillation. Geophys. Res. Lett. 2007, 34, L16608. [Google Scholar] [CrossRef]
  19. Ham, Y.-G.; Kug, J.-S.; Park, J.-Y.; et al. Sea surface temperature in the north tropical Atlantic as a trigger for El Niño/Southern Oscillation events. Nat. Geosci. 2013, 6, 112–116. [Google Scholar] [CrossRef]
  20. Hu, R.; Lian, T.; Feng, J.; et al. Pacific meridional mode does not induce strong positive SST anomalies in the central equatorial Pacific. J. Clim. 2023. [CrossRef]
  21. Lian, T.; Tang, Y.; Zhou, L.; et al. Westerly wind bursts simulated in CAM4 and CCSM4, Clim. Dyn. 2017, 50, 1353–1371. [Google Scholar]
  22. Lian, T.; Chen, D. The essential role of early-spring westerly wind burst in generating the centennial extreme 1997/98 El Niño. J. Clim. 2021, 34, 8377–8388. [Google Scholar] [CrossRef]
  23. Harrison, D.E.; Vecchi, G.A. Westerly wind events in the tropical Pacific, 1986–1995. J. Clim. 1997, 10, 3131–3156. [Google Scholar] [CrossRef]
  24. Eisenman, I.; Yu, L.; Tziperman, E. Westerly wind bursts: ENSO’s tail rather than the dog. J. Clim. 2005, 18, 5224–5238. [Google Scholar] [CrossRef]
  25. Chen, D.; Lian, T.; Fu, C.; et al. Strong influence of westerly wind bursts on El Niño diversity. Nat. Geosci. 2015, 8, 339–345. [Google Scholar] [CrossRef]
  26. McPhaden, M.J. Climate oscillations: Genesis and evolution of the 1997–98 El Niño. Science 1999, 283, 950–954. [Google Scholar] [CrossRef] [PubMed]
  27. McPhaden, M.J. Playing hide and seek with El Niño. Nat. Clim. Chang. 2015, 5, 791–795. [Google Scholar] [CrossRef]
  28. Chiodi, A. M.; Harrison, D.E. Observed El Niño SSTA development and the effects of easterly and westerly wind events in 2014/15. J. Clim. 2017, 30, 1505–1519. [Google Scholar] [CrossRef]
  29. Chiodi, A.; Harrison, D.E. Equatorial Pacific easterly wind surges and the onset of La Niña events. J. Clim. 2015, 28, 776–792. [Google Scholar] [CrossRef]
  30. Hu, S.; Fedorov, A.V. Exceptionally strong easterly wind burst stalling El Niño of 2014. Proc. Natl. Acad. Sci. 2016, 113, 2005–2010. [Google Scholar] [CrossRef]
  31. Hartten, L.M. Synoptic settings of westerly wind bursts. J. Geophys. Res. 1996, 101, 16997–17019. [Google Scholar] [CrossRef]
  32. Lian, T.; Chen, D.; Tang, Y.; et al. Linkage between westerly wind bursts and tropical cyclones. Geophys. Res. Lett. 2018. [Google Scholar] [CrossRef]
  33. Yu, L.; Rienecker, M.M. Evidence of an extratropical atmospheric influence during the onset of the 1997-98 El Niño. Geophys. Res. Lett. 1998, 25. [Google Scholar] [CrossRef]
  34. Feng, J.; Lian, T.; Ding, Y.; et al. Two Types of the East Asian Cold Surge and Their Impacts on El Niño, Geophys. Res. Lett. 2022, 49, e2021GL096108. [Google Scholar] [CrossRef]
  35. Puy, M.; Vialard, J.; Lengaigne, M.; et al. Modulation of equatorial Pacific westerly/easterly wind events by the Madden-Julian oscillation and convectively-coupled Rossby waves, Clim. Dyn. 2015, 46, 2155–2178. [Google Scholar]
  36. Feng, J.; Lian, T. Assessing the Relationship between MJO and Equatorial Pacific WWBs in Observations and CMIP5 Models. J. Clim. 2018, 31, 6393–6410. [Google Scholar] [CrossRef]
  37. Gebbie, G.; Tziperman, E. Predictability of SST-modulated westerly wind bursts. J. Clim. 2009, 22, 3894–3909. [Google Scholar] [CrossRef]
  38. Zuo, H.; Balmaseda, M.A.; Tietsche, S.; et al. The ECMWF operational ensemble reanalysis–analysis system for ocean and sea ice: A description of the system and assessment. Ocean Sci. 2019, 15, 779–808. [Google Scholar] [CrossRef]
  39. Saha, S.N.; Thiaw, C.; Wang, J.; et al. The NCEP Climate Forecast System. J. Clim. 2006, 19, 3483–3517. [Google Scholar] [CrossRef]
  40. Hersbach, H.; Bell, B.; Berrisford, P.; et al. The ERA5 global reanalysis. Q. J. R. Meteorol. Soc. 2020, 146, 1999–2049. [Google Scholar] [CrossRef]
  41. Vertenstein, M.; Craig, T.; Middleton, A.; et al. CESM1.0.4 users guide; National Center of Atmosphere Research: Boulder, CO, 2012. [Google Scholar]
  42. Song, X.; Li, X.; Zhang, S.; et al. A new nudging scheme for the current operational climate prediction system of the National Marine Environmental Forecasting Center of China. Acta Oceanol. Sin. 2021, 41, 51–64. [Google Scholar] [CrossRef]
  43. Kleeman, R.; Tang, Y.; Moore, A. The calculation of climatically relevant singular vectors in the presence of weather noise. J. Atmos. Sci. 2003, 60, 2856–2867. [Google Scholar] [CrossRef]
  44. Liu, T.; Song, X.; Tang, Y.; et al. ENSO Predictability over the Past 137 Years Based on a CESM Ensemble Prediction System, J. Clim. 2022, 35, 763–777. [Google Scholar] [CrossRef]
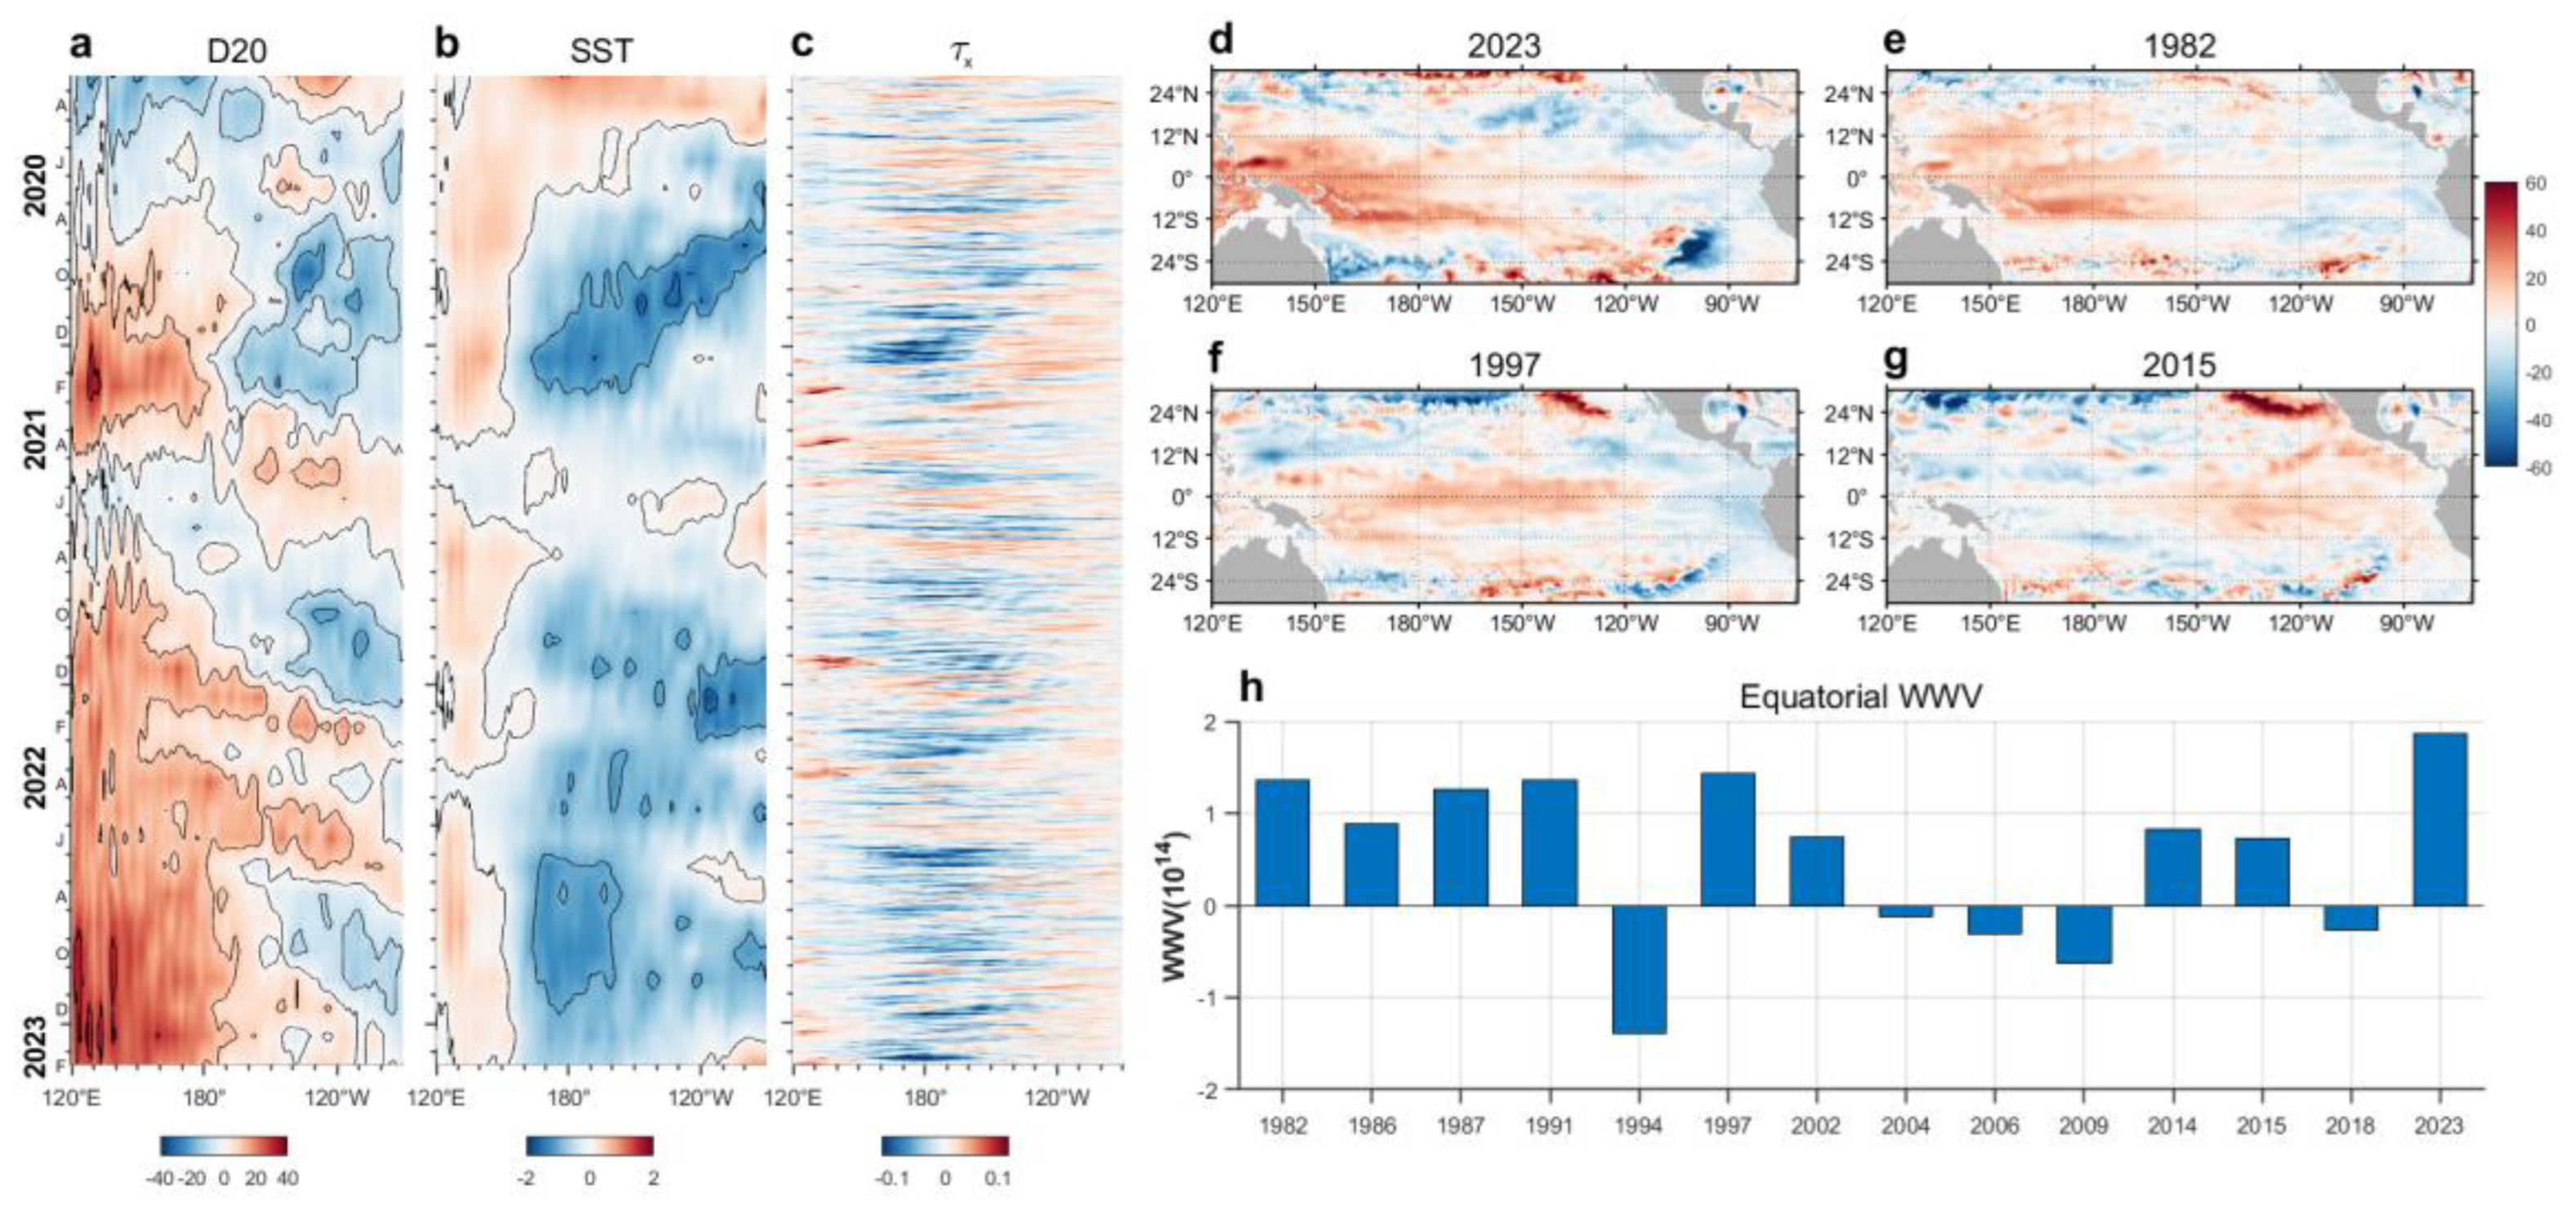
Figure 1. Tropical Pacific Ocean heat content. (a-c) Evolutions of thermocline depth (D20, unit of m), SST (unit of °C) and zonal wind stress (τx, unit of Nm-2) anomalies along the equator (averaged over 5°S-5°N) from March 2022 to February 2023. (d-g) Comparison of the D20 map in the winter 2023 (D(-1)JF(0)) to those preceding three previous extreme El Niño events. (h) The integral of the warm water volume (WWV, unit of m3) over the equatorial Pacific (120°E-80°W 5°S-5°N) in D(-1)JF(0) preceding every El Niño event since 1982, and in 2023. Data is from ORAS5.
Preprints 70960 g001
Figure 2. Predictions of NINO3.4 index from Mar 2023 by different models. (a) Global model, CESM-G. (b) Tropical Pacific model, CESM-TP. (c) Tropical Pacific model with an online low-pass filtering scheme, CESM-TP+LP. Grey thin curves are 11 ensemble members with different initial conditions, and black thick curves denote the ensemble-mean. Red, blue, and yellow lines in (c) denote the ensemble members showing the strongest, weakest, and medium NINO3.4 in D(0)JF(1) 2023, respectively.
Preprints 70960 g002
Figure 3. Dependence of ENSO intensity on WWV and HFPs. (a) Scatterplot of the NINO3.4 index (unit of °C) in D(0)JF(1) versus the equatorial WWV (unit of m3) in D(-1)JF(0). (b) Scatterplot of the NINO3.4 index in D(0)JF(1) versus the HPFs intensity (unit of N) in MAMJ(0). The HFPs intensity is measured by the integral of HPFs over the equatorial Pacific (120°E-80°W, 5°S-5°N). The NINO3.4 index in D(0)JF(1) 2023 used in (a) is obtained from the CESM-TP+LP run, and that used in (b) is from the CESM-TP+LP+HFPs run with 4 idealized WWBs added in MAMJ(0). Black dashed lines denote linear regressions. r and p denote the correlation coefficient and risk of rejecting the null hypothesis, respectively. Data is from ORAS5.
Preprints 70960 g003
Figure 4. Impacts of HFPs on 2023/24 El Niño. (a) Predictions of the NINO3.4 index from Mar 2023 when different number and type of HFPs are added in MAMJ(0) 2023. (b) Changes in NINO3.4 between forced and unforced runs as a function of the number of HFPs. Positive and negative number in (b) denote WWB and EWS, respectively. Shading in (a) and error bars in (b) denote the 95% bootstrap confidence level.
Preprints 70960 g004
Disclaimer/Publisher’s Note: The statements, opinions and data contained in all publications are solely those of the individual author(s) and contributor(s) and not of MDPI and/or the editor(s). MDPI and/or the editor(s) disclaim responsibility for any injury to people or property resulting from any ideas, methods, instructions or products referred to in the content.
Copyright: This open access article is published under a Creative Commons CC BY 4.0 license, which permit the free download, distribution, and reuse, provided that the author and preprint are cited in any reuse.
Prerpints.org logo

Preprints.org is a free preprint server supported by MDPI in Basel, Switzerland.

Subscribe

© 2024 MDPI (Basel, Switzerland) unless otherwise stated