Submitted:
12 April 2023
Posted:
13 April 2023
You are already at the latest version
Abstract
Keywords:
1. Introduction
2. Materials and Methods
2.1. Chemicals and Reagents
2.2. Cell Lines
2.3. Clonogenic Assays
2.4. Western Blotting
2.5. MTS Assay
2.6. HRR Assay
2.7. Quantitative reverse transcription PCR
2.8. Wound healing assay
2.9. Statistics
3. Results
3.1. TGFβ induces mesenchymal markers and morphology in ovarian cancer cells
3.2. TGFβ alters expression of EMT markers in PEO1 and PEO4
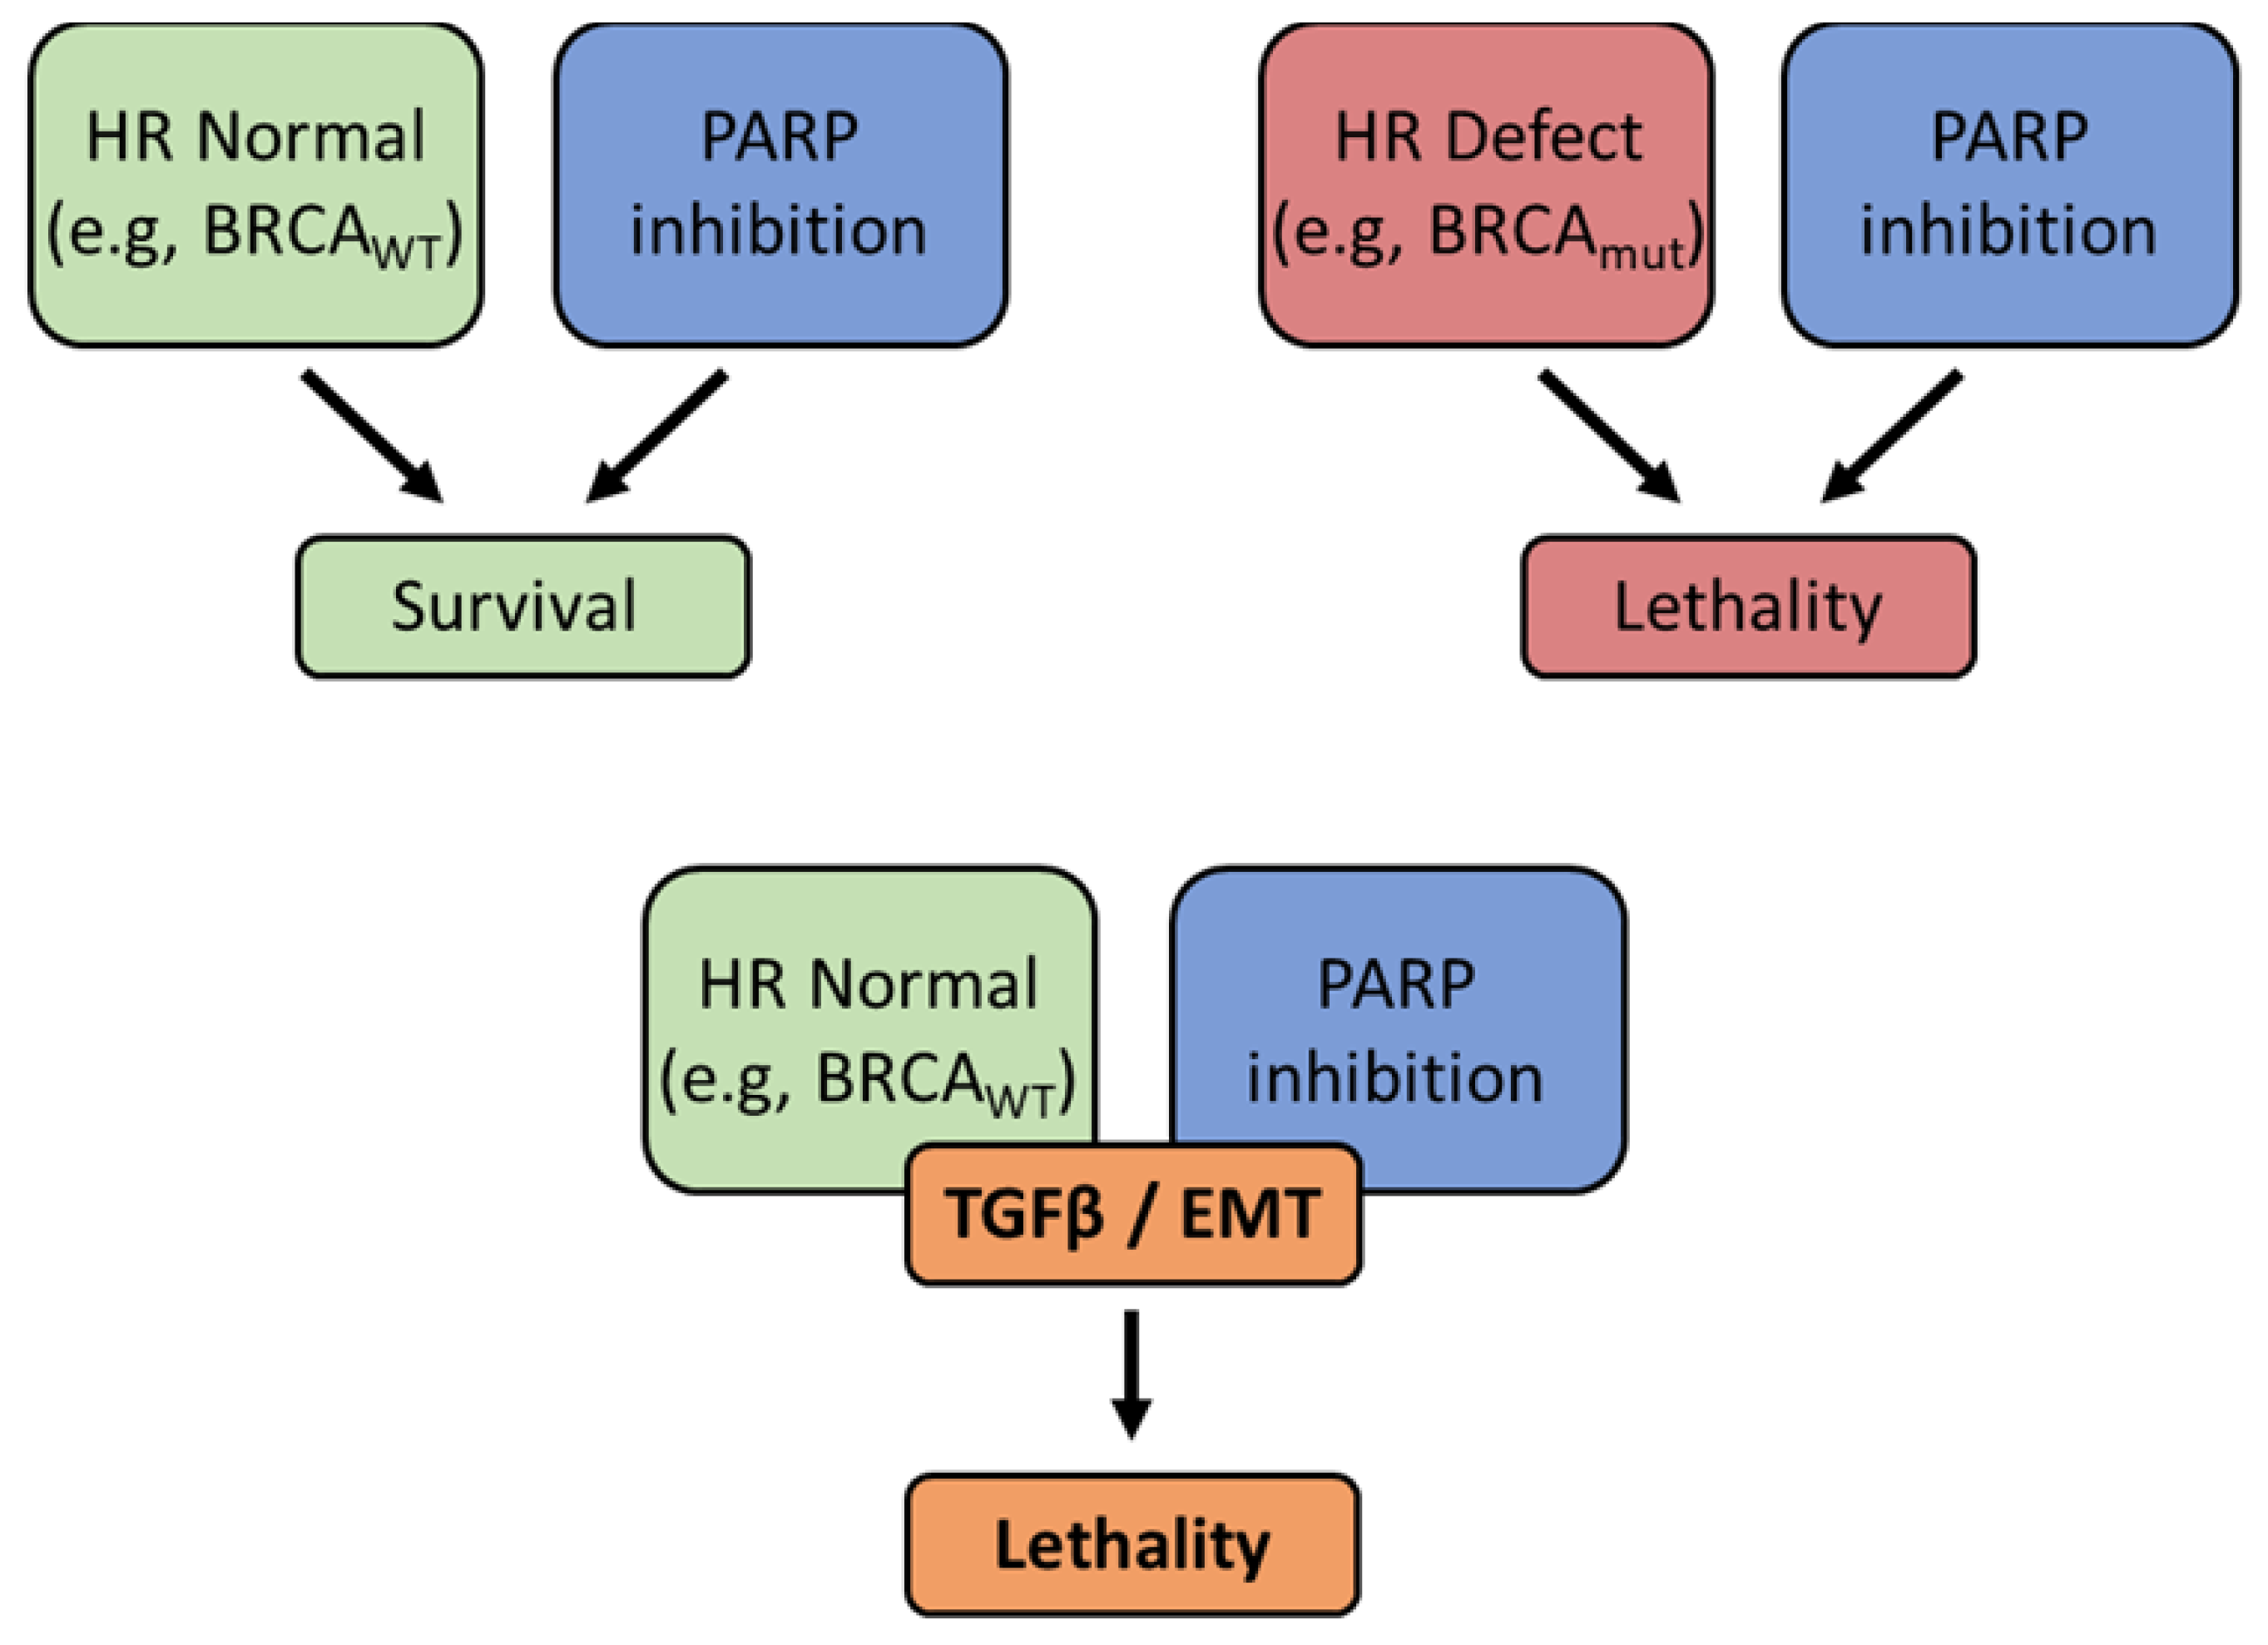
3.3. TGFβ downregulates HR proteins in BRCA2 WT cells and sensitizes them to olaparib
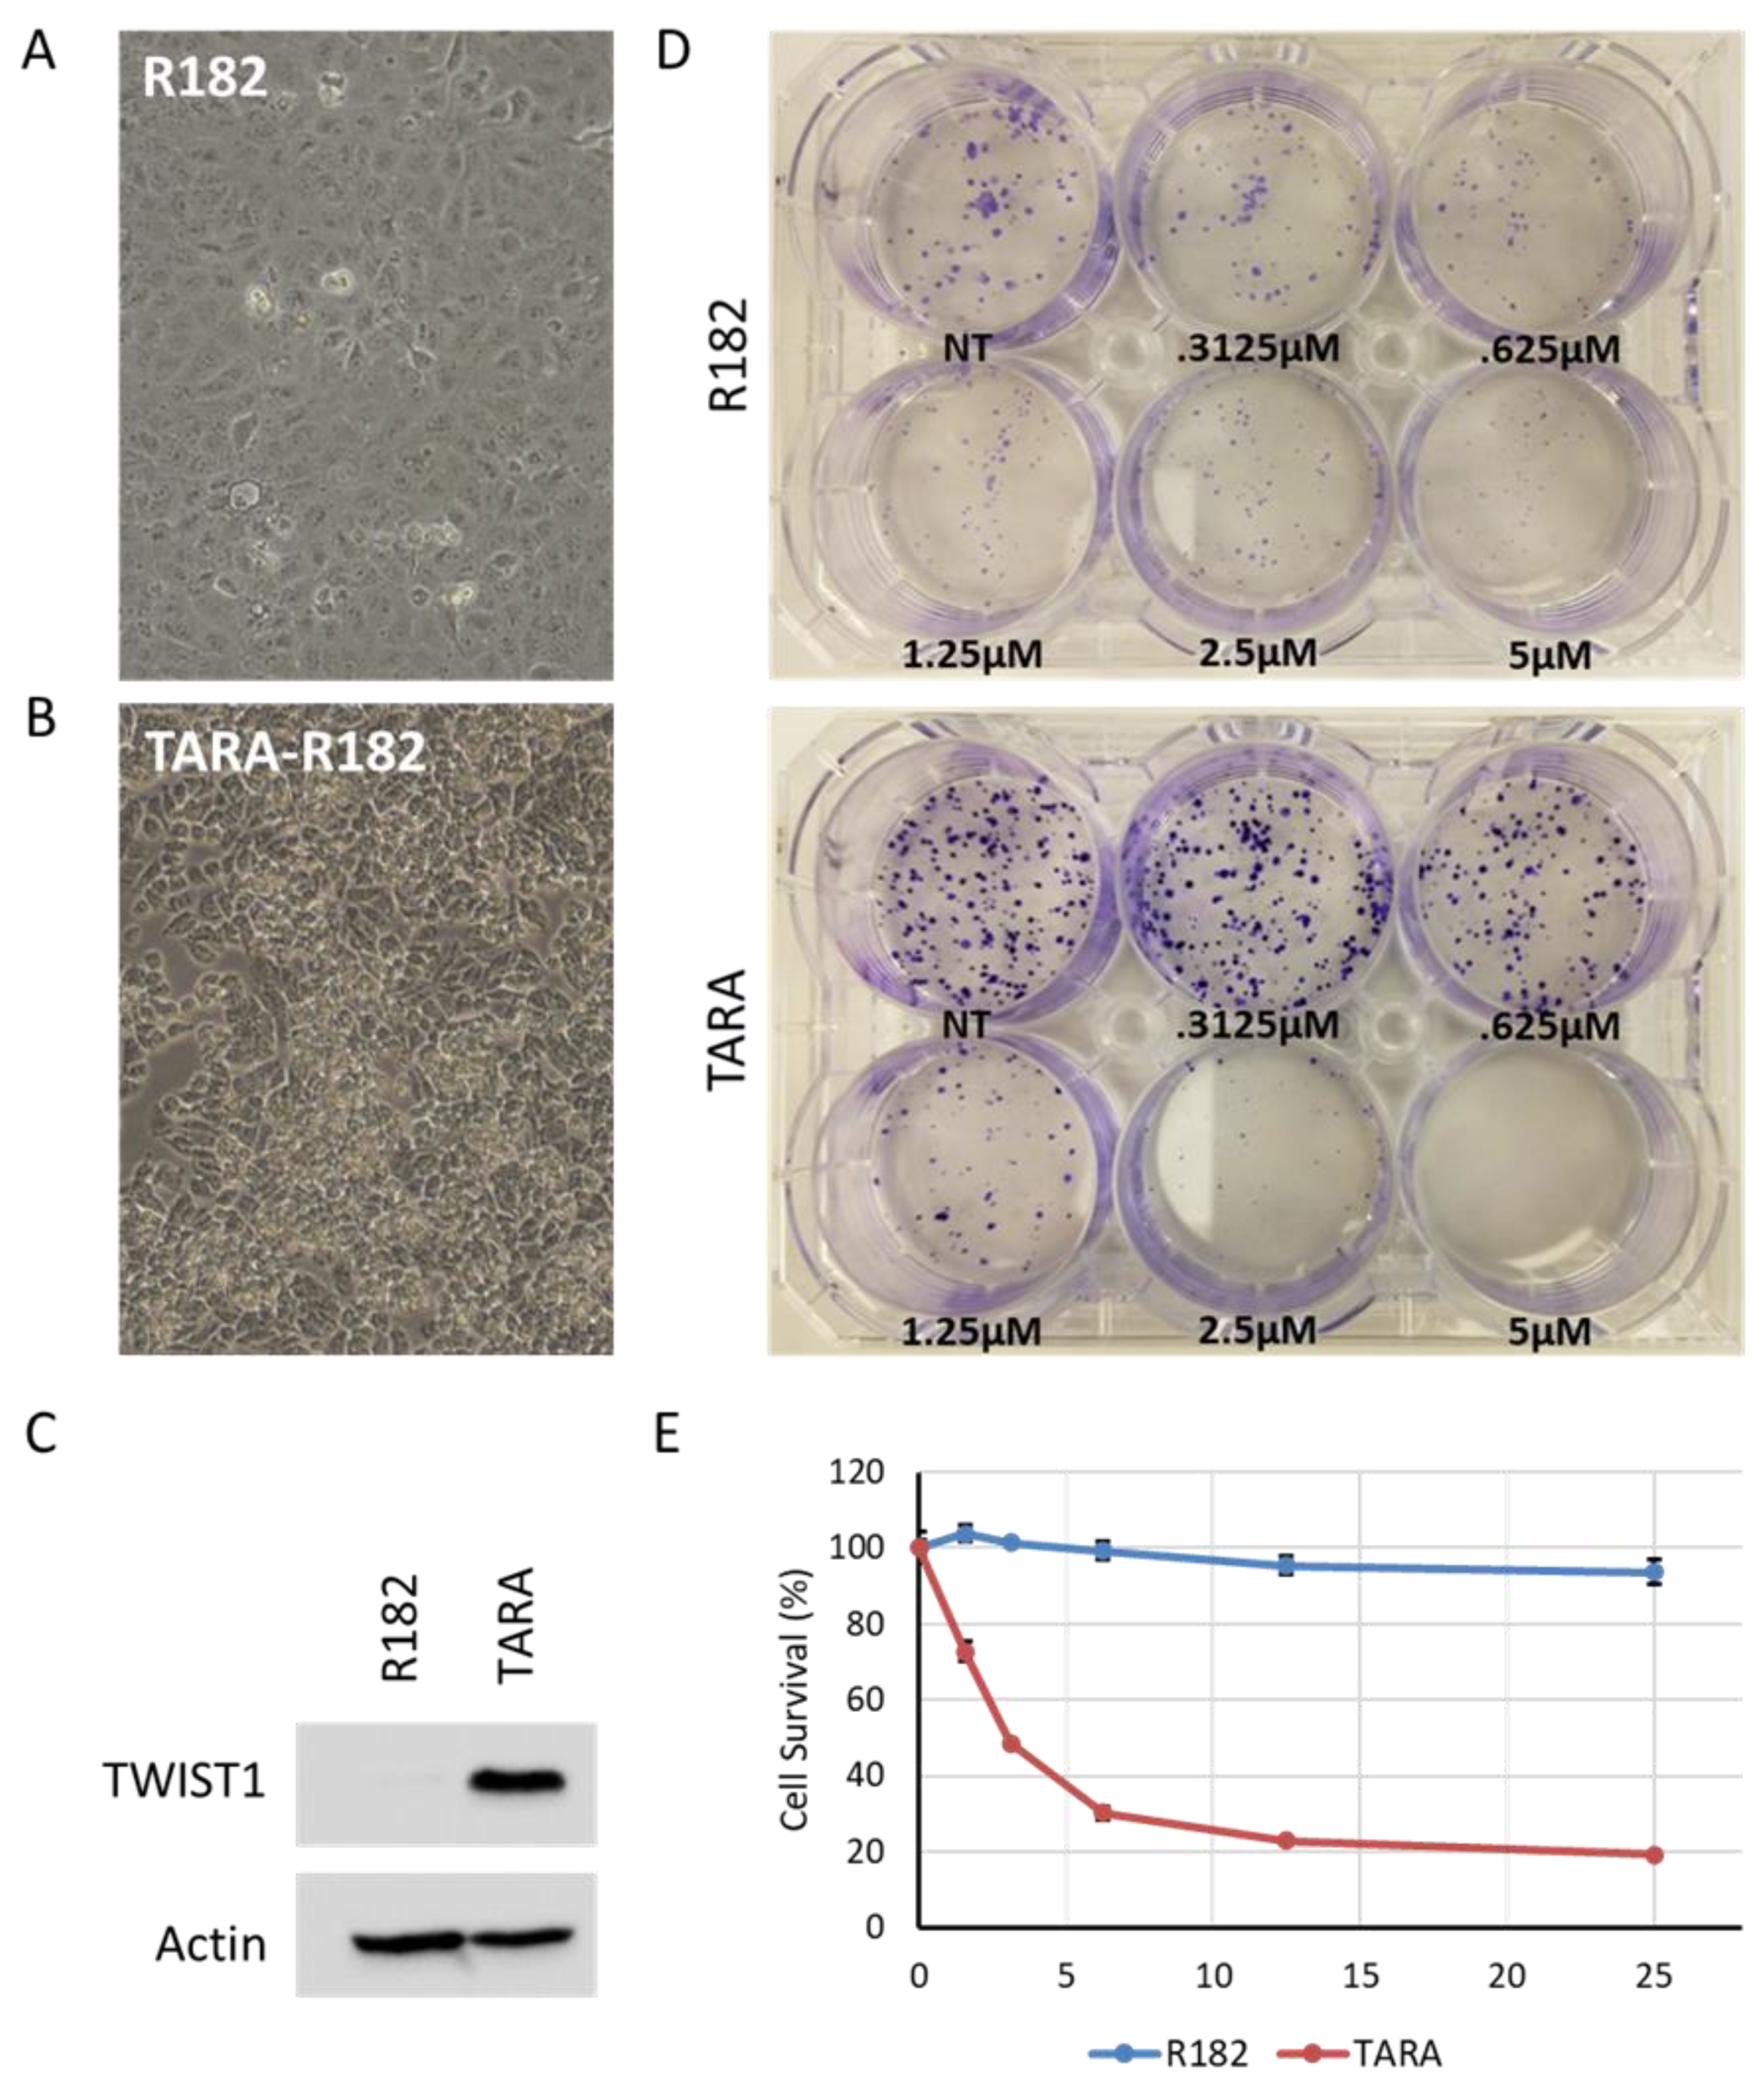
3.4. EMT also sensitizes ovarian cancer cells to PARP inhibition
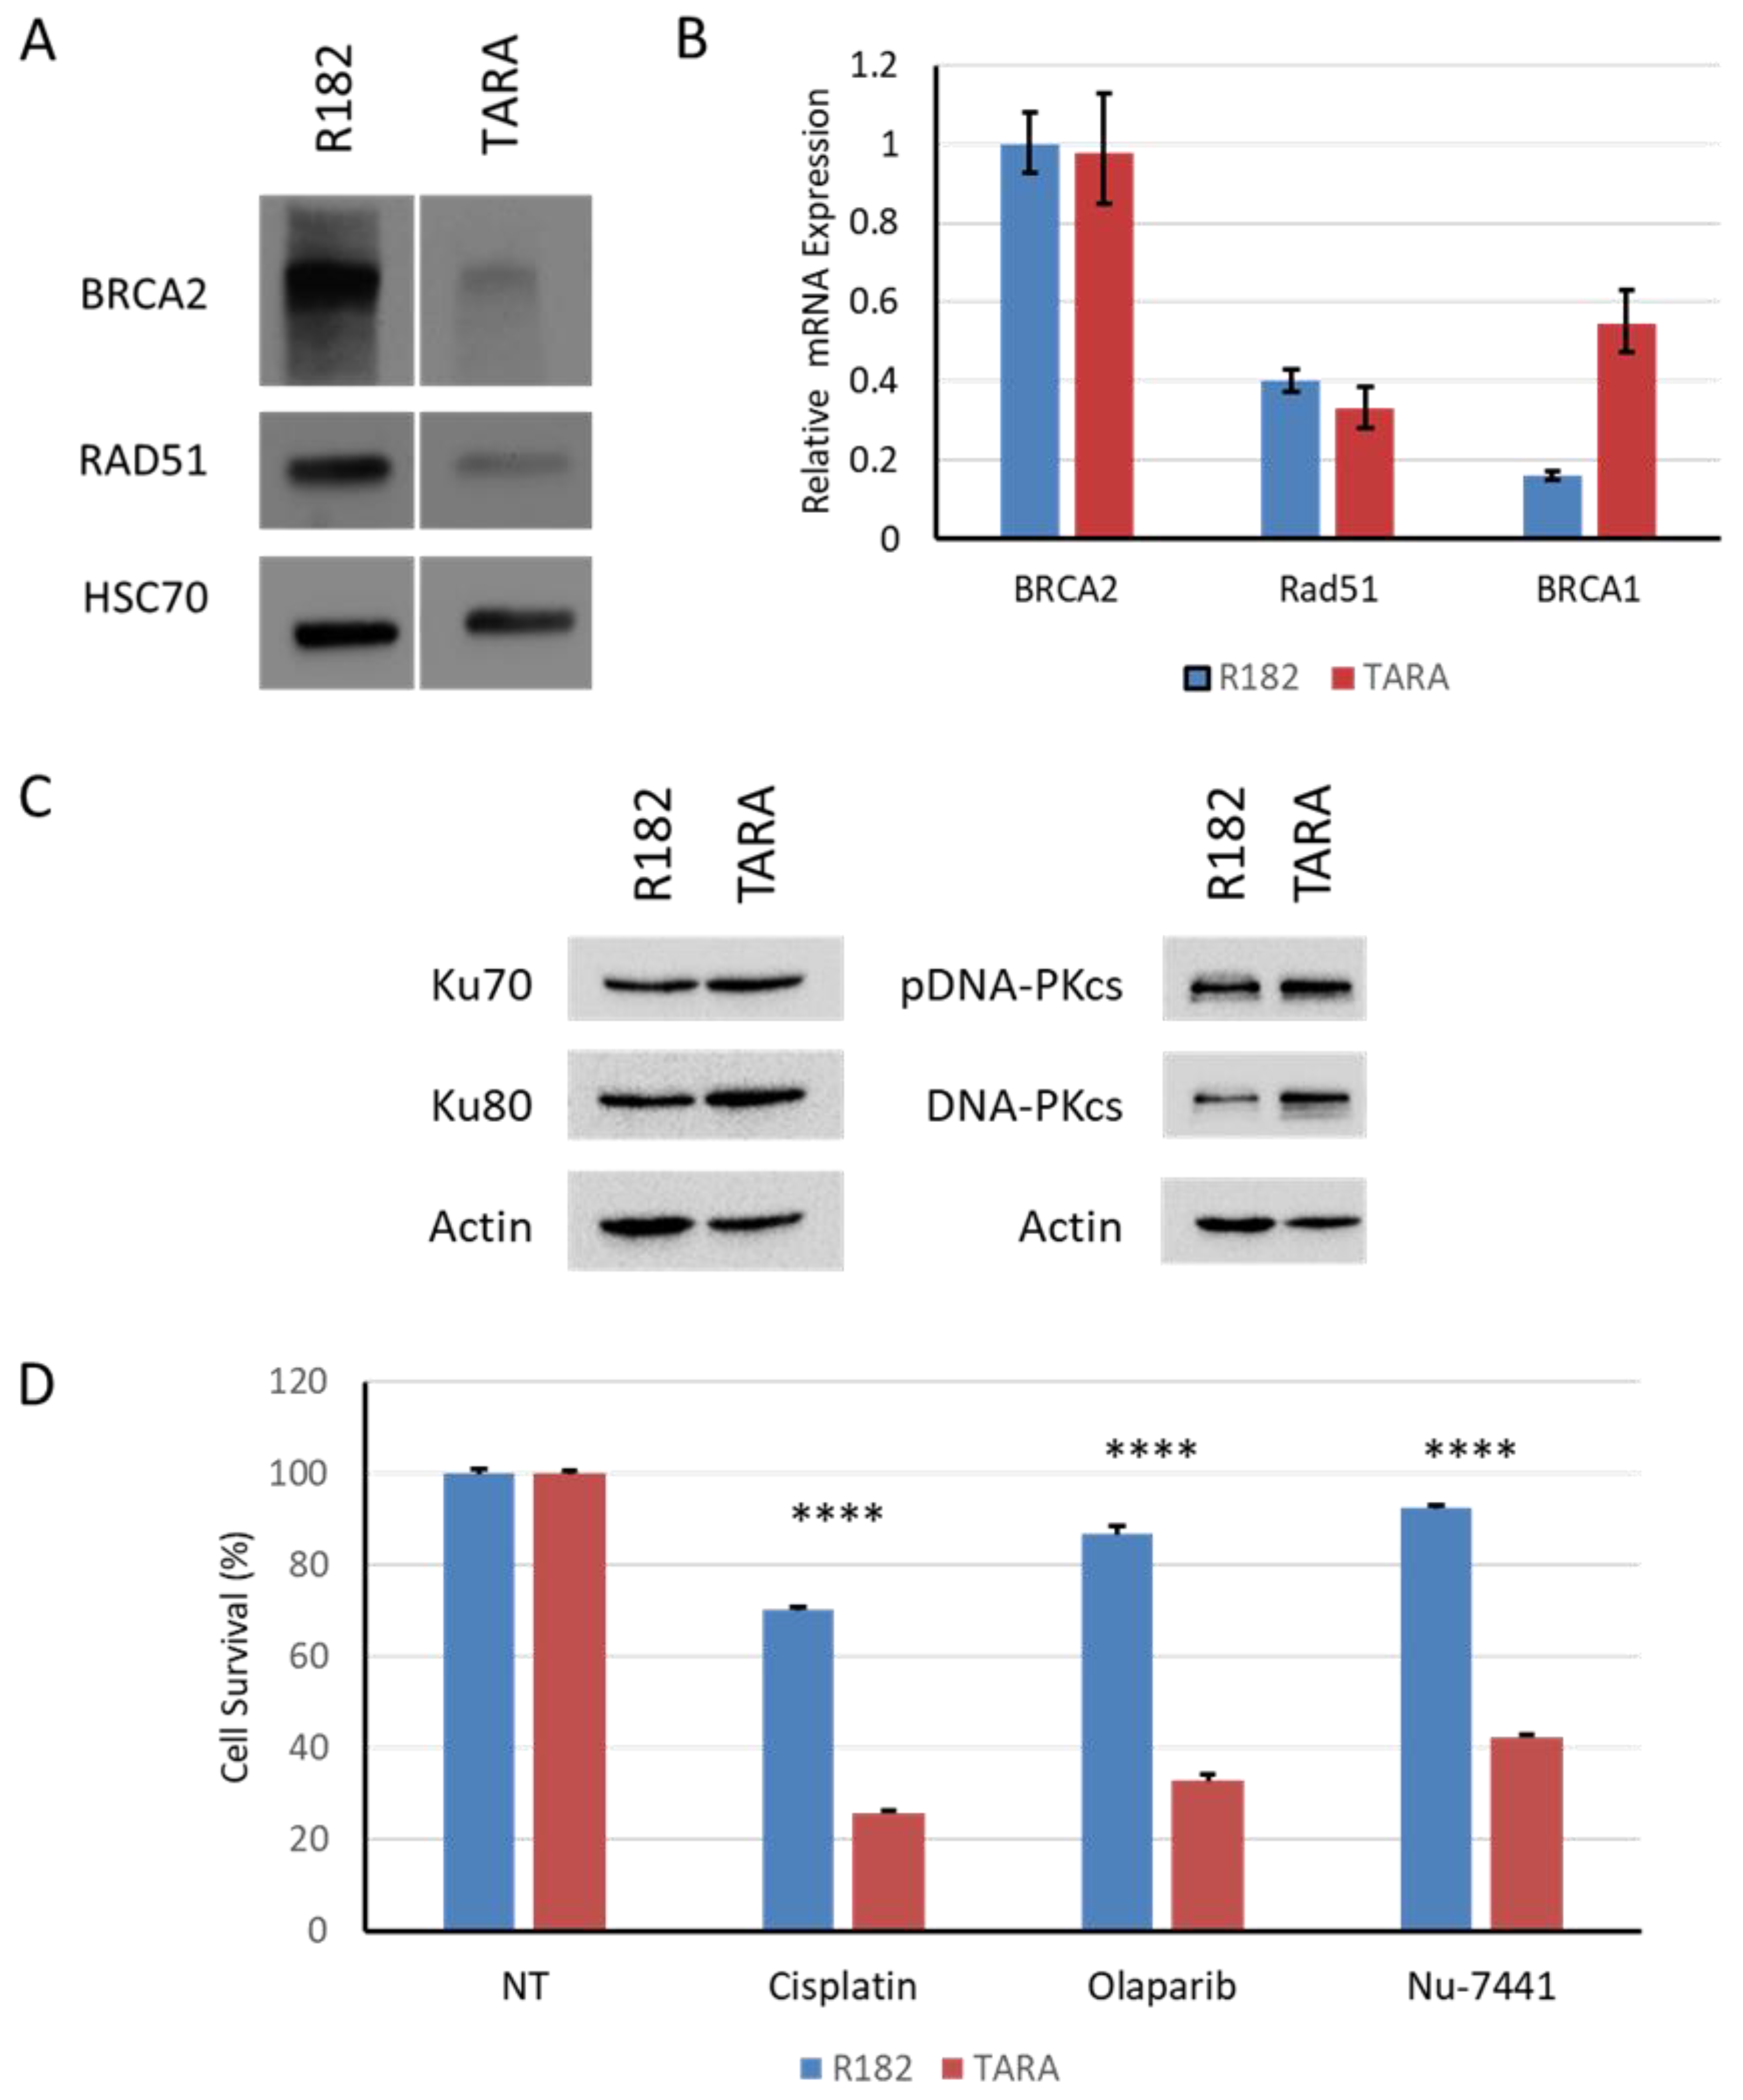
3.5. EMT alters HR gene expression
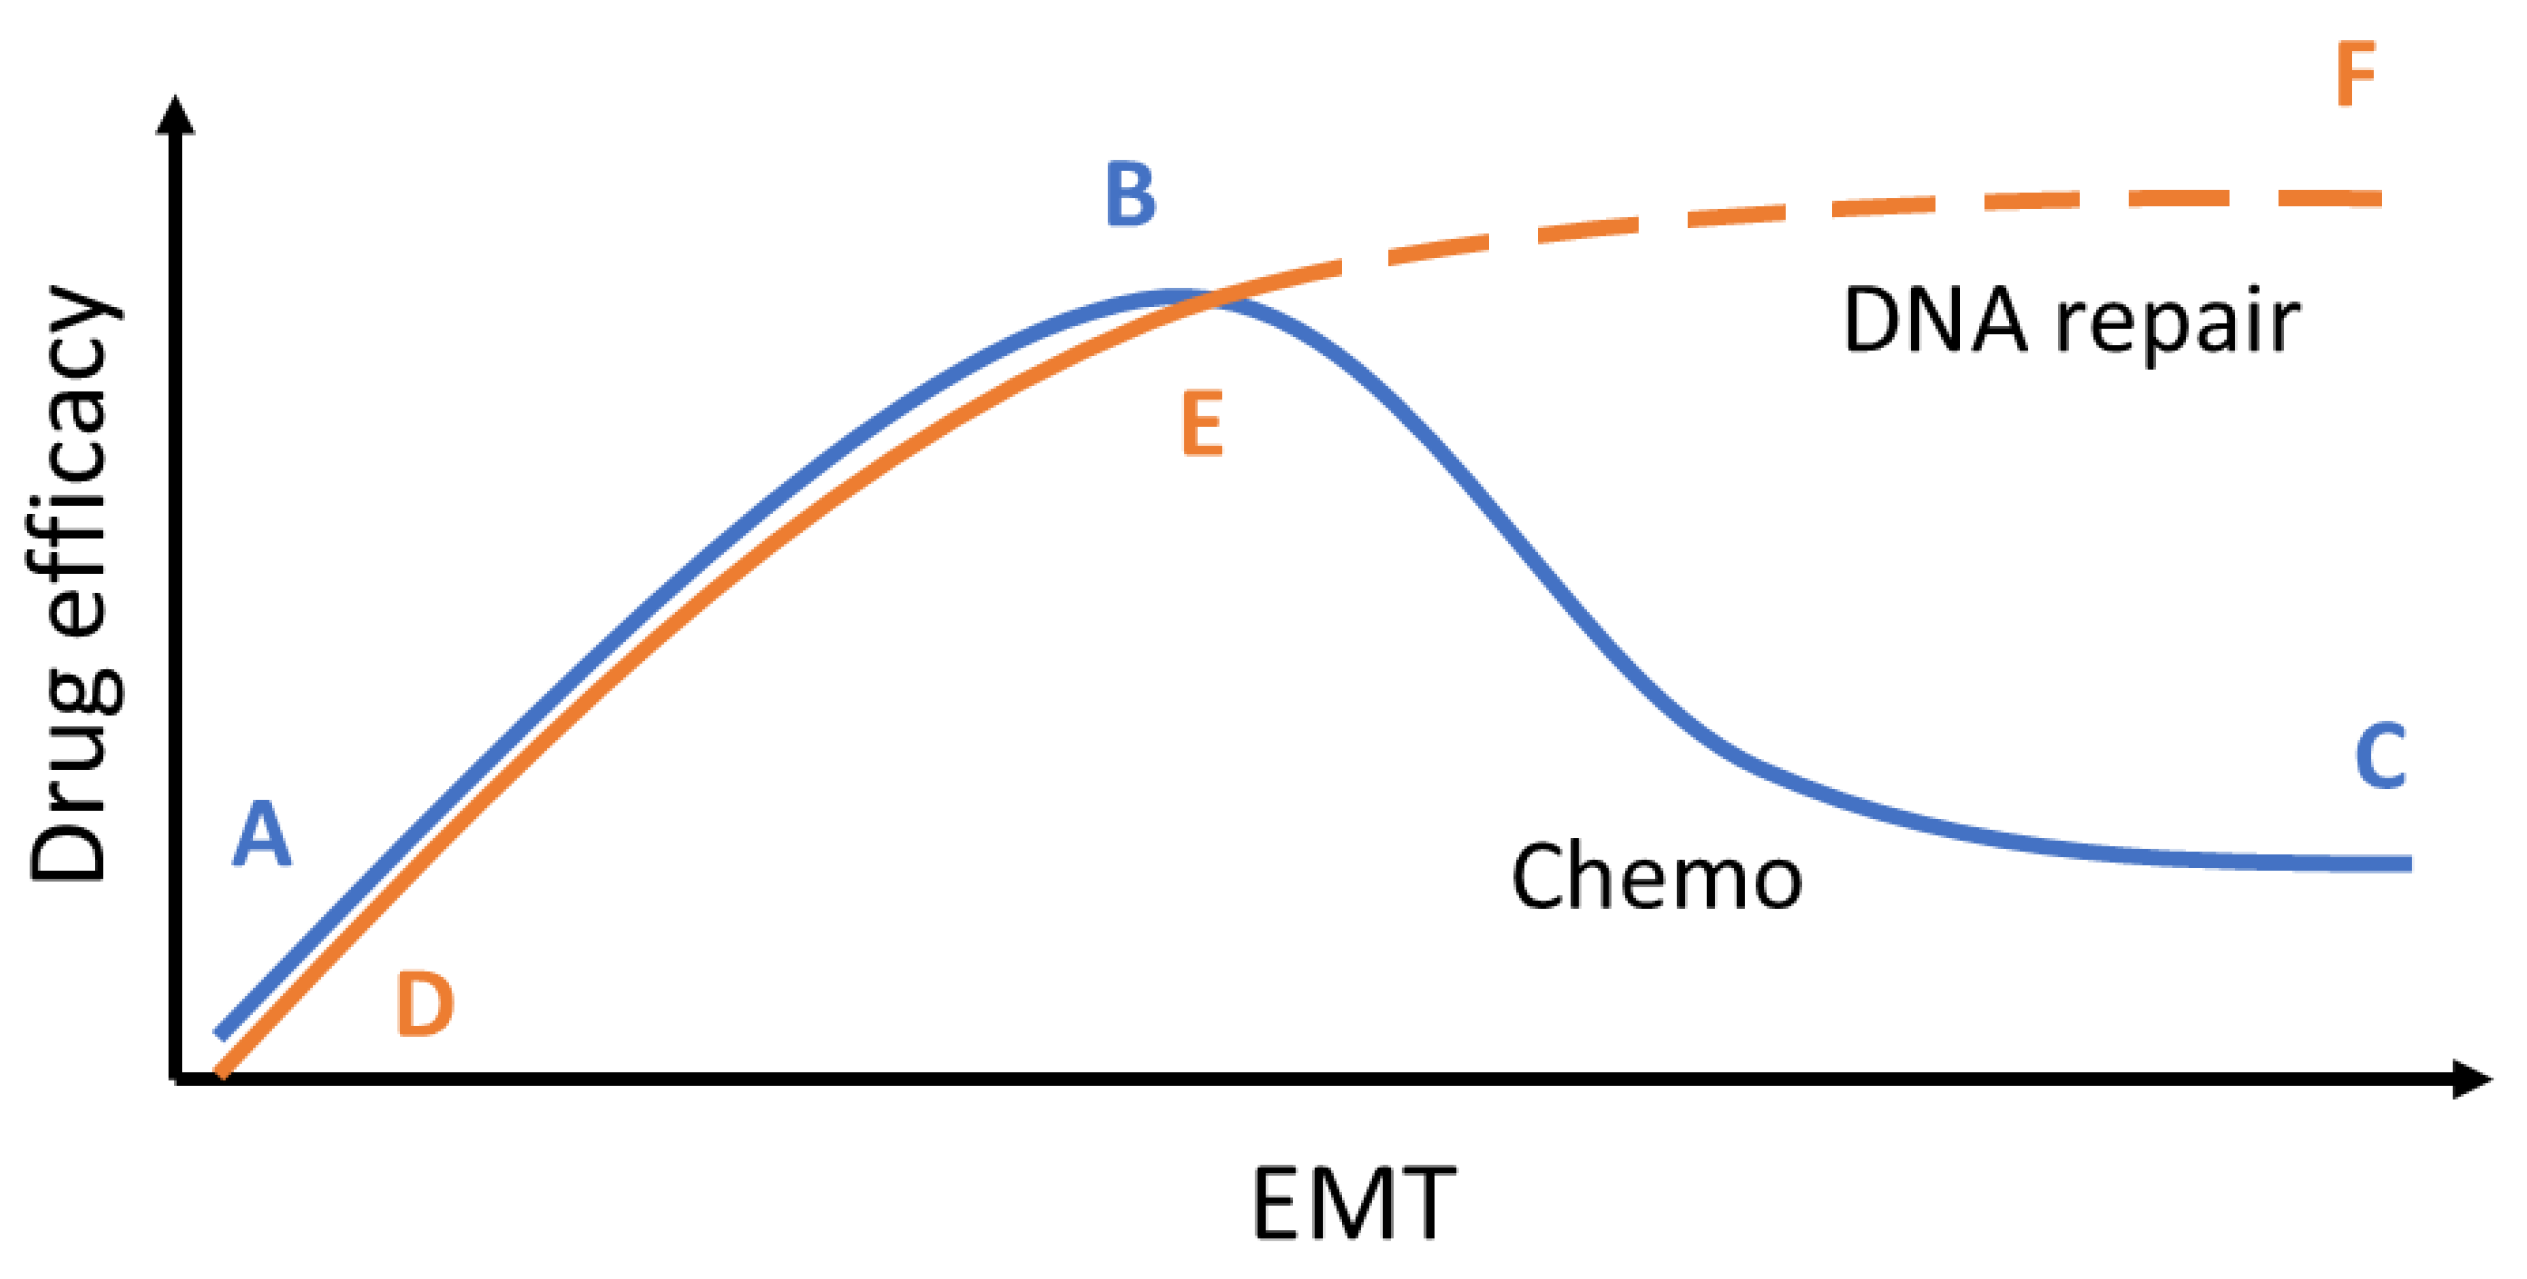
3.6. EMT induces an alternate DNA repair pathway and opens an additional therapeutic window
4. Discussion
5. Conclusions
Supplementary Materials
Author Contributions
Funding
Institutional Review Board Statement
Informed Consent Statement
Data Availability Statement
Acknowledgments
Conflicts of Interest
References
- Siegel, R.L.; Miller, K.D.; Wagle, N.S.; Jemal, A. Cancer Statistics, 2023. CA Cancer J Clin 2023, 73, 17–48. [Google Scholar] [CrossRef] [PubMed]
- Allemani, C.; Weir, H.K.; Carreira, H.; Harewood, R.; Spika, D.; Wang, X.-S.; Bannon, F.; Ahn, J.V.; Johnson, C.J.; Bonaventure, A.; et al. Global Surveillance of Cancer Survival 1995–2009: Analysis of Individual Data for 25 676 887 Patients from 279 Population-Based Registries in 67 Countries (CONCORD-2). Lancet 2015, 385, 977–1010. [Google Scholar] [CrossRef] [PubMed]
- Jayson, G.C.; Kohn, E.C.; Kitchener, H.C.; Ledermann, J.A. Ovarian Cancer. Lancet 2014, 384, 1376–1388. [Google Scholar] [CrossRef] [PubMed]
- McCabe, N.; Turner, N.C.; Lord, C.J.; Kluzek, K.; Bialkowska, A.; Swift, S.; Giavara, S.; O’Connor, M.J.; Tutt, A.N.; Zdzienicka, M.Z.; et al. Deficiency in the Repair of DNA Damage by Homologous Recombination and Sensitivity to Poly(ADP-Ribose) Polymerase Inhibition. Cancer Res 2006, 66, 8109–8115. [Google Scholar] [CrossRef] [PubMed]
- Kyle, S.; Thomas, H.D.; Mitchell, J.; Curtin, N.J. Exploiting the Achilles Heel of Cancer: The Therapeutic Potential of Poly(ADP-Ribose) Polymerase Inhibitors in BRCA2-Defective Cancer. Br J Radiol 2008, 81 Spec No 1, S6–S11. [Google Scholar] [CrossRef]
- Ratner, E.S.; Sartorelli, A.C.; Lin, Z.P. Poly (ADP-Ribose) Polymerase Inhibitors: On the Horizon of Tailored and Personalized Therapies for Epithelial Ovarian Cancer. Curr Opin Oncol 2012, 24, 564–571. [Google Scholar] [CrossRef] [PubMed]
- Weigelt, B.; Comino-Mendez, I.; Bruijn, I. de; Tian, L.; Meisel, J.L.; Garcia-Murillas, I.; Fribbens, C.; Cutts, R.; Martelotto, L.G.; Ng, C.K.Y.; et al. Diverse BRCA1 and BRCA2 Reversion Mutations in Circulating Cell-Free DNA of Therapy-Resistant Breast or Ovarian Cancer. Clin Cancer Res 2017, 23, 6708–6720. [Google Scholar] [CrossRef] [PubMed]
- Francica, P.; Rottenberg, S. Mechanisms of PARP Inhibitor Resistance in Cancer and Insights into the DNA Damage Response. Genome Med 2018, 10, 101. [Google Scholar] [CrossRef] [PubMed]
- Ratner, E.S.; Zhu, Y.L.; Penketh, P.G.; Berenblum, J.; Whicker, M.E.; Huang, P.H.; Lee, Y.; Ishiguro, K.; Zhu, R.; Sartorelli, A.C.; et al. Triapine Potentiates Platinum-Based Combination Therapy by Disruption of Homologous Recombination Repair. Br J Cancer 2016, 114, 777–786. [Google Scholar] [CrossRef]
- Lin, Z.P.; Ratner, E.S.; Whicker, M.E.; Lee, Y.; Sartorelli, A.C. Triapine Disrupts CtIP-Mediated Homologous Recombination Repair and Sensitizes Ovarian Cancer Cells to PARP and Topoisomerase Inhibitors. Mol Cancer Res 2014, 12, 381–393. [Google Scholar] [CrossRef]
- Lin, Z.P.; Zouabi, N.N.A.; Xu, M.L.; Bowen, N.E.; Wu, T.L.; Lavi, E.S.; Huang, P.H.; Zhu, Y.L.; Kim, B.; Ratner, E.S. In Silico Screening Identifies a Novel Small Molecule Inhibitor That Counteracts PARP Inhibitor Resistance in Ovarian Cancer. Sci Rep 2021, 11, 8042. [Google Scholar] [CrossRef] [PubMed]
- Lin, Z.P.; Zhu, Y.L.; Lo, Y.C.; Moscarelli, J.; Xiong, A.; Korayem, Y.; Huang, P.H.; Giri, S.; LoRusso, P.; Ratner, E.S. Combination of Triapine, Olaparib, and Cediranib Suppresses Progression of BRCA-Wild Type and PARP Inhibitor-Resistant Epithelial Ovarian Cancer. PLoS One 2018, 13, e0207399. [Google Scholar] [CrossRef] [PubMed]
- Bachman, K.E.; Park, B.H. Duel Nature of TGF-Beta Signaling: Tumor Suppressor vs. Tumor Promoter. Curr Opin Oncol 2005, 17, 49–54. [Google Scholar] [CrossRef] [PubMed]
- Connolly, E.C.; Freimuth, J.; Akhurst, R.J. Complexities of TGF-Beta Targeted Cancer Therapy. Int J Biol Sci 2012, 8, 964–978. [Google Scholar] [CrossRef] [PubMed]
- Leivonen, S.K.; Kahari, V.M. Transforming Growth Factor-Beta Signaling in Cancer Invasion and Metastasis. Int J Cancer 2007, 121, 2119–2124. [Google Scholar] [CrossRef] [PubMed]
- Syed, V. TGF-Beta Signaling in Cancer. J Cell Biochem 2016, 117, 1279–1287. [Google Scholar] [CrossRef]
- Kirshner, J.; Jobling, M.F.; Pajares, M.J.; Ravani, S.A.; Glick, A.B.; Lavin, M.J.; Koslov, S.; Shiloh, Y.; Barcellos-Hoff, M.H. Inhibition of Transforming Growth Factor-Beta1 Signaling Attenuates Ataxia Telangiectasia Mutated Activity in Response to Genotoxic Stress. Cancer Res 2006, 66, 10861–10869. [Google Scholar] [CrossRef]
- Wu, C.T.; Chang, Y.H.; Lin, W.Y.; Chen, W.C.; Chen, M.F. TGF Beta1 Expression Correlates with Survival and Tumor Aggressiveness of Prostate Cancer. Ann Surg Oncol 2015, 22 (Suppl 3), S1587–93. [Google Scholar] [CrossRef]
- Wu, C.T.; Hsieh, C.C.; Yen, T.C.; Chen, W.C.; Chen, M.F. TGF-Beta1 Mediates the Radiation Response of Prostate Cancer. J Mol Med (Berl) 2015, 93, 73–82. [Google Scholar] [CrossRef]
- Tummala, H.; Dokal, I. TGF-Beta Pathway Inhibition Signals New Hope for Fanconi Anemia. Cell Stem Cell 2016, 18, 567–568. [Google Scholar] [CrossRef]
- Liu, L.; Zhou, W.; Cheng, C.T.; Ren, X.; Somlo, G.; Fong, M.Y.; Chin, A.R.; Li, H.; Yu, Y.; Xu, Y.; et al. TGFbeta Induces “BRCAness” and Sensitivity to PARP Inhibition in Breast Cancer by Regulating DNA-Repair Genes. Mol Cancer Res 2014, 12, 1597–1609. [Google Scholar] [CrossRef] [PubMed]
- Yang, J.; Mani, S.A.; Donaher, J.L.; Ramaswamy, S.; Itzykson, R.A.; Come, C.; Savagner, P.; Gitelman, I.; Richardson, A.; Weinberg, R.A. Twist, a Master Regulator of Morphogenesis, Plays an Essential Role in Tumor Metastasis. Cell 2004, 117, 927–939. [Google Scholar] [CrossRef] [PubMed]
- Li, Z.; Zhou, Z.; Wu, X.; Zhou, Q.; Liao, C.; Liu, Y.; Li, D.; Shen, L.; Feng, D.; Yang, L. LMP1 Promotes Nasopharyngeal Carcinoma Metastasis through NTRK2-Mediated Anoikis Resistance. Am J Cancer Res 2020, 10, 2083–2099. [Google Scholar]
- Nonpanya, N.; Prakhongcheep, O.; Petsri, K.; Jitjaicham, C.; Tungsukruthai, S.; Sritularak, B.; Chanvorachote, P. Ephemeranthol A Suppresses Epithelial to Mesenchymal Transition and FAK-Akt Signaling in Lung Cancer Cells. Anticancer Res 2020, 40, 4989–4999. [Google Scholar] [CrossRef]
- Ko, H. Geraniin Inhibits TGF-Beta1-Induced Epithelial-Mesenchymal Transition and Suppresses A549 Lung Cancer Migration, Invasion and Anoikis Resistance. Bioorg Med Chem Lett 2015, 25, 3529–3534. [Google Scholar] [CrossRef] [PubMed]
- Terauchi, M.; Kajiyama, H.; Yamashita, M.; Kato, M.; Tsukamoto, H.; Umezu, T.; Hosono, S.; Yamamoto, E.; Shibata, K.; Ino, K.; et al. Possible Involvement of TWIST in Enhanced Peritoneal Metastasis of Epithelial Ovarian Carcinoma. Clin Exp Metastasis 2007, 24, 329–339. [Google Scholar] [CrossRef] [PubMed]
- Yin, G.; Alvero, A.B.; Craveiro, V.; Holmberg, J.C.; Fu, H.H.; Montagna, M.K.; Yang, Y.; Chefetz-Menaker, I.; Nuti, S.; Rossi, M.; et al. Constitutive Proteasomal Degradation of TWIST-1 in Epithelial-Ovarian Cancer Stem Cells Impacts Differentiation and Metastatic Potential. Oncogene 2013, 32, 39–49. [Google Scholar] [CrossRef]
- Alvero, A.B.; Chen, R.; Fu, H.-H.; Montagna, M.; Schwartz, P.E.; Rutherford, T.; Silasi, D.-A.; Steffensen, K.D.; Waldstrom, M.; Visintin, I.; et al. Molecular Phenotyping of Human Ovarian Cancer Stem Cells Unravels the Mechanisms for Repair and Chemoresistance. Cell cycle (Georgetown, Tex.) 2009, 8, 158–166. [Google Scholar] [CrossRef]
- Vesuna, F.; Lisok, A.; Kimble, B.; Raman, V. Twist Modulates Breast Cancer Stem Cells by Transcriptional Regulation of CD24 Expression. Neoplasia 2009, 11, 1318–1328. [Google Scholar] [CrossRef]
- Kong, D.; Li, Y.; Wang, Z.; Sarkar, F.H. Cancer Stem Cells and Epithelial-to-Mesenchymal Transition (EMT)-Phenotypic Cells: Are They Cousins or Twins? Cancers (Basel) 2011, 3, 716–729. [Google Scholar] [CrossRef]
- Roberts, C.M.; Shahin, S.A.; Wen, W.; Finlay, J.B.; Dong, J.; Wang, R.; Dellinger, T.H.; Zink, J.I.; Tamanoi, F.; Glackin, C.A. Nanoparticle Delivery of SiRNA against TWIST to Reduce Drug Resistance and Tumor Growth in Ovarian Cancer Models. Nanomedicine 2017, 13, 965–976. [Google Scholar] [CrossRef] [PubMed]
- Roberts, C.M.; Tran, M.A.; Pitruzzello, M.C.; Wen, W.; Loeza, J.; Dellinger, T.H.; Mor, G.; Glackin, C.A. TWIST1 Drives Cisplatin Resistance and Cell Survival in an Ovarian Cancer Model, via Upregulation of GAS6, L1CAM, and Akt Signalling. Sci Rep 2016, 6, 37652. [Google Scholar] [CrossRef] [PubMed]
- Langdon, S.P.; Lawrie, S.S.; Hay, F.G.; Hawkes, M.M.; McDonald, A.; Hayward, I.P.; Schol, D.J.; Hilgers, J.; Leonard, R.C.; Smyth, J.F. Characterization and Properties of Nine Human Ovarian Adenocarcinoma Cell Lines. Cancer Res 1988, 48, 6166–6172. [Google Scholar] [PubMed]
- Craveiro, V.; Yang-Hartwich, Y.; Holmberg, J.C.; Joo, W.D.; Sumi, N.J.; Pizzonia, J.; Griffin, B.; Gill, S.K.; Silasi, D.A.; Azodi, M.; et al. Phenotypic Modifications in Ovarian Cancer Stem Cells Following Paclitaxel Treatment. Cancer Med 2013, 2, 751–762. [Google Scholar] [CrossRef]
- Steffensen, K.D.; Alvero, A.B.; Yang, Y.; Waldstrom, M.; Hui, P.; Holmberg, J.C.; Silasi, D.A.; Jakobsen, A.; Rutherford, T.; Mor, G. Prevalence of Epithelial Ovarian Cancer Stem Cells Correlates with Recurrence in Early-Stage Ovarian Cancer. J Oncol 2011, 2011, 620523. [Google Scholar] [CrossRef]
- Yang-Hartwich, Y.; Tedja, R.; Roberts, C.M.; Goodner-Bingham, J.; Cardenas, C.; Gurea, M.; Sumi, N.J.; Alvero, A.B.; Glackin, C.A.; Mor, G. P53-Pirh2 Complex Promotes Twist1 Degradation and Inhibits EMT. Mol Cancer Res 2019, 17, 153–164. [Google Scholar] [CrossRef]
- Chiruvella, K.K.; Liang, Z.; Wilson, T.E. Repair of Double-Strand Breaks by End Joining. Cold Spring Harb Perspect Biol 2013, 5, a012757. [Google Scholar] [CrossRef]
- Leahy, J.J.; Golding, B.T.; Griffin, R.J.; Hardcastle, I.R.; Richardson, C.; Rigoreau, L.; Smith, G.C. Identification of a Highly Potent and Selective DNA-Dependent Protein Kinase (DNA-PK) Inhibitor (NU7441) by Screening of Chromenone Libraries. Bioorg Med Chem Lett 2004, 14, 6083–6087. [Google Scholar] [CrossRef]
- Liu, L.; Zhou, W.; Cheng, C.-T.; Ren, X.; Somlo, G.; Fong, M.Y.; Chin, A.R.; Li, H.; Yu, Y.; Xu, Y.; et al. TGFβ Induces “BRCAness” and Sensitivity to PARP Inhibition in Breast Cancer by Regulating DNA-Repair Genes. Mol Cancer Res 2014, 12, 1597–1609. [Google Scholar] [CrossRef]
- Savagner, P. The Epithelial-Mesenchymal Transition (EMT) Phenomenon. Ann Oncol 2010, 21 Suppl 7, vii89–92. [Google Scholar] [CrossRef]
- Brabletz, T.; Kalluri, R.; Nieto, M.A.; Weinberg, R.A. EMT in Cancer. Nat Rev Cancer 2018, 18, 128–134. [Google Scholar] [CrossRef]
- Lim, J.; Thiery, J.P. Epithelial-Mesenchymal Transitions: Insights from Development. Development 2012, 139, 3471–3486. [Google Scholar] [CrossRef] [PubMed]
- Whicker, M.E.; Lin, Z.P.; Hanna, R.; Sartorelli, A.C.; Ratner, E.S. MK-2206 Sensitizes BRCA-Deficient Epithelial Ovarian Adenocarcinoma to Cisplatin and Olaparib. BMC Cancer 2016, 16, 550. [Google Scholar] [CrossRef] [PubMed]
- Portella, G.; Cumming, S.A.; Liddell, J.; Cui, W.; Ireland, H.; Akhurst, R.J.; Balmain, A. Transforming Growth Factor Beta Is Essential for Spindle Cell Conversion of Mouse Skin Carcinoma in Vivo: Implications for Tumor Invasion. Cell Growth Differ Mol Biology J Am Assoc Cancer Res 1998, 9, 393–404. [Google Scholar]
- Spaderna, S.; Schmalhofer, O.; Hlubek, F.; Berx, G.; Eger, A.; Merkel, S.; Jung, A.; Kirchner, T.; Brabletz, T. A Transient, EMT-Linked Loss of Basement Membranes Indicates Metastasis and Poor Survival in Colorectal Cancer. Gastroenterology 2006, 131, 830–840. [Google Scholar] [CrossRef] [PubMed]
- Connolly, E.C.; Saunier, E.F.; Quigley, D.; Luu, M.T.; Sapio, A.D.; Hann, B.; Yingling, J.M.; Akhurst, R.J. Outgrowth of Drug-Resistant Carcinomas Expressing Markers of Tumor Aggression after Long-Term TβRI/II Kinase Inhibition with LY2109761. Cancer Res 2011, 71, 2339–2349. [Google Scholar] [CrossRef] [PubMed]
- Roberts, C.M.; Cardenas, C.; Tedja, R. The Role of Intra-Tumoral Heterogeneity and Its Clinical Relevance in Epithelial Ovarian Cancer Recurrence and Metastasis. Cancers 2019, 11, 1083. [Google Scholar] [CrossRef] [PubMed]
- Wu, Z.-Q.; Li, X.-Y.; Hu, C.Y.; Ford, M.; Kleer, C.G.; Weiss, S.J. Canonical Wnt Signaling Regulates Slug Activity and Links Epithelial–Mesenchymal Transition with Epigenetic Breast Cancer 1, Early Onset (BRCA1) Repression. Proc National Acad Sci 2012, 109, 16654–16659. [Google Scholar] [CrossRef]
- Gavande, N.S.; VanderVere-Carozza, P.S.; Hinshaw, H.D.; Jalal, S.I.; Sears, C.R.; Pawelczak, K.S.; Turchi, J.J. DNA Repair Targeted Therapy: The Past or Future of Cancer Treatment? Pharmacol Therapeut 2016, 160, 65–83. [Google Scholar] [CrossRef]
- Munck, J.M.; Batey, M.A.; Zhao, Y.; Jenkins, H.; Richardson, C.J.; Cano, C.; Tavecchio, M.; Barbeau, J.; Bardos, J.; Cornell, L.; et al. Chemosensitization of Cancer Cells by KU-0060648, a Dual Inhibitor of DNA-PK and PI-3K. Mol Cancer Ther 2012, 11, 1789–1798. [Google Scholar] [CrossRef]
- Walker, T.D.J.; Faraahi, Z.F.; Price, M.J.; Hawarden, A.; Waddell, C.A.; Russell, B.; Jones, D.M.; McCormick, A.; Gavrielides, N.; Tyagi, S.; et al. The DNA Damage Response in Advanced Ovarian Cancer: Functional Analysis Combined with Machine Learning Identifies Signatures That Correlate with Chemotherapy Sensitivity and Patient Outcome. Brit J Cancer 2023, 1–12. [Google Scholar] [CrossRef] [PubMed]
- Oda, K.; Tanikawa, M.; Sone, K.; Mori-Uchino, M.; Osuga, Y.; Fujii, T. Recent Advances in Targeting DNA Repair Pathways for the Treatment of Ovarian Cancer and Their Clinical Relevance. Int J Clin Oncol 2017, 22, 611–618. [Google Scholar] [CrossRef] [PubMed]
Disclaimer/Publisher’s Note: The statements, opinions and data contained in all publications are solely those of the individual author(s) and contributor(s) and not of MDPI and/or the editor(s). MDPI and/or the editor(s) disclaim responsibility for any injury to people or property resulting from any ideas, methods, instructions or products referred to in the content. |
© 2023 by the authors. Licensee MDPI, Basel, Switzerland. This article is an open access article distributed under the terms and conditions of the Creative Commons Attribution (CC BY) license (https://creativecommons.org/licenses/by/4.0/).


