Preprint
Article

Climate Suitability for Tourism in Romania based on HCI: Urban Climate Index in the Near-Future Climate

Altmetrics

Downloads

202

Views

58

Comments

0

A peer-reviewed article of this preprint also exists.

Submitted:

13 April 2023

Posted:

14 April 2023

You are already at the latest version

Alerts
Abstract
The study presents an assessment of climate suitability for outdoor leisure activities in Romania using the Holliday Climate Index (HCI) for the near future (2021-2040), focusing on unfavorable and good climate conditions. The analysis employs data from an ensemble model in the context of RCP45 and RCP85 climate change scenarios. The results indicate that the number of days with low weather suitability is decreasing in almost the entire country, especially during the warm season, while during the winter and spring extended regions may be characterized by a higher number of days favorable for outdoor activities than during the current climate. An estimation of the impact of climate changes on tourism flux in Romania is further carried out, suggesting that the increasing attractivity of climate conditions may lead to an increased number of tourist overnights in the near future, more pronounced in rural destinations.
Keywords: 
Subject: Environmental and Earth Sciences  -   Atmospheric Science and Meteorology

1. Introduction

Climate changes pose challenges to all economic sectors and aspects of human life and tourism is not an exception. As a ‘social, cultural and economic phenomenon’ [1], tourism has a transversal impact in society in terms of economic development from local level (e.g., small villages) to national level (e.g., population health) but also interpersonal relationships or country image as a place worth knowing in person.
In Romania, tourism contributed about 3% to the GDP in 2019, although in 2020, due to the pandemic, it dropped to only 1.6% - the lowest value since 2008 [2]. The hotels and restaurants sector involved about 2.6% of the total employed population in 2021 [3], to which add other related economic branches too (e.g., transport, tourism agencies, commerce). The positive impact of tourism is maybe more visible in rural areas, where the development of agrotourism increased in the last years, offering new opportunities for a better socio-economic situation in villages where other options are scarce.
The tourism intensity in Romania, just like in other countries, is not uniformly distributed in the territory. Brașov - Prahova Valley tourist corridor (combining Brașov and Prahova counties) is in second place as a tourist attraction area of ​​Romania; the center of Transylvania (Cluj, Sibiu and Mureș counties) registers a similar value, followed by Constanța, in the seaside [4]. Furthermore, about 62% of the total accommodation capacity is concentrated in 12 counties from a total of 41 counties [5]. Nevertheless, the governmental support for tourism development, seen as an economic priority of the country, encourages the revival of this sector and supports it through several directions like the development of ecological, natural and rural tourism, cultural programs, tourism education etc.
While improvable points in Romanian tourism are linked mainly to administrative or economic aspects (e.g., transport infrastructure, marketing), strong points are already in place and they reside, among others, in the natural resources abundant in any place of the country. Romania includes a large variety of relief units – from the seaside (along the Black Sea) to mountains up to 2544m high (Moldoveanu Peak in Fagaras Mountains). Five major rivers (Danube, Mures, Prut, Olt, Siret) flow on the Romanian territory. Several lakes are spread across all major relief units - from glacial ones in the mountainous area (Mioarele Lake – Făgăraș Mountains, located at the highest altitude: 2282 m, Bucura and Zanoaga Mare Lakes – Retezat Mountains, the largest glacial lake: 10 ha respectively the deepest: 29 m) to those in Danube Delta and river-maritime banks (Techirghiol Lake, at 1.5 m altitude) and anthropic lakes like the one from Porțile de Fier [6]. All these assure a large palette of opportunities for spending time in nature and thus provide the background for a variety of tourism forms. Spa resources represent another natural treasure, with a diversity of ‘flavors’ including thermal waters used mostly for external treatments, oligo-mineral waters recommended for internal use in various diseases, salt mines recommended for respiratory diseases or mofettas (natural gas emanations from volcanic sources with a very high carbon dioxide content) recommended in heart diseases and not only.
Climate is yet another major natural asset in Romanian tourism. Romania's climate is temperate-continental with oceanic influences from the west, Mediterranean influences from the southwest and continental-excessive influences from the east. The multiannual average temperature is differentiated latitudinally, with annual averages of 8°C in the north and over 11°C in the south, and altitudinally, with annual average values ​​of -2.5°C in the mountain floor (Vârfu Omu - Bucegi massif) and 11.6°C in the plains (Zimnicea, Teleorman county). The annual precipitation decreases in intensity from west to east, respectively from over 600 mm to less than 500 mm in the Eastern Romanian Plain, less than 450 mm in Dobrogea and about 350 mm on the coast, while in the mountainous regions, it reaches 1000 -1500 mm [7]. The four seasons provide different opportunities for various tourism types; pronounced tourism fluxes in mountainous resorts are seen during winter, while during summer almost all resorts receive a large number of tourists, more marked on the seaside.
Climate changes are expected to have an impact on the tourism sector, both directly, through changes in the weather and climate features which modulates the tourism demand as well as indirectly, by affecting other resources (e.g., water availability) or economic sectors (e.g., energy) which are linked to tourism. In Romania, the observed changes in the climate indicate that during the period 1901-2020 the average temperature at the national level increased by more than 1oC, with the largest increases during winter and summer [8] Furthermore, the number of days with convective rain increased during 1991-2020 compared to the 1961-1991 period, and future projections show that the number of days with heavy rain (over 20mm/day) will increase as well. The average snow layer depth, instead, presents a decreasing tendency, with an intraseasonal difference in the behavior of decreasing trends which are more pronounced in the month of February [8].
The direct impact of climate change on tourism in Europe has been comprehensively analyzed. The risks for winter tourism, for example, due to the decrease of snow layer depth and air temperature increase, are acknowledged by a large number of studies ([9,10,11,12,13,14]). For summer tourism, studies indicate that the changed climate may become less favorable for tourism in some areas (e.g., Greece, Cyprus) due to increasing temperatures, while the northern countries may benefit from this physical impact [15,16]. Coastal tourism in some areas of the Mediterranean region may be negatively influenced by increased temperature [17], while other risks associated with climate changes are also pertinent for coastal tourism, like beach loss caused by shoreline recession [18] or coastal storms. Urban tourism is also likely to be affected mainly due to the increase in temperature associated with more intense thermal discomfort [19,20] amplified by the urban heat island effect.
Regarding Romanian tourism in particular, there are fewer studies focusing on the direct impact of climate change on tourism. For seaside tourism, climate changes may provide new opportunities for development [21,22]. Mountain resorts may also benefit from increasing temperatures, despite the negative effects induced by decreasing snow layer depth [23]. Increased temperatures and thus thermal discomfort in urban areas [24,25,26,27] suggest an implicit negative effect on urban tourism, however not fully investigated.
In the present study, the direct impact of climate changes on climate suitability for tourism in Romania is investigated based on the seasonal mean number of days with good and unfavorable weather conditions defined with the use of the Holiday Climate Index [28], in order to cover the gap in the scientific literature. The data provided by Copernicus Climate Data Store [29] is used in the context of two climate change scenarios for the near future period (2021-2040). Furthermore, the impact of changes in climate suitability on tourism intensity as expressed through the number of touristic overnights in 41 cities and 53 rural touristic destinations (Figure 1) is investigated. Finally, the implications and limitations of the results, highlighting also potential directions for improvement and future research are discussed.

2. Materials and Methods

HCI index comprises several facets of the weather (e.g., temperature, humidity, cloudiness, wind speed, rain) such that to provide synthetic information which is assembled in classes (Table 1). The index has been developed by [28] with a focus on urban areas, in order to characterize the weather conditions suitable for outdoor leisure activities. Recently, it has been shown that the index is also appropriate for describing the climate attractivity for tourism in rural areas [5].

2.1. Climate suitability for tourism in the context of climate changes

The estimation of changes in climate suitability for tourism in the near future (2021-2040) is based on the ‘Climate Suitability for Tourism Indicators’ dataset available from Copernicus Climate Data Store [30]. The dataset contains monthly ensemble mean values of HCI as well as daily data obtained by downscaling large-scale information from six Global Climate Models (GCM) with regional model RCA4 [31] in the context of up to three RCP (Representative Concentration Pathways) climate change scenarios. The HCI index has been computed based on [28], using the Effective Temperature index for the thermal aspect, where the maximum value of near-surface air temperature and minimum value of relative humidity were used [32]. For the estimation of changes in climate suitability in the near future (2021-2040), the information on HCI used in this study is in the form number of days with ‘good’ weather conditions (i.e., HCI >70) and the number of days with ‘unfavorable’ weather conditions (i.e., HCI <50). These indicators are available at a monthly scale and they are derived from the ensemble mean of all simulations available for each of the HISTORICAL period (1986-2005) and RCP26, RCP45 and RCP85 scenarios for the period 2021-2040. Nevertheless, in order to assure consistency throughout the study, only climate projections in the context of two scenarios – RCP45 and RCP85 – are employed, as for the RCP26 scenario not all models have provided simulations at daily scale needed for the second part of the analysis.

2.2. Impact of climate changes on tourism flux

The assessment of the impact of changes in climate suitability on the tourism flux is based on a simple linear regression approach. As a first step, the regression model is built using monthly time series of HCI and sectoral data in form of touristic overnights for the period 2010-2018. Next, the model is applied to monthly series of HCI for HISTORICAL, RCP45 and RCP85 experiments. The results are analyzed as the relative difference (in percent) between RCP45 or RCP85 and HISTORICAL outputs of the regression model expressed as the mean number of overnights over the selected 20 years period. The analysis is applied to 41 urban areas and 53 rural touristic destinations; the latter are selected following the criteria described in [5].
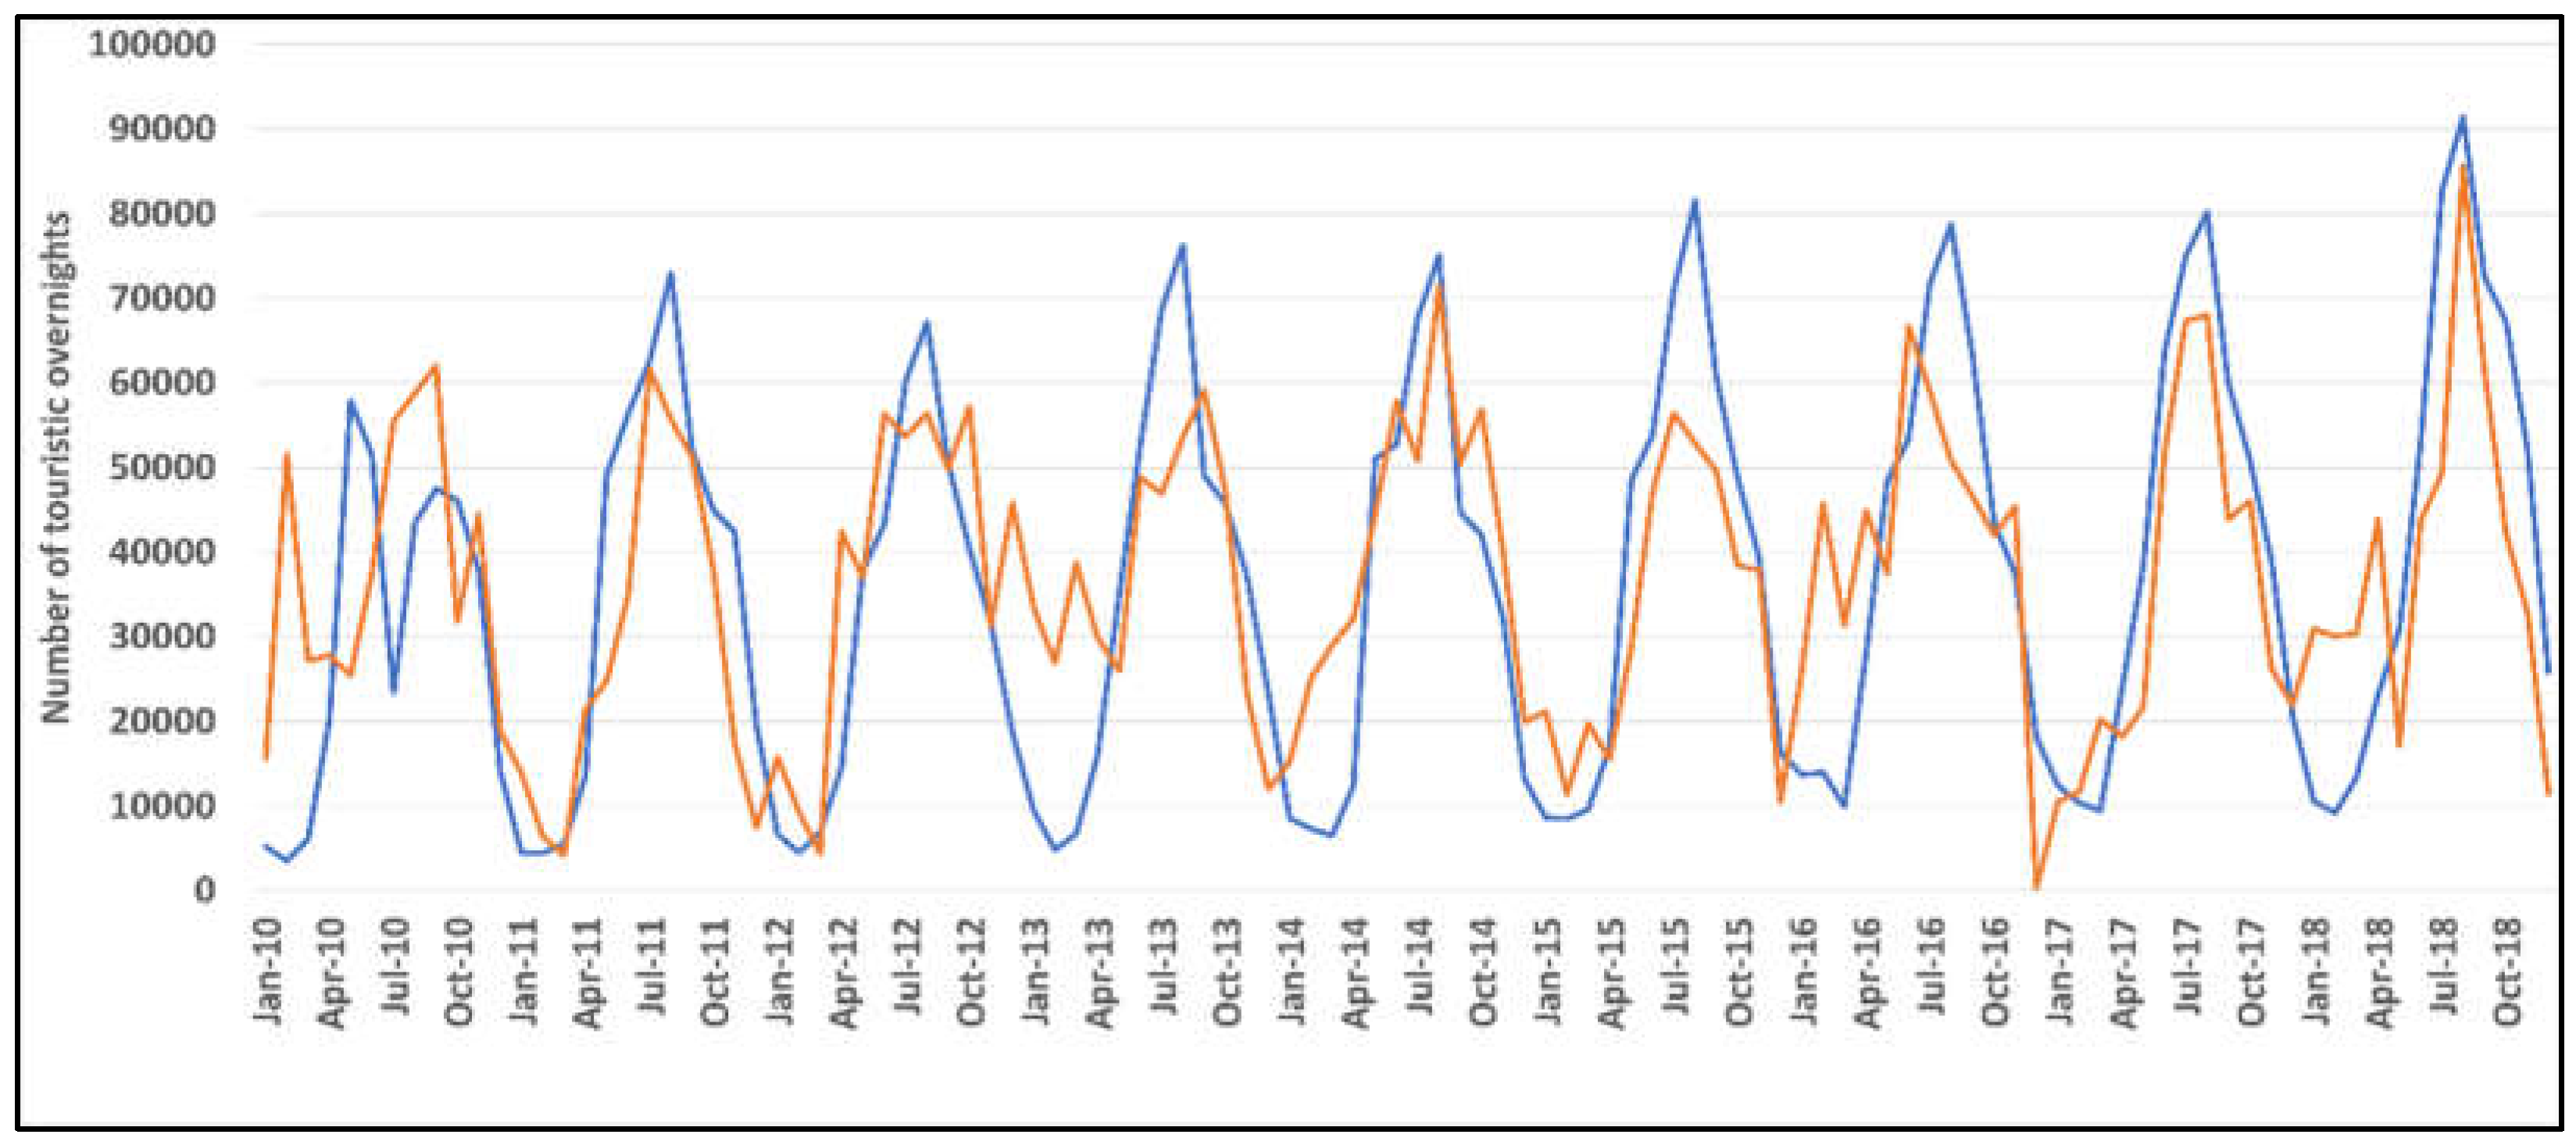
For this part of the analysis, HCI is computed using data provided by the regional reanalysis dataset UERRA [33] for 2 m of air temperature, 2 m of relative humidity, total cloud cover, and 10 m of wind speed; total precipitation was provided by the global reanalysis dataset ERA5-Land [34]. Both datasets are available through CDS. In the framework of this study, the 2 m air temperature and relative humidity from the UERRA analysis at 12 UTC were used as proxies for daytime conditions [5]. The sectoral data is provided by National Institute for Statistics in Romania [3] in the form of monthly number of touristic overnights in each locality, starting from 2010; the data refers to accommodation units having more than 10 beds, regardless of the type of accommodation unit (e.g., hotel, agrotouristic boarding houses etc.). A linear regression model is fitted on the data for each locality, at a 0.05 confidence level. It should be noted that the regression model reproduces the seasonal variations in the number of overnights, but not the extreme values or the year-to-year variations (e.g., Figure 2). This is an expected limitation of the regression model, given that the number of touristic overnights is influenced by much more factors than the weather, which is in no way considered in this analysis. However, the trend in observed data is captured by the simulations.
To apply the regression model on HISTORICAL, RCP45 and RCP85 data, time series of monthly values of the index, derived from daily data, are used. In order to have a larger but common number of ensemble members for the same scenario, five simulations that cover RCP45 and RCP85 climate change scenarios have been selected, namely those driven by the following GCMs: ICHEC-EC-EARTH, MPI-M-MPI-ESM-LR, MOHC-HadGEM2-ES, CNRM-CERFACS-CNRM-CM5, IPSL-IPSL-CM5A-MR. The time series for each locality are computed as the monthly mean of daily data provided by the five models.

3. Results

3.1. Changes in climate attractivity for tourism in the near future (2021-2040) in Romania

The analysis focuses on two classes of climate suitability, namely days with ‘unfavorable’ climate conditions (HCI <50) and days with ‘good’ climate conditions (HCI >70), as available from the ‘Climate Suitability for Tourism Indicators’ dataset [30] and aggregated at seasonal scale. This categorization simplifies the rating system defined in Table 1 and it favors a practical approach (e.g., fast, synthetic overview), although the analysis may lose some local details.
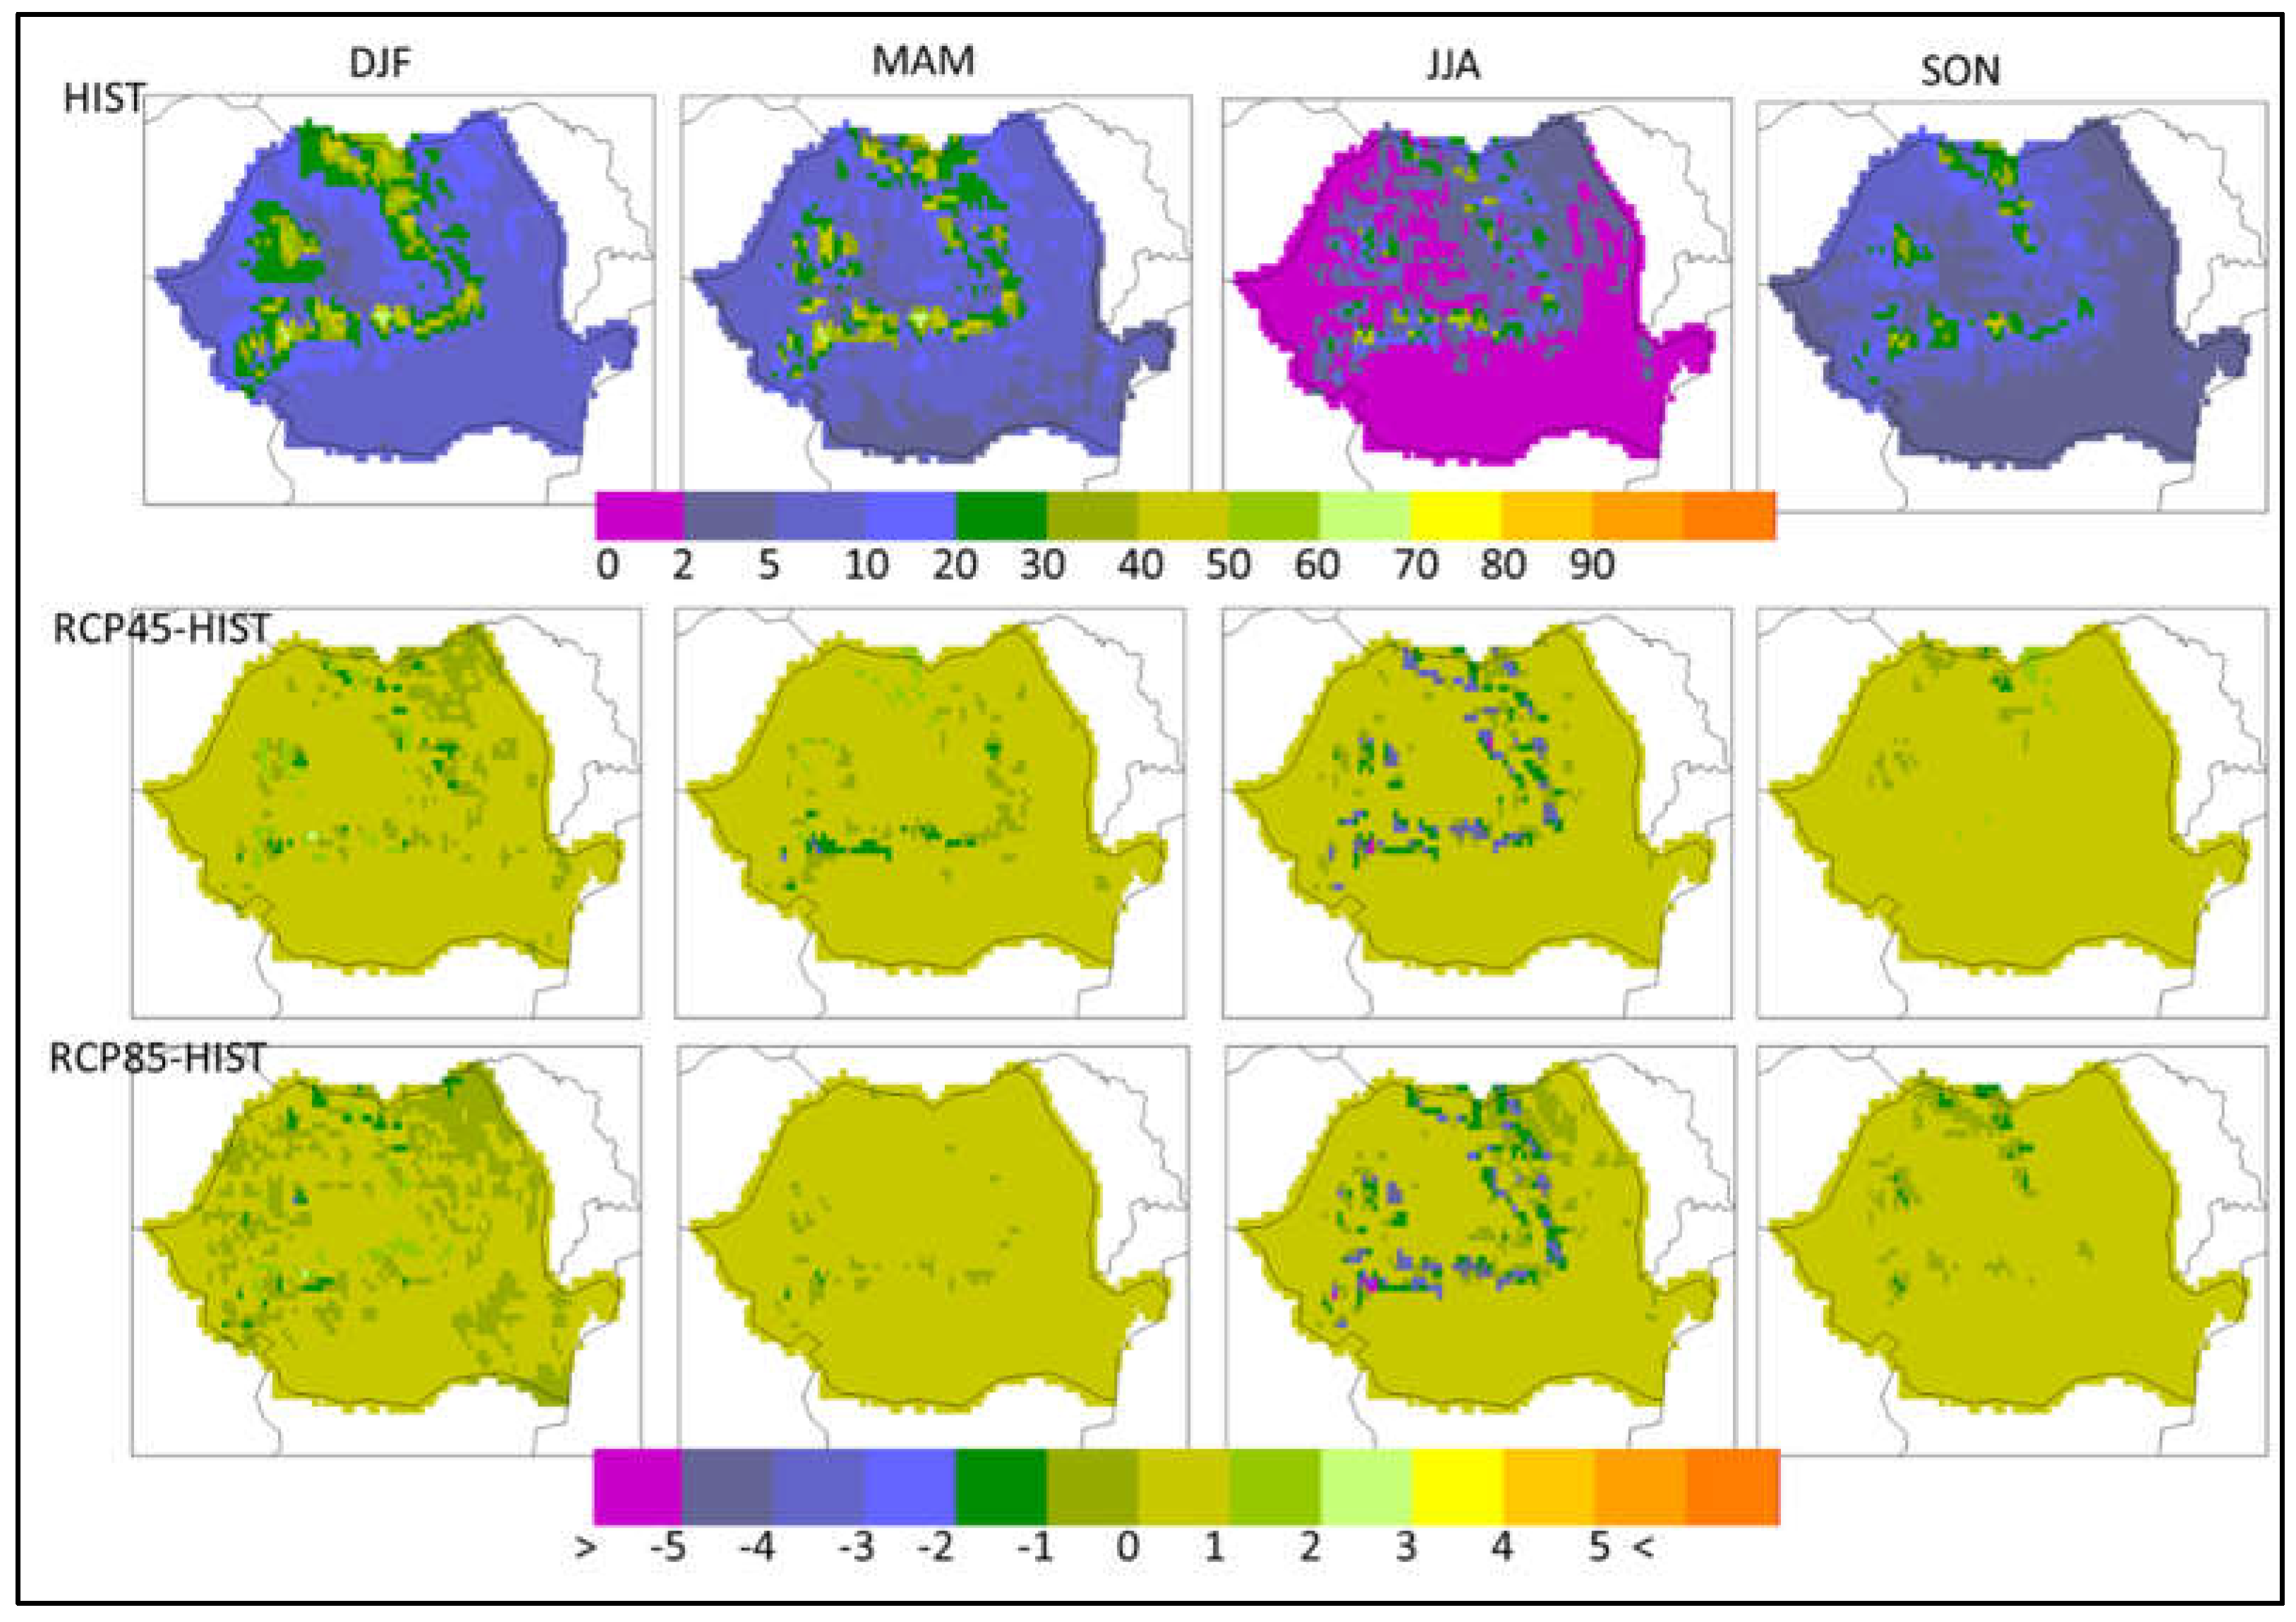
The spatial distribution of the seasonal number of days with ‘unfavorable’ climate conditions for outdoor leisure activities is presented in Figure 3. The reference simulation (HIST) for the period 1986-2005 indicates that the distribution of the number of ‘unfavorable’ days is closely related to the terrain orography, as expected, with a larger number of days associated with higher relief heights. Seasonality is also pronounced. During winter all over the country may be experienced at least 10 such days (in the south), the number increasing in the sub-Carpathic areas to 20 days and in higher mountainous areas to up to 50 days. The situation partially improves during spring, especially on limited areas in the southern regions. The summer season is characterized by less than 2 days of ‘unfavorable’ climate conditions in most parts of the country, except for the sub-mountainous and mountainous areas. Even for those, the climate conditions are better during summer, as only higher mountainous areas are characterized by up to 20 days of ‘unfavorable’ conditions; in isolated regions (e.g., high mountain peaks) there persist up to 50 days of ‘unfavorable’ climate conditions for outdoor activities.
In the near future (2021-2040) in the context of the RCP45 scenario the changes are generally of small amplitude (1 day) in most of the country. Interestingly, the number of days with ‘unfavorable’ climate conditions for outdoor leisure activity is increasing compared to the reference period in all the country except for the NE area and sub-mountainous and mountainous regions. In these zones, the difference between the RCP45 and HISTORICAL simulations indicates, mostly during winter and spring, a decrease of the ‘unfavorable’ number of days with an average of 1-2 days in most mountainous areas and up to 3 days on isolated high peaks regions. This change has a larger amplitude during summer, where higher mountainous regions may experience up to 5 ‘unfavorable’ days less and even more on limited, isolated areas in the southern and eastern Carpathians.
A similar situation is found for the RCP85 scenario. However, in this case during winter more regions in western, northern and south-eastern regions may have fewer days with ‘unfavorable’ conditions (up to 1 day less). In summer, the impact of the climate changes is more visible in the mountainous regions; slightly larger areas may experience less ‘unfavorable’ days than in the context of the RCP45 scenario, but the amplitude of the change is in the same range (2-5 days less).
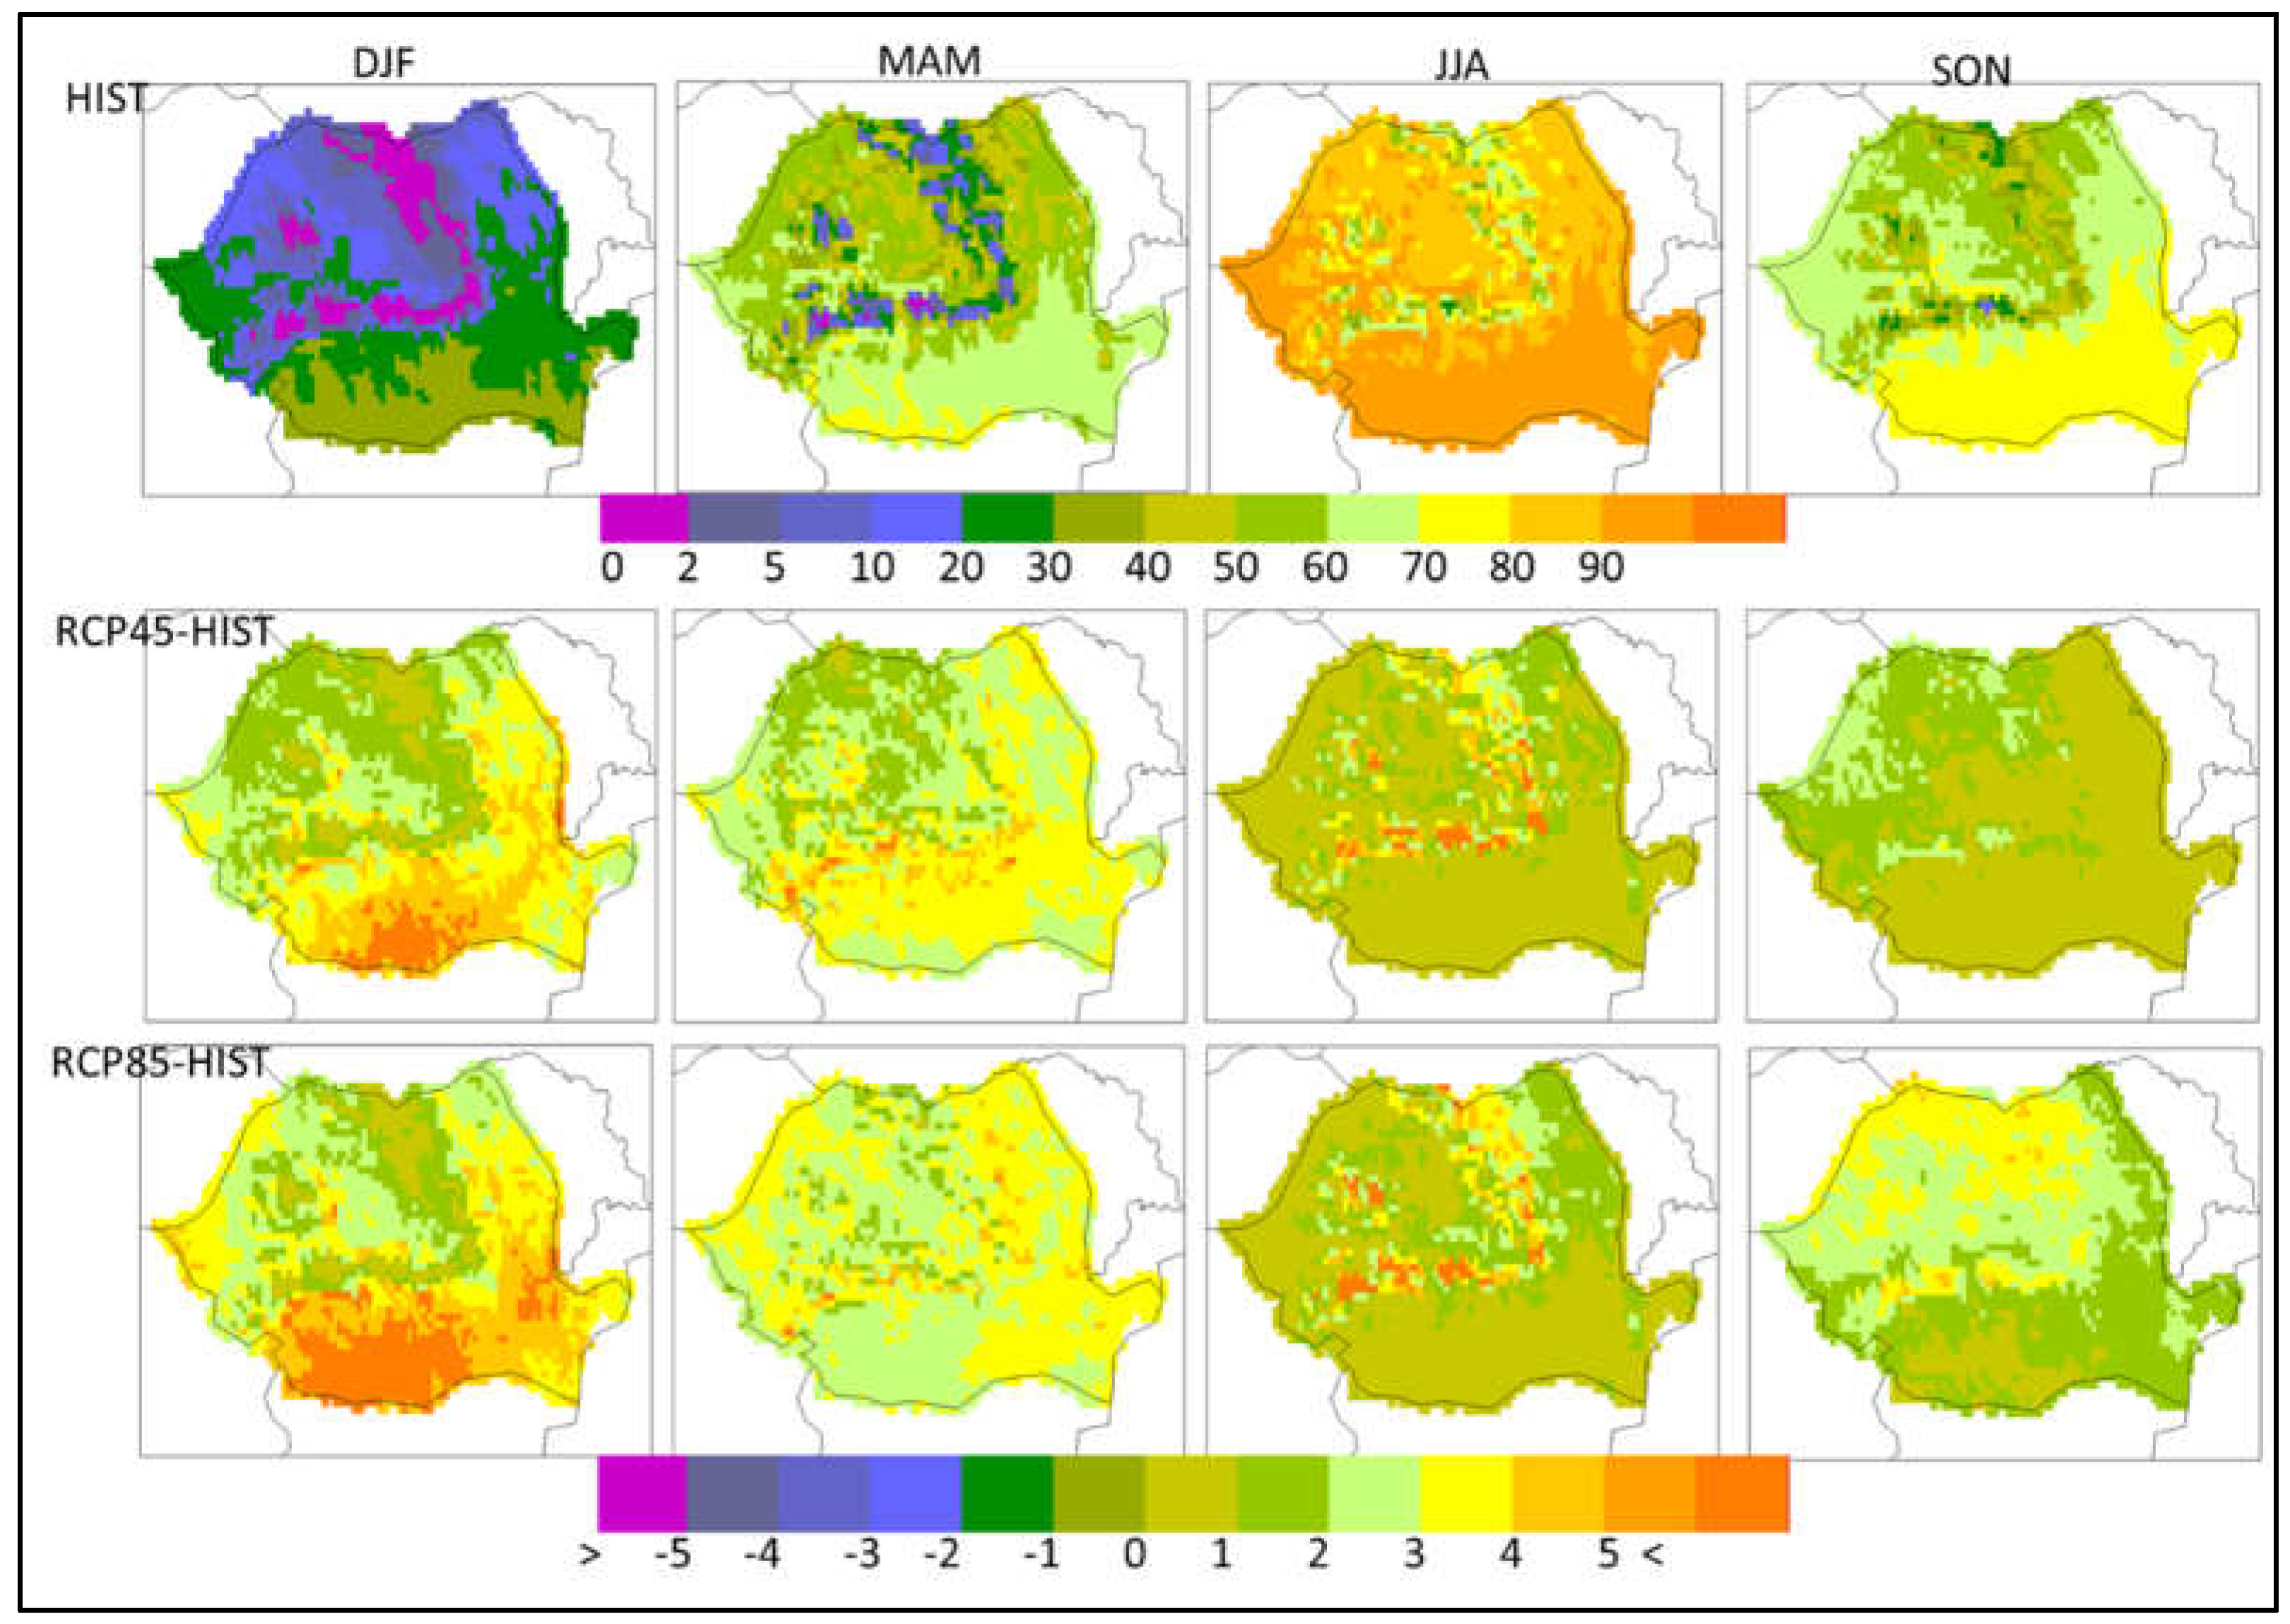
Regarding the favorable climate conditions for outdoor leisure activities, the spatial distribution of the seasonal mean number of days with ‘good’ conditions (HCI >70) is presented in Figure 4. During the reference period 1986-2005, the southern, south-eastern and western regions register the largest number of days with ‘good’ conditions, varying from 30-40 days during winter to almost the entire season during summer. In these regions, shoulder seasons are also characterized by good climate conditions, with up to 70 days (even 80 in limited areas) during spring and up to 80 days with ‘good’ conditions during autumn. The mountainous regions are marked by the lowest number of ‘good’ days, which in winter are as low as 2 and increase to 60-70 days during summer or a maximum of 30 in limited, high areas. The spring season carries more of the winter characteristics, the number of ‘good’ days in the Carpathians being still low (5-10 days on average), while the warmth of summer is partially seen during fall to, when 30-50 days with ‘good’ conditions are found in the mountainous areas.
The simulations for the near future (2021-2040) indicate a positive change in the number of days with ‘good’ climate conditions, differentiated spatially and seasonally. For the southern regions an increase of more than 5 days with ‘good’ conditions may be seen during winter, the area affected being larger in the RCP85 scenario. This amplitude diminishes during the other seasons, such that in summer and fall the improvement is in the order of 1-2 days of additional days with ‘good’ conditions. The western and eastern regions of the country also may benefit from additional 3-5 days with ‘good’ conditions during winter and even spring, while the improvement is in the range of 2- 3 additional ‘good’ days during summer and fall. The improvement of climate conditions in the mountainous regions is also visible, varying from 1-2 supplementary days with ‘good’ conditions in winter to up to 5 additional ‘good’ days in summer. The distinct features of changes in the RCP85 scenario compared to the RCP45 scenario are more pronounced with respect to the spatial distribution of these changes – in the RCP85 scenario, larger areas located mainly in the south and north of the territory may experience an increased number of ‘good’ days, especially during winter, fall and spring. The amplitude of the changes is similar for the two scenarios with regard to the number of ‘good’ days.

3.2. Estimating the impact of climate changes on tourism in the near future (2021-2040) in Romania

Changes in climatic conditions are expected to be reflected in each socio-economic sector sensitive to climate. The direct impact of climate changes in tourism may be visible in the modifications of touristic flux (e.g., incoming number of tourists, overnights etc.), but it will be further modulated by the complex interaction between socio-economic aspects also affected, in various degrees, by the climate changes (e.g., personal income, health, availability of new investments etc.).
Estimation of the direct impact of climate change on tourism demand is a research topic well represented in scientific literature. Several studies explore the link between weather parameters like air temperature [35,36,37,38], sunshine duration [35,36], presence of rain ([36,37] on the changes in touristic overnights. Their methods are generally based on regression, with varying degrees of complexity of the models. Climate indices are also used in studies focusing on this research topic. Hein and collaborators [39] uses the Tourism Climate Index (TCI; [40]) to describe current climate suitability and future climate changes in seven regions in Spain. They build a model linking TCI and foreign visitors’ overnights at the regional level, but they also include a factor reflecting the ‘intrinsic attractiveness of a region’. Oğur and Baikan [41] follow a similar approach to study the future changes in international tourist arrivals in Turkey. Carillo and collaborators [42] employs both TCI and Holliday Climate Index to study the potential change in climate suitability in the Canary Island, although the estimation of the climate change impact is limited to the changes in specific suitability classes of the two indices.
The aim of this part of the analysis is to investigate if the changes in climate suitability for tourism (i.e., HCI) in Romania may lead to quantifiable impact in terms of sector-specific indices (i.e., number of touristic overnights) and, if it is the case, to estimate the amplitude of this impact at the level of urban and rural touristic destinations. In this exercise, there are not taken into account any socio-economic factors or other types of factors like for example related to security issues which may influence the tourism demand. A regression model is built, describing the relationship between HCI and the overnights for the 2010-2018 period, based on monthly data, for each of the 94 destinations considered initially. For the analysis, only localities for which the climate conditions explain at least 30% of the variability in the touristic overnights (R2 >30) for the period 2010-2018 are retained. There are 13 urban areas and 20 rural touristic destinations fulfilling this condition (Table 2 and Table 3). The regression model is then applied to the ensemble monthly mean values of HCI for the historical period (1986-2005) as well as for the near future (2021-2040) in the context of RCP45 and RCP85 scenarios, for each destination. The results are interpreted in terms of the mean relative difference between the number of overnights corresponding to the climate change scenarios and those corresponding to the historical period. This approach accounts for the uncertainty associated with the models employed (e.g., the models and the ensemble mean are ‘warmer’ than the reanalysis) as well as for the limitations associated with the regression model (e.g., it is derived for a 9-year period and applied for 20 years period).
The expected improvement in the climate conditions may lead to an increase in the touristic overnights in all the selected destinations. For the urban destinations (Table 2), the change is generally in the order of 2-3.5 % compared to the reference period in the context of both scenarios, while for three destinations (Constanța, Piatra Neamț and Tulcea) the potential increase is slightly higher (5.21 % in the context of RCP45 scenario for Piatra Neamț). It is worth noting that, except for Constanta, all the other urban destinations in Table 2 are small-medium cities, where forms of tourism less dependent on the weather and climate (e.g., business, conferences, medical tourism etc.) are not too strongly developed. The relatively high increase for Constanța may be explained by its location in the seaside, as well as by the fact that number of touristic overnights for this city incorporate also those for the well-known seaside resort Mamaia.
For the rural destinations (Table 3), the impact of improving climate conditions may lead to a more pronounced increase in the touristic flux. In the context of the RCP45 scenario, eight destinations may benefit from an improvement of 2.8- 4.67 % in the mean number of touristic overnights, while for five destinations the increase may vary between 5.5 and 8.8 % compared to the reference period. The highest increases are in the range of 9.89-14.79 % and they are found for Băltățești, Praid, Sângeorz Băi and Slănic Moldova. The similar amplitude of the results are found for the RCP85 scenario, the difference compared to the RCP45 scenario being generally in the range of -1% and 1%, with a minimum of -1.2% (Băile Olănesti) and a maximum of 2.92% (Sângeorgiu de Mureș). It is interesting to note that for half of the selected rural destinations, the potential increase in the mean number of touristic overnights is slightly larger in the context of the RCP45 scenario; however, for at least one rural destination (Sângeorgiu de Mureș), the climate conditions associated with RCP85 scenario may lead to a significantly larger increase than in the context of RCP45 scenario (14.01 % compared to 11.08 %). The higher impact of better climate conditions for outdoor leisure activities in the rural destinations compared to the urban destinations confirms once more the strong dependency of the tourism flux in these localities on the climate conditions. Considering that, with the exception of one locality (Gura Humorului) in all the other 19 rural destinations balneary tourism is dominant, these results are in agreement with other studies (e.g., [43]) showing that for this type of tourism, the main activities, apart from the balneary treatment itself, are walking and other light relaxation activities outdoor.

4. Discussion and Conclusions

The changes in climate suitability for tourism in Romania in the near future (2021-2040) in the context of RCP45 and RCP85 climate change scenarios are investigated. The analysis employs the Holiday Climate Index and it focuses on seasonal changes in the number of days with ‘unfavorable’ climate conditions (HCI <50) and ‘good’ climate conditions (HCI >70). Furthermore, an attempt of estimating of the direct impact of these changes on the tourism flux in urban and rural destinations in Romania is presented.
In the context of both RCP45 and RCP85 climate change scenarios, the climate suitability for tourism in Romania is expected to improve. The seasonal mean number of days with ‘unfavorable’ conditions is expected to decrease especially during summer and in the mountainous regions (up to 5 ‘unfavorable’ days less). The improvement is more pronounced for the seasonal mean number of days with ‘good’ conditions, which increases with up to 5 days during winter in almost the entire country. In the other seasons, this change is less marked, except for the mountainous areas where during summer up to 5 additional ‘good’ days may be experienced. In the RCP85 scenario, the impact is visible on a larger spatial scale compared to the RCP45 scenario, such that more areas located mainly in the south and north of the territory may experience an increased number of ‘good’ days, especially during winter, fall and spring.
The estimate of the direct impact of changes in climate conditions on tourism flux is based on a simple regression model and it considers initially 41 urban and 53 rural destinations. By requiring that climate conditions explain at least 30% of the variability in the touristic overnights during the period 2010-2018, only 13 urban and 20 rural destinations are further used for analysis. The results suggest that the improvement in the climate conditions for outdoor leisure activities may be associated with an increase in the mean number of touristic overnights. The magnitude of the impact, however, is differentiated both between the urban and rural destinations, as well as inside the same ‘category’ of destinations, even at a similar degree of explained variability.
For the urban destinations, the impact is in general below 3%. Only three destinations may experience a larger increase -around 5%- in the mean number of touristic overnights. The results suggest that despite the quite robust influence of climate conditions on the tourism flux, for these urban areas, the sole improvement of climate conditions may not be sufficient for a relevant increase in the mean number of touristic overnights. Products and forms of tourism more independent of weather and climate, based on other resources than the natural ones, should be developed with the view of consolidating tourism as a bigger contributor to local incomes. The same is valid for seaside urban destinations (Constanta, Tulcea, Braila) where the geographical location and the apparently greater tourism demand should not be the only assets exploited.
The rural destinations, instead, may observe a more pronounced increase of tourism flux in the conditions of improvement of climate suitability, with values as high as 14% in the RCP85 scenario. These are mainly balneary destinations, for which light outdoor recreational activities are the specific types of touristic activities. Just as the case for urban destinations, the increase in tourism intensity due to the improvement of climate suitability is not sufficient to guarantee the revitalization of tourism in these destinations. Further improvements in the quality of touristic infrastructure and services is needed, as confirmed also by the governmental policies (e.g., [44,45])
The study presents inherent limitations, for example related to the uncertainty of climate change scenarios (e.g., [46,47]) or the uncertainty associated with climate models employed in the simulations of the climate change projections. More specific limitations are also associated with the regression model used to estimate the direct impact of changes in climate suitability on tourism flux. The model is ‘trained’ with 9 years of data, but is then applied to 20-year period; this may affect the quality of the regression for the reference and near-future periods in terms of capturing the extreme- value range. On the other hand, the type of linear regression we used in this study is a simplistic way to model the analyzed link. However, for now it suggests the very robust signals and by expressing the results of the analysis in terms of the mean relative difference between the two periods, it is expected that the model-related uncertainties to be diminished. For a more comprehensive analysis, it should be taken into account that climate changes may imply other impacts as well (e.g., on water availability) affecting the tourism flux. Studies accounting for both the direct and indirect impact of climate change on tourism (e.g., [48,49]) highlight that the response of the tourism sector to climate changes is complex and pertains to economic and social levels as well. By considering the additional impacts of climate change on tourism in Romania, the estimation provided here would change. Future approaches using more sophisticated models will be further used to better capture the details of analyzed link between climate change and tourism-related indicators.
Nevertheless, by documenting the expected changes in climate suitability for tourism in Romania, the study contributes to the research on this topic targeting South-Eastern Europe. The use of the Holiday Climate Index aligns the study with the most recent approaches (e.g., [50,51,52,53]). The estimation of the direct impact of changes in climate suitability on tourism flux at the destination level may provide useful insights to local authorities and tourism investors. The climate changes may positively impact the tourism sector in Romania, however, the amplitude of this impact is not high, especially in medium-sized urban areas. Further direction of research may consider in more depth the impact of various tourism types in the specific conditions of the Romanian context, as well as by considering indirect impacts of climate changes (e.g., through thermal comfort) which also have a significant influence on tourism.

Author Contributions

Conceptualization, L.V.; data curation, A.I. and V.C.; formal analysis, R.B.; methodology, L.V. and R.B.; project administration, A.G.; resources, V.C. and S.P.; visualization, A.I.; writing—original draft, L.V.; writing—review and editing, A.G. and S.P. All authors have read and agreed to the published version of the manuscript.

Funding

This project received funding from the European Union’s Horizon 2020 research and innovation program under the Marie Sklodowska–Curie Grant agreement no. 887544.

Institutional Review Board Statement

Not applicable.

Informed Consent Statement

Not applicable.

Data Availability Statement

Publicly available datasets were analyzed in this study. These data can be found here: https://cds.climate.copernicus.eu, http://statistici.insse.ro:8077/tempo-online/#/pages/tables/insse-table (accessed on 4 April 2023).

Conflicts of Interest

The authors declare no conflict of interest. The funders had no role in the design of the study; in the collection, analyses, or interpretation of data; in the writing of the manuscript, or in the decision to publish the results.

References

  1. UNWTO https://www.unwto.org/glossary-tourism-terms (accessed on 6April 2023).
  2. NIS (National Institute for Statistics) 2021: https://insse.ro/cms/sites/default/files/field/publicatii/contul_satelit_de_turism_2020.pdf) (accessed on 6April 2023).
  3. NIS (National Institute of Statistics) - TEMPO database. Available online at http://statistici.insse.ro:8077/tempo-online/#/pages/tables/insse-table (accessed on 6 April 2023).
  4. NSTD (National Strategy for Touristic Development) 2020; http://sgg.gov.ro/1/wp-content/uploads/2020/09/Strategia-de-Dezvoltare-Turistic%C4%83-a-Rom%C3%A2niei-volum-2-Strategia-%C8%99i-Planul-de-Ac%C8%9Biune.pdf (accessed on 6 April 2023).
  5. Velea, L., Gallo, A., Bojariu, R., Irimescu, A., Craciunescu, V., Puiu, S. Holiday Climate Index:Urban — Application for Urban and Rural Areas in Romania, Atmosphere, 2022, 13, pp. 1519. [CrossRef]
  6. *** Romania’s Geography, I, Physical Geography; Publisher: Edit. Acad., Bucureşti, Romania, 662 p., 1983 (in Romanian).
  7. *** Romania’s Climate, Publisher: Edit. Acad. Române, Bucureşti, Romania, 363 p. , 2008 (in Romanian).
  8. Bojariu, R., Chițu, Z., Dascălu, S.I., Gothard, M., Velea, L.V., Burcea, R., Dumitrescu, A., Burcea, S., Apostol, L., Amihaesei, V., Marin, L., Crăciunescu, V., Irimescu, A., Mătreață, M., Niță, A., Bîrsan, M.V. Climate changes – from physical basis to risks and adaptation, 2nd ed.; Publisher: Ed. Printech, București, Romania; 2021, pp 46-54 (In Romanian). Available online at https://www.meteoromania.ro/clima/adaptarea-la-schimbarile-climatice/ (accessed on 6 April 2023). (In Romanian). Available online at https://www.meteoromania.ro/clima/adaptarea-la-schimbarile-climatice/ (accessed on 6 April 2023)
  9. Hamilton, L. C., Brown, C., Keim, B. D. Ski areas, weather and climate: Time series models for New England case studies. Int. J. of Clim., 2007,27, 2113–2124.
  10. Amelung, B., Moreno, A. Impacts of climate change in tourism in Europe. PESETA-Tourism study. Publications Office, 2012.
  11. Pons-Pons M., Johnson P.A., Rosas-Casals M., Sureda B., Jover È. Modeling climate change effects on winter ski tourism in Andorra. Clim Res, 2012, 54:197-207. [CrossRef]
  12. Tranos, E., Davoudi, S. The Regional Impact of Climate Change on Winter Tourism in Europe, Tourism Planning & Development, 2014, 11:2, 163-178. [CrossRef]
  13. Damm, A., Greuell, W., Landgren, O., Prettenthaler, F. Impacts of +2°C global warming on winter tourism demand in Europe, Clim. Serv., 2017, 7, 31-46. [CrossRef]
  14. Steiger, R., Scott, D. Ski tourism in a warmer world: Increased adaptation and regional economic impacts in Austria, Tourism Management, 2020, 77, 104032. [CrossRef]
  15. Grillakis, M.G., Koutroulis, A.G., Seiradakis, K.D., Tsanis, I.K. Implications of 2°C global warming in European summer tourism, Clim. Serv., 2016,1, Pages 30-38. [CrossRef]
  16. Jacob, D., Kotova, L., Teichmann, C., Sobolowski, S.P., Vautard, R., Donnelly, C., Koutroulis, A.G., Grillakis, M.G., Tsanis, I.K., Damm, A., Sakalli, A. and van Vliet, M.T.H. (2018), Climate Impacts in Europe Under +1.5°C Global Warming. Earth's Future, 6: 264-285. [CrossRef]
  17. Demiroglu, O. C., Saygili-Araci, F. S., Pacal, A., Hall, C. M., & Kurnaz, M. L. Future Holiday Climate Index (HCI) performance of urban and beach destinations in the Mediterranean. Atm, 2020, 11(9), 911. [CrossRef]
  18. Toimil, A., Díaz-Simal, P., Losada, I.J., Camus, P. Estimating the risk of loss of beach recreation value under climate change, Tourism Management, 2018, 68,c387-400. [CrossRef]
  19. Matzarakis, A., Endler, C., Nastos, P. T. Quantification of climate-tourism potential for Athens, Greece - recent and future climate simulations., Global Nest Journal, 2014, 16(1), 43-51. Available online at https://journal.gnest.org/sites/default/files/Submissions/gnest_01264/gnest_01264_published.pdf (accessed on 10 April 2023).
  20. Caldeira, A.M, Kastenholz, E. It’s so hot: predicting climate change effects on urban tourists’ time–space experience, Journal of Sustainable Tourism, 2018, 26:9, 1516-1542. [CrossRef]
  21. Surugiu, C., Surugiu, M.R. The Assessment of Climate Change Impact on the Romanian Seaside Tourism, Economic Research-Ekonomska Istraživanja, 2012, 25:4, 959-972. [CrossRef]
  22. Dumitrescu, G.-C., Poladian, S.M., Aluculesei, A.-C. Repositioning of Romanian Seaside Tourism as an Effect of Climate Change. Information, 2021, 12, 108. [CrossRef]
  23. Surugiu, C., Surugiu, M.R., Frent, C., Breda, Z. Effects of climate change on Romanian mountain tourism: are they positive or mostly negative?, European Journal of Tourism, Hospitality and Recreation, 2011, 2(1), 42-71.
  24. Velea L., Bojariu, R. Summer thermal discomfort conditions in Romania under climate change scenarios, Carpathian Journal of Earth and Environmental Sciences, 2018, 13(2), 595 - 603. [CrossRef]
  25. Banc, Ș., Croitoru, A-.E., David, N.A., Scripcă, A.-S.. Changes Detected in Five Bioclimatic Indices in Large Romanian Cities over the Period 1961–2016. Atm, 2020, 11(8):819.
  26. Cheval, S., Dumitrescu, A., Irașoc, A., Paraschiv, M.G., Perry, M., Ghent, D. MODIS-based climatology of the Surface Urban Heat Island at country scale (Romania), Urban Climate, 2022, 41, 101056. [CrossRef]
  27. Sfîcă, L., Crețu, C.S., Ichim, P., Hrițac, R., Breabăn, I.G. Surface urban heat island of Iași city (Romania) and its differences from in situ screen-level air temperature measurements, Sustainable Cities and Society, 2023, 104568. [CrossRef]
  28. Scott, D., Rutty, M., Amelung, B., Tang, M. An Inter-Comparison of the Holiday Climate Index (HCI) and the Tourism Climate Index (TCI) in Europe. Atm. 2016, 7, 80. [CrossRef]
  29. https://cds.climate.copernicus.eu/.
  30. https://cds.climate.copernicus.eu/cdsapp#!/dataset/sis-tourism-climate-suitability-indicators?tab=overview.
  31. Strandberg, G., Bärring, L., Hansson, U., Jansson, C., Jones, C., Kjellström, E., Kolax, M., Kupiainen, M., Nikulin, G., Samuelsson, P., Ullerstig, A., and Wang, S.: CORDEX scenarios for Europe from the Rossby Centre regional climate model RCA4, Report meteorology and climatology No. 116, 2014. Swedish Meteorological and Hydrological Institute (SMHI), ISSN: 0347-2116.
  32. Benassi, M. Climate Suitability for Tourism Indicators (CST) - Dataset description, 2019, available at https://datastore.copernicus-climate.eu/documents/sis-european-tourism/C3S_D422_Lot2_TEC_CST_dataset_description_v1.1_Projections.pdf.
  33. UERRA: Available online: https://datastore.copernicus-climate.eu/documents/uerra/D322_Lot1.4.1.2_User_guides_v3.3.pdf (accessed on 6April 2023).
  34. ERA5-Land: Available online: https://cds.climate.copernicus.eu/cdsapp#!/dataset/reanalysis-era5-land?tab=overview (accessed on 6April 2023).
  35. Serquet, G., Rebetez, M. Relationship between tourism demand in the Swiss Alps and hot summer air temperatures associated with climate change. Clim. Chang. , 2011, 108, 291–300. [CrossRef]
  36. Falk, M. Impact of weather conditions on tourism demand in the peak summer season over the last 50years, Tourism Management Perspectives, 2014, 9, 24-35. [CrossRef]
  37. Köberl, J., Prettenthaler, F., Bird, D.N. Modelling climate change impacts on tourism demand: A comparative study from Sardinia (Italy) and Cap Bon (Tunisia), Science of The Total Environment, 2006, 543-B, 1039-1053. [CrossRef]
  38. Yañez, C.C., Hopkins, F.M., Porter, W.C. Projected impacts of climate change on tourism in the Coachella Valley, California. Clim. Change, 2020, 162, 707–721 (2020). [CrossRef]
  39. Hein, L., Metzger, M. J., & Moreno, A. Potential impacts of climate change on tourism; a case study for Spain. Current Opinion in Environmental Sustainability, 2009, 1(2), 170–178. [CrossRef]
  40. Mieczkowski, Z. The tourism climatic index: A method of evaluating world climates for tourism. Can. Geogr./Le Géographe Can. 1985, 29, 220–233.
  41. Oğur, A.A., Baycan, T. Assessing climate change impacts on tourism demand in Turkey, Environment, Development and Sustainability, 2022. [CrossRef]
  42. Carrillo, J., González, A., Pérez, J.C. et al. Projected impacts of climate change on tourism in the Canary Islands. Reg Environ Change, 2022, 22, 61. [CrossRef]
  43. Stancioiu, A.F., Teodorescu, N., Pârgaru, I., Botos, A., Radu, A.C. Aspects on the perception of young people regarding balneotherapy tourism in Romania. Theor. Appl. Econ. 2013, 12, 25–42. Available online: http://store.ectap.ro/articole/930.pdf. (accessed on 6 April 2023).
  44. MET ((Ministry of Entrepreneurship and Tourism) Masterplan for the Development of Balneo-Climateric Tourism; 2018. Available online: https://turism.gov.ro/web/wp-content/uploads/2018/11/MASTER-PLAN-PENTRU-DEZVOLTAREA-TURISMULUI-BALNEAR.pdf (accessed on 6 April 2023). (In Romanian).
  45. MET (Ministry of Entrepreneurship and Tourism). ROMANIA'S NATIONAL STRATEGY FOR DEVELOPMENT tourism 2023-2035; 2022. Available online: https://turism.gov.ro/web/wp-content/uploads/2022/11/SNRDT-actualizat-var-pt-HG-2023-2035.pdf (accessed on 6 April 2023). (In Romanian).
  46. Zhang H, Huang GH, Wang D, Zhang X. Uncertainty assessment of climate change impacts on the hydrology of small prairie wetlands. J. Hydrol. , 2011, 396: 94–103.
  47. Samadi, S., Wilson, C.A.M.E. & Moradkhani, H. Uncertainty analysis of statistical downscaling models using Hadley Centre Coupled Model. Theor Appl Climatol 114, 673–690 (2013). [CrossRef]
  48. Day, J., Chin, N., Sydnor, S., Widhalm, M., Shah, K.U., Dorworth, L. Implications of climate change for tourism and outdoor recreation: an Indiana, USA, case study. Clim Change. 2021, 169(3-4):29. [CrossRef]
  49. Arabadzhyan, A., Figini, P., García, C., González, M.M., Lam-González, Y.E., León, C.J. Climate change, coastal tourism, and impact chains – a literature review, Current Issues in Tourism 2021, 24:16, 2233-2268. [CrossRef]
  50. Demiroglu, O. C., Saygili-Araci, F. S., Pacal, A., Hall, C. M., & Kurnaz, M. L. Future Holiday Climate Index (HCI) performance of urban and beach destinations in the Mediterranean. Atm., 2020, 11(9), 911. [CrossRef]
  51. Yu, D.D., Rutty, M., Scott, D. et al. A comparison of the holiday climate index:beach and the tourism climate index across coastal destinations in China. Int J Biometeorol , 2021, 65, 741–748. [CrossRef]
  52. Ma, S., Craig, A.C., Feng, S., Liu, C. Climate resources at United States National Parks: a tourism climate index approach, Tourism Recreation Research, 2021. a: Climate resources at United States National Parks. [CrossRef]
  53. Yu, D.D., Matthews, L., Scott, D., Li, S., Guo, Z. Y. Climate suitability for tourism in China in an era of climate change: a multiscale analysis using holiday climate index, Current Issues in Tourism, 2022, 25:14, 2269-2284. [CrossRef]
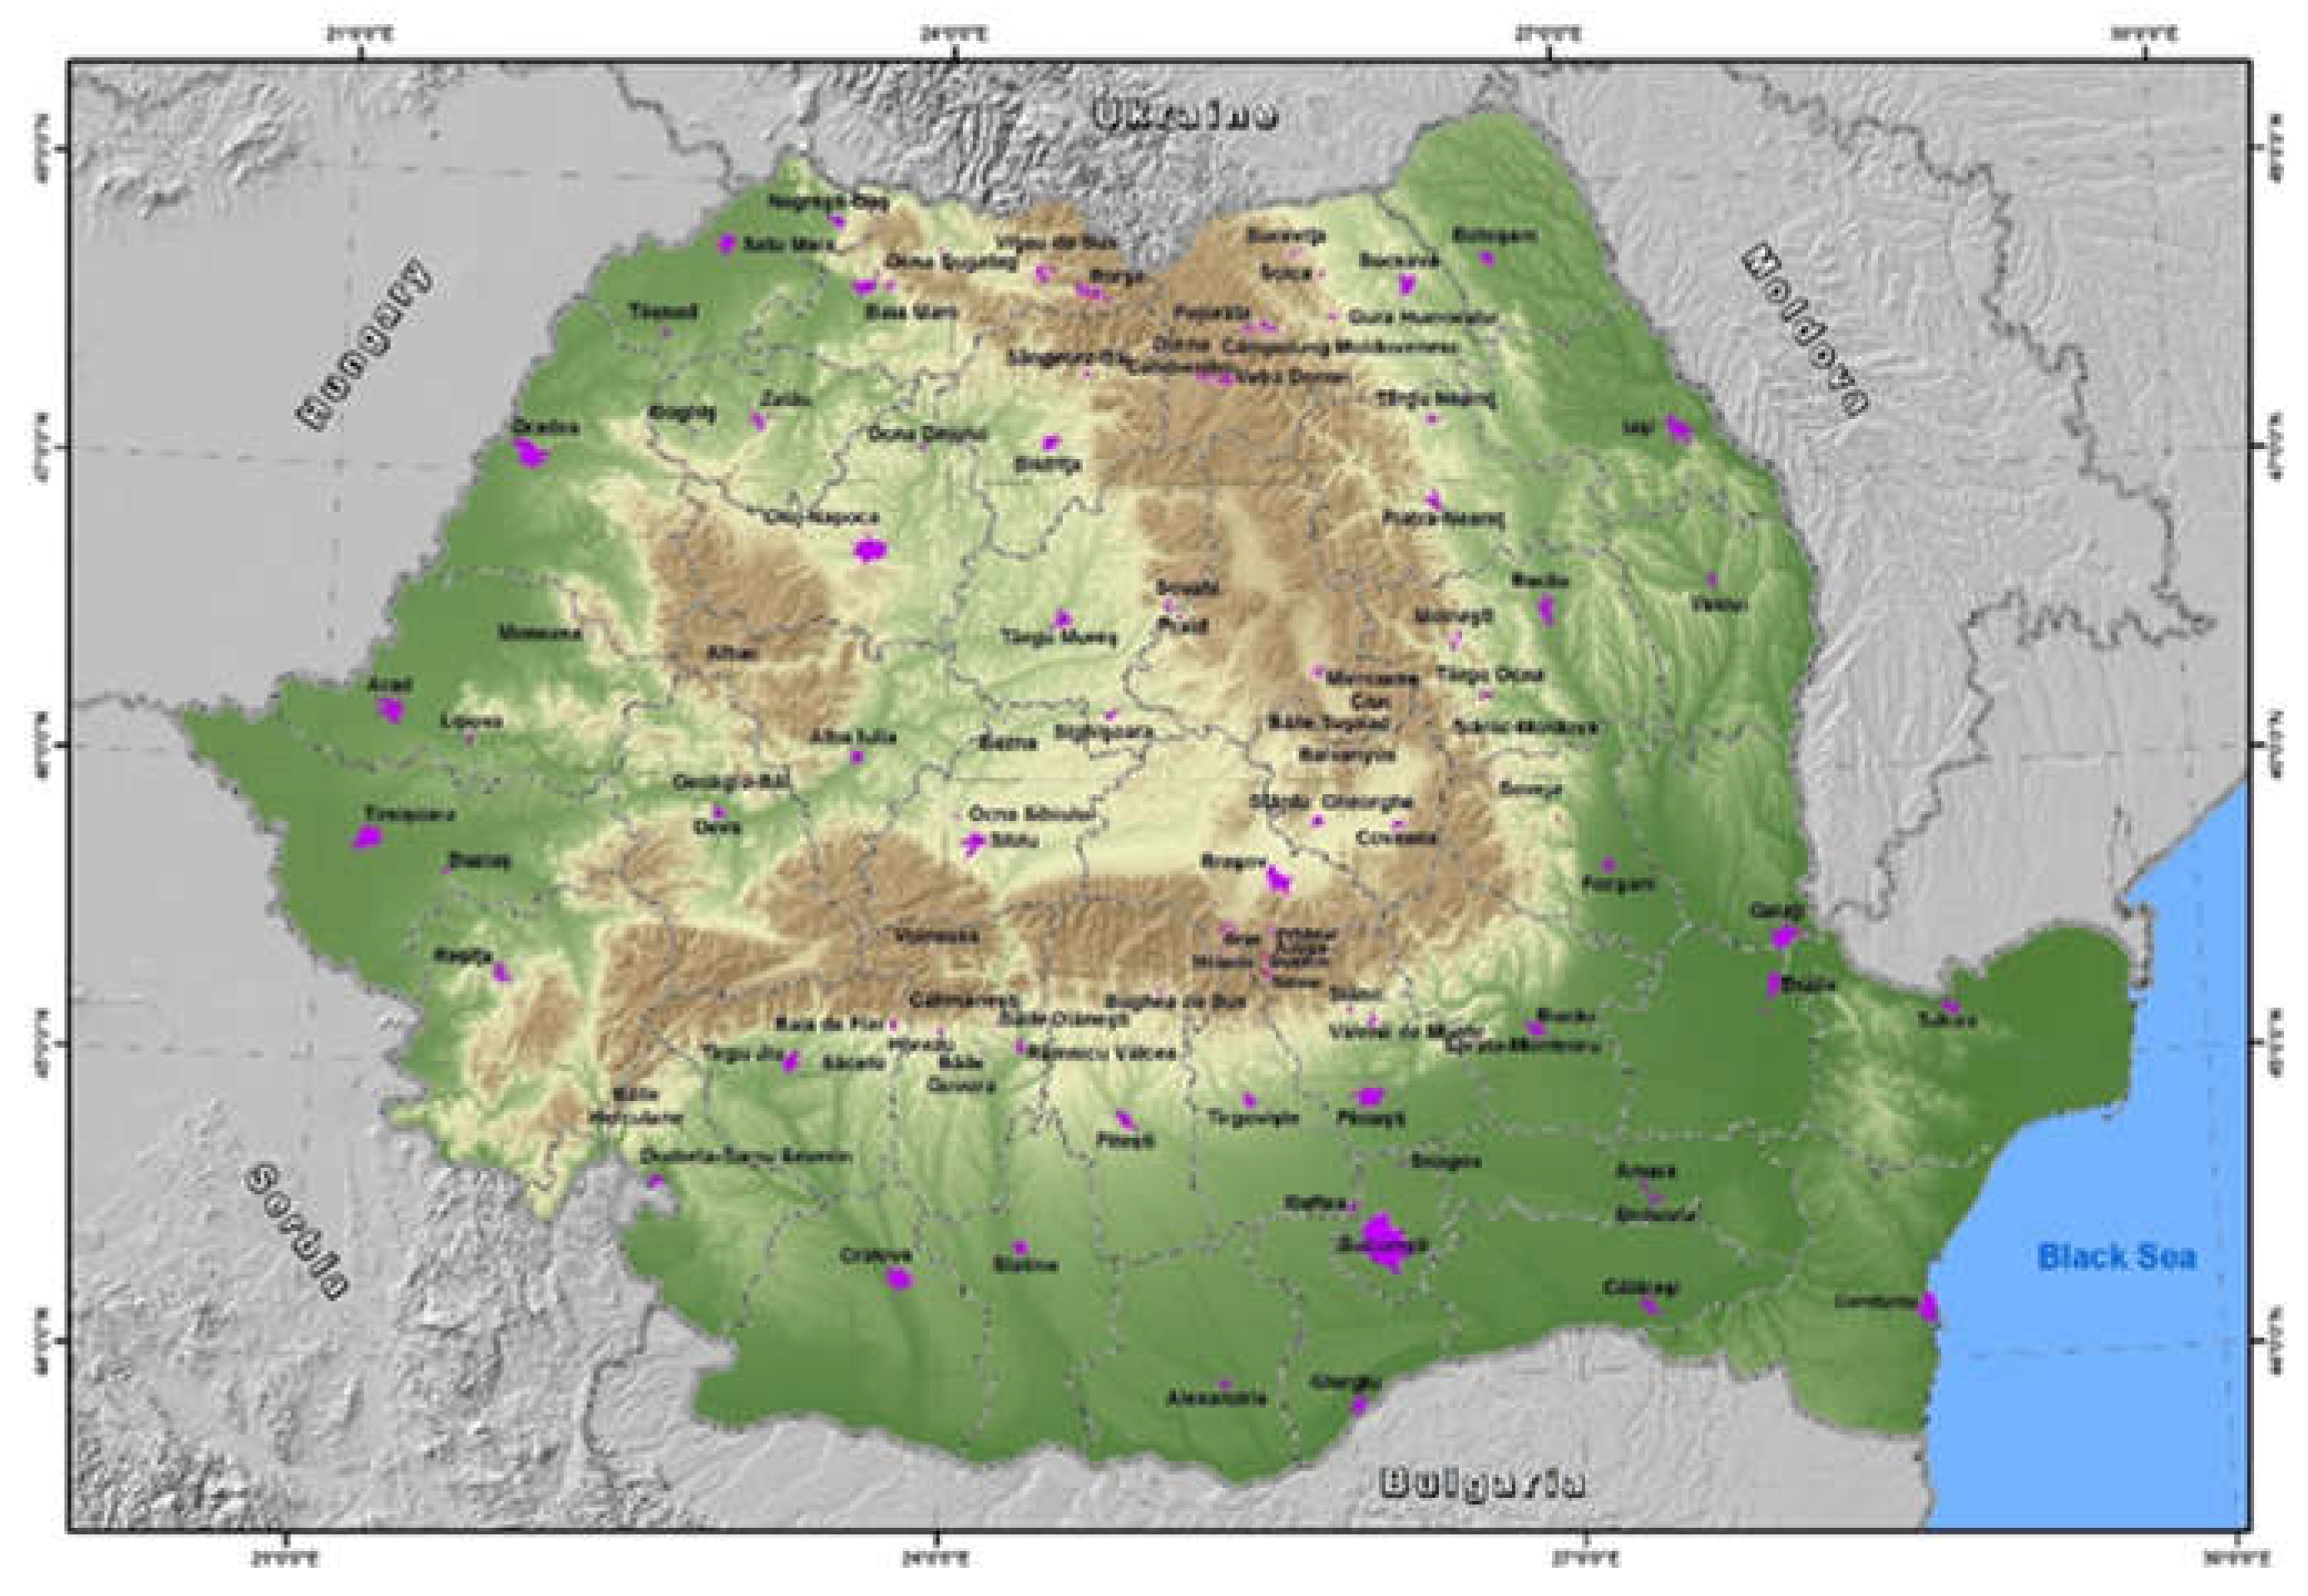
Figure 1. Map of selected touristic destinations.
Preprints 70975 g001
Figure 2. Temporal evolution of monthly touristic overnights between 2010-2018 at Baile Herculane from sectoral data (blue line) and simulated by the linear regression model (orange line).
Preprints 70975 g002
Figure 3. (upper row) Seasonal mean number of days with ‘unfavorable’ climate conditions (HCI <50) for outdoor leisure activities for HIST period (1986-2005); difference between seasonal mean number of days with ‘unfavorable’ climate conditions for period 2021-2040 between RCP45 and HIST (middle row) and between RCP85 and HIST (lower row) simulations.
Preprints 70975 g003
Figure 4. (Upper row) Seasonal mean number of days with ‘good’ climate conditions (HCI >70) for outdoor leisure activities for HIST period (1986-2005); difference between seasonal mean number of days with ‘good’ climate conditions for period 2021-2040 between RCP45 and HIST (middle row) and between RCP85 and HIST (lower row) simulations.
Preprints 70975 g004
Table 1. HCI rating system (after Scott et al, 2016).
HCI values Climate suitability classes (HCI rating) Acronyms used in the graphics
90 ÷ 100 Ideal I
80 ÷ 89 Excellent E
70 ÷ 79 Very good VG
60 ÷ 69 Good G
50 ÷ 59 Acceptable A
40 ÷ 49 Marginal M
30 ÷ 3920 ÷ 29 Unacceptable UA
10 ÷ 199 ÷ 0 Dangerous D
Table 2. Linear regression model-based estimation of the impact of climate changes in the number of touristic overnights for the period 2021-2040, in RCP45 and RCP85 climate change scenarios, for urban localities for which climate conditions explain at least 30% of the variability in touristic overnights during the period 2010-2018.
No. Locality R2 for regression model on 2010-2018 period Mean overnights (sectoral data) 2010-2018 Mean relative overnights difference RCP45-HIST [%] Mean relative overnights difference RCP85-HIST [%]
1 Alba Iulia 40.22 7369 2.77 2.63
2 Arad 53.02 18460 2.01 2.08
3 Bistrita 37.05 7602 2.87 3.16
4 Braila 35.23 14946 3.16 3.00
5 Constanta 57.14 129507 4.80 4.95
6 Targu Jiu 30.48 7216 2.41 2.09
7 Miercurea Ciuc 36.83 5869 3.12 3.47
8 Deva 31.51 4342 2.35 2.35
9 Slobozia 45.42 1519 2.47 2.44
10 Piatra Neamt 60.46 6310 5.21 5.11
11 Zalau 33.36 3295 2.84 3.25
12 Tulcea 49.06 8236 3.92 3.68
13 Ramnicu Valcea 44.83 7635 2.62 2.23
Table 3. Linear regression model-based estimation of the impact of climate changes in the number of touristic overnights for period 2021-2040, in RCP45 and RCP85 climate change scenarios, for rural destinations for which climate conditions explain at least 30% of the variability in touristic overnights during the period 2010-2018.
No. Locality R2 for regression model on 2010-2018 period Mean overnights (sectoral data) 2010-2018 Mean relative overnights difference RCP45-HIST [%] Mean relative overnights difference RCP85-HIST [%]
1 Amara 59.29 13229 3.77 3.64
2 Băile Govora 61.07 9303 4.18 3.43
3 Băile Herculane 55.05 36713 8.31 7.21
4 Băile Olanești 65.86 26810 6.67 5.47
5 Băile Tușnad 47.07 10249 8.88 8.86
6 Bala 43.07 3249 4.49 3.55
7 Băltățești 61.49 5115 14.79 14.35
8 Boghiș 33.84 907 4.33 4.94
9 Buziaș 51.95 8576 2.79 3.10
10 Covasna 64.78 31611 6.77 7.38
11 Geoagiu 61.65 11755 3.10 3.31
12 Gura Humorului 30.57 6702 5.77 5.87
13 Moneasa 67.54 7457 7.86 8.77
14 Ocna Sibiului 32.95 1347 4.67 4.09
15 Praid 35.51 2122 9.89 10.56
16 Sângeorz_Băi 57.53 3579 11.08 14.01
17 Slănic Moldova 51.96 7086 12.45 11.45
18 Sovata 63.62 28656 6.15 6.62
19 Tășnad 44.3 1441 2.94 3.65
20 Slănic (Prahova) 49.33 5682 5.65 4.87
Disclaimer/Publisher’s Note: The statements, opinions and data contained in all publications are solely those of the individual author(s) and contributor(s) and not of MDPI and/or the editor(s). MDPI and/or the editor(s) disclaim responsibility for any injury to people or property resulting from any ideas, methods, instructions or products referred to in the content.
Copyright: This open access article is published under a Creative Commons CC BY 4.0 license, which permit the free download, distribution, and reuse, provided that the author and preprint are cited in any reuse.
Prerpints.org logo

Preprints.org is a free preprint server supported by MDPI in Basel, Switzerland.

Subscribe

© 2024 MDPI (Basel, Switzerland) unless otherwise stated