Submitted:
14 April 2023
Posted:
14 April 2023
You are already at the latest version
Abstract
Keywords:
1. Introduction
2. System Modeling
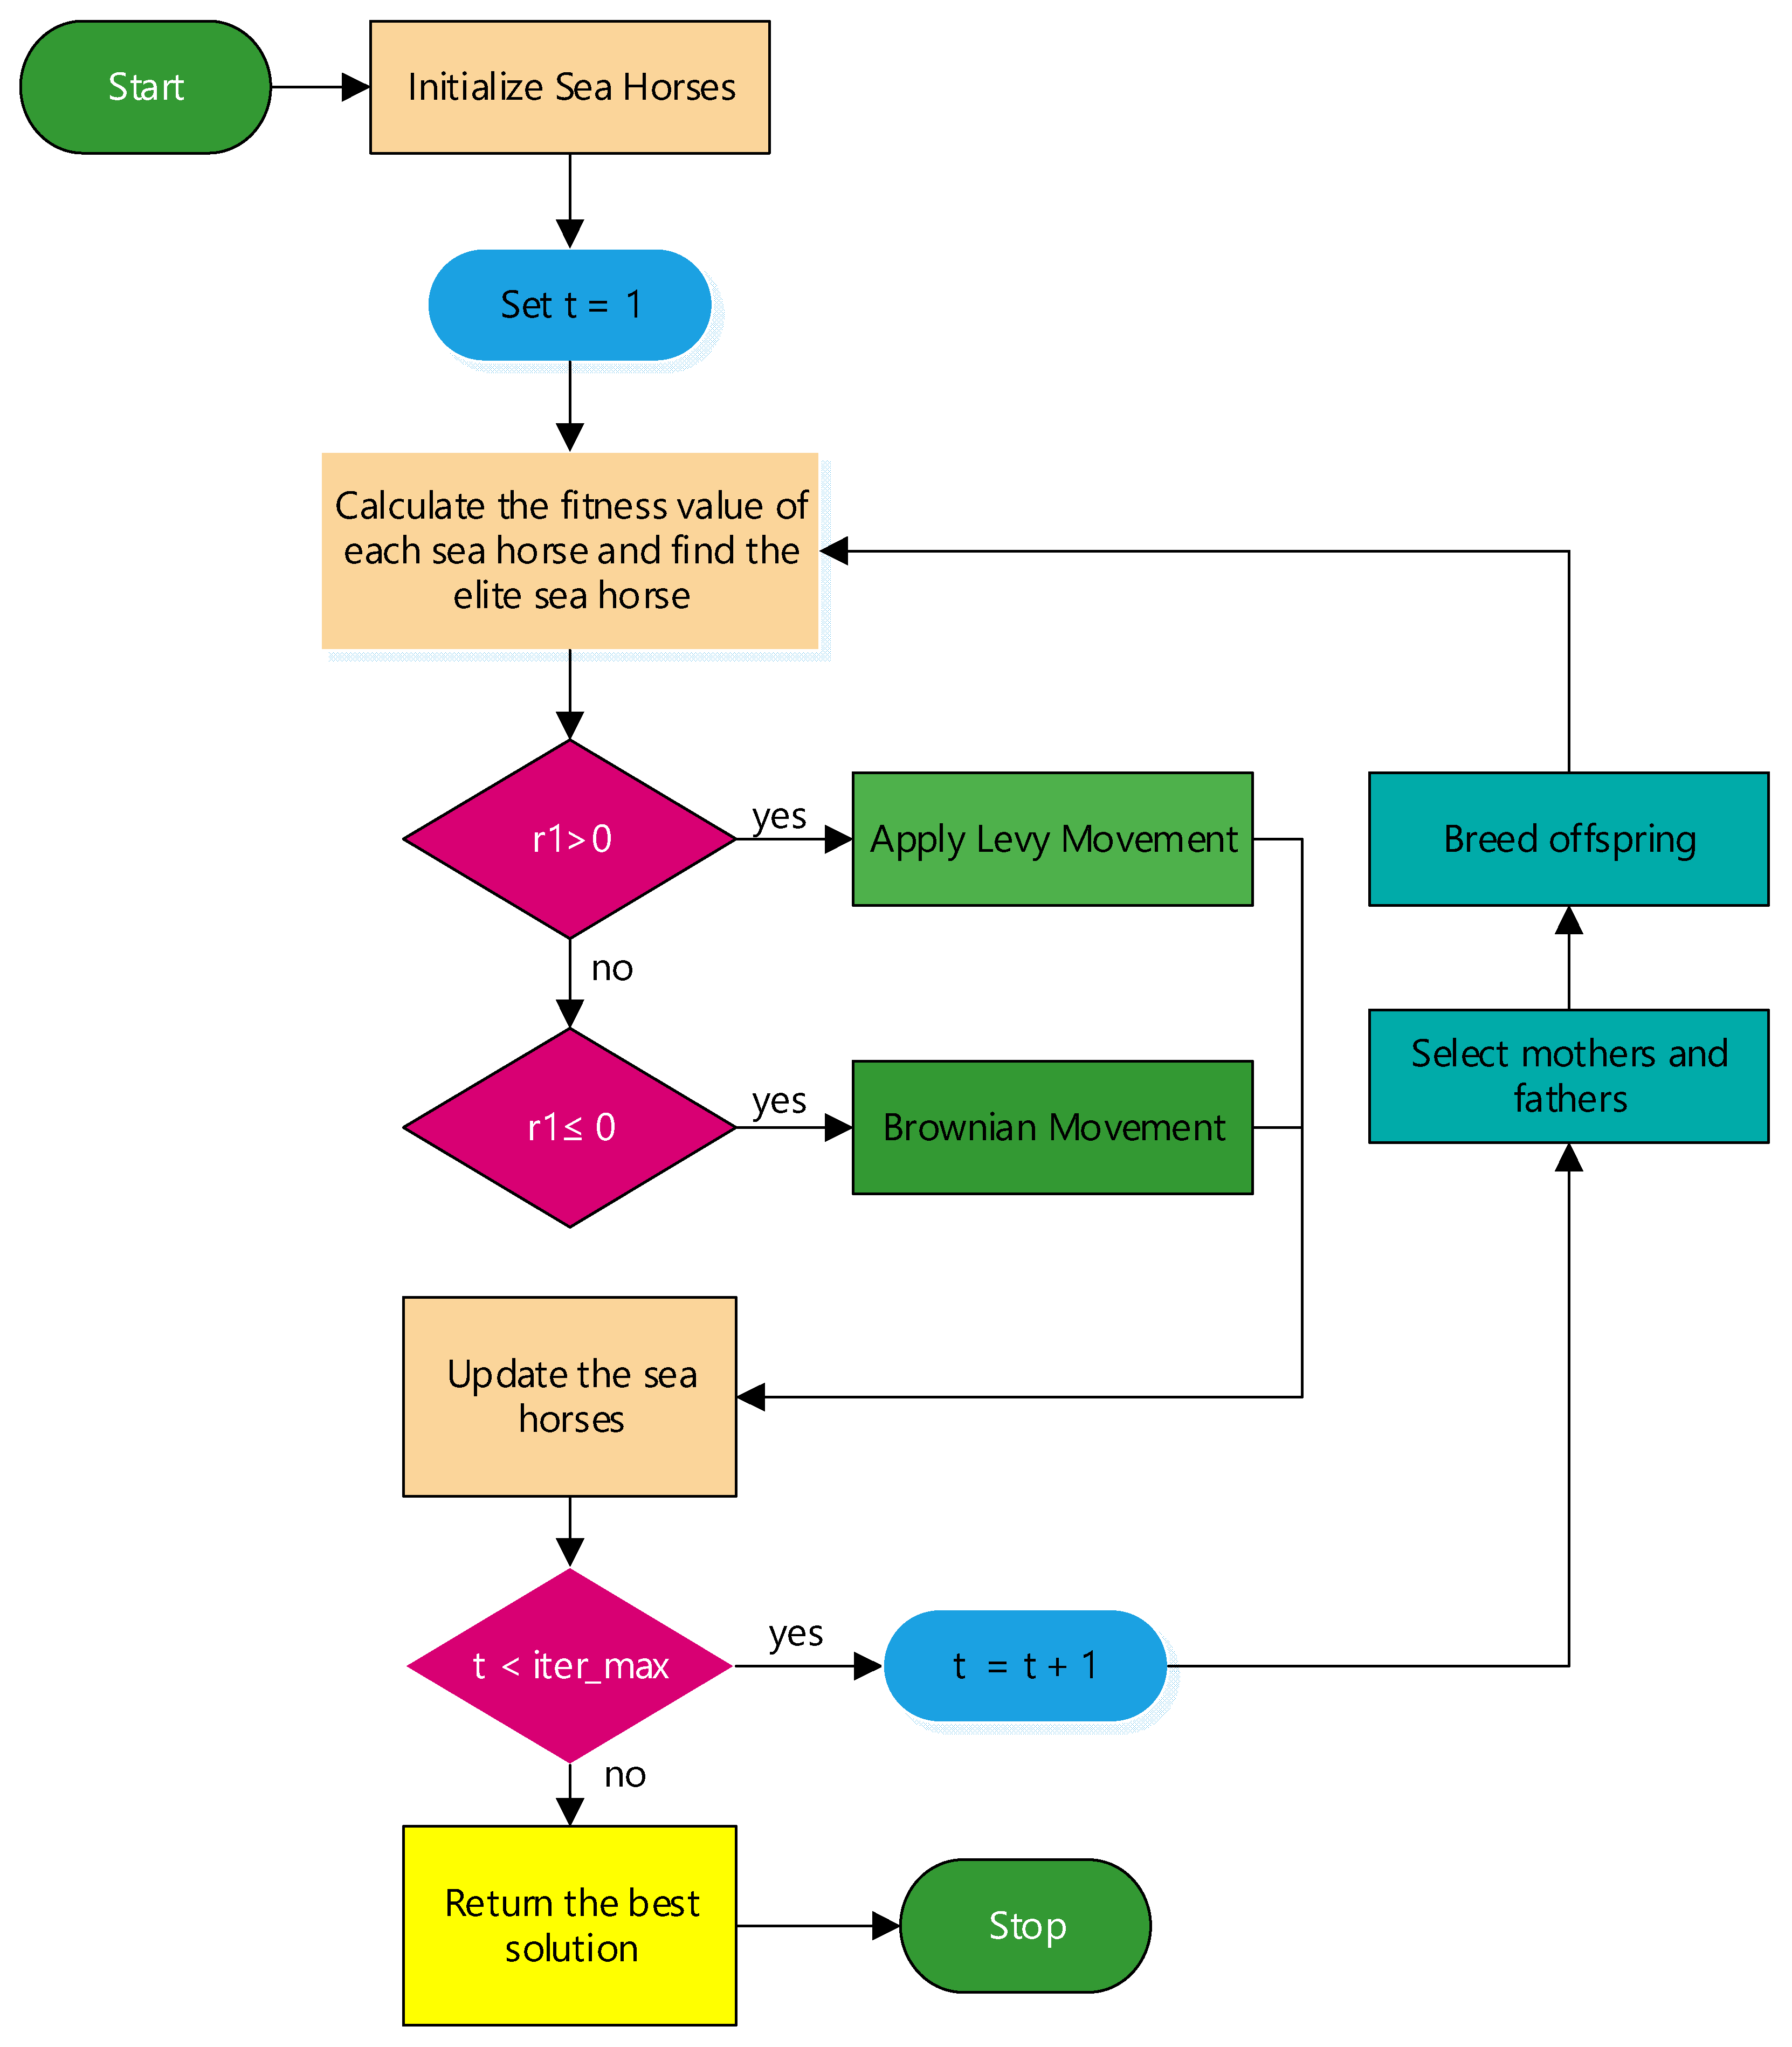
3. Sea Horse Optimizer Algorithm
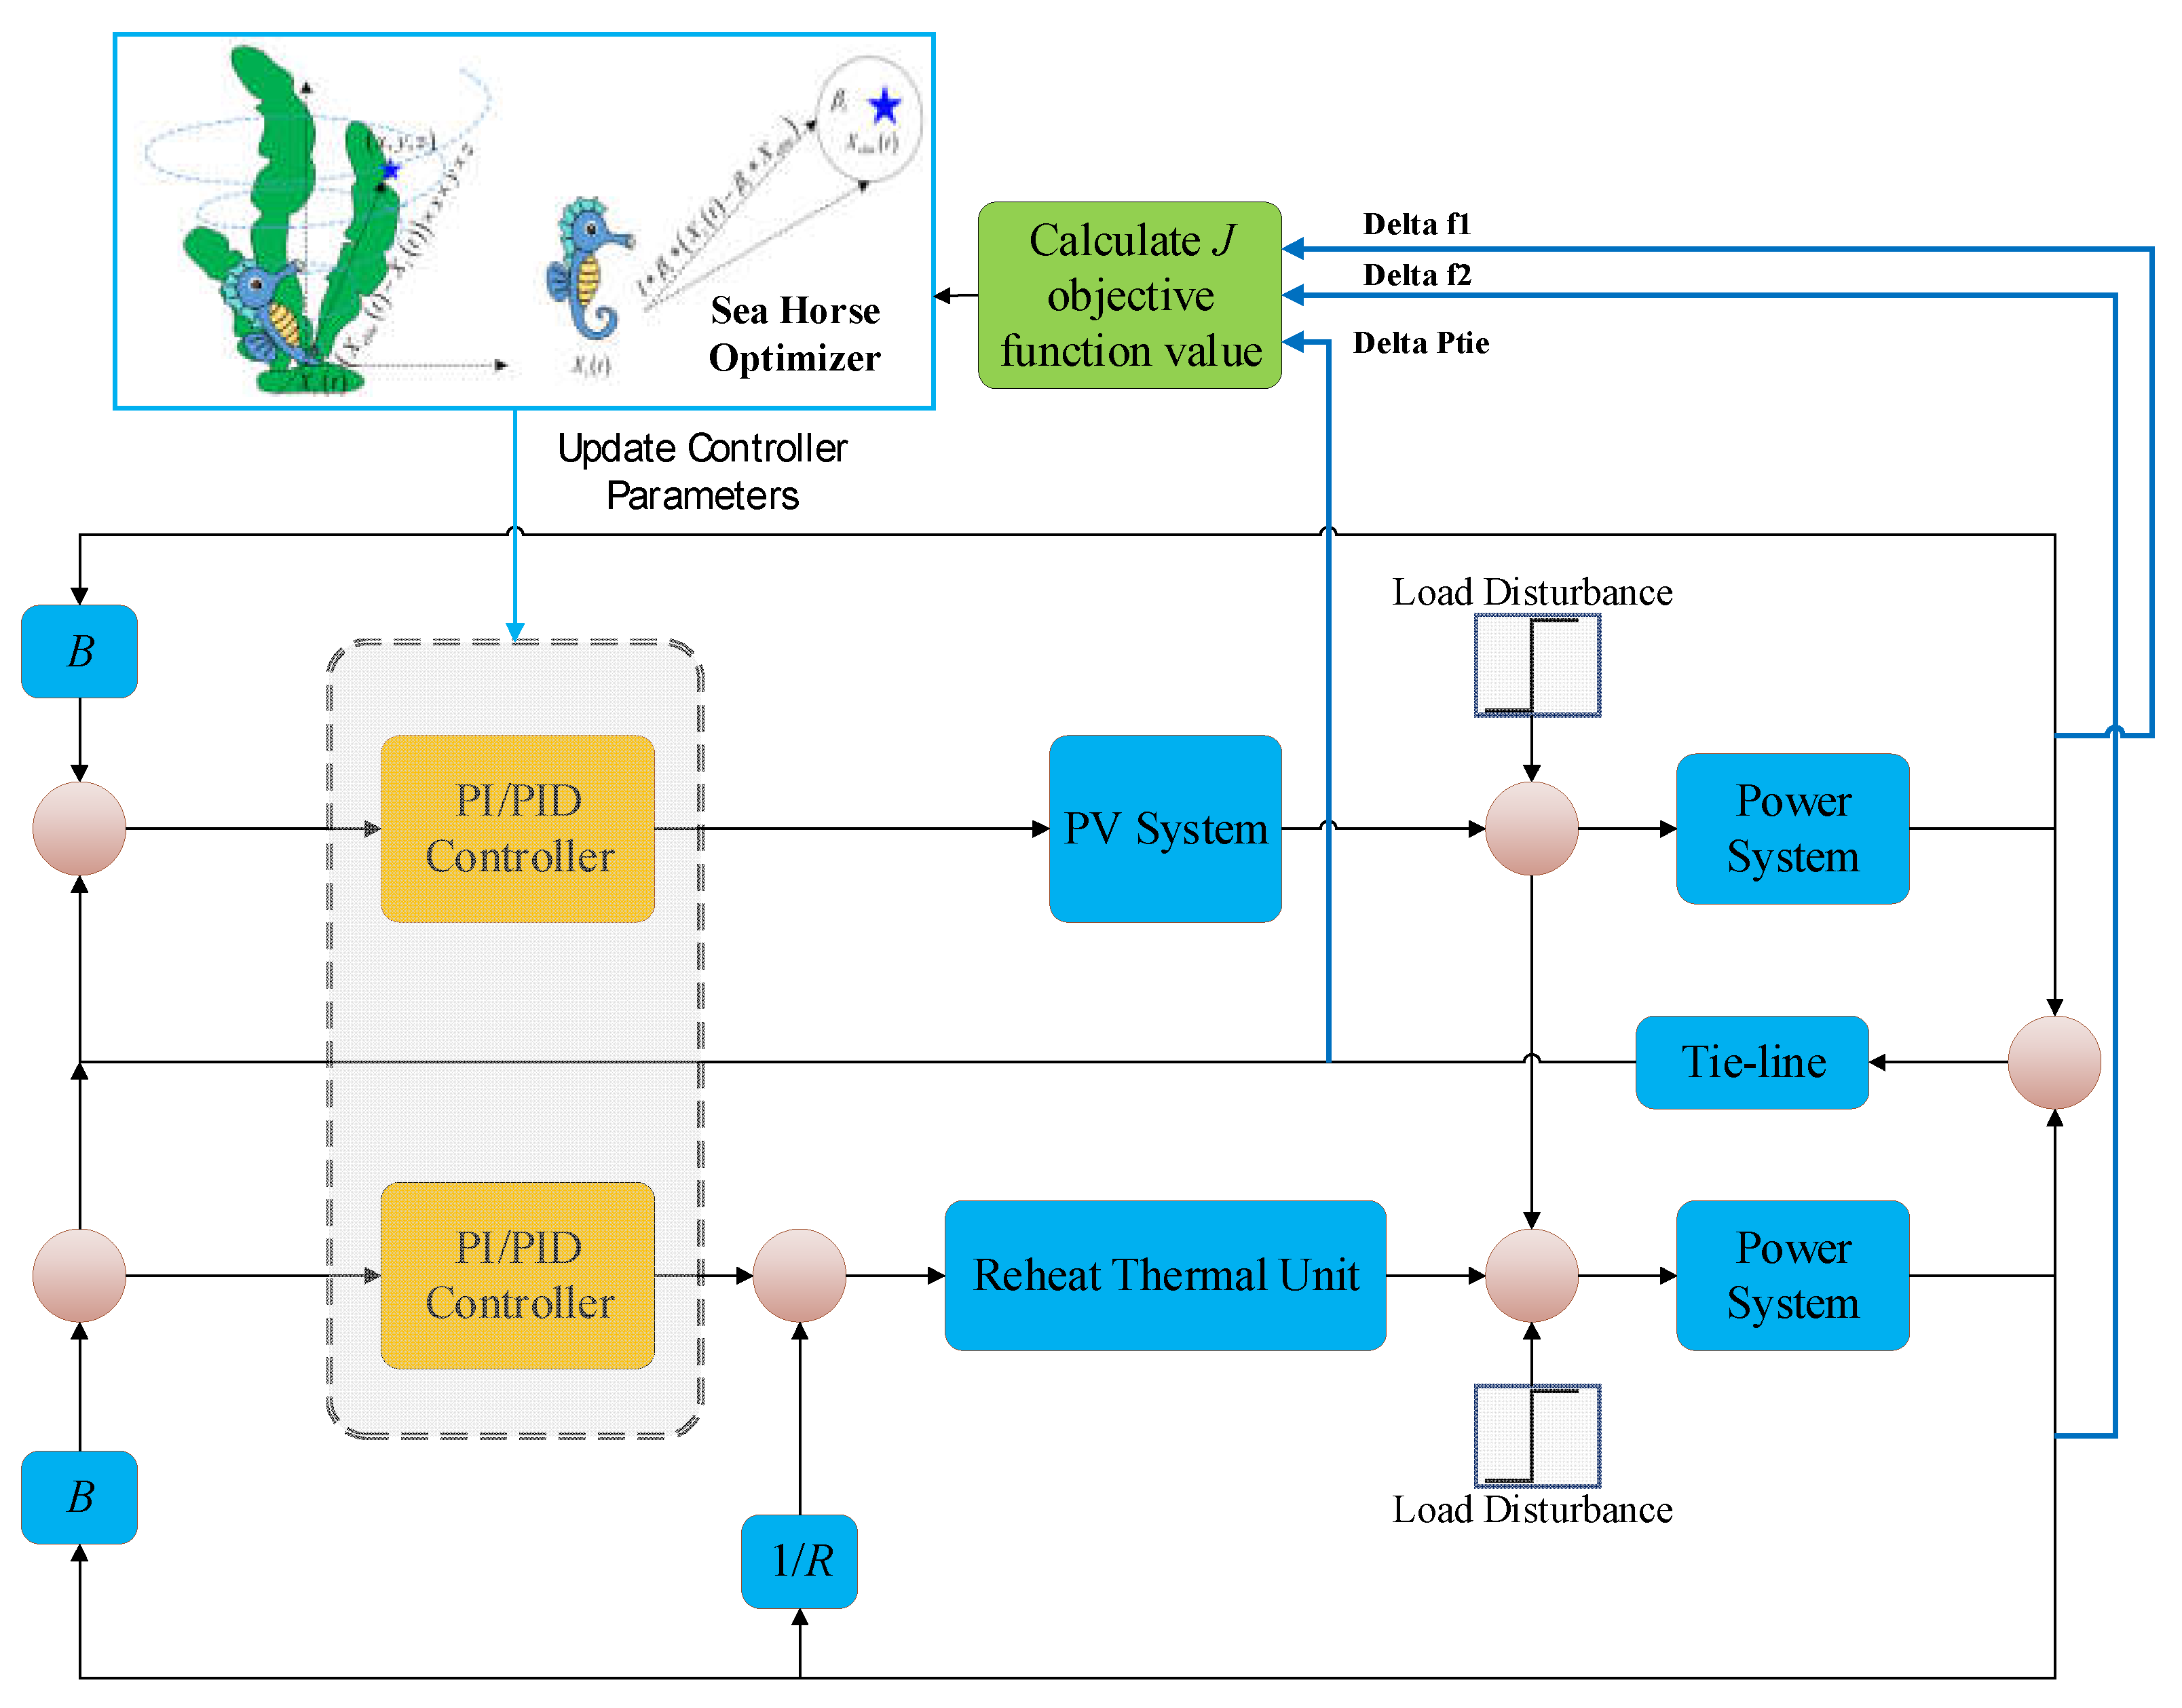
4. Sea Horse Optimization Based Load Frequency Control
4.1. PI Controller
4.2. PID Controller
5. Simulation Results and Discussion
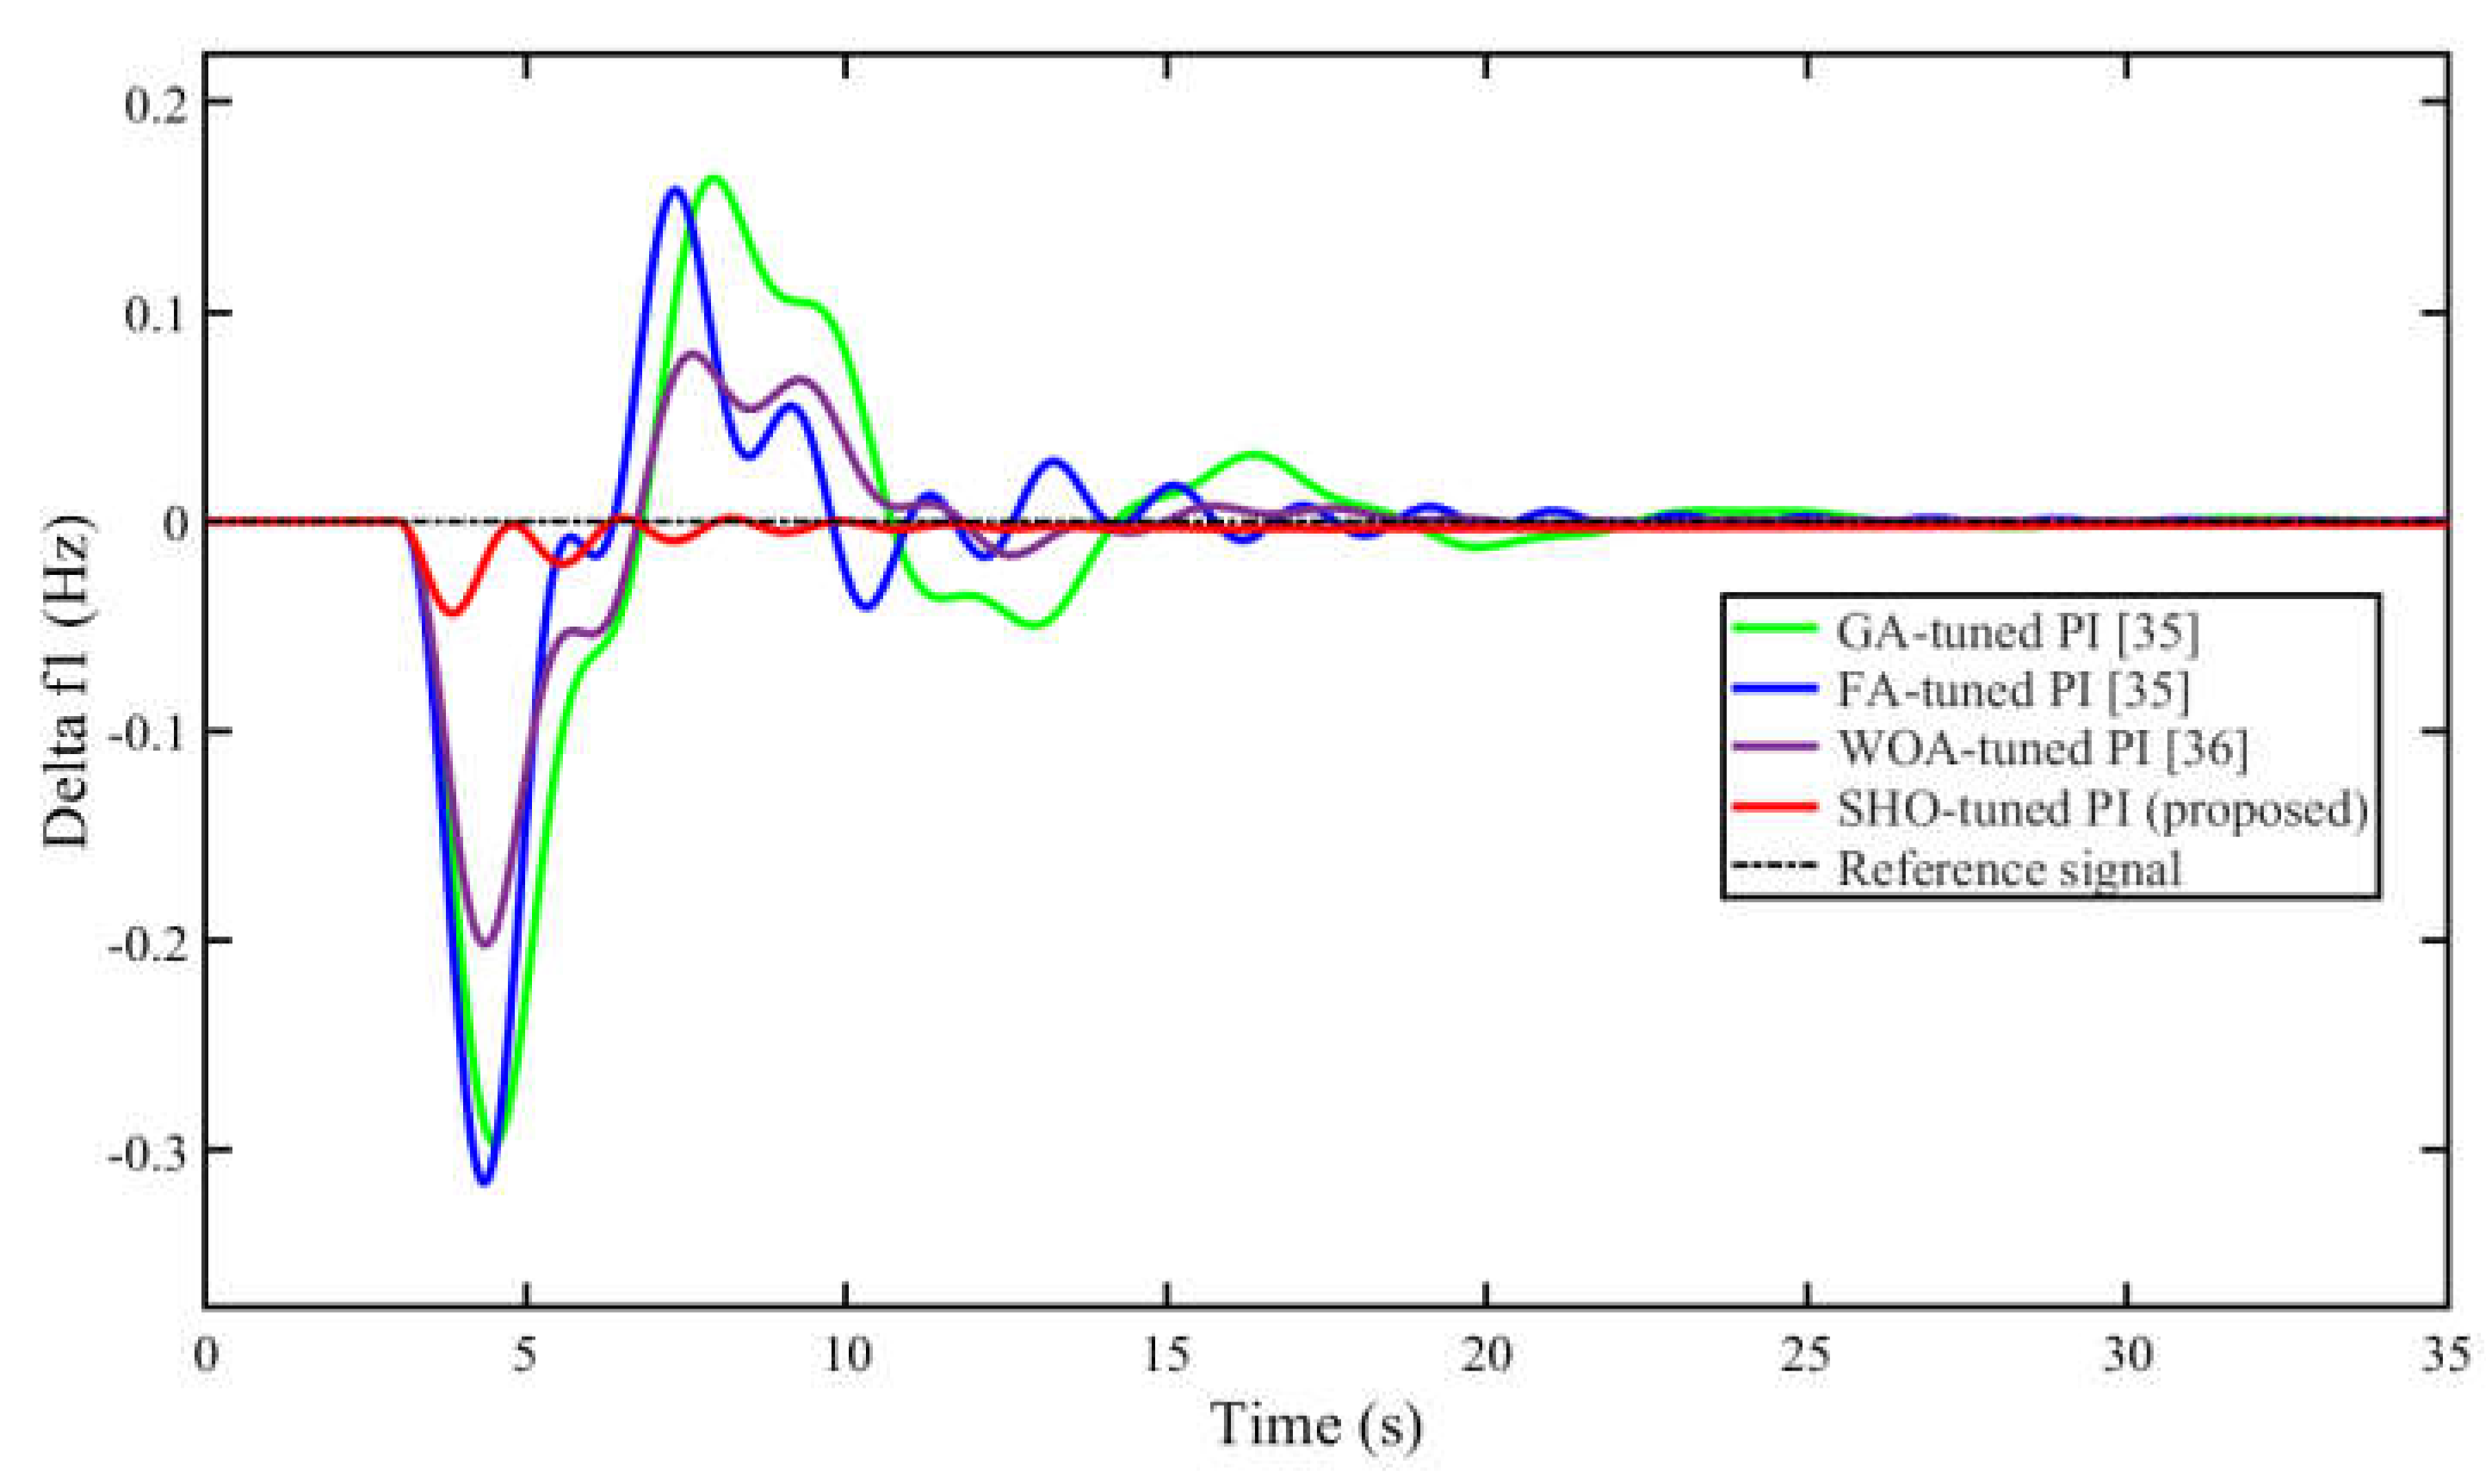
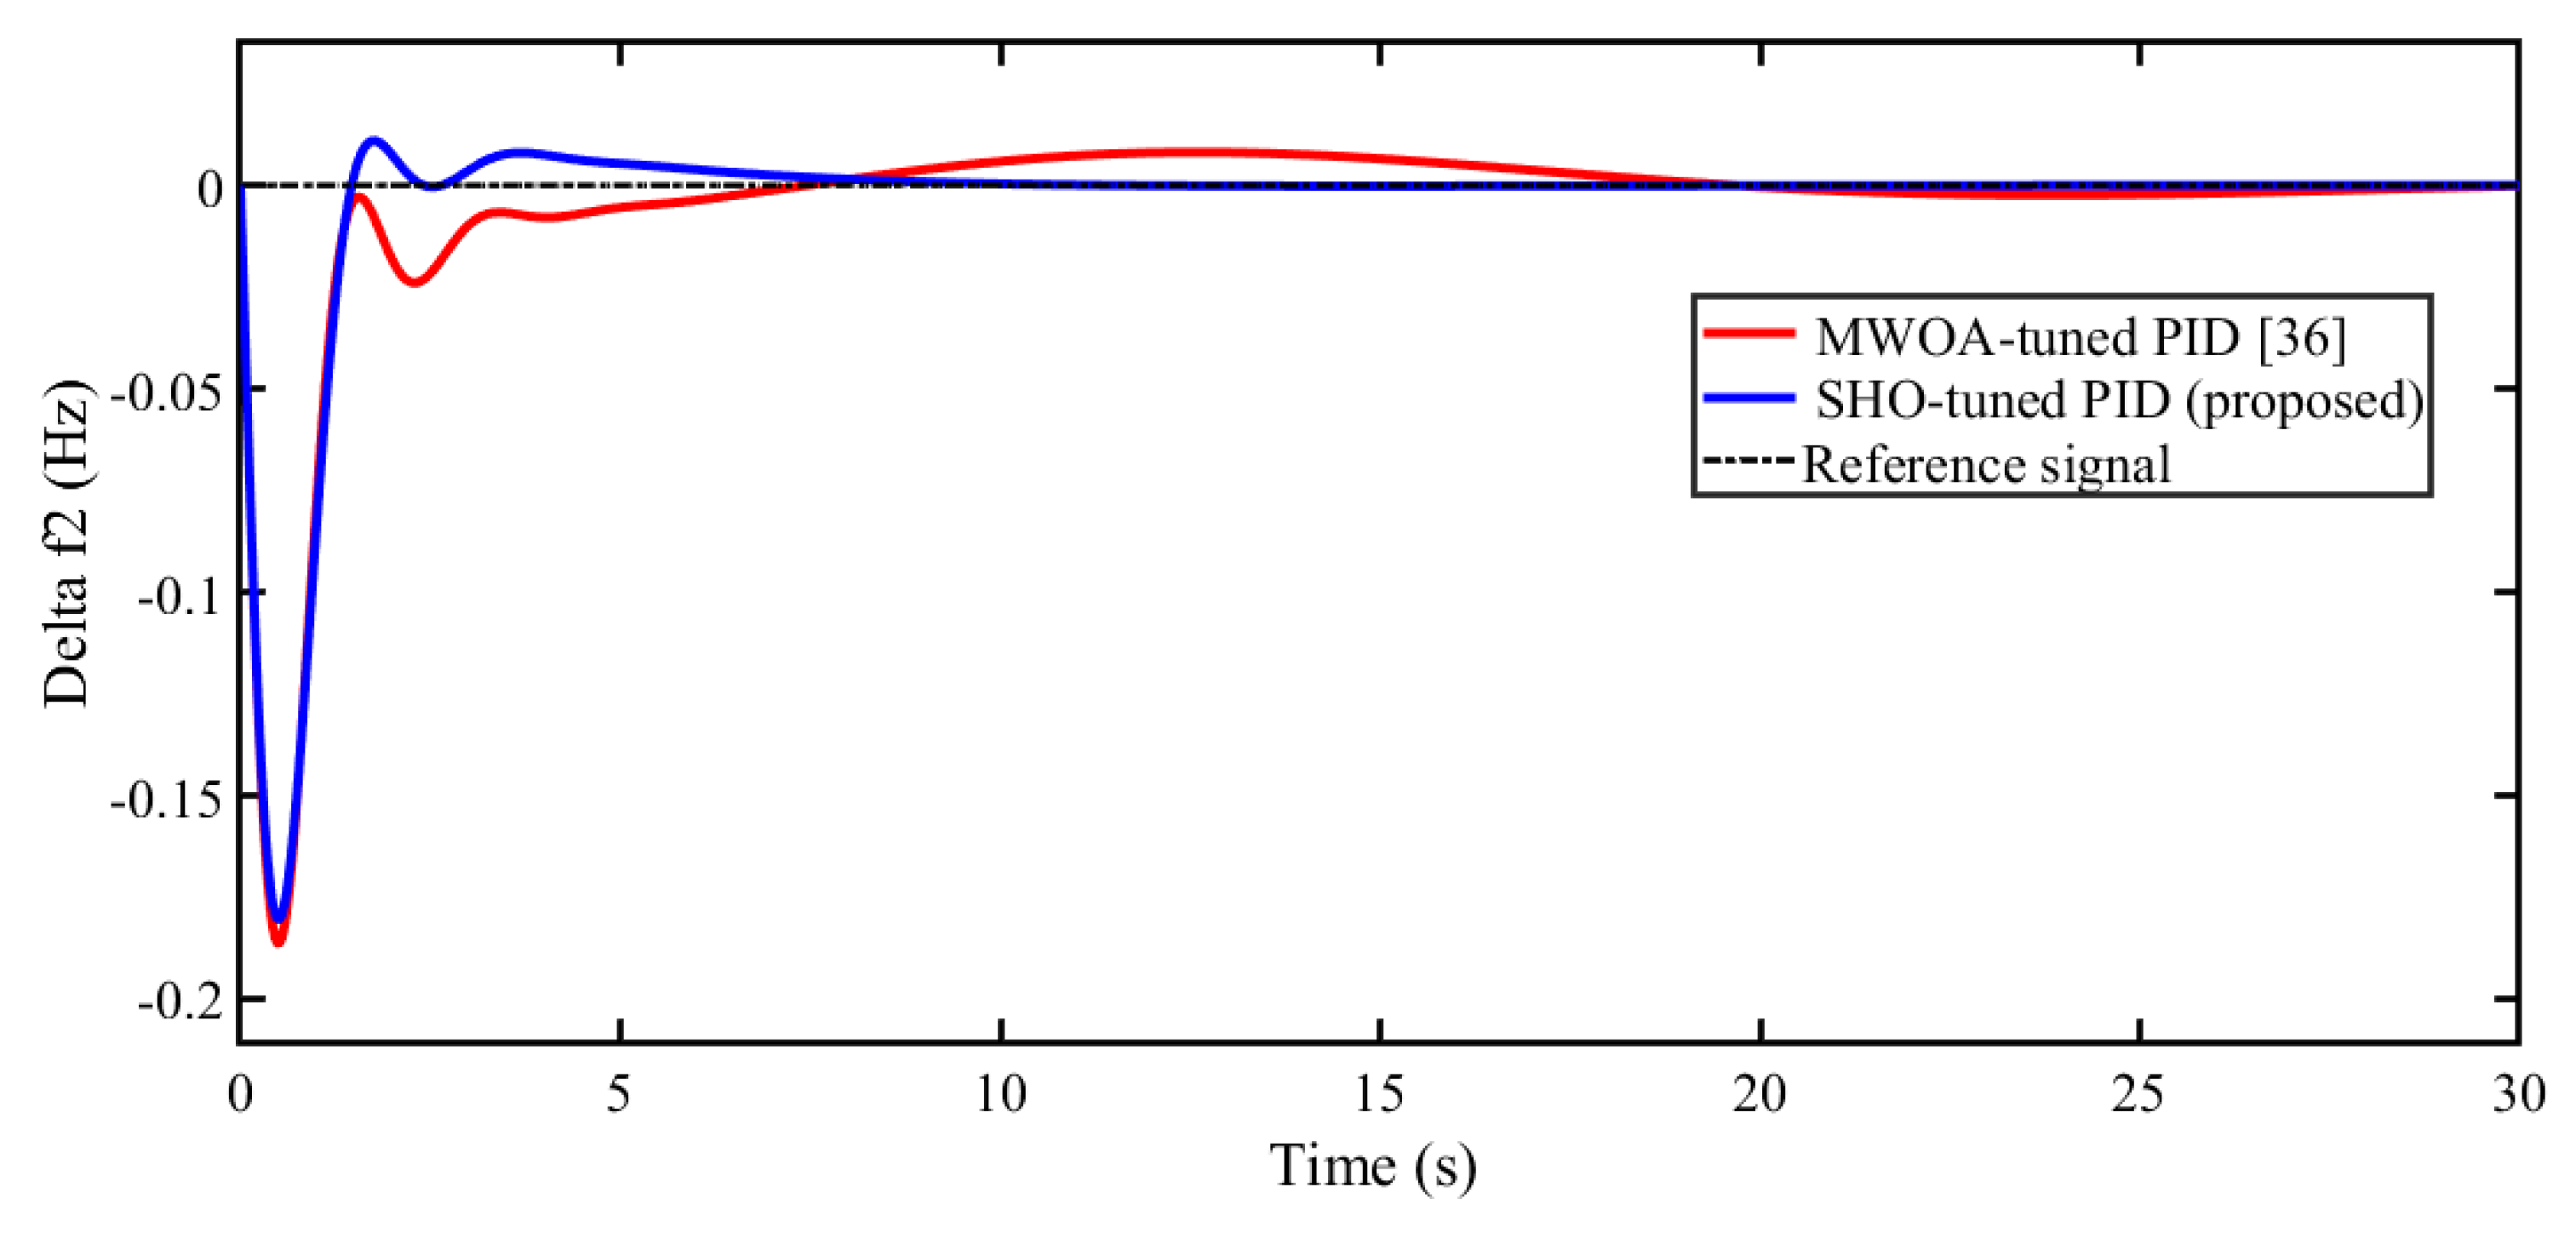
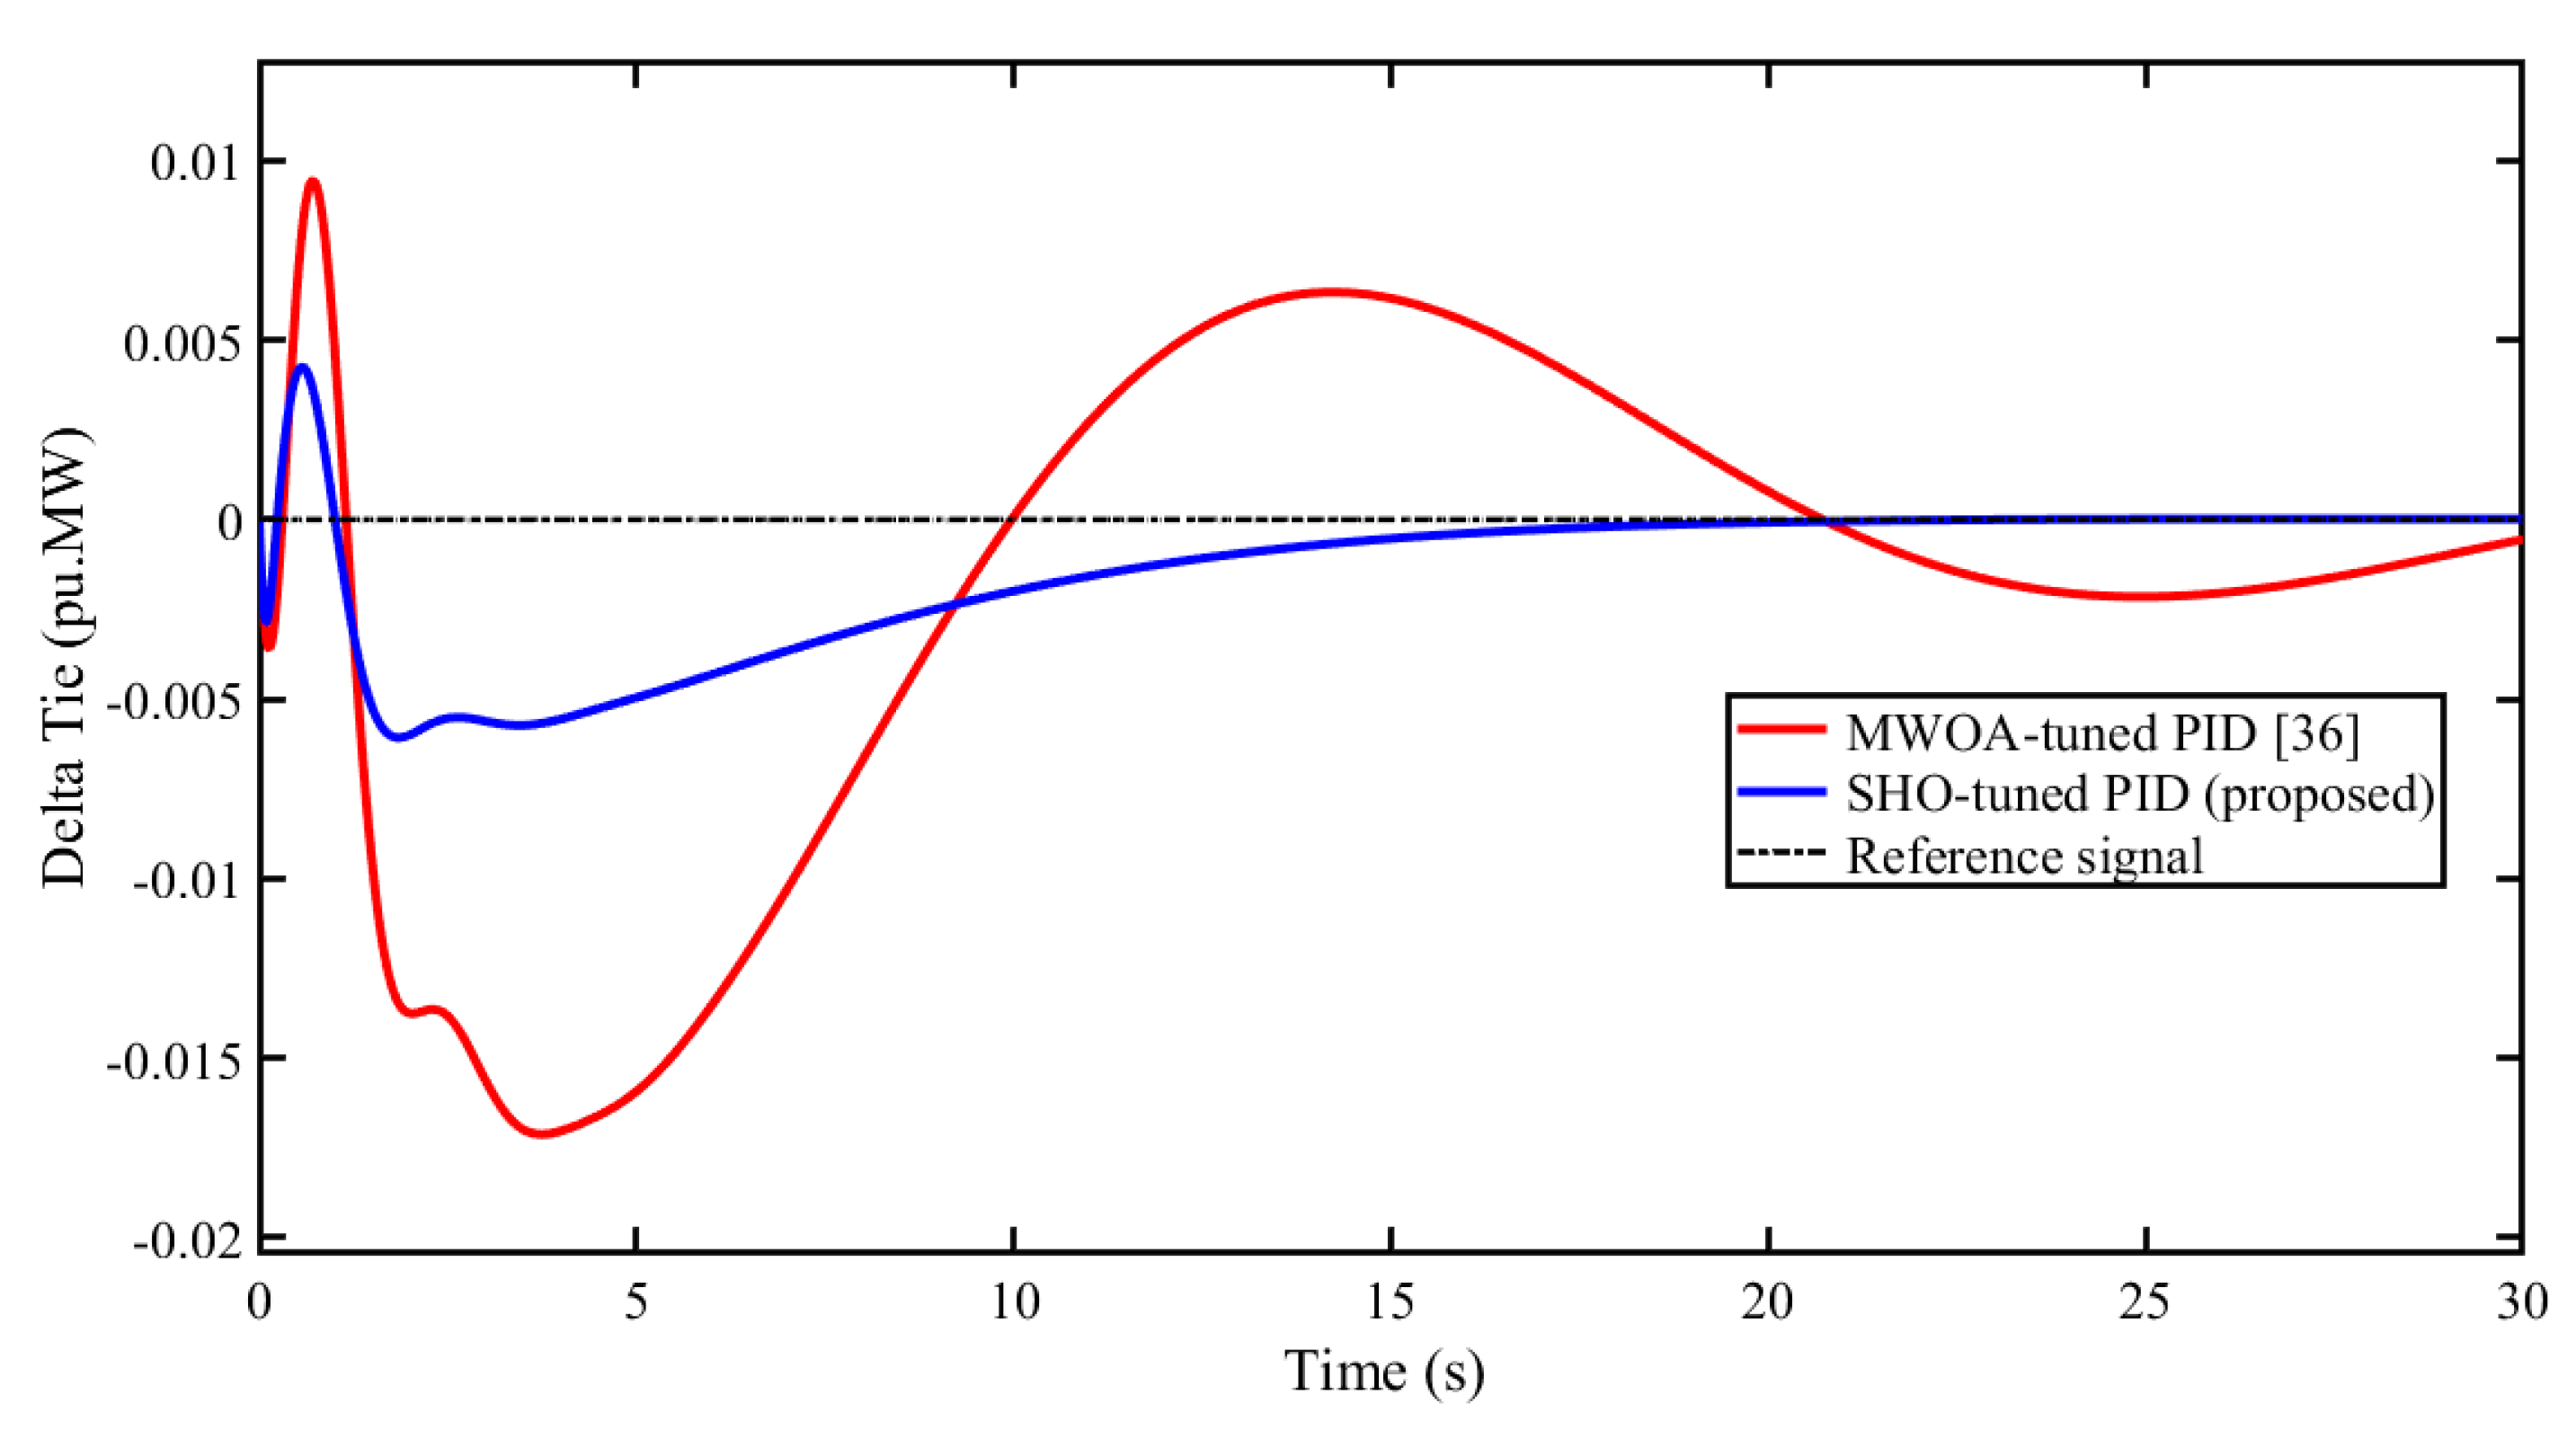
5.1. Scenario 1: Performance Comparison of Proposed SHO Optimized Controller with Other Reported Algorithms
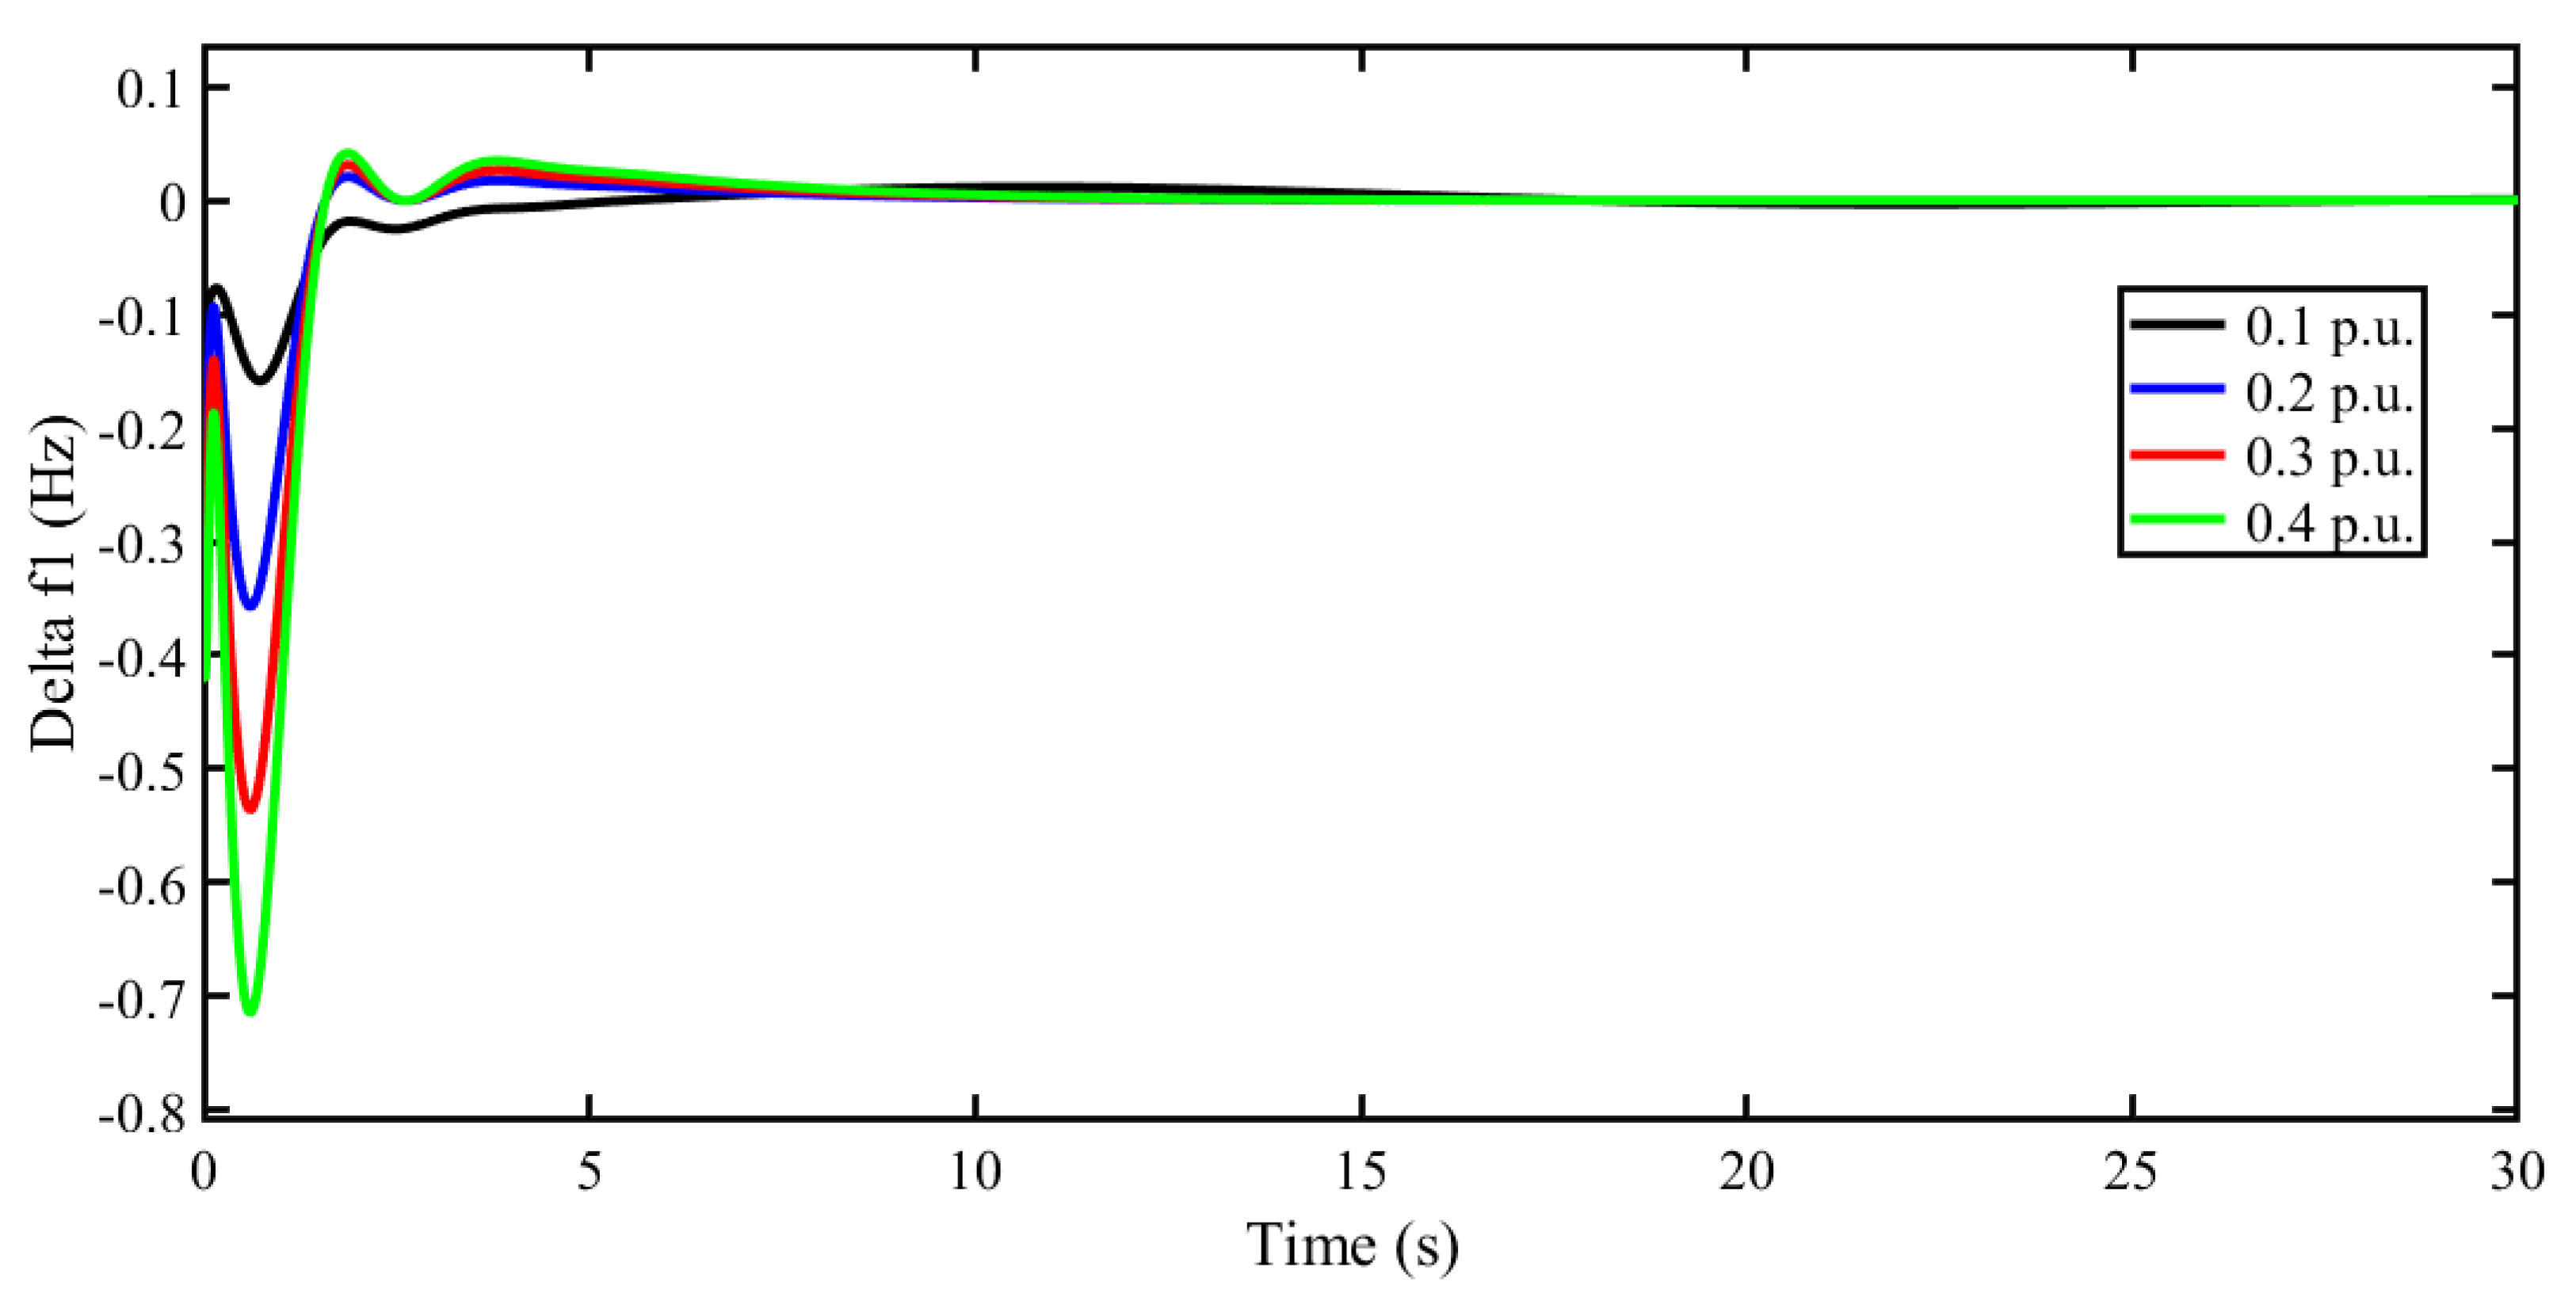
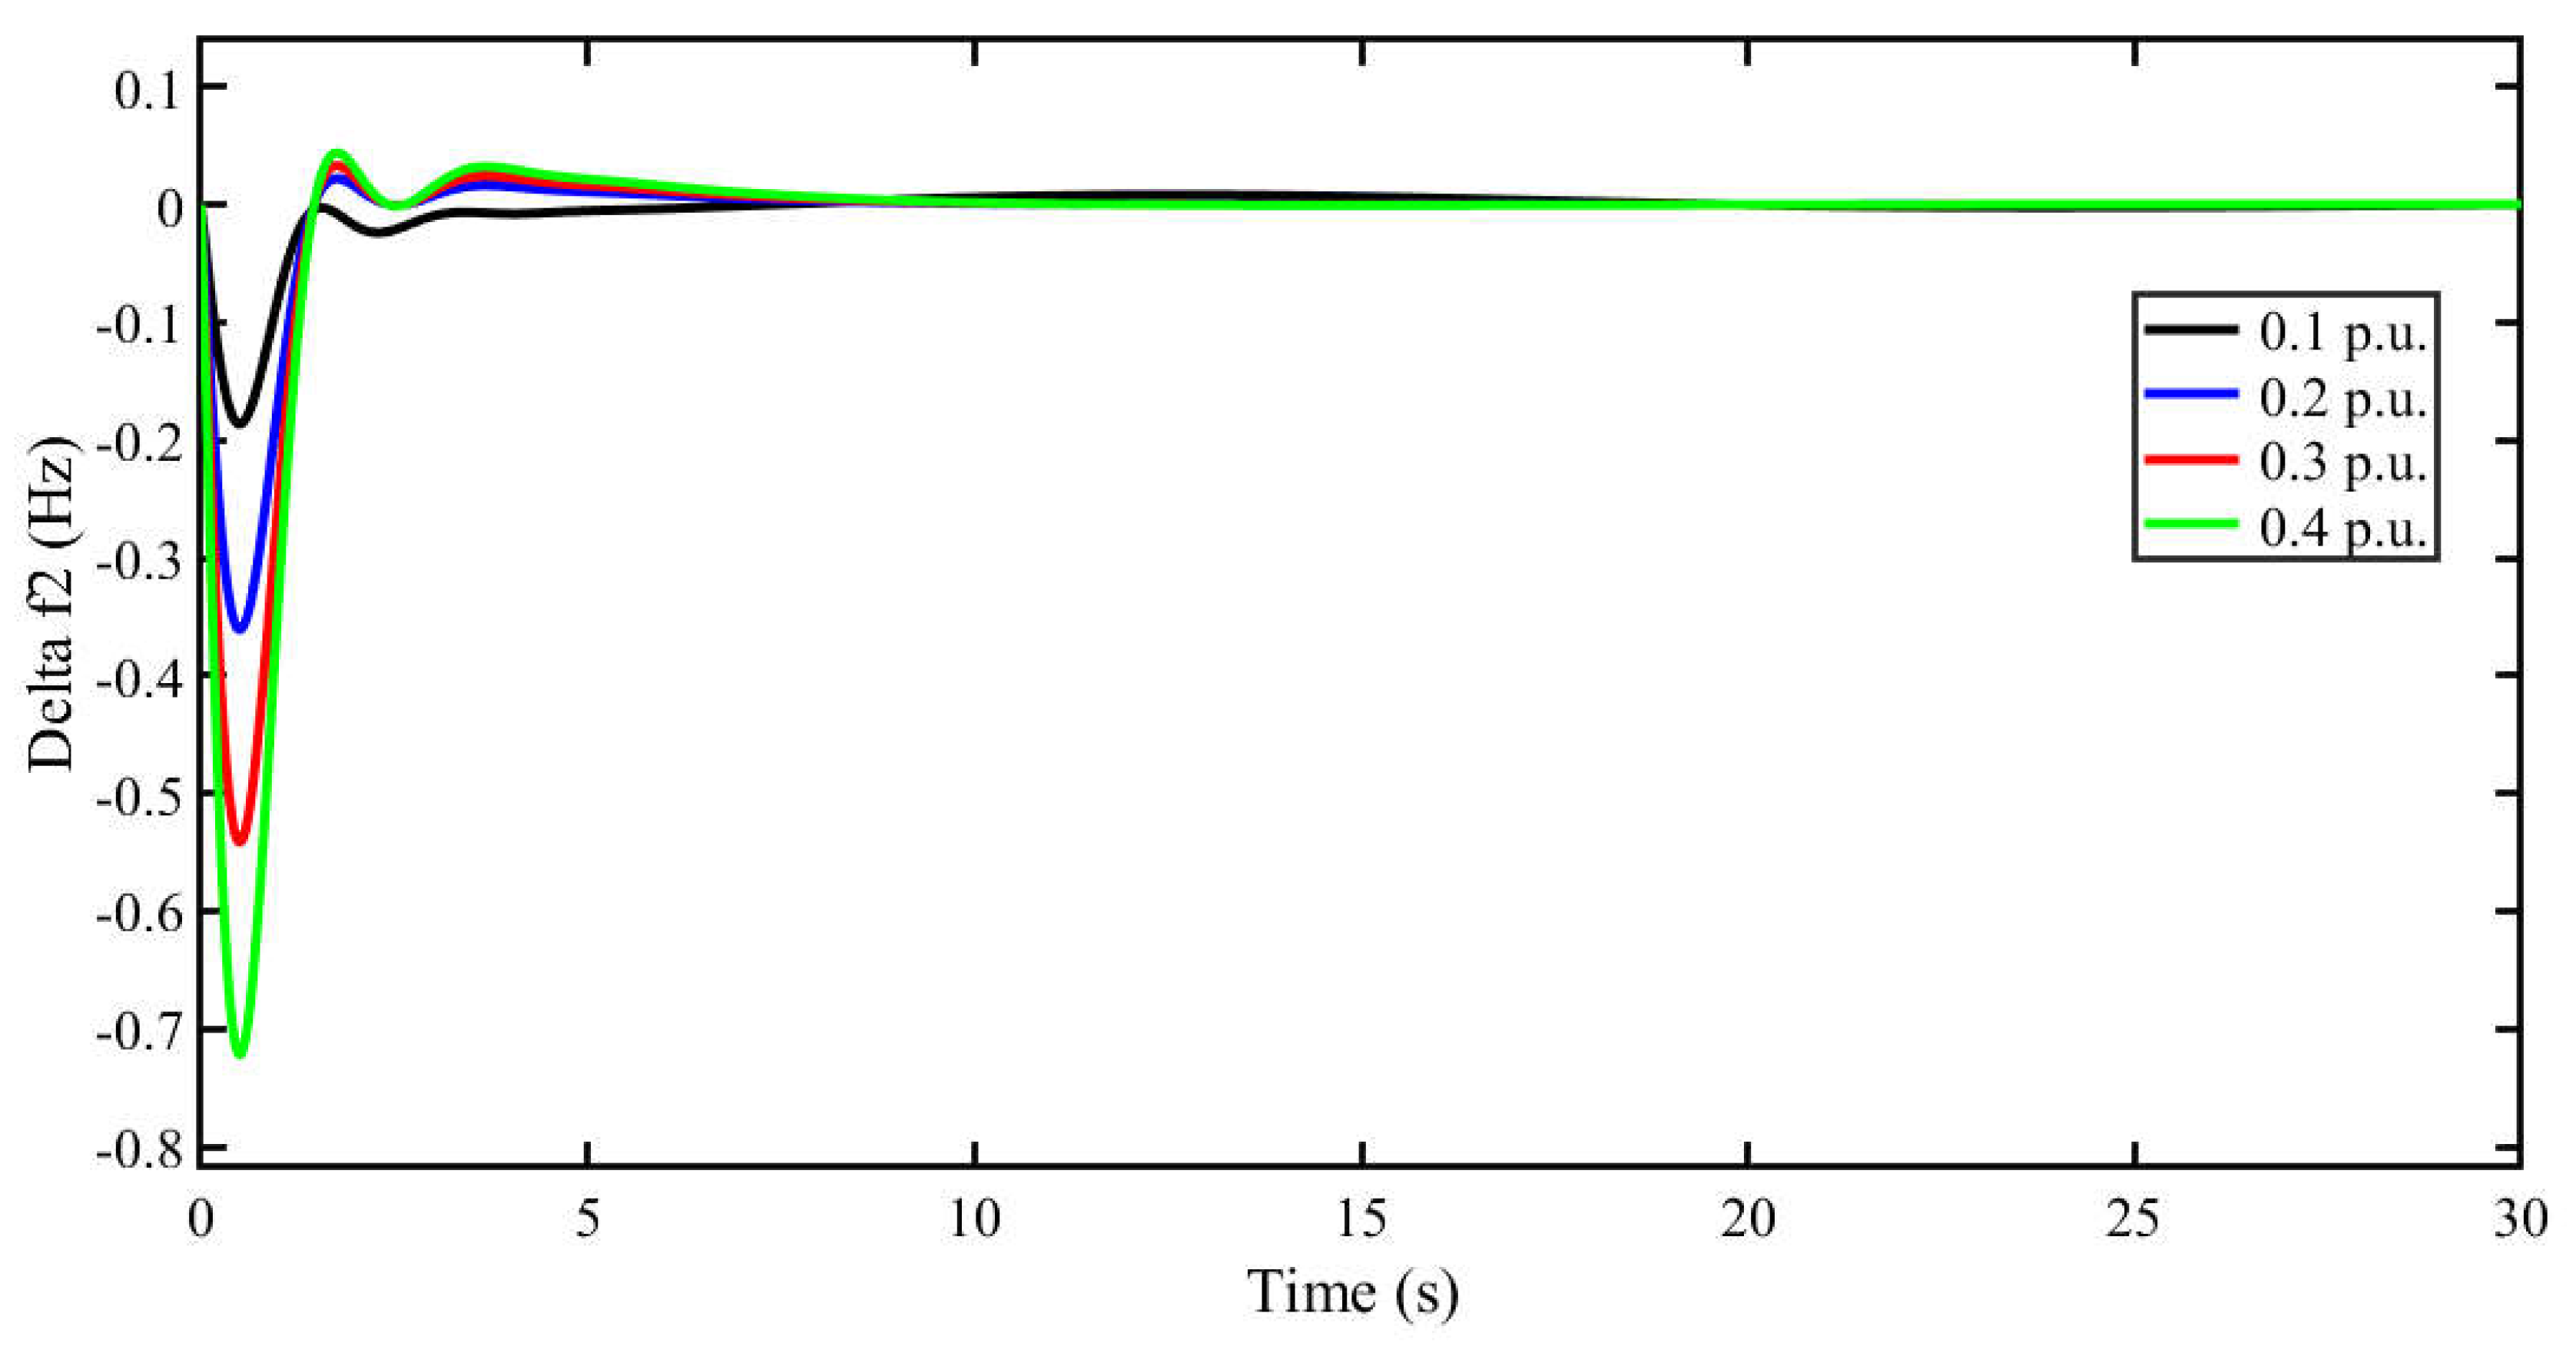
5.2. Scenario 2: Effect of High Load Demand on System Stability
5.3. Scenario 3: Influence of Solar Radiation Variation
5.4. Performance Indices and Robustness
6. Conclusions
Author Contributions
Funding
Data Availability Statement
Conflicts of Interest
References
- Yang, S.; Huang, C.; Yu, Y.; Yue, D.; Xie, J. Load frequency control of interconnected power system via multi-agent system method. Electric Power Components and Systems 2017, 45, 839–851. [Google Scholar] [CrossRef]
- Tan, W.; Xu, Z. Robust analysis and design of load frequency controller for power systems. Electric Power Systems Research 2009, 79, 846–853. [Google Scholar] [CrossRef]
- Kumar, V.; Sharma, V.; Naresh, R. Leader harris hawks algorithm based optimal controller for automatic generation control in PV-hydro-wind integrated power network. Electric Power Systems Research 2023, 214, 108924. [Google Scholar] [CrossRef]
- Alhelou, H.H.; Hamedani-Golshan, M.E.; Zamani, R.; Heydarian-Forushani, E.; Siano, P. Challenges and opportunities of load frequency control in conventional, modern and future smart power systems: a comprehensive review. Energies 2018, 11, 2497. [Google Scholar] [CrossRef]
- Mokhtar, M.; Marei, M.I.; Sameh, M.A.; Attia, M.A. An adaptive load frequency control for power systems with renewable energy sources. Energies 2022, 15, 573. [Google Scholar] [CrossRef]
- Singh, A.; Sharma, V. Salp swarm algorithm-based model predictive controller for frequency regulation of solar integrated power system. Neural Computing and Applications 2019, 31, 8859–8870. [Google Scholar] [CrossRef]
- Celik, E.; Ozturk, N.; Houssein, E.H. Improved load frequency control of interconnected power systems using energy storage devices and a new cost function. Neural Computing and Applications 2023, 35, 681–697. [Google Scholar] [CrossRef]
- Ibrahim, M.H.; Peng, A.S.; Dani, M.N.; Khalil, A.; Law, K.H.; Yunus, S.; Rahman, M.I.; Au, T.W. A novel computation of delay margin based on grey wolf optimisation for a load frequency control of two-area-network power systems. Energies 2023, 16, 2860. [Google Scholar] [CrossRef]
- Ali, T.; Malik, S.A.; Daraz, A.; Aslam, S.; Alkhalifah, T. Dandelion optimizer-based combined automatic voltage regulation and load frequency control in a multi-area, multi-source interconnected power system with nonlinearities. Energies 2022, 15, 8499. [Google Scholar] [CrossRef]
- Farooq, Z.; Rahman, A.; Lone, S.A. Load frequency control of multi-source electrical power system integrated with solar-thermal and electric vehicle. International Transactions on Electrical Energy Systems 2021, 31, 12918. [Google Scholar] [CrossRef]
- Chandrakala, K.V.; Balamurugan, S. Simulated annealing based optimal frequency and terminal voltage control of multi source multi area system. International Journal of Electrical Power and Energy Systems 2016, 78, 823–829. [Google Scholar] [CrossRef]
- Mbuli, N.; Ngaha, W.S. A survey of big bang big crunch optimization in power systems. Renewable and Sustainable Energy Reviews 2022, 155, 111848. [Google Scholar] [CrossRef]
- Sahu, R.K.; Panda, S.; Padhan, S. A novel hybrid gravitational search and pattern search algorithm for load frequency control of nonlinear power system. Applied Soft Computing 2015, 29, 310–327. [Google Scholar] [CrossRef]
- Gozde, H.; Taplamacioglu, M.C.; Kocaarslan, I. Comparative performance analysis of artificial bee colony algorithm in automatic generation control for interconnected reheat thermal power system. International Journal of Electrical Power and Energy Systems 2012, 42, 167–178. [Google Scholar] [CrossRef]
- Nguyen, G.N.; Jagatheesan, K.; Ashour, A.S.; Anand, B.; Dey, N. Ant colony optimization based load frequency control of multi-area interconnected thermal power system with governor dead-band nonlinearity. Smart Trends in Systems, Security and Sustainability: Proceedings of WS4 2017 2018, 1, 157–167. [Google Scholar]
- Abdelaziz, A.Y.; Ali, E.S. Load frequency controller design via artificial cuckoo search algorithm. Electric Power Components and Systems 2016, 44, 90–98. [Google Scholar] [CrossRef]
- Ghoshal, S.H. Optimizations of PID gains by particle swarm optimizations in fuzzy based automatic generation control. Electric Power Systems Research 2004, 72, 203–212. [Google Scholar] [CrossRef]
- Abo-Elyousr, F.K.; Abdelaziz, A.Y. A novel modified robust load frequency control for mass-less inertia photovoltaics penetrations via hybrid PSO-Woa approach. Electric Power Components and Systems 2019, 47, 1744–1758. [Google Scholar] [CrossRef]
- Golpira, H.; Bevrani, H. A framework for economic load frequency control design using modified multi-objective genetic algorithm. Electric Power Components and Systems 2014, 42, 788–797. [Google Scholar] [CrossRef]
- Mohanty, B.; Panda, S.; Hota, P.K. Controller parameters tuning of differential evolution algorithm and its application to load frequency control of multi-source power system. International Journal of Electrical Power and Energy Systems 2014, 54, 77–85. [Google Scholar] [CrossRef]
- Padhan, S.; Sahu, R.K.; Panda, S. Application of firefly algorithm for load frequency control of multi-area interconnected power system. Electric Power Components and Systems 2014, 42, 1419–1430. [Google Scholar] [CrossRef]
- Jagatheesan, K.; Anand, B.; Samanta, S.; Dey, N; Santhi, V.; Ashour, A.S.; Balas, V.E. Application of flower pollination algorithm in load frequency control of multi-area interconnected power system with nonlinearity. Neural Computing and Applications 2017, 28, 475–488. [Google Scholar] [CrossRef]
- Guha, D.; Roy, P.K.; Banerjee, S. Whale optimization algorithm applied to load frequency control of a mixed power system considering nonlinearities and PLL dynamics. Energy Systems 2020, 11, 699–728. [Google Scholar] [CrossRef]
- Kalyan, C.N.S.; Goud, B.S.; Reddy, C.R.; Ramadan, H.S.; Bajaj, M.; Ali, Z.M. Water cycle algorithm optimized type II fuzzy controller for load frequency control of a multi-area, multi-fuel system with communication time delays. Energies 2021, 14, 5387. [Google Scholar] [CrossRef]
- Jumani, T.A.; Mustafa, M.W.; Md Rasid, M.; Mirjat, N.H.; Leghari, Z.H.; Saeed, M.S. Optimal voltage and frequency control of an islanded microgrid using grasshopper optimization algorithm. Energies 2018, 11, 3191. [Google Scholar] [CrossRef]
- Ibrahim, M.H.; Peng, A.S.; Dani, M.N.; Khalil, A.; Law, K.H.; Yunus, S.; Rahman, M.I.; Au, T.W. A novel computation of delay margin based on grey wolf optimisation for a load frequency control of two-area-network power systems. Energies 2023, 16, 2860. [Google Scholar] [CrossRef]
- Can, O.; Ozturk, A.; Eroglu, H.; Kotb, H. A novel grey wolf optimizer based load frequency controller for renewable energy sources integrated thermal power systems. Electric Power Components and Systems 2022, 49, 1248–1259. [Google Scholar] [CrossRef]
- Chaturvedi, D.K.; Umrao, R.; Malik, O.P. Adaptive polar fuzzy logic based load frequency controller. International Journal of Electrical Power and Energy Systems 2015, 66, 154–159. [Google Scholar] [CrossRef]
- Cam, E. Application of fuzzy logic for load frequency control of hydroelectrical power plants. Energy Conversion and Management 2007, 48, 1281–1288. [Google Scholar] [CrossRef]
- Kocaarslan, I; Cam, E. Fuzzy logic controller in interconnected electrical power systems for load-frequency control. International Journal of Electrical Power and Energy Systems 2005, 27, 542–549. [Google Scholar] [CrossRef]
- Yousef, H.A.; Khalfan, A.K.; Albadi, M.H.; Hosseinzadeh, N. Load frequency control of a multi-area power system: An adaptive fuzzy logic approach. IEEE Transactions on Power Systems 2014, 29, 1822–1830. [Google Scholar] [CrossRef]
- Chaturvedi, D.K.; Satsangi, P.S.; Kalra, P.K. Load frequency control: a generalized neural network approach. International Journal of Electrical Power and Energy Systems 1999, 21, 405–415. [Google Scholar] [CrossRef]
- Al-Majidi, S.D.; Kh. AL-Nussairi, M.; Mohammed, A.J.; Dakhil, A.M.; Abbod, M.F.; Al-Raweshidy, H.S. Design of a load frequency controller based on an optimal neural network. Energies 2022, 15, 6223. [Google Scholar] [CrossRef]
- Zhao, S.; Zhang, T.; Ma, S.; Wang, M. Sea-horse optimizer: a novel nature-inspired meta-heuristic for global optimization problems. Applied Intelligence 2022, 1, 1–28. [Google Scholar] [CrossRef]
- Abd-elazim, S.M.; Ali, E.S. Load frequency controller design of a two-area system composing of PV grid and thermal generator via firefly algorithm. Neural Computing and Applications 2018, 30, 607–616. [Google Scholar] [CrossRef]
- Khadanga, R.K.; Kumar, A.; Panda, S. A novel modified whale optimization algorithm for load frequency controller design of a two-area power system composing of PV grid and thermal generator. Neural Computing and Applications 2020, 32, 8205–8216. [Google Scholar] [CrossRef]
- Tomy, F.T.; Prakash, R. Load frequency control of a two area hybrid system consisting of a grid connected PV system and thermal generator. International Journal of Research in Engineering and Technology 2014, 3, 573–580. [Google Scholar]
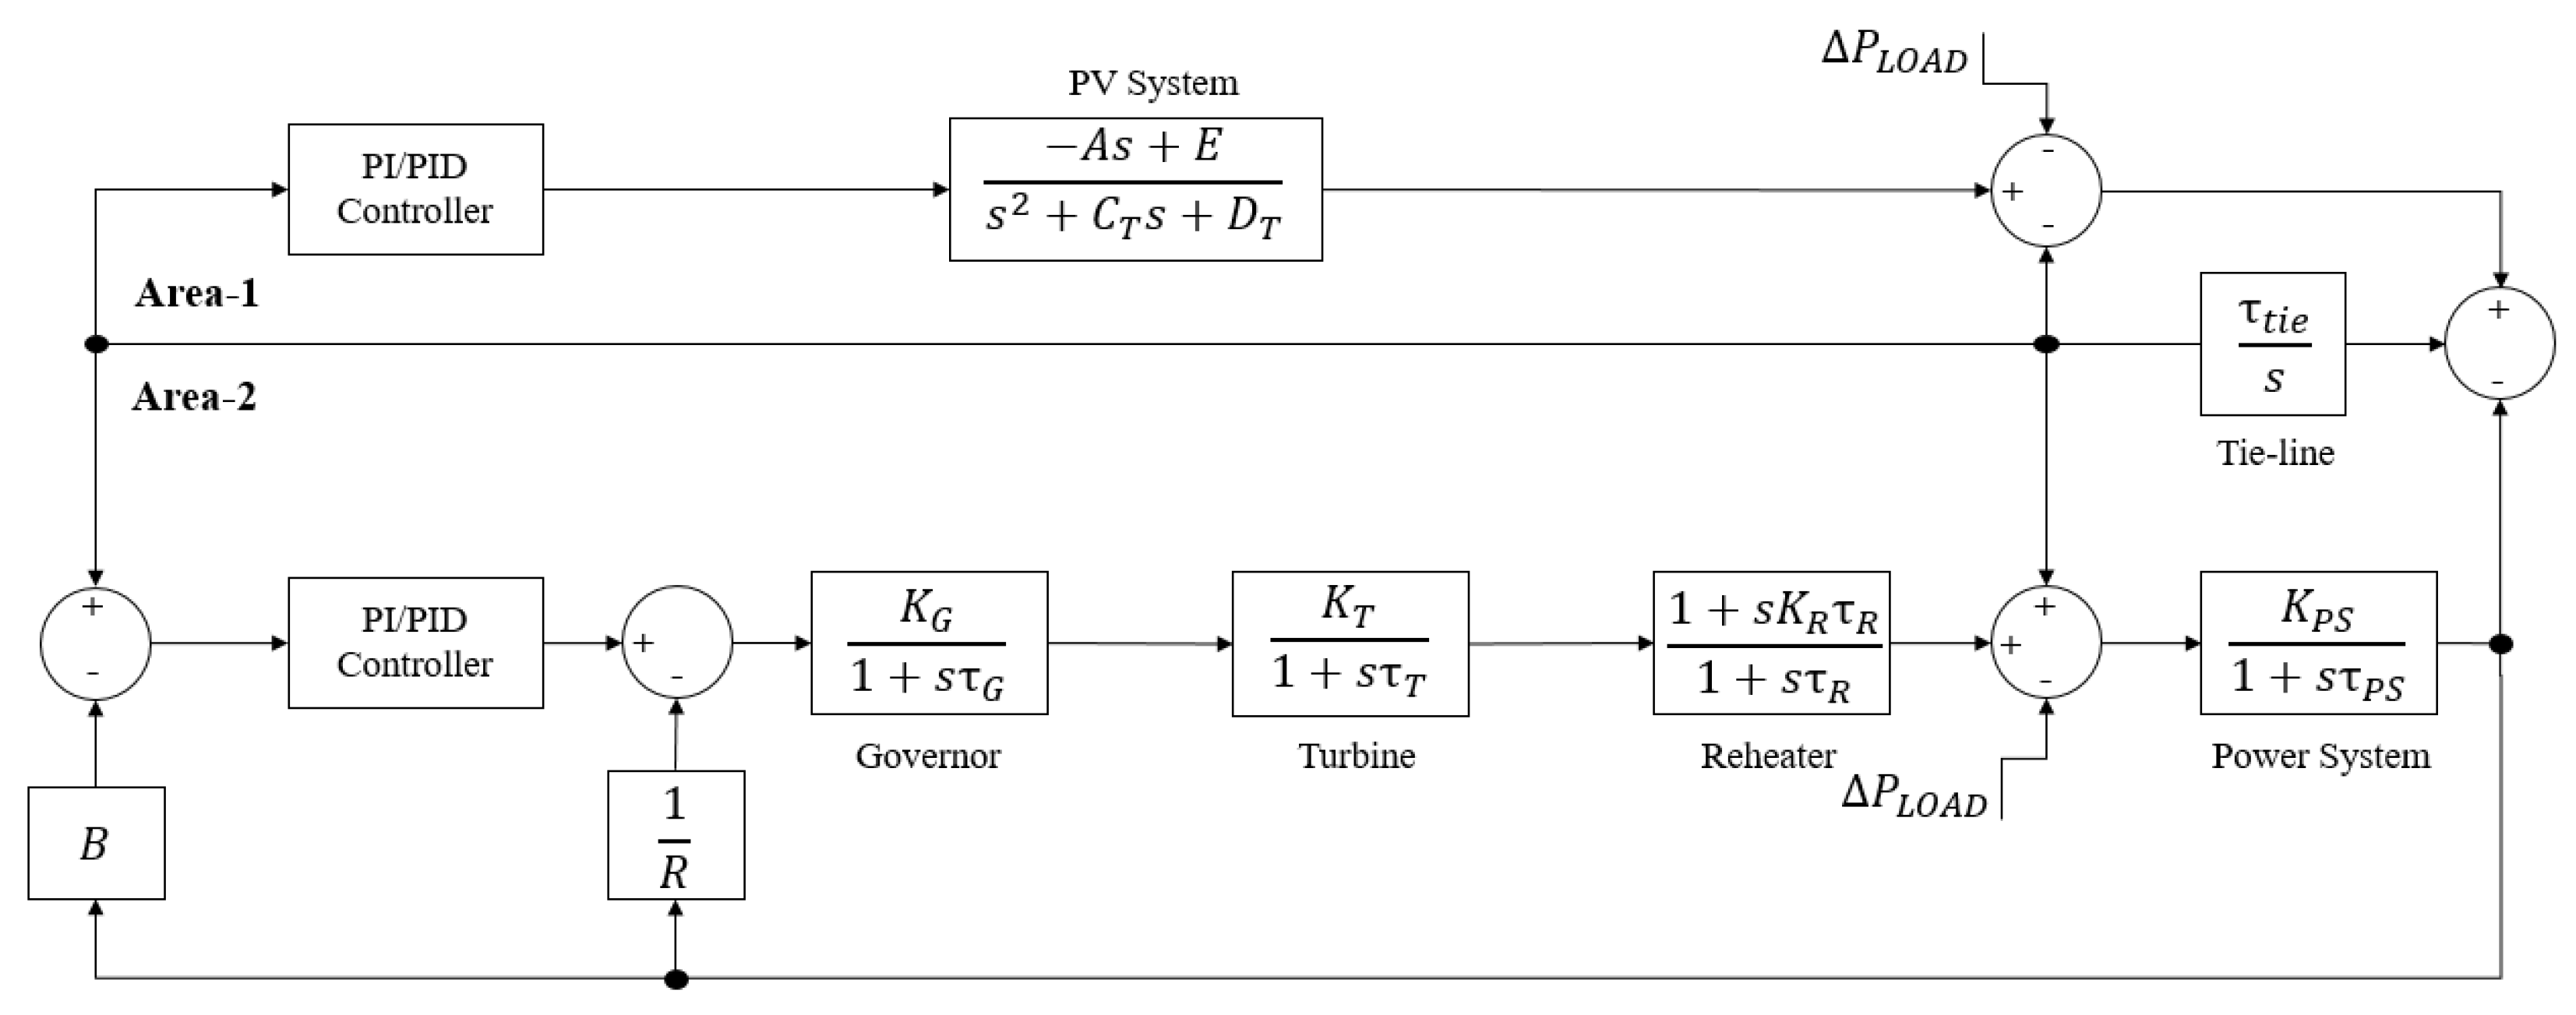
| PV system gain 1 | 18 | |
| PV system gain 2 | 900 | |
| PV system time constant 1 | 100 | |
| PV system time constant 2 | 50 | |
| Governor gain | 1 p.u. MW | |
| Governor time constant | 0.08 sec | |
| Turbine gain | 1 p.u. MW | |
| Turbine time constant | 0.3 sec | |
| Reheat gain | 0.33 p.u. MW | |
| Reheat time constant | 10 sec | |
| Power system gain of thermal area | 120 Hz/p.u. MW | |
| Power system time constant | 20 sec | |
| Regulation droop | 0.4 Hz/p.u. MW | |
| Frequency bias constant | 0.8 p.u. | |
| Tie-line power coefficient | 0.545 |
| Parameter | Value |
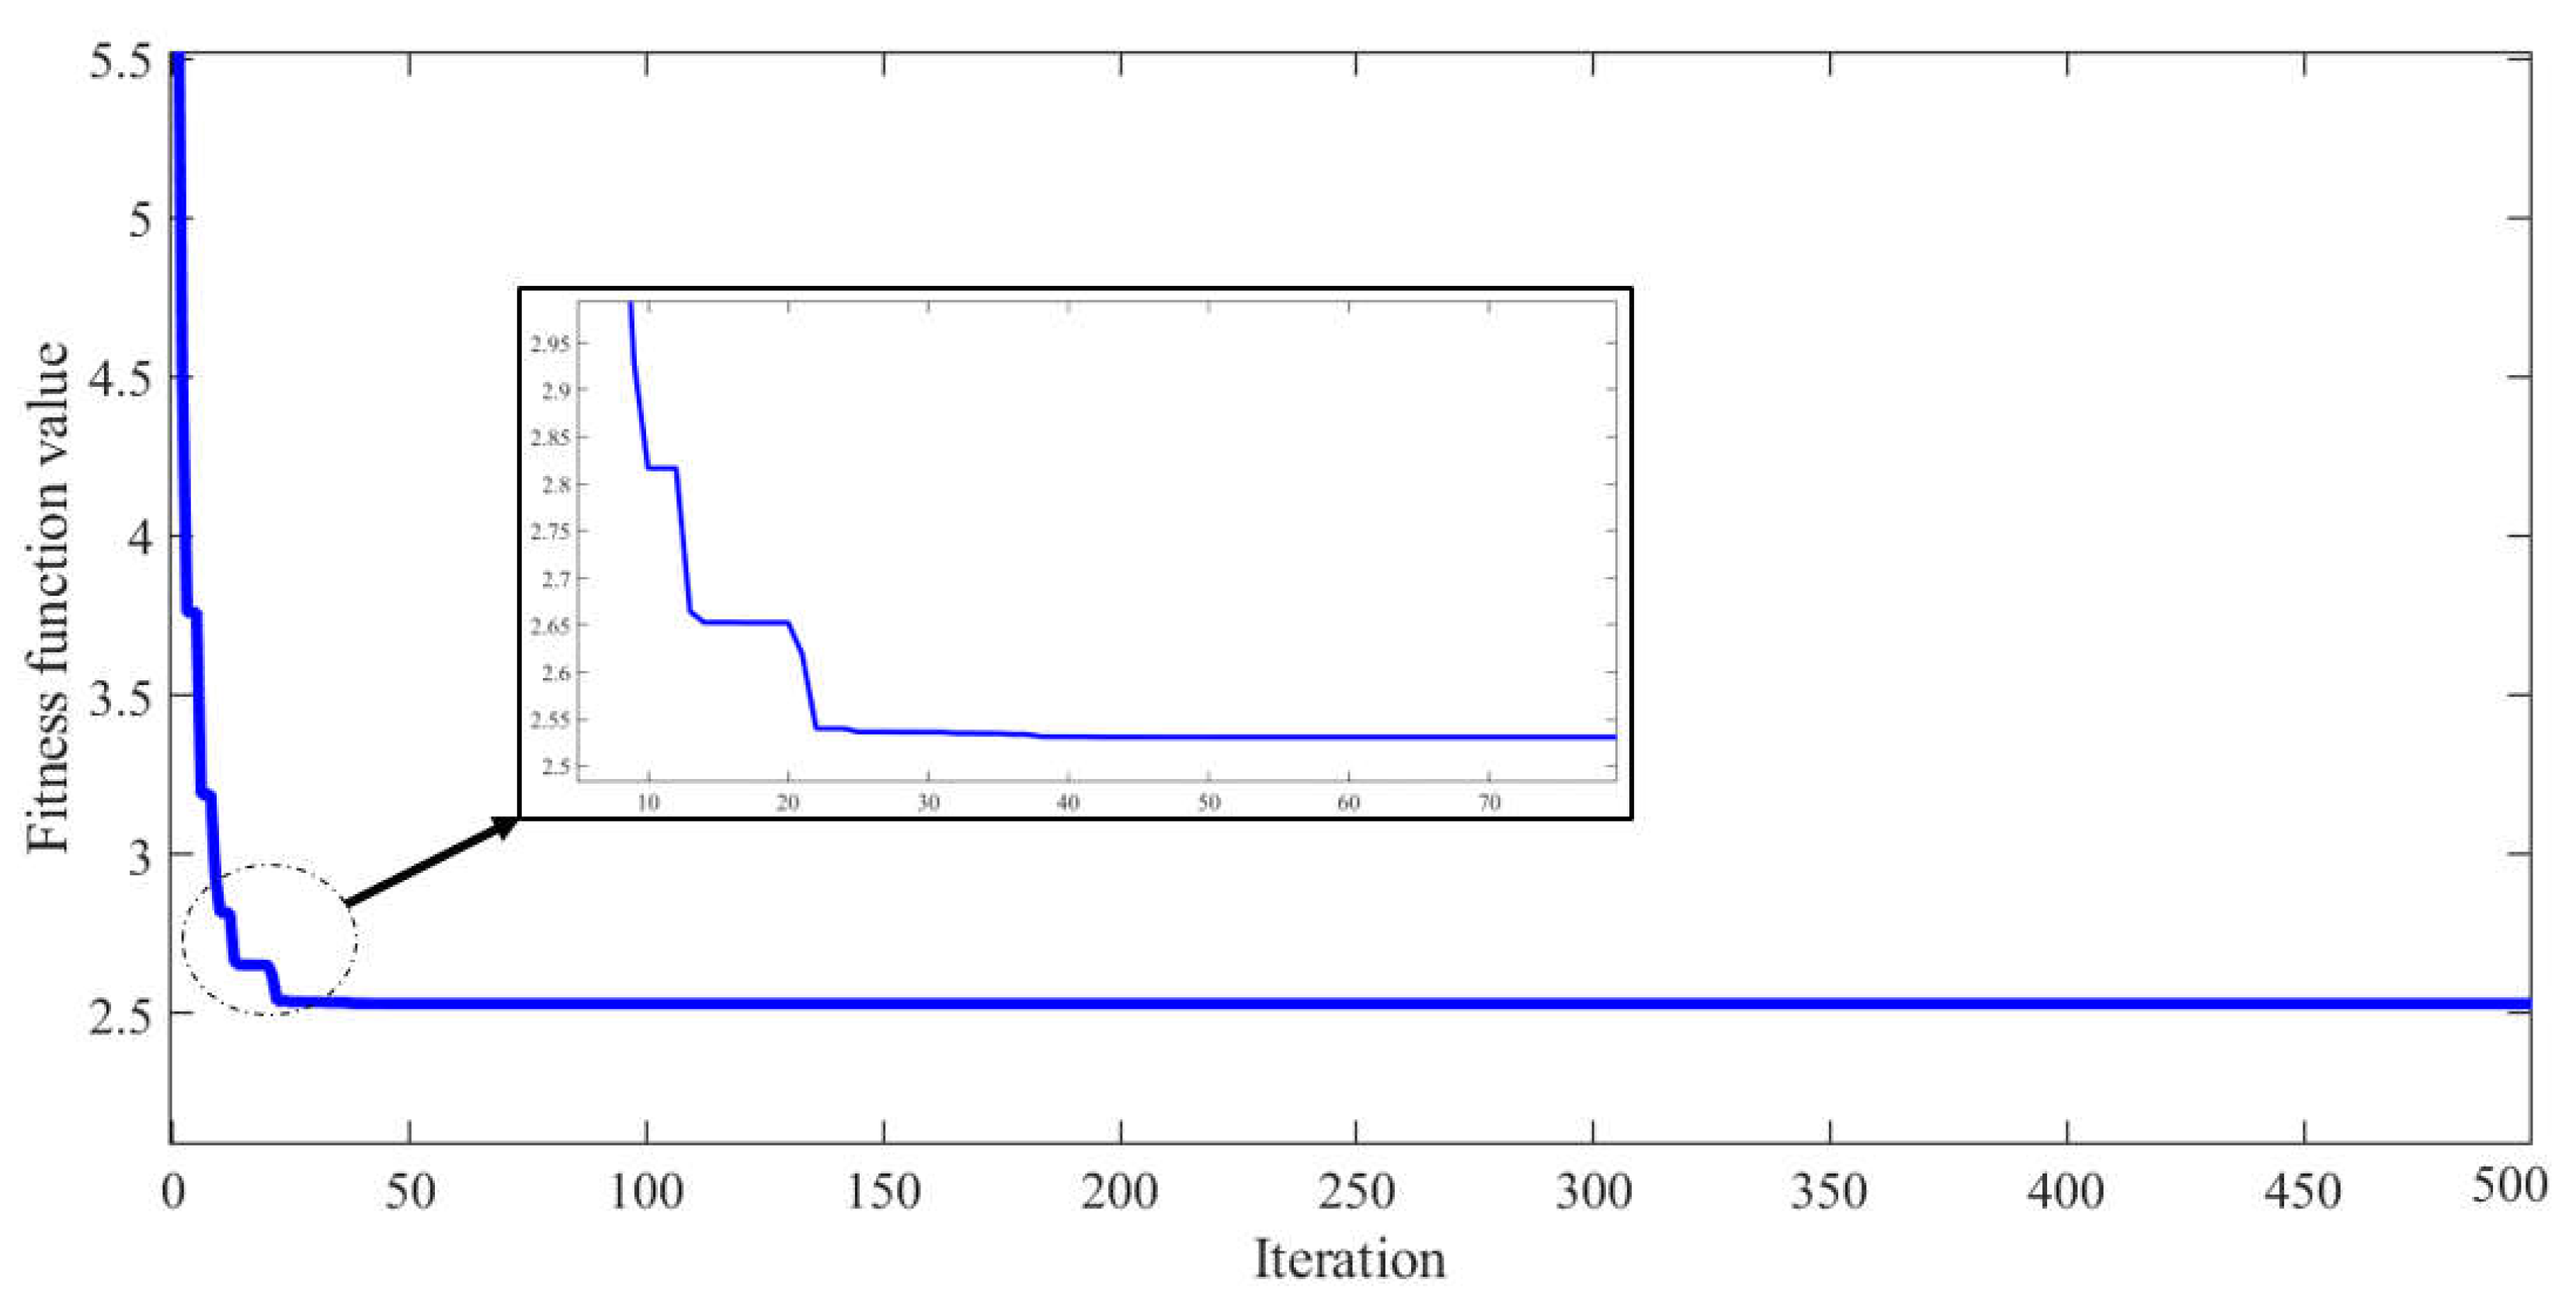
| Number of sea horse | 50 |
| Iteration number | 100 |
| 0.05 | |
| 0.05 | |
| 0.05 | |
| Lower bound for [; ; ] | [-2; -2; -2] |
| Upper bound for [; ; ] | [2; 2; 2] |
| Parameter | Methods | |||||
| SHO-tuned PID (proposed) | MWOA-tuned PID [36] | SHO-tuned PI (proposed) | WOA-tuned PI [36] | FA-tuned PI [35] | GA-tuned PI [35] | |
| -0.8599 | -0.1070 | -0.67012 | -0.4563 | -0.8811 | -0.5663 | |
| -0.1290 | -0.0906 | -0.5371 | -0.2254 | -0.5765 | -0.4024 | |
| -1.9396 | -0.6112 | - | - | - | - | |
| -2.0000 | -1.8938 | -2.0000 | -0.8967 | -0.7626 | -0.5127 | |
| -2.0000 | -1.8935 | -0.8476 | -0.9865 | -0.8307 | -0.7256 | |
| -0.2614 | -0.2505 | - | - | - | - | |
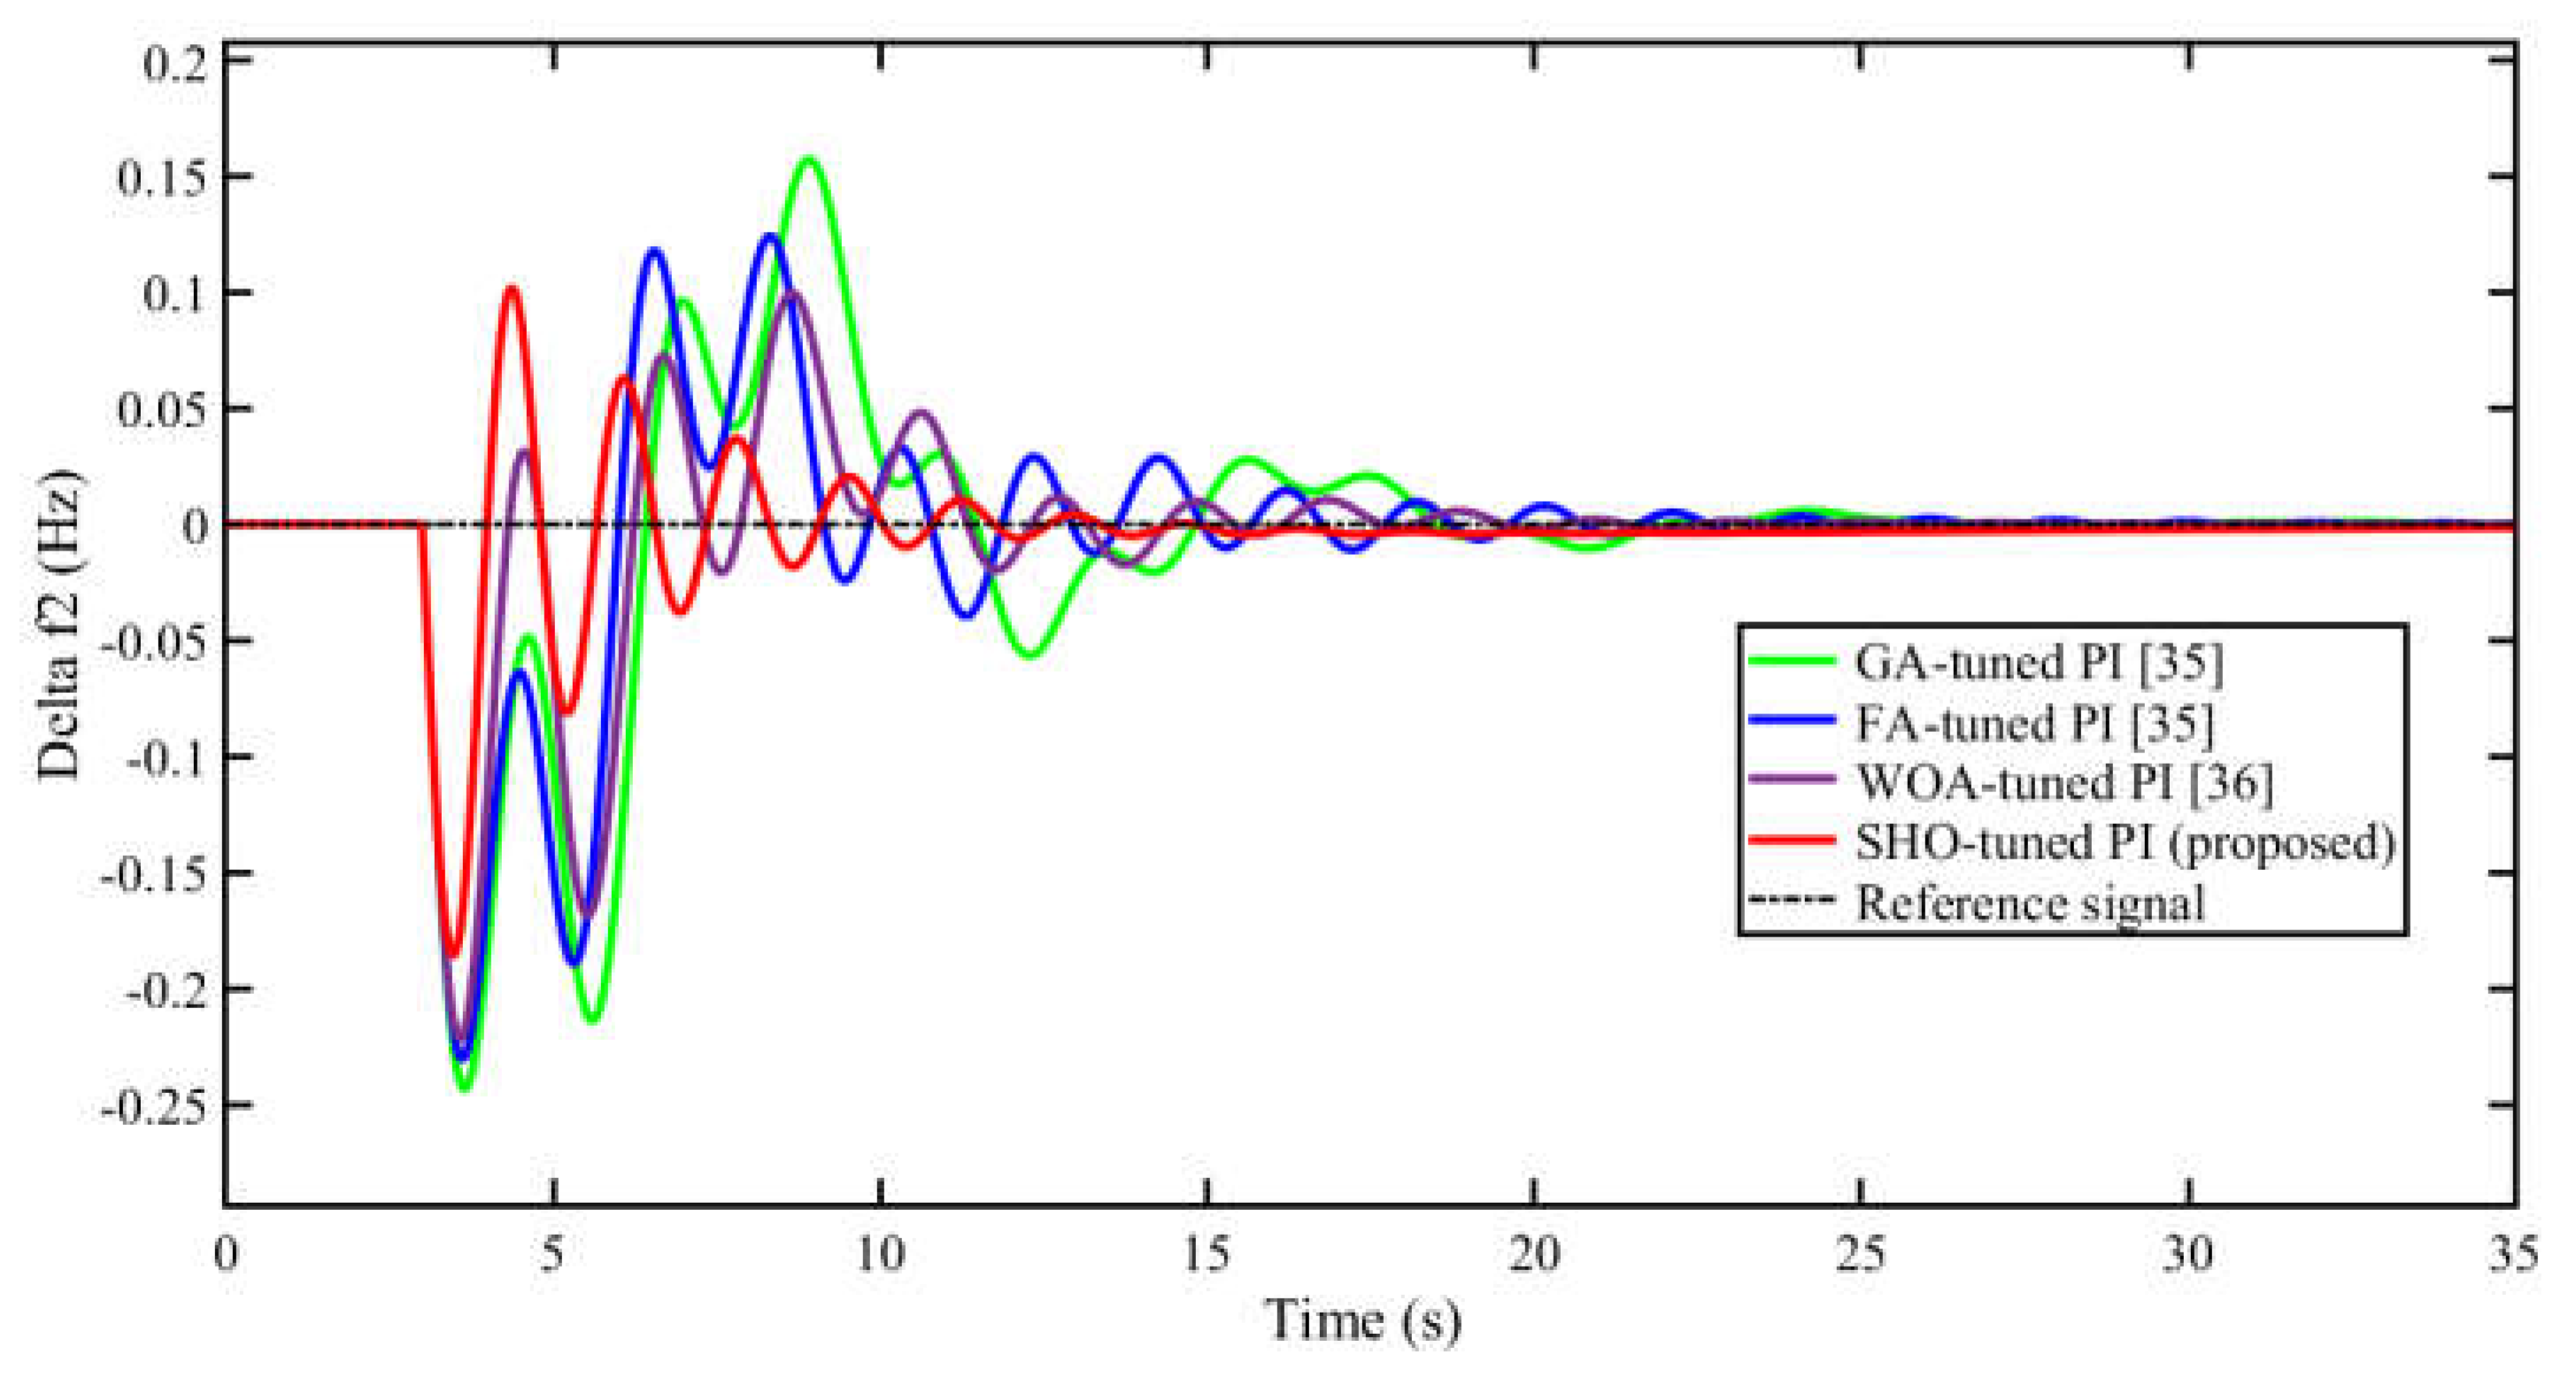
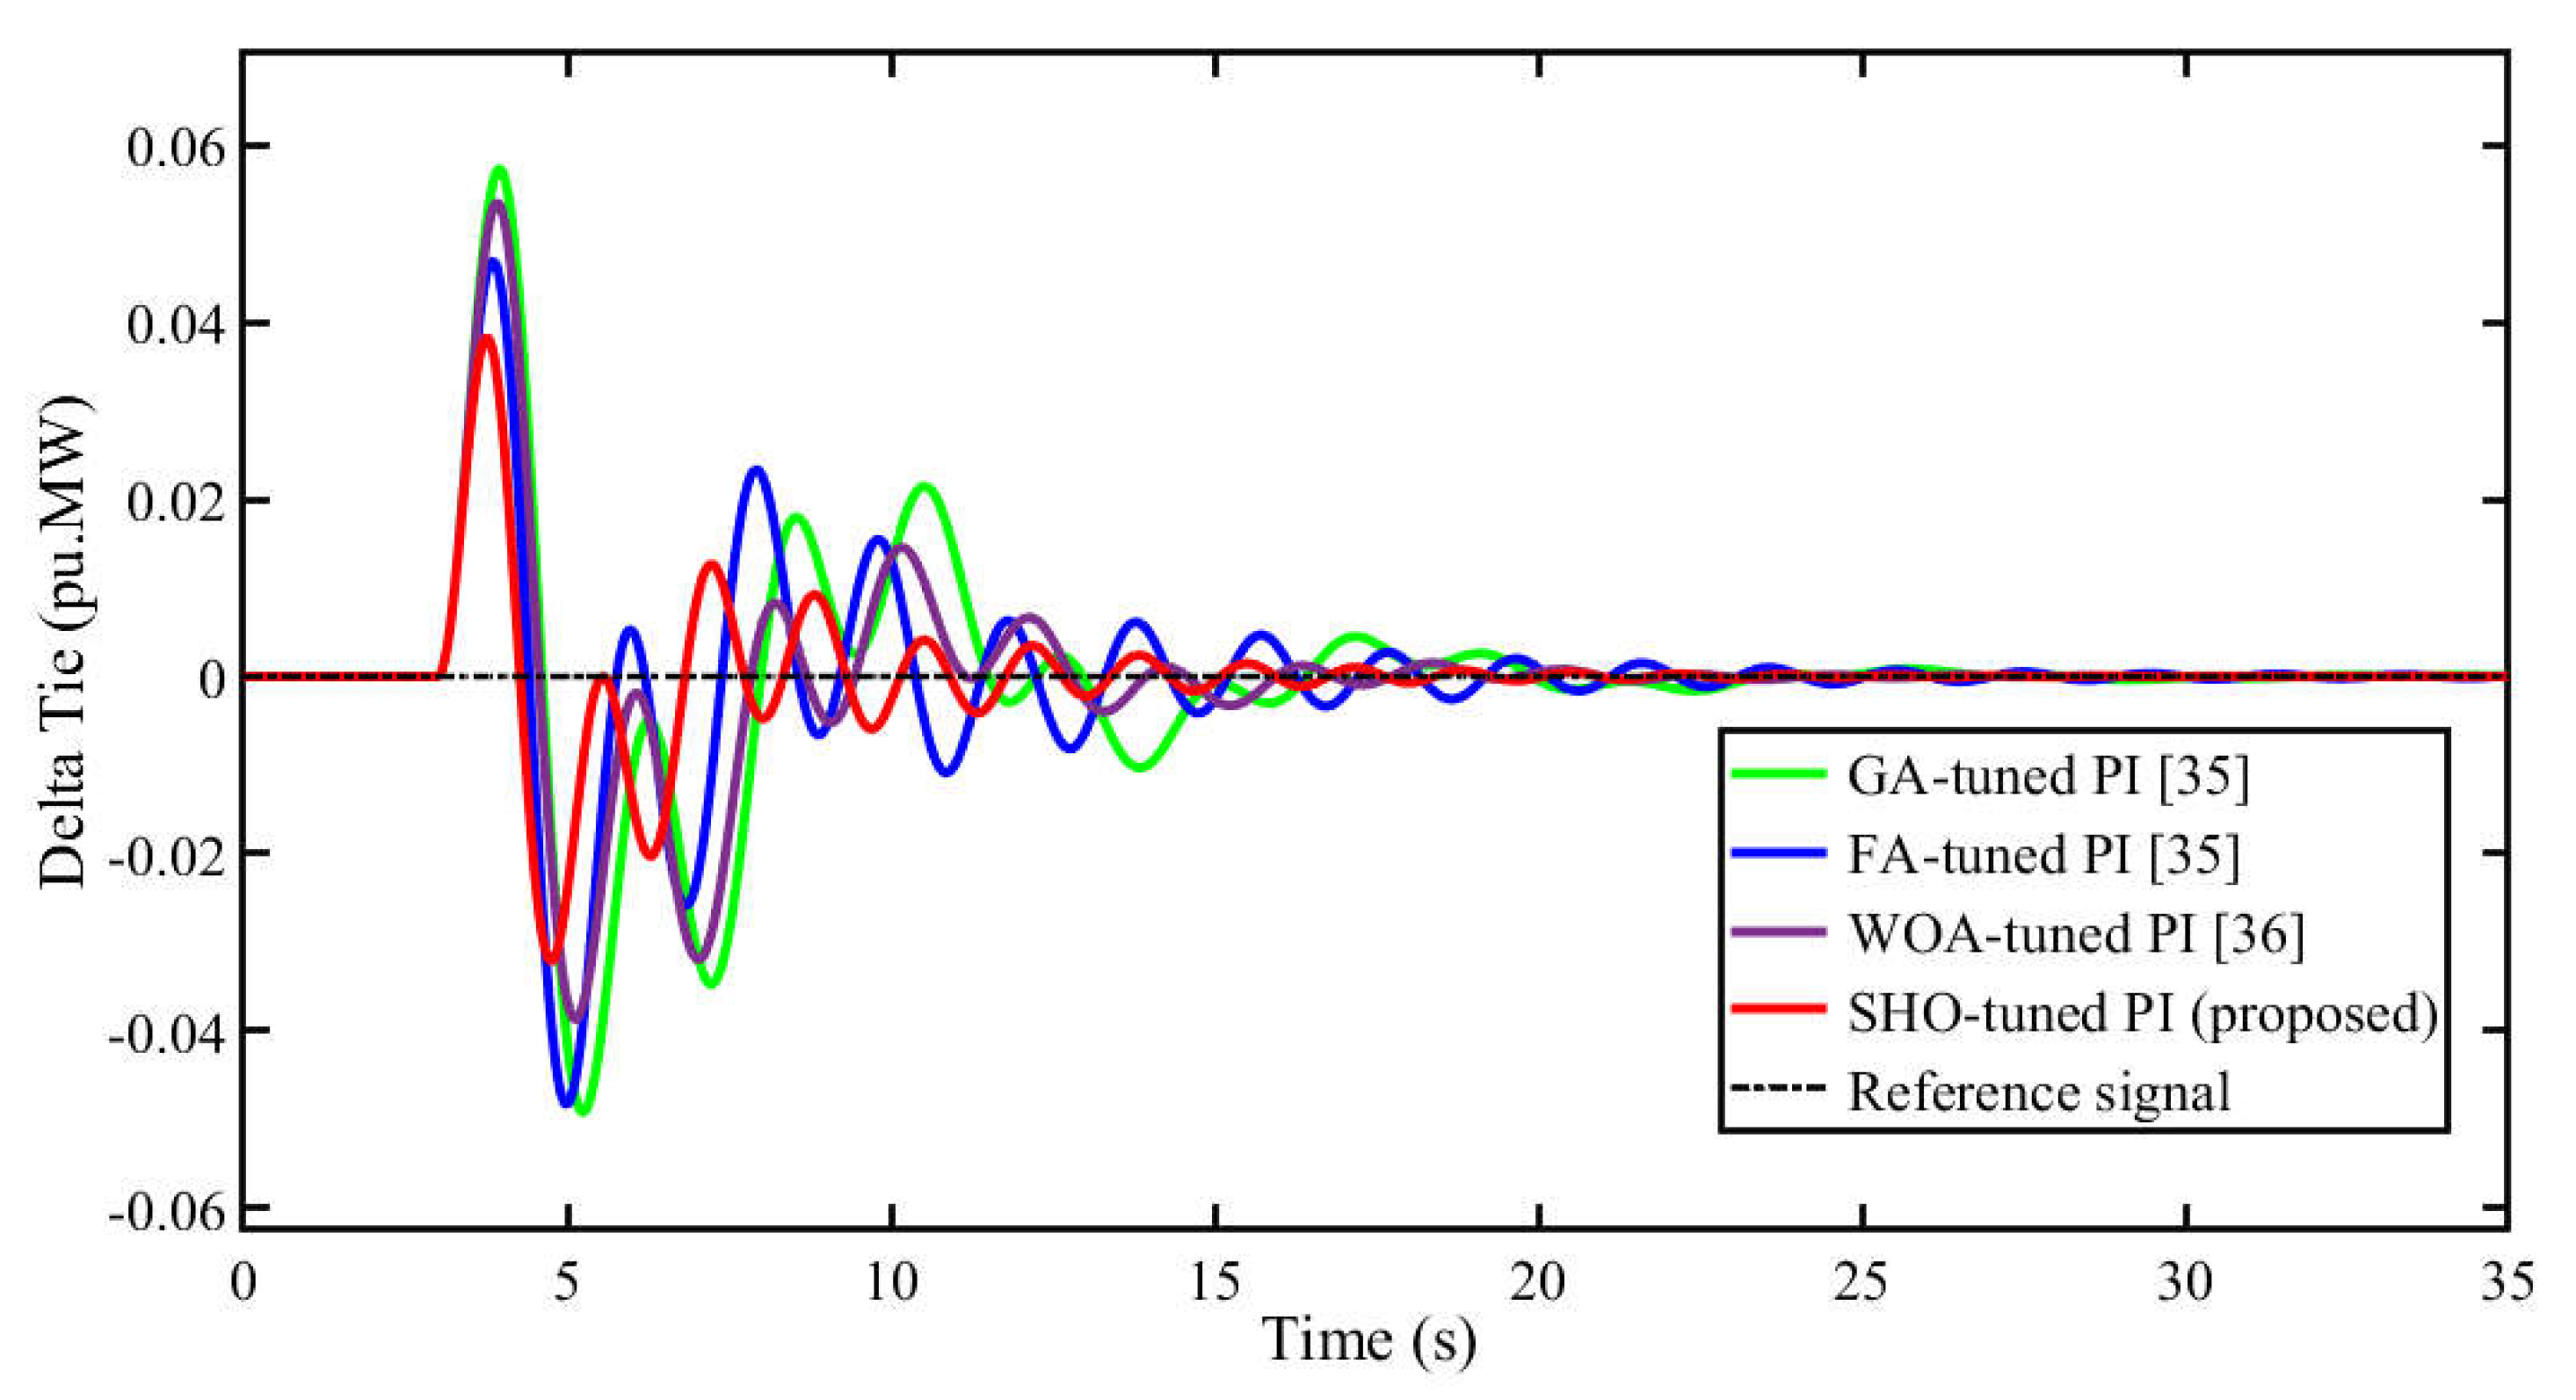
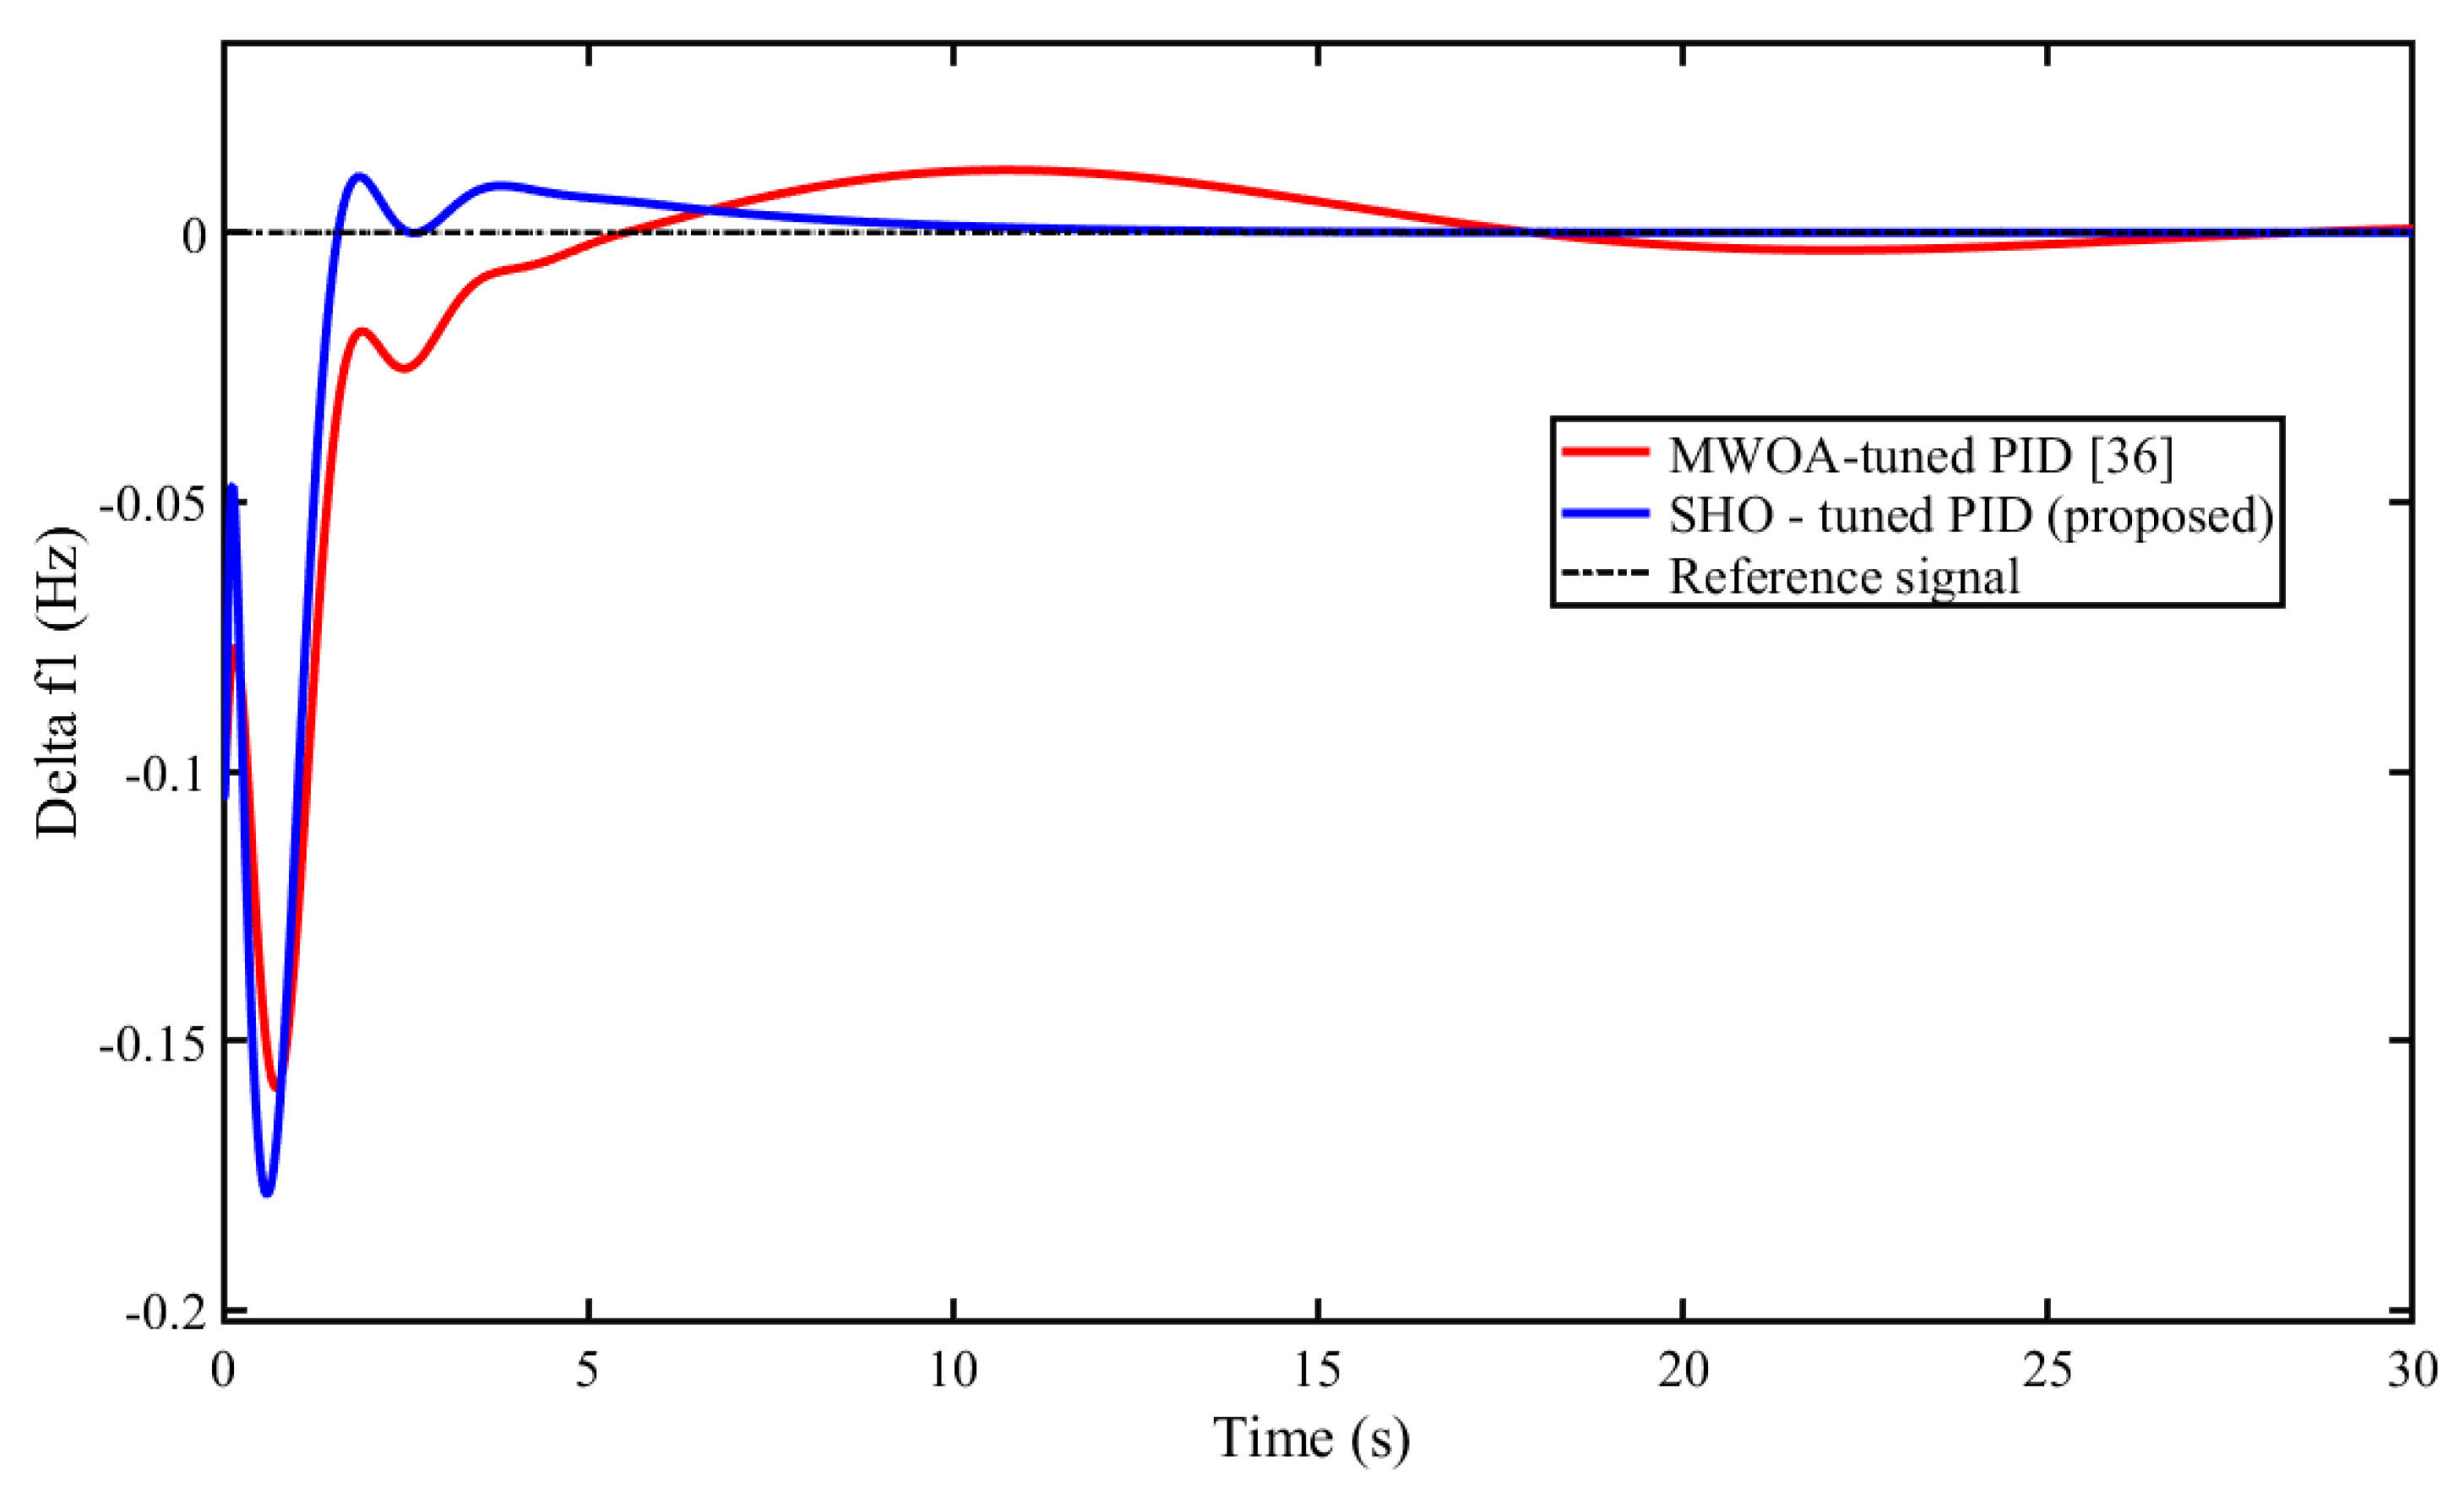
| ITAE | 0.8582 | 1.5602 | 2.5308 | 4.1211 | 7.4259 | 12.1244 |
| Parameters | GA | FA | WOA | SHO (proposed) | |
|---|---|---|---|---|---|
| ∆f1 | Overshoot (M+) | 0.1638 | 0.1577 | 0.07997 | 0.001733 |
| Undershoot (M-) | -0.2966 | -0.3154 | -0.2015 | -0.04374 | |
| Settling Time (s) | 26.73 | 26.44 | 26.30 | 12.62 | |
| ∆f2 | Overshoot (M+) | 0.1571 | 0.1228 | 0.09816 | 0.1012 |
| Undershoot (M-) | -0.2435 | -0.2295 | -0.2216 | -0.1807 | |
| Settling Time (s) | 23.64 | 23.60 | 25.54 | 15.75 | |
| ∆Ptie | Overshoot (M+) | 0.05636 | 0.04643 | 0.0534 | 0.03823 |
| Undershoot (M-) | -0.04921 | -0.04778 | -0.03814 | -0.03215 | |
| Settling Time (s) | 27.73 | 26.45 | 21.07 | 18.04 | |
| Techniques | IAE | ITAE | ISE | ITSE |
|---|---|---|---|---|
| GA-tuned PI | 2.3341 | 12.1244 | 0.3202 | 0.8618 |
| FA-tuned PI | 1.7207 | 7.4259 | 0.2907 | 0.4723 |
| WOA-tuned PI | 1.0566 | 4.1211 | 0.1663 | 0.4262 |
| SHO-tuned PI | 0.6491 | 2.5308 | 0.1021 | 0.26179 |
| MWOA-tuned PID | 0.5625 | 1.5602 | 0.0815 | 0.0601 |
| SHO-tuned PID | 0.3091 | 0.8582 | 0.0448 | 0.0369 |
Disclaimer/Publisher’s Note: The statements, opinions and data contained in all publications are solely those of the individual author(s) and contributor(s) and not of MDPI and/or the editor(s). MDPI and/or the editor(s) disclaim responsibility for any injury to people or property resulting from any ideas, methods, instructions or products referred to in the content. |
© 2023 by the authors. Licensee MDPI, Basel, Switzerland. This article is an open access article distributed under the terms and conditions of the Creative Commons Attribution (CC BY) license (https://creativecommons.org/licenses/by/4.0/).


