
You are currently viewing a beta version of our website. If you spot anything unusual, kindly let us know.
Preprint
Article
Application of Composite Flour from Indonesian Local Tubers in Gluten-Free Pancakes
Altmetrics
Downloads
138
Views
50
Comments
0
A peer-reviewed article of this preprint also exists.


This version is not peer-reviewed
Abstract
Pancakes are fast food snacks that are generally made with the basic ingredients of wheat flour, which is an imported commodity and detrimental for people who are allergic to gluten. To reduce the use of wheat, alternative raw materials derived from local commodities are used, such as modified cassava flour (mocaf), arrowroot flour, and suweg flour. The experiment was carried out by mixing mocaf flour, arrowroot flour, and suweg flour to produce composite flour with a ratio of 70:15:15 (CF1), 70:20:10 (CF2), and 70:20:5 (CF3). The result showed that the ratio of mocaf flour, arrowroot flour, and suweg flour had a significant effect on pasting temperature, peak viscosity, hold viscosity, breakdown viscosity, setback, L*, a*, hue, whiteness, ∆E, as well as swelling volume and solubility on the characteristics of the composite flour It also had a significant effect on the texture characteristics of hardness, adhesiveness, chewiness, color characteristics L*, a*, whiteness, ∆E, and preference for the flavor of gluten-free pancake products. It is known that the best formulation for the resulting pancake product is P1, with the addition of a 70% ratio of mocaf flour, 15% ratio of arrowroot tuber flour, and 15% ratio of suweg flour.
Keywords:
Subject: Chemistry and Materials Science - Materials Science and Technology
1. Introduction
Flour is a raw material that plays an important role in Indonesian food, and is widely used in food processing. The flour with the most use in Indonesia is wheat flour derived from wheat. Until now, Indonesia needs to import wheat to fulfill the high domestic demand for wheat. This is also due to the wheat plant which can only grow in subtropical regions. To reduce dependence on wheat imports which are increasing at increasingly inflated prices, development is needed in the food sector by seeking food diversification.
Another reason for the need for food diversification efforts for wheat flour is because of the gluten content in it. Gluten is a protein that can be found in wheat [1]. In products, the presence of gluten plays a role in the characteristics and stickiness of a dough, where gluten protein is responsible for cohesiveness, viscosity, and elasticity, and affects the water absorption capacity of the dough [2]. However, the presence of gluten in foodstuffs can cause disturbances in some people, one of which is celiac disease. Celiac disease is a digestive disorder, in which there are problems with the absorption of specific proteins in food products which are induced by the presence of gluten protein in some genetically susceptible people [3]. Regardless of age and race, as much as 1% of the human population suffers from celiac disease [4]. Apart from celiac disease, the presence of gluten in foodstuffs can also cause other disorders, such as non-celiac gluten sensitivity, dermatitis herpetiformis, gluten ataxia, and wheat allergy [5]. Therefore, alternative flour is needed to replace wheat flour.
Tubers are a source of carbohydrates, which can be processed into flour and become an alternative flour to replace wheat flour. Tuber flour has some advantages such as being gluten-free and its raw material being available in Indonesia. However, the absence of gluten content in flour also has drawbacks, the absence of gluten causes the resulting product to have characteristics that are not as good as products made from wheat flour. To improve the characteristics of non-gluten flours, they need to be modified. Several previous studies have reported that starch/flour modification treatment can improve its characteristics and expand its application in the food industry [6,7,8,9]. A previous study also reported that modification can improve the nutritional value of starch/flour [10,11]. For this reason, modifications were made to local tuber flour, namely cassava flour using the fermentation method. The lack of characteristics of modified cassava flour (mocaf) can also be covered by making composite flour, by combining mocaf flour with other local tuber flours such as arrowroot flour and suweg flour. The purpose of making composite flour to improve the characteristics of the flour produced, due the mixing between flours causes complementary properties.
One of the applications of composite flour is as an ingredient in gluten-free pancake production. Pancakes are fast food snacks with a flat round shape which are generally made with the basic ingredients of wheat flour. Pancakes with good quality have perfect swelling power, with dough that is always new to meet good quality standards. Pancakes are generally consumed as an easy and quick breakfast to make at home, by mixing flour with milk, eggs, sugar, and baking powder, then the dough is baked on a pan [12]. Based on research conducted by Shih et al. [13], making gluten-free pancakes with 100% rice flour as a base result in an unfavorable texture due to increased hardness when compared to pancakes made from wheat flour. Pancakes with a composition of 50% rice flour and 50% corn flour also produce unfavorable characteristics, in which pancakes with a brittle texture and thick yellow color are produced [14]. To produce pancakes that meet the functional characteristics of flour, as well as produce good characteristics and are liked by the panelists, it is necessary to find the appropriate ratio between mocaf flour, arrowroot tuber flour, and suweg flour.
2. Materials and Methods
2.1. Materials
The main ingredients used in this study were commercial wheat flour, commercial mocaf flour, arrowroot tuber with the age 7-8 months of planting, and suweg tuber with the age 10-12 months of planting. Arrowroot tuber was obtained from Ciamis, Indonesia, and suweg tuber was obtained from Madiun, Indonesia.
2.2. Arrowroot Flour Preparation
Arrowroot flour preparation was followed according to Marta et al. [15] with a slight modification. The arrowroot tubers are washed and peeled, then reduced in size using a food processor into small sizes with a thickness of 2-5 mm. The tuber slices are soaked in water to prevent enzymatic browning, then drained and dried in a cabinet oven at 60°C for 24 hours to reduce the water content. The dried tubers were then milled using a miller machine and then sieved using a 100-mesh sieve. Arrowroot flour that has been sifted is then packed in a tight plastic zip lock and given silica gel inside to prevent an increase in water content in the flour.
2.3. Suweg Flour Preparation
Suweg flour preparation was followed according to Marta et al. [15] with a slight modification. The suweg tubers are washed and peeled, then reduced in size using a food processor with a thickness of 2-5 mm. During the cutting process, the tuber slices must be soaked in water and all parts must be submerged to prevent enzymatic browning. The tuber slices were drained and dried in a cabinet oven at 60 °C for 24 hours. The dried suweg tubers were then milled using a miller machine, then sieved using a 100-mesh sieve. Suweg flour that has been sifted is then packed in a tight plastic zip lock and given silica gel inside to prevent an increase in the water content.
2.4. Composite Flour Preparation
Mocaf flour (MF), arrowroot flour (AF), and suweg flour (SF) were mixed and sieved to make it homogeneous as a composite flour (CF). For CF1 the ratio between flour is 70% mocaf flour, 15% arrowroot tuber flour, and 15% suweg flour, for CF2 70% mocaf flour, 20% arrowroot tuber flour, and 10% suweg flour, and for CF3 70% mocaf flour, 25% arrowroot tuber flour, and 5% suweg flour.
2.5. Pancake Preparation
Each formulation (CF1, CF2, and CF3) is added with other additional ingredients for making pancake products: 90 grams of powdered sugar, 9 grams of baking powder, and 26 grams of powdered milk [3], then mixed with 170 ml water and 1 beaten egg (± 50 grams). The mixing process is carried out until the dough becomes homogeneous. Next, cook the dough with a diameter of ± 8 cm in a pan over low heat for ± 3 minutes [3].

Table 1.
Pancake formulations.
| Formulation | Mocaf (g) | Arrowroot tuber (g) | Suweg (g) | Powdered Sugar (g) | Powdered Milk (g) | Baking Powder (g) | Egg (pcs) | Water (ml) |
|---|---|---|---|---|---|---|---|---|
| Pancake 1 (P1) | 70 | 15 | 15 | 90 | 26 | 9 | 1 | 170 |
| Pancake 2 (P2) | 70 | 20 | 10 | 90 | 26 | 9 | 1 | 170 |
| Pancake 3 (P3) | 70 | 25 | 5 | 90 | 26 | 9 | 1 | 170 |
2.6. Proximate and Crude Fiber Composition Analysis of Flours
The moisture, ash, total protein, fat, and total crude fiber content were determined using standard [16] methods.
2.7. Pasting Properties (RVA Analysis) of Flours
The pasting properties of the flour samples were determined using Rapid Visco Analyzer (RVA-SM2, Warriewood Australia). In an RVA tube, 2.8 g of flour samples were added with 25 mL of aquadest. The temperature was originally held at 50°C for 1 minute, then increased from 50 to 95°C at a rate of 6°C/min, held at 95°C for 5 minutes, and then decreased to 50°C at a rate of 6°C/min. After that, the gel was preserved at 50°C for 5 minutes.
2.8. Color Evaluation of Flours and Pancakes
The color scale for L*, a*, and b* of flour was measured using a Spectrophotometer CM-5 (Konica Minolta Co., Osaka, Japan) with Spectra Magic software. The color measurement includes L* (lightness, 0 = black/100 = white), a* (+a* = redness/-a* = greenness), b* (+b* = yellowness/-a* = blueness) and hue. The calibration was performed with a zero-calibration plate (CM-A124) and a white calibration plate (CM-A120) with a large target mask (CM-A203).
2.9. Water Absorption Capacity (WAC) Measurement of Flour
The water absorption capacity of the flour samples was determined according to Marta et al. [9]. A centrifuge tube containing one gram of flour was filled with 10 mL of water, allowed to remain at room temperature (26 ± 2°C) for one hour, and then centrifuged at 3500 x g for 30 minutes. The supernatant's amount was then calculated. The amount of water that could be absorbed by one gram of wheat was measured as mL as water absorption capacity.
2.10. Swelling Volume and Solubility Measurement of Flours
Swelling volume and solubility were determined according to Marta et al. [9]. The sample was suspended in 12.5 mL of water at a concentration of 0.35 g (db) and then mixed using a vortex for 30 seconds. The samples were centrifuged using a "Beckman Model TJ-6 Centrifuge" at 3500 x g (25°C, 30 minutes) after being kept in a water bath at 90°C for 20 minutes and cooled in cold water. The volume of the supernatant was measured to get the swelling volume result and then dried in an oven at 110°C for 24 hrs to measure the solubility of the samples.
2.11. Texture Evaluation (TPA) of Pancakes
Texture evaluation was measured using Texture Profile Analyzer (TA.XTExpress Stable Micro System) and exponent lite express software for data collection and calculation. The product was pressed using an aluminum cylinder probe P36R with a 2 kg load cell at a speed of 5 mm/s to a strain of 50%. The product texture profile including hardness, adhesiveness, springiness, cohesiveness, chewiness, and resilience was determined from exponent lite express software.
2.12. Hedonic Sensory Test of Pancakes
A hedonic sensory test of the pancake was conducted with 20 panelists with ages 18 to 25, male and female. Pancakes were presented as whole pieces, and placed on white plastic dishes coded with three-digit random numbers. Pancakes were evaluated based on the acceptability of their color, aroma, texture, taste, and overall appearance on a 5-point hedonic scale. The scale ranged from “extremely like” to “extremely dislike,” corresponding to the highest and lowest scores of “5” and “1” respectively [17].
2.13. Statistical analysis
Data were analyzed using one-way ANOVA, then followed by Duncan Test to detect differences. Significance was confirmed at P values <0.05.
3. Results
3.1. Proximate and Crude Fiber Composition
The proximate and crude fiber test results for wheat flour, mocaf flour, arrowroot tuber flour, suweg flour, and composite flour respectively are presented in Table 2.
All composite flours were not significantly different from each other in the parameters of moisture content, ash content, fat content, protein content, and crude fiber content, but all composite flours were significantly different from wheat flour (Table 2). The composite flour had a moisture content ranging from 10.05% to 10.87%, an ash content ranging from 2.40 %db to 2.45 %db, a fat content ranging from 0.36 %db to 0.56 %db, a protein content ranging from 1.74%db to 1.81%db, and a crude fiber content ranging from 1.38 %db to 1.50 %db. All composite flours had a lower moisture content, fat content, and protein content compared to wheat flour, but had a higher ash content and crude fiber content compared to wheat flour.
3.2. Pasting Properties
Amylographic tests were carried out to show the pasting properties of the starch paste and flour produced as well as changes in starch viscosity during the cooking process, which play an important role in flour applications in the food industry. The pasting properties of wheat flour, mocaf flour, arrowroot tuber flour, suweg flour, CF1, CF2, and CF3 are presented in Figure 1 and tabulated in Table 3.
All parameters of pasting properties of composite flours were significantly different from wheat flour (Table 3). Pasting temperature CF1 was a significant difference from CF3, where the pasting temperature increases with the increase of suweg flour (84.07 ºC). Peak viscosity between samples was significantly different, where mocaf flour had the highest peak viscosity (3351.33 cP) and CF1 had the lowest (2394.67 cP). The peak viscosity of composite flour is influenced by the ratio of the addition of arrowroot flour, where the higher the ratio of arrowroot flour, the higher the peak viscosity. This is due to arrowroot flour having a higher peak viscosity (2851.33 cP) when compared to suweg flour (2798.67 cP). Wheat flour has the lowest hold viscosity (935.67 cP) and breakdown viscosity (783.00 cP). The breakdown viscosity of composite flour is influenced by the ratio of arrowroot flour, where arrowroot flour has a higher breakdown viscosity (1483.00 cP) when compared to suweg flour (1093.33 cP). However, the addition of 25% of arrowroot flour can give a significant effect on breakdown viscosity, whereas the addition of 15% and 20% of arrowroot flour has not provided a significant difference. In contrast to breakdown viscosity, setback viscosity in composite flour is influenced by the ratio of suweg flour. This is because the setback viscosity of suweg flour has a significantly higher value (995.67 cP) when compared to arrowroot flour (436.00 cP). However, the addition of suweg flour only contributed significantly after the addition of 15%, whereas the addition of 10% and 5% did not have a significant effect on setback viscosity.
3.3. Color Evaluation of Flour
Color is one of the main determining factors that determine consumer acceptance [18]. The color of flour is influenced by several factors, such as flour preparation and the presence of macronutrients such as lipids and proteins [19]. The color of the flours is shown in Figure 2.
Testing the color characteristics of the flours is carried out with the CM-5 Spectrophotometer which will produce L, a*, and b* data which are color spaces defined by CIE (Commission International de I'Exlairage), and tabulated in Table 4.
CF3 has the highest L* (91.19) indicating a higher lightness, whereas CF1 has the lowest L* (89.58) compared to other composite flours. Similar results are also found in the whiteness index, whereas CF1 (70:15:15) has the lowest whiteness (86.16), while CF3 (70:25:5) has the highest whiteness index (87.27) when compared to other composite flours. However, when compared to all samples, suweg flour has the lowest lightness (81.64) and whiteness index (77.46), while mocaf flour shows the highest lightness (94.17) and whiteness index (88.63). The dark color of the suweg flour causes the suweg flour to have the largest ∆E (11.94) compared to all samples, which shows a very large difference when compared to wheat flour as a control.
CF1 (70:15:15) has the highest a* (1.06) which indicates a more reddish color, while CF3 (70:25:5) has the lowest a* (0.70) when compared to all composite flours. All composite flours were significantly different from one another, and significantly different from wheat flour, mocaf flour, arrowroot flour, and suweg flour. In contrast to a*, it is known that all composite flours were not significantly different in b*. All composite flours have a higher level of red color, but a lower level of yellow color compared to wheat flour.
3.3. Functional Properties
Functional properties are physicochemical properties that affect the behavior of components during the process of preparation, processing, storage, and consumption. The functional properties observed in this study include water absorption capacity (WAC), swelling volume, and solubility which are presented in Table 5.
The water absorption capacity (WAC) of the composite flour ranges from 1.62 g/g to 1.65 g/g, the swelling volume ranges from 21.01 ml/g to 25.33 ml/g, and solubility ranges from 12.86% to 16.20%. The WAC of CF1, CF2, and CF3 were not significantly different from each other, but significantly different from wheat flour (1.11 g/g). The swelling volume of all composite flours was significantly different from wheat flour. The WAC and swelling volume of the composite flours were significantly higher than wheat flour.
3.4. Texture Evaluation of Pancake
The texture is one important factor that will affect the final product of the resulting flour. The characteristics of the texture can be tested using the Texture Profile Analyzer (TPA) with the parameters of hardness, springiness, cohesiveness, adhesiveness, resilience, and chewiness (Table 6).
Compared to all gluten-free pancake products, P1 has the highest hardness and chewiness and is not significantly different from pancakes made from wheat flour. Apart from hardness and chewiness, P1 is also not significantly different compared to wheat flour’s pancake in adhesiveness. All pancake samples showed no significant differences in cohesiveness and resilience. Overall, the P1 pancake product has the most texture characteristics resembling wheat flour pancakes.
3.5. Color Evaluation of Pancakes
Color is the main attribute of the appearance of food products and is an important characteristic of their quality. Color is one of the determining indicators for consumers in purchasing a food product because it is a parameter that can be assessed directly before buying a product. The color of all pancake samples can be seen in Figure 3 and tabulated in Table 7.
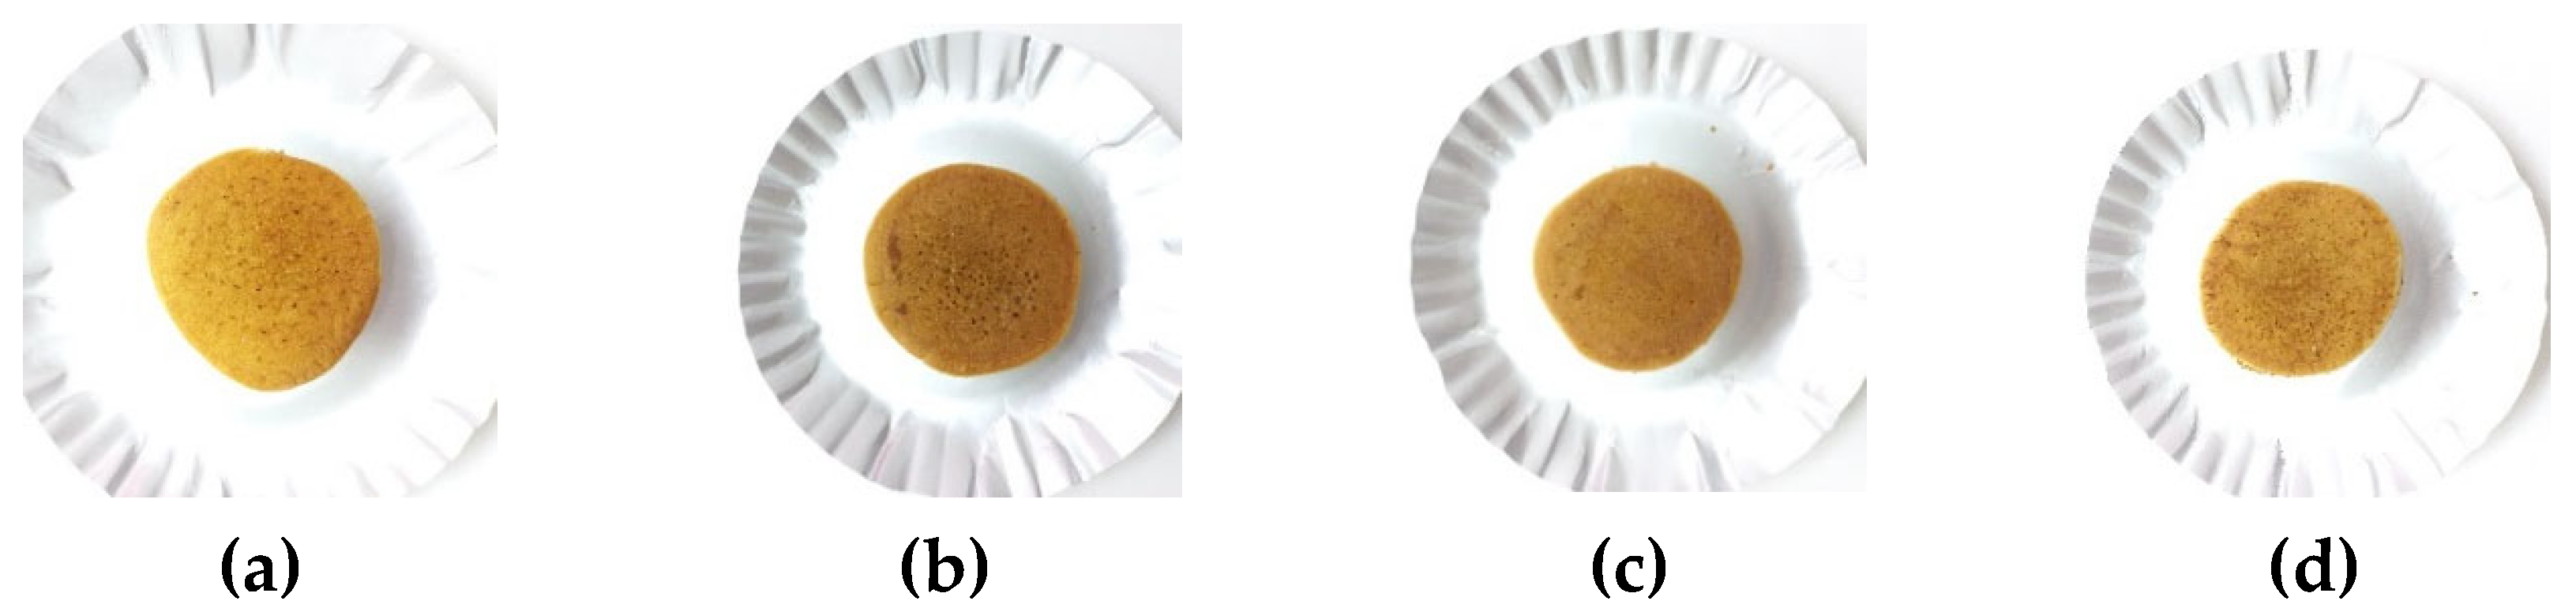
Figure 2.
The visual appearance of pancakes with wheat flour (a), with 70% mocaf flour, 15% arrowroot tuber flour, and 15% suweg flour (b), with 70% mocaf flour, 20% arrowroot tuber flour, and 10% suweg flour (c), with 70% mocaf flour, 25% arrowroot tuber flour, and 5% suweg flour (d).
Figure 2.
The visual appearance of pancakes with wheat flour (a), with 70% mocaf flour, 15% arrowroot tuber flour, and 15% suweg flour (b), with 70% mocaf flour, 20% arrowroot tuber flour, and 10% suweg flour (c), with 70% mocaf flour, 25% arrowroot tuber flour, and 5% suweg flour (d).
P3 has the highest L* (49.52) which indicates a higher level of brightness, while P1 has the lowest L* (43.70) compared to all gluten-free pancakes. However, wheat flour still had the highest L* (52.20) when compared to all pancake products. All gluten-free pancake products have a* ranging from 9.47 to 13.74, whereas all gluten-free pancake products have a* that are significantly different from one another. P2 had the highest a* (13.74) compared to other gluten-free pancake products which stated a more reddish color and was not significantly different from wheat flour, while P3 (70:25:5) has the lowest b* (9.47). All gluten-free pancake products had lower red and yellow color levels compared to wheat flour.
3.5. Hedonic Sensory
Analysis of the organoleptic characteristics of pancake products was carried out using a hedonic test to determine the panelists' preference and acceptance of the products. The parameters in this hedonic test include color, aroma, texture, taste, and overall appearance. The score for this hedonic test is 1 (dislike very much), 2 (dislike), 3 (normal), 4 (like), and 5 (very like). The hedonic test was carried out on 20 panelists. The results of the panelists' preference for pancake products can be seen in Figure 4.
Pancakes made from wheat flour still had the preferred color, texture, flavor, and overall appearance. In terms of aroma, P1 has the most preferred aroma by the panelists. Overall, all pancake products have a score above 3, which indicates the product is acceptable to the panelists.
4. Discussion
Moisture content of the composite flours were found to be below the maximum required level (<14% w/w), so it is safe enough to prevent the growth of mold [18]. The ash content of composite flour is from 2.40% to 2.45%. Based on the research results, it is known that arrowroot flour has the highest ash content (5.34%) compared to all other samples, which was in line with Sudaryati et al. [20]. All composite flours were not significantly different from each other in the parameters of moisture content, ash content, fat content, protein content, and crude fiber content, which shows that the addition of a ratio of 5%, 10%, and 15% in arrowroot tuber flour and suweg flour does not have a significant effect to all composite flours.
The pasting properties are an important parameter to determine the characteristics of flour. All the composite flours had a higher pasting temperature compared to wheat flour. A higher pasting temperature of composite flours indicates a higher resistance to swelling and rupture [21]. On the peak viscosity, all samples differed significantly from one another. A high peak viscosity might be caused by a low amylose content, which encourages swelling of starch molecules and causes an increase in viscosity [22]. Peak viscosity correlates with the quality of the final product produced, where a high peak viscosity will give a good paste texture [23]. All the composite flours also showed a higher breakdown viscosity compared to wheat flour. Inversely correlated with hold viscosity and breakdown viscosity, composite flours have a lower final viscosity and setback viscosity. These results are in accordance with research conducted by Yulianti et al. [24], where the final viscosity of gluten-free composite flours shows lower results when compared to wheat flour. All composite flours have significantly lower setback than wheat flour. A lower setback for composite flours indicates a lower retrogradation tendency, which will affect the hardness of the resulting pancake product [25]. However, based on the data obtained, it is known that the hardness of pancakes is not significantly different between pancakes made from wheat flour with P1 and P2.
Color is also an important parameter to determine flour quality. The concentration of the suweg flour is affecting the color of all the composite flours, that the lightness gradually decreased when the concentration of the suweg flour (81.64) is higher. Based on previous research, it is known that suweg flour has a high phenolic content (17.66 mg GAE/g) [26], while arrowroot flour only has a phenolic content of 0.268 mg GAE/g [27]. Phenolics are compounds that are easily oxidized, which can cause discoloration due to the formation of oxidation products. The presence of high phenolic content in suweg flour causes the color to brown more quickly. In line with the level of lightness, the whiteness of all samples and all composite flours were significantly different from each other and decreased with the addition of the ratio of suweg flour, which was because the suweg flour had the lowest whiteness when compared to all samples (77.46).
Functional properties testing was also carried out to determine the properties of the flour to be used in making pancakes. The WAC of the composite flours (CF1, CF2, and CF3) were higher than wheat flour. High water binding capacity will increase the reconstitution ability and textural properties of the dough obtained [28]. This is in accordance with research conducted by Chandra & Samsher [29], where gluten-free flour has a higher WAC when compared to wheat flour. A high WAC indicates that flour can used in the formulation of several foods such as dough and bakery products [30]. Suweg flour has the highest WAC (2.01 g/g) compared to all samples. This is related to the high crude fiber content in suweg flour, where the fiber-rich dough causes higher water absorption [31]. Functional properties have a correlation with amylographic properties. When compared with amylographic properties, swelling volume is directly proportional to the peak viscosity [25]. This is consistent with the results of the study, where wheat flour has the lowest peak viscosity and swelling volume compared to all samples.
In pancake products, texture is the most important parameter to determine its quality. It is known that all gluten-free pancake products have significantly different hardness. Of all gluten-free pancakes, the hardnes of P1 and P2 are not significantly different from wheat flour pancakes. This shows that P1 and P2 have good texture characteristics in terms of hardness and resemble pancakes made from wheat flour. Hardness is affected by the difference in the ratio of adding suweg flour to composite flour. The hardness of the product increases with the addition of the suweg flour composition used, which indicates that the suweg flour affects the hardness of the resulting pancake product. This could be due to the high content of crude fiber in suweg flour, causing the hardness of the product to increase. In pancake products, springiness is the desired texture attribute [32]. Springiness is associated with the freshness of the product produced, where high quality products have a higher springiness [33]. It is known that P2 and P3 are not significantly different from wheat flour pancakes. Meanwhile P1 have a significantly lower springiness compared to pancake products made from wheat flour. Suweg flour contains resistant starch which can increase the viscosity of the dough and the resulting final product. In addition, suweg flour also contains a high crude fiber which can give a chewy texture to the resulting product. Based on the research results, it is known that P2 and P3 had a lower chewiness when compared to wheat flour pancake products. In contrast to springiness, an increase in chewiness is undesirable for pancake products. This is because the increased chewiness of pancake products causes the final pancake product to have a texture that is too chewy and has lost its soft texture [32]. P1 had a chewiness that is not significantly different from pancake made from wheat flour, which shows good characteristics and resembles wheat flour.
Color is one of the determining indicators for consumers in purchasing a food product, so that it becomes one of the criteria that needs to be considered to determine the acceptability of the resulting pancake product. It is known that P3 has the highest L* (49.52) which indicates a higher level of brightness, while P1 has the lowest L* (43.70). This is because P3 has the highest ratio of arrowroot flour addition, which is 25%. The higher the ratio of arrowroot flour added, the product with higher brightness will be produced. This is consistent with research by Lestari et al. [34], where the addition of the highest arrowroot flour ratio (30%) resulted in cookies with the highest brightness. However, pancake made from wheat flour still had the highest L* (52.20) when compared to all pancake products. The same result as flour color evaluation, the concentration of suweg flour affects the color of the pancake product, where the L* decreases when suweg flour concentration is higher. This is due to the basic color of the suweg flour which is dark brown, which will affect the final product [35]. All gluten-free pancake has lower red and yellow color levels when compared to wheat flour. The presence of red and yellow colors in flour can be influenced by the presence of chemical compositions such as fats and proteins [19]. This is consistent with the data obtained, where all composite flour has lower fat and protein compared to wheat flour. Calculations were also made for the whiteness of pancake products to determine the level of whiteness of the final product. It is known that P3 (70:25:5) has the highest whiteness (40.54), while P1 (70:15:15) has the lowest whiteness (34.36). Similar to the lightness, the whiteness is affected by the ratio of the addition of suweg flour, where the more the ratio of suweg flour added, the lower the whiteness will be. In the ∆E calculation, P1 has the highest ∆E compared to other gluten-free pancake products, which indicates a greater color difference when compared to pancake products made from wheat flour. Meanwhile P2 has the smallest ∆E which shows less difference compared to wheat flour pancakes.
In terms of panelist preferences, it is known that all pancake products are acceptable to panelists. The textural preference of gluten-free pancake products is influenced by the addition of arrowroot flour ratio, where P1 with the lowest ratio of arrowroot flour addition was not significantly different when compared to pancake products made from wheat flour, while P2 and P3 had significant differences. The addition of an arrowroot flour ratio of 15% gives the texture characteristics of pancake products giving a firm texture, but remains smooth when consumed. P1 had the highest preference over other gluten-free pancakes, and had a more favorable aroma than wheat flour-based pancakes.
5. Conclusions
The conclusion obtained from this study is that the ratio of the use of mocaf flour, arrowroot flour, and suweg flour had a significant effect on pasting temperature, peak viscosity, hold viscosity, breakdown viscosity, setback, L*, a*, hue, whiteness, ∆E , as well as swelling volume and solubility on the characteristics of the flour composition. The ratio of the use of mocaf flour, arrowroot flour, and suweg flour also had a significant effect on the texture characteristics of hardness, adhesiveness, chewiness, color characteristics L*, a*, whiteness, ∆E, and preference for the aroma of the resulting gluten-free pancake product. It is known that the best formulation for the resulting pancake product is P1, with the addition of 70% ratio of mocaf flour, 15% ratio of arrowroot tuber flour, and 15% ratio of suweg flour with characteristics and organoleptics hardness texture 2698.16, springiness texture 0.98, chewiness texture 2199.06, L* 43.70, a* 12.11, b* 31.41, organoleptic taste 3.76, organoleptic color 3.33, organoleptic texture 3.71, aroma organoleptic 3.67, and overall appearance organoleptic 3.62.
Author Contributions
Conceptualization, H.M. and Y.C.; methodology, H.M. and H.R.A.; software, C.F.; validation, H.M., Y.C. and H.R.A.; formal analysis, C.F. and F.F.; investigation, D.S and Y.C.; resources, F.F. and D.S.; data curation, H.M. and Y.C.; writing—original draft preparation, H.M. and C.F.; writing—review and editing. H.R.A. and Y.C.; visualization. F.F.; supervision. H.M., Y.C. and H.R.A.; project administration. H.M., F.F., and D.S. All authors have read and agreed to the published version of the manuscript.
Funding
This research was funded by Grant of Ministry of Education, Culture, Research, and Technology (MoECRT), Republic of Indonesia [grant number: 2393/UN6.3.1/PT.00/2022] and The APC was funded by Universitas Padjadjaran.
Data Availability Statement
Not applicable.
Acknowledgments
Not applicable.
Conflicts of Interest
The authors declare no conflict of interest.
References
- García-García, A.; Madrid, R.; Sohrabi, H.; de la Cruz, S.; García, T.; Martín, R.; González, I. A Sensitive and Specific Real-Time PCR Targeting DNA from Wheat, Barley and Rye to Track Gluten Contamination in Marketed Foods. Lwt 2019, 114, 108378. [CrossRef]
- Ortolan, F.; Steel, C.J. Protein Characteristics That Affect the Quality of Vital Wheat Gluten to Be Used in Baking: A Review. Comprehensive Reviews in Food Science and Food Safety 2017, 16, 369–381. [CrossRef]
- Rakmai, J.; Haruthaithanasan, V.; Chompreeda, P.; Chatakanonda, P.; Yonkoksung, U. Development of Gluten-Free and Low Glycemic Index Rice Pancake: Impact of Dietary Fiber and Low-Calorie Sweeteners on Texture Profile, Sensory Properties, and Glycemic Index. Food Hydrocolloids for Health 2021, 1, 100034. [CrossRef]
- Bascuñán, K.A.; Vespa, M.C.; Araya, M. Celiac Disease: Understanding the Gluten-Free Diet. European Journal of Nutrition 2017, 56, 449–459. [CrossRef]
- Dale, H.F.; Biesiekierski, J.R.; Lied, G.A. Non-Coeliac Gluten Sensitivity and the Spectrum of Gluten-Related Disorders: An Updated Overview. Nutrition Research Reviews 2019, 32, 28–37. [CrossRef]
- Marta, H.; Cahyana, Y.; Bintang, S.; Soeherman, G.P.; Djali, M. Physicochemical and Pasting Properties of Corn Starch as Affected by Hydrothermal Modification by Various Methods. International Journal of Food Properties 2022, 25, 792–812. [CrossRef]
- Marta, H.; Cahyana, Y.; Djali, M.; Pramafisi, G. The Properties, Modification, and Application of Banana Starch. Polymers 2022, 14, 1–20. [CrossRef]
- Marta, H.; Hasya, H.N.L.; Lestari, Z.I.; Cahyana, Y.; Arifin, H.R.; Nurhasanah, S. Study of Changes in Crystallinity and Functional Properties of Modified Sago Starch (Metroxylon Sp.) Using Physical and Chemical Treatment. Polymers 2022, 14. [CrossRef]
- Marta, H.; Cahyana, Y.; Arifin, H.R.; Khairani, L. Comparing the Effect of Four Different Thermal Modifications on Physicochemical and Pasting Properties of Breadfruit (Artocarpus Altilis) Starch. International Food Research Journal 2019, 26, 269–276.
- Marta, H.; Cahyana, Y.; Djali, M. Densely Packed-Matrices of Heat Moisture Treated-Starch Determine the Digestion Rate Constant as Revealed by Logarithm of Slope Plots. Journal of Food Science and Technology 2021, 58, 2237–2245. [CrossRef]
- Marta, H.; Cahyana, Y.; Djali, M. Pectin Interaction with Thermally Modified Starch Affects Physicochemical Properties and Digestibility of Starch as Revealed by Logarithm of Slop Plot. CYTA - Journal of Food 2021, 19, 63–71. [CrossRef]
- Yamashita, S.; Matsumiya, K.; Kogo, Y.; Takamatsu, K.; Matsumura, Y. Emulsifiers Efficiently Prevent Hardening of Pancakes under Refrigerated Conditions via Inclusion Complexes with Starch Molecules. Food Hydrocolloids 2020, 100, 105432. [CrossRef]
- Shih, F.F.; Truong, V.D.; Daigle, K.W. Physicochemical Properties of Gluten-Free Pancakes from Rice and Sweet Potato Flours. Journal of Food Quality 2006, 29, 97–107. [CrossRef]
- Kiprushkina, E.I.; Golovinskaia, O. V.; Ovsyuk, E.A.; Baklanova, V. V.; Alekseeva, L.A.; Tulina, A.K.; Beloded, V.R.; Shestopalova, I.A. Pancakes for a Healthy Diet: Low-Carb, Prebiotic, Gluten-Free. Agronomy Research 2020, 18, 2410–2424. [CrossRef]
- Marta, H.; Cahyana, Y.; Djali, M.; Arcot, J.; Tensiska, T. A Comparative Study on the Physicochemical and Pasting Properties of Starch and Flour from Different Banana (Musa Spp.) Cultivars Grown in Indonesia. International Journal of Food Properties 2019, 22, 1562–1575. [CrossRef]
- AOAC Official Method of Analysis. Arlington: AOAC International. 2005.
- Cahyana, Y.; Rangkuti, A.; Siti Halimah, T.; Marta, H.; Yuliana, T. Application of Heat-Moisture-Treated Banana Flour as Composite Material in Hard Biscuit. CYTA - Journal of Food 2020, 18, 599–605. [CrossRef]
- Sumardiono, S.; Jos, B.; Antoni, M.F.Z.; Nadila, Y.; Handayani, N.A. Physicochemical Properties of Novel Artificial Rice Produced from Sago, Arrowroot, and Mung Bean Flour Using Hot Extrusion Technology. Heliyon 2022, 8, e08969. [CrossRef]
- Sholichah, E.; Deswina, P.; Sarifudin, A.; Andriansyah, C.E.; Rahman, N. Physicochemical, Structural and Morphological Properties of Some Arrowroot (Maranta Arundinacea) Accessions Growth in Indonesia. AIP Conference Proceedings 2019, 2175. [CrossRef]
- Sudaryati, E.; Nasution, E.; Ardiani, F. Nutritional Quality of Bread from Mixture of Arrowroot Flour (Marantha Arundinacea L.) and Wheat Flour. 2018, 9, 186–189. [CrossRef]
- Kumar, R.; Khatkar, B.S. Thermal, Pasting and Morphological Properties of Starch Granules of Wheat (Triticum Aestivum L.) Varieties. Journal of Food Science and Technology 2017, 54, 2403–2410. [CrossRef]
- Qadir, N.; Wani, I.A. Functional Properties, Antioxidant Activity and in-Vitro Digestibility Characteristics of Brown and Polished Rice Flours of Indian Temperate Region. Grain and Oil Science and Technology 2022. [CrossRef]
- Alamu, E.O.; Maziya-Dixon, B.; Dixon, A.G. Evaluation of Proximate Composition and Pasting Properties of High Quality Cassava Flour (HQCF) from Cassava Genotypes (Manihot Esculenta Crantz) of β-Carotene-Enriched Roots. Lwt 2017, 86, 501–506. [CrossRef]
- Yulianti, L.E.; Afifah, N.; Ekafitri, R. Physicochemical and Pasting Properties of Composite Flours for Making Gluten-Free Bread. AIP Conference Proceedings 2019, 2175. [CrossRef]
- Ayetigbo, O.; Latif, S.; Abass, A.; Müller, J. Preparation, Optimization and Characterization of Foam from White-Flesh and Yellow-Flesh Cassava (Manihot Esculenta) for Powder Production. Food Hydrocolloids 2019, 97, 105205. [CrossRef]
- Shete, C.C.; Wadkar, S.S.; Gaikwad, N.B.; Patil, K.S.; Ghosh, J.S. Phenolic Contents and Antioxidant Capacity of Amorphophallus Commutatus and Amorphophallus Paeonifolius. International Food Research Journal 2015, 22, 1939–1944.
- Ieamkheng, S.; Santibenchakul, S.; Sooksawat, N. Potential of Maranta Arundinacea Residues for Recycling: Analysis of Total Phenolic, Flavonoid, and Tannin Contents. Biodiversitas 2022, 23, 1204–1210. [CrossRef]
- Adebowale, A.A.; Adegoke, M.T.; Sanni, S.A.; Adegunwa, M..; Fetuga, G.O. Functional Properties and Biscuit Making Potentials of Sorghum-Wheat Flour Composite. American Journal of Food Technology 2012, 7, 372–379.
- Chandra, S.; Samsher Assessment of Functional Properties of Different Flours. African Journal of Agricultural Research 2013, 8, 4849–4852. [CrossRef]
- Chandra, S.; Singh, S.; Kumari, D. Evaluation of Functional Properties of Composite Flours and Sensorial Attributes of Composite Flour Biscuits. Journal of Food Science and Technology 2015, 52, 3681–3688. [CrossRef]
- Kaur, R.; Kaur, M. Microstructural, Physicochemical, Antioxidant, Textural and Quality Characteristics of Wheat Muffins as Influenced by Partial Replacement with Ground Flaxseed. Lwt 2018, 91, 278–285. [CrossRef]
- Kumar, P.K.; Parhi, A.; Sablani, S.S. Development of High-Fiber and Sugar-Free Frozen Pancakes: Influence of State and Phase Transitions on the Instrumental Textural Quality of Pancakes during Storage. Lwt 2021, 146, 111454. [CrossRef]
- Valcarcel, M.; Ghatak, R.; Bhaduri, S.; Navder, K.P. Physical, Textural and Sensory Characteristics of Gluten-Free Muffins Prepared with Teff Flour (Eragrostis Tef (Zucc) Trotter). Journal of the Academy of Nutrition and Dietetics 2012, 112, A58. [CrossRef]
- Lestari, L.A.; Huriyati, E.; Marsono, Y. The Development of Low Glycemic Index Cookie Bars from Foxtail Millet (Setaria Italica), Arrowroot (Maranta Arundinacea) Flour, and Kidney Beans (Phaseolus Vulgaris). Journal of Food Science and Technology 2017, 54, 1406–1413. [CrossRef]
- Sofyan, A.; Ikhsani, A.Y.; Purwani, E.; Hasanah, L.E.N.; Febriyadin, F. The Effect of Suweg (Amorphophallus Paeoniifolius) Flour and Incubation Temperature on Characteristics of Yogurt with the Addition of Bifidobacterium Bifidum as Probiotic. Materials Today: Proceedings 2022, 63, S507–S512. [CrossRef]
Figure 1.
Pasting properties of wheat flour (A), mocaf flour (B), arrowroot flour (C), suweg flour (D), and composite flours CF1 (E), CF2 (F), CF3 (G), temperature profile (H).
Figure 1.
Pasting properties of wheat flour (A), mocaf flour (B), arrowroot flour (C), suweg flour (D), and composite flours CF1 (E), CF2 (F), CF3 (G), temperature profile (H).
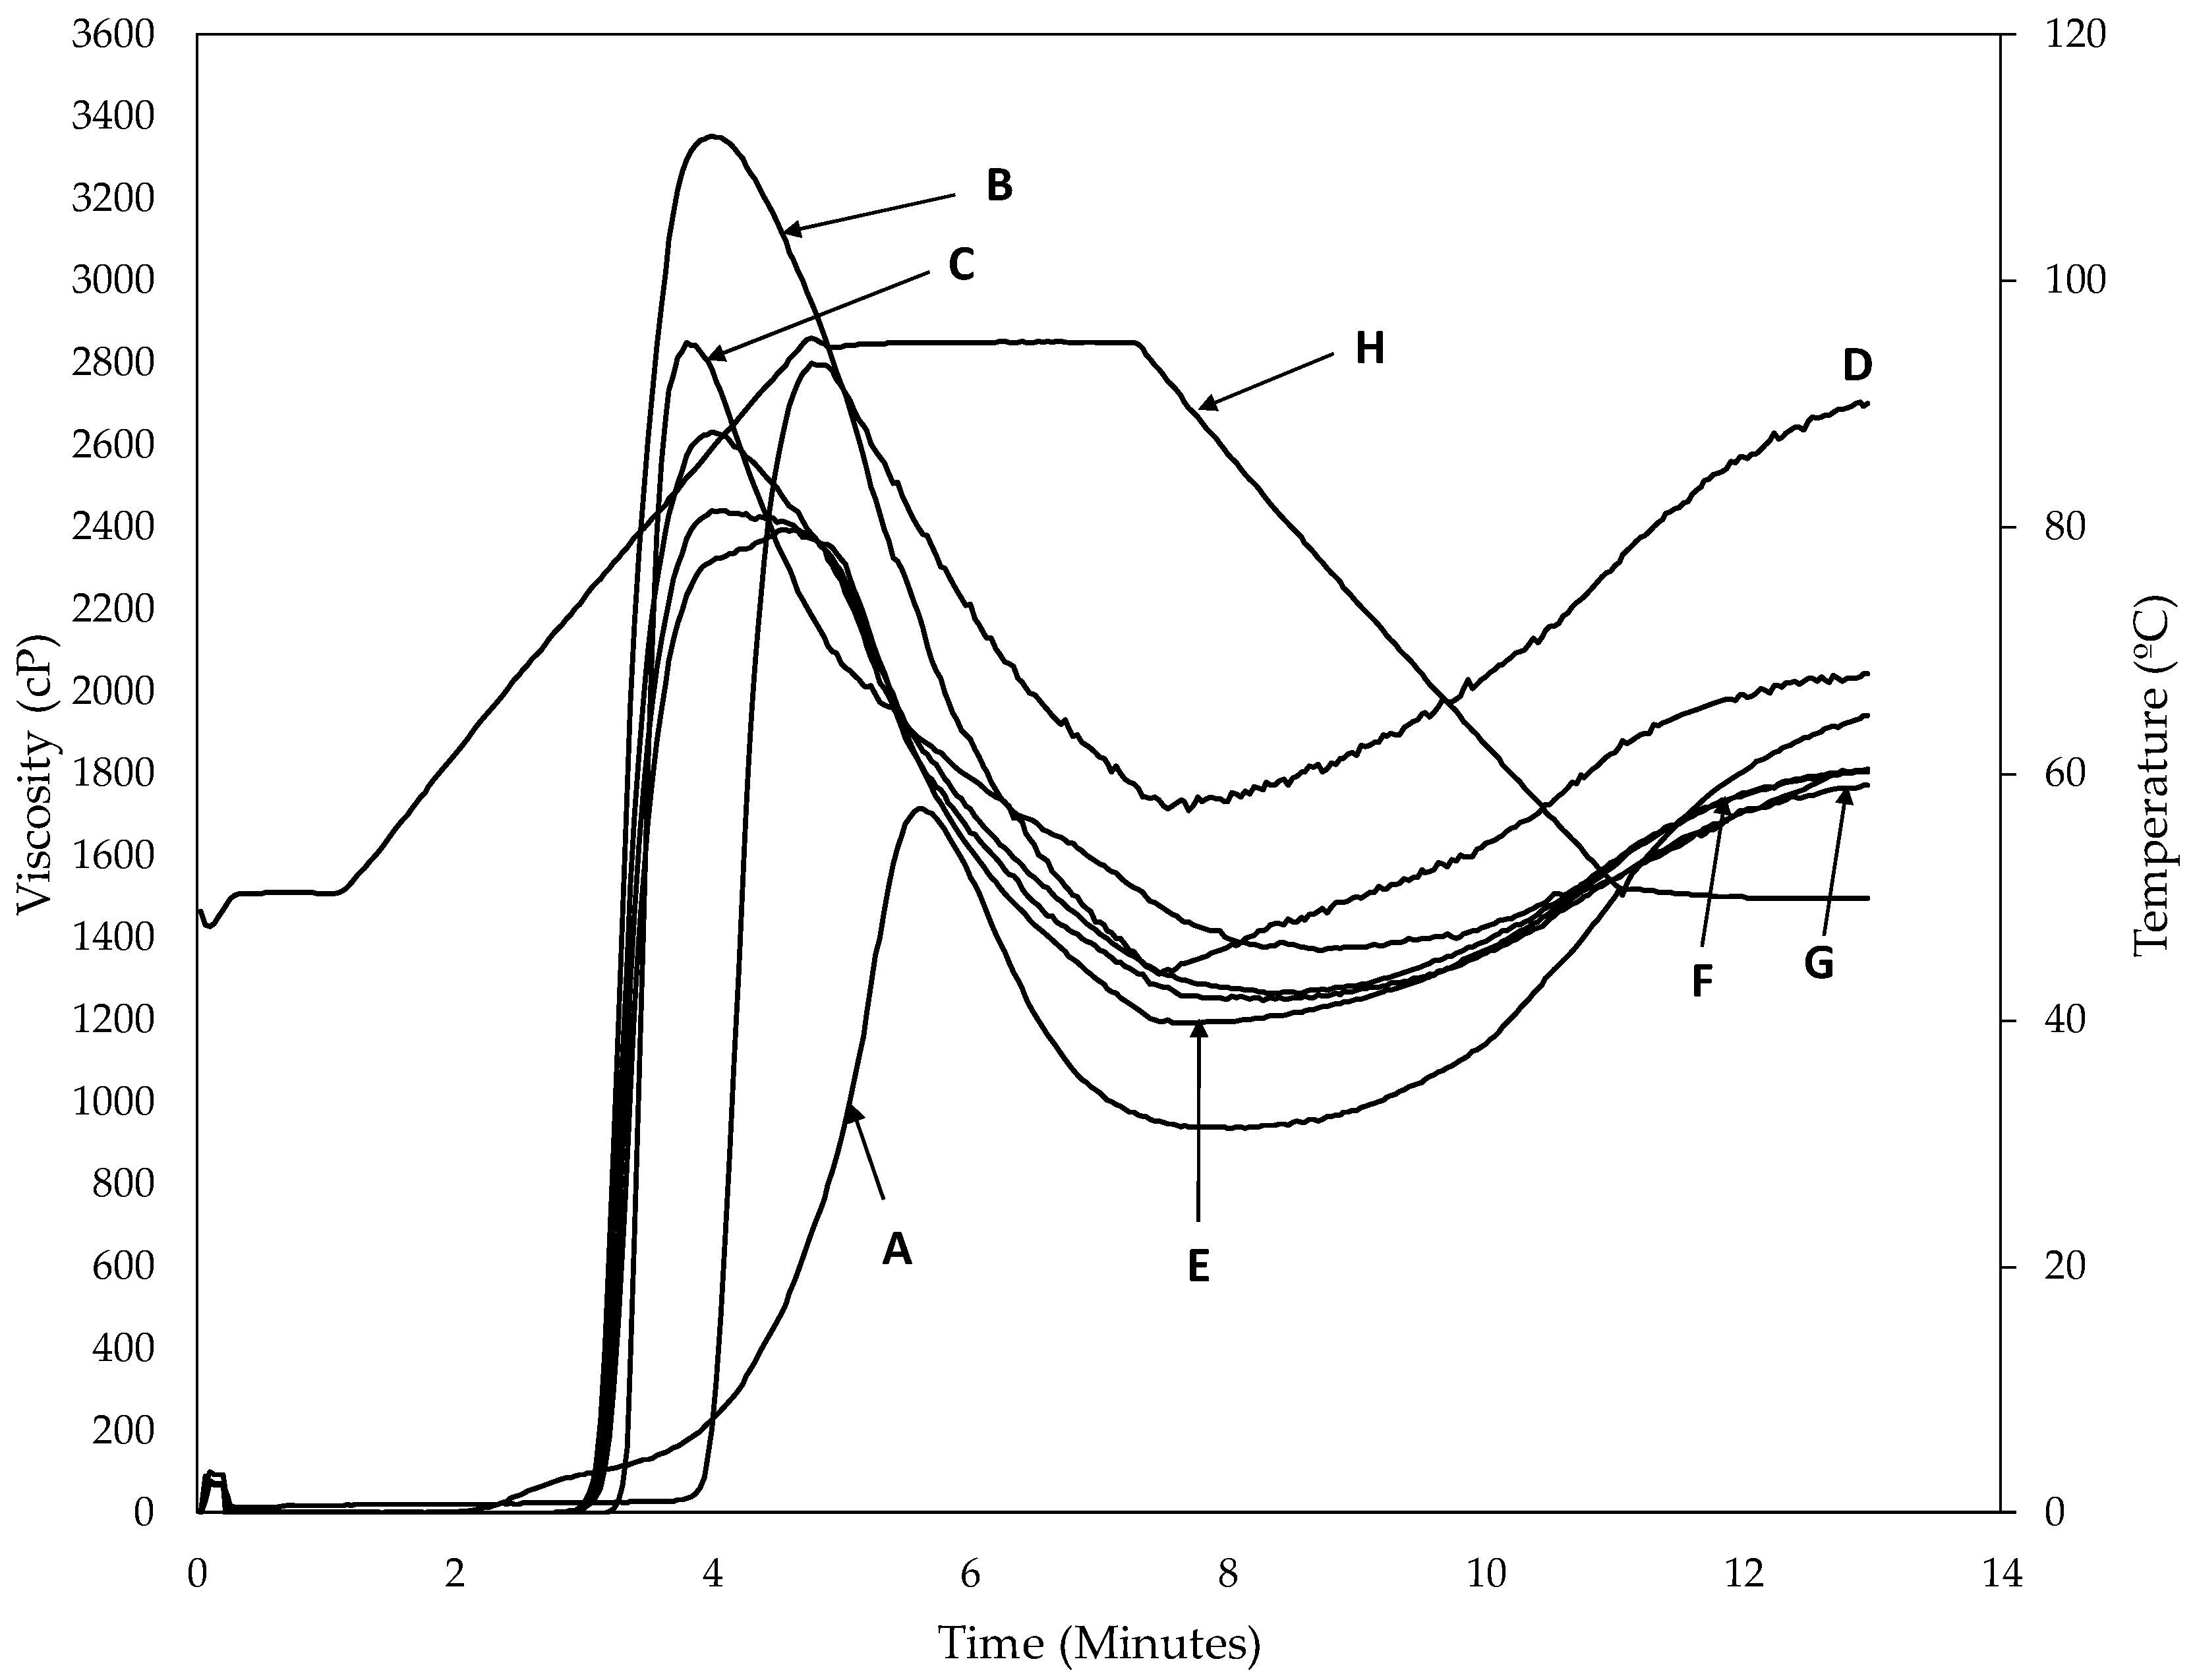
Figure 2.
Visual appearance of wheat flour (a), mocaf flour (b), arrowroot tuber flour (c), suweg flour (d), and composite flour CF1 (e), CF2 (f), and CF3 (g).
Figure 2.
Visual appearance of wheat flour (a), mocaf flour (b), arrowroot tuber flour (c), suweg flour (d), and composite flour CF1 (e), CF2 (f), and CF3 (g).
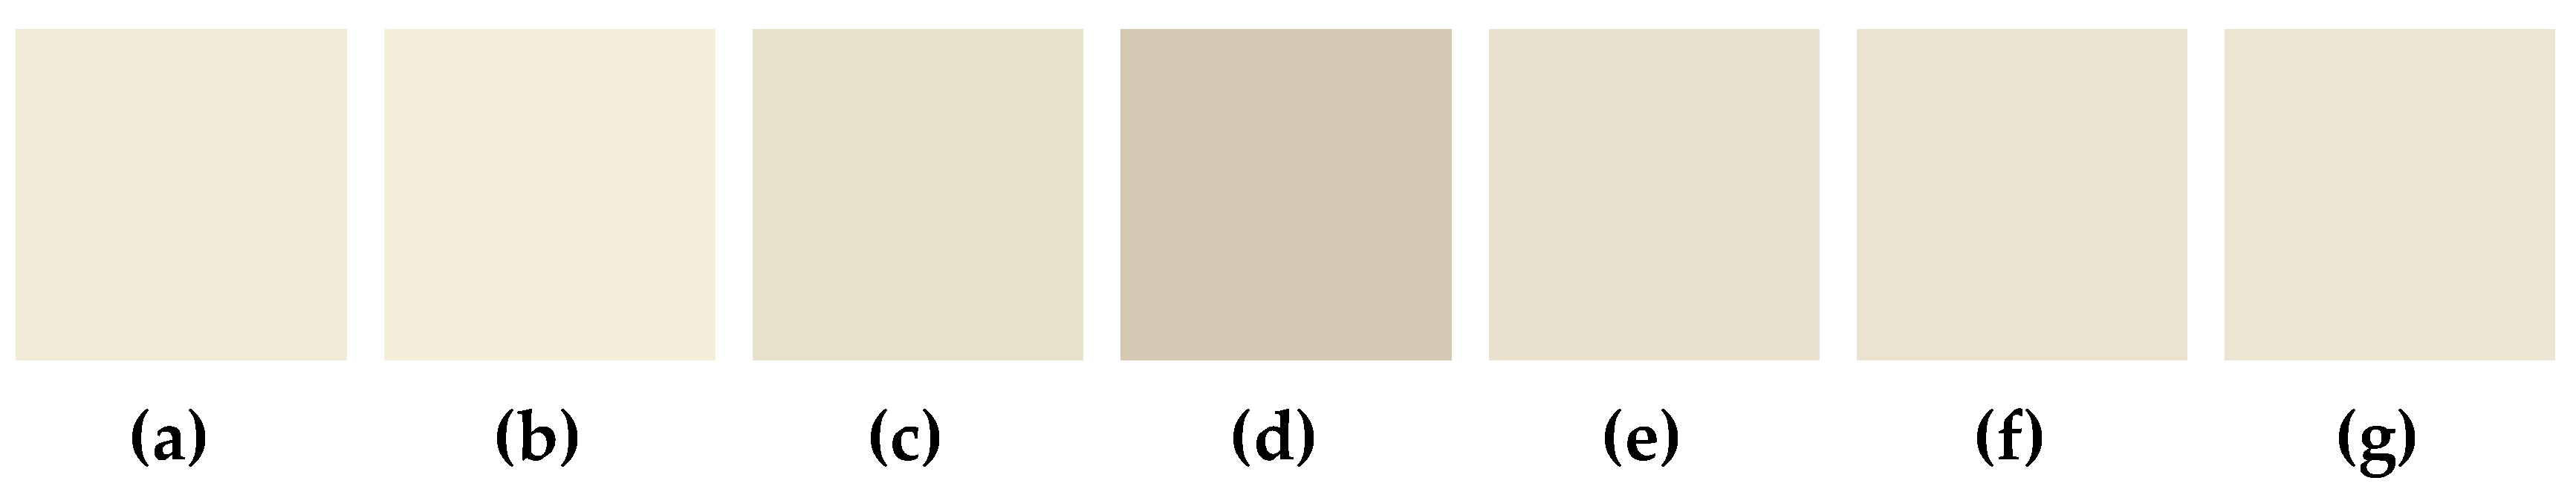
Figure 4.
Organoleptic parameters of pancakes.
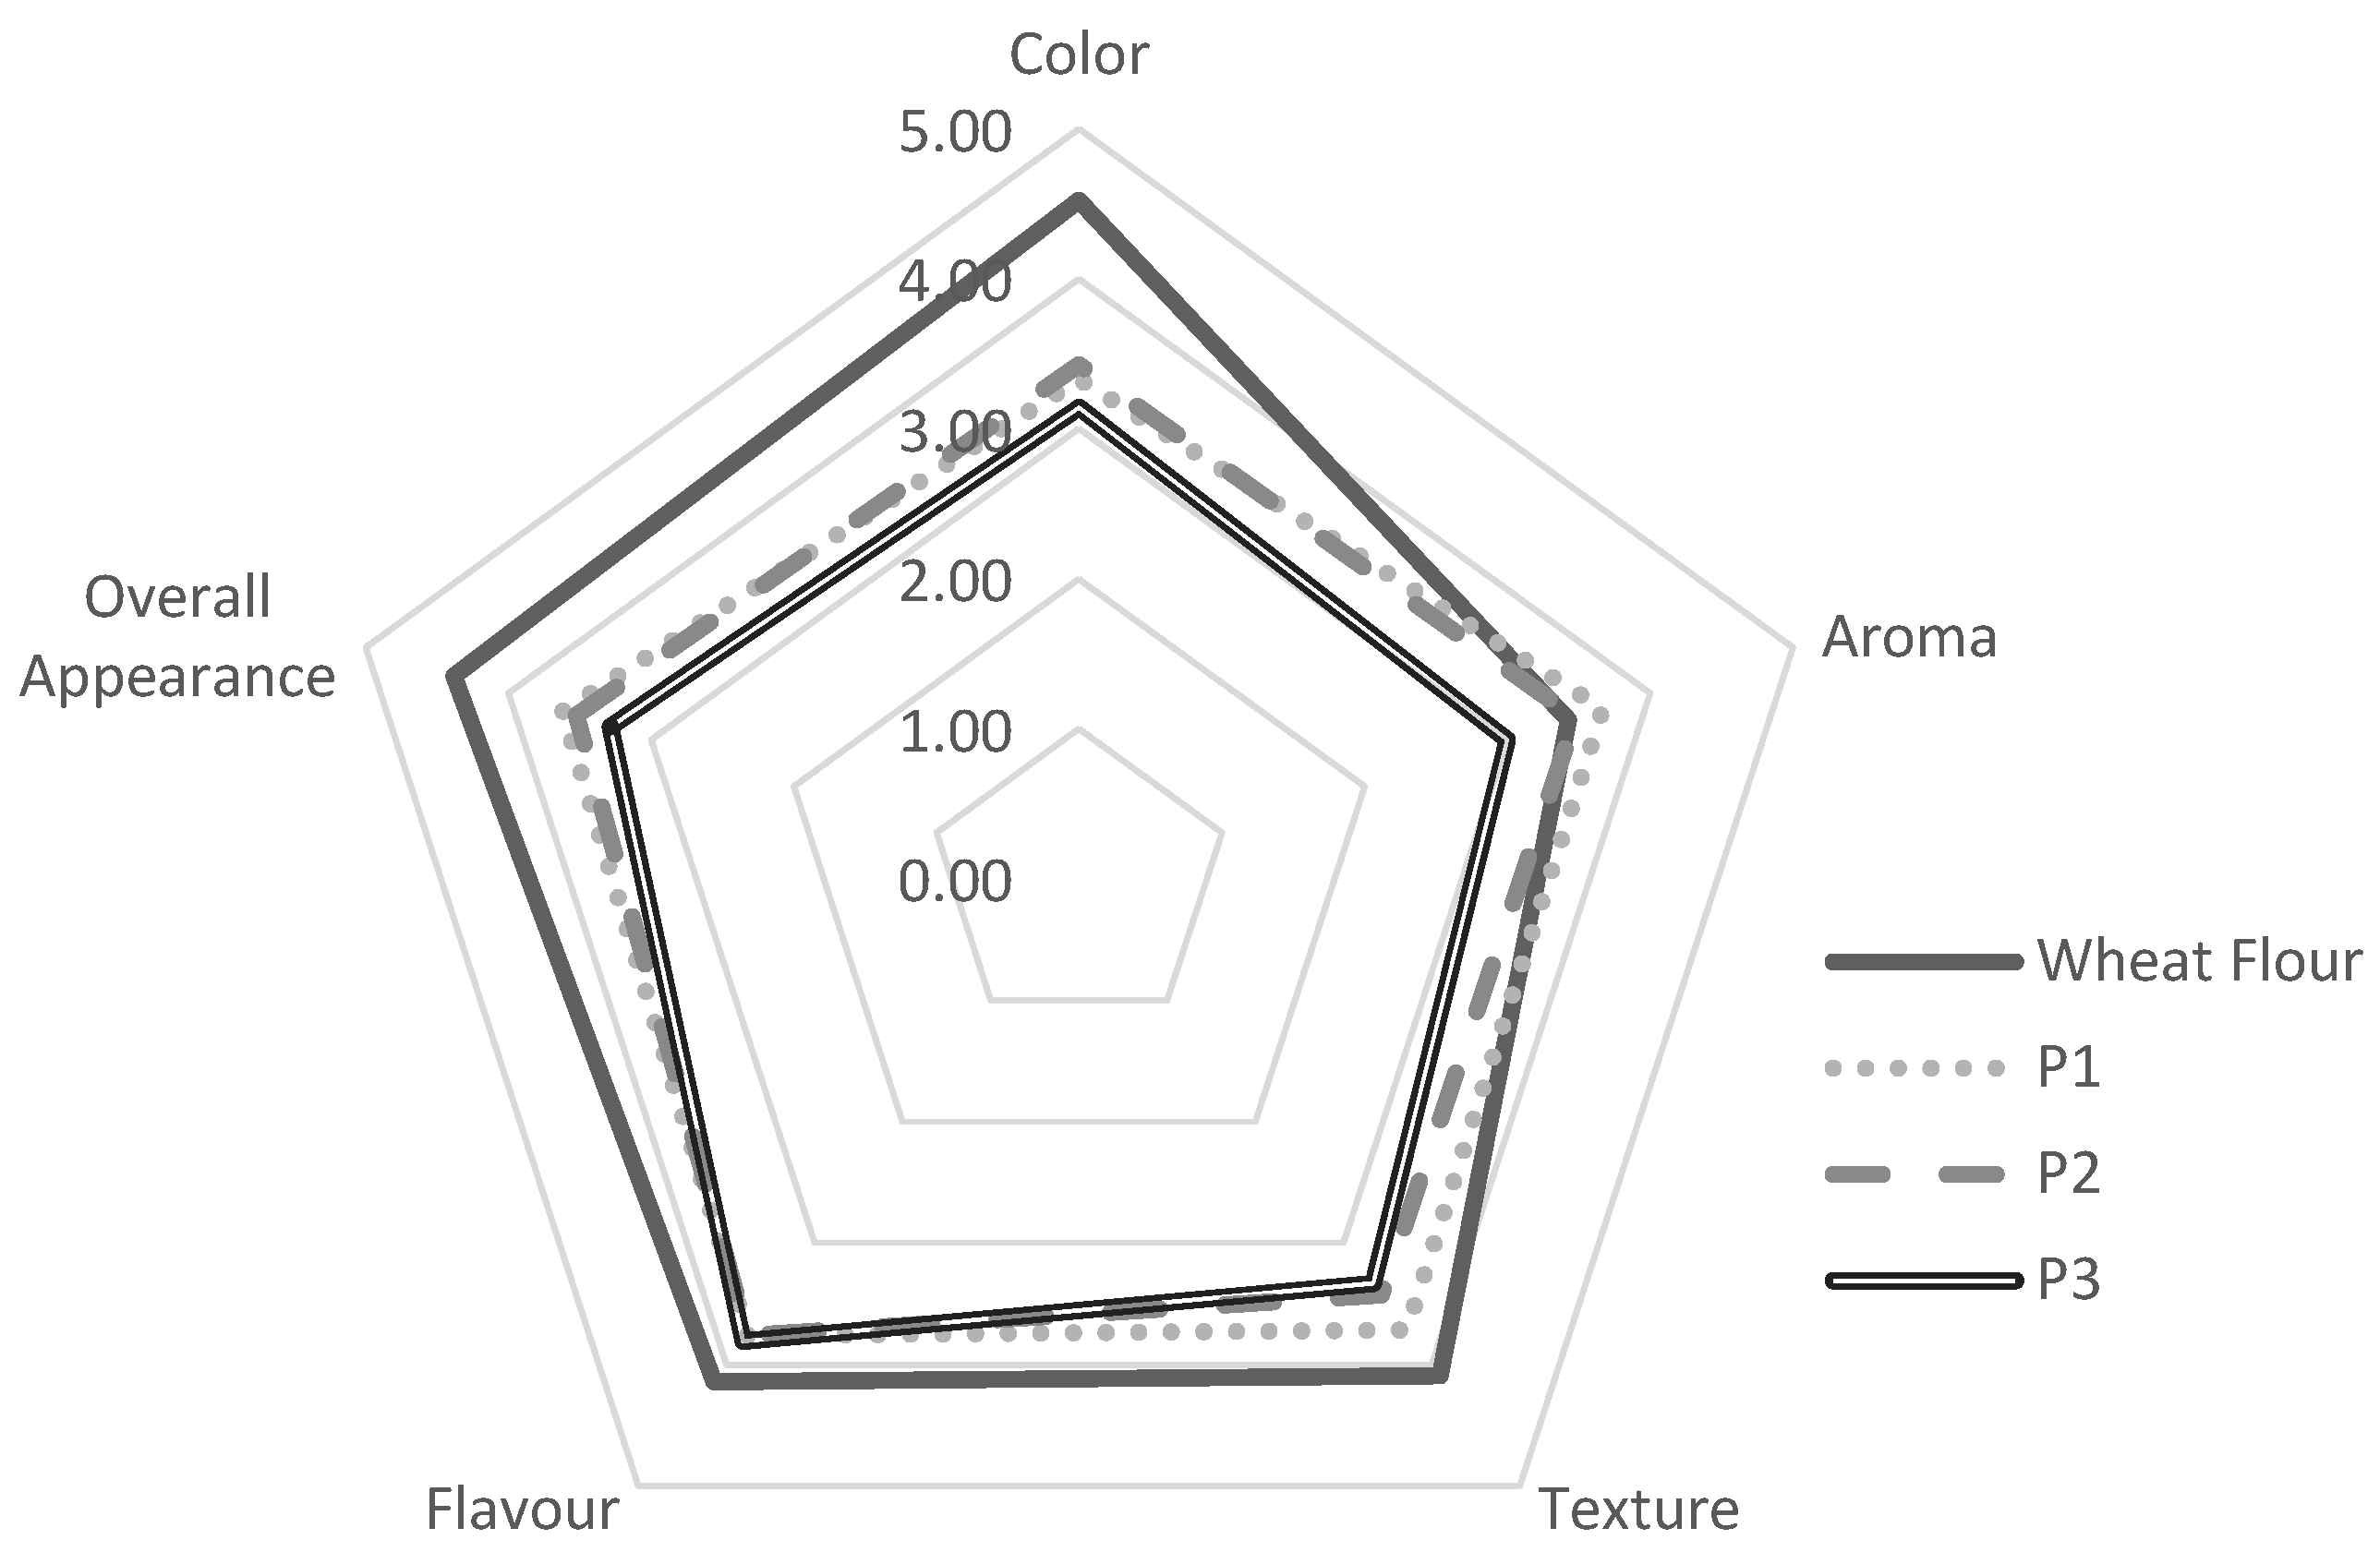
Table 2.
Proximate composition of wheat flour, mocaf flour, arrowroot tuber flour, suweg flour, and composite flours.
Table 2.
Proximate composition of wheat flour, mocaf flour, arrowroot tuber flour, suweg flour, and composite flours.
| Sample | Water (%db) | Ash (%db) |
Fat (%db) |
Protein (%db) | Crude fiber (%db) |
|---|---|---|---|---|---|
| WF | 14.52 ± 0.16a | 0.69 ± 0.01e | 1.36 ± 0.43a | 10.55 ± 0.18a | 0.38 ± 0.15e |
| MF | 14.33 ± 0.25a | 1.46 ± 0.20d | 1.05 ± 0.06ab | 1.13 ± 0.22d | 1.18 ± 0.09d |
| AF | 7.32 ± 0.05c | 5.34 ± 0.02a | 0.54 ± 0.28bc | 4.40 ± 0.10b | 1.79 ± 0.05b |
| SF | 10.21 ± 0.71b | 4.05 ± 0.06b | 0.53 ± 0.34bc | 4.44 ± 0.06b | 3.15 ± 0.25a |
| CF1 | 10.87 ± 0.25b | 2.45 ± 0.07c | 0.56 ± 0.01bc | 1.75 ± 0.07c | 1.38 ± 0.01cd |
| CF2 | 10.26 ± 0.83b | 2.40 ± 0.02c | 0.36 ± 0.07c | 1.74 ± 0.05c | 1.50 ± 0.01bc |
| CF3 | 10.05 ± 0.10b | 2.43 ± 0.02c | 0.43 ± 0.20bc | 1.81 ± 0.10c | 1.44 ± 0.13cd |
Means within columns with different superscripts are significantly different (p ≤ 0.05). CF1 = MF : AF : SF = 70 : 15 : 15. CF2 = MF : AF : SF = 70 : 20 : 10. CF3 = MF : AF : SF = 70 : 25 : 5.
Table 3.
Pasting properties of wheat flour, mocaf flour, arrowroot tuber flour, suweg flour, and composite flours.
Table 3.
Pasting properties of wheat flour, mocaf flour, arrowroot tuber flour, suweg flour, and composite flours.
| Sample | Pasting Temperature (oC) | Peak Viscosity (cP) | Hold Viscosity (cP) | Final Viscosity (cP) | Breakdown (cP) | Setback (cP) |
|---|---|---|---|---|---|---|
| WF | 64.91 ± 0.60e | 1718.67 ± 4.93g | 935.67 ± 14.50e | 1943.00 ± 24.06c | 783.00 ± 10.15f | 1007.33 ± 9.71a |
| MF | 73.17 ± 0.24d | 3351.33 ± 17.79a | 1312.00 ± 39.40bc | 2042.33 ± 10.02b | 2039.33 ± 56.22a | 730.33 ± 34.93b |
| AF | 76.62 ± 0.04b | 2851.33 ± 29.87b | 1368.67 ± 55.64b | 1804.33 ± 98.54d | 1483.00 ± 25.24b | 436.00 ± 45.92e |
| SF | 84.07 ± 0.15a | 2798.67 ± 10.97c | 1705.33 ± 55.23a | 2701.00 ± 12.12a | 1093.33 ± 47.26e | 995.67 ± 53.93a |
| CF1 | 74.06 ± 0.47c | 2394.67 ± 38.03f | 1191.67 ± 14.01d | 1806.67 ± 36.12d | 1203.00 ± 24.02d | 615.00 ± 22.11c |
| CF2 | 73.79 ± 0.10cd | 2445.67 ± 15.50e | 1264.00 ± 5.20c | 1813.00 ± 16.46d | 1181.67 ± 12.86d | 549.00 ± 19.47d |
| CF3 | 73.24 ± 0.47d | 2632.00 ± 24.56d | 1245.67 ± 44.64cd | 1772.67 ± 6.03d | 1386.33 ± 39.80c | 527.00 ± 33.63d |
Means within columns with different superscripts are significantly different (p ≤ 0.05). CF1 = MF : AF : SF = 70 : 15 : 15. CF2 = MF : AF : SF = 70 : 20 : 10. CF3 = MF : AF : SF = 70 : 25 : 5.
Table 4.
Color evaluation of wheat flour, mocaf flour, arrowroot flour, suweg flour, and composite flours.
Table 4.
Color evaluation of wheat flour, mocaf flour, arrowroot flour, suweg flour, and composite flours.
| Sample | L* | a* | b* | hue | Whiteness | ∆E |
|---|---|---|---|---|---|---|
| WF | 93.09 ± 0.21b | 0.45 ± 0.01e | 9.81 ± 0.12c | 1.53 ± 0.00a | 87.99 ± 0.03b | 0.00 ± 0.00f |
| MF | 94.17 ± 0.16a | 0.43 ± 0.02e | 9.75 ± 0.13c | 1.53 ± 0.00a | 88.63 ± 0.07a | 1.09 ± 0.31e |
| AF | 89.48 ± 0.21e | -0.36 ± 0.02f | 11.35 ± 0.16b | -1.54 ± 0.00f | 84.52 ± 0.12f | 4.01 ± 0.27b |
| SF | 81.64 ± 0.42f | 1.78 ± 0.02a | 12.96 ± 0.28a | 1.43 ± 0.00e | 77.46 ± 0.18g | 11.94 ± 0.19a |
| CF1 | 89.58 ± 0.37e | 1.06 ± 0.01b | 9.04 ± 0.03d | 1.45 ± 0.00d | 86.16 ± 0.28e | 3.65 ± 0.51b |
| CF2 | 90.37 ± 0.16d | 0.88 ± 0.03c | 9.13 ± 0.26d | 1.47 ± 0.00c | 86.70 ± 0.28d | 2.84 ± 0.34c |
| CF3 | 91.19 ± 0.05c | 0.70 ± 0.03d | 9.17 ± 0.27d | 1.49 ± 0.00b | 87.27 ± 0.22c | 2.03 ± 0.19d |
Means within columns with different superscripts are significantly different (p ≤ 0.05). CF1 = MF : AF : SF = 70 : 15 : 15. CF2 = MF : AF : SF = 70 : 20 : 10. CF3 = MF : AF : SF = 70 : 25 : 5.
Table 5.
Functional properties of wheat flour, mocaf flour, arrowroot tuber flour, suweg flour, and composite flours.
Table 5.
Functional properties of wheat flour, mocaf flour, arrowroot tuber flour, suweg flour, and composite flours.
| Sample | WAC (g/g) | Swelling Volume (ml/g) | Solubility (%) |
|---|---|---|---|
| WF | 1.11 ± 0.13d | 11.52 ± 0.31e | 14.17 ± 2.00c |
| MF | 1.68 ± 0.01b | 16.65 ± 0.24d | 9.20 ± 0.36d |
| AF | 1.48 ± 0.04c | 22.19 ± 0.42b | 19.05 ± 0.36a |
| SF | 2.01 ± 0.07a | 16.55 ± 0.22d | 17.35 ± 0.17b |
| CF1 | 1.63 ± 0.03b | 25.33 ± 0.62a | 12.86 ± 0.80c |
| CF2 | 1.65 ± 0.02b | 21.10 ± 0.16c | 16.20 ± 0.10b |
| Cf3 | 1.62 ± 0.03b | 21.01 ± 0.32c | 16.11 ± 0.37b |
Means within columns with different superscripts are significantly different (p ≤ 0.05). CF1 = MF : AF : SF = 70 : 15 : 15. CF2 = MF : AF : SF = 70 : 20 : 10. CF3 = MF : AF : SF = 70 : 25 : 5.
Table 6.
Pancake texture evaluation made from wheat flour and composite flour.
| Sample | Hardness | Adhesiveness | Springiness | Cohesiveness | Chewiness | Resilience |
|---|---|---|---|---|---|---|
| Wheat flour | 2632.36 ± 232.56 ab | -14.19 ± 2.73bc | 0.99 ± 0.00a | 0.85 ± 0.01a | 2211.92 ± 206.55a | 0.66 ± 0.04a |
| P1 | 2698.16 ± 162.34a | -19.92 ± 3.51c | 0.98 ± 0.01b | 0.84 ± 0.00a | 2199.06 ± 112.78a | 0.62 ± 0.04a |
| P2 | 2372.49 ± 27.47 b | -17.24 ± 4.77bc | 0.98 ± 0.01ab | 0.83 ± 0.00a | 1926.63 ± 14.80b | 0.62 ± 0.04a |
| P3 | 2035.74 ± 64.56 c | -11.42 ± 0.20a | 0.98 ± 0.01ab | 0.84 ± 0.00a | 1677.32 ± 32.45c | 0.64 ± 0.04a |
Means within columns with different superscripts are significantly different (p ≤ 0.05). P1 = pancake formulation using composite flour 1. P2 = pancake formulation using composite flour 2. P3 = pancake formulation using composite flour 3.
Table 7.
Pancake color evaluation made from wheat flour and composite flour.
| Sample | L* | a* | b* | hue | Whiteness | ∆E |
|---|---|---|---|---|---|---|
| Wheat Flour | 52.20 ± 3.24a | 14.13 ± 1.35a | 37.77 ± 2.27a | 1.21 ± 0.05ab | 37.38 ± 1.41b | 0.00 ± 0.00d |
| P1 | 43.70 ± 1.64c | 12.11 ± 0.07b | 31.41 ± 2.58d | 1.20 ± 0.03ab | 34.36 ± 0.21c | 12.93 ± 1.18a |
| P2 | 47.06 ± 2.79bc | 13.74 ± 0.55a | 35.24 ± 1.63d | 1.20 ± 0.03b | 34.89 ± 1.47c | 5.27 ± 0.49c |
| P3 | 49.52 ± 0.56ab | 9.47 ± 0.78c | 29.89 ± 2.56d | 1.26 ± 0.02a | 40.54 ± 1.28a | 7.75 ± 0.52b |
Means within columns with different superscripts are significantly different (p ≤ 0.05).
Disclaimer/Publisher’s Note: The statements, opinions and data contained in all publications are solely those of the individual author(s) and contributor(s) and not of MDPI and/or the editor(s). MDPI and/or the editor(s) disclaim responsibility for any injury to people or property resulting from any ideas, methods, instructions or products referred to in the content. |
© 2023 by the authors. Licensee MDPI, Basel, Switzerland. This article is an open access article distributed under the terms and conditions of the Creative Commons Attribution (CC BY) license (http://creativecommons.org/licenses/by/4.0/).
Copyright: This open access article is published under a Creative Commons CC BY 4.0 license, which permit the free download, distribution, and reuse, provided that the author and preprint are cited in any reuse.
Submitted:
14 April 2023
Posted:
17 April 2023
You are already at the latest version
Alerts
A peer-reviewed article of this preprint also exists.
This version is not peer-reviewed
Submitted:
14 April 2023
Posted:
17 April 2023
You are already at the latest version
Alerts
Abstract
Pancakes are fast food snacks that are generally made with the basic ingredients of wheat flour, which is an imported commodity and detrimental for people who are allergic to gluten. To reduce the use of wheat, alternative raw materials derived from local commodities are used, such as modified cassava flour (mocaf), arrowroot flour, and suweg flour. The experiment was carried out by mixing mocaf flour, arrowroot flour, and suweg flour to produce composite flour with a ratio of 70:15:15 (CF1), 70:20:10 (CF2), and 70:20:5 (CF3). The result showed that the ratio of mocaf flour, arrowroot flour, and suweg flour had a significant effect on pasting temperature, peak viscosity, hold viscosity, breakdown viscosity, setback, L*, a*, hue, whiteness, ∆E, as well as swelling volume and solubility on the characteristics of the composite flour It also had a significant effect on the texture characteristics of hardness, adhesiveness, chewiness, color characteristics L*, a*, whiteness, ∆E, and preference for the flavor of gluten-free pancake products. It is known that the best formulation for the resulting pancake product is P1, with the addition of a 70% ratio of mocaf flour, 15% ratio of arrowroot tuber flour, and 15% ratio of suweg flour.
Keywords:
Subject: Chemistry and Materials Science - Materials Science and Technology
1. Introduction
Flour is a raw material that plays an important role in Indonesian food, and is widely used in food processing. The flour with the most use in Indonesia is wheat flour derived from wheat. Until now, Indonesia needs to import wheat to fulfill the high domestic demand for wheat. This is also due to the wheat plant which can only grow in subtropical regions. To reduce dependence on wheat imports which are increasing at increasingly inflated prices, development is needed in the food sector by seeking food diversification.
Another reason for the need for food diversification efforts for wheat flour is because of the gluten content in it. Gluten is a protein that can be found in wheat [1]. In products, the presence of gluten plays a role in the characteristics and stickiness of a dough, where gluten protein is responsible for cohesiveness, viscosity, and elasticity, and affects the water absorption capacity of the dough [2]. However, the presence of gluten in foodstuffs can cause disturbances in some people, one of which is celiac disease. Celiac disease is a digestive disorder, in which there are problems with the absorption of specific proteins in food products which are induced by the presence of gluten protein in some genetically susceptible people [3]. Regardless of age and race, as much as 1% of the human population suffers from celiac disease [4]. Apart from celiac disease, the presence of gluten in foodstuffs can also cause other disorders, such as non-celiac gluten sensitivity, dermatitis herpetiformis, gluten ataxia, and wheat allergy [5]. Therefore, alternative flour is needed to replace wheat flour.
Tubers are a source of carbohydrates, which can be processed into flour and become an alternative flour to replace wheat flour. Tuber flour has some advantages such as being gluten-free and its raw material being available in Indonesia. However, the absence of gluten content in flour also has drawbacks, the absence of gluten causes the resulting product to have characteristics that are not as good as products made from wheat flour. To improve the characteristics of non-gluten flours, they need to be modified. Several previous studies have reported that starch/flour modification treatment can improve its characteristics and expand its application in the food industry [6,7,8,9]. A previous study also reported that modification can improve the nutritional value of starch/flour [10,11]. For this reason, modifications were made to local tuber flour, namely cassava flour using the fermentation method. The lack of characteristics of modified cassava flour (mocaf) can also be covered by making composite flour, by combining mocaf flour with other local tuber flours such as arrowroot flour and suweg flour. The purpose of making composite flour to improve the characteristics of the flour produced, due the mixing between flours causes complementary properties.
One of the applications of composite flour is as an ingredient in gluten-free pancake production. Pancakes are fast food snacks with a flat round shape which are generally made with the basic ingredients of wheat flour. Pancakes with good quality have perfect swelling power, with dough that is always new to meet good quality standards. Pancakes are generally consumed as an easy and quick breakfast to make at home, by mixing flour with milk, eggs, sugar, and baking powder, then the dough is baked on a pan [12]. Based on research conducted by Shih et al. [13], making gluten-free pancakes with 100% rice flour as a base result in an unfavorable texture due to increased hardness when compared to pancakes made from wheat flour. Pancakes with a composition of 50% rice flour and 50% corn flour also produce unfavorable characteristics, in which pancakes with a brittle texture and thick yellow color are produced [14]. To produce pancakes that meet the functional characteristics of flour, as well as produce good characteristics and are liked by the panelists, it is necessary to find the appropriate ratio between mocaf flour, arrowroot tuber flour, and suweg flour.
2. Materials and Methods
2.1. Materials
The main ingredients used in this study were commercial wheat flour, commercial mocaf flour, arrowroot tuber with the age 7-8 months of planting, and suweg tuber with the age 10-12 months of planting. Arrowroot tuber was obtained from Ciamis, Indonesia, and suweg tuber was obtained from Madiun, Indonesia.
2.2. Arrowroot Flour Preparation
Arrowroot flour preparation was followed according to Marta et al. [15] with a slight modification. The arrowroot tubers are washed and peeled, then reduced in size using a food processor into small sizes with a thickness of 2-5 mm. The tuber slices are soaked in water to prevent enzymatic browning, then drained and dried in a cabinet oven at 60°C for 24 hours to reduce the water content. The dried tubers were then milled using a miller machine and then sieved using a 100-mesh sieve. Arrowroot flour that has been sifted is then packed in a tight plastic zip lock and given silica gel inside to prevent an increase in water content in the flour.
2.3. Suweg Flour Preparation
Suweg flour preparation was followed according to Marta et al. [15] with a slight modification. The suweg tubers are washed and peeled, then reduced in size using a food processor with a thickness of 2-5 mm. During the cutting process, the tuber slices must be soaked in water and all parts must be submerged to prevent enzymatic browning. The tuber slices were drained and dried in a cabinet oven at 60 °C for 24 hours. The dried suweg tubers were then milled using a miller machine, then sieved using a 100-mesh sieve. Suweg flour that has been sifted is then packed in a tight plastic zip lock and given silica gel inside to prevent an increase in the water content.
2.4. Composite Flour Preparation
Mocaf flour (MF), arrowroot flour (AF), and suweg flour (SF) were mixed and sieved to make it homogeneous as a composite flour (CF). For CF1 the ratio between flour is 70% mocaf flour, 15% arrowroot tuber flour, and 15% suweg flour, for CF2 70% mocaf flour, 20% arrowroot tuber flour, and 10% suweg flour, and for CF3 70% mocaf flour, 25% arrowroot tuber flour, and 5% suweg flour.
2.5. Pancake Preparation
Each formulation (CF1, CF2, and CF3) is added with other additional ingredients for making pancake products: 90 grams of powdered sugar, 9 grams of baking powder, and 26 grams of powdered milk [3], then mixed with 170 ml water and 1 beaten egg (± 50 grams). The mixing process is carried out until the dough becomes homogeneous. Next, cook the dough with a diameter of ± 8 cm in a pan over low heat for ± 3 minutes [3].
Table 1.
Pancake formulations.
| Formulation | Mocaf (g) | Arrowroot tuber (g) | Suweg (g) | Powdered Sugar (g) | Powdered Milk (g) | Baking Powder (g) | Egg (pcs) | Water (ml) |
|---|---|---|---|---|---|---|---|---|
| Pancake 1 (P1) | 70 | 15 | 15 | 90 | 26 | 9 | 1 | 170 |
| Pancake 2 (P2) | 70 | 20 | 10 | 90 | 26 | 9 | 1 | 170 |
| Pancake 3 (P3) | 70 | 25 | 5 | 90 | 26 | 9 | 1 | 170 |
2.6. Proximate and Crude Fiber Composition Analysis of Flours
The moisture, ash, total protein, fat, and total crude fiber content were determined using standard [16] methods.
2.7. Pasting Properties (RVA Analysis) of Flours
The pasting properties of the flour samples were determined using Rapid Visco Analyzer (RVA-SM2, Warriewood Australia). In an RVA tube, 2.8 g of flour samples were added with 25 mL of aquadest. The temperature was originally held at 50°C for 1 minute, then increased from 50 to 95°C at a rate of 6°C/min, held at 95°C for 5 minutes, and then decreased to 50°C at a rate of 6°C/min. After that, the gel was preserved at 50°C for 5 minutes.
2.8. Color Evaluation of Flours and Pancakes
The color scale for L*, a*, and b* of flour was measured using a Spectrophotometer CM-5 (Konica Minolta Co., Osaka, Japan) with Spectra Magic software. The color measurement includes L* (lightness, 0 = black/100 = white), a* (+a* = redness/-a* = greenness), b* (+b* = yellowness/-a* = blueness) and hue. The calibration was performed with a zero-calibration plate (CM-A124) and a white calibration plate (CM-A120) with a large target mask (CM-A203).
2.9. Water Absorption Capacity (WAC) Measurement of Flour
The water absorption capacity of the flour samples was determined according to Marta et al. [9]. A centrifuge tube containing one gram of flour was filled with 10 mL of water, allowed to remain at room temperature (26 ± 2°C) for one hour, and then centrifuged at 3500 x g for 30 minutes. The supernatant's amount was then calculated. The amount of water that could be absorbed by one gram of wheat was measured as mL as water absorption capacity.
2.10. Swelling Volume and Solubility Measurement of Flours
Swelling volume and solubility were determined according to Marta et al. [9]. The sample was suspended in 12.5 mL of water at a concentration of 0.35 g (db) and then mixed using a vortex for 30 seconds. The samples were centrifuged using a "Beckman Model TJ-6 Centrifuge" at 3500 x g (25°C, 30 minutes) after being kept in a water bath at 90°C for 20 minutes and cooled in cold water. The volume of the supernatant was measured to get the swelling volume result and then dried in an oven at 110°C for 24 hrs to measure the solubility of the samples.
2.11. Texture Evaluation (TPA) of Pancakes
Texture evaluation was measured using Texture Profile Analyzer (TA.XTExpress Stable Micro System) and exponent lite express software for data collection and calculation. The product was pressed using an aluminum cylinder probe P36R with a 2 kg load cell at a speed of 5 mm/s to a strain of 50%. The product texture profile including hardness, adhesiveness, springiness, cohesiveness, chewiness, and resilience was determined from exponent lite express software.
2.12. Hedonic Sensory Test of Pancakes
A hedonic sensory test of the pancake was conducted with 20 panelists with ages 18 to 25, male and female. Pancakes were presented as whole pieces, and placed on white plastic dishes coded with three-digit random numbers. Pancakes were evaluated based on the acceptability of their color, aroma, texture, taste, and overall appearance on a 5-point hedonic scale. The scale ranged from “extremely like” to “extremely dislike,” corresponding to the highest and lowest scores of “5” and “1” respectively [17].
2.13. Statistical analysis
Data were analyzed using one-way ANOVA, then followed by Duncan Test to detect differences. Significance was confirmed at P values <0.05.
3. Results
3.1. Proximate and Crude Fiber Composition
The proximate and crude fiber test results for wheat flour, mocaf flour, arrowroot tuber flour, suweg flour, and composite flour respectively are presented in Table 2.
All composite flours were not significantly different from each other in the parameters of moisture content, ash content, fat content, protein content, and crude fiber content, but all composite flours were significantly different from wheat flour (Table 2). The composite flour had a moisture content ranging from 10.05% to 10.87%, an ash content ranging from 2.40 %db to 2.45 %db, a fat content ranging from 0.36 %db to 0.56 %db, a protein content ranging from 1.74%db to 1.81%db, and a crude fiber content ranging from 1.38 %db to 1.50 %db. All composite flours had a lower moisture content, fat content, and protein content compared to wheat flour, but had a higher ash content and crude fiber content compared to wheat flour.
3.2. Pasting Properties
Amylographic tests were carried out to show the pasting properties of the starch paste and flour produced as well as changes in starch viscosity during the cooking process, which play an important role in flour applications in the food industry. The pasting properties of wheat flour, mocaf flour, arrowroot tuber flour, suweg flour, CF1, CF2, and CF3 are presented in Figure 1 and tabulated in Table 3.
All parameters of pasting properties of composite flours were significantly different from wheat flour (Table 3). Pasting temperature CF1 was a significant difference from CF3, where the pasting temperature increases with the increase of suweg flour (84.07 ºC). Peak viscosity between samples was significantly different, where mocaf flour had the highest peak viscosity (3351.33 cP) and CF1 had the lowest (2394.67 cP). The peak viscosity of composite flour is influenced by the ratio of the addition of arrowroot flour, where the higher the ratio of arrowroot flour, the higher the peak viscosity. This is due to arrowroot flour having a higher peak viscosity (2851.33 cP) when compared to suweg flour (2798.67 cP). Wheat flour has the lowest hold viscosity (935.67 cP) and breakdown viscosity (783.00 cP). The breakdown viscosity of composite flour is influenced by the ratio of arrowroot flour, where arrowroot flour has a higher breakdown viscosity (1483.00 cP) when compared to suweg flour (1093.33 cP). However, the addition of 25% of arrowroot flour can give a significant effect on breakdown viscosity, whereas the addition of 15% and 20% of arrowroot flour has not provided a significant difference. In contrast to breakdown viscosity, setback viscosity in composite flour is influenced by the ratio of suweg flour. This is because the setback viscosity of suweg flour has a significantly higher value (995.67 cP) when compared to arrowroot flour (436.00 cP). However, the addition of suweg flour only contributed significantly after the addition of 15%, whereas the addition of 10% and 5% did not have a significant effect on setback viscosity.
3.3. Color Evaluation of Flour
Color is one of the main determining factors that determine consumer acceptance [18]. The color of flour is influenced by several factors, such as flour preparation and the presence of macronutrients such as lipids and proteins [19]. The color of the flours is shown in Figure 2.
Testing the color characteristics of the flours is carried out with the CM-5 Spectrophotometer which will produce L, a*, and b* data which are color spaces defined by CIE (Commission International de I'Exlairage), and tabulated in Table 4.
CF3 has the highest L* (91.19) indicating a higher lightness, whereas CF1 has the lowest L* (89.58) compared to other composite flours. Similar results are also found in the whiteness index, whereas CF1 (70:15:15) has the lowest whiteness (86.16), while CF3 (70:25:5) has the highest whiteness index (87.27) when compared to other composite flours. However, when compared to all samples, suweg flour has the lowest lightness (81.64) and whiteness index (77.46), while mocaf flour shows the highest lightness (94.17) and whiteness index (88.63). The dark color of the suweg flour causes the suweg flour to have the largest ∆E (11.94) compared to all samples, which shows a very large difference when compared to wheat flour as a control.
CF1 (70:15:15) has the highest a* (1.06) which indicates a more reddish color, while CF3 (70:25:5) has the lowest a* (0.70) when compared to all composite flours. All composite flours were significantly different from one another, and significantly different from wheat flour, mocaf flour, arrowroot flour, and suweg flour. In contrast to a*, it is known that all composite flours were not significantly different in b*. All composite flours have a higher level of red color, but a lower level of yellow color compared to wheat flour.
3.3. Functional Properties
Functional properties are physicochemical properties that affect the behavior of components during the process of preparation, processing, storage, and consumption. The functional properties observed in this study include water absorption capacity (WAC), swelling volume, and solubility which are presented in Table 5.
The water absorption capacity (WAC) of the composite flour ranges from 1.62 g/g to 1.65 g/g, the swelling volume ranges from 21.01 ml/g to 25.33 ml/g, and solubility ranges from 12.86% to 16.20%. The WAC of CF1, CF2, and CF3 were not significantly different from each other, but significantly different from wheat flour (1.11 g/g). The swelling volume of all composite flours was significantly different from wheat flour. The WAC and swelling volume of the composite flours were significantly higher than wheat flour.
3.4. Texture Evaluation of Pancake
The texture is one important factor that will affect the final product of the resulting flour. The characteristics of the texture can be tested using the Texture Profile Analyzer (TPA) with the parameters of hardness, springiness, cohesiveness, adhesiveness, resilience, and chewiness (Table 6).
Compared to all gluten-free pancake products, P1 has the highest hardness and chewiness and is not significantly different from pancakes made from wheat flour. Apart from hardness and chewiness, P1 is also not significantly different compared to wheat flour’s pancake in adhesiveness. All pancake samples showed no significant differences in cohesiveness and resilience. Overall, the P1 pancake product has the most texture characteristics resembling wheat flour pancakes.
3.5. Color Evaluation of Pancakes
Color is the main attribute of the appearance of food products and is an important characteristic of their quality. Color is one of the determining indicators for consumers in purchasing a food product because it is a parameter that can be assessed directly before buying a product. The color of all pancake samples can be seen in Figure 3 and tabulated in Table 7.
Figure 2.
The visual appearance of pancakes with wheat flour (a), with 70% mocaf flour, 15% arrowroot tuber flour, and 15% suweg flour (b), with 70% mocaf flour, 20% arrowroot tuber flour, and 10% suweg flour (c), with 70% mocaf flour, 25% arrowroot tuber flour, and 5% suweg flour (d).
Figure 2.
The visual appearance of pancakes with wheat flour (a), with 70% mocaf flour, 15% arrowroot tuber flour, and 15% suweg flour (b), with 70% mocaf flour, 20% arrowroot tuber flour, and 10% suweg flour (c), with 70% mocaf flour, 25% arrowroot tuber flour, and 5% suweg flour (d).
P3 has the highest L* (49.52) which indicates a higher level of brightness, while P1 has the lowest L* (43.70) compared to all gluten-free pancakes. However, wheat flour still had the highest L* (52.20) when compared to all pancake products. All gluten-free pancake products have a* ranging from 9.47 to 13.74, whereas all gluten-free pancake products have a* that are significantly different from one another. P2 had the highest a* (13.74) compared to other gluten-free pancake products which stated a more reddish color and was not significantly different from wheat flour, while P3 (70:25:5) has the lowest b* (9.47). All gluten-free pancake products had lower red and yellow color levels compared to wheat flour.
3.5. Hedonic Sensory
Analysis of the organoleptic characteristics of pancake products was carried out using a hedonic test to determine the panelists' preference and acceptance of the products. The parameters in this hedonic test include color, aroma, texture, taste, and overall appearance. The score for this hedonic test is 1 (dislike very much), 2 (dislike), 3 (normal), 4 (like), and 5 (very like). The hedonic test was carried out on 20 panelists. The results of the panelists' preference for pancake products can be seen in Figure 4.
Pancakes made from wheat flour still had the preferred color, texture, flavor, and overall appearance. In terms of aroma, P1 has the most preferred aroma by the panelists. Overall, all pancake products have a score above 3, which indicates the product is acceptable to the panelists.
4. Discussion
Moisture content of the composite flours were found to be below the maximum required level (<14% w/w), so it is safe enough to prevent the growth of mold [18]. The ash content of composite flour is from 2.40% to 2.45%. Based on the research results, it is known that arrowroot flour has the highest ash content (5.34%) compared to all other samples, which was in line with Sudaryati et al. [20]. All composite flours were not significantly different from each other in the parameters of moisture content, ash content, fat content, protein content, and crude fiber content, which shows that the addition of a ratio of 5%, 10%, and 15% in arrowroot tuber flour and suweg flour does not have a significant effect to all composite flours.
The pasting properties are an important parameter to determine the characteristics of flour. All the composite flours had a higher pasting temperature compared to wheat flour. A higher pasting temperature of composite flours indicates a higher resistance to swelling and rupture [21]. On the peak viscosity, all samples differed significantly from one another. A high peak viscosity might be caused by a low amylose content, which encourages swelling of starch molecules and causes an increase in viscosity [22]. Peak viscosity correlates with the quality of the final product produced, where a high peak viscosity will give a good paste texture [23]. All the composite flours also showed a higher breakdown viscosity compared to wheat flour. Inversely correlated with hold viscosity and breakdown viscosity, composite flours have a lower final viscosity and setback viscosity. These results are in accordance with research conducted by Yulianti et al. [24], where the final viscosity of gluten-free composite flours shows lower results when compared to wheat flour. All composite flours have significantly lower setback than wheat flour. A lower setback for composite flours indicates a lower retrogradation tendency, which will affect the hardness of the resulting pancake product [25]. However, based on the data obtained, it is known that the hardness of pancakes is not significantly different between pancakes made from wheat flour with P1 and P2.
Color is also an important parameter to determine flour quality. The concentration of the suweg flour is affecting the color of all the composite flours, that the lightness gradually decreased when the concentration of the suweg flour (81.64) is higher. Based on previous research, it is known that suweg flour has a high phenolic content (17.66 mg GAE/g) [26], while arrowroot flour only has a phenolic content of 0.268 mg GAE/g [27]. Phenolics are compounds that are easily oxidized, which can cause discoloration due to the formation of oxidation products. The presence of high phenolic content in suweg flour causes the color to brown more quickly. In line with the level of lightness, the whiteness of all samples and all composite flours were significantly different from each other and decreased with the addition of the ratio of suweg flour, which was because the suweg flour had the lowest whiteness when compared to all samples (77.46).
Functional properties testing was also carried out to determine the properties of the flour to be used in making pancakes. The WAC of the composite flours (CF1, CF2, and CF3) were higher than wheat flour. High water binding capacity will increase the reconstitution ability and textural properties of the dough obtained [28]. This is in accordance with research conducted by Chandra & Samsher [29], where gluten-free flour has a higher WAC when compared to wheat flour. A high WAC indicates that flour can used in the formulation of several foods such as dough and bakery products [30]. Suweg flour has the highest WAC (2.01 g/g) compared to all samples. This is related to the high crude fiber content in suweg flour, where the fiber-rich dough causes higher water absorption [31]. Functional properties have a correlation with amylographic properties. When compared with amylographic properties, swelling volume is directly proportional to the peak viscosity [25]. This is consistent with the results of the study, where wheat flour has the lowest peak viscosity and swelling volume compared to all samples.
In pancake products, texture is the most important parameter to determine its quality. It is known that all gluten-free pancake products have significantly different hardness. Of all gluten-free pancakes, the hardnes of P1 and P2 are not significantly different from wheat flour pancakes. This shows that P1 and P2 have good texture characteristics in terms of hardness and resemble pancakes made from wheat flour. Hardness is affected by the difference in the ratio of adding suweg flour to composite flour. The hardness of the product increases with the addition of the suweg flour composition used, which indicates that the suweg flour affects the hardness of the resulting pancake product. This could be due to the high content of crude fiber in suweg flour, causing the hardness of the product to increase. In pancake products, springiness is the desired texture attribute [32]. Springiness is associated with the freshness of the product produced, where high quality products have a higher springiness [33]. It is known that P2 and P3 are not significantly different from wheat flour pancakes. Meanwhile P1 have a significantly lower springiness compared to pancake products made from wheat flour. Suweg flour contains resistant starch which can increase the viscosity of the dough and the resulting final product. In addition, suweg flour also contains a high crude fiber which can give a chewy texture to the resulting product. Based on the research results, it is known that P2 and P3 had a lower chewiness when compared to wheat flour pancake products. In contrast to springiness, an increase in chewiness is undesirable for pancake products. This is because the increased chewiness of pancake products causes the final pancake product to have a texture that is too chewy and has lost its soft texture [32]. P1 had a chewiness that is not significantly different from pancake made from wheat flour, which shows good characteristics and resembles wheat flour.
Color is one of the determining indicators for consumers in purchasing a food product, so that it becomes one of the criteria that needs to be considered to determine the acceptability of the resulting pancake product. It is known that P3 has the highest L* (49.52) which indicates a higher level of brightness, while P1 has the lowest L* (43.70). This is because P3 has the highest ratio of arrowroot flour addition, which is 25%. The higher the ratio of arrowroot flour added, the product with higher brightness will be produced. This is consistent with research by Lestari et al. [34], where the addition of the highest arrowroot flour ratio (30%) resulted in cookies with the highest brightness. However, pancake made from wheat flour still had the highest L* (52.20) when compared to all pancake products. The same result as flour color evaluation, the concentration of suweg flour affects the color of the pancake product, where the L* decreases when suweg flour concentration is higher. This is due to the basic color of the suweg flour which is dark brown, which will affect the final product [35]. All gluten-free pancake has lower red and yellow color levels when compared to wheat flour. The presence of red and yellow colors in flour can be influenced by the presence of chemical compositions such as fats and proteins [19]. This is consistent with the data obtained, where all composite flour has lower fat and protein compared to wheat flour. Calculations were also made for the whiteness of pancake products to determine the level of whiteness of the final product. It is known that P3 (70:25:5) has the highest whiteness (40.54), while P1 (70:15:15) has the lowest whiteness (34.36). Similar to the lightness, the whiteness is affected by the ratio of the addition of suweg flour, where the more the ratio of suweg flour added, the lower the whiteness will be. In the ∆E calculation, P1 has the highest ∆E compared to other gluten-free pancake products, which indicates a greater color difference when compared to pancake products made from wheat flour. Meanwhile P2 has the smallest ∆E which shows less difference compared to wheat flour pancakes.
In terms of panelist preferences, it is known that all pancake products are acceptable to panelists. The textural preference of gluten-free pancake products is influenced by the addition of arrowroot flour ratio, where P1 with the lowest ratio of arrowroot flour addition was not significantly different when compared to pancake products made from wheat flour, while P2 and P3 had significant differences. The addition of an arrowroot flour ratio of 15% gives the texture characteristics of pancake products giving a firm texture, but remains smooth when consumed. P1 had the highest preference over other gluten-free pancakes, and had a more favorable aroma than wheat flour-based pancakes.
5. Conclusions
The conclusion obtained from this study is that the ratio of the use of mocaf flour, arrowroot flour, and suweg flour had a significant effect on pasting temperature, peak viscosity, hold viscosity, breakdown viscosity, setback, L*, a*, hue, whiteness, ∆E , as well as swelling volume and solubility on the characteristics of the flour composition. The ratio of the use of mocaf flour, arrowroot flour, and suweg flour also had a significant effect on the texture characteristics of hardness, adhesiveness, chewiness, color characteristics L*, a*, whiteness, ∆E, and preference for the aroma of the resulting gluten-free pancake product. It is known that the best formulation for the resulting pancake product is P1, with the addition of 70% ratio of mocaf flour, 15% ratio of arrowroot tuber flour, and 15% ratio of suweg flour with characteristics and organoleptics hardness texture 2698.16, springiness texture 0.98, chewiness texture 2199.06, L* 43.70, a* 12.11, b* 31.41, organoleptic taste 3.76, organoleptic color 3.33, organoleptic texture 3.71, aroma organoleptic 3.67, and overall appearance organoleptic 3.62.
Author Contributions
Conceptualization, H.M. and Y.C.; methodology, H.M. and H.R.A.; software, C.F.; validation, H.M., Y.C. and H.R.A.; formal analysis, C.F. and F.F.; investigation, D.S and Y.C.; resources, F.F. and D.S.; data curation, H.M. and Y.C.; writing—original draft preparation, H.M. and C.F.; writing—review and editing. H.R.A. and Y.C.; visualization. F.F.; supervision. H.M., Y.C. and H.R.A.; project administration. H.M., F.F., and D.S. All authors have read and agreed to the published version of the manuscript.
Funding
This research was funded by Grant of Ministry of Education, Culture, Research, and Technology (MoECRT), Republic of Indonesia [grant number: 2393/UN6.3.1/PT.00/2022] and The APC was funded by Universitas Padjadjaran.
Data Availability Statement
Not applicable.
Acknowledgments
Not applicable.
Conflicts of Interest
The authors declare no conflict of interest.
References
- García-García, A.; Madrid, R.; Sohrabi, H.; de la Cruz, S.; García, T.; Martín, R.; González, I. A Sensitive and Specific Real-Time PCR Targeting DNA from Wheat, Barley and Rye to Track Gluten Contamination in Marketed Foods. Lwt 2019, 114, 108378. [CrossRef]
- Ortolan, F.; Steel, C.J. Protein Characteristics That Affect the Quality of Vital Wheat Gluten to Be Used in Baking: A Review. Comprehensive Reviews in Food Science and Food Safety 2017, 16, 369–381. [CrossRef]
- Rakmai, J.; Haruthaithanasan, V.; Chompreeda, P.; Chatakanonda, P.; Yonkoksung, U. Development of Gluten-Free and Low Glycemic Index Rice Pancake: Impact of Dietary Fiber and Low-Calorie Sweeteners on Texture Profile, Sensory Properties, and Glycemic Index. Food Hydrocolloids for Health 2021, 1, 100034. [CrossRef]
- Bascuñán, K.A.; Vespa, M.C.; Araya, M. Celiac Disease: Understanding the Gluten-Free Diet. European Journal of Nutrition 2017, 56, 449–459. [CrossRef]
- Dale, H.F.; Biesiekierski, J.R.; Lied, G.A. Non-Coeliac Gluten Sensitivity and the Spectrum of Gluten-Related Disorders: An Updated Overview. Nutrition Research Reviews 2019, 32, 28–37. [CrossRef]
- Marta, H.; Cahyana, Y.; Bintang, S.; Soeherman, G.P.; Djali, M. Physicochemical and Pasting Properties of Corn Starch as Affected by Hydrothermal Modification by Various Methods. International Journal of Food Properties 2022, 25, 792–812. [CrossRef]
- Marta, H.; Cahyana, Y.; Djali, M.; Pramafisi, G. The Properties, Modification, and Application of Banana Starch. Polymers 2022, 14, 1–20. [CrossRef]
- Marta, H.; Hasya, H.N.L.; Lestari, Z.I.; Cahyana, Y.; Arifin, H.R.; Nurhasanah, S. Study of Changes in Crystallinity and Functional Properties of Modified Sago Starch (Metroxylon Sp.) Using Physical and Chemical Treatment. Polymers 2022, 14. [CrossRef]
- Marta, H.; Cahyana, Y.; Arifin, H.R.; Khairani, L. Comparing the Effect of Four Different Thermal Modifications on Physicochemical and Pasting Properties of Breadfruit (Artocarpus Altilis) Starch. International Food Research Journal 2019, 26, 269–276.
- Marta, H.; Cahyana, Y.; Djali, M. Densely Packed-Matrices of Heat Moisture Treated-Starch Determine the Digestion Rate Constant as Revealed by Logarithm of Slope Plots. Journal of Food Science and Technology 2021, 58, 2237–2245. [CrossRef]
- Marta, H.; Cahyana, Y.; Djali, M. Pectin Interaction with Thermally Modified Starch Affects Physicochemical Properties and Digestibility of Starch as Revealed by Logarithm of Slop Plot. CYTA - Journal of Food 2021, 19, 63–71. [CrossRef]
- Yamashita, S.; Matsumiya, K.; Kogo, Y.; Takamatsu, K.; Matsumura, Y. Emulsifiers Efficiently Prevent Hardening of Pancakes under Refrigerated Conditions via Inclusion Complexes with Starch Molecules. Food Hydrocolloids 2020, 100, 105432. [CrossRef]
- Shih, F.F.; Truong, V.D.; Daigle, K.W. Physicochemical Properties of Gluten-Free Pancakes from Rice and Sweet Potato Flours. Journal of Food Quality 2006, 29, 97–107. [CrossRef]
- Kiprushkina, E.I.; Golovinskaia, O. V.; Ovsyuk, E.A.; Baklanova, V. V.; Alekseeva, L.A.; Tulina, A.K.; Beloded, V.R.; Shestopalova, I.A. Pancakes for a Healthy Diet: Low-Carb, Prebiotic, Gluten-Free. Agronomy Research 2020, 18, 2410–2424. [CrossRef]
- Marta, H.; Cahyana, Y.; Djali, M.; Arcot, J.; Tensiska, T. A Comparative Study on the Physicochemical and Pasting Properties of Starch and Flour from Different Banana (Musa Spp.) Cultivars Grown in Indonesia. International Journal of Food Properties 2019, 22, 1562–1575. [CrossRef]
- AOAC Official Method of Analysis. Arlington: AOAC International. 2005.
- Cahyana, Y.; Rangkuti, A.; Siti Halimah, T.; Marta, H.; Yuliana, T. Application of Heat-Moisture-Treated Banana Flour as Composite Material in Hard Biscuit. CYTA - Journal of Food 2020, 18, 599–605. [CrossRef]
- Sumardiono, S.; Jos, B.; Antoni, M.F.Z.; Nadila, Y.; Handayani, N.A. Physicochemical Properties of Novel Artificial Rice Produced from Sago, Arrowroot, and Mung Bean Flour Using Hot Extrusion Technology. Heliyon 2022, 8, e08969. [CrossRef]
- Sholichah, E.; Deswina, P.; Sarifudin, A.; Andriansyah, C.E.; Rahman, N. Physicochemical, Structural and Morphological Properties of Some Arrowroot (Maranta Arundinacea) Accessions Growth in Indonesia. AIP Conference Proceedings 2019, 2175. [CrossRef]
- Sudaryati, E.; Nasution, E.; Ardiani, F. Nutritional Quality of Bread from Mixture of Arrowroot Flour (Marantha Arundinacea L.) and Wheat Flour. 2018, 9, 186–189. [CrossRef]
- Kumar, R.; Khatkar, B.S. Thermal, Pasting and Morphological Properties of Starch Granules of Wheat (Triticum Aestivum L.) Varieties. Journal of Food Science and Technology 2017, 54, 2403–2410. [CrossRef]
- Qadir, N.; Wani, I.A. Functional Properties, Antioxidant Activity and in-Vitro Digestibility Characteristics of Brown and Polished Rice Flours of Indian Temperate Region. Grain and Oil Science and Technology 2022. [CrossRef]
- Alamu, E.O.; Maziya-Dixon, B.; Dixon, A.G. Evaluation of Proximate Composition and Pasting Properties of High Quality Cassava Flour (HQCF) from Cassava Genotypes (Manihot Esculenta Crantz) of β-Carotene-Enriched Roots. Lwt 2017, 86, 501–506. [CrossRef]
- Yulianti, L.E.; Afifah, N.; Ekafitri, R. Physicochemical and Pasting Properties of Composite Flours for Making Gluten-Free Bread. AIP Conference Proceedings 2019, 2175. [CrossRef]
- Ayetigbo, O.; Latif, S.; Abass, A.; Müller, J. Preparation, Optimization and Characterization of Foam from White-Flesh and Yellow-Flesh Cassava (Manihot Esculenta) for Powder Production. Food Hydrocolloids 2019, 97, 105205. [CrossRef]
- Shete, C.C.; Wadkar, S.S.; Gaikwad, N.B.; Patil, K.S.; Ghosh, J.S. Phenolic Contents and Antioxidant Capacity of Amorphophallus Commutatus and Amorphophallus Paeonifolius. International Food Research Journal 2015, 22, 1939–1944.
- Ieamkheng, S.; Santibenchakul, S.; Sooksawat, N. Potential of Maranta Arundinacea Residues for Recycling: Analysis of Total Phenolic, Flavonoid, and Tannin Contents. Biodiversitas 2022, 23, 1204–1210. [CrossRef]
- Adebowale, A.A.; Adegoke, M.T.; Sanni, S.A.; Adegunwa, M..; Fetuga, G.O. Functional Properties and Biscuit Making Potentials of Sorghum-Wheat Flour Composite. American Journal of Food Technology 2012, 7, 372–379.
- Chandra, S.; Samsher Assessment of Functional Properties of Different Flours. African Journal of Agricultural Research 2013, 8, 4849–4852. [CrossRef]
- Chandra, S.; Singh, S.; Kumari, D. Evaluation of Functional Properties of Composite Flours and Sensorial Attributes of Composite Flour Biscuits. Journal of Food Science and Technology 2015, 52, 3681–3688. [CrossRef]
- Kaur, R.; Kaur, M. Microstructural, Physicochemical, Antioxidant, Textural and Quality Characteristics of Wheat Muffins as Influenced by Partial Replacement with Ground Flaxseed. Lwt 2018, 91, 278–285. [CrossRef]
- Kumar, P.K.; Parhi, A.; Sablani, S.S. Development of High-Fiber and Sugar-Free Frozen Pancakes: Influence of State and Phase Transitions on the Instrumental Textural Quality of Pancakes during Storage. Lwt 2021, 146, 111454. [CrossRef]
- Valcarcel, M.; Ghatak, R.; Bhaduri, S.; Navder, K.P. Physical, Textural and Sensory Characteristics of Gluten-Free Muffins Prepared with Teff Flour (Eragrostis Tef (Zucc) Trotter). Journal of the Academy of Nutrition and Dietetics 2012, 112, A58. [CrossRef]
- Lestari, L.A.; Huriyati, E.; Marsono, Y. The Development of Low Glycemic Index Cookie Bars from Foxtail Millet (Setaria Italica), Arrowroot (Maranta Arundinacea) Flour, and Kidney Beans (Phaseolus Vulgaris). Journal of Food Science and Technology 2017, 54, 1406–1413. [CrossRef]
- Sofyan, A.; Ikhsani, A.Y.; Purwani, E.; Hasanah, L.E.N.; Febriyadin, F. The Effect of Suweg (Amorphophallus Paeoniifolius) Flour and Incubation Temperature on Characteristics of Yogurt with the Addition of Bifidobacterium Bifidum as Probiotic. Materials Today: Proceedings 2022, 63, S507–S512. [CrossRef]
Figure 1.
Pasting properties of wheat flour (A), mocaf flour (B), arrowroot flour (C), suweg flour (D), and composite flours CF1 (E), CF2 (F), CF3 (G), temperature profile (H).
Figure 1.
Pasting properties of wheat flour (A), mocaf flour (B), arrowroot flour (C), suweg flour (D), and composite flours CF1 (E), CF2 (F), CF3 (G), temperature profile (H).
Figure 2.
Visual appearance of wheat flour (a), mocaf flour (b), arrowroot tuber flour (c), suweg flour (d), and composite flour CF1 (e), CF2 (f), and CF3 (g).
Figure 2.
Visual appearance of wheat flour (a), mocaf flour (b), arrowroot tuber flour (c), suweg flour (d), and composite flour CF1 (e), CF2 (f), and CF3 (g).
Figure 4.
Organoleptic parameters of pancakes.
Table 2.
Proximate composition of wheat flour, mocaf flour, arrowroot tuber flour, suweg flour, and composite flours.
Table 2.
Proximate composition of wheat flour, mocaf flour, arrowroot tuber flour, suweg flour, and composite flours.
| Sample | Water (%db) | Ash (%db) |
Fat (%db) |
Protein (%db) | Crude fiber (%db) |
|---|---|---|---|---|---|
| WF | 14.52 ± 0.16a | 0.69 ± 0.01e | 1.36 ± 0.43a | 10.55 ± 0.18a | 0.38 ± 0.15e |
| MF | 14.33 ± 0.25a | 1.46 ± 0.20d | 1.05 ± 0.06ab | 1.13 ± 0.22d | 1.18 ± 0.09d |
| AF | 7.32 ± 0.05c | 5.34 ± 0.02a | 0.54 ± 0.28bc | 4.40 ± 0.10b | 1.79 ± 0.05b |
| SF | 10.21 ± 0.71b | 4.05 ± 0.06b | 0.53 ± 0.34bc | 4.44 ± 0.06b | 3.15 ± 0.25a |
| CF1 | 10.87 ± 0.25b | 2.45 ± 0.07c | 0.56 ± 0.01bc | 1.75 ± 0.07c | 1.38 ± 0.01cd |
| CF2 | 10.26 ± 0.83b | 2.40 ± 0.02c | 0.36 ± 0.07c | 1.74 ± 0.05c | 1.50 ± 0.01bc |
| CF3 | 10.05 ± 0.10b | 2.43 ± 0.02c | 0.43 ± 0.20bc | 1.81 ± 0.10c | 1.44 ± 0.13cd |
Means within columns with different superscripts are significantly different (p ≤ 0.05). CF1 = MF : AF : SF = 70 : 15 : 15. CF2 = MF : AF : SF = 70 : 20 : 10. CF3 = MF : AF : SF = 70 : 25 : 5.
Table 3.
Pasting properties of wheat flour, mocaf flour, arrowroot tuber flour, suweg flour, and composite flours.
Table 3.
Pasting properties of wheat flour, mocaf flour, arrowroot tuber flour, suweg flour, and composite flours.
| Sample | Pasting Temperature (oC) | Peak Viscosity (cP) | Hold Viscosity (cP) | Final Viscosity (cP) | Breakdown (cP) | Setback (cP) |
|---|---|---|---|---|---|---|
| WF | 64.91 ± 0.60e | 1718.67 ± 4.93g | 935.67 ± 14.50e | 1943.00 ± 24.06c | 783.00 ± 10.15f | 1007.33 ± 9.71a |
| MF | 73.17 ± 0.24d | 3351.33 ± 17.79a | 1312.00 ± 39.40bc | 2042.33 ± 10.02b | 2039.33 ± 56.22a | 730.33 ± 34.93b |
| AF | 76.62 ± 0.04b | 2851.33 ± 29.87b | 1368.67 ± 55.64b | 1804.33 ± 98.54d | 1483.00 ± 25.24b | 436.00 ± 45.92e |
| SF | 84.07 ± 0.15a | 2798.67 ± 10.97c | 1705.33 ± 55.23a | 2701.00 ± 12.12a | 1093.33 ± 47.26e | 995.67 ± 53.93a |
| CF1 | 74.06 ± 0.47c | 2394.67 ± 38.03f | 1191.67 ± 14.01d | 1806.67 ± 36.12d | 1203.00 ± 24.02d | 615.00 ± 22.11c |
| CF2 | 73.79 ± 0.10cd | 2445.67 ± 15.50e | 1264.00 ± 5.20c | 1813.00 ± 16.46d | 1181.67 ± 12.86d | 549.00 ± 19.47d |
| CF3 | 73.24 ± 0.47d | 2632.00 ± 24.56d | 1245.67 ± 44.64cd | 1772.67 ± 6.03d | 1386.33 ± 39.80c | 527.00 ± 33.63d |
Means within columns with different superscripts are significantly different (p ≤ 0.05). CF1 = MF : AF : SF = 70 : 15 : 15. CF2 = MF : AF : SF = 70 : 20 : 10. CF3 = MF : AF : SF = 70 : 25 : 5.
Table 4.
Color evaluation of wheat flour, mocaf flour, arrowroot flour, suweg flour, and composite flours.
Table 4.
Color evaluation of wheat flour, mocaf flour, arrowroot flour, suweg flour, and composite flours.
| Sample | L* | a* | b* | hue | Whiteness | ∆E |
|---|---|---|---|---|---|---|
| WF | 93.09 ± 0.21b | 0.45 ± 0.01e | 9.81 ± 0.12c | 1.53 ± 0.00a | 87.99 ± 0.03b | 0.00 ± 0.00f |
| MF | 94.17 ± 0.16a | 0.43 ± 0.02e | 9.75 ± 0.13c | 1.53 ± 0.00a | 88.63 ± 0.07a | 1.09 ± 0.31e |
| AF | 89.48 ± 0.21e | -0.36 ± 0.02f | 11.35 ± 0.16b | -1.54 ± 0.00f | 84.52 ± 0.12f | 4.01 ± 0.27b |
| SF | 81.64 ± 0.42f | 1.78 ± 0.02a | 12.96 ± 0.28a | 1.43 ± 0.00e | 77.46 ± 0.18g | 11.94 ± 0.19a |
| CF1 | 89.58 ± 0.37e | 1.06 ± 0.01b | 9.04 ± 0.03d | 1.45 ± 0.00d | 86.16 ± 0.28e | 3.65 ± 0.51b |
| CF2 | 90.37 ± 0.16d | 0.88 ± 0.03c | 9.13 ± 0.26d | 1.47 ± 0.00c | 86.70 ± 0.28d | 2.84 ± 0.34c |
| CF3 | 91.19 ± 0.05c | 0.70 ± 0.03d | 9.17 ± 0.27d | 1.49 ± 0.00b | 87.27 ± 0.22c | 2.03 ± 0.19d |
Means within columns with different superscripts are significantly different (p ≤ 0.05). CF1 = MF : AF : SF = 70 : 15 : 15. CF2 = MF : AF : SF = 70 : 20 : 10. CF3 = MF : AF : SF = 70 : 25 : 5.
Table 5.
Functional properties of wheat flour, mocaf flour, arrowroot tuber flour, suweg flour, and composite flours.
Table 5.
Functional properties of wheat flour, mocaf flour, arrowroot tuber flour, suweg flour, and composite flours.
| Sample | WAC (g/g) | Swelling Volume (ml/g) | Solubility (%) |
|---|---|---|---|
| WF | 1.11 ± 0.13d | 11.52 ± 0.31e | 14.17 ± 2.00c |
| MF | 1.68 ± 0.01b | 16.65 ± 0.24d | 9.20 ± 0.36d |
| AF | 1.48 ± 0.04c | 22.19 ± 0.42b | 19.05 ± 0.36a |
| SF | 2.01 ± 0.07a | 16.55 ± 0.22d | 17.35 ± 0.17b |
| CF1 | 1.63 ± 0.03b | 25.33 ± 0.62a | 12.86 ± 0.80c |
| CF2 | 1.65 ± 0.02b | 21.10 ± 0.16c | 16.20 ± 0.10b |
| Cf3 | 1.62 ± 0.03b | 21.01 ± 0.32c | 16.11 ± 0.37b |
Means within columns with different superscripts are significantly different (p ≤ 0.05). CF1 = MF : AF : SF = 70 : 15 : 15. CF2 = MF : AF : SF = 70 : 20 : 10. CF3 = MF : AF : SF = 70 : 25 : 5.
Table 6.
Pancake texture evaluation made from wheat flour and composite flour.
| Sample | Hardness | Adhesiveness | Springiness | Cohesiveness | Chewiness | Resilience |
|---|---|---|---|---|---|---|
| Wheat flour | 2632.36 ± 232.56 ab | -14.19 ± 2.73bc | 0.99 ± 0.00a | 0.85 ± 0.01a | 2211.92 ± 206.55a | 0.66 ± 0.04a |
| P1 | 2698.16 ± 162.34a | -19.92 ± 3.51c | 0.98 ± 0.01b | 0.84 ± 0.00a | 2199.06 ± 112.78a | 0.62 ± 0.04a |
| P2 | 2372.49 ± 27.47 b | -17.24 ± 4.77bc | 0.98 ± 0.01ab | 0.83 ± 0.00a | 1926.63 ± 14.80b | 0.62 ± 0.04a |
| P3 | 2035.74 ± 64.56 c | -11.42 ± 0.20a | 0.98 ± 0.01ab | 0.84 ± 0.00a | 1677.32 ± 32.45c | 0.64 ± 0.04a |
Means within columns with different superscripts are significantly different (p ≤ 0.05). P1 = pancake formulation using composite flour 1. P2 = pancake formulation using composite flour 2. P3 = pancake formulation using composite flour 3.
Table 7.
Pancake color evaluation made from wheat flour and composite flour.
| Sample | L* | a* | b* | hue | Whiteness | ∆E |
|---|---|---|---|---|---|---|
| Wheat Flour | 52.20 ± 3.24a | 14.13 ± 1.35a | 37.77 ± 2.27a | 1.21 ± 0.05ab | 37.38 ± 1.41b | 0.00 ± 0.00d |
| P1 | 43.70 ± 1.64c | 12.11 ± 0.07b | 31.41 ± 2.58d | 1.20 ± 0.03ab | 34.36 ± 0.21c | 12.93 ± 1.18a |
| P2 | 47.06 ± 2.79bc | 13.74 ± 0.55a | 35.24 ± 1.63d | 1.20 ± 0.03b | 34.89 ± 1.47c | 5.27 ± 0.49c |
| P3 | 49.52 ± 0.56ab | 9.47 ± 0.78c | 29.89 ± 2.56d | 1.26 ± 0.02a | 40.54 ± 1.28a | 7.75 ± 0.52b |
Means within columns with different superscripts are significantly different (p ≤ 0.05).
Disclaimer/Publisher’s Note: The statements, opinions and data contained in all publications are solely those of the individual author(s) and contributor(s) and not of MDPI and/or the editor(s). MDPI and/or the editor(s) disclaim responsibility for any injury to people or property resulting from any ideas, methods, instructions or products referred to in the content. |
© 2023 by the authors. Licensee MDPI, Basel, Switzerland. This article is an open access article distributed under the terms and conditions of the Creative Commons Attribution (CC BY) license (http://creativecommons.org/licenses/by/4.0/).
Copyright: This open access article is published under a Creative Commons CC BY 4.0 license, which permit the free download, distribution, and reuse, provided that the author and preprint are cited in any reuse.
Amorphophallus konjac: A Novel Alternative Flour on Gluten-Free Bread
Fernanda Laignier
et al.
Foods,
2021
Possibilities to Use Germinated Lupine Flour as an Ingredient in Breadmaking to Improve the Final Product Quality
Denisa Atudorei
et al.
Agronomy,
2022
Exploring the Potential of Andean Crops for the Production of Gluten-Free Muffins
Diego Salazar
et al.
Agronomy,
2021


MDPI Initiatives
Important Links
© 2024 MDPI (Basel, Switzerland) unless otherwise stated