1. Introduction
The reckless use of primary energy such as oil, coal, natural gas, and nuclear power due to advanced industrialization has led to the depletion of fossil fuels and environmental problems caused by global warming. As a result, the productivity and technological importance of the energy industry have become very important. In particular, for countries that need to import resources and convert them into secondary energy to produce electricity, efficient development based on economic stability is essential [
1,
2,
3].
One of the most influential equipments in power plants, the condenser plays a role in increasing efficiency by rotating the turbine and generator with high-pressure and high-temperature steam and is very important for energy production because it reuses steam.
In the literature, studies have been conducted to improve the performance of capacitors by utilizing various parameters. Ibrahim et al. studied the effect of the fouling of condenser tubes on thermal performance in nuclear power plants and found that an increase in fouling factor causes a decrease in thermal efficiency and power loss [
4]. Alabrudzinski et al. performed simulations based on computational fluid dynamics (CFD) analysis using the fouling thermal resistance value according to the fouling growth rate measurement results and turbine operating conditions. They found that the thermal resistance of fouling reduces the output of the turbine and that even an old condenser can affect the output of the turbine [
5]. Pattanayak et al. analyzed various parameters that affect the efficiency of steam condensers through simulation models based on thermodynamic theory. They derived the cooling water temperature that can maintain the optimal condenser pressure and found that as the cooling water temperature increases, the heat rate of the power cycle decreases [
6]. Mohammadaliha et al. developed a new air-to-liquid cross-flow heat exchanger model to analyze the effect of thermal conductivity on overall efficiency in condenser heat exchangers. They found that materials with excellent corrosion resistance and low-cost materials have low thermal characteristics that affect performance and that if materials with a thermal conductivity value of less than 0.5 W/m
K are used, the efficiency of heat recovery systems is significantly reduced [
7]. Gadhamshetty et al. used a new approach, a cooling water heat energy storage system, to improve the performance degradation due to ambient temperature rise, which is a disadvantage of air-cooled condensers (ACC) environmentally compared to water-cooled condensers in heat dissipation. They confirmed that power loss can be reduced through thermodynamic modeling and simulation [
8].
Most power plants use seawater as a coolant, which introduces various impurities and foreign substances such as seaweed and fish eggs into the seawater. This provides an environment for microbial growth, and the impurities adhere to the surface of the condenser tube, reducing the heat exchange performance of the condenser and increasing the exhaust pressure of the steam turbine, which can cause safety issues and lead to a decrease in power generation efficiency and power production efficiency [
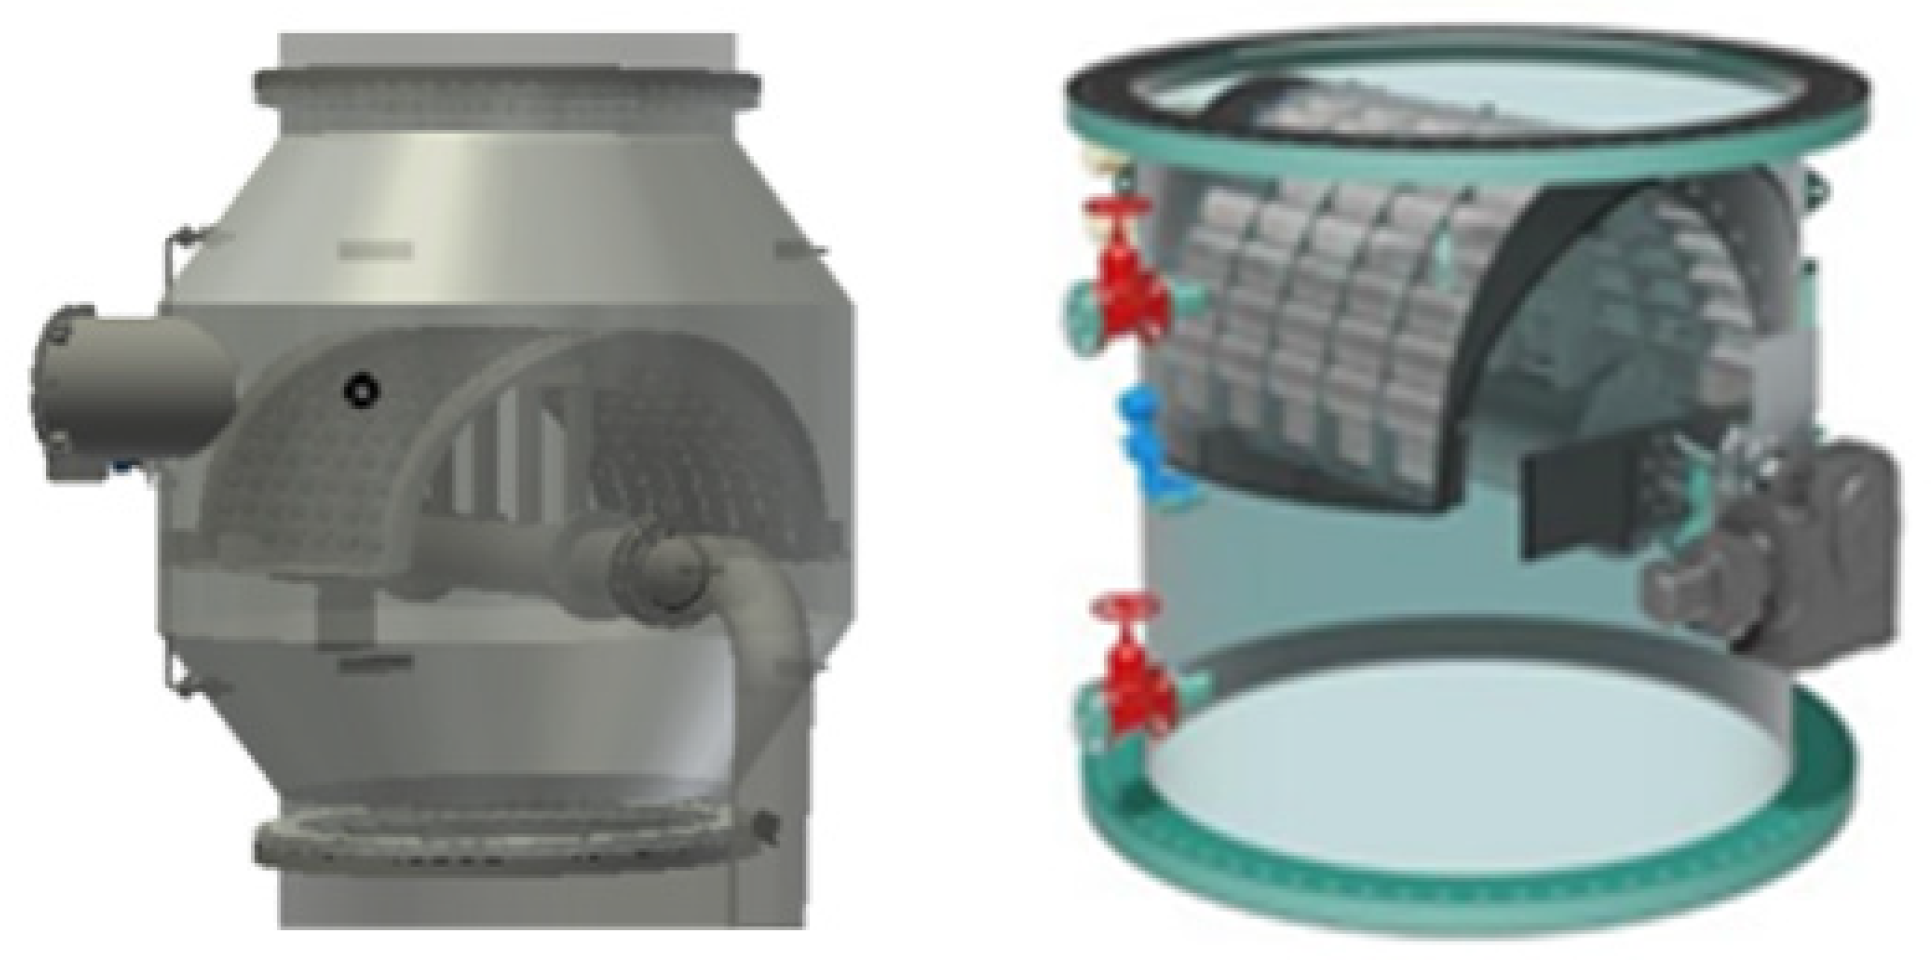
9]. To solve this, as shown in
Figure 1, the DF is installed in front of the condenser to filter the seawater. The DF is composed of screen, rotor, and hopper. It filters foreign substances contained in seawater using a screen and absorbs and removes the various foreign substances that accumulate using a rotor and hopper. However, in this process, foreign substances that are filtered by the screen and accumulate can create a differential pressure. This can decrease the flow rate of cooling water flowing into the condenser, which leads to a decrease in the heat exchange efficiency of the condenser and the stability of the circulating water pump [
10,
11].
Until recently, research to improve condenser heat exchange performance has pri-marily focused on improving the recovery and circulation rate of sponge balls and reduc-ing ball loss, by considering the flow characteristics of the CTCS in which the sponge balls are applied [
12,
13,
14]. Jung et al. conducted the DF flow tests for two types of DF, P-grid and G-grid, using 18 types of debris. They found that the G-grid filter design showed better performance than the P-grid design because it provided a smaller flow area and higher grid strap than the P-grid design [
15]. In addition, Walker et al. analyzed the economic impact of fouling on the condenser to analyze the cleaning system for economic cost analysis and found that increasing the cleaning frequency can reduce additional fuel costs due to fouling [
16]. In another work, Chae et al. conducted an experimental study to maintain the efficiency of plate heat exchangers while eliminating the inconvenience of cleaning operations and measured the recovery rate according to changes in flow rate within the tube and changes in cleaning time and recovery time [
1]. Kim et al. conducted an experiment-based study to solve the stability problem caused by excessive vibration during circulating water pump operation. They revealed how the operating characteristics of the DF affected the natural vibration of the pump, and suggested ways to reduce vibration [
17].
In this study, research was conducted to improve the performance of the CTCS equipped with a DF that is currently installed in existing power plants. Due to the pressure drop caused by fluid pressure, which limits the stability of the fluid pump and the efficiency of heat exchange, numerical analysis was performed to analyze the flow characteristics inside the system’s pipes and identify factors affecting pressure drop and fluid resistance. It was confirmed that the pressure drop caused by the screen that filters out the DF and external substances is a factor that affects it, and by analyzing the correlation between the shape of the screen that can minimize pressure drop and the size of the perforated plate, we derived an optimal screen shape according to DF size through CFD analysis. In addition, the effects of the presence or absence of the filter on flow characteristics and differential pressure performance in the pipe according to each initial flow rate condition were compared and analyzed, and the velocity, pressure, and TKE distribution in the pipe according to flow rate were examined for comparison and analysis.
2. Numerical analysis method
2.1. Numerical analysis target and design conditions
This study was conducted to investigate the effect of the presence or absence of the DF, and the flow velocity on the differential pressure and TKE. A numerical analysis modeling was performed using a 14-inch DF that was actually in use, as shown in
Figure 2 (a). The height of the mid-plate and the size of the perforated plate for fixing the screen were set to 30 mm. Fluid analysis was conducted using commercial code and the fluid region of
Figure 2(a) was extracted to create mesh for analysis. Water-liquid was applied as the working fluid. In addition, as shown in
Figure 2 (b), to derive the results of velocity, pressure, and TKE, the vertical direction (H) was set at an interval of 0.06 m, and the horizontal direction (L) was set at 0.333 m intervals from the bottom of the inlet in the center plane of the pipe. Each of the points used for measuring flow characteristics is plotted in this figure and The conditions were set with the goal of establishing a numerical analytical database for the shape.
2.2. Governing Equations for Numerical Analysis
As the governing equations for flow analysis, continuity equations, momentum equations, and energy equations were applied, and they are expressed as the following equations.
In equations (1) to (3),
,
, and
represent the speed in the
,
, and
directions, respectively,
is the density, and
is the coefficient of kinematic viscosity. For the turbulence model, the shear-stress transport (SST) model suitable for the
model-based flow separation simulation is applied, and the flow field is calculated based on the TKE (
) and energy-specific dissipation rate (
) equations.
represents the generation of the TKE due to the velocity gradient, and is the energy-specific dissipation rate () generation term. , and mean the effective diffusion of and due to turbulence, , and are the dissipation terms of and due to turbulence, , and are user-defined terms, and the Eddy viscosity in the turbulence model is calculated.
2.3. Verification of Numerical Analysis Results
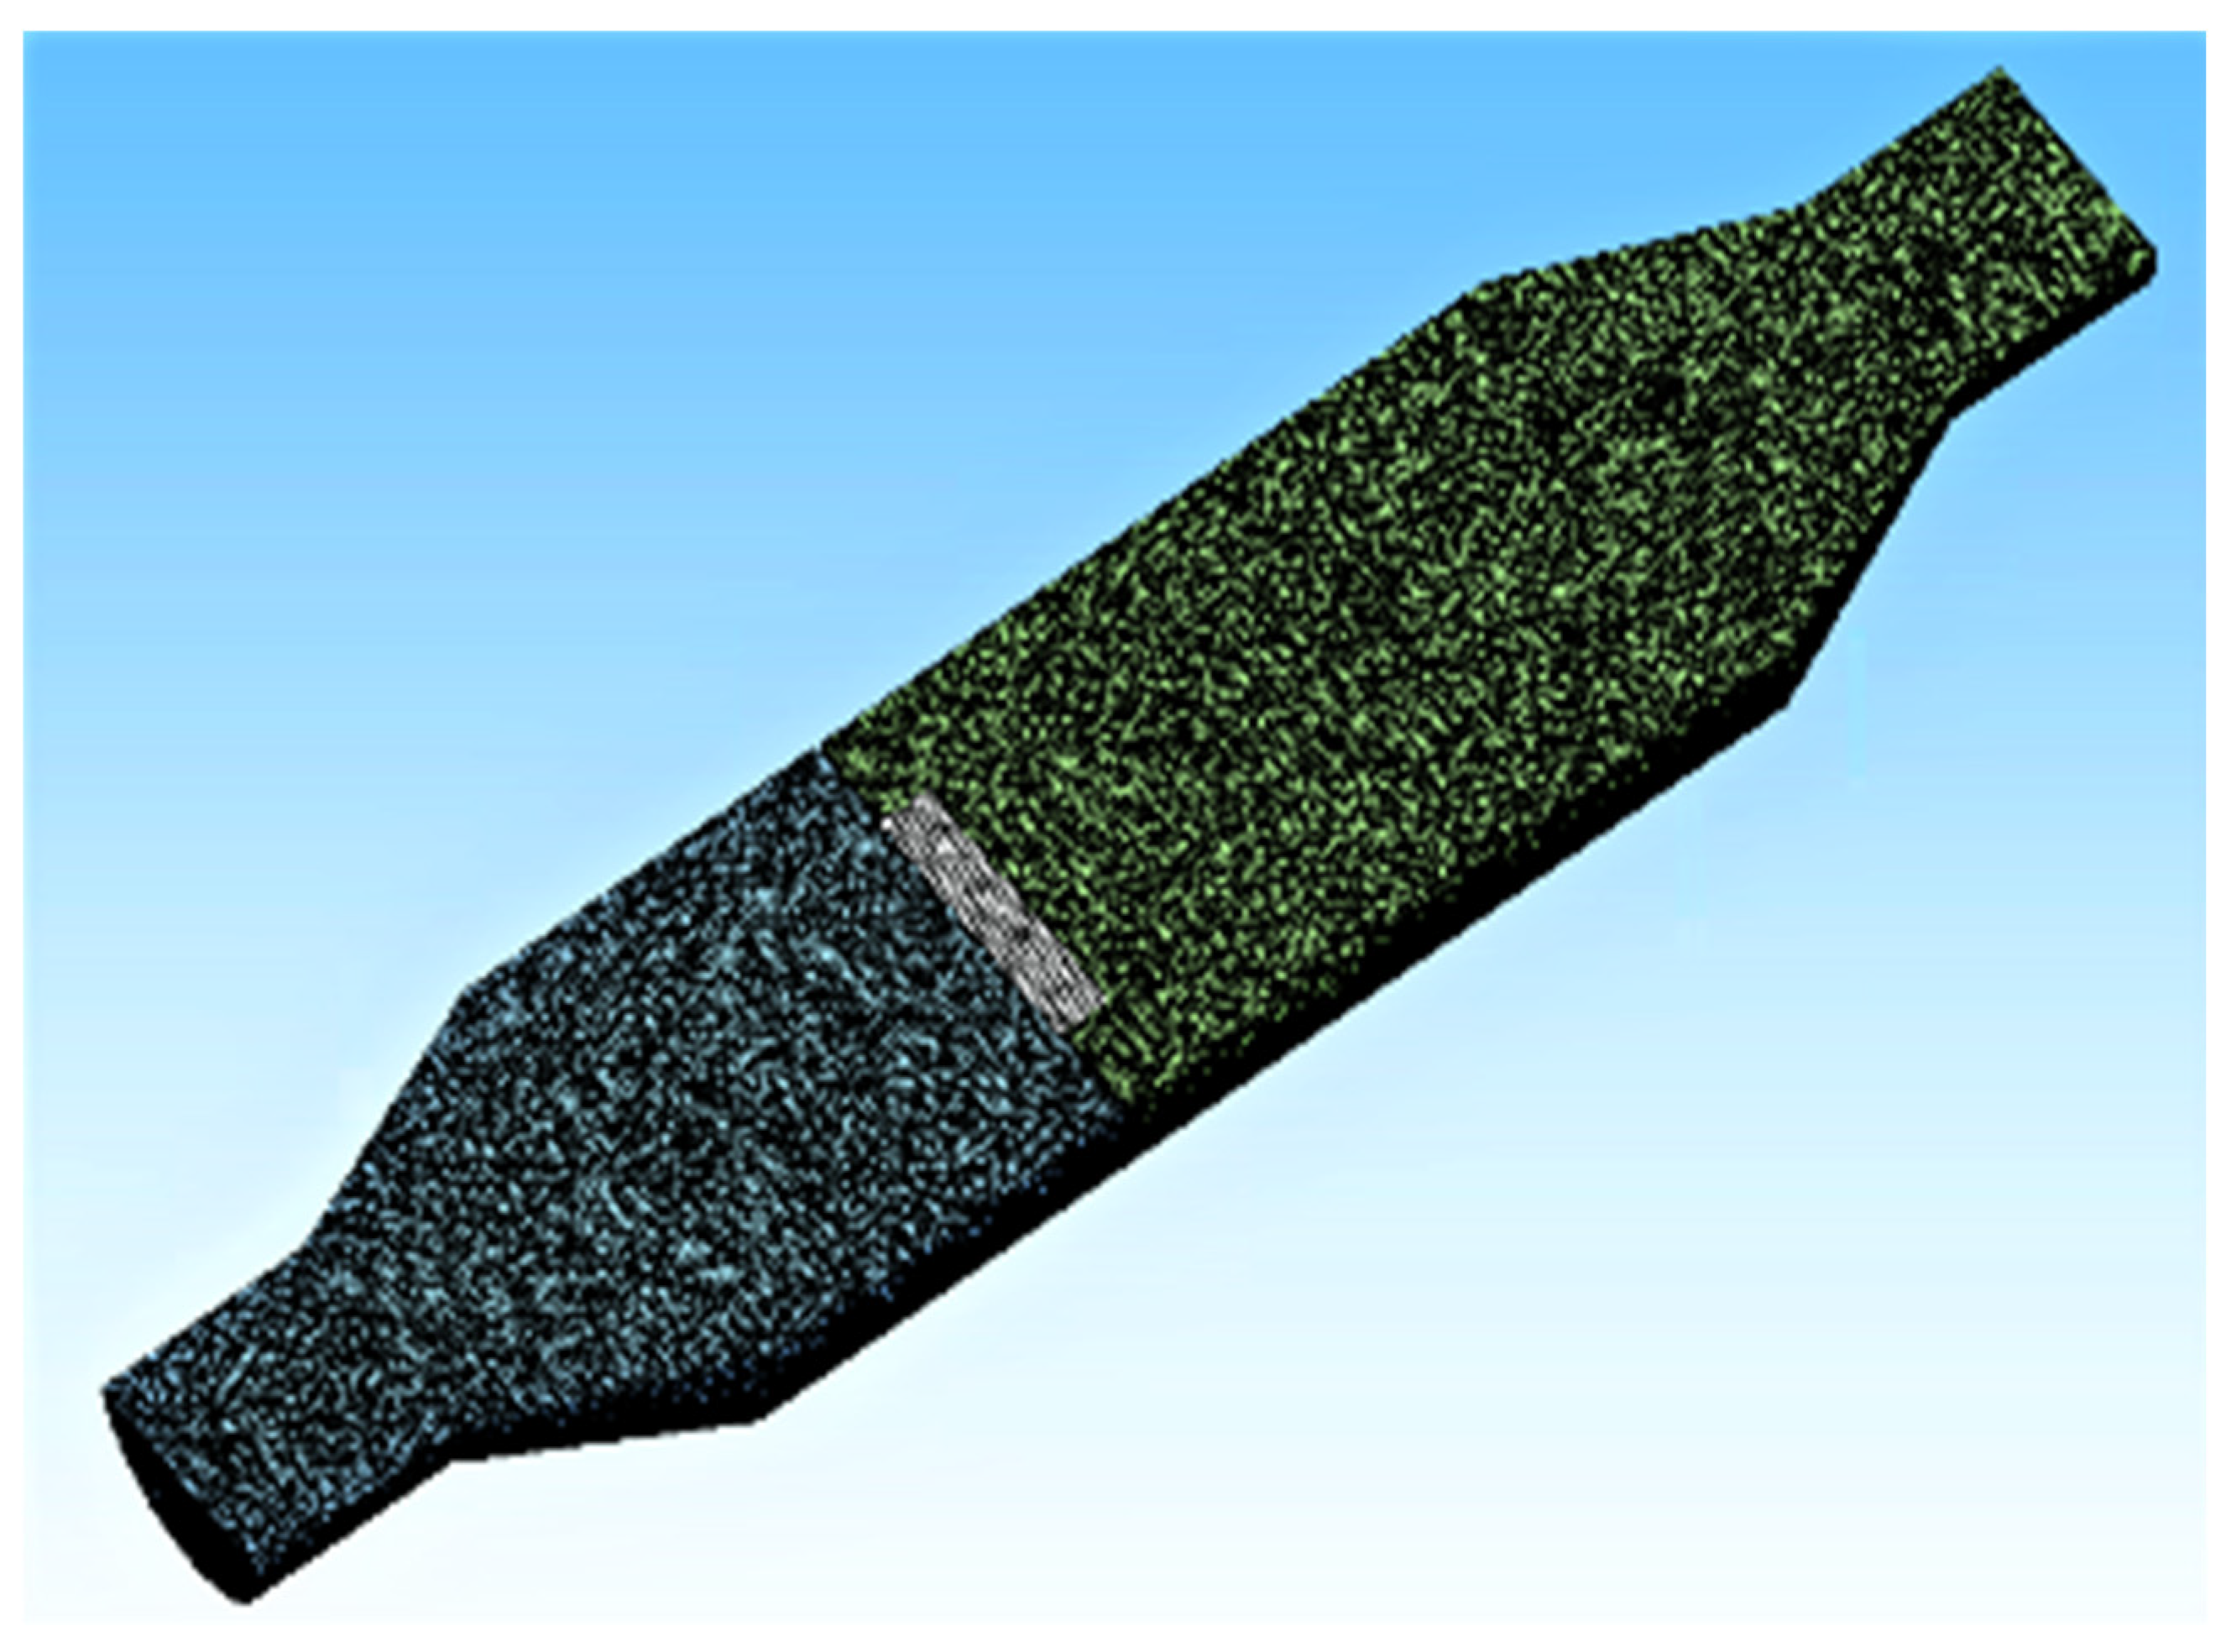
Before numerical analysis, about 1.3 million tetra meshes were generated by extracting the fluid area in the pipe to which a 14-inch DF was applied. Detailed information about the mesh applied to the numerical analysis is shown in
Table 1 and
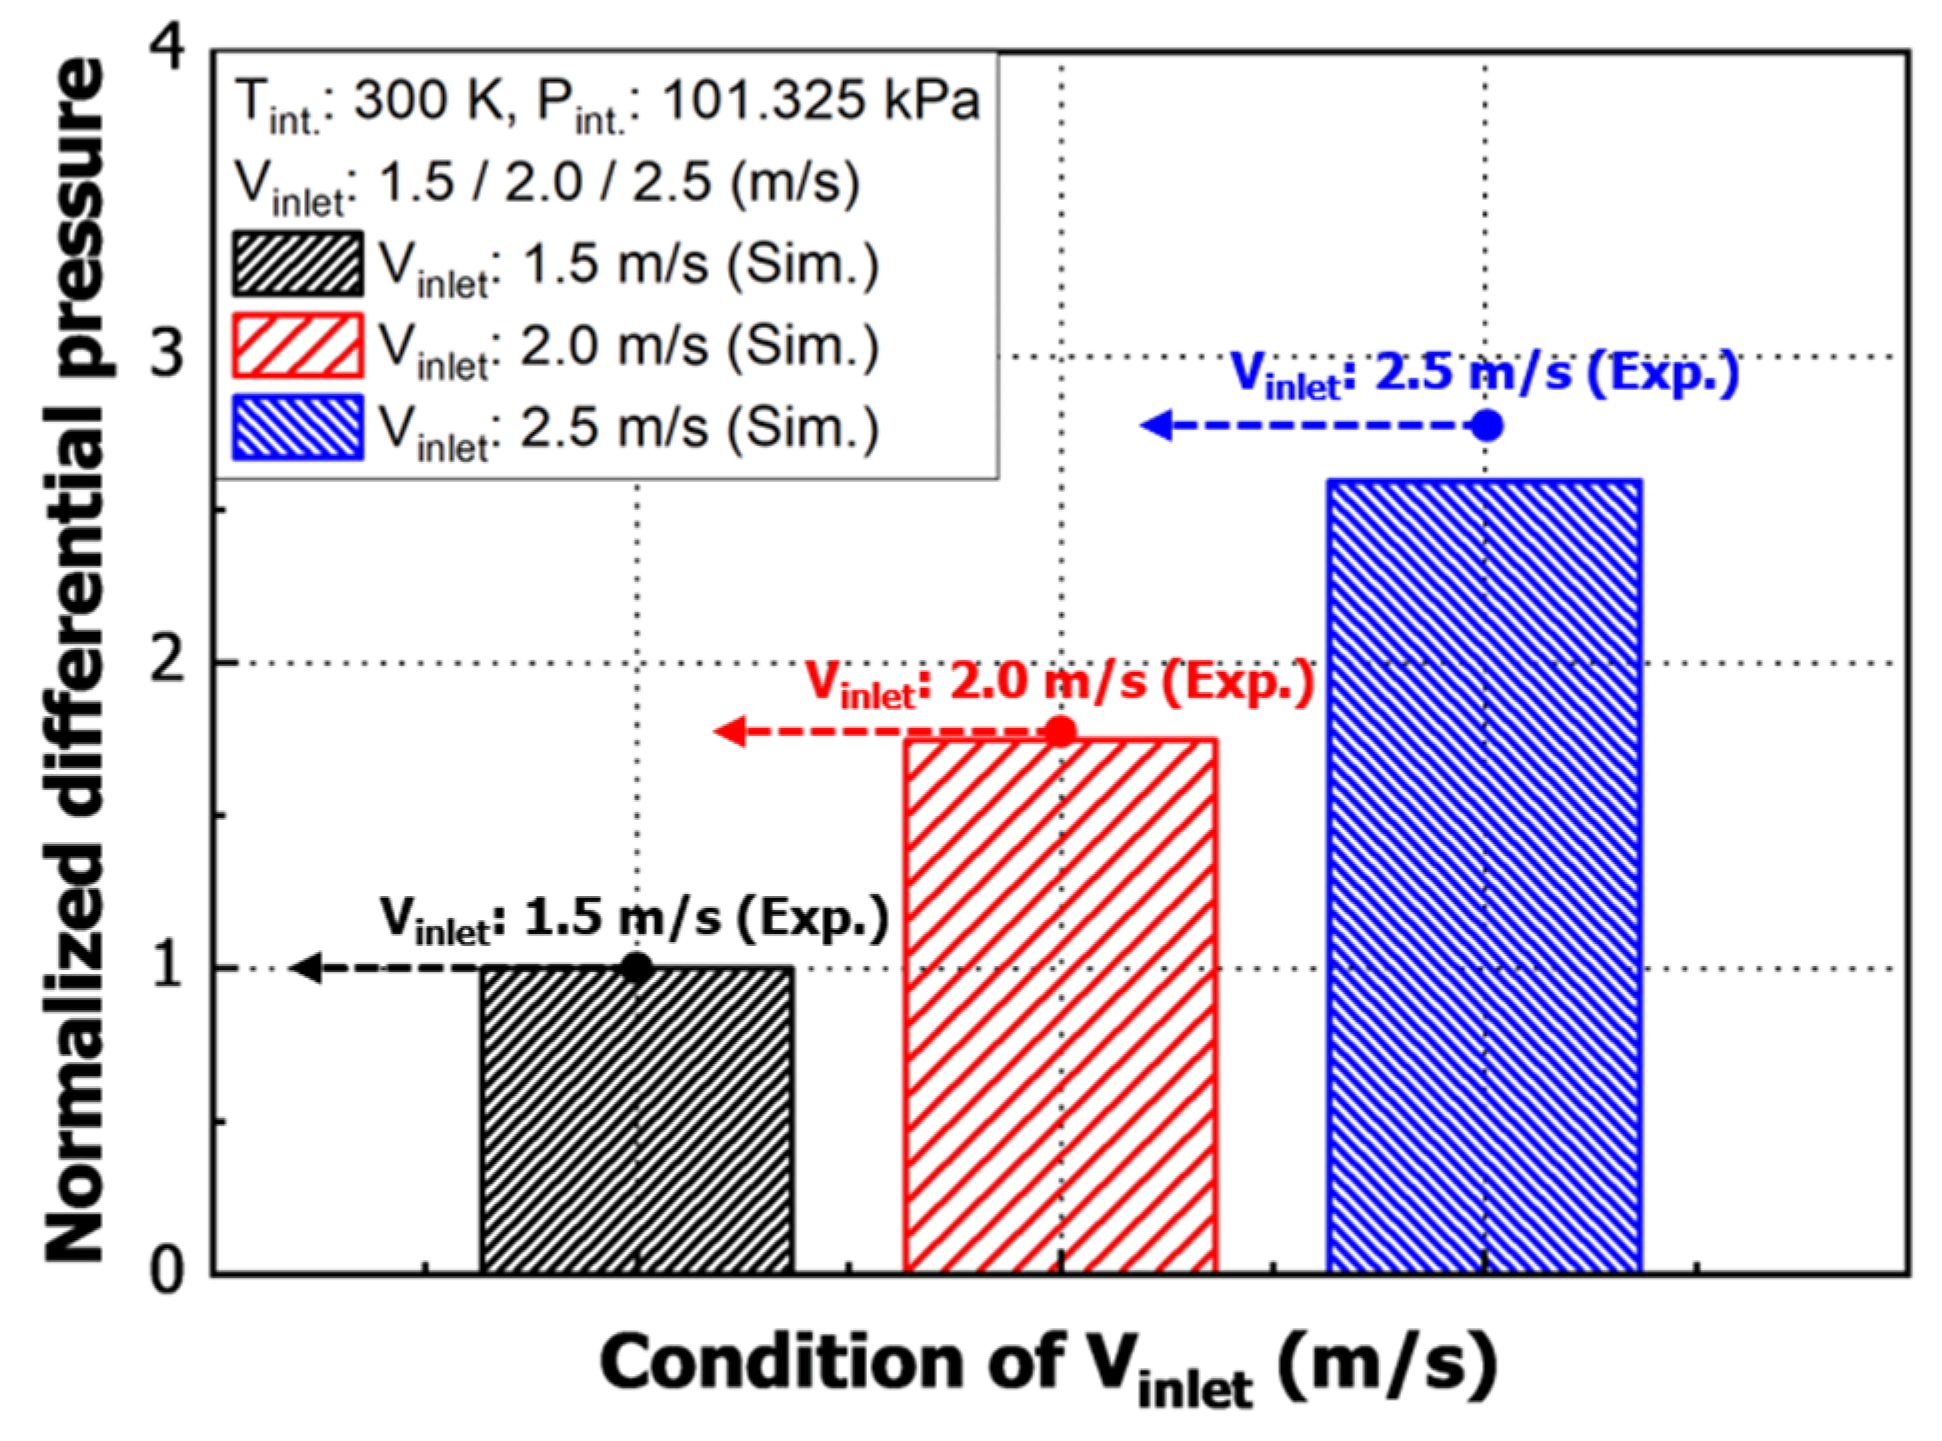
Figure 3. Based on the differential pressure results for each flow velocity obtained in the experiment, the differential pressure displayed by the screen (perforated plate) in the DF was simulated to be the viscous resistance value of a porous zone, similar to the experimental value. The normalized differential pressure results are shown in
Figure 4. After normalization, it was confirmed that at the highest initial flow velocity of 2.5 m/s, the maximum error was 6.99%, and the experimental values and the trend of numerical analysis were the same in all flow rate conditions. Accordingly, it was judged that the reliability of this study was secure.
2.4. Numerical Analysis Conditions
Steady-state analysis was carried out by applying the analysis conditions shown in
Table 2, based on the grid used to verify the analysis results. To analyze the TKE and differential pressure characteristics in the presence or absence of the DF, a numerical analysis was performed on the pipe of the CTCS with or without 14-inch DF cases. The working fluid was set as water-liquid, and the flow rates were 1.5 m/s, 2.0 m/s, and 2.5 m/s. Then the flow characteristics in the CTCS were compared and analyzed according to the flow rates.
3. Numerical analysis results
3.1. Effect of the DF on flow rate
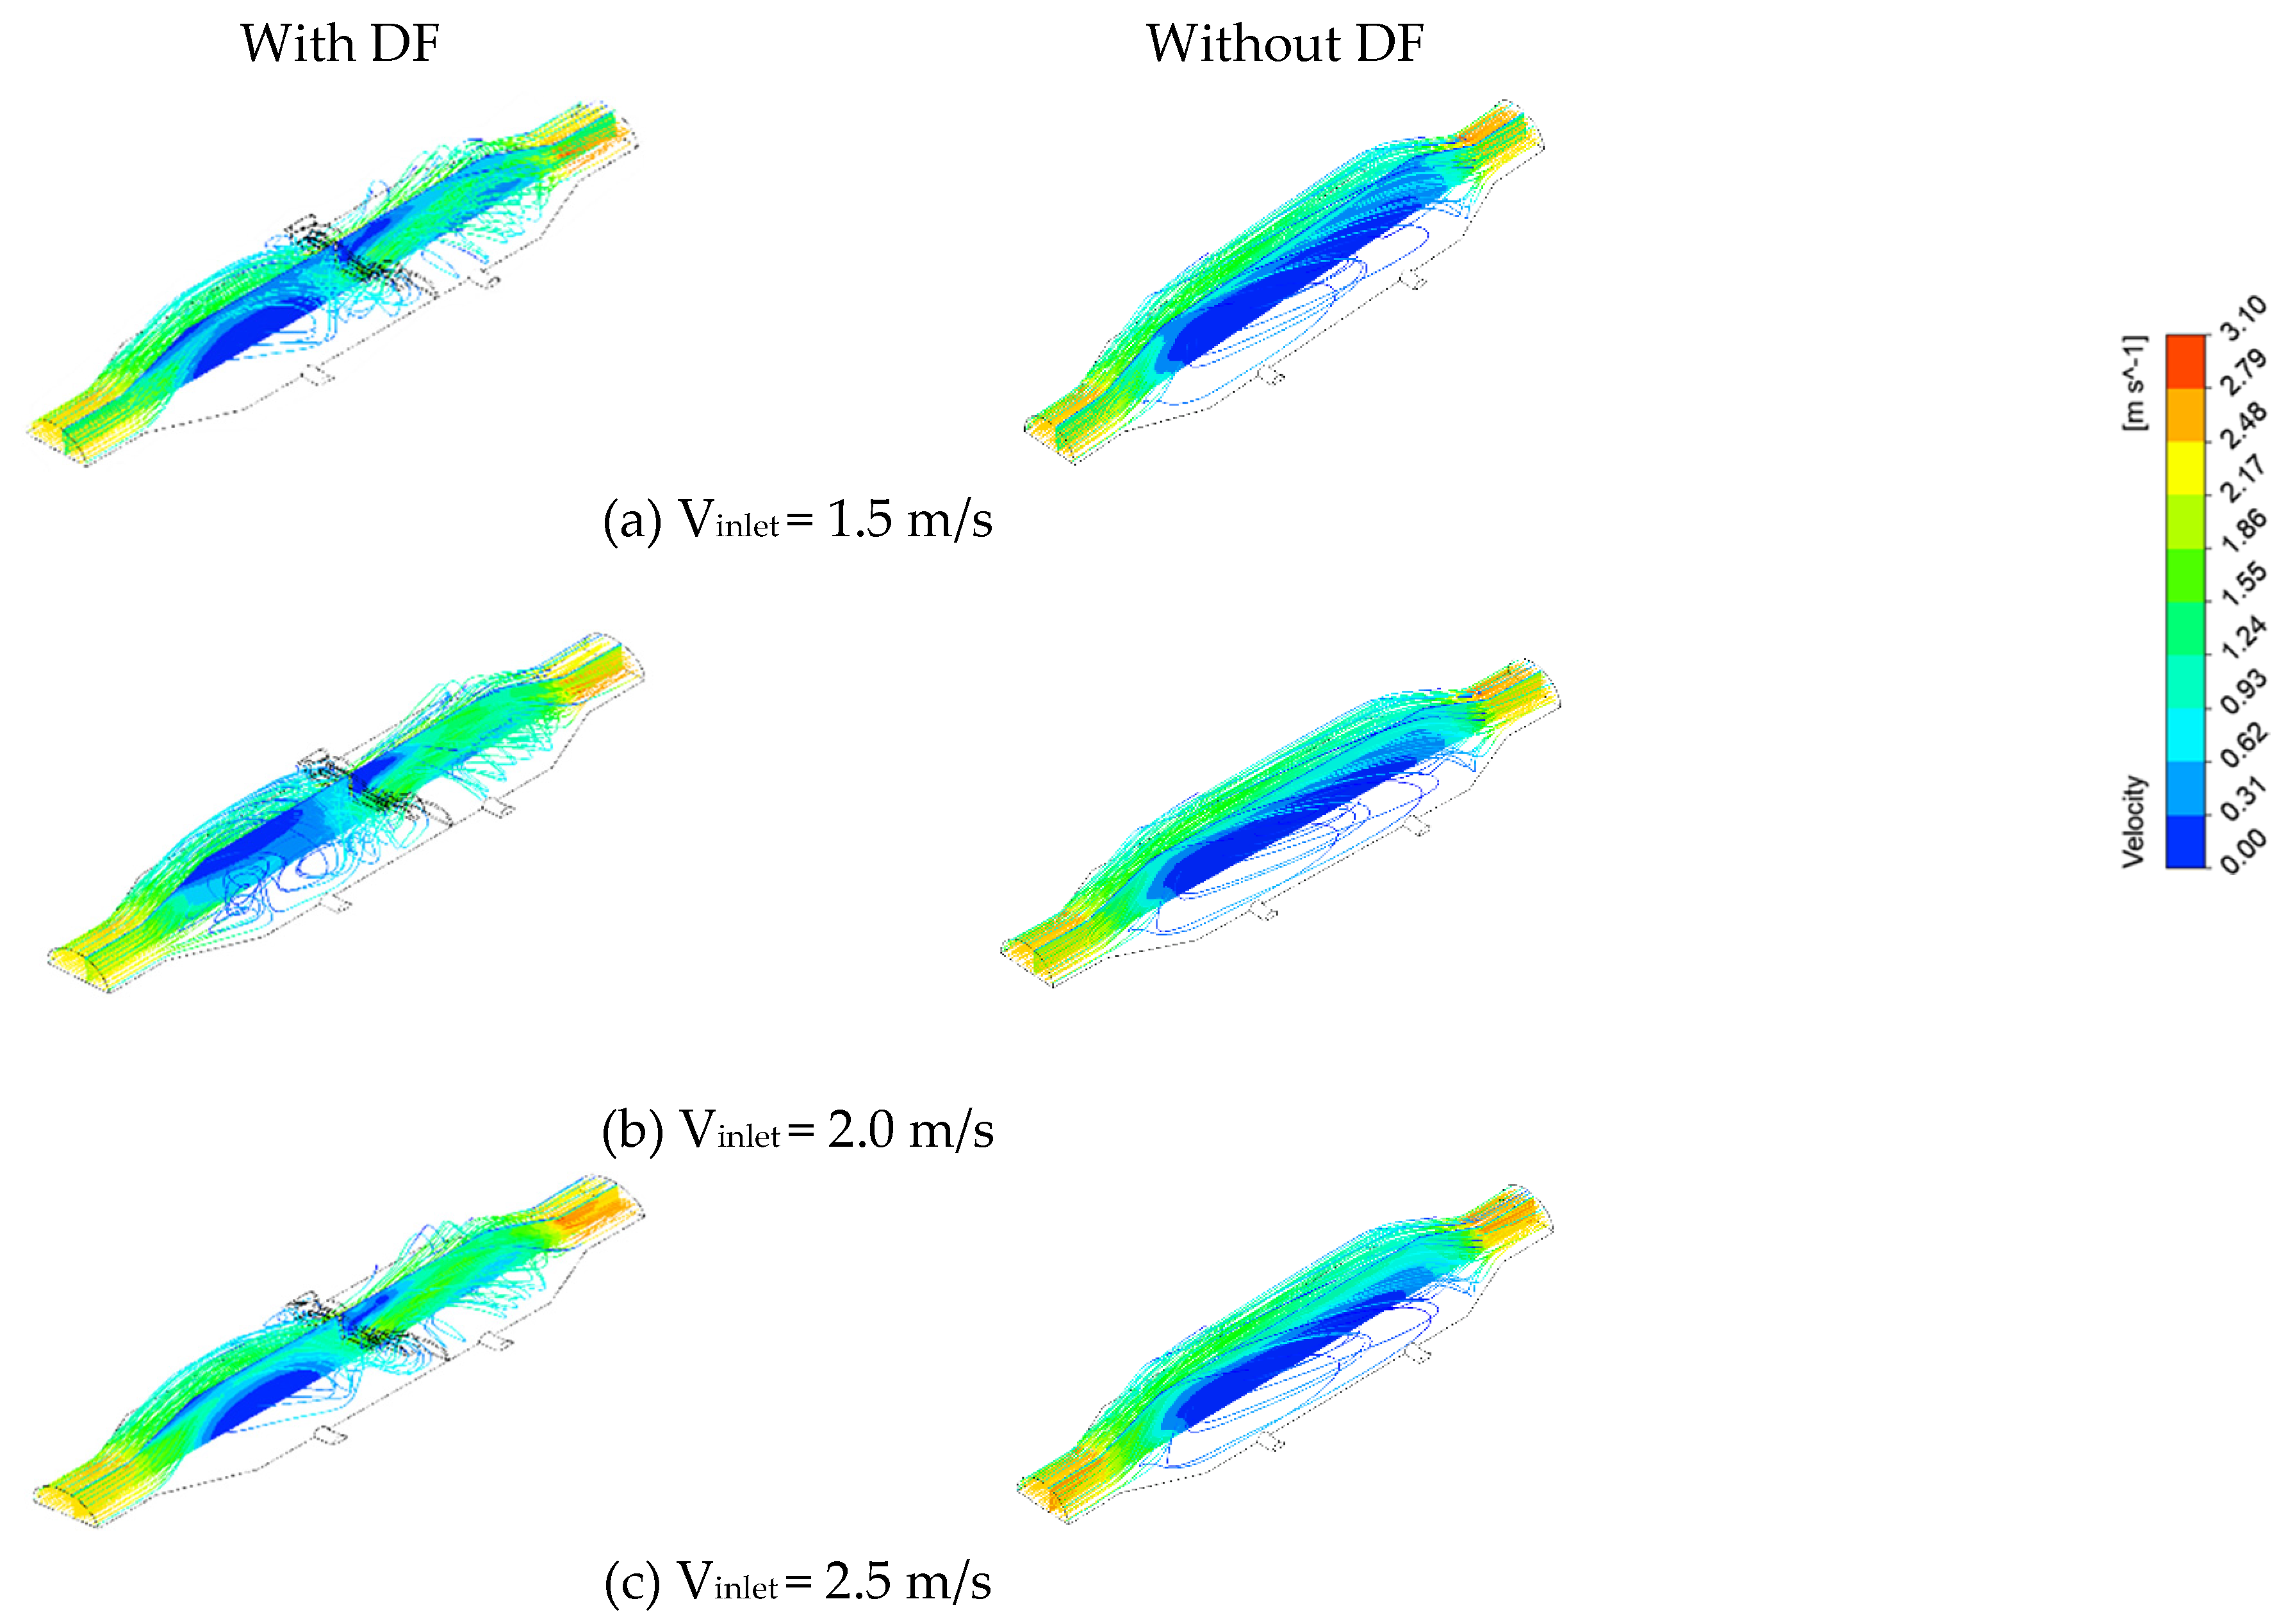
Figure 5 shows the velocity distributions in the pipe with and without the DF applied, and
Table 3 shows the velocity values in the pipe according to the inlet flow rate change. In the velocity distribution when the DF was on the left side of
Figure 5, the main flow at the front end before passing the filter was distributed in the center of the pipe. In
Table 3, the porous zone is located at point 6, and it can be seen that the velocity results are generally higher at points 3, 4, and 5. Without the DF on the right side of
Figure 5, the main flow was distributed near the wall of the pipe. As seen through streamline in
Figure 5, This suggests that the main flow forms in the center of the tube because a vortex is generated by the flow colliding with the bracket at the top of the DF.
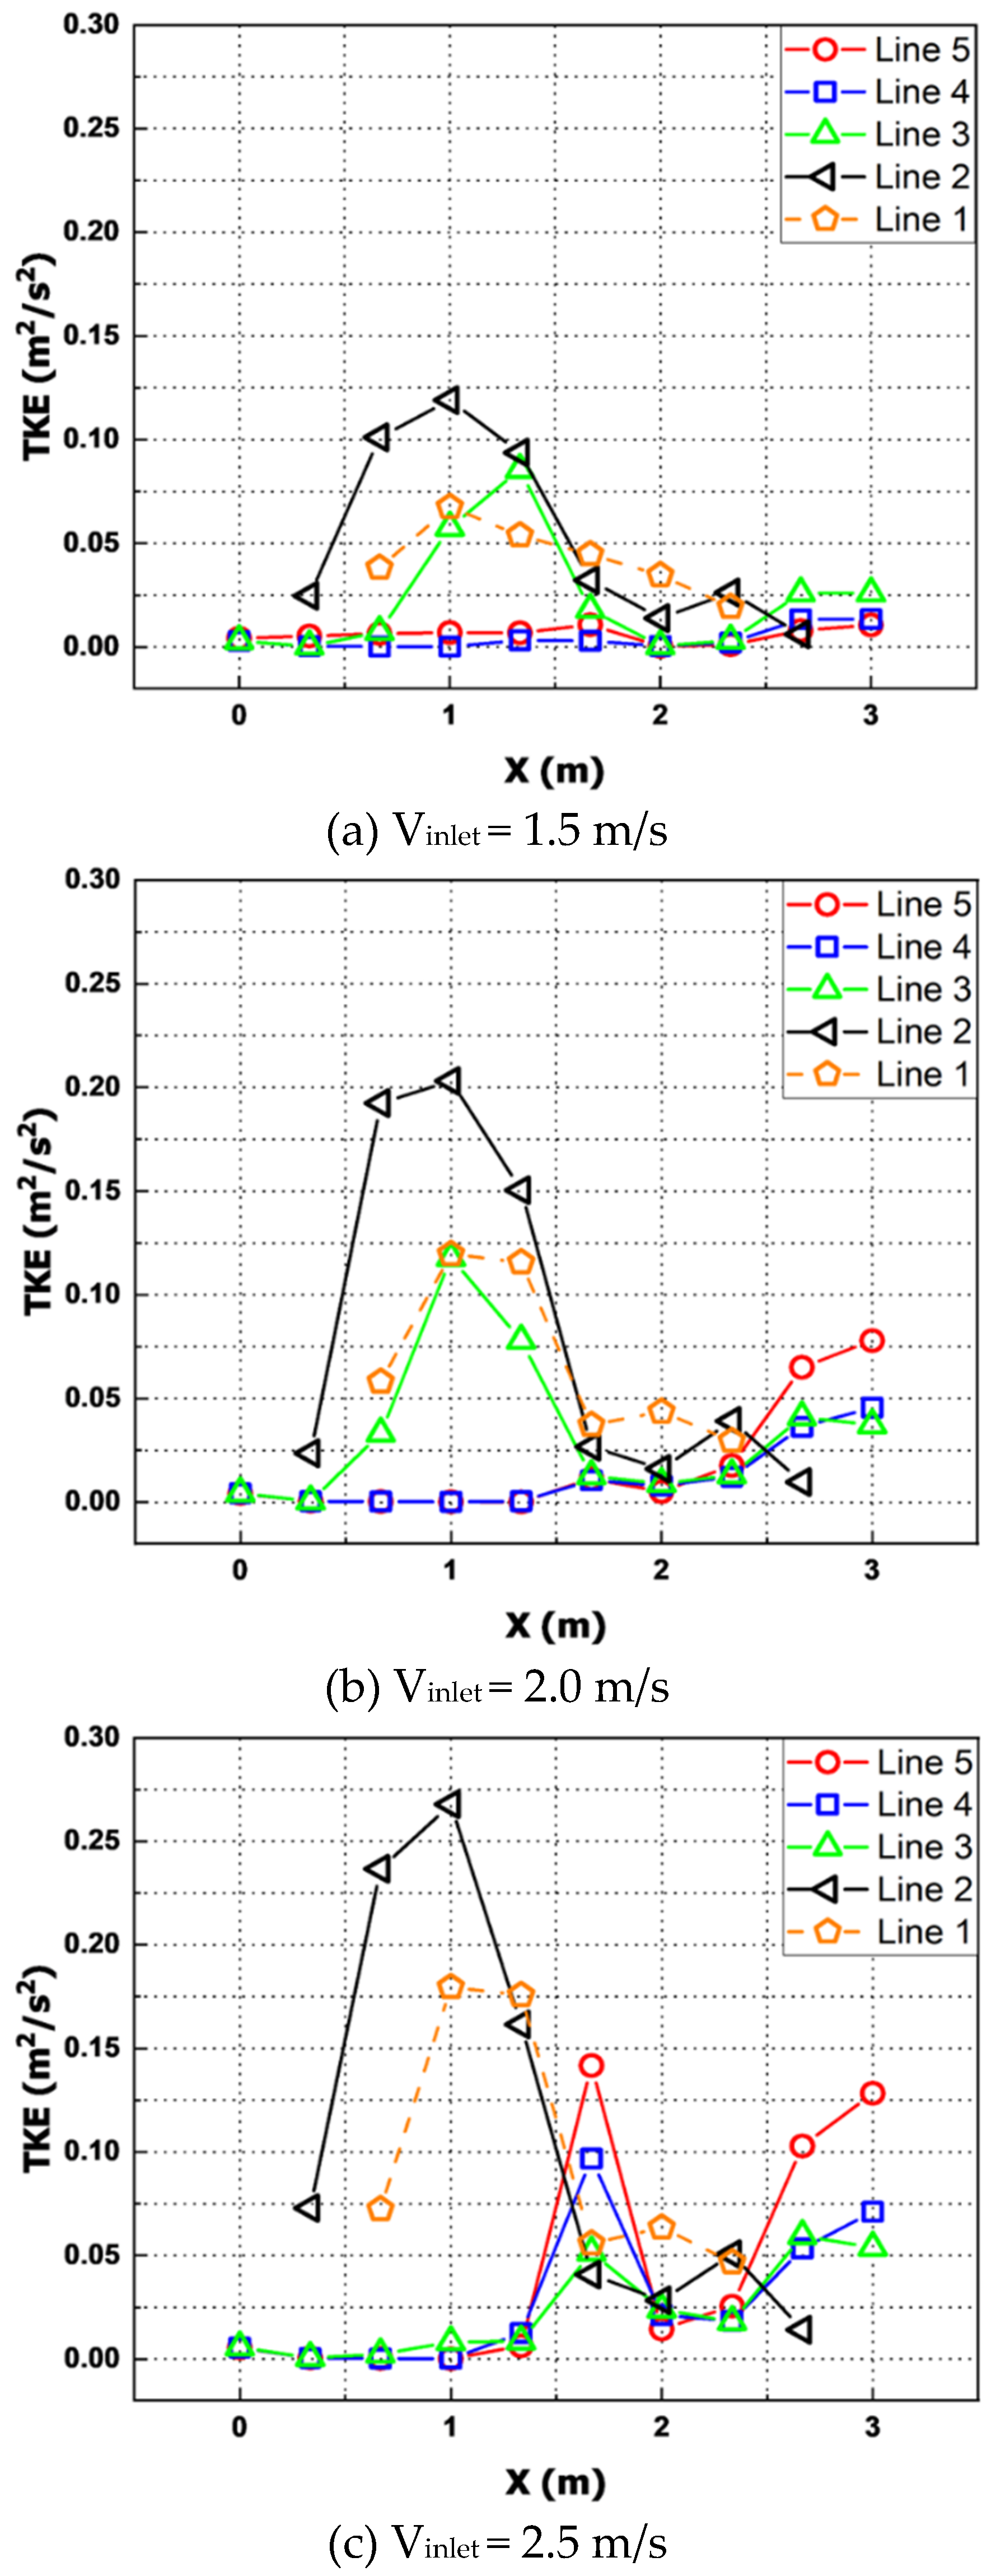
Table 4 shows the TKE values in the pipe according to the inlet flow rate change, and
Figure 6 and
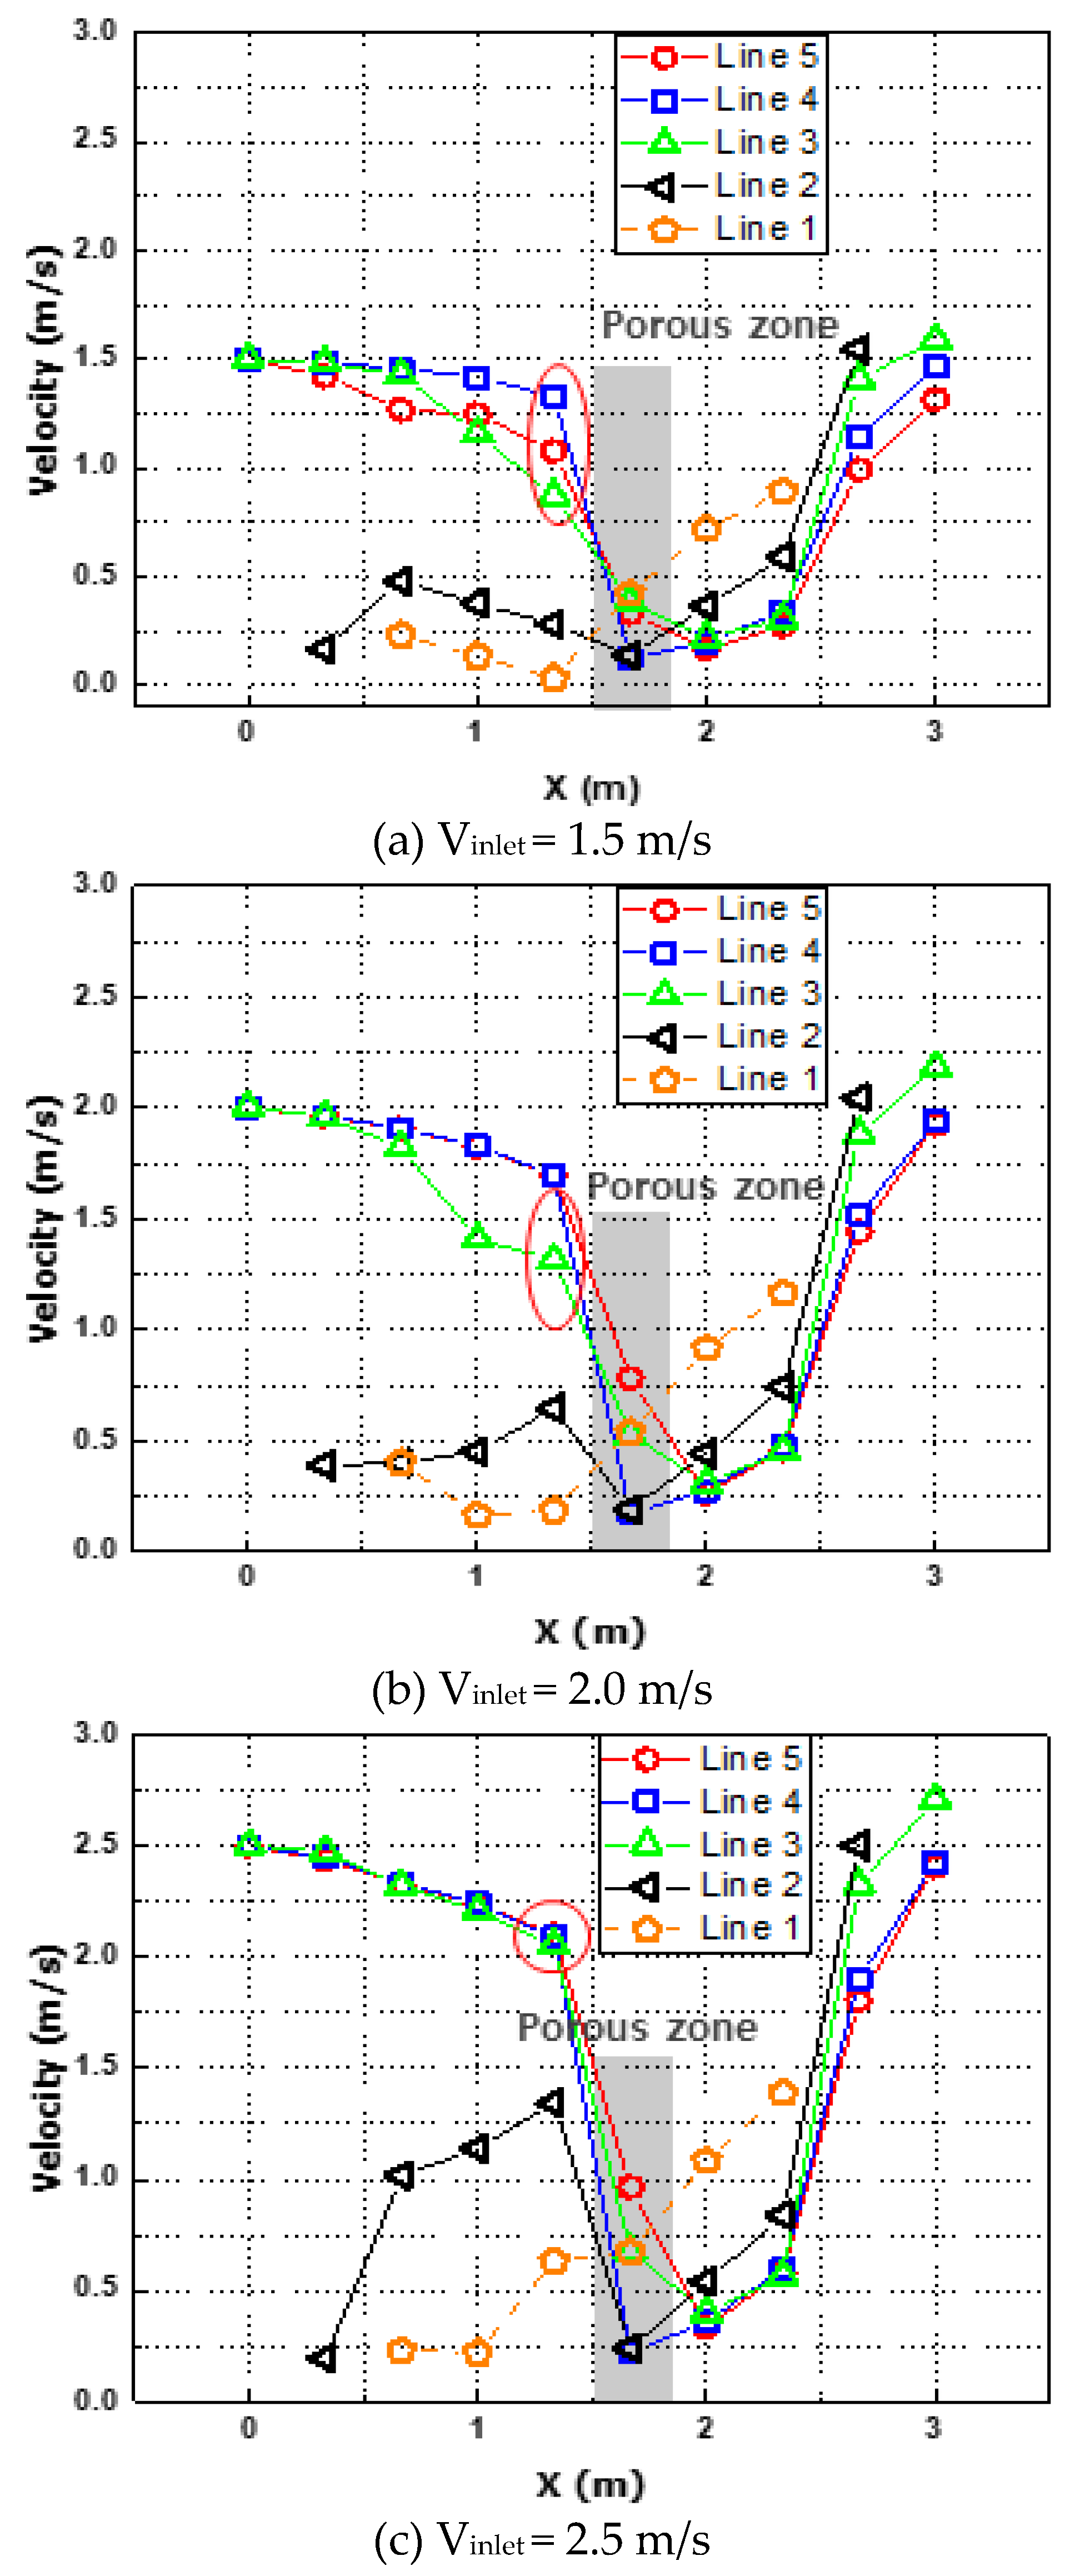
Figure 7 show the distribution of TKE and velocity in the tube of the CTCS with the DF. As shown in
Figure 6, the TKE rapidly increases at the front end of the filter set as the porous zone. This suggests the main flow increases the resistance of the working fluid due to the viscous resistance of the porous zone. As the vortex generated by the flow colliding with the bracket at the top of the filter grows, it increasingly interferes with the main flow.
Also, in the 2.5 m section in
Figure 6, the TKE in Lines 3, 4, and 5 shows a tendency to increase again. This is because, as shown in the velocity distribution in the 2 m to 2.5 m section in
Figure 7, the velocity of the main flow distributed along the wall of the tube increases due to the shape of the nozzle-shaped tube. The TKE increases as it affects the main flow due to the interaction with the relatively slower flow distributed in the center of the tube. The analyses confirmed that when the DF is applied, the main flow at the rear end is distributed along the wall of the tube, in contrast to the front end. This is because the bracket located on the top of the filter acts as a barrier, and the pressure at the rear end of the bracket is relatively lower than the pressure immediately after the porous zone. The working fluid that has passed through the filter tends to accelerate to the top of the filter with low pressure. This is judged to be the same as the tendency that the flow velocity of Line 1, the outer tube of the pipe at the point 2 m past the porous zone, appears higher than other points under all flow velocity conditions in Figure Line 3 in
Figure 6 (c) under the 2.5 m/s flow rate, unlike (a) and (b), is similar to the trend of Lines 4 and 5 at the front of the porous zone. This indicates that as the flow rate increases, the range of the main flow increases so the trend of Line 3 became similar to the flow at the center of the pipe.
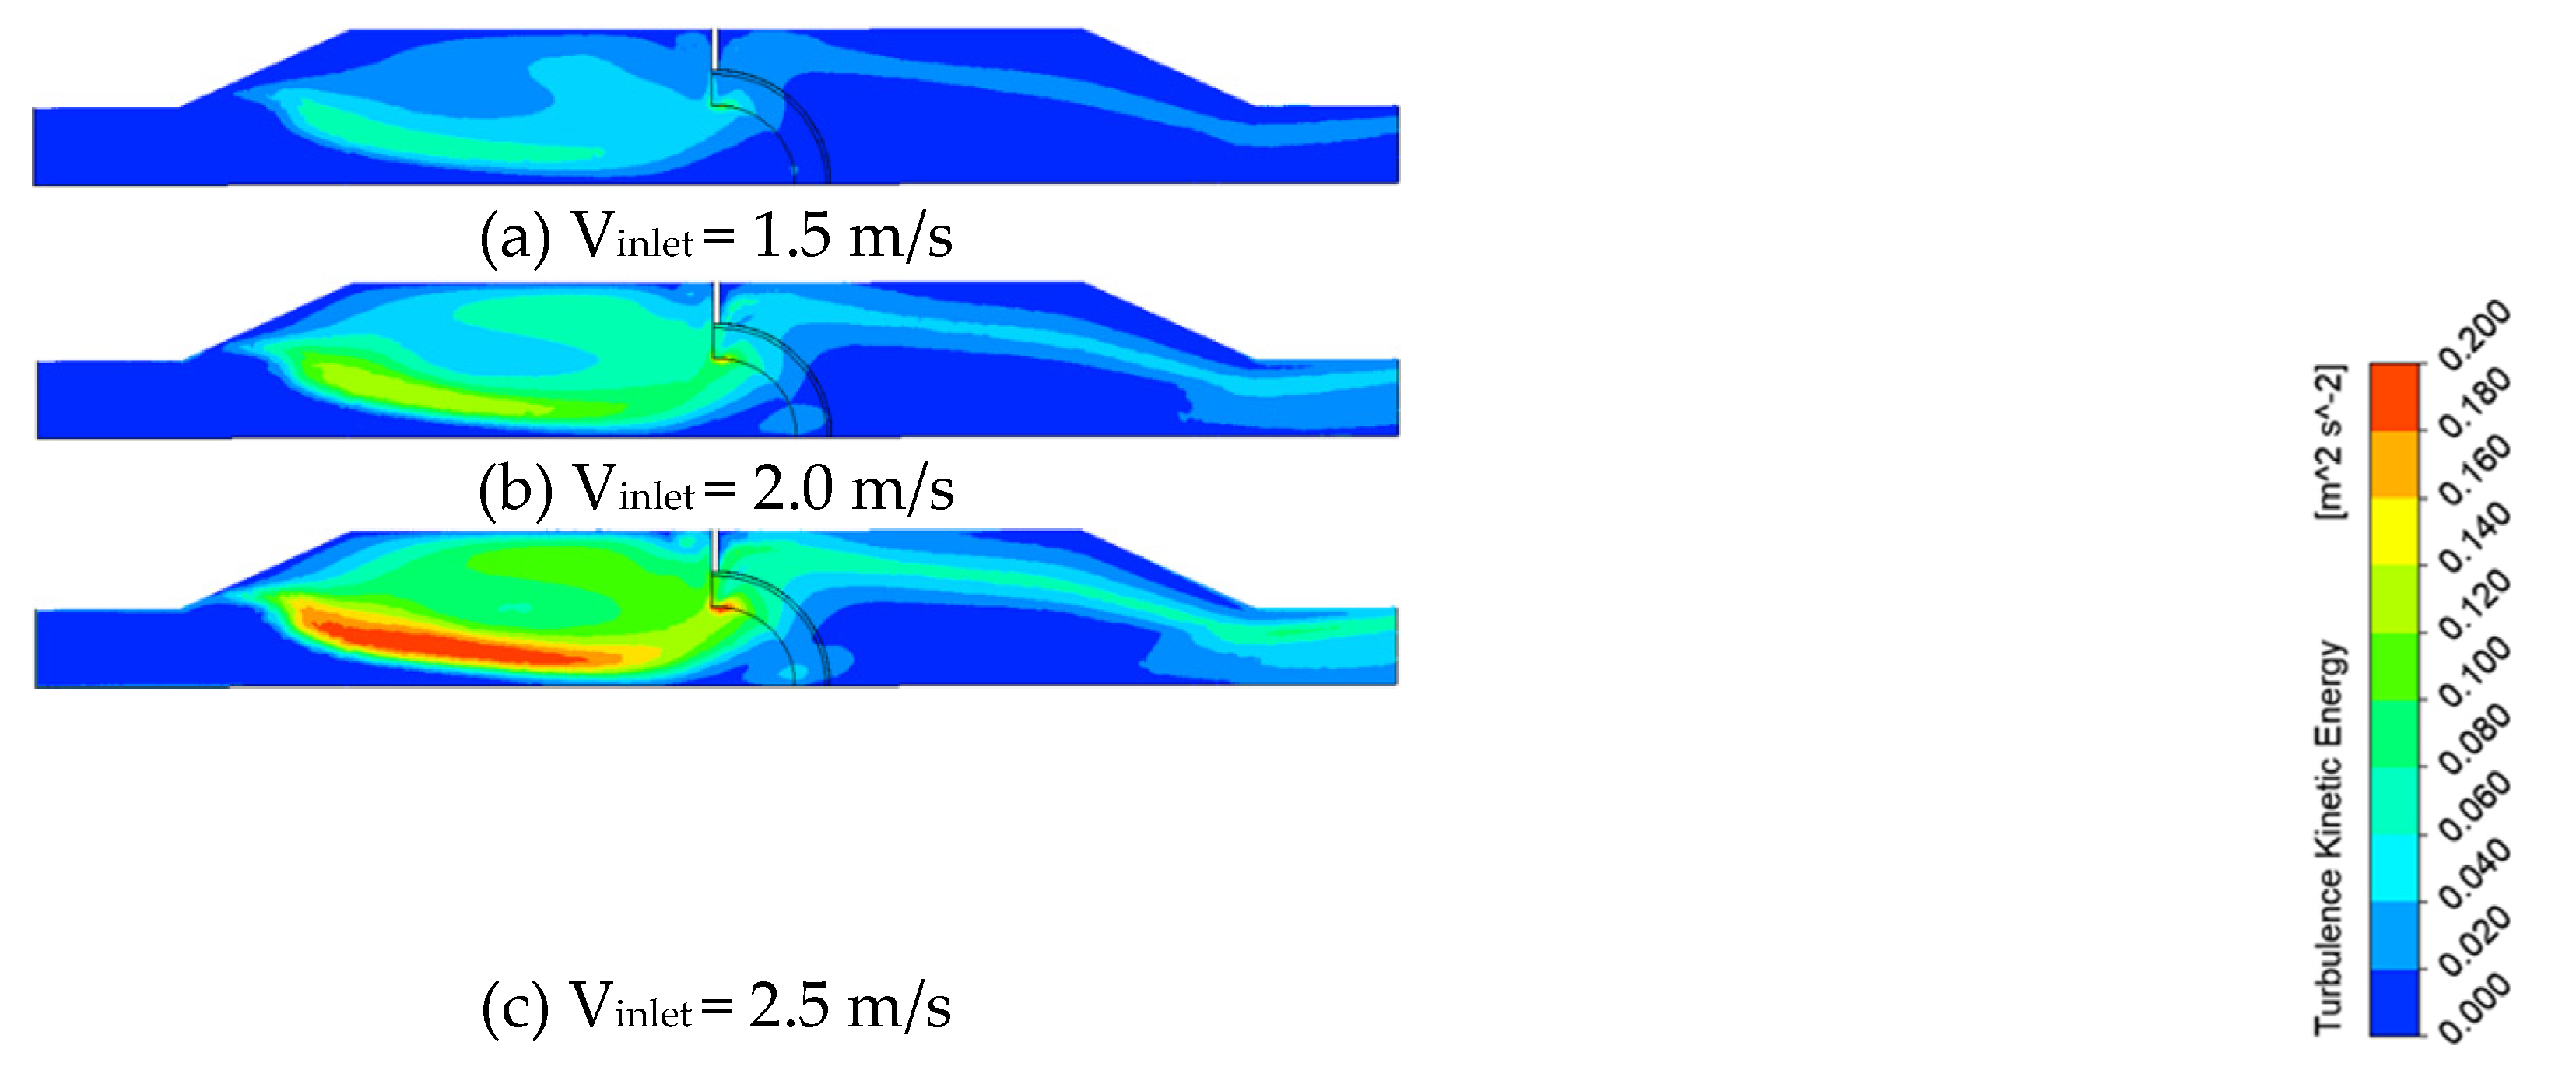
Figure 8 shows the distributions of TKE concerning the flow velocity in the pipe with the DF applied. As the flow velocity increases, the effect of the area and value of the TKE at the front of the filter on the main flow increases, and it can be inferred that the distributions of the vortex increase. As the flow velocity increases, the radius of the vortex resulting from the flow colliding with the bracket at the top of the filter increases, and the friction with the main flow increases, showing the trend in
Figure 8(c).
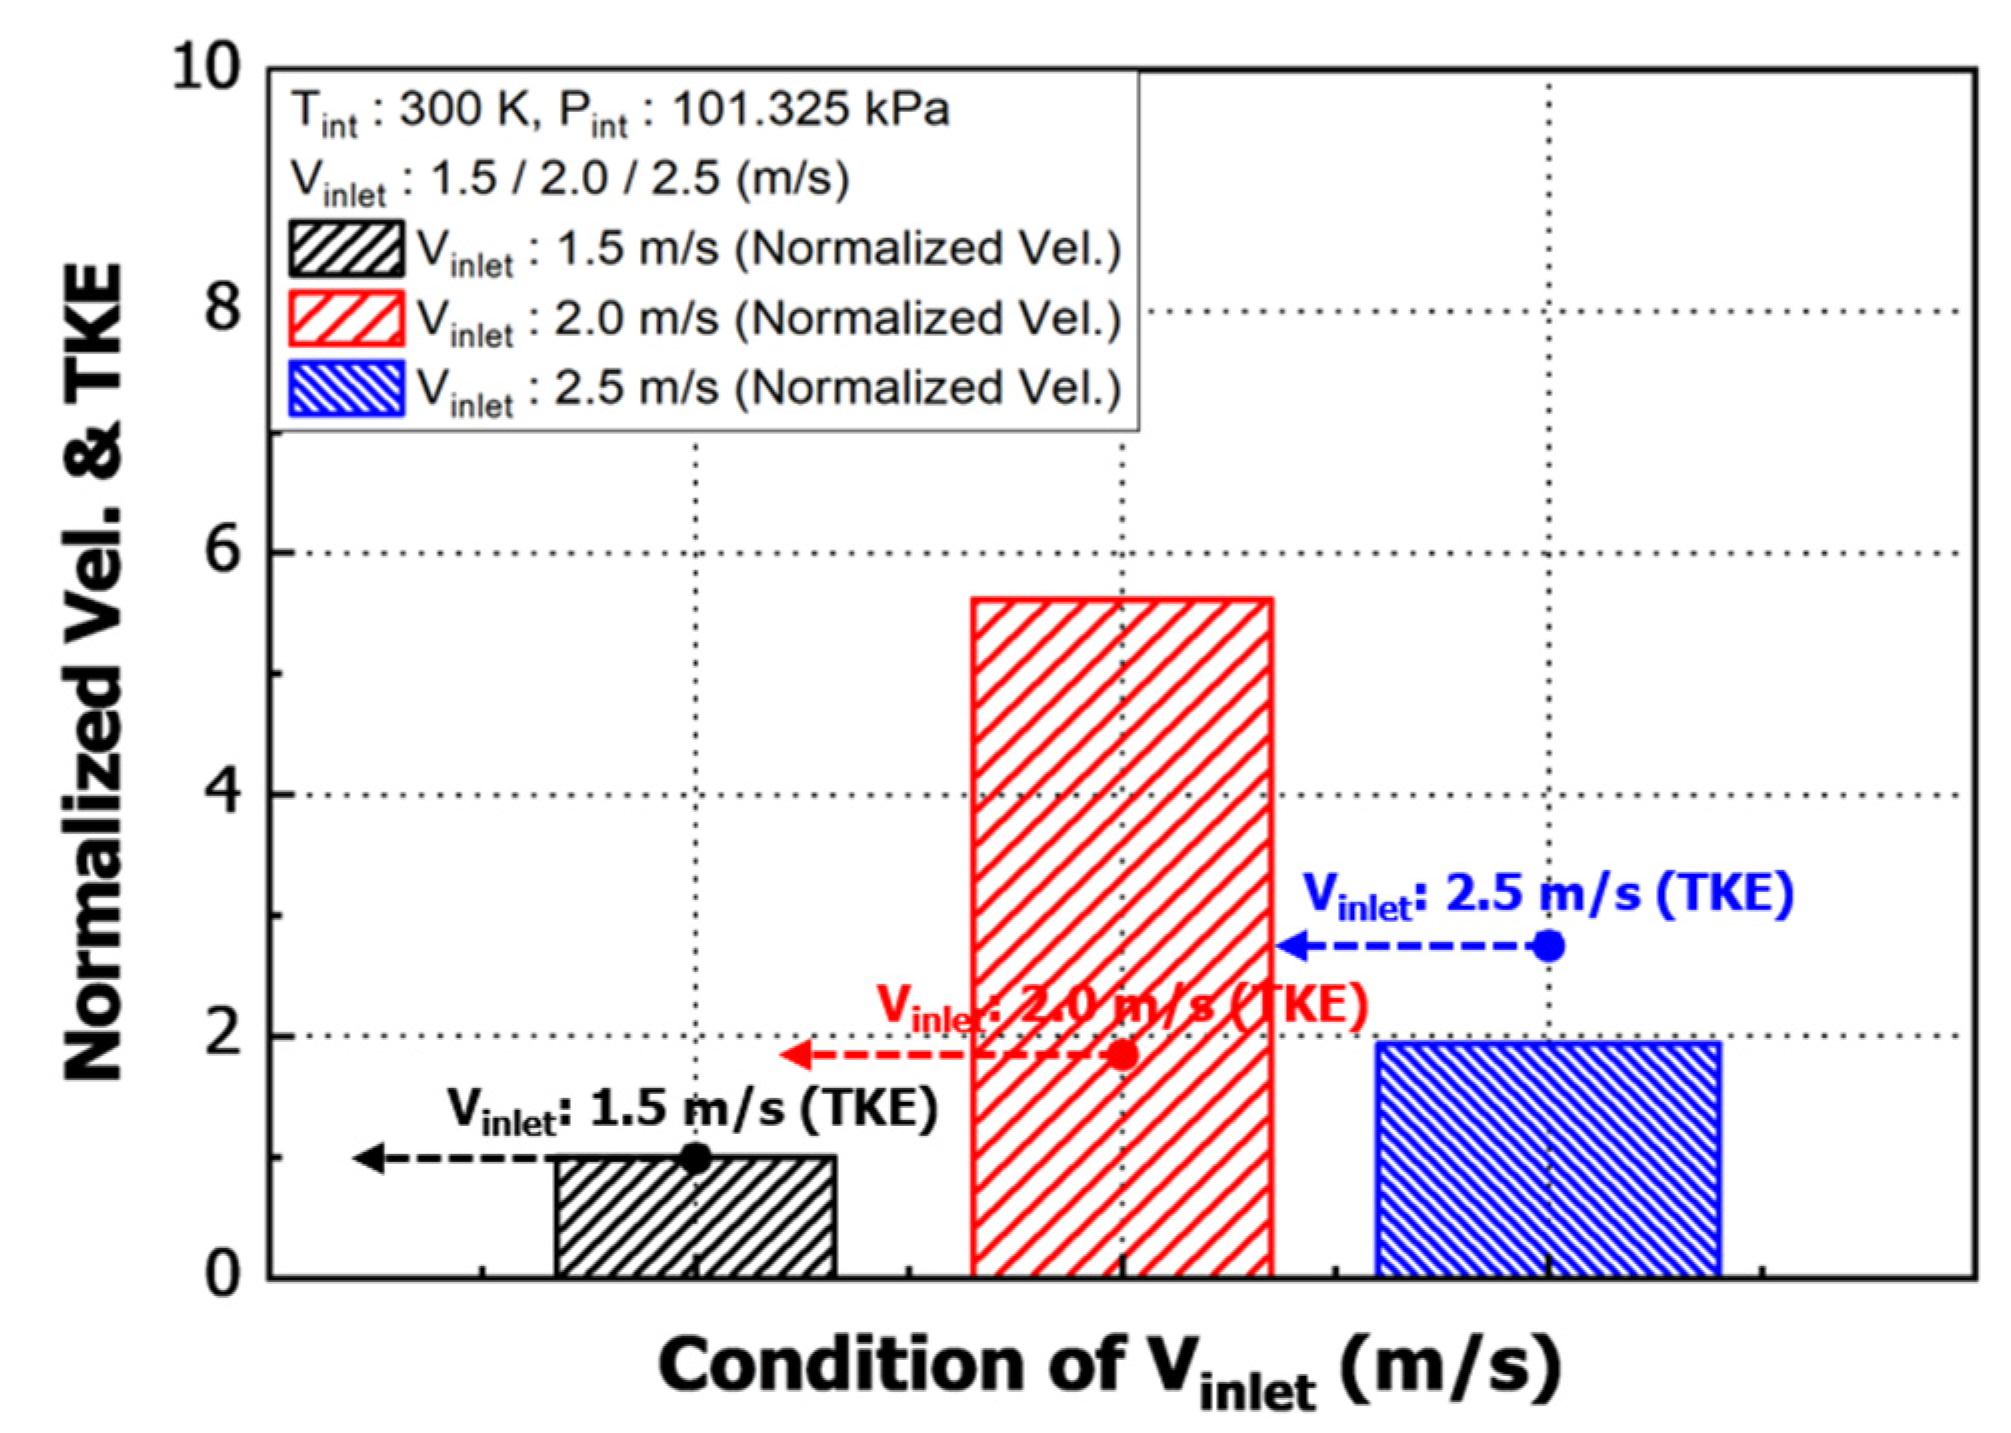
Figure 9 shows the normalized velocity and TKE under inlet flow conditions. The turbulence intensity generated by the working fluid is similar to the trend of the internal pressure distribution. In areas with high fluid resistance, fluid drag increases and flow separation occurs during fluid flow. As a result, it is judged that the flow characteristics deteriorated and the turbulence intensity increases due to the increase in pressure.
3.2. Pressure characteristics of the DF
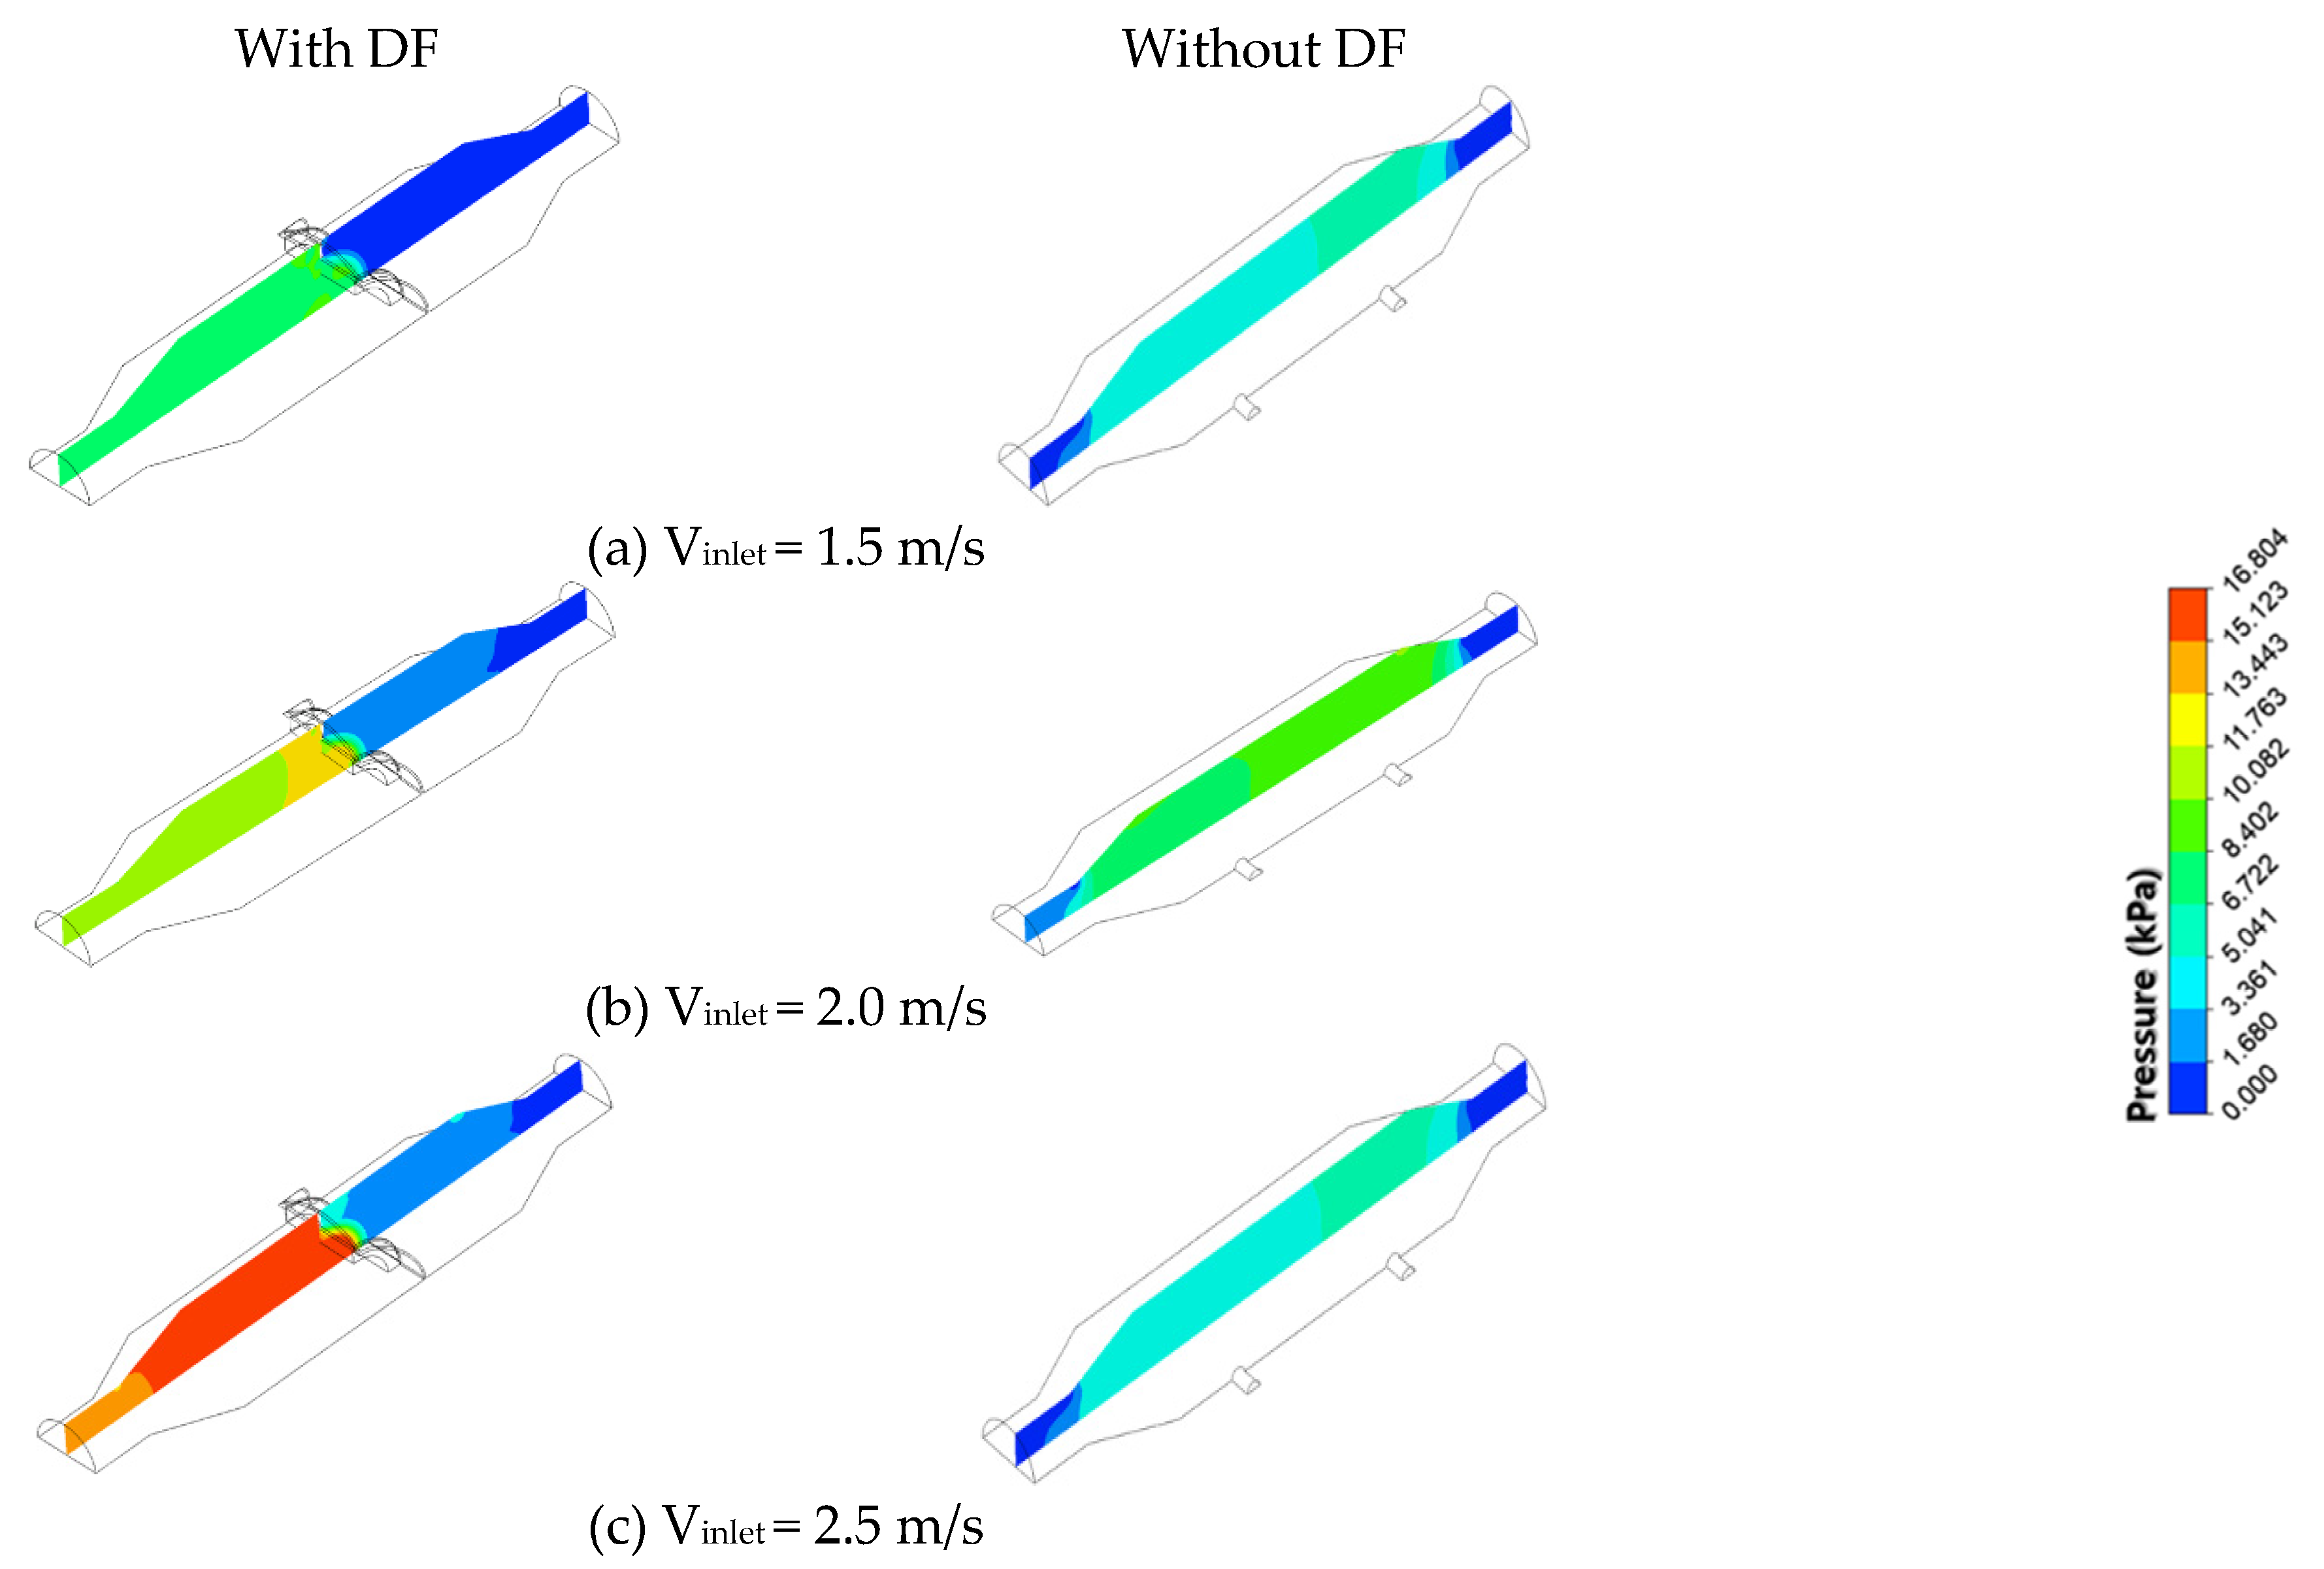
Figure 10 indicates the pressure distributions for each flow velocity in the pipe with the DF, and the pipe without the DF, and
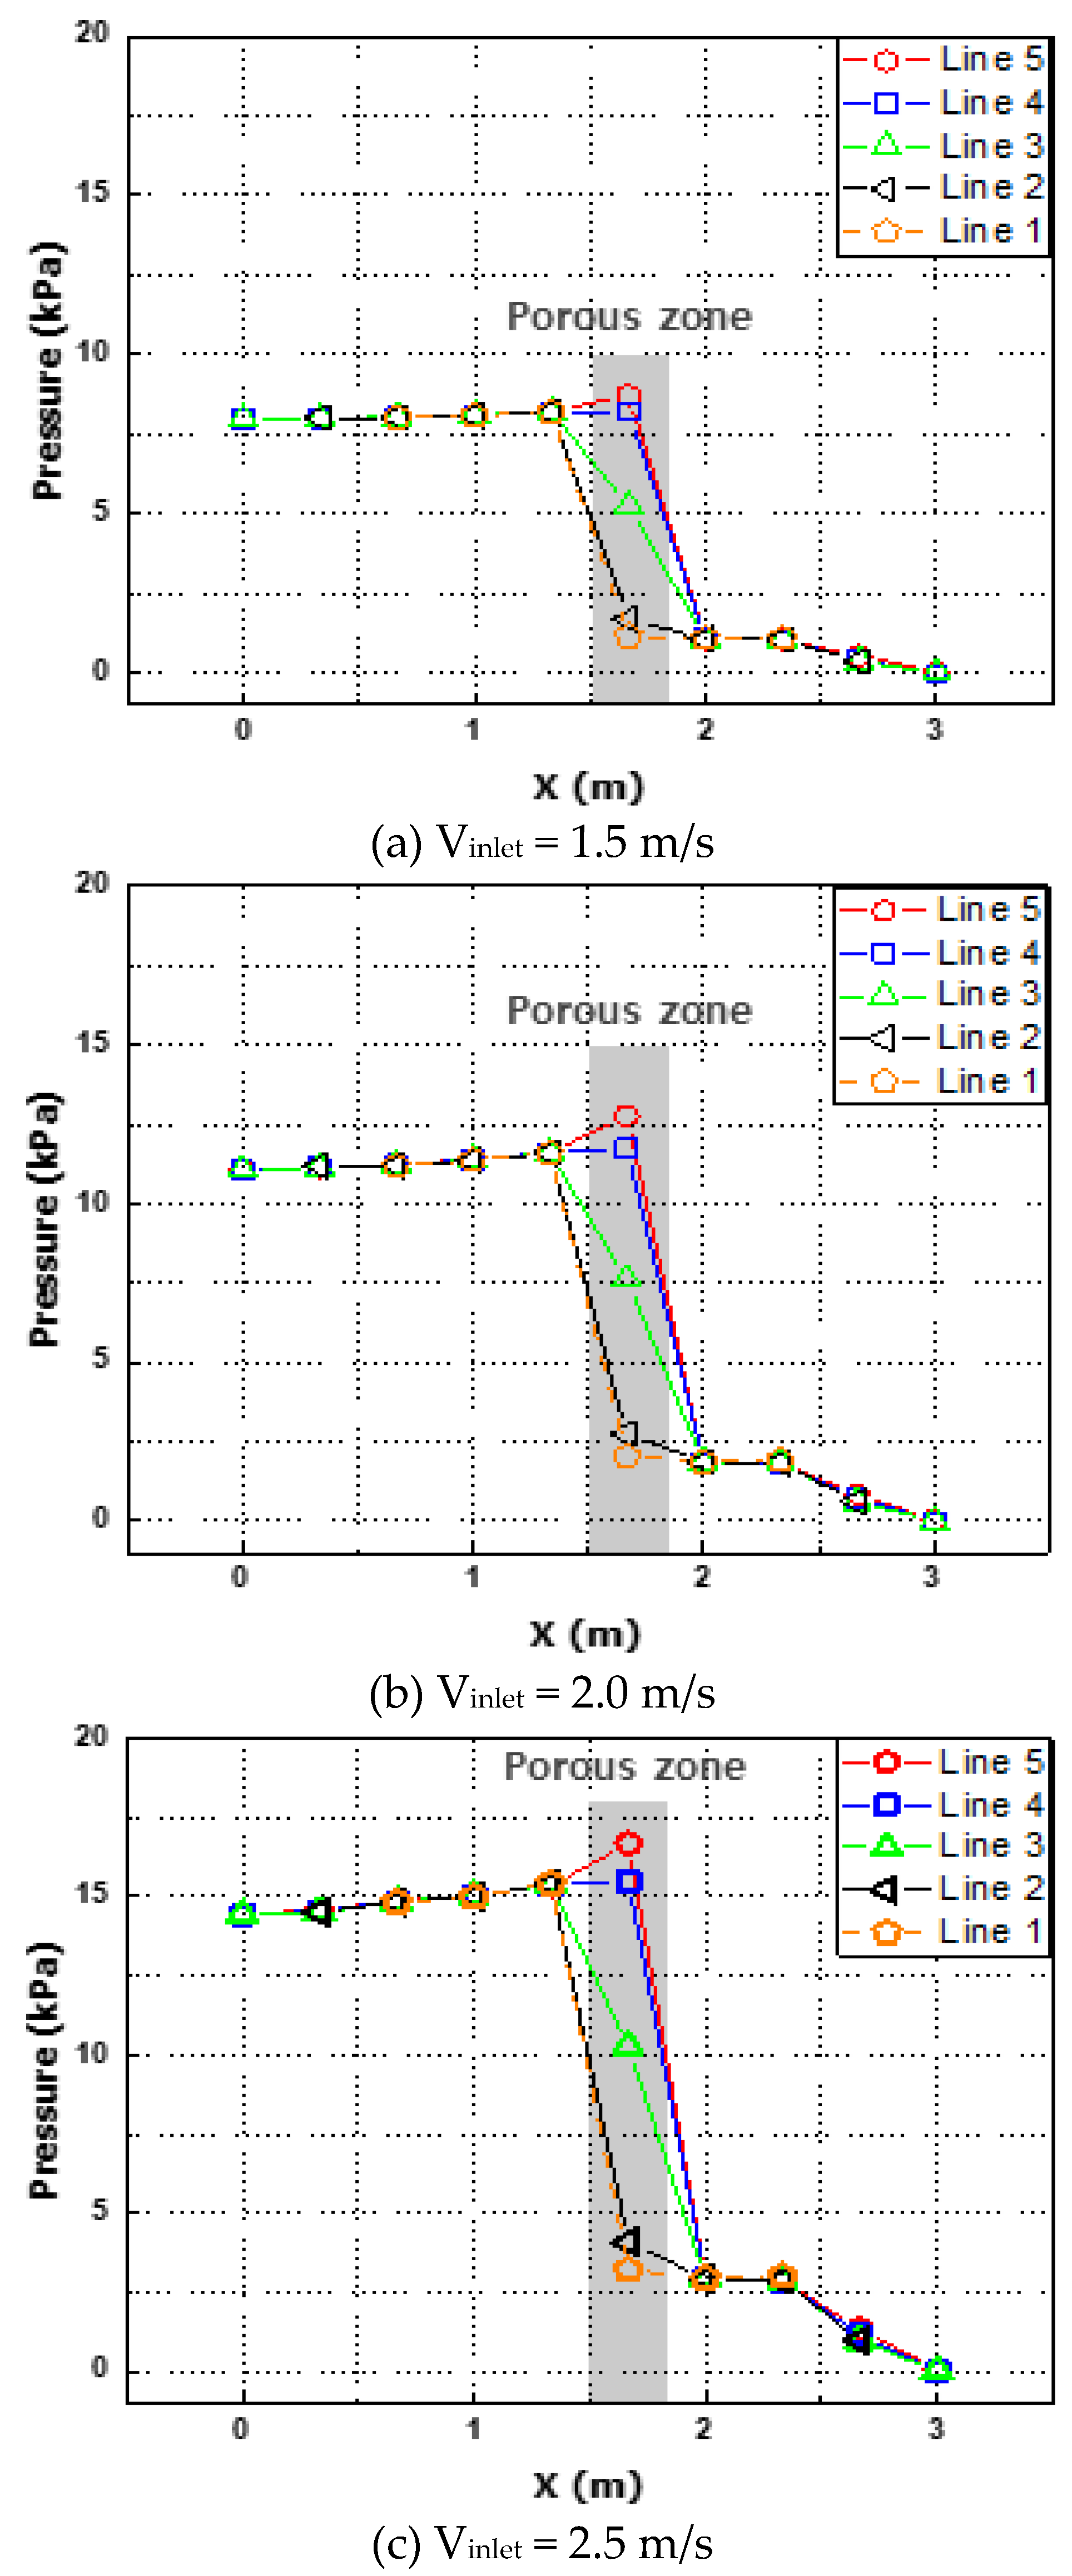
Figure 11 presents the pressure variation in the pipe with the DF applied according to the measuring lines.
Table 5 shows the pressure values in the pipe according to the inlet flow rate change.
Figure 10 shows that the pressure at the front of the filter tends to increase rapidly as the flow rate increases. This indicates that an increase in flow velocity leads to an increase in the flow mass rate, and the pressure rises because the flow mass rate increases in the same volume. Thus, it was confirmed that the differential pressure was also increased by the filter, which could lead to the deterioration of the performance of the condenser.
In the pressure distribution in the pipe without the DF in
Figure 10, both the inlet and outlet pressures were low, according to the Bernoulli's law, and the pressure tended to increase in the part of the expanded pipe where the flow rate was relatively low. On the other hand, in the pipe with the DF, the pressure at the front of the filter increased significantly compared to the case without the DF. It is believed that the pressure inside the pipe is increased significantly by the shape of the filter, the resistance generated by the bracket, and the influence of the pressure drop in the porous zone. It was also determined that the perforated plate of the filter and the shape of the filter have a dominant influence on the differential pressure performance. Thus, further research on this is necessary.
In
Figure 7 and
Figure 11, as the flow rate increases, the velocity and pressure at the front end of the filter tend to increase. This is because the density per unit area at the outlet point of the pipe increases as the flow rate increases, which increases the kinetic energy of the fluid per the same unit area, meaning pressure will be high. At the same initial flow rate condition, the speed and pressure before and after the filter tend to be in inverse proportion, and the increase/decrease width for this tends to be large as the flow velocity increases. On the other hand, the velocity and pressure immediately after passing through the porous zone and filter tend to decrease in the same way.
It is understood that the average velocity per area increases as the pressure drop increases, according to the Darcy's law, which is generally applied to calculations in porous media. Darcy's law is expressed as Equation (6), where
is the average velocity per area of the fluid,
is the flow rate,
is the cross-sectional area,
is the permeation coefficient,
is the viscosity coefficient, and
is the pressure [
19].
Also, in
Figure 11, the pressure in the porous zone increases toward the center of the pipe. This is because the flow per unit area near the center increases as the flow in the pipe approaches the maximum flow rate toward the center due to the no-slip condition. The resistance the working fluid receives from the viscous resistance of the filter increases in proportion to the flow rate.
4. Conclusions
In this study, a numerical analysis method was used to compare and analyze the flow characteristics and differential pressure performance of the CTCS to which a 14-inch DF was applied. As a result, the following conclusions were reached.
(1) The numerical analysis confirmed that the main flow in the pipe with the DF was dominantly affected by the vortex generated by the DF bracket.
(2) As the flow velocity increases, the radius of the vortex generated by the flow colliding with the DF bracket increases. And as the vortex radius increases, friction with the main flow is induced, leading to an increase in the TKE, which interferes with the main flow and is thought to cause flow loss in the tube.
(3) According to the Bernoulli's law, the pressure before and after the DF tends to be inversely proportional to the flow rate and pressure. On the other hand, the speed and pressure in the filter tend to be proportional, which was confirmed by calculations made using the Darcy's law on the influence of the porous zone of the perforated plate.
(4) In addition, it was confirmed that the filter shape and fluid resistance due to pressure drop in the porous zone had a dominant influence on the differential pressure performance in the pipe with the DF.
Funding
This work was supported by the Technology Innovation Program (20018176, Development of heat exchanger cleaning system and automatic operation technology that can reduce energy use of heat exchangers by more than 25%) funded By the Ministry of Trade, Industry & Energy(MOTIE, Korea).
References
- H. M. Chae, J. T. Kwon, D. A. Cha and O. K. Kwon, “The Measurements of Ball Recovery Rate for the Cleaning Apparatus in Plate Heat Exchanger Using Ceramic Ball”, Journal of the Korean Society for Power System Engineering, 2014, Vol. 18, No. 1, pp. 38~44. [CrossRef]
- K. M. Nam and S. J. Kang, “A Comparative Study on Technical Efficiency in the Secondary Energy Industry and a Factor Analysis for Technical Efficiency”, Korean Energy Economic Review, 2015, Vol. 14, No. 1, pp. 111~141.
- S. C. Park and I. W. Lee, “Experimental study on analysis of correlation between void fraction and drag reduction rate in air lubrication ship”, Journal of The Korean Society of Visualization, 2020, Vol. 18, pp. 11~17. [CrossRef]
- Ibrahim, Said MA, and Sami I. Attia. "The influence of condenser cooling seawater fouling on the thermal performance of a nuclear power plant." Annals of Nuclear Energy 76, 2015, pp. 421~430. [CrossRef]
- Alabrudzinski, S., Markowski, M., Trafczynski, M., and Urbaniec, K, “The influence of fouling build-up in condenser tubes on power generated by a condensing turbine”, Chemical Engineering Transactions, 2016, Vol. 52, pp. 225~1230. [CrossRef]
- Pattanayak. L, Narayana Padhi. B and Kodamasingh. B, "Thermal performance assessment of steam surface condenser." Case Studies in Thermal Engineering, 2019, pp.100484. [CrossRef]
- Mohammadaliha. N, Amani. M and Bahrami. M, "Thermal performance of heat and water recovery systems: Role of condensing heat exchanger material." Cleaner Engineering and Technology, 2020, Vol. 1, pp. 100024. [CrossRef]
- Gadhamshetty, V, Nirmalakhandan. N, Myint. M and Ricketts. C, "Improving air-cooled condenser performance in combined cycle power plants." Journal of energy engineering, 2006, Vol.132 pp. 81~88. [CrossRef]
- C. S. Yi, and C. W. Lee, “Development on Cleaning System of Condenser for Nuclear Power Plant by Using Sponge Ball” Journal of the Korean Society of Manufacturing Process Engineers, 2015, Vol. 14(6), pp. 21~26. [CrossRef]
- G. C. Jeong, H. S. Lee and C. W. Lee, “Numerical analysis of ball strainer screen module blockage effects,” Journal of the Korean Society for Power System Engineering, 2015, Vol. 19, No. 1, pp. 83~89. [CrossRef]
- S. J. Lee, J. S. Kim and S. H. Lee, “A study on the fouling factor and formation of surface film in the power plant condenser,” Korean Journal of materials Research, 1997, Vol. 7, No. 9. pp. 750~757.
- C. S. Lee and C. W. Lee, “Development on Cleaning System of condenser for nuclear Power Plant by Using Sponge Ball,” Journal of the Korean Society of Manufacturing Process Engineers, 2015, Vol. 14, No. 6, pp. 21~26. [CrossRef]
- S. Y. Kwon, D. J. Hur and J. K. Choi, “ A study of the ball dispersion prediction for increasing the effect of condenser tube cleaning system,” Journal of computational fluids engineering, 2016, 2016 Spring Conference of KSCFE, pp. 83~84.
- S. Y. Kwon, D. J. Hur and K. S. Yun, “Study on the Prediction of Ball Collection Rate in Power Plants Condenser Tube Cleaning System,” Trans. Korean Soc. Mech. Eng. 2017, 2017 Spring Conference of KSME, pp. 61~62.
- M. S. Jung, and K. T. Kim, "Debris filtering efficiency and its effect on long term cooling capability." Nuclear Engineering and Design, 2013, Vol. 261 pp. 1~9. [CrossRef]
- Walker, M. E., Safari, I., Theregowda, R. B., Hsieh, M. K., Abbasian, J., Arastoopour, H., ... & Miller, D. C. “Economic impact of condenser fouling in existing thermoelectric power plants”, Energy, Vol. 44, pp. 429~437. [CrossRef]
- Y. W. Kim, J. R. Goo, Y. C. Bae, H. Lee and Y. S. Lee, “Vibration Phenomena between Condensate Vertical Pump and Condenser Debris system in Power Plant”, 2001, Trans. Korean Soc. Noise Vib. Eng., pp. 1020~1025.
- Zubair, S. M., Sheikh, A. K., Younas, M., & Budair, M. O. “A risk based heat exchanger analysis subject to fouling: Part I: Performance evaluation”, Energy, 2000, Vol. 25, pp. 427~443. [CrossRef]
- S. W. Choi, J. H. Yang, B. S. Kim and J. S. Kwon, “Study on permeability coefficient and fluid behavior of porous materials” , 2018, Journal of the Korean Society of Marine Engineering, Vol. 42, No. 9 pp. 742~746. [CrossRef]
Figure 1.
The shape and position of the DF inside the CTCS.
Figure 1.
The shape and position of the DF inside the CTCS.
Figure 2.
Schematics of the DF and flow characteristics measuring points: (a) Schematics of the DF and (b) Measuring points of pipe with the DF applied.
Figure 2.
Schematics of the DF and flow characteristics measuring points: (a) Schematics of the DF and (b) Measuring points of pipe with the DF applied.
Figure 3.
Mesh of pipe with the DF applied.
Figure 3.
Mesh of pipe with the DF applied.
Figure 4.
Normalized results for differential pressure under various flow velocity.
Figure 4.
Normalized results for differential pressure under various flow velocity.
Figure 5.
Comparison results of velocity contour with the DF (left) and without the DF (right) (a) Vinlet = 1.5 m/s, (b) Vinlet = 2.0 m/s, (c) Vinlet = 2.5 m/s.
Figure 5.
Comparison results of velocity contour with the DF (left) and without the DF (right) (a) Vinlet = 1.5 m/s, (b) Vinlet = 2.0 m/s, (c) Vinlet = 2.5 m/s.
Figure 6.
The TKE distributions of pipe with DF applied (a) Vinlet = 1.5 m/s, (b) Vinlet = 2.0 m/s, (c) Vinlet = 2.5 m/s.
Figure 6.
The TKE distributions of pipe with DF applied (a) Vinlet = 1.5 m/s, (b) Vinlet = 2.0 m/s, (c) Vinlet = 2.5 m/s.
Figure 7.
The velocity distributions of pipe with the DF applied. (a) Vinlet = 1.5 m/s, (b) Vinlet = 2.0 m/s, (c) Vinlet = 2.5 m/s.
Figure 7.
The velocity distributions of pipe with the DF applied. (a) Vinlet = 1.5 m/s, (b) Vinlet = 2.0 m/s, (c) Vinlet = 2.5 m/s.
Figure 8.
The TKE contour in a pipe with the DF. (a) Vinlet = 1.5 m/s, (b) Vinlet = 2.0 m/s, (c) Vinlet = 2.5 m/s.
Figure 8.
The TKE contour in a pipe with the DF. (a) Vinlet = 1.5 m/s, (b) Vinlet = 2.0 m/s, (c) Vinlet = 2.5 m/s.
Figure 9.
Normalized results for velocity and TKE under various flow velocity.
Figure 9.
Normalized results for velocity and TKE under various flow velocity.
Figure 10.
Comparison results of pressure contour with the DF (left) and without the DF (right) (a) Vinlet = 1.5 m/s, (b) Vinlet = 2.0 m/s, (c) Vinlet = 2.5 m/s.
Figure 10.
Comparison results of pressure contour with the DF (left) and without the DF (right) (a) Vinlet = 1.5 m/s, (b) Vinlet = 2.0 m/s, (c) Vinlet = 2.5 m/s.
Figure 11.
Pressure distributions of pipe with the DF applied. (a) Vinlet = 1.5 m/s, (b) Vinlet = 2.0 m/s, (c) Vinlet = 2.5 m/s.
Figure 11.
Pressure distributions of pipe with the DF applied. (a) Vinlet = 1.5 m/s, (b) Vinlet = 2.0 m/s, (c) Vinlet = 2.5 m/s.
Table 1.
The amount of mesh used for the numerical analysis.
Table 1.
The amount of mesh used for the numerical analysis.
| Cases |
Nodes |
Elements |
| With DF |
260,950 |
1,308,948 |
| Without DF |
51,297 |
259,098 |
Table 2.
Numerical Analysis conditions.
Table 2.
Numerical Analysis conditions.
| Contents |
Conditions |
Turbulence model
Inlet velocity (m/s)
Inlet temperature (K)
Inlet pressure (kPa)
Outlet condition |
(sst)
1.5, 2.0, 2.5
300
101.325
Pressure outlet |
Table 3.
The velocity values at each flow characteristic measurement point in pipe containing DF.
Table 3.
The velocity values at each flow characteristic measurement point in pipe containing DF.
| V () |
| Vinlet
|
|
Point 1 |
Point 2 |
Point 3 |
Point 4 |
Point 5 |
Point 6 |
Point 7 |
Point 8 |
Point 9 |
Point 10 |
| 1.5 m/s |
Line 1 |
|
|
0.2297 |
0.1342 |
0.0325 |
0.4192 |
0.7169 |
0.8914 |
|
|
| Line 2 |
|
0.1642 |
0.4782 |
0.377 |
0.28 |
0.1372 |
0.363 |
0.5899 |
1.5453 |
|
| Line 3 |
1.5022 |
1.4826 |
1.4262 |
1.1571 |
0.8698 |
0.383 |
0.2178 |
0.3056 |
1.4089 |
1.5891 |
| Line 4 |
1.501 |
1.4862 |
1.4572 |
1.4166 |
1.3307 |
0.1246 |
0.1975 |
0.341 |
1.1407 |
1.4644 |
| Line 5 |
1.4991 |
1.4242 |
1.2668 |
1.2455 |
1.0776 |
0.3335 |
0.166 |
0.2726 |
0.9912 |
1.3142 |
| 2 m/s |
Line 1 |
|
|
0.401 |
0.1639 |
0.1855 |
0.5385 |
0.915 |
1.1635 |
|
|
| Line 2 |
|
0.3899 |
0.3994 |
0.4514 |
0.6452 |
0.189 |
0.4421 |
0.742 |
2.0443 |
|
| Line 3 |
2.0024 |
1.9608 |
1.8216 |
1.4078 |
1.3166 |
0.53 |
0.3073 |
0.4525 |
1.8828 |
2.1836 |
| Line 4 |
2.0008 |
1.9639 |
1.9087 |
1.8297 |
1.6968 |
0.1748 |
0.2763 |
0.4724 |
1.5188 |
1.9404 |
| Line 5 |
2.0006 |
1.9615 |
1.906 |
1.8258 |
1.695 |
0.7811 |
0.2602 |
0.4588 |
1.4404 |
1.9276 |
| 2.5 m/s |
Line 1 |
|
|
0.23 |
0.221 |
0.633 |
0.675 |
1.08 |
1.39 |
|
|
| Line 2 |
|
0.195 |
1.02 |
1.14 |
1.34 |
0.242 |
0.54 |
0.839 |
2.5 |
|
| Line 3 |
2.5 |
2.48 |
2.32 |
2.21 |
2.05 |
0.679 |
0.399 |
0.567 |
2.32 |
2.71 |
| Line 4 |
2.5 |
2.45 |
2.33 |
2.24 |
2.09 |
0.225 |
0.359 |
0.598 |
1.9 |
2.43 |
| Line 5 |
2.5 |
2.44 |
2.33 |
2.24 |
2.1 |
0.966 |
0.335 |
0.582 |
1.8 |
2.41 |
Table 4.
The TKE values at each flow characteristic measurement point in pipe containing the DF.
Table 4.
The TKE values at each flow characteristic measurement point in pipe containing the DF.
| TKE (m2/s2) |
| Vinlet
|
|
Point 1 |
Point 2 |
Point 3 |
Point 4 |
Point 5 |
Point 6 |
Point 7 |
Point 8 |
Point 9 |
Point 10 |
| 1.5 m/s |
Line 1 |
|
|
0.0382 |
0.0676 |
0.0539 |
0.0447 |
0.0347 |
0.0194 |
|
|
| Line 2 |
|
0.0248 |
0.1010 |
0.1190 |
0.0938 |
0.0322 |
0.014 |
0.0263 |
0.0062 |
|
| Line 3 |
0.0030 |
0.0004 |
0.0073 |
0.0577 |
0.0856 |
0.0181 |
0.0005 |
0.0032 |
0.0260 |
0.0260 |
| Line 4 |
0.0029 |
0.0004 |
0.0002 |
0.0001 |
0.0033 |
0.0030 |
0.0006 |
0.0022 |
0.0134 |
0.0135 |
| Line 5 |
0.0043 |
0.0054 |
0.0065 |
0.0070 |
0.0069 |
0.0107 |
0.0004 |
0.0011 |
0.0079 |
0.0107 |
| 2 m/s |
Line 1 |
|
|
0.0580 |
0.1196 |
0.1157 |
0.0373 |
0.0436 |
0.0295 |
|
|
| Line 2 |
|
0.0235 |
0.1925 |
0.2031 |
0.1504 |
0.0267 |
0.0160 |
0.0391 |
0.0097 |
|
| Line 3 |
0.0043 |
0.0005 |
0.0332 |
0.1179 |
0.0780 |
0.0127 |
0.0088 |
0.0131 |
0.0410 |
0.0372 |
| Line 4 |
0.0042 |
0.0005 |
0.0002 |
0.0002 |
0.0005 |
0.0105 |
0.0080 |
0.0122 |
0.0363 |
0.0455 |
| Line 5 |
0.0041 |
0.0005 |
0.0002 |
0.0002 |
0.0001 |
0.0113 |
0.0051 |
0.0177 |
0.0650 |
0.0779 |
| 2.5 m/s |
Line 1 |
|
|
0.0724 |
0.1796 |
0.1758 |
0.0558 |
0.0635 |
0.0467 |
|
|
| Line 2 |
|
0.0729 |
0.2367 |
0.2678 |
0.1616 |
0.0408 |
0.0284 |
0.0506 |
0.0141 |
|
| Line 3 |
0.0057 |
0.0006 |
0.0024 |
0.0082 |
0.0086 |
0.0516 |
0.0240 |
0.0180 |
0.0595 |
0.0539 |
| Line 4 |
0.0056 |
0.0006 |
0.0003 |
0.0002 |
0.0125 |
0.0968 |
0.0212 |
0.0185 |
0.0533 |
0.0711 |
| Line 5 |
0.0054 |
0.0006 |
0.0003 |
0.0002 |
0.0064 |
0.1417 |
0.0145 |
0.0256 |
0.1029 |
0.1283 |
Table 5.
The pressure values at each flow characteristic measurement point in the pipe containing the DF.
Table 5.
The pressure values at each flow characteristic measurement point in the pipe containing the DF.
| P () |
| Vinlet
|
|
Point 1 |
Point 2 |
Point 3 |
Point 4 |
Point 5 |
Point 6 |
Point 7 |
Point 8 |
Point 9 |
Point 10 |
| 1.5 m/s |
Line 1 |
|
|
8.0278 |
8.0941 |
8.1993 |
1.1769 |
1.0813 |
1.109 |
|
|
| Line 2 |
|
8.0278 |
8.0315 |
8.0977 |
8.1958 |
1.7097 |
1.0801 |
1.0683 |
0.3801 |
|
| Line 3 |
7.986 |
8.014 |
8.044 |
8.1011 |
8.203 |
5.255 |
1.0799 |
1.0594 |
0.3826 |
0.0227 |
| Line 4 |
7.9839 |
8.0061 |
8.0475 |
8.1034 |
8.215 |
8.2079 |
1.0802 |
1.0561 |
0.4198 |
-0.0228 |
| Line 5 |
7.9842 |
8.0059 |
8.0485 |
8.1033 |
8.2225 |
8.7235 |
1.081 |
1.0697 |
0.5462 |
0.0431 |
| 2 m/s |
Line 1 |
|
|
11.1955 |
11.3682 |
11.593 |
2.0497 |
1.8764 |
1.9262 |
|
|
| Line 2 |
|
11.2001 |
11.1925 |
11.3671 |
11.5954 |
2.7553 |
1.8729 |
1.8538 |
0.625 |
|
| Line 3 |
11.0707 |
11.1533 |
11.2309 |
11.374 |
11.6014 |
7.6196 |
1.8715 |
1.8329 |
0.6196 |
0.0101 |
| Line 4 |
11.0654 |
11.1386 |
11.2425 |
11.3858 |
11.6082 |
11.7556 |
1.8725 |
1.8231 |
0.7543 |
-0.0024 |
| Line 5 |
11.0636 |
11.1408 |
11.245 |
11.3897 |
11.6116 |
12.7695 |
1.874 |
1.8293 |
0.8535 |
0.0366 |
| 2.5 m/s |
Line 1 |
|
|
14.8 |
15 |
15.4 |
3.21 |
2.94 |
3.01 |
|
|
| Line 2 |
|
14.5 |
14.8 |
15 |
15.4 |
4.08 |
2.93 |
2.9 |
0.981 |
|
| Line 3 |
14.4 |
14.5 |
14.8 |
15 |
15.4 |
10.3 |
2.93 |
2.87 |
0.975 |
0.0182 |
| Line 4 |
14.4 |
14.5 |
14.8 |
15 |
15.3 |
15.5 |
2.93 |
2.85 |
1.18 |
0.0058 |
| Line 5 |
14.4 |
14.6 |
14.8 |
15 |
15.3 |
16.7 |
2.93 |
2.86 |
1.34 |
0.0623 |
|
Disclaimer/Publisher’s Note: The statements, opinions and data contained in all publications are solely those of the individual author(s) and contributor(s) and not of MDPI and/or the editor(s). MDPI and/or the editor(s) disclaim responsibility for any injury to people or property resulting from any ideas, methods, instructions or products referred to in the content. |
© 2023 by the authors. Licensee MDPI, Basel, Switzerland. This article is an open access article distributed under the terms and conditions of the Creative Commons Attribution (CC BY) license (http://creativecommons.org/licenses/by/4.0/).
