1. Introduction
Insulated-gate bipolar transistor (IGBT) is a key power semiconductor component of power electronic converters. IGBT has the advantages of semiconductor field effect transistor such as high input impedance, high switching speed, low switching loss, and it also has the advantages of bipolar transistor such as high current density, low saturation voltage drop, strong current processing capability, etc. For these reasons, it is widely used in rail transit, new energy, communications and other fields in recent years [
1,
2,
3]. With the rapid development of power semiconductor manufacturing technology, the volume of IGBT modules continues to decrease, and the external loading condition they need to bear is getting heavier, resulting in high failure rates. The aging failure of power devices will inevitably affect the normal operation of the entire system, and even cause huge economic losses in serious cases. Therefore, it is necessary to establish a reliable IGBT fault prediction system, predict the degradation trend of IGBT throughout the life cycle, and assist the system to grasp the fault information in advance.
The main methods for IGBT failure prediction are divided into reliability-based life prediction methods and data-driven methods based on failure precursor parameters [
4,
5]. Life prediction methods [
6,
7,
8] include physical analytical models and statistical models. The physical analytical models are built on the failure mechanism of IGBT, then predict stress, damage and reliability through finite element analysis or experiment. Based on the statistical method of data, the statistical models are used to fit the relationship between temperature average, temperature fluctuation value and number of failures. An electro-thermal stress analysis model for IGBT bonding line failure is established in [
6]. For failure modes such as bonding wires and solder layers, a new aging analysis method is proposed based on Miner linear failure accumulation theory [
7]. An accelerated life test scheme is given and used to evaluate the life of IGBTs under operating conditions [
8]. The IGBT life prediction method based on life prediction methods needs the accurate failure mechanism model of the device, but it is difficult to obtain the parameters of the mechanism model and to predict the IGBT life in real time.
The data-driven method based on fault precursor parameters [
9,
10,
11,
12,
13,
14,
15,
16] is built according to parameters that can characterize the aging of IGBTs. This method determines the current operation status and predicts the future parameter degradation of fault precursor parameters based on the collected data under historical operating conditions. The current research mainly extracts characteristic parameters from collector-emitter voltage data and predicts the performance degradation trend, which has the advantage that it is possible to give more accurate predictions through the historical data collected by the sensor without mastering the failure mechanism inside the IGBT. At present, the research on IGBT health evaluation and prediction focuses on the failure modes such as latch-up effect and bonding line failure of IGBT chips, and a series of modeling analysis is mainly carried out with respect to collector-emitter voltage. Ge et al. use the peak-to-peak of transient collector-emitter voltage as an indicator of IGBT performance degradation, and uses DeepAR prediction model to predict the remaining lifetime of IGBT in [
9]. Lu and Christou also extracts the performance degradation indicator from the collector-emitter voltage, and uses the long short-term memory (LSTM) prediction model to predict the performance degradation trend of IGBT, and the average absolute error can be predicted as low as 0.0322 in [
10]. Zhang [
11,
12] et al. extracted the parameters such as saturation voltage drop and tailing current for fusion, introduced a comprehensive health indicator, and obtained IGBT health status assessment results. Liu et al. introduce CCN-LSTM hybrid model to build the IGBT life prediction with respect to collector emitter voltage that characterizes IGBT failure modes of weld layer failure and latch failure in [
13]. The more results about the data-driven prediction method can be referred to [
14,
15,
16].
In rail transit, new energy, communications and other fields, grid oxide degradation is one of the main failure mechanisms of IGBT [
17,
18]. This failure mechanism can be characterized by collector-emitter voltage parameters as well as gate leakage current. The degradation of IGBT gate oxide layer results in small amplitude of gate leakage current change, therefore the extraction of weak degradation features and modeling of degradation law need exquisite modeling skills. In engineering practice, because the acquisition of IGBT collector-emitter voltage involves high voltage test, the volume of the monitoring module may be large. Thus, it is difficult to collect collector-emitter voltage in the limited space of high-speed trains, communications and other equipment systems. In contrast, the monitoring module required to collect gate leakage current is small, so it is more feasible to monitor and predict the degradation trend of gate leakage current (I
G) due to gate oxide degradation.
Therefore, the gate leakage current (IG) is selected as the precursor parameter of IGBT gate oxide degradation for feature extraction, degradation trend modeling and prediction technology in this paper. Firstly, the time domain analysis of IG is carried out, and the characteristic dimensionality reduction is fused into a health indicator which can characterize the degradation degree of IGBT gate oxide layer by combining the gray correlation degree, Mahalanobis distance, and Kalman filter methods. Secondly, this paper introduces a Convolutional Neural Network and Long Short-Term Memory (CNN-LSTM) network to obtain the real-time prediction of performance degradation. Finally, this paper uses the dataset published by NASA Ames Laboratory to verify the effectiveness of the CNN-LSTM network, and discusses the prediction error using different prediction models.
2. Analysis of IGBT Failure Modes and Their Precursor Parameters
The degradation of the health state of IGBT is a process of gradual evolution under the action of external stress, and the degradation of each precursor parameter of IGBT is monitored in real time by condition monitoring technology, and the potential failure can be detected in advance when the health state of IGBT is approaching to failure. This section gives a brief overview on the failure modes of IGBT and their common precursor parameters.
2.1. Failure Mode Analysis
The failure mode of IGBT is mainly divided into two categories such as chip internal failure and device package failure. The chip internal failure modes include overstress failure, latch-up effect and gate failure, mainly caused by the electrical overstress and charge effect existing inside the chip. These failure modes are manifested in the form of secondary device breakdown, latch-up failure, gate oxide layer breakdown, etc.
The package-related failure is mainly caused by the different coefficients of thermal expansion of the metal materials in the IGBT package, and the structure of the connecting part is constantly affected under the action of thermal stress, which eventually leads to the failure phenomena, such as bond wire shedding, solder layer aging and aluminum metal reconstruction.
2.2. Selection of Precursor Parameters
The studies [
6,
7,
8,
9,
10,
11,
12,
13,
14,
15,
16,
17,
18] show that the IGBT failure precursor parameters can directly or indirectly reflect the IGBT health state, mainly including collector-emitter voltage (V
CE), gate-emitter threshold voltage (V
GEth), collector shutdown current (I
C), gate leakage current (I
G), junction temperature and thermal resistance, etc.
V
CE can be used as a precursor parameter for both failure modes of weld layer failure and latch failure. The latch-up effect caused by chip bonding tends to cause V
CE to decrease, while bond wire detachment failure tends to increase V
CE values. Due to the decline of V
CE caused by chip bonding and the loss of bonding wires, the increase in V
CE value has a high impact, and it is generally believed that the V
CE value increases when IGBT aging. The V
CE is the most commonly used health monitoring parameter due to its easy detection of V
CE through sensors under laboratory conditions [
9,
10,
11,
12,
13,
14,
15,
16]. The part of the shutdown current I
C in the slow falling phase of the IGBT is called the tail current, and the shutdown current duration can be used as a performance parameter to characterize the IGBT latch-up effect, so the tailing current can also be used as an electrical parameter to characterize the IGBT latch-up effect.
The gate-emitter threshold voltage V
GEth and gate leakage current I
G can be used to characterize the degradation of the gate oxide layer of IGBT devices [
17,
18]. As the device health aging process changes, the degradation of IGBT performance affects the internal structure of the device's gate oxide layer, and the change of the oxide layer will cause the gate capacitance parameters to also change. Although V
GEth can be monitored by certain techniques under laboratory conditions, it is currently difficult to monitor the gate emitter voltage using sensors in practical application sites. In contrast, the monitoring circuit of the gate leakage current I
G is small, and this parameter can be used as a precursor parameter for the performance degradation of the gate oxide layer of IGBT devices in engineering.
Junction temperature and thermal resistance are mainly used to characterize package-related failure modes such as IGBT solder layer degradation [
6,
7,
8]. An easy way to measure junction temperature is to place a temperature sensor close to the module junction, capable of measuring junction temperature online without interrupting the normal operation of the IGBT. However, this method is invasive, and the accuracy of the measurement is affected by the sensor position. If the temperature and heat generation are known, in order to easily measure the actual solder damage parameters within the IGBT module, an accurate electro-thermal model needs to be established to calculate the thermal resistance and power lost.
In summary, the precursor parameters of IGBT gate oxide degradation failure are gate-emitter threshold voltage and gate leakage current. Because the online detection required to collect gate leakage current is easy to achieve in engineering, this paper takes gate leakage current as the precursor parameter to carry out IGBT gate oxide degradation modeling and prediction research, which provides a method model for online detection, feature extraction and health state prediction of IGBT gate oxide performance degradation.
2.3. Analysis of Performance Degradation Mechanism and Its Precursor Parameter of Gate Oxide Layer
The change of gate leakage current characteristics of IGBT is mainly caused by the degradation of the performance of the gate oxide layer of the device, the inherent pinhole defect of the gate silica film insulation layer or the late fatigue aging will cause the IGBT to undergo gate Al-SiO2 interface ion diffusion and Si-SiO2 interface charge density increase and other changes, due to the presence of electron traps, hole traps, neutral traps in the gate oxide layer when the oxide tunnel has current through the trap, will capture carriers, accumulate positive or negative charge. The accumulated movable ion charge, interface trap charge, oxide trap charge, etc. will enhance the local electric field of the oxide layer, further increase the leakage current, and eventually the gate oxide layer will breakdown, causing the gate control failure. Therefore, gate leakage current IG can be used as a precursor parameter for the degradation failure of IGBT gate oxide layer.
For this reason, IG is used as the precursor parameter of the performance degradation failure of the IGBT gate oxide layer, the performance degradation indicator of IGBT is obtained by time domain analysis, feature selection, fusion and noise reduction, and the CNN-LSTM network is introduced to predict the performance degradation of IGBT, and the effectiveness of the prediction algorithm is verified by open dataset.
3. Construction of Performance Degradation Indicator of IGBT Gate Oxide Layer
For the performance degradation of IGBT gate oxide layer, the performance degradation indicator can visually characterize the aging degree of the gate oxide layer of IGBT, which is the input of the prediction model. When the model prediction result reaches the failure threshold, it means that the IGBT fails.
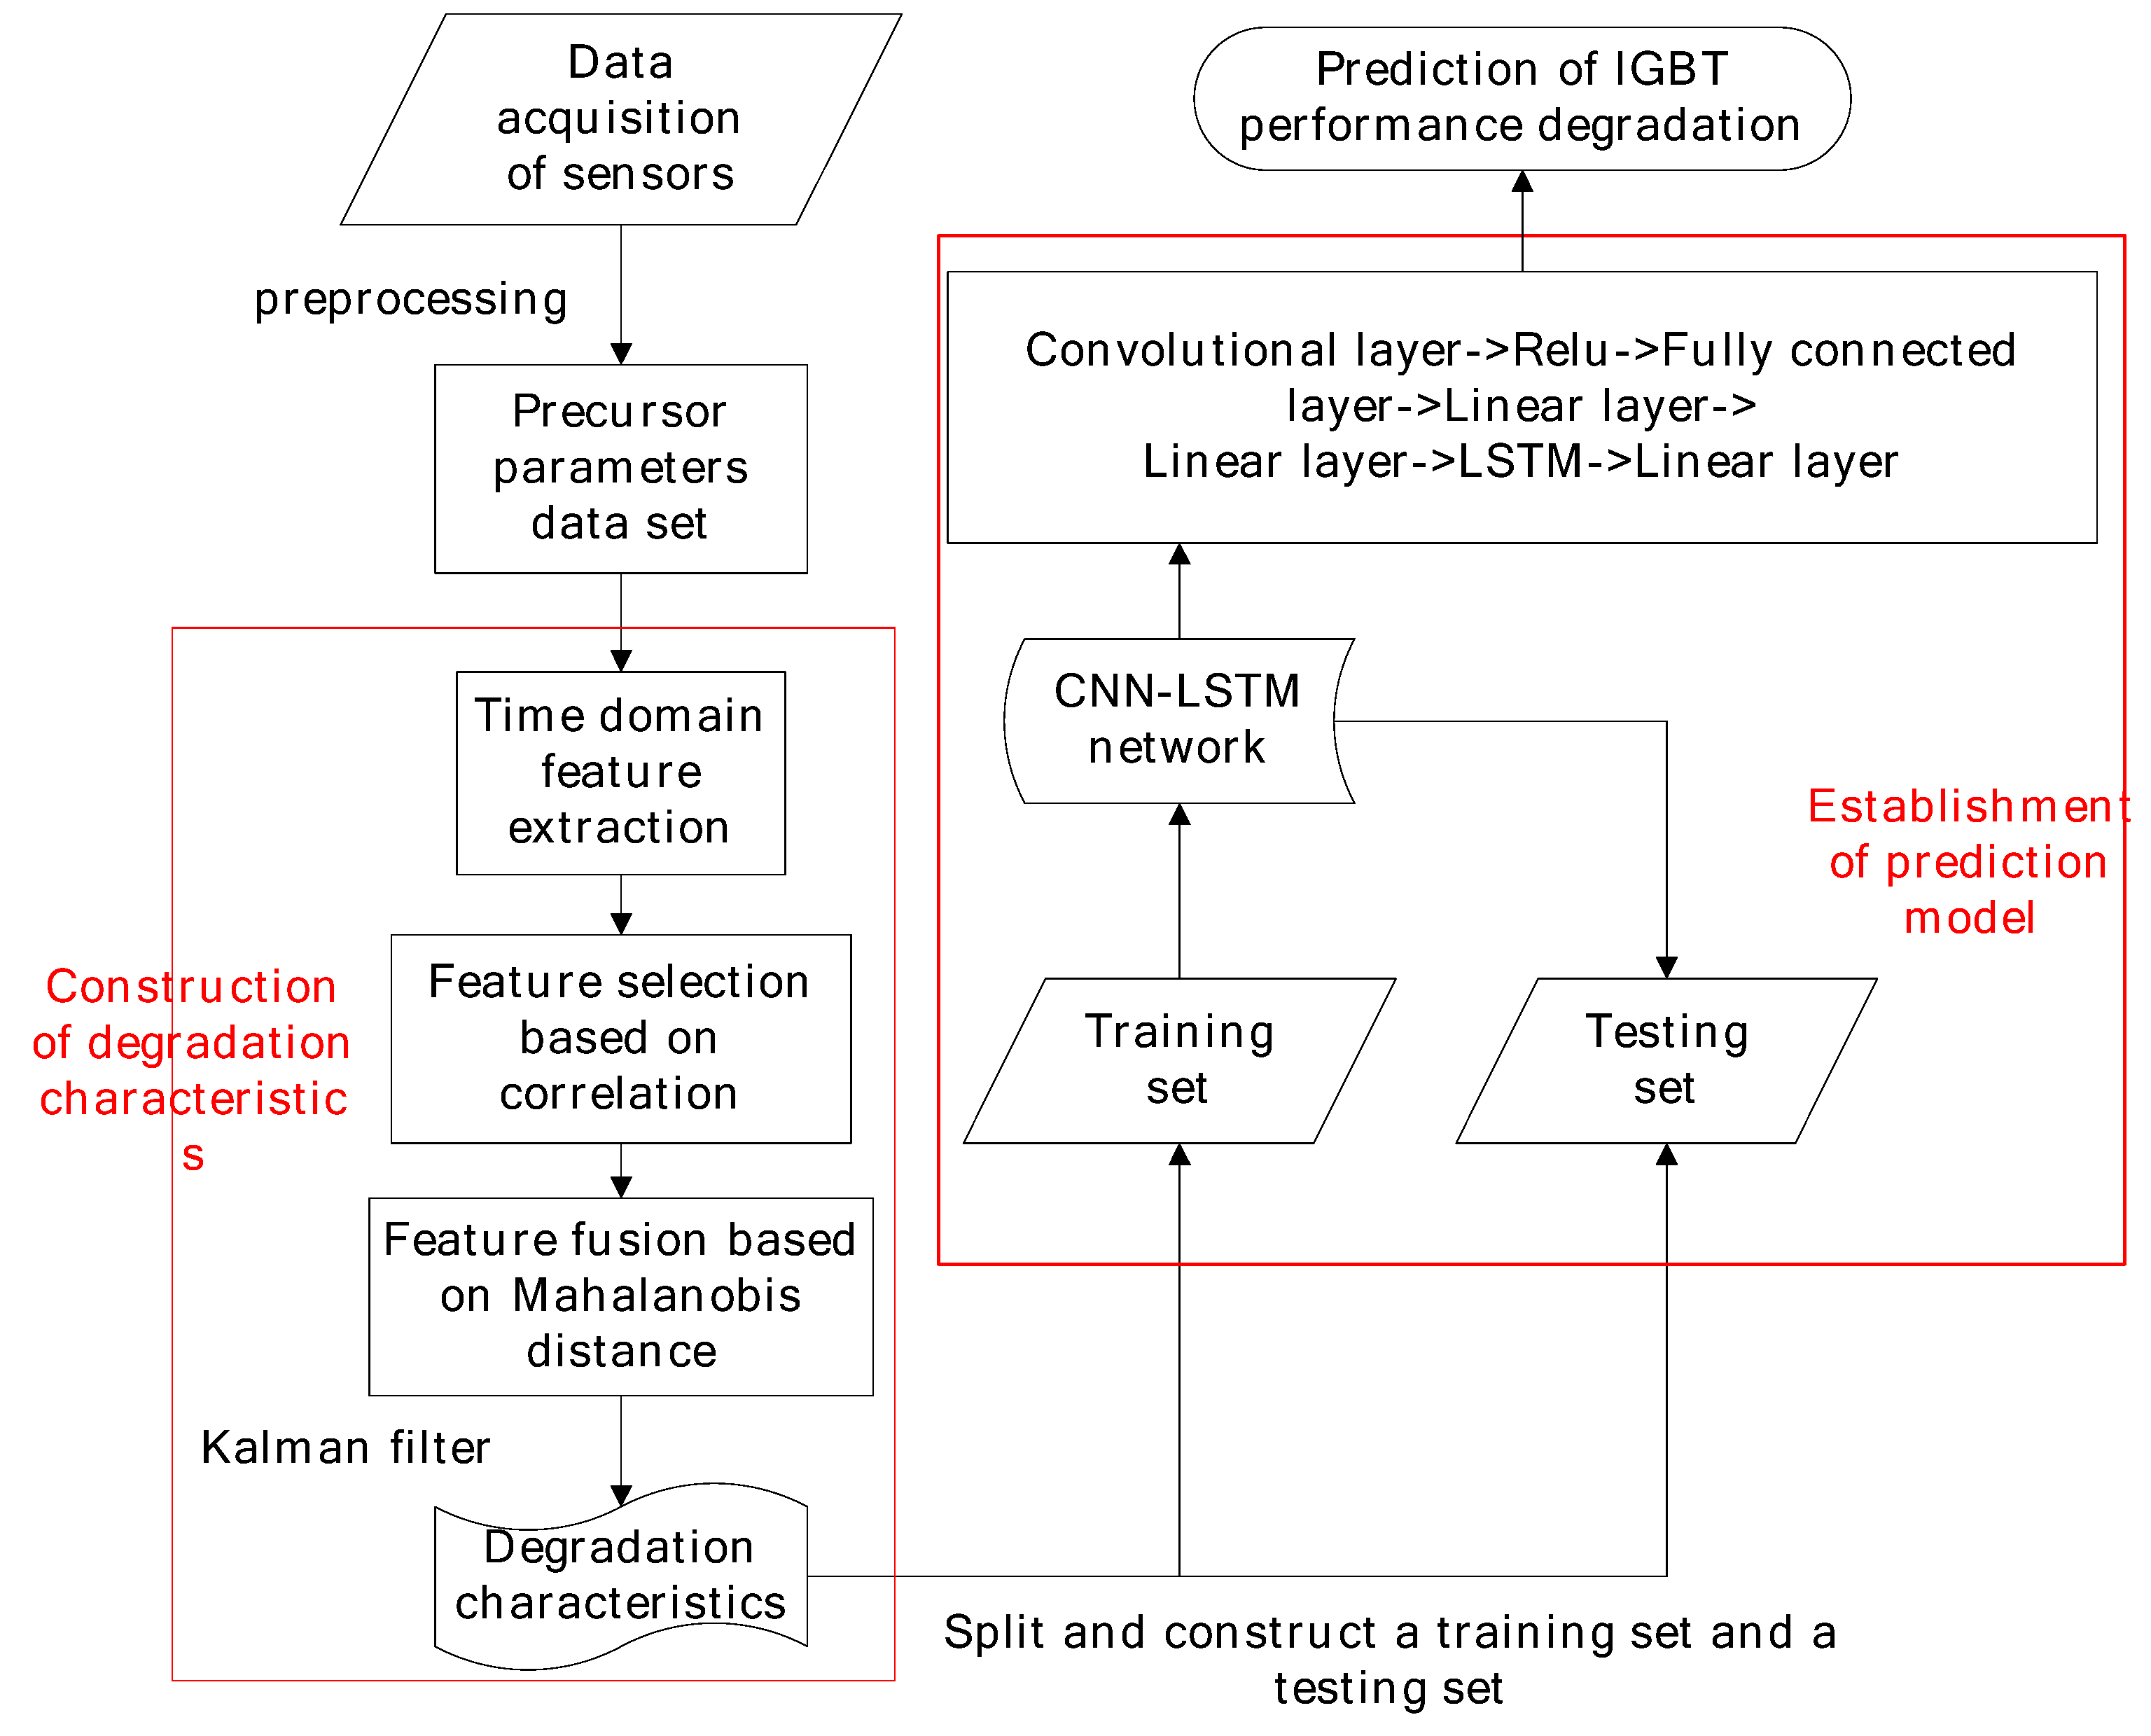
In this paper, the 13 time-domain features such as maximum, minimum, variance and skewness etc. are extracted by time domain analysis of the I
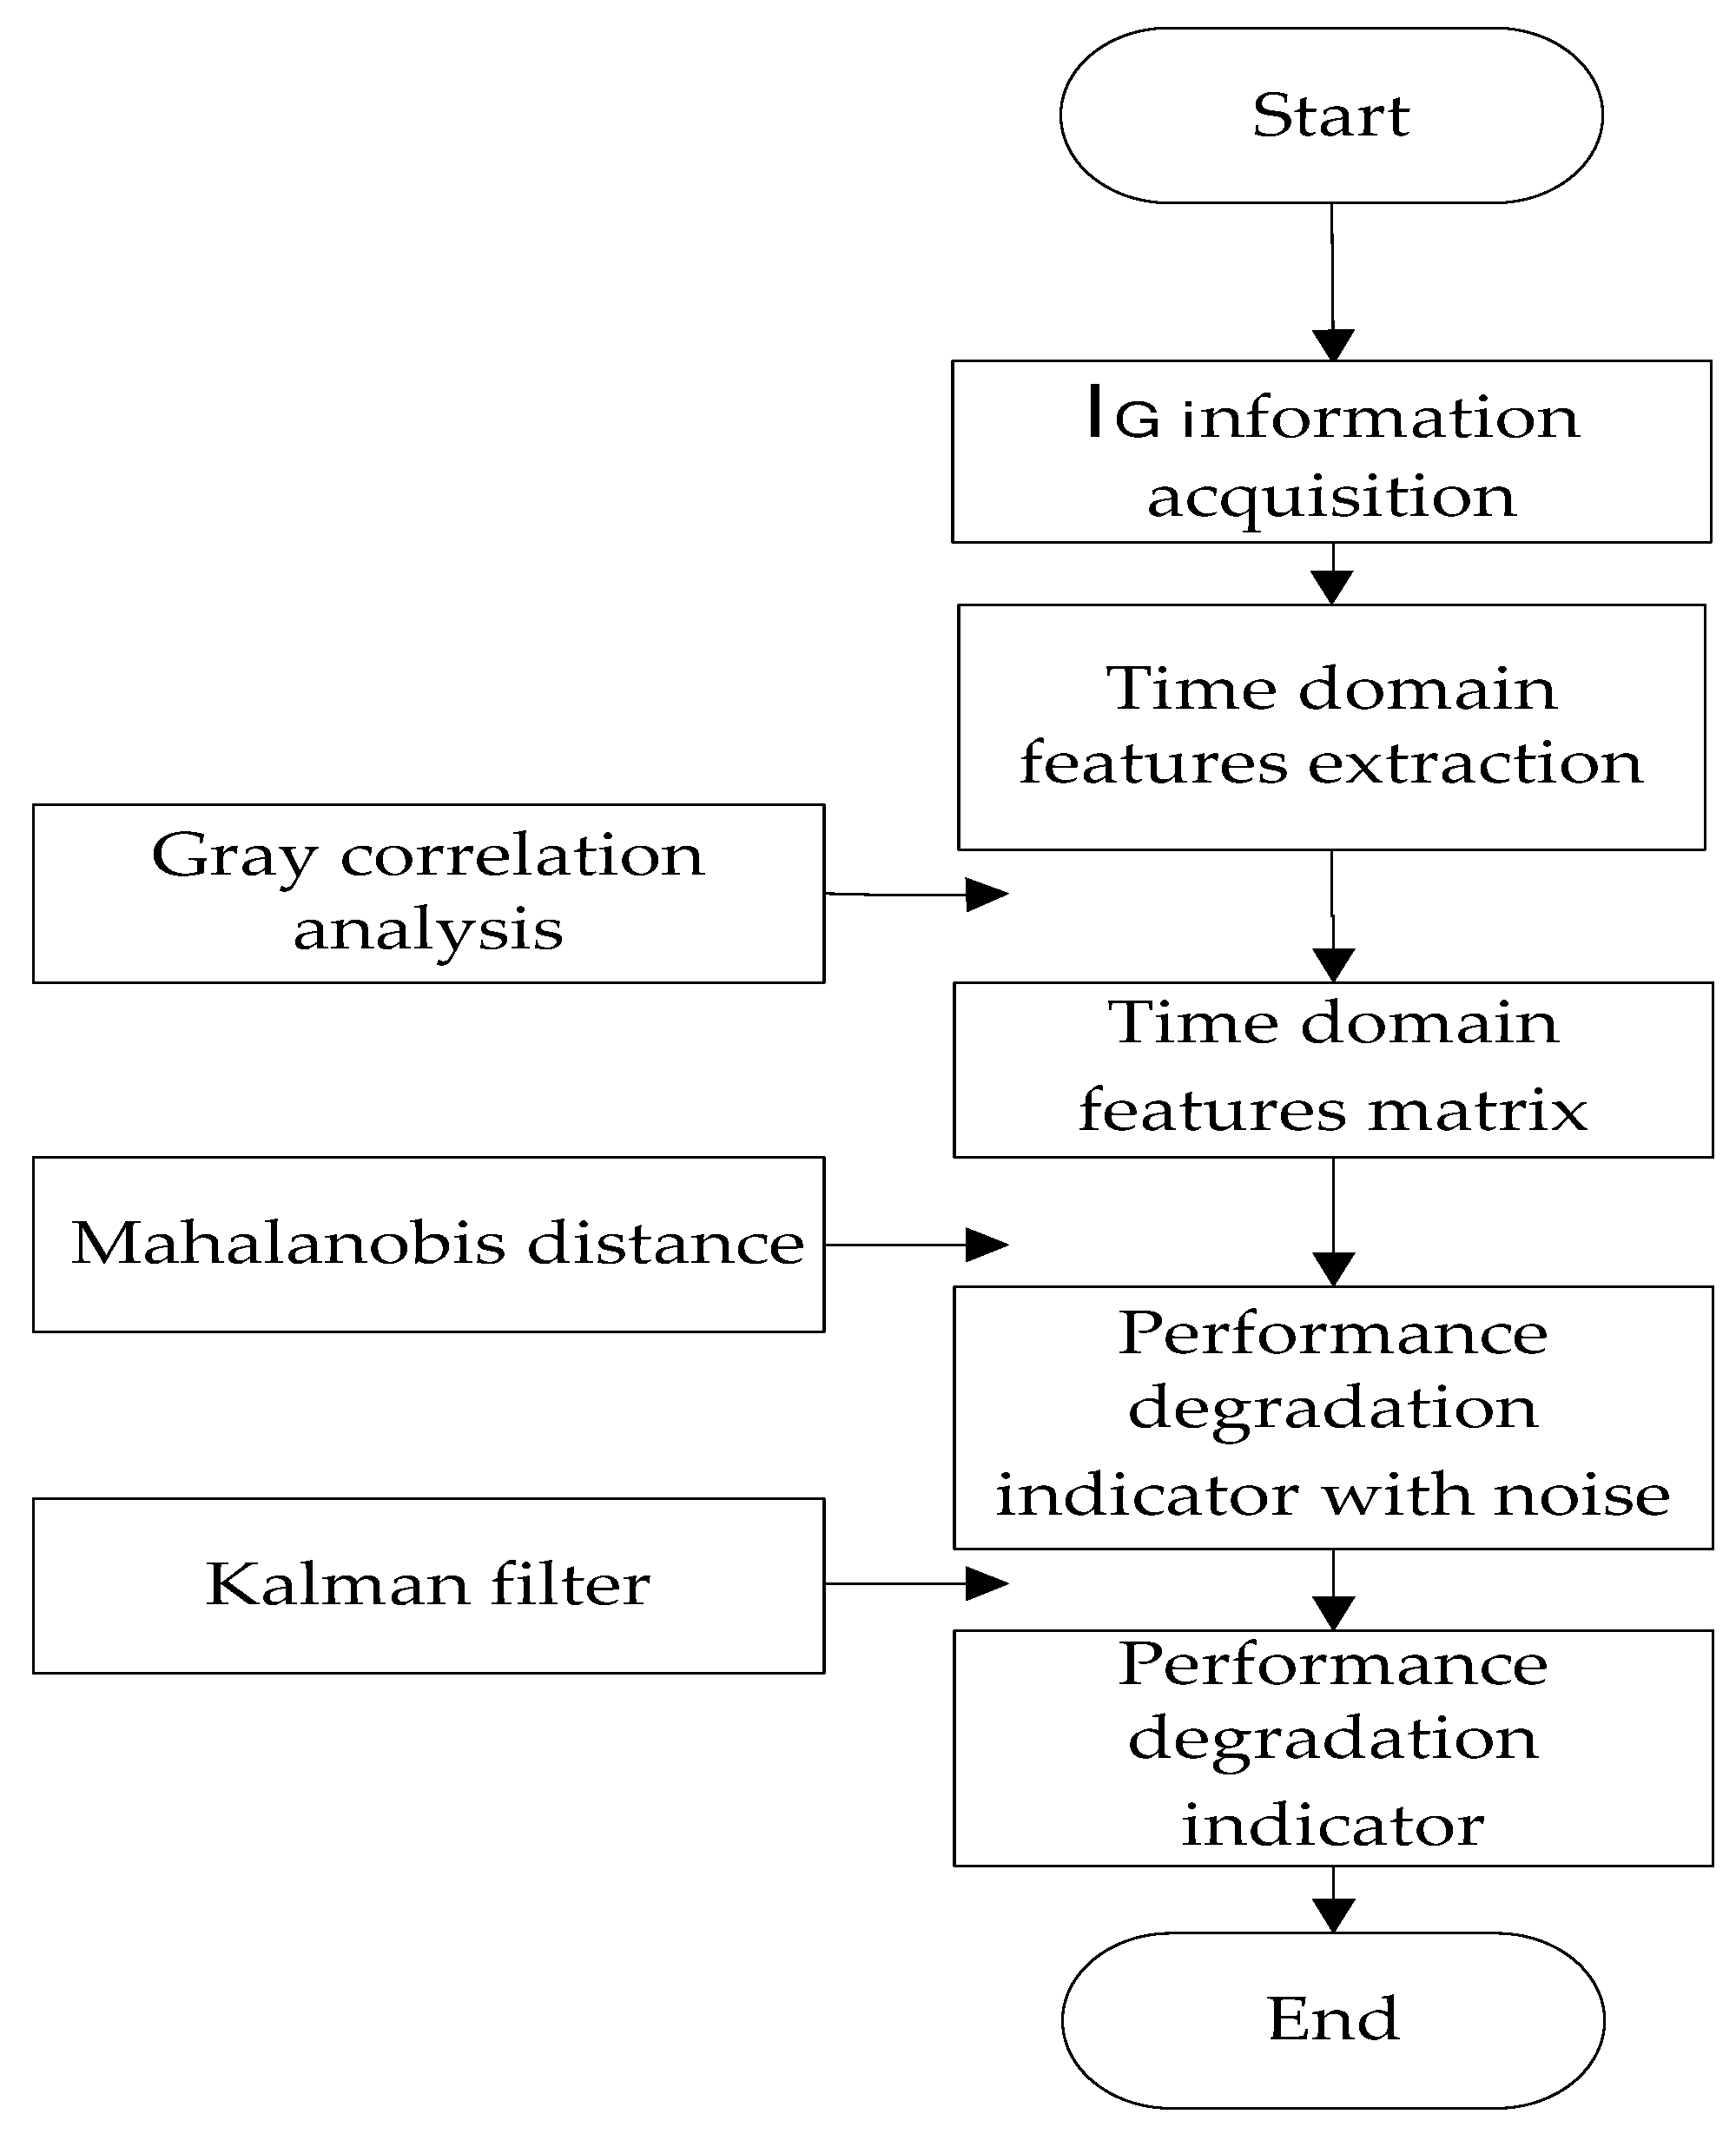
G, and then the IGBT performance degradation indicator MD is obtained through feature selection, fusion and noise reduction. The construction of this performance degradation indicator is shown in
Figure 1. To be more specific, this construction process is given in subsection 3.1, 3.2 and 3.3, respectively.
3.1. Precursor Parameter IG Information Acquisition
In this paper, the IGBT aging experimental data released by NASA was used, and the last 700 cycles data at the end of the experiment were selected for experimental analysis for secondary acquisition, and the last 10 cycle data after IGBT failure were excluded. IGBT goes through a turn-on and turn-off once means a cycle. In this paper, the gate leakage current IG is used as a precursor parameter to the failure of the gate oxide layer, and when the IGBT is turned off, the small current flowing through the gate is IG.
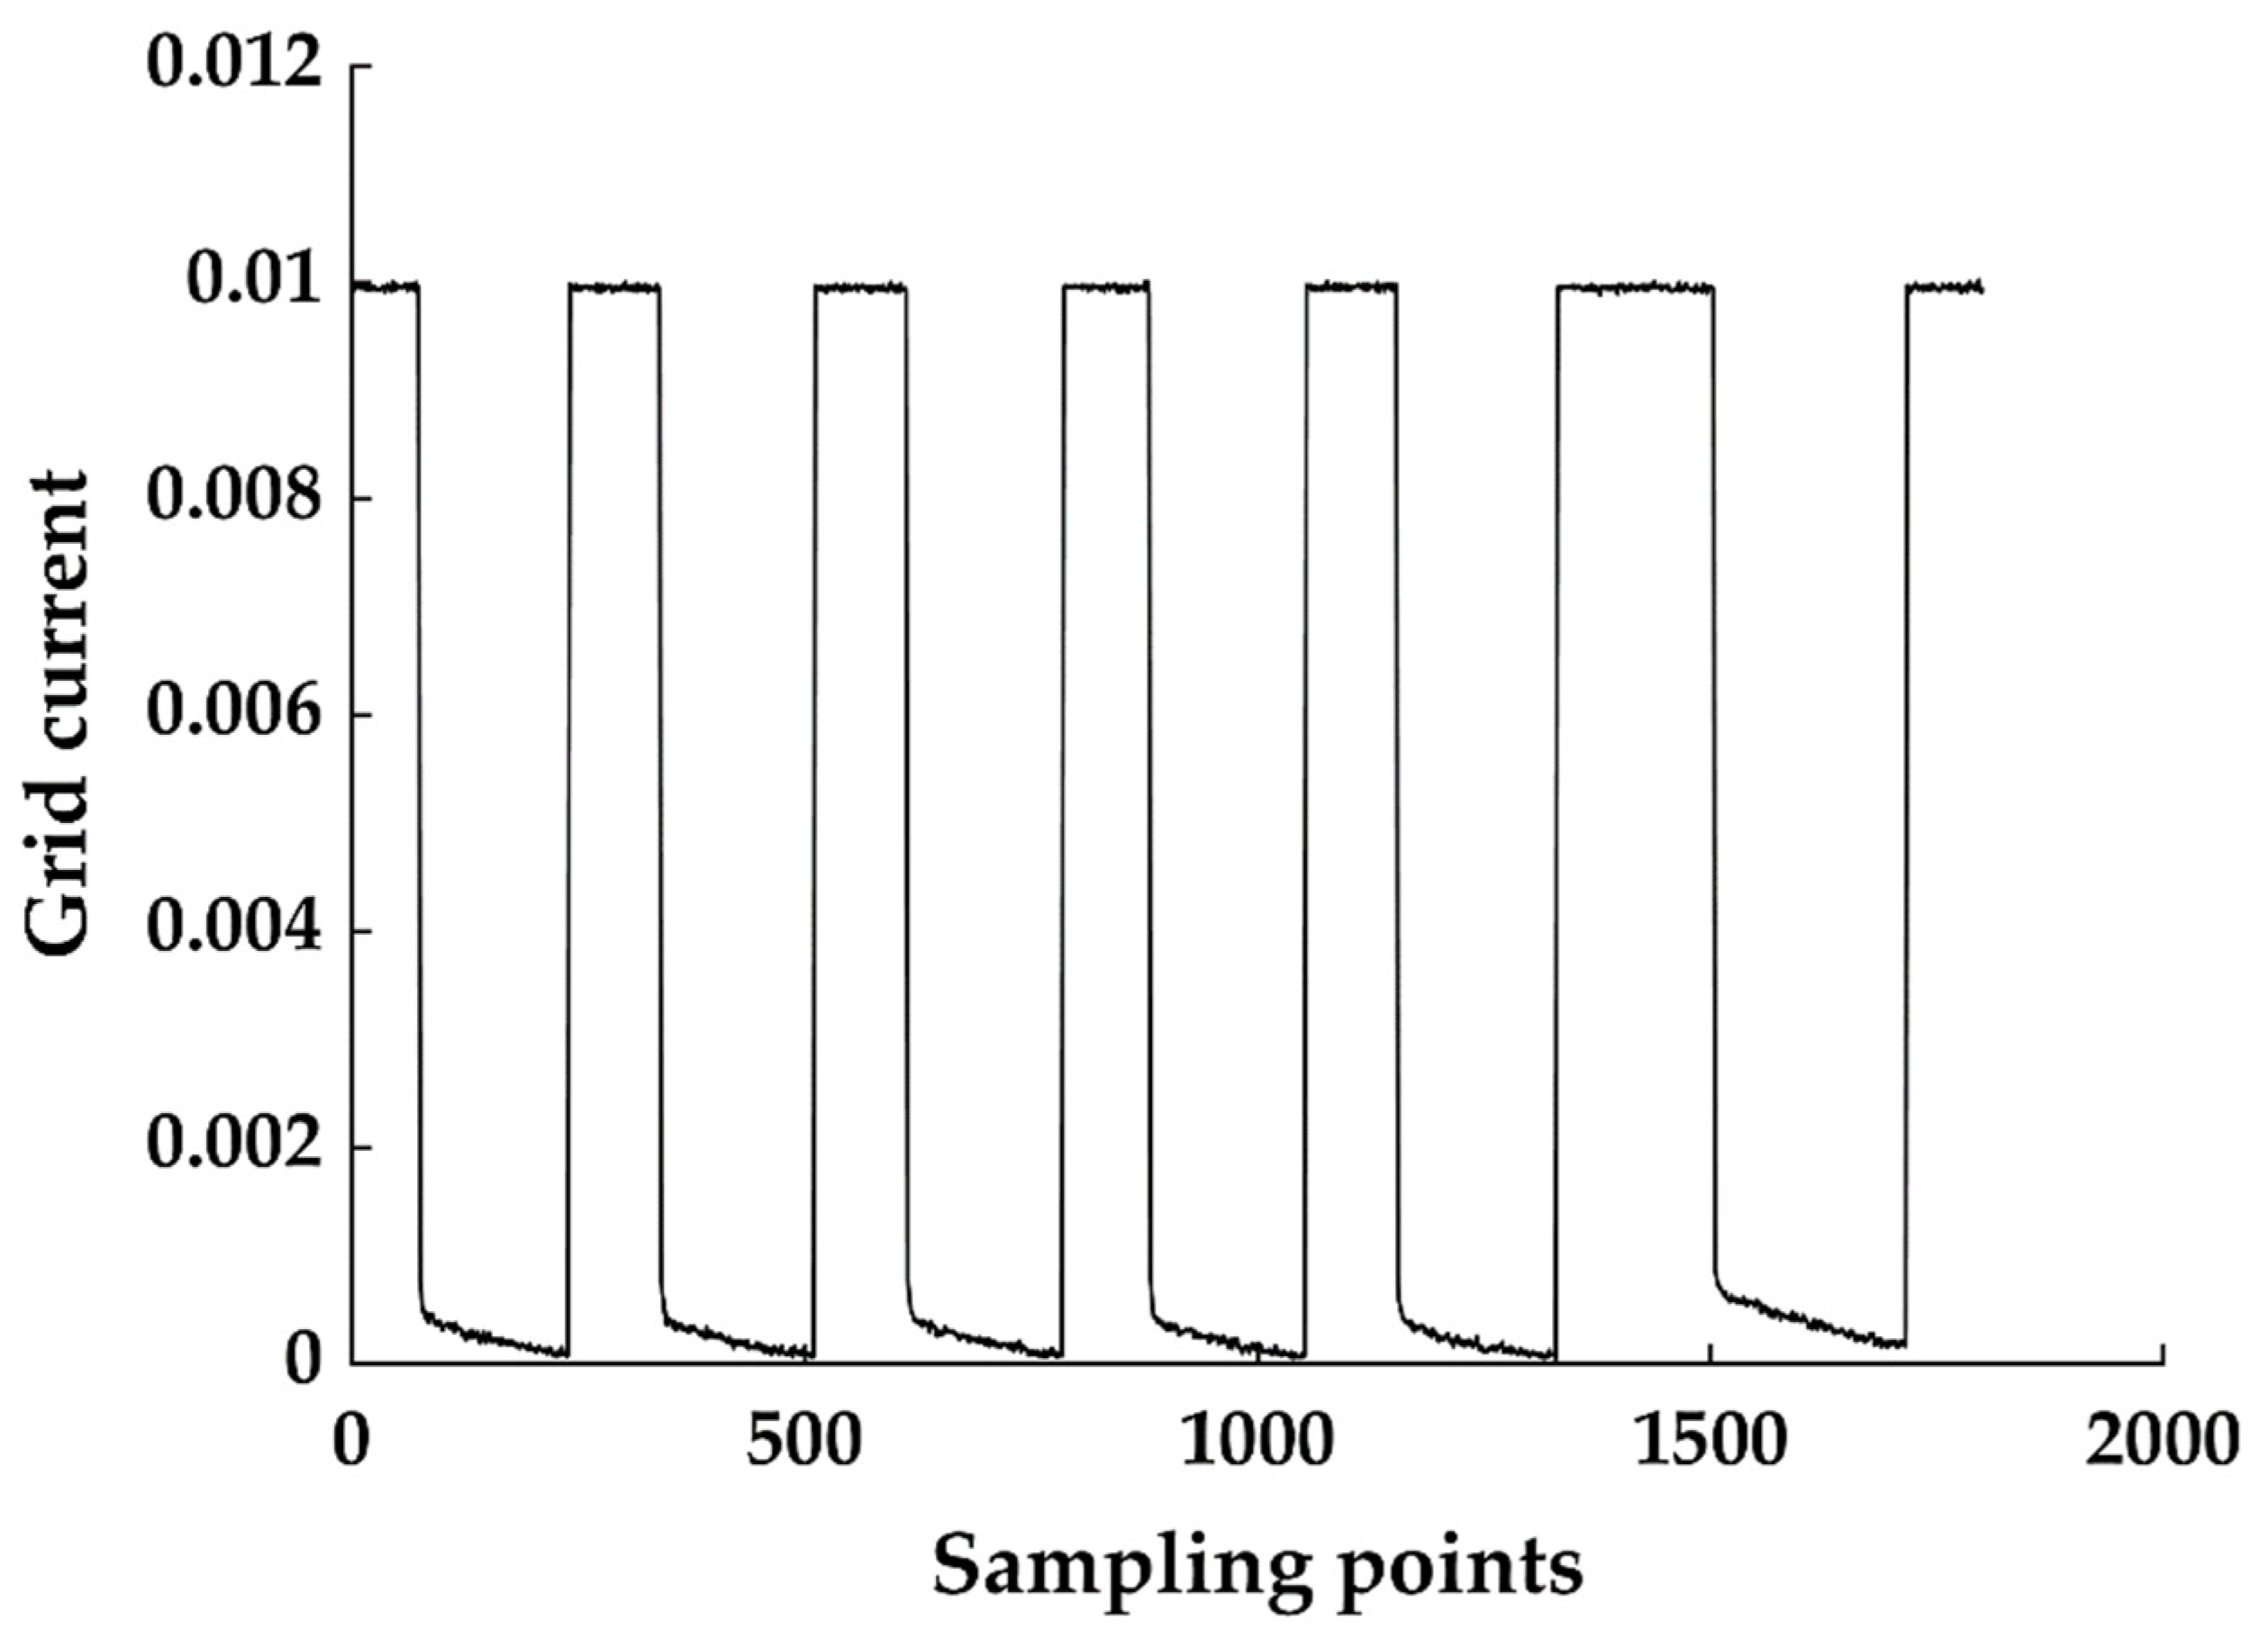
Figure 2 shows part of the dynamic curve of the gate current, and it can be observed that the current gap between the on-time and the off-time is significant, so the threshold value can be set for collecting I
G.
3.2. Gray Correlation Calculation of Time Domain Features
The time domain features of the extracted 13 time-domain features do not all contain the degradation information of the gate oxide layer of IGBT, and the development trends of different features have certain similarities, which is very suitable for studying the correlation within each other by gray correlation, so as to further extract the necessary features. The correlation calculation formula used in this paper is as follows:
where is the difference between the sequence X
0 and Xi at each point, and its calculation method is given in equation (2), ζ represents the resolution coefficient, and the value range is (0,1).
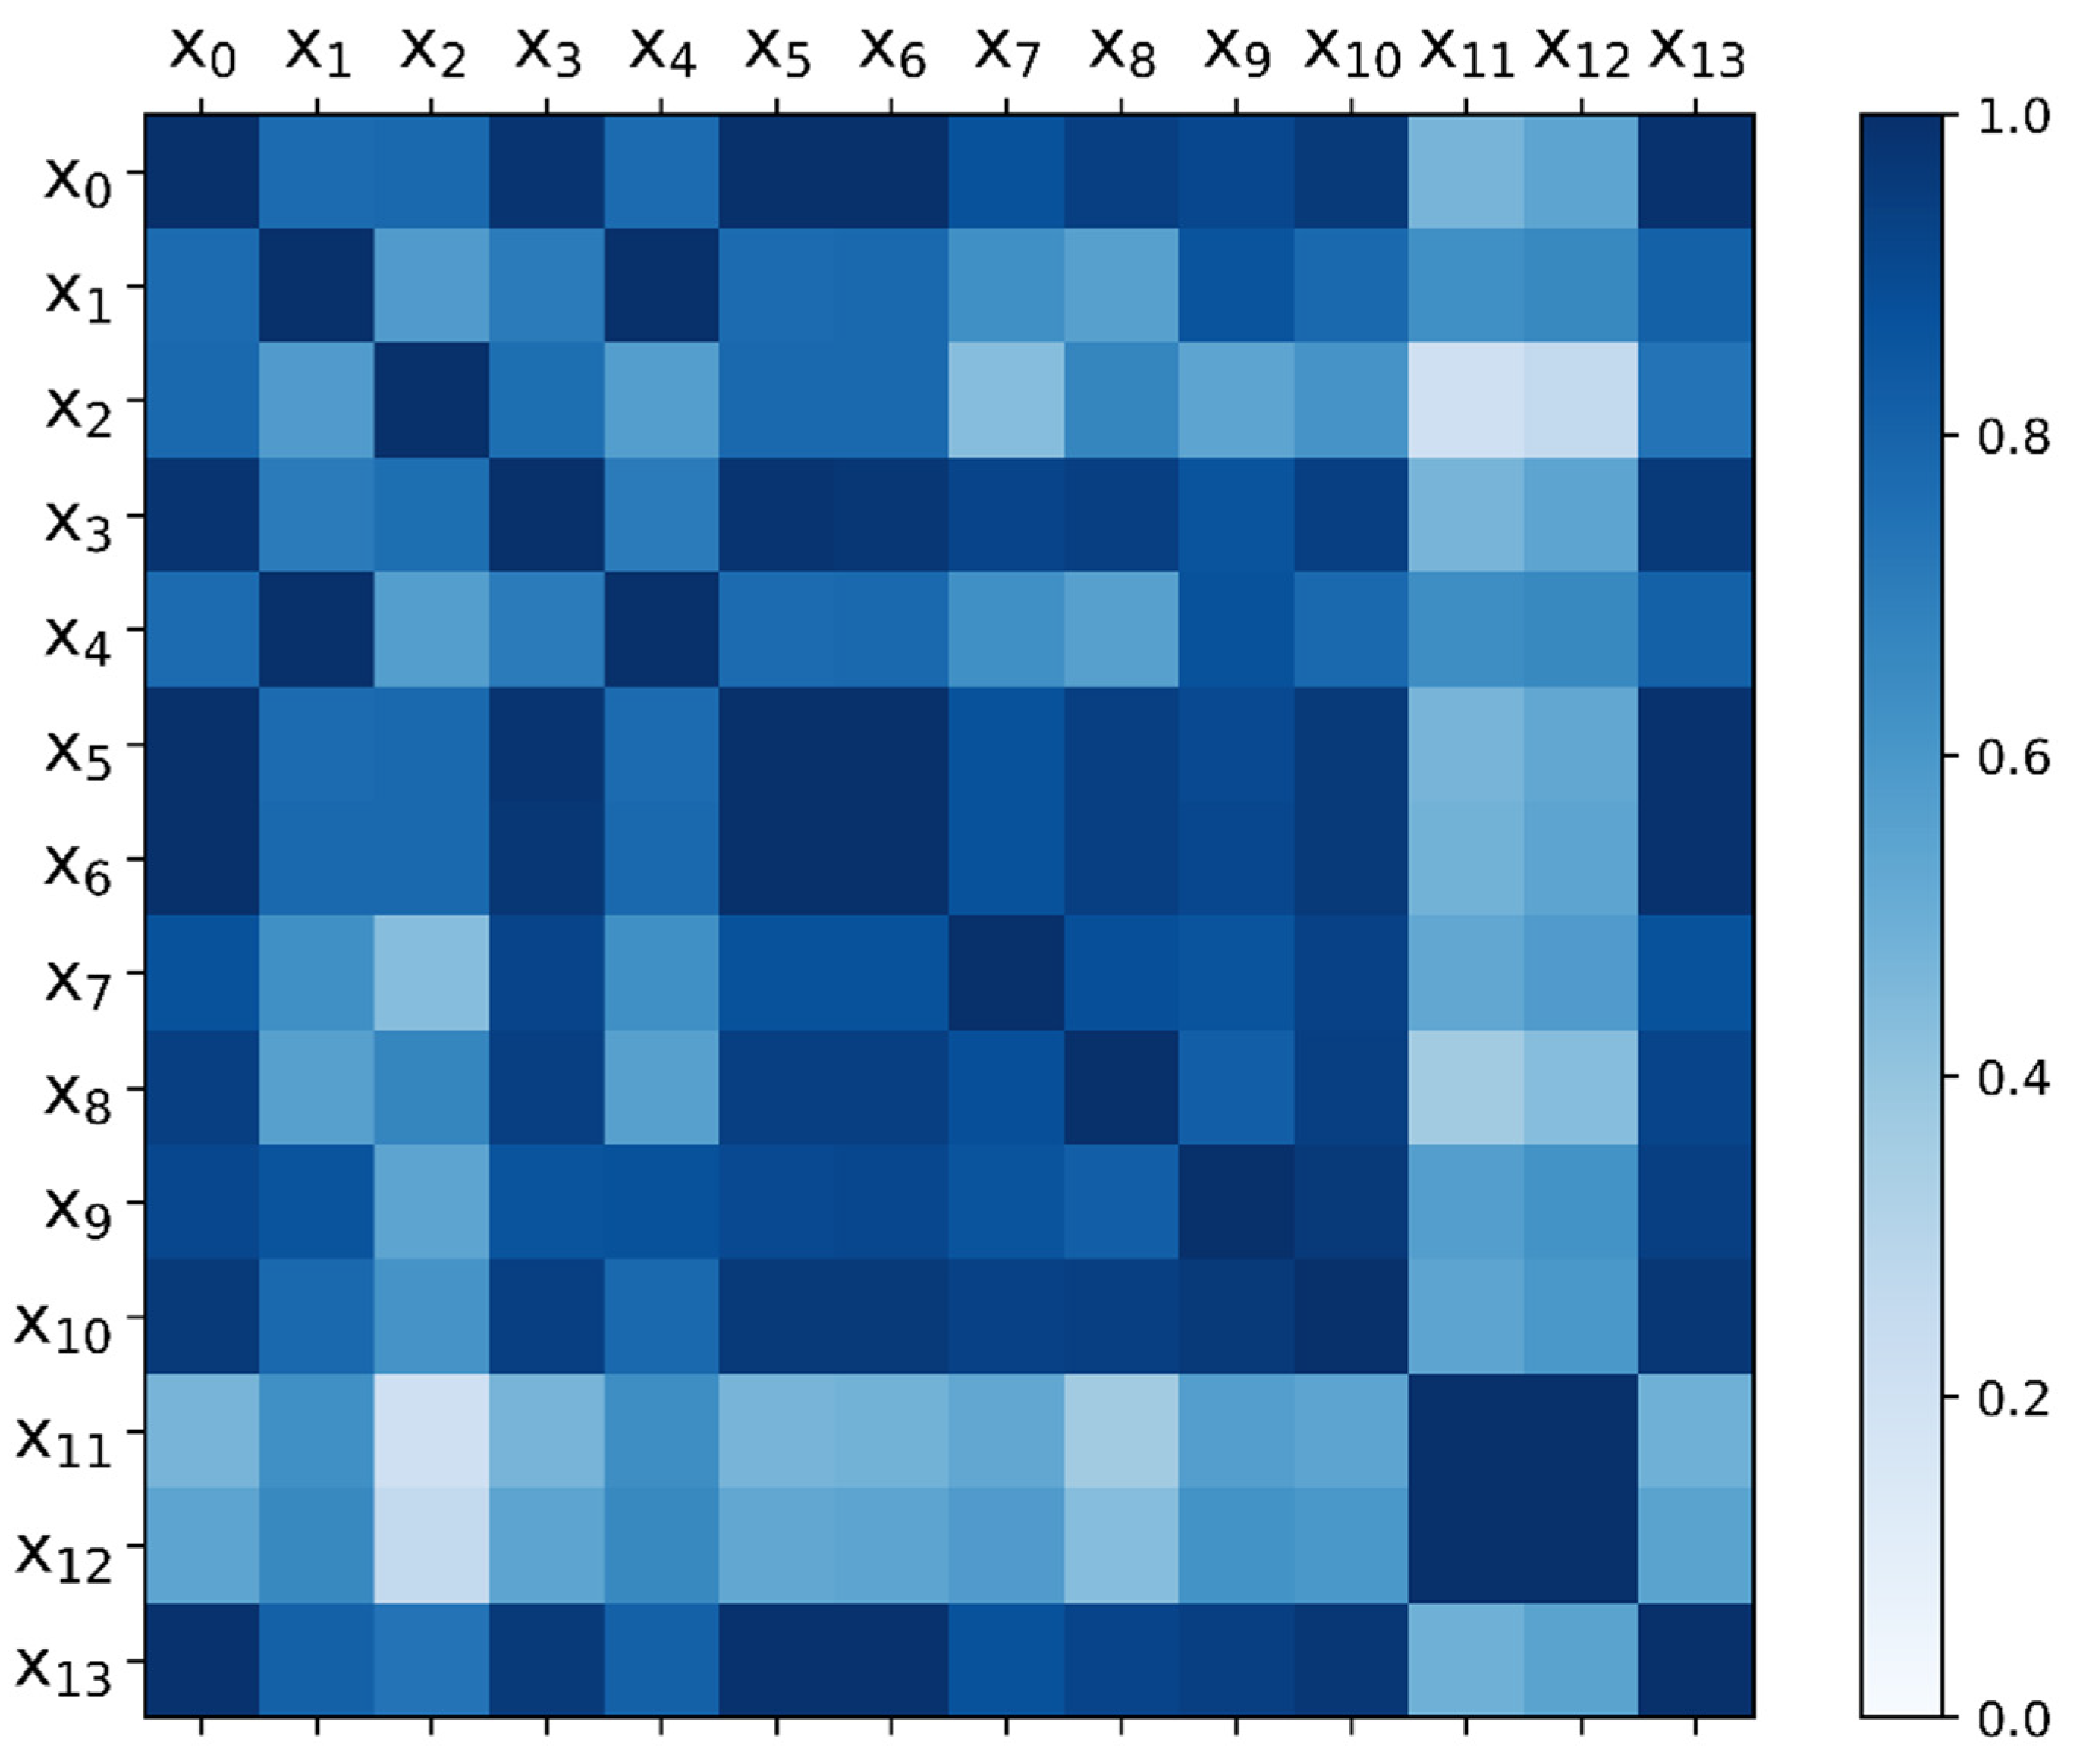
Finally, the thermal diagram of the correlation degree of I
G characteristics in each time domain is obtained as shown in
Figure 3.
The shade of color in
Figure 3 indicates the degree of correlation between the two sequences, and it can be deduced that the correlation between different features is high or low, and the correlation between features and cycle periods is also different. The degradation of the gate oxide layer of IGBT is a time-sensitive process, so the features with high correlation with the cycle should be the available features with more degradation information, and in order to avoid the relevance between different features affecting the results, the features with high correlation are further eliminated. Finally, the selected I
G time domain features include RMS root mean square, steepness and kurtosis.
3.3. Features Fusion and Nosie Reduction
In section 3.2 of this paper, a well-performing time domain feature has been selected, but a unified indicator is required to characterize the performance degradation of IGBTs, and the acquired data contains a lot of noise and needs to be reduced. In this paper, the feature matrix is built based on Mahalanobis distance (MD), and the noise is reduced by Kalman filter theory.
The larger Mahalanobis distance (MD) is, the greater the deviation between sample sets is, which is consistent with the degradation process of IGBT. There are sample set X and sample set Y, where the X is a row vector composed of n sample points, and the Y is m×n-dimensional sample set. The Mahalanobis distance between X and Y is calculated as shown in formula (3).
where is the barycenter of Ym×n, and Σ-1 is covariance of Ym×n.
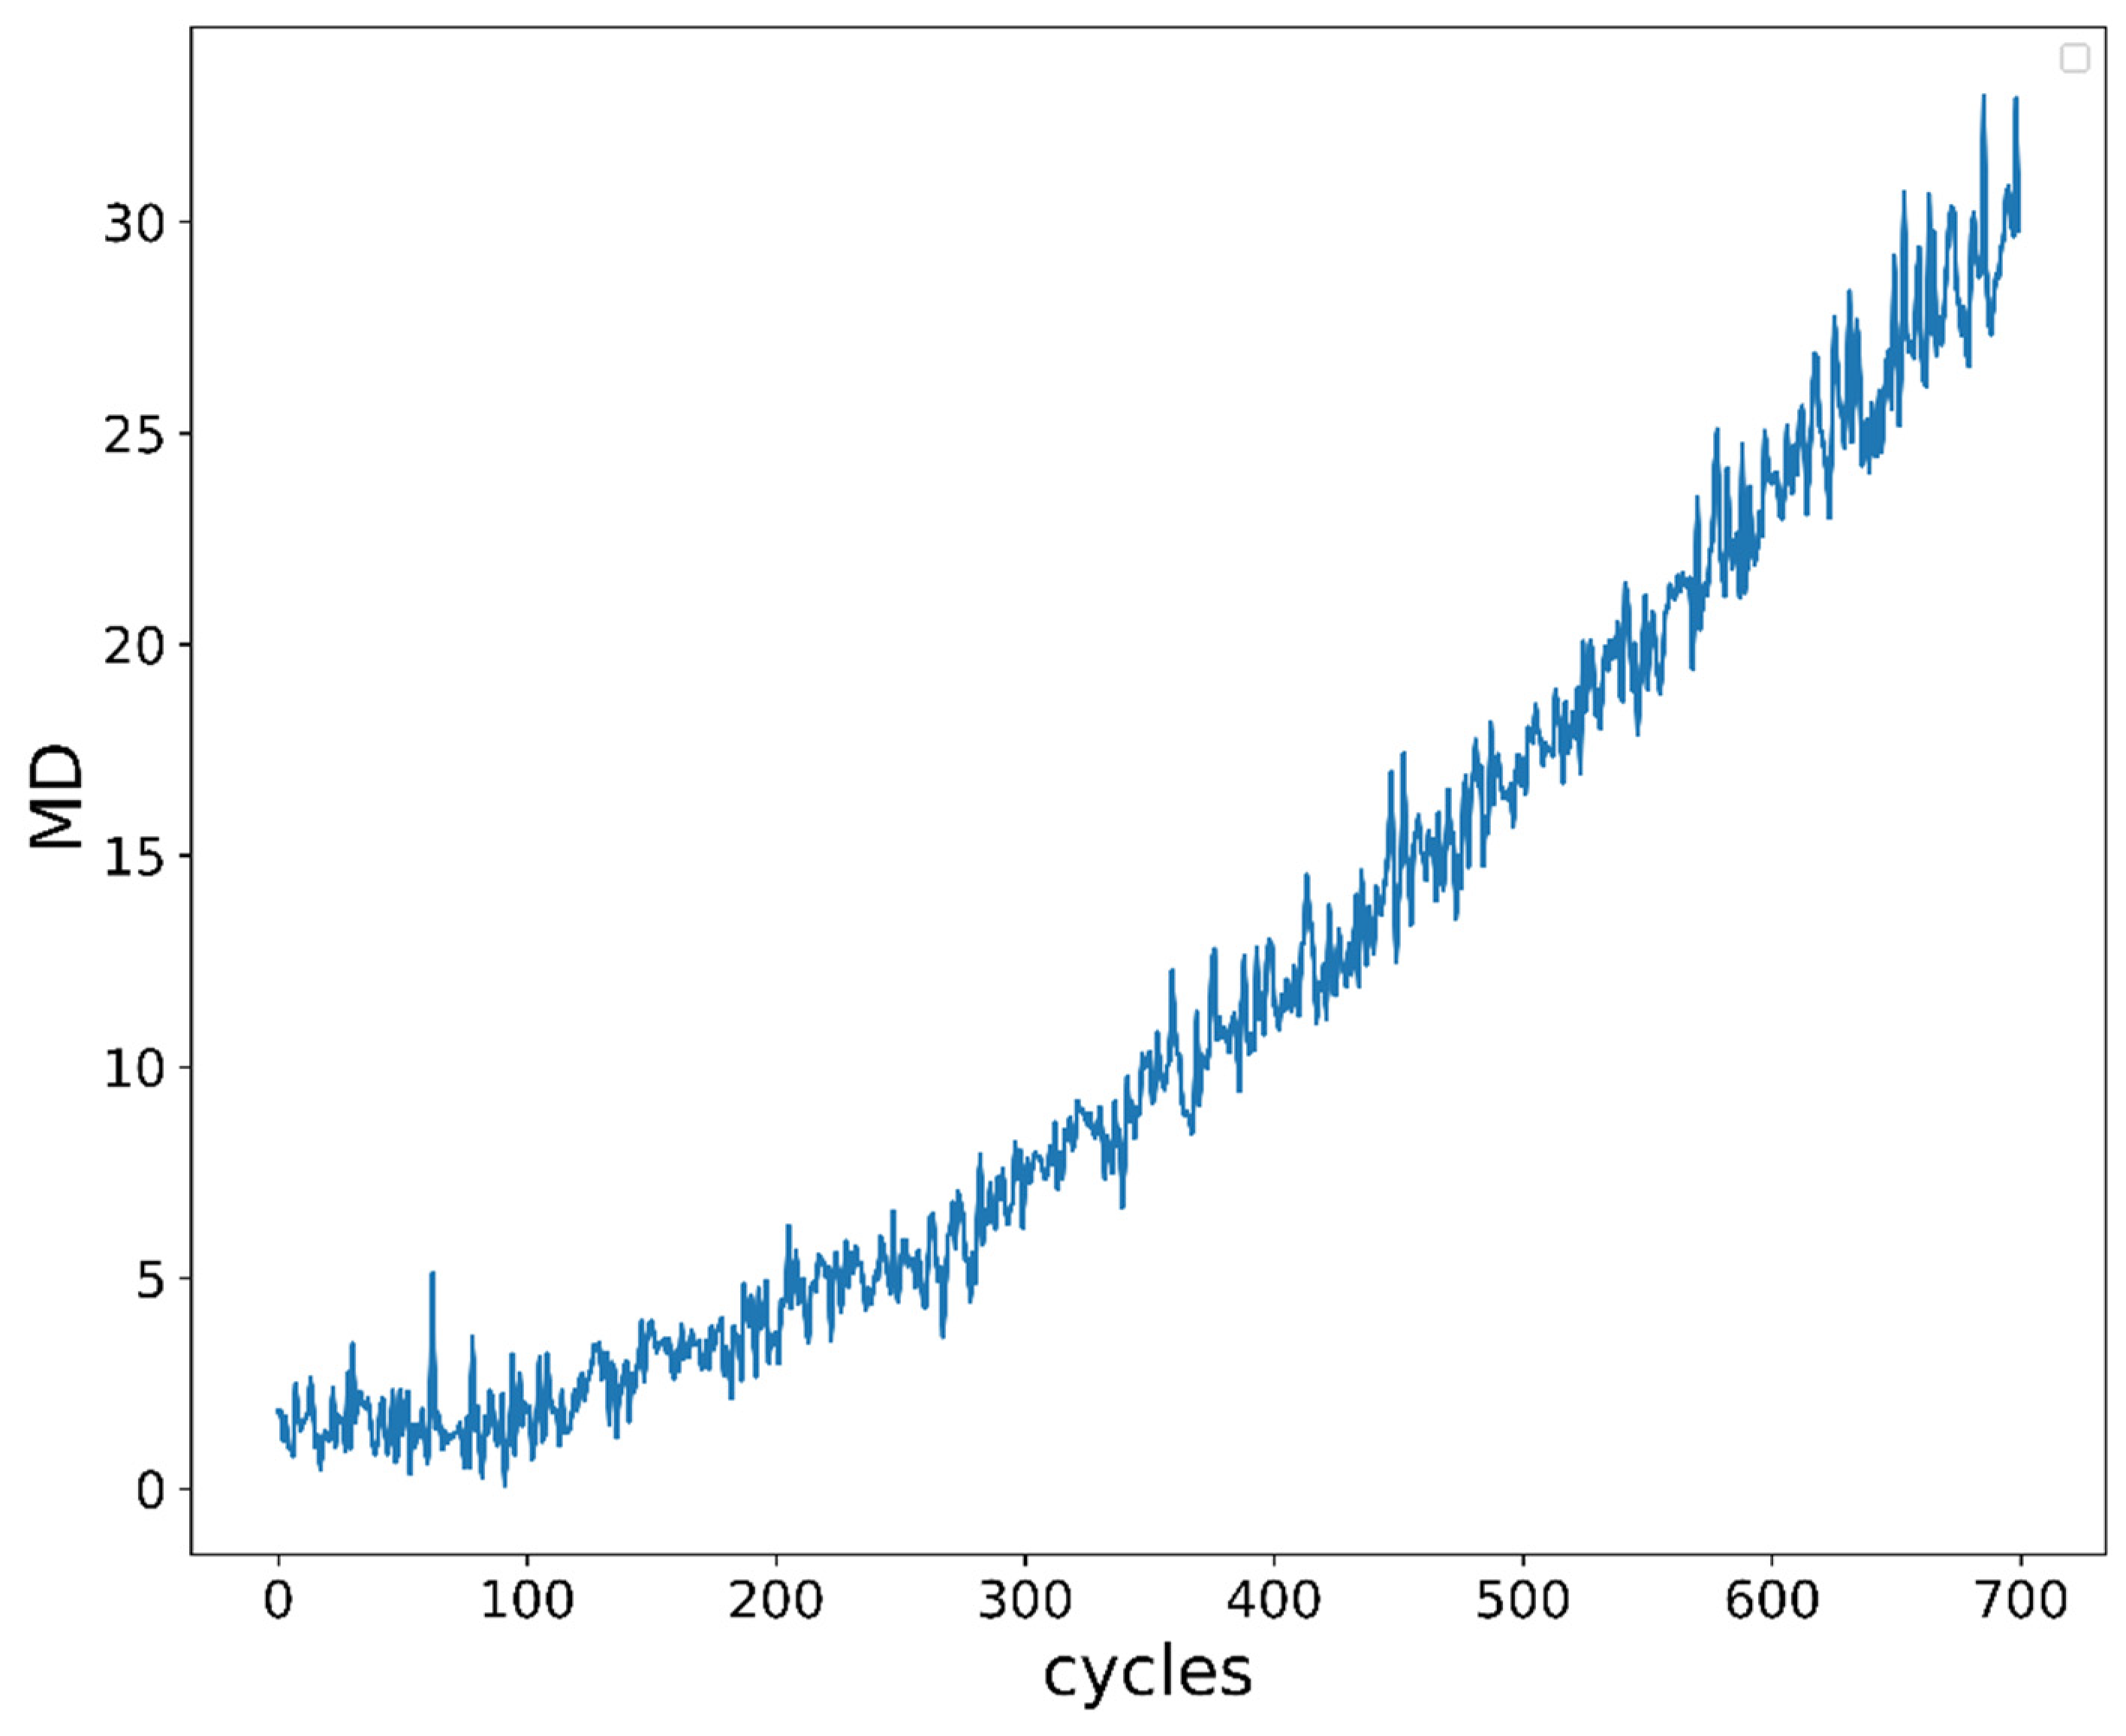
Figure 4 shows that the ordinate is MD value of I
G and the abscissa is the IGBT working cycle number. With the increase of cycle, I
G gradually ages and MD also gradually increases, indicating the rationality of MD as an indicator of IGBT performance degradation.
Kalman filtering is a commonly used filtering algorithm to reduce signal noise in acquired data, which has higher accuracy and better interpretability in the field of signal processing. In this paper, the Kalman filter algorithm is further used to reduce the noise in MD value, forming into another denoised MD value. For the convenience, it is also denoted as MD without ambiguity.
4. Performance Degradation Prediction of Gate Oxide Layer Based on CNN-LSTM Network
In this paper, the CNN-LSTM network is used to construct an IGBT performance degradation prediction model, which ensures the accuracy of the prediction results through the powerful feature extraction capability of Convolutional Neural Network (CNN) and the reliability of Long Short-Term Memory (LSTM) model in the field of time series forecasting. The model input is a one-dimensional IGBT performance degradation indicator matrix, and the output is an IGBT real-time degradation indicator, and there are two groups in the control experimental group, which use CNN, LSTM and Support Vector Regression (SVR) Models, respectively.
4.1. CNN-LSTM Network
CNN convolves the local region of the input signal with the filter core through the convolutional layer, and then generates nonlinear features through the activation function [
20]. For CNNs to process time series data, a one-dimensional convolutional network Con1d is typically used, with the following expression:
where
is the weight matrix of the i-th convolution kernel of the l-th layer,
is the j-th local output of l-1,
is the bias,
is the convolution operation. Moreover,
is the activation function, this experiment uses the Relu function, and its expression is as follows:
Long short-term memory network (LSTM) is often used to process time series data, and their structure consists of a forget gate, input gate, and output gate. Useless information is discarded through the forget gate with the following expression:
where is the output of the prior unit, is the input to the current cell, is the sigmoid activation function, and are the weight matrix and the bias, respectively.
The role of the input gate is to decide to update the information, and the activation function uses the Relu function. The expression is as follows:
where is the unit state at the current moment, are the weight matrix and bias of the input gate, respectively, and are the weight matrix and bias for the current state, respectively.
The output gate then determines the current output information
and obtains the output
of the LSTM unit based on the updated cell state, i.e.:
where
are the weight matrix and bias of the output gate, respectively. In this paper, the flow of IGBT gate oxide performance degradation prediction experiment and the CNN-LSTM network structure are shown in
Figure 5.
The left part of
Figure 5 is the feature engineering of IGBT gate aging data, and the feature matrix will be obtained. A time window of 5 is set in this paper, and every time the degradation features of four cycles are the inputs of the prediction network, shown in the right part of
Figure 5. The outputs of the network will give the prediction value of the next cycle.
In this paper, the root mean square error loss function (MSE loss function) is used to calculate the loss between the prediction value with neural network and the label, and the adaptive moment estimation (Adam optimizer) is adopted for model optimization. The initial learning rate is set to 0.001, and the model can converge within 150 iterations. After the training, the model and corresponding parameters will be saved and used to predict the test set.
4.2. Prediction Experiment on the Performance Degradation of IGBT Gate Oxide Layer
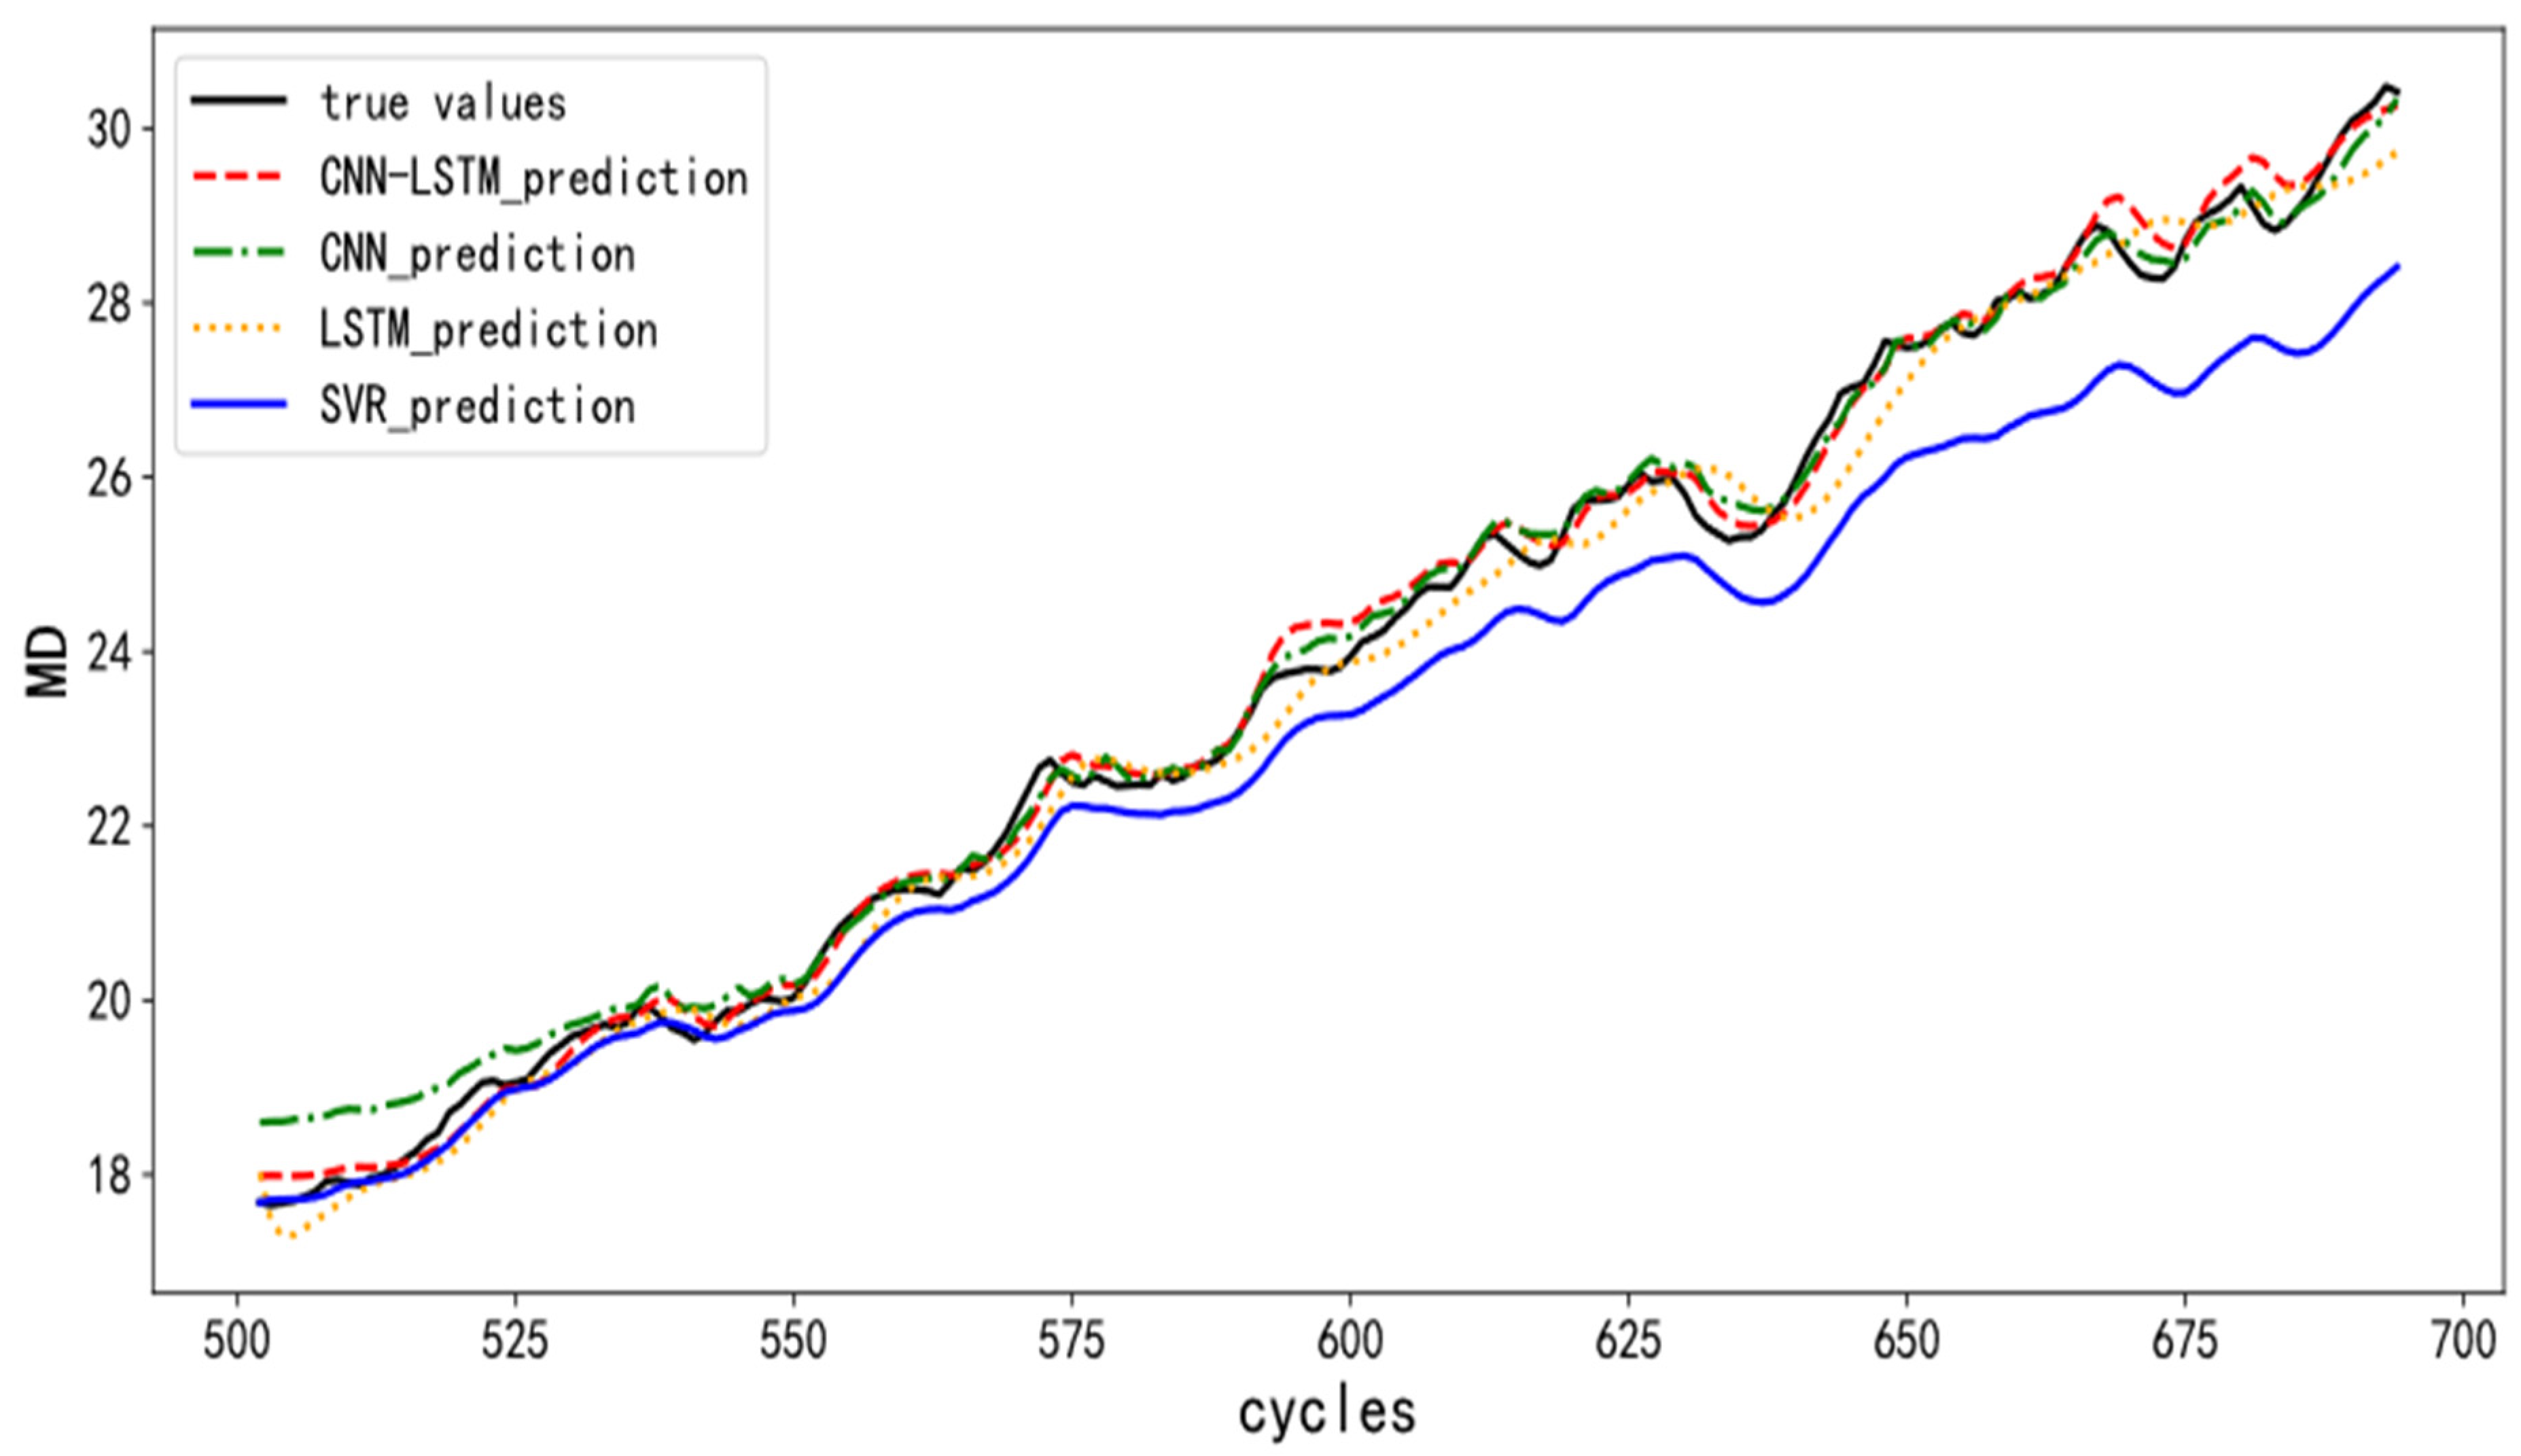
In this paper, IG is used as the precursor parameter of gate oxide degradation to construct the performance degradation indicator of IGBT gate oxide, and an IGBT performance degradation prediction model is built based on CNN-LSTM network, and the data of 500 cycles is trained first, and then the IGBT is predicted in real time within 200 cycles. In order to verify the effectiveness of CNN-LSTM network, SVR, LSTM and CNN networks are used to construct IGBT performance degradation prediction models for controlled experiments.
In
Figure 6, the abscissa is the cycle period of the IGBT, and the ordinate is the performance degradation indicator of the IGBT, that is, MD. In the figure, the SVR prediction curve and LSTM prediction curve deviated greatly from the actual value. The CNN prediction curve has a large prediction deviation in the first 50 cycles, and the fitting results are better later. The CNN-LSTM forecast curve performs very well throughout the whole forecast cycle. The accuracy of different models is quantitatively compared using mean absolute error (MAE), and the result is showed in
Table 1.
In summary, the IGBT prediction model based on CNN-LSTM has the most accurate prediction results, and the MAE can reach as low as 0.0216.
5. Conclusions
In view of the degradation of IGBT gate oxide, this paper uses gate leakage current as a failure precursor parameter, analyzes it in the time domain, and obtains a performance degradation indicator (i. e. MD) that can characterize IGBT gate oxide layer through feature selection, feature fusion and noise reduction processing. In terms of performance degradation prediction of IGBT gate oxide layer, this paper designs a prediction model based on CNN-LSTM network, and verifies the model effectiveness by using NASA's public dataset. The main contributions of this paper are as follows.
1) Compared with the previous prediction model studies [
6,
7,
8,
9,
10,
11,
12,
13,
14,
15,
16] about the failure modes such as the weld layer failure, latch failure and solder layer degradation, this paper focused on the gate oxide layer performance degradation of IGBT and its corresponding failure precursor analysis, filling a void on the prediction of gate oxide layer performance degradation.
2) In order to mining the small amplitude change of gate leakage current, a series of gate leakage current analysis techniques, such as feature selection, feature fusion and noise reduction processing, Mahalanobis distance and Kalman filter, the performance degradation indicator MD of the extracted gate oxide layer is obtained, which gradually increases with the increase of cycle, characterizing the gradual aging process of IGBT to failure.
3) The CNN-LSTM network is introduced to predict IGBT performance degradation prediction, which inherits the advantages of CNN and LSTM. The results show that the average absolute error in IGBT prediction experiments is the 0.0216, which is lower than the prediction error of CNN, LSTM and SVR model.
In summary, this paper constructs an IGBT gate oxide performance degradation prediction model based on CNN-LSTM, selects gate leakage current as a precursor parameter, obtains a unified indicator MD that can characterize IGBT aging, and finally the average absolute error of degradation prediction is as low as 0.0216, which indicates the feasibility of gate leakage current as a precursor parameter and the accuracy and reliability of CNN-LSTM prediction model.
Author Contributions
Conceptualization, Z.Z., H. S. and L. J.; methodology, Z.Z., H. S., L.J. and W. X.; software, W. X. and L. J.; validation, W. X.; formal analysis, Z.Z., W.X., H. S., L. J.; investigation, Z.Z., H. S. and L. J.; resources, Z.Z. H.S. and W. X.; data curation, W. X.; writing—original draft preparation, Z.Z. and W.X.; writing—review and editing, H.S., L.J. and C. W.; visualization, W. X. and L.J.; supervision, Z.Z., H. S. and C. W.; project administration, Z.Z.; funding acquisition, Z.Z., He. S. and Liu. J. All authors have read and agreed to the published version of the manuscript.
Funding
This work was funded by the Key-Area Research and Development Program of Guangdong Province (No. 2022B0701180002), National Natural Science Foundation of China (No. 62274043), and Opening Project (No. 21D03) of Science and Technology on Reliability Physics and Application Technology of Electronic Component Laboratory.
Data Availability Statement
The data set used in this paper for supporting that our proposed framework is effective for aging prediction of IGBT grid oxide layer was provided by the NASA Prognostics Center of Excellence (PCoE). The data for download is available on
https://data.nasa.gov/download/nk8v-ckry/application%2Fzip.
Acknowledgments
The authors thank Dr. Yiqiang Chen who is with China Electronic Product Reliability and Environmental Testing Institute for his helpful discussion.
Conflicts of Interest
The authors declare no conflict of interest.
References
- Kabir. A; Bailey. C; Lu. H. A review of data-driven prognostics in power electronics. In Proceedings of IEEE 35th International Spring Seminar on Electronics Technology (ISSE). Bad Aussee, Austria, 9th-13rd. May. 2012. [CrossRef]
- Liu. G; Li. K. Recent advances and trend of HEV/EV-oriented power semiconductors-an overview. IET Power Electron 2020, 13, 394–404. [Google Scholar] [CrossRef]
- Sheng. K; Williams. BW. A review of IGBT models. IEEE Transactions on Power Electronics 2000, 15, 1250–1266. [Google Scholar] [CrossRef]
- Lu. B; Sharma. SK.A Literature Review of IGBT Fault Diagnostic and Protection Methods for Power Inverters. IEEE Transactions on Industry Applications 2009, 45, 1770–1777. [Google Scholar] [CrossRef]
- Oh. H; Han. B. Physics-of-failure, condition monitoring, prognostics of insulated gate bipolar transistor modules: a review. IEEE Transactions on Power Electronics 2015, 30, 2413–2426. [Google Scholar] [CrossRef]
- Dai. X; Yang. X. Analytical modeling of thermo-mechanical stress for bond wire of IGBT module. Microelectronics Reliability 2021, 127, 114401. [Google Scholar] [CrossRef]
- Li. L; He. Y. The aging analysis method of IGBT with composite failure mode based on Miner linear fatigue cumulative theory. Microelectronics Reliability 2021, 122, 114165. [Google Scholar] [CrossRef]
- Thebaud. JM; Woirgard. E. Strategy for Designing Accelerated Aging Tests to Evaluate IGBT Power Modules Lifetime in Real Operation Mode. IEEE Transactions on Components and Packaging Technologies 2003, 26, 429–438. [Google Scholar] [CrossRef]
- Ge. J; Huang. Y; Tao. Z. RUL Predict of IGBT Based on DeepAR Using Transient Switch Features. In Proceedings of 5th European Conference of the Prognostics and Health Management Society, Turin, Italy, 1st-3rd. Jul. 2020.
- Lu. Y; Christou. A. Prognostics of IGBT modules based on the approach of particle filtering. Microelectronics Reliability 2019, 92, 96–105. [Google Scholar] [CrossRef]
- Zhang. J; Hu J. A remaining useful life prediction method of IGBT based on online status data. Microelectronics Reliability 2021, 121, 114124. [Google Scholar] [CrossRef]
- Zhang. J; Hu. J. Characterization method of IGBT comprehensive health index based on online status data. Microelectronics Reliability 2021, 116, 114023. [Google Scholar] [CrossRef]
- Liu. Q.; Tong. Q.; Wang. L. IGBT Life Prediction Based on CNN1D-LSTM Hybrid Model. In Proceedings of the 5th International Conference on Electrical Engineering and Information Technologies for Rail Transportation (EITRT), Qingdao, Shandong, China, 21st-23rd. Oct. 2021.
- Ji, B; Volker., P.; Cao., W.; Bashar., Z. In Situ Diagnostics and Prognostics of Wire Bonding Faults in IGBT Modules for Electric Vehicle Drives. IEEE Transactions on Power Electronics 2013, 28, 5568–5577. [Google Scholar] [CrossRef]
- Ji, B.; Song., X; Cao., W; Volker., P.; Hu., Y.; John., W.M.; Gareth., P. In Situ Diagnostics and Prognostics of Solder Fatigue in IGBT Modules for Electric Vehicle Drives. IEEE Transactions on Power Electronics 2015, 30, 1535–1543. [Google Scholar]
- Wang, X.; Zhou., Z.; He., S.; Jia., H.; Huang., Y. IGBT Performance Degradation Feature Construction and Real-Time Prediction Based on Machine Learning. In Proceedings of the 17th Annual Conference of China Electrotechnical Society ( ACCES), Beijing, China, 17th-18th,Sept. 2022.
- Jang. YC; Kim. SS. Accelerated Degradation of IGBTs Due to High Gate Voltage at Various Temperature Environments. IEEE Transactions on Device and Materials Reliability 2020, 20, 731–736. [Google Scholar] [CrossRef]
- Zhang. Y; Xiang. D; Xu. G. On Gate Oxide Degradation Mechanism and Chip-Related Failure Precursors of IGBT. In Proceedings of the 38th Chinese Control Conference (CCC), Guangzhou, Guangdong, China, 27th-30th. Jul. 2019.
- Gang. Niu.; Satnam. Singh. Health monitoring of electronic products based on Mahalanobis distance and Weibull decision metrics. Microelectronics Reliability 2011, 51, 279–284. [Google Scholar] [CrossRef]
- Agga, A.; Abbou., A. CNN-LSTM: An efficient hybrid deep learning architecture for predicting short-term photovoltaic power production. Electric Power Systems Research 2022, 208, 107908. [Google Scholar] [CrossRef]
|
Disclaimer/Publisher’s Note: The statements, opinions and data contained in all publications are solely those of the individual author(s) and contributor(s) and not of MDPI and/or the editor(s). MDPI and/or the editor(s) disclaim responsibility for any injury to people or property resulting from any ideas, methods, instructions or products referred to in the content. |
© 2023 by the authors. Licensee MDPI, Basel, Switzerland. This article is an open access article distributed under the terms and conditions of the Creative Commons Attribution (CC BY) license (http://creativecommons.org/licenses/by/4.0/).
