Submitted:
17 April 2023
Posted:
17 April 2023
You are already at the latest version
Abstract
Keywords:
1. Introduction
2. Basic Equations, Parameters, and Definitions
2.1. Periodic and Antiperiodic States
2.2. Equations for the Modal Amplitudes
2.3. The Impact of Radial Poling
2.4. Fundamental Representation
- –
- This nonlinear set admits dual steady-state solutions , circulating with a common velocity without shape changes. Solitons belong indeed to this class of solutions. Velocity has to be determined simultaneously with the shape of the envelopes.
- –
- Set (8) is written for a static coordinate frame. It is practical to rewrite it for a coordinate frame moving with velocity . To do this, it is sufficient to drop the term in the first equation and replace by in the second one. It is assumed from now on.
- –
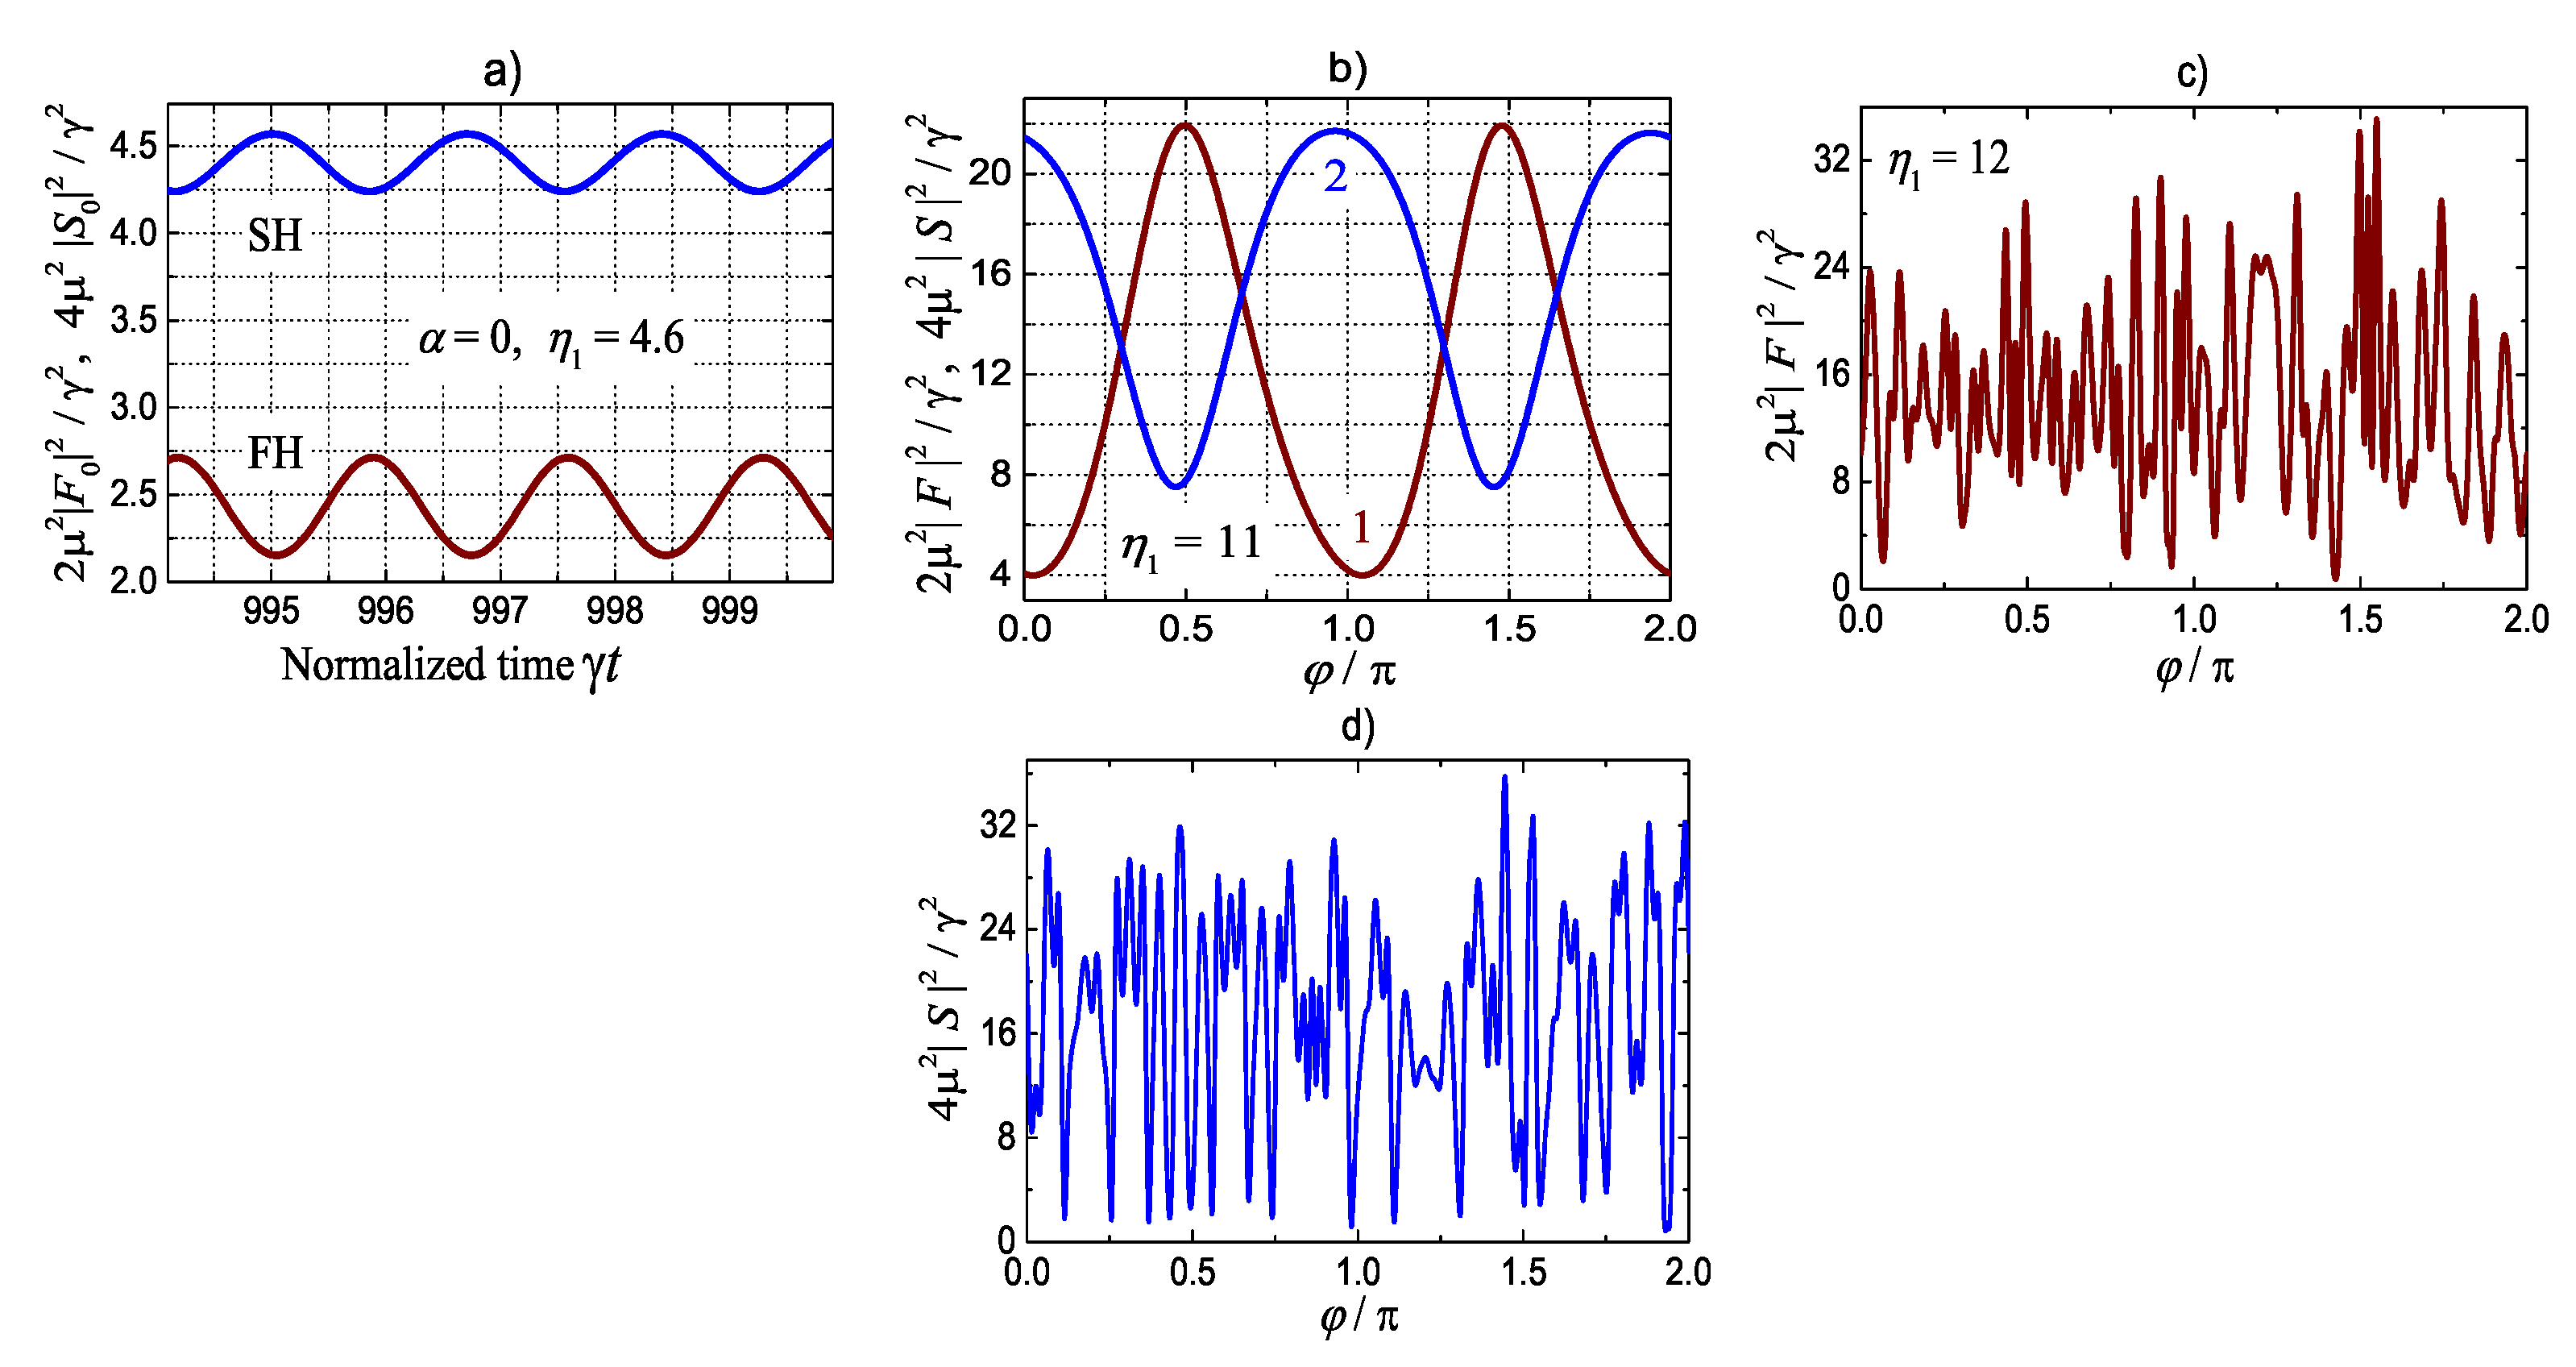
- In a dual steady state propagating with a constant velocity , the modal amplitudes and oscillate in time as and . This elementary property is useful to control the establishment of dual steady states in numerical simulations, see Section 1.
- –
- Attempts to rewrite set (8) for the antiperiodic states using the replacements lead to restoration of the periodicity but also to an explicit z-dependence of the right-hand sides (non-autonomous system). This in inappropriate.
- –
- In the limit , (no gain, no modal decay) we proceed to the conservative case reviewed in [19]. A number of exact soliton solutions are known here, but they are far from the subject of our study.
- –
- In the the dissipativeless driven limit at and , one can also obtain exact soliton solutions [51]. It turns out, however, that they all are unstable, i.e. cannot be realized.
3. Instability Thresholds
4. Numerical Methods
5. Soliton-Comb States for SH Pumping
5.1. Antiperiodic solutions near nm
5.2. Selective Generation of Periodic and Antiperiodic Milti-Soliton States
5.3. Natural PM: The Absence of Solitons
6. Solutions for FH pumping
7. Discussion
8. Conclusions
Supplementary Materials
Author Contributions
Funding
Institutional Review Board Statement
Informed Consent Statement
Data Availability Statement
Conflicts of Interest
References
- Del’Haye, P.; Schliesser, A.; Arcizet, O.; Wilken, T.; Holzwarth, R; Kippenberg, T. J. Optical frequency comb generation from a monolithic microresonator. Nature 2007, 450, 1214–1217. [Google Scholar] [CrossRef]
- Del’Haye, P.; Herr, T.; Gavartin, E.; Gorodetsky, M.L.; Holzwarth, R; Kippenberg, T. J. Octave spanning tunable frequency comb from a microresonator. Phys. Rev. Lett. 2011, 107, 063901. [Google Scholar] [CrossRef]
- Kippenberg, T.J.; Holzwarth, R.; Diddams, S.A. Microresonator-based optical frequency combs. Science 2011, 332, 555–559. [Google Scholar] [CrossRef]
- Herr, T.; Brasch, V.; Jost, J.D.; Wang, C.Y.; Kondratiev, N.M.; Gorodetsky, M.L.; Kippenberg, T.J. Temporal solitons in optical microresonators. Nature Photonics 2014, 8, 145–152. [Google Scholar] [CrossRef]
- Kippenberg, T.J.; Gaeta, A.L.; Lipson, M.; Gorodetsky, M.L. Dissipative Kerr solitons in optical microresonators. Science 2018, 361, 567–572. [Google Scholar] [CrossRef]
- Suh, M.G.; Vahala, K. Gigahertz-repetition-rate soliton microcombs. Optica 2018, 5, 65–66. [Google Scholar] [CrossRef]
- Gaeta, A.L.; Lipson, M.; Kippenberg, T.J. Photonic-chip-based frequency combs. Nature Photonics 2019, 13, 158–169. [Google Scholar] [CrossRef]
- Chang, L.; Xie, W.; et al. Shu, H.; Yang, Q; Shen, B.; Boes, A.; Peters, J.D; Jin, W.; Xiang, C.; Liu, S.; Moille, G.; Yu, S.; Wang, X.; Srinivasan, K.; Papp, S.B.; Vahala K.; Bowers, J.E.. Ultra-efficient frequency comb generation in AlGaAs-on-insulator microresonators. Nature Communications 2020, 11, 1331. [CrossRef] [PubMed]
- Fujii, S.; Tanaka, S.; Ohtsuka, T.; Kogure, S.; Wada, K.; Kumazaki, H.; Tasaka, S.; Hashimoto, Y.; Kobayashi, Y.; Araki, T.; Furusawa, K.; Sekine, N.; Kawanishi, S.; Tanabe, T. Dissipative Kerr soliton microcombs for FEC-free optical communications over 100 channels. Opt. Express 2022, 30, 1351–1364. [Google Scholar] [CrossRef] [PubMed]
- Fujii, S.; Wada, K.; Sugano, R.; Kumazaki, H.; Kogure, S.; Kato, Y.K.; Tanabe, T. Versatile tuning of Kerr soliton microcombs in crystalline microresonators. Communications Physics 2023, 6, 1–7. [Google Scholar] [CrossRef]
- Akhmediev, N.; Ankiewicz, A. Dissipative Solitons, Lecture Notes in Physics; Springer-Verlag: Berlin, Germany, 2005. [Google Scholar]
- Grelu, P.; Akhmediev, N. Dissipative solitons for mode-locked lasers. Nature Photonics 2012, 6, 84–92. [Google Scholar] [CrossRef]
- Boyd, R.W. Nonlinear Optics; Academic Press: New York, USA, 2008. [Google Scholar]
- Fürst, J.U.; Strekalov, D.V.; Elser, D.; Lassen, M.; Andersen, U.L.; Marquardt, C.; Leuchs, G. Naturally phase-matched second-harmonic generation in a whispering-gallery-mode resonator. Phys. Rev. Lett. 2010, 104, 153901. [Google Scholar] [CrossRef]
- Beckmann, T.; Linnenbank, H.; Steigerwald, H.; Sturman, B.; Haertle, D.; Buse, K.; Breunig, I. Highly tunable low-threshold optical parametric oscillation in radially poled whispering gallery resonators. Phys. Rev. Lett. 2011, 106, 143903. [Google Scholar] [CrossRef]
- Mohageg, M.; Strekalov, D.V.; Savchenkov, A.A.; Matsko, A.B.; Ilchenko, V.S.; Maleki, L. Calligraphic poling of lithium niobate. Opt. Express 2005, 13, 3408–3419. [Google Scholar] [CrossRef]
- Strekalov, D.; Marquardt, Ch.; Matsko, A.B.; Schwefel, H.G.L.; Leuchs, G. Nonlinear and quantum optics with whispering gallery resonators. J. Opt. 2016, 18, 123002. [Google Scholar] [CrossRef]
- Breunig, I. Three-wave mixing in whispering gallery resonators. Laser and Photonics Reviews 2016, 10, 569–587. [Google Scholar] [CrossRef]
- Buryak, A.V.; Trapani, P. Di; Skryabin, D.V.; Trillod, S. Optical solitons due to quadratic nonlinearities: from basic physics to futuristic applications. Phys. Rep. 2002, 370, 63–235. [Google Scholar] [CrossRef]
- Ilchenko, V.S.; Savchenkov, A.A.; Matsko, A.B.; Maleki, L. Nonlinear optics and crystalline whispering gallery mode cavities. Phys. Rev. Lett. 2004, 92, 043903–043907. [Google Scholar] [CrossRef] [PubMed]
- Jia, Y.; Hanka, K.; Zawilski, K.T.; Schunemann, P.G.; Buse, K.; Breunig, I. Continuous-wave whispering-gallery optical parametric oscillator based on CdSiP2. Opt. Express 2018, 26, 10833–10841. [Google Scholar] [CrossRef] [PubMed]
- Guo, X.; Zou, C.-L.; Tang, H.X. Second-harmonic generation in aluminum nitride microrings with 2500%/W conversion efficiency. Optica 2016, 3, 1126–1131. [Google Scholar] [CrossRef]
- Kuo, P.S.; Bravo-Abad, J.; Solomon, G.S. Second-harmonic generation using 4¯-quasi-phasematching in a GaAs whispering-gallery-mode microcavity. Nature Communications 2013, 5, 3109. [Google Scholar] [CrossRef] [PubMed]
- Gorodetsky, M.L. High-Q Optical Microresonators; Fizmatgiz: Moscow, Russia, in Russian, 2011. [Google Scholar]
- Matsko, A.B.; Ilchenko, V.S. Optical resonators with whispering-gallery modes – Part I: Basics. IEEE J. of Selected Topics in Quantum Electronics 2006, 12, 3–14. [Google Scholar] [CrossRef]
- Maleki, L.; Ilchenko, V.S.; Savchenkov, A.A.; Matsko, A.B. Crystalline whispering gallery mode resonators in optics and photonics. In Practical Applications of Microresonators in Optics and Photonics; Matsko, A.B., Ed.; CRC Press: Boca Raton, USA, 2019. [Google Scholar]
- Gorodetsky, M.L.; Demchenko, Yu.A. Accurate analytical estimates of eigenfrequencies and dispersion in whispering-gallery spheroidal resonators. Proceedings of SPIE 2012, 8236, 823623. [Google Scholar]
- Demchenko, Yu.A.; Gorodetsky, M.L. Analytical estimates of eigenfrequencies, dispersion, and field distribution in whispering gallery resonators. J. Opt. Soc. Am. B 2013, 30, 3056–3063. [Google Scholar] [CrossRef]
- Breunig, I.; Sturman, B.; Sedlmeir, F.; Schwefel, H.G.L.; Buse, K. Whispering gallery modes at the rim of an axisymmetric optical resonator: Analytical versus numerical description and comparison with experiment. Opt. Express 2013, 21, 30683–30692. [Google Scholar] [CrossRef] [PubMed]
- Sturman, B.; Podivilov, E.; Werner, C.S.; Breunig, I. Vectorial perturbation theory for axisymmetric whispering gallery resonators. Phys. Rev. A 2019, 99, 013810. [Google Scholar] [CrossRef]
- Sturman, B.; Breunig, I. Generic description of second-order nonlinear phenomena in whispering-gallery resonators. J. Opt. Soc. Am. B 2011, 28, 2465–2471. [Google Scholar] [CrossRef]
- Werner, Ch.S.; Yoshiki, W.; Herr, S.J.; Breunig, I.; Buse, K. Geometric tuning: spectroscopy using whispering-gallery resonator frequency-synthesizers. Optica 2017, 4, 1205–1208. [Google Scholar] [CrossRef]
- Ricciardi, I.; Mosca, S.; Parisi, M.; Maddaloni, P.; Santamaria, L.; De Natale, P.; De Rosa, M. Frequency comb generation in quadratic nonlinear media. Phys. Rev. A 2015, 91, 063839. [Google Scholar] [CrossRef]
- Leo, F.; Hansson, T.; Ricciardi, I.; De Rosa, M.; Coen, S.; Wabnitz, S.; Erkintalo, M. Walk-off-induced modulation instability, temporal pattern formation, and frequency comb generation in cavity-enhanced second-harmonic generation. Phys. Rev. Lett. 2016, 116, 033901. [Google Scholar] [CrossRef]
- Mosca, S.; Ricciardi, I.; Parisi, M.; Maddaloni, P.; Santamaria, L.; De Natale, P.; De Rosa, M. Direct generation of optical frequency combs in χ(2) nonlinear cavities. Nanophotonics 2016, 5, 316–331. [Google Scholar] [CrossRef]
- Mosca, S.; Parisi, M.; Ricciardi, I.; Leo, F.; Hansson, T.; Erkintalo, M.; Maddaloni, P.; De Natale, P.; Wabnitz, S.; De Rosa, M. Modulation instability induced frequency comb generation in a continuously pumped optical parametric oscillator. Phys. Rev. Lett. 2018, 121, 093903. [Google Scholar] [CrossRef] [PubMed]
- Szabados, J.; Puzyrev, D.N.; Minet, Y.; Reis, L.; Buse, K.; Villois, A.; Skryabin, D.V.; Breunig, I. Frequency comb generation via cascaded second-order nonlinearities in microresonators. Phys. Rev. Lett. 2020, 124, 203902. [Google Scholar] [CrossRef] [PubMed]
- Szabados, J.; Sturman, B.; Breunig, I. Frequency comb generation threshold via second-harmonic excitation in χ(2) optical microresonators. APL Photonics 2020, 5, 116102. [Google Scholar] [CrossRef]
- Bruch, A.W.; Liu, X.; Gong, Z.; Surya, J.B.; Li, M.; Zou, C.-L.; Tang, H.X. Pockels soliton microcomb. Nature Photonics 2021, 15, 21–27. [Google Scholar] [CrossRef]
- Hannson, T.; Parra-Rivas, P.; Bernard, M.; Leo, F.; Gelens, L.; Wabnitz, S. Quadratic soliton combs in doubly resonant second-harmonic generation. Opt. Lett. 2018, 43, 6033–6036. [Google Scholar] [CrossRef]
- Villois, A.; Skryabin, D. Soliton and quasi-soliton frequency combs due to second harmonic generation in microresonators. Opt. Express 2019, 27, 7098–7107. [Google Scholar] [CrossRef]
- Villois, A.; Kondratiev, N.; Breunig, I.; Puzyrev, D.N.; Skryabin, D.V. Frequency combs in a microring optical parametric oscillator. Opt. Lett. 2019, 44, 4443–4446. [Google Scholar] [CrossRef]
- Lobanov, V.E. Two-color flat-top solitons in microresonator-based optical parametric oscillators. Phys. Rev. A 2020, 102, 013518. [Google Scholar] [CrossRef]
- Landau, L.D.; Lifshitz, E.M. Mechanics, 3rd ed.; Elsevier Ltd.: Amsterdam, Netherlands, 1976. [Google Scholar]
- Zakharov, V.E.; Kuznetsov, E.A. Hamiltonian formalism for nonlinear waves. Physics - Uspekhi 1997, 40, 1087–1116. [Google Scholar] [CrossRef]
- Podivilov, E.; Smirnov, S.; Breunig, I.; Sturman, B. Nonlinear solutions for χ(2) frequency combs in optical microresonators. Phys. Rev. A 2020, 101, 023815. [Google Scholar] [CrossRef]
- Smirnov, S.; Sturman, B.; Podivilov, E.; Breunig, I. Walk-off controlled self-starting frequency combs in χ(2) optical microresonators. Opt. Express 2020, 28, 18006–18017. [Google Scholar] [CrossRef]
- The use of this expansion is justified, for the FH and SH spectra must be relatively narrow (|j|,|l|≪∼104) within our envelope approximation.
- Nikogosyan, D.N. Nonlinear Optical Crystals: A Complete Survey; Springer: New York, USA, 2005. [Google Scholar]
- Sturman, B.; Podivilov, E.; Szabados, J.; Breunig, I. Dual backgrounds and their stability during frequency comb and second harmonic generation in χ(2) microresonators. J. Opt. Soc. Am. B 2022, 39, 378–387. [Google Scholar] [CrossRef]
- Podivilov, E.; Sturman, B.; Breunig, I. Frequency comb solutions for driven χ(2) optical microresonators. J. Opt. Soc. Am. B 2020, 37, 3316–3324. [Google Scholar] [CrossRef]
- Smirnov, S.; Andryushkov, V.; Podivilov, E.; Sturman, B.; Breunig, I. Walk-off controlled self-starting frequency combs in χ(2) optical microresonators. Opt. Express 2021, 29, 27434–27449. [Google Scholar] [CrossRef] [PubMed]
- Podivilov, E.; Smirnov, S.; Sturman, B. Adiabatic growing, multistability, and control of soliton-comb states in χ(2) microresonators for pumping into second-harmonic modes. JETP Letters 2022, 115, 553–559. [Google Scholar] [CrossRef]
- Breunig, I. , Freiburg University, Germany, Personal communication, 2020.
- Umemura, N.; Matsuda, D. Thermo-optic dispersion formula for the ordinary wave in 5 mol % MgO doped LiNbO3 and its application to temperature insensitive second-harmonic generation. Opt. Commun. 2016, 367, 167–173. [Google Scholar] [CrossRef]
- Smirnov, S.; Podivilov, E.; Sturman, B. Effects of dispersion and pumping scheme on soliton-comb generation in χ(2) microresonators. J. Opt. Soc. Am. B 2023, 40, 515–522. [Google Scholar] [CrossRef]
- Leidinger, M.; Fieberg, S.; Waasem, N.; Kühnemann, F.; Buse, K.; Breunig, I. Comparative study on three highly sensitive absorption measurement techniques characterizing lithium niobate over its entire transparent spectral range. Opt. Express 2015, 23, 21690–21705. [Google Scholar] [CrossRef] [PubMed]


Disclaimer/Publisher’s Note: The statements, opinions and data contained in all publications are solely those of the individual author(s) and contributor(s) and not of MDPI and/or the editor(s). MDPI and/or the editor(s) disclaim responsibility for any injury to people or property resulting from any ideas, methods, instructions or products referred to in the content. |
© 2023 by the authors. Licensee MDPI, Basel, Switzerland. This article is an open access article distributed under the terms and conditions of the Creative Commons Attribution (CC BY) license (http://creativecommons.org/licenses/by/4.0/).


