1. Introduction
The second-leading cause of mortality worldwide, behind cardiovascular disorders, is cancer. Often, this disease results from malfunctions in the regulatory systems that control cell division and proliferation [
1]. Every year, 1.7 million new instances of cancer are discovered, and 600,000 individuals pass away from it in the United States alone [
2]. The cornerstones to effective cancer treatment are decreasing mortality, improving survival, enhancing patients, rapid diagnosis, and then prompt and targeted treatments. Early cancer detection is crucial since it shortens the treatment process and lowers the overall cost of care. Psoriasis plaques show up as raised, aroused, and textured patches of skin that will too be bothersome and difficult. On Caucasian skin, plaques ordinarily show up as raised, ruddy patches secured with a shimmering white buildup of dead skin cells or scale [
3]. The infection features a solid but complex hereditary foundation with a concordance of around 60% in monozygotic twins [
2]. Psoriasis vulgaris is hereditarily not a homogenous malady, and unmistakable clinical sub-phenotypes of the malady appear to be subordinate to distinctive hereditary components [
3,
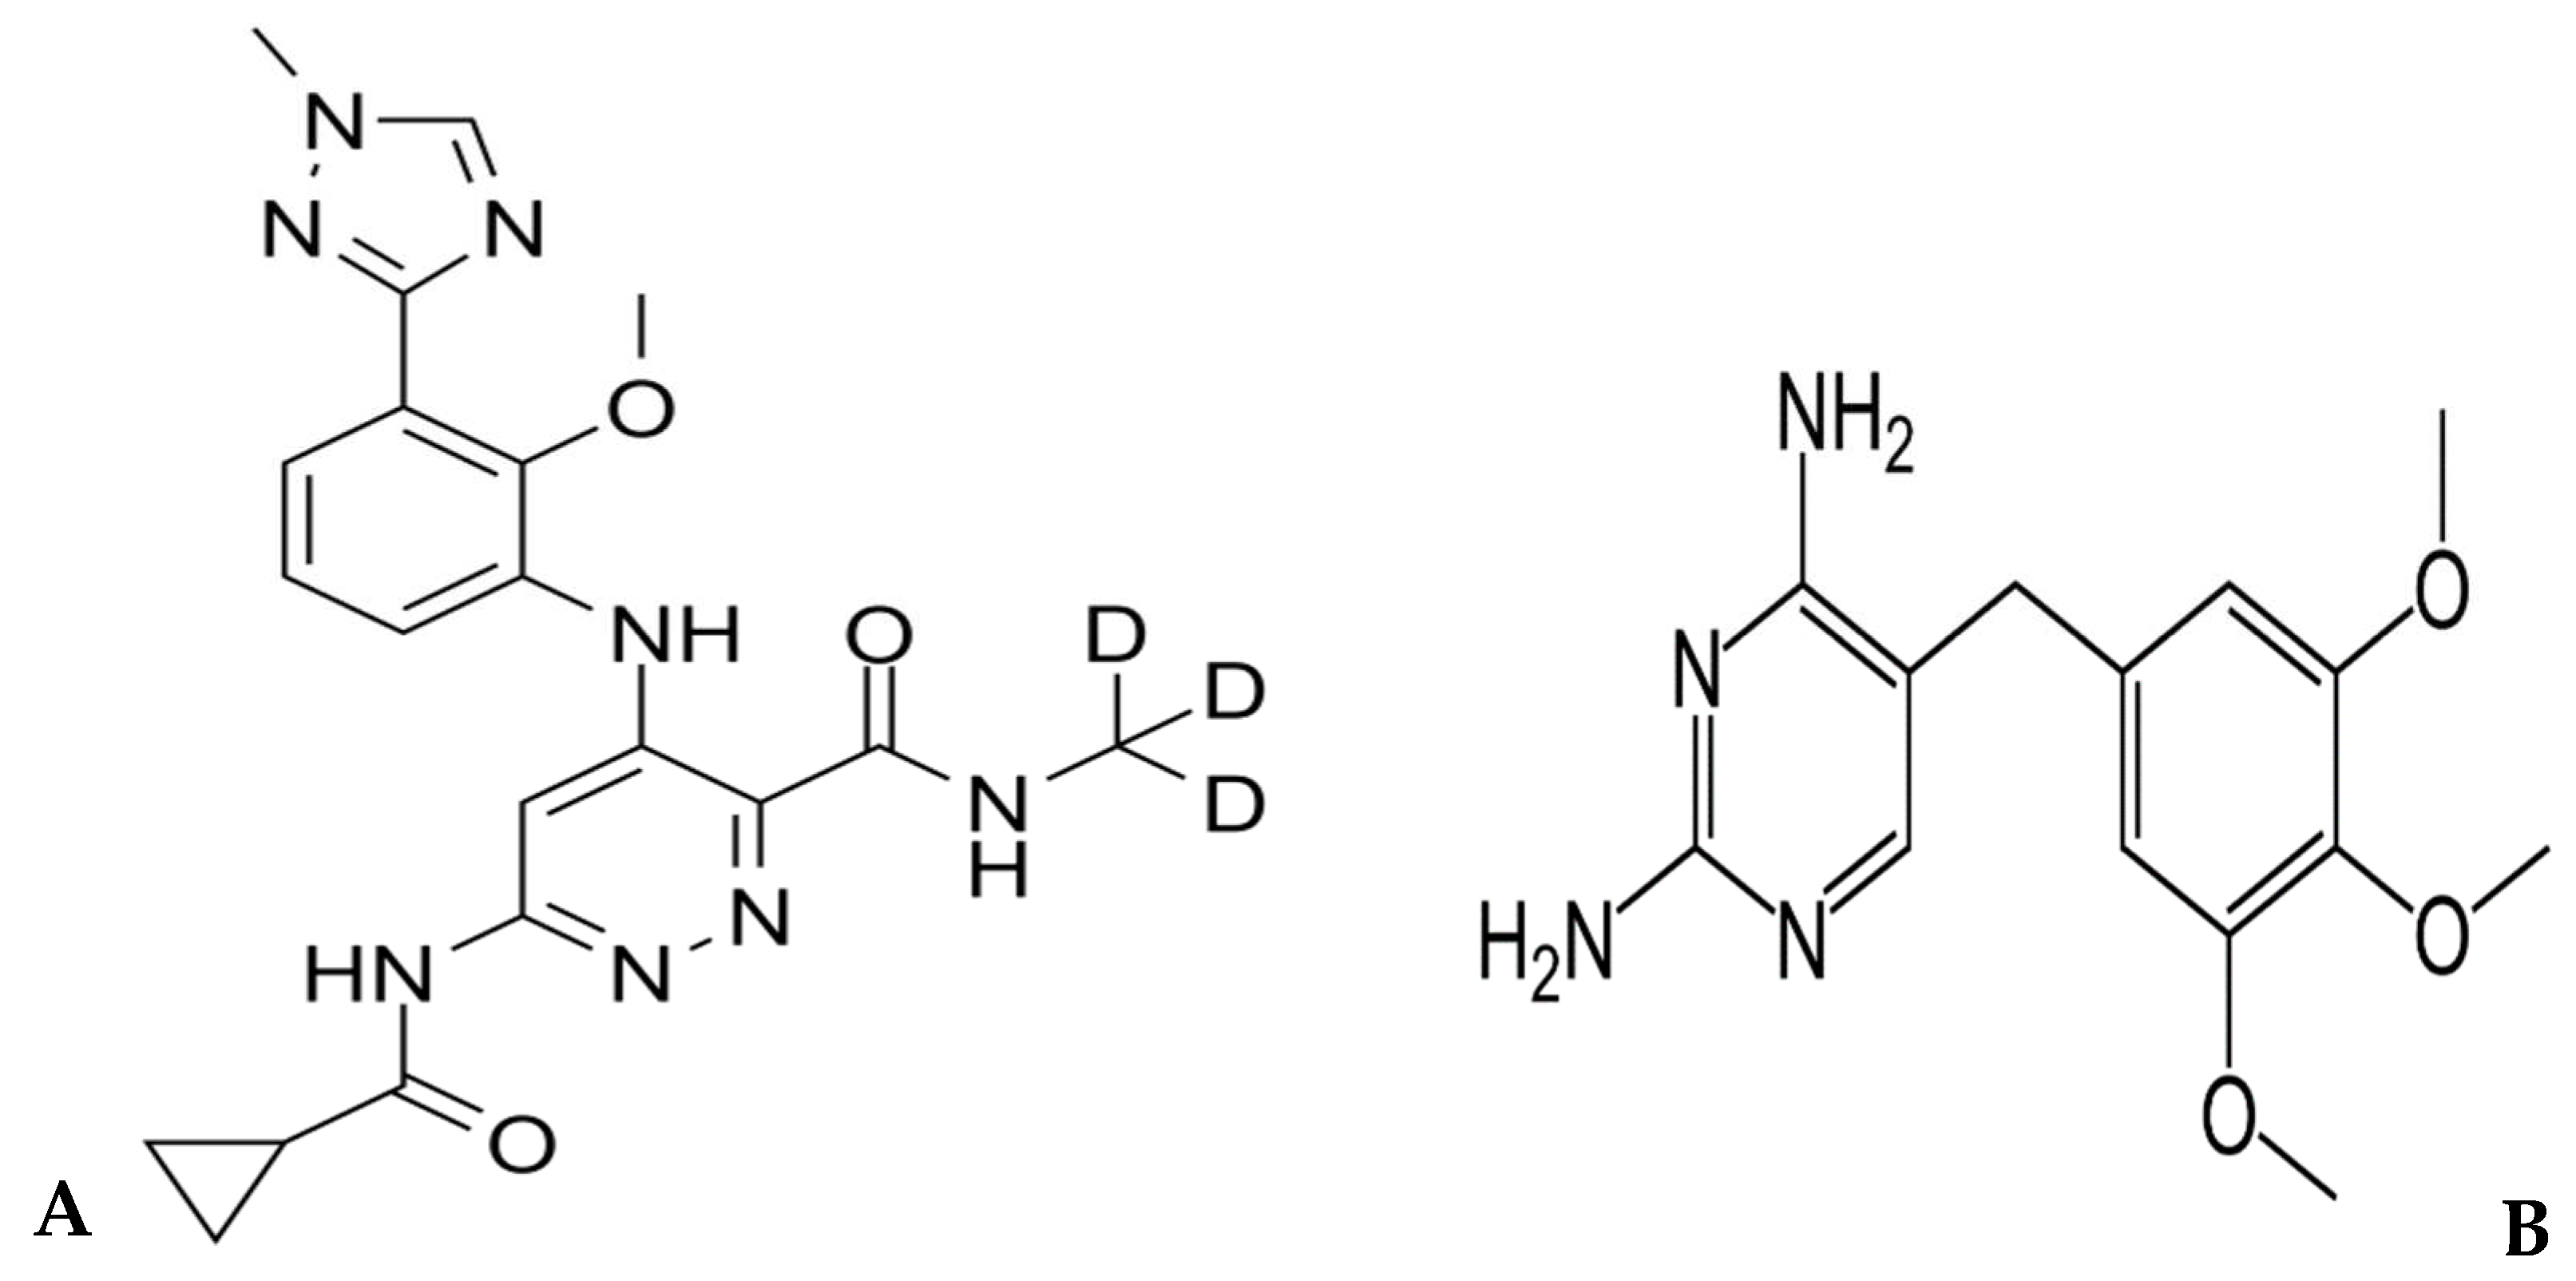
4]. Therefore, FDA in 2022 approved DEU (
Figure 1) as a first-line oral and selective tyrosine kinase inhibitor [
5,
6]. DEU is a novel lingual small molecule that selectively impedes TYK2 by binding exclusively to the TYK2-regulated pseudo-kinase (JH2) domain (allosteric inhibition). DEU, like other JAK inhibitors, does not bind to the kept active domain (competitive inhibitor) and is therefore significantly selective for TYK2 over other JAKs [
7,
8]. Therefore, DEU was used to treat adults with moderate-to-severe plaque psoriasis who did not respond to systemic medication or phototherapy [
5,
8].
As seen in
Figure 1, DEU is a free base with basic functional groups available for extraction and ionization of DEU. The polar nature makes it prone to problems with matrix effects, but trimethoprim (TMP), as an internal standard, (
Figure 1) was used to correct for matrix effects and ensure that the IS-normalized matrix coefficients are within acceptable limits.
To date, no chromatographic approaches were reported for the quantification of DEU in biological fluids. The selective LC-MS/MS strategy was applied to develop a selective, ultra-sensitive, and accurate approach with high repeatability and reliability. The main research activity was aimed at developing and justify a sensitive and highly selective bioanalytical design suitable for the quantification of DEU in human plasma, for the first time, covering a wide range of linearity.
2. Materials and Methods
2.1. Instrumentation
A mass spectrometer SCIEX API 4000 (from AB Sciex LLC, MA, USA) with Shimadzu prominence LC (software Version-Analyst 1.6.3) interfaced via Turbo ion spray was used for the study. The chromatographic method was optimized using the ACE C18 column (100 x 4.6 mm, 5 μm).
2.2. Materials
DEU and TMP (Internal Standard) were obtained as a gift sample from Dr. Reddy's Laboratories (Telangana, India). Methanol (HPLC grade), ammonium formate (AR grade), methyl tertiary butyl ether (MTBE) (AR grade), and HPLC Water were purchased from Merck (Darmstadt, Germany). Human (K2 EDTA as an anticoagulant) plasma was obtained from Om blood bank (Pune, Maharashtra, India). The study protocol was reviewed and approved by Aavishkar Ethics Committee (Goa, India).
2.3. Chromatographic conditions
The mobile phase was composed of methanol and 2 mM ammonium formate (80:20, v/v, respectively) which was used for separation of analyte from internal standard as well as extracted samples at a flow rate of 0.9 mL min-1. Quantitation of isolated components was done in a mass spectrometer in positive ion mode. A highly sensitive and selective, rapid, MRM (Multiple Reaction Monitoring) strategy has been created and validated for the quantification of DEU in human plasma utilizing an isocratic elution with 5 µL injection on tandem mass spectrometry. The innovative approach is based on liquid-liquid phase extraction with selective and rapid TMP as an IS. Sample 100 ng mL-1 (in 90% methanol in water) was prepared and used for tuning of mass parameters.
2.4. Preparation of standard solutions
5.0 mg of each DEU and TMP standards were weighed and dissolved in 5.0 mL methanol to get 1 mg mL-1 primary stock solutions which were stored in a refrigerator (2-8°C). The linear graph and the quality control samples were prepared using those primary stock solutions. A working solution of IS (500 ng mL-1) was obtained by dilution using mixture of methanol: water (80:20, v/v).
2.5. Linear graph and control samples
The samples were spiked with 0.980 mL of control plasma with the standard dilution of 0.02 mL dilution of the analyte. A set of eight non-zero standard ranging from 0.500 - 601.050 ng mL-1 of DEU were prepared for the linear graph. To determine the precision and accuracy, sample solutions (0.2 mL each) were prepared by spiking of control human plasma (9.8 mL each). The final concentrations for QC samples for DEU were 0.5 ng mL-1 (LLOQ), 1.444 ng mL-1 (LQC), 240.733 ng mL-1 (MQC) and 456.798 (HQC) ng mL-1.
2.6. Sample processing
Liquid-liquid extraction method [
9,
10] was used to isolate DEU and TMP as IS from human plasma. 0.100 mL sample (K2 EDTA plasma) was aliquoted into Ria (polypropylene) vials. Another 0.050 mL IS working solution was added to all samples except blank and vortexed. 0.100 mL of 2 mM ammonium format was added to all samples and vortexed. 1.000 mL of methyl tertiary butyl ether (MTBE) was added to all samples. All samples were vortexed at 2500 rpm for 10 minutes. The supernatant was separated into a fresh Ria vial. Samples were evaporated at 40°C under nitrogen gas till dryness. The samples were then reconstituted with 0.500 mL mobile phase and vortexed for 3 min. Samples were transferred to an autosampler vial for analysis and 5 μL of the sample was injected into a chromatographic system with MS-MS detection.
2.7. The validation process of innovated strategy
The method has been validated under FDA guidance [
11].
2.7.1. Selectivity
At least six individual donor lots of human plasma were used for analyses of blank samples for selectivity. One blank and one lower limit of quantitation (LLOQ) were processed from each plasma lot and analyzed for interference and selectivity.
2.7.2. Precision and accuracy of the creative strategy
According to FDA guidance [
11,
12], a minimum of three concentrations in the range of expected concentrations under a calibration curve should be used for accurate results. To estimate the assay accuracy, six replicates containing analyte at a minimum of three different quality control (QC) levels were analyzed. This analysis ensures that the mean value falls within 15% of the actual concentration, providing reliable data for further decision-making. By adhering to these guidelines, both precision and accuracy can be ensured in the calibration process while maintaining compliance with regulations.
To achieve the required precision, it is essential to perform a minimum of five determinations per concentration at no less than three varying concentration levels. The coefficient of variation (CV) for each concentration level must not surpass 15%, except for lower limit of quantification (LLOQ) measurements, where a maximum of 20% CV is acceptable. Following these standardized procedures will foster the production of reliable data and reinforce the robustness of the calibration process. Moreover, it will guarantee our adherence to regulatory requirements and promote confidence in the analytical results generated.
Recuperation of the analyte requires not to be 100%, but the degree of recuperation of an analyte and the inner standard ought to be reliable, exact, and reproducible. Recuperation tests ought to be performed by comparing the expository comes about for extricated tests at three concentrations (low, medium, and maximum concentrations) with un-extracted/aliquot guidelines that speak to 100% recuperation.
2.7.3. Standardization and calibration graph
The curve for calibration was measured using samples that were produced in the same biological medium by spiking the matrix with specified analyte concentrations. The range of expected analytical results and the type of the analyte/response connection determines how many standards are required when building a calibration curve. Standard levels ought to be determined by the concentration range anticipated in a specific investigation. A calibration curve included a blank sample, a zero sample, and six to eight non-zero specimens that span the predicted range, including LLOQ. A blank sample is a matrix specimen treated without internal standard, whereas a zero sample is a matrix sample generated with internal standard.
2.7.4. Stability study of DEU
To evaluate the stability of the DEU in samples of plasma under different circumstances that could exist during sampling, stability studies were carried out. Six different samples from each level were used to perform the LQC and HQC levels of the stock solution stability, autosampler (processed sample) stability, and extracting stability tests. By contrasting the recoveries of the quality control samples under the various stability settings with those of freshly created samples, the stability of the QC samples was examined. If the average concentration at each QC level was less than 15% and the RSD% did not go over 15%, the samples were considered stable.
3. Results
3.1. Mass spectrophotometry
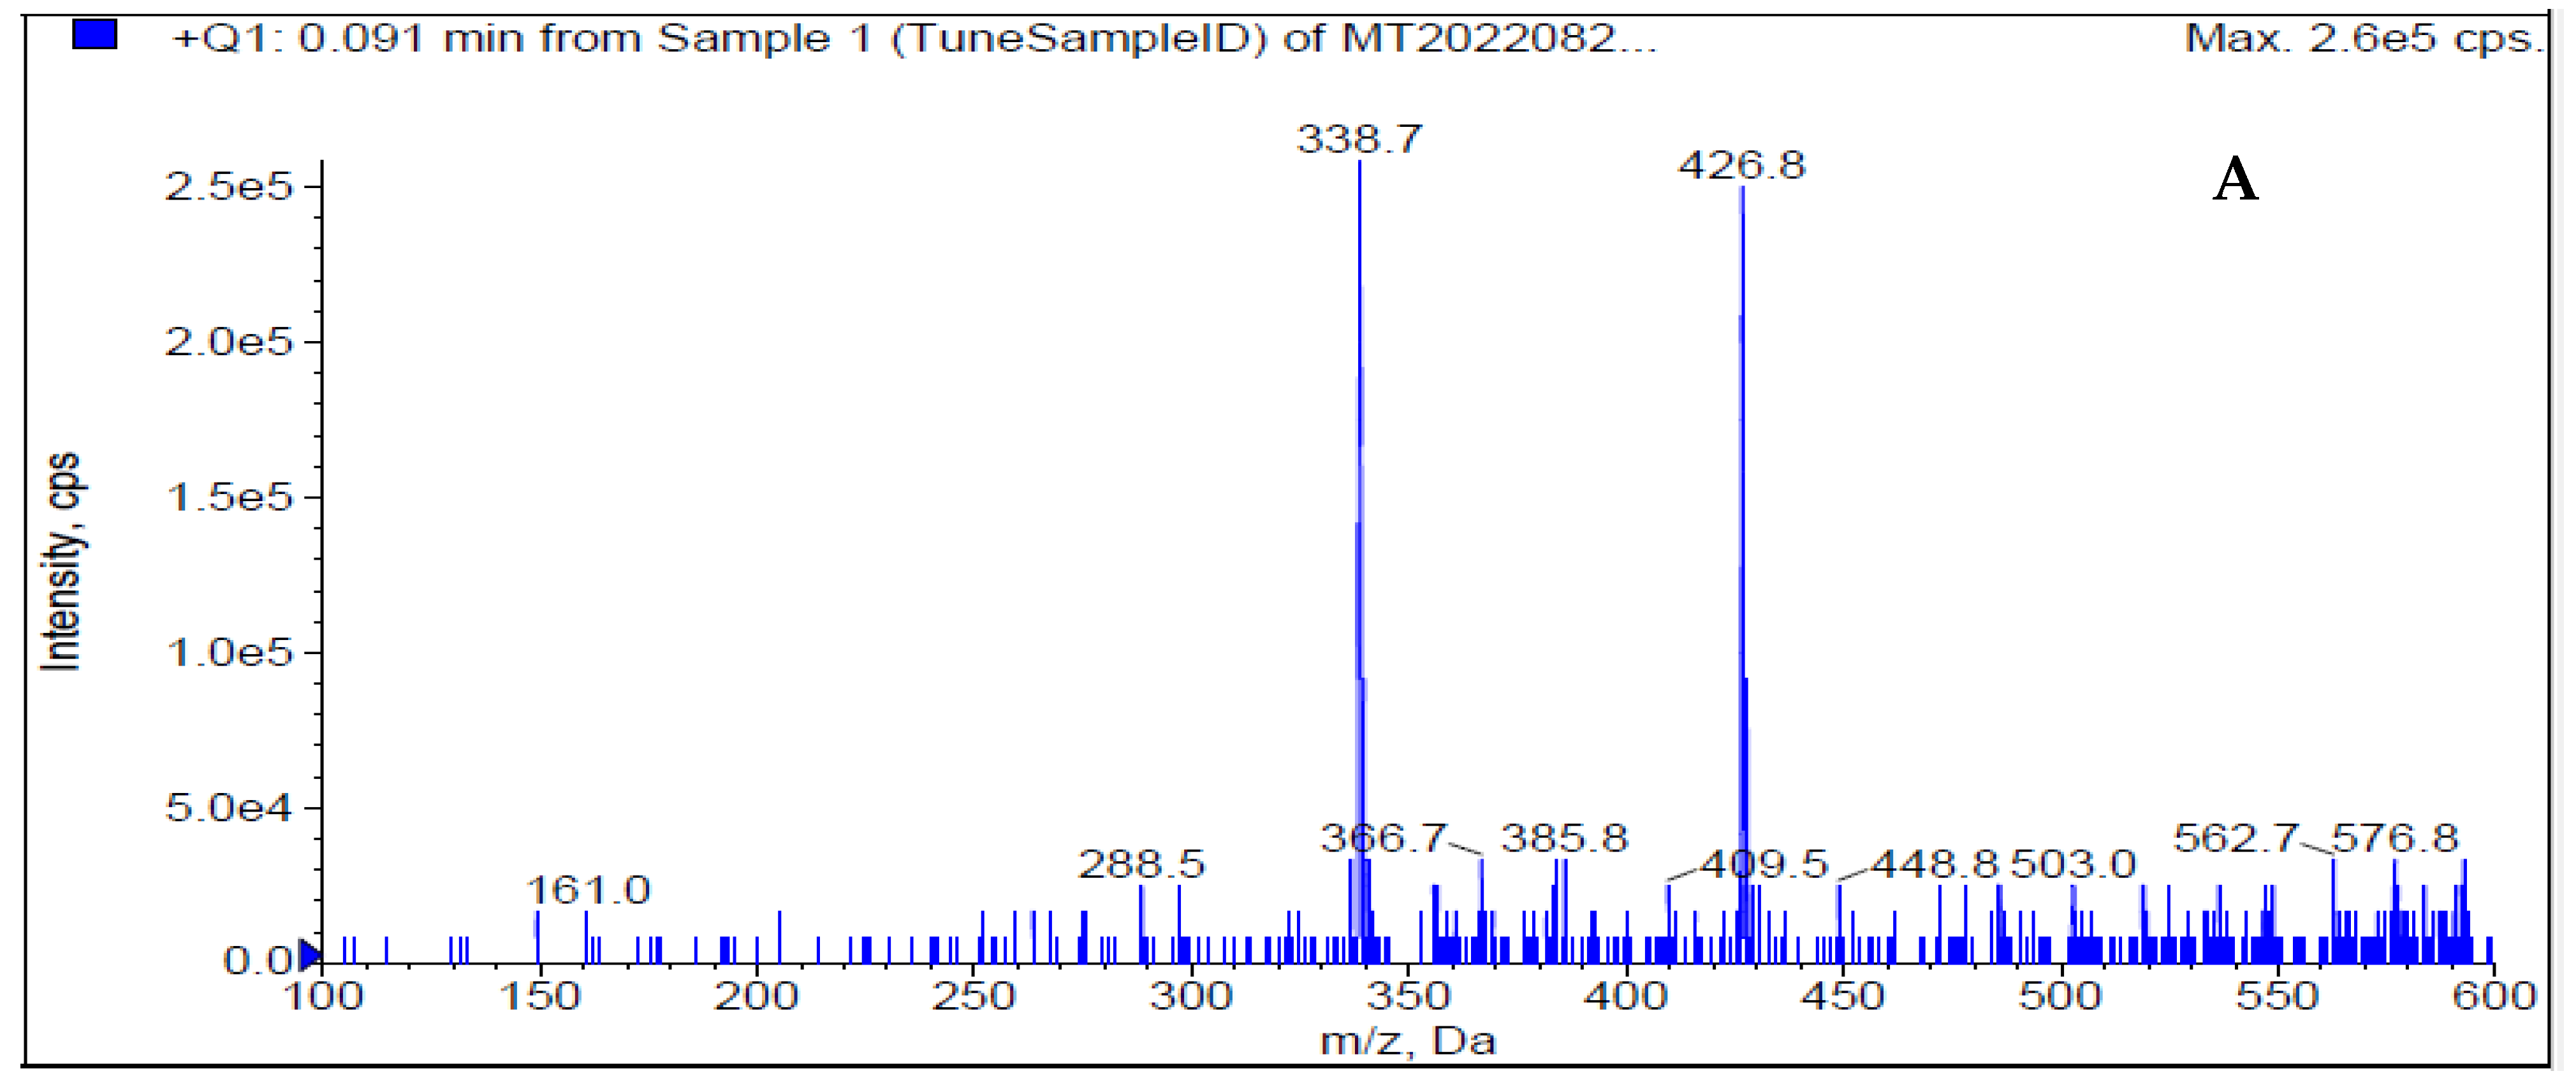
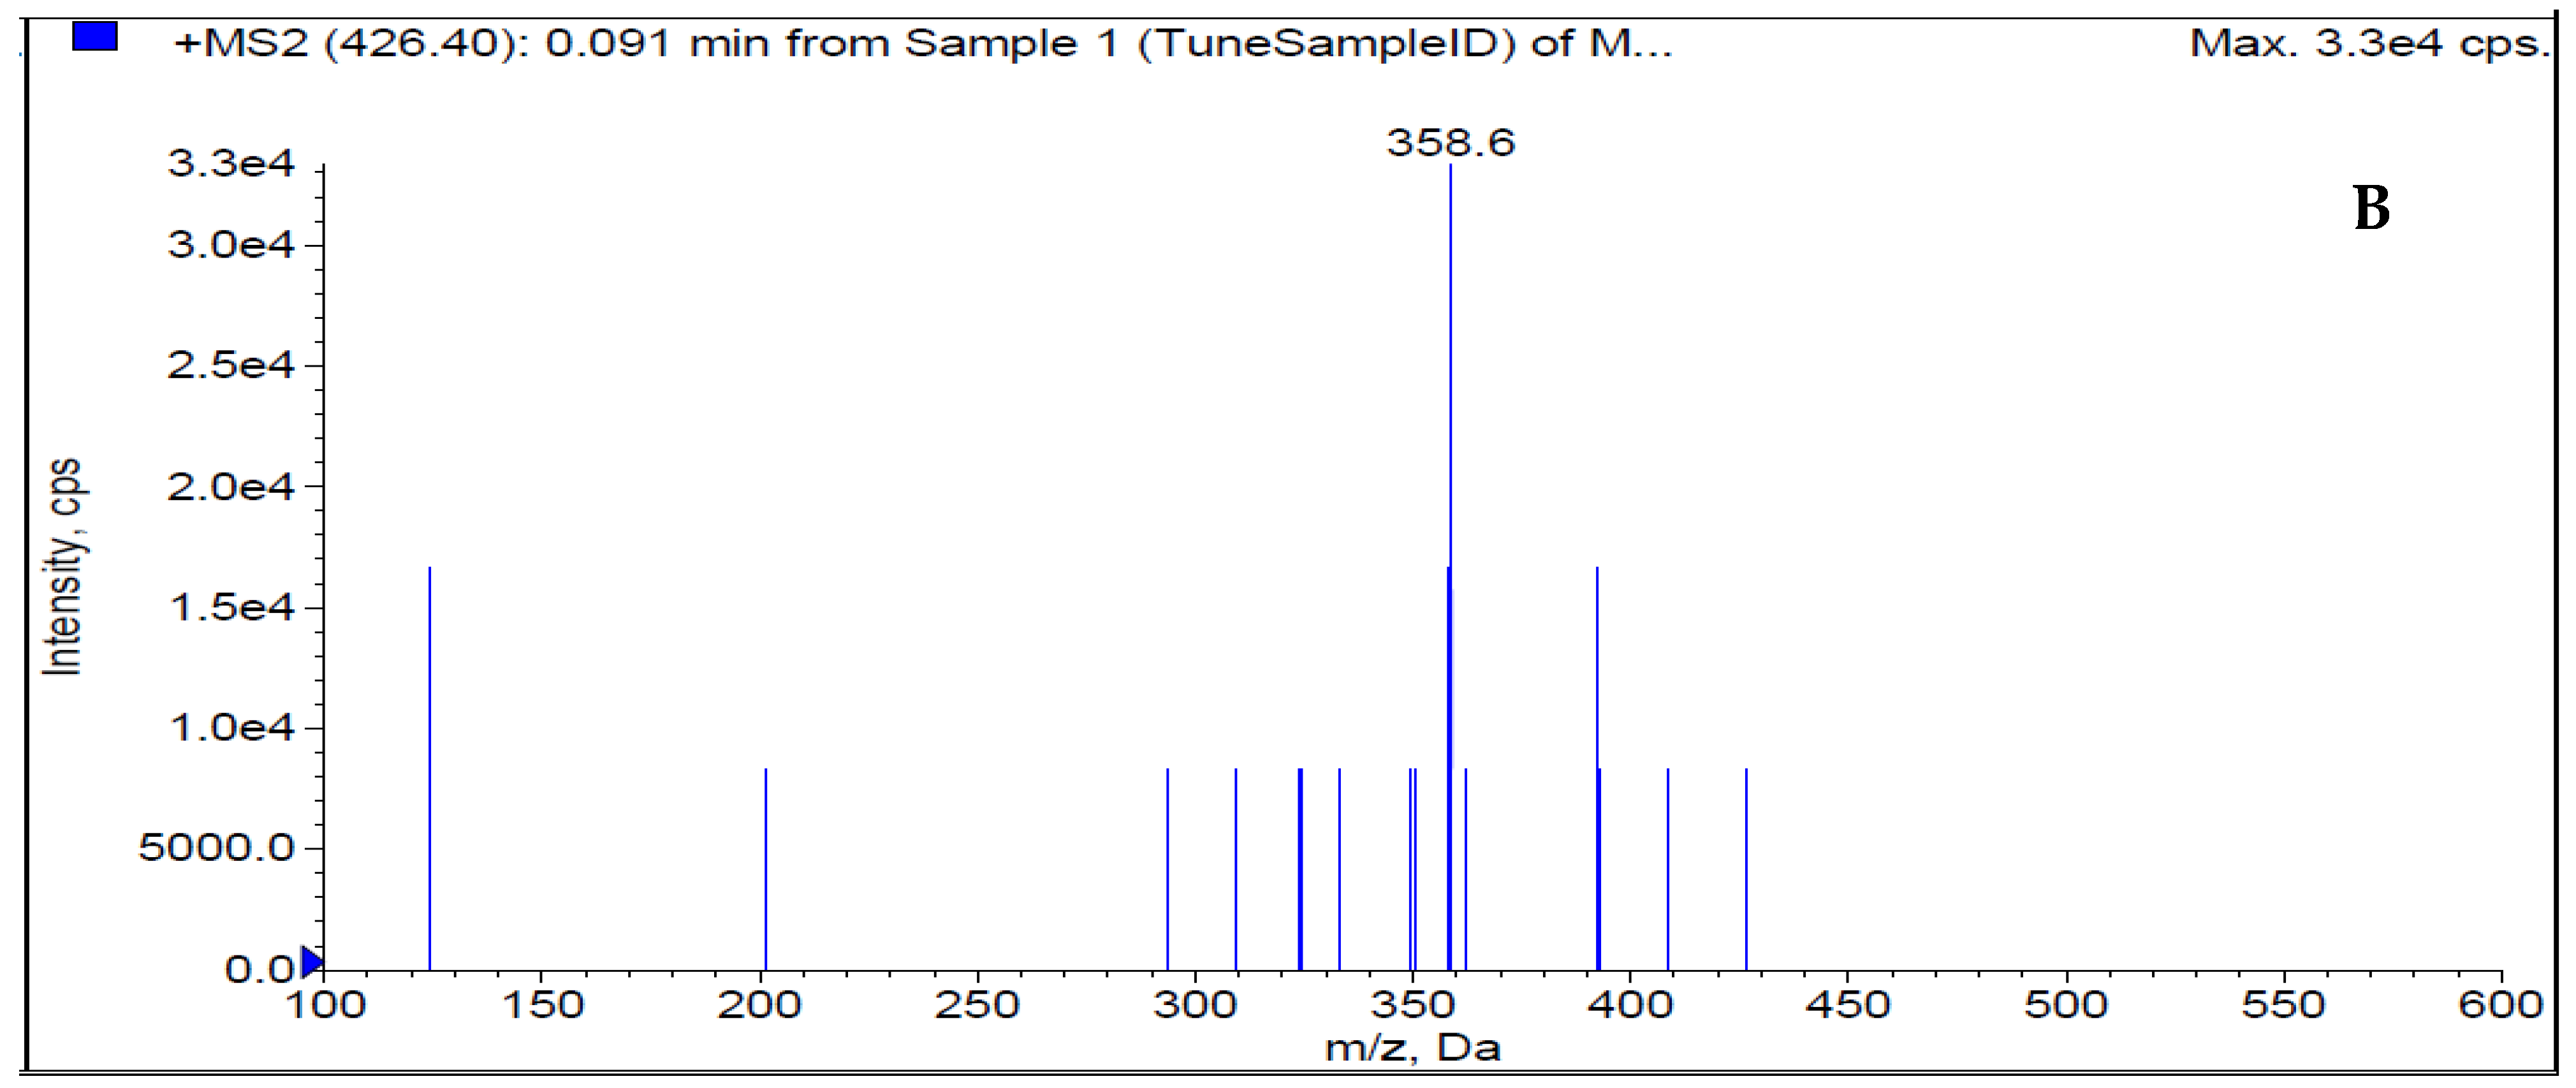
Figure 2 shows how the mass characteristics for the compounds with good performance were optimized in positive ionization mode. Data from the MRM mode were evaluated to improve selectivity [
9,
10,
13]. The m/z values of the protonated form analyte and IS, [M+H]
+ were 426.8 and 291.1 (Q1 mass), respectively. The daughter masses were determined to be 358.6 and 261.1 (Q3 mass) respectively (
Figure 2).
3.2. The development of the creative approach
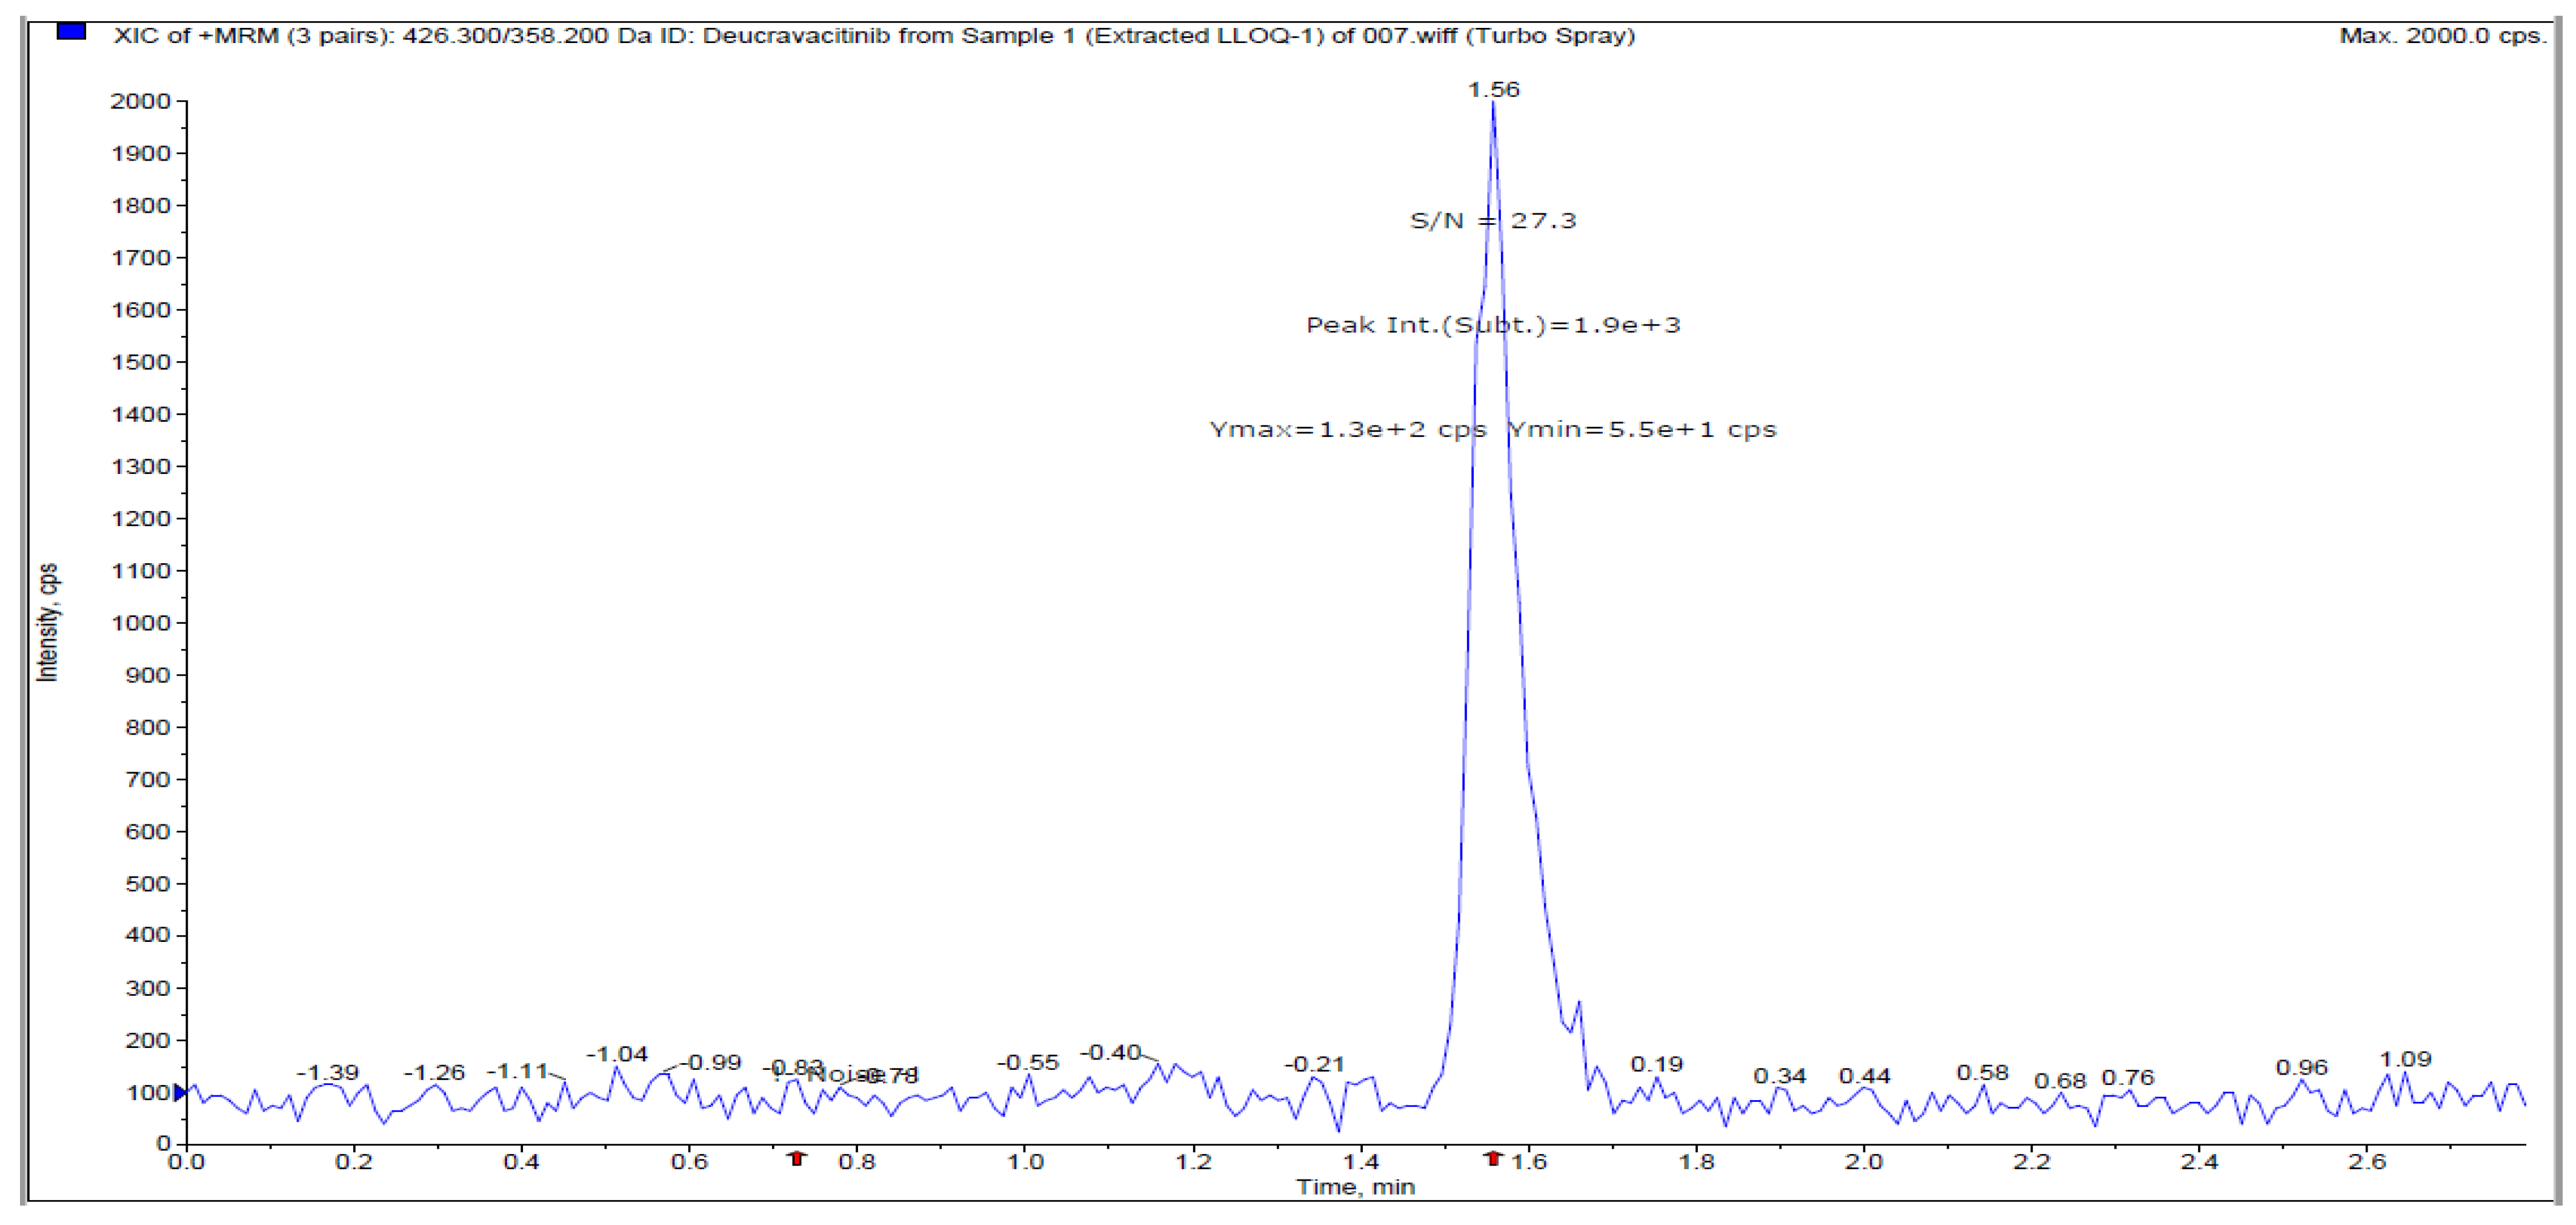
To obtain the requisite separations, a series of studies were carried out utilizing formate and acetate buffers of varying pH. Based on the findings, ammonium formate was chosen as the buffer and methanol was used as the organic solvent. Various buffer and methanol ratios were explored, and finally the methanol: buffer (80:20, v/v) was chosen as the optimized mobile phase because it eluted an elevated peak with favorable features for DEU and TMP as IS. The devised approach (
Table 1 and
Table 2) produced a symmetric peak with a retention period of 1.56 min for DEU and 1.34 min for TMP and met all peak attributes as specified by USP guidelines [
14].
3.3. Method Validation
3.3.1. Specificity
Selectivity of the creative strategy was performed by checking blank plasma (without spiking with DEU) from six individual blood donor lots. Each blank plasma was processed against each LLOQ and analyzed. Interference in blank at analyte retention time (RT) was less than 20% area of the respective LLOQ. Interference in the blank at IS retention time was less than 5% of the respective internal standard IS area (
Supplementary material Table S3).
3.3.2. Linearity
To define the range of DEU concentrations that can be tested with the creative approach, we collected and analyzed eight different sets containing DEU concentrations ranging from 0.5 to 601.05 ng mL
-1 (
Table 3). Plot the area ratios obtained for each concentration against the amount of DEU. Linearly fit the points by least-squares regression analysis and observe constant proportions with minimal data variance. 75% calibration standards must be within 85-115% of nominal concentration except CC1 where it can be within 80-120 % of nominal concentration (i.e. LLOQ). The mean correlation coefficient (r2 value) was obtained greater than 0.9941 (
Table 3). Hence, the DEU can be easily estimated with the present system within this concentration.
The lower limit of quantification (LLOQ) for DEU is 0.500 ng mL
-1. The run precision and precision of DEU at 0.500 ng mL
-1 were 96.07 and 9.5%, respectively (
Table 4). Analyte responses at LLOQ were more than 5-fold larger than the blank and IS calibration curves.
3.3.3. Accuracy and precision
Assay accuracy was defined as the ratio of the mean assay value to the actual value collected and expressed as a percentage. From
Table 5 we can see that the accuracy ranges from 95.98% to 108.59%.
Precision was consistent against a single linear curve using three concentrations of LQC, MQC, and HQC (1,444, 240,733,456,798 ng/mL) and precision was determined for six sets of QC specimens. The impact captured is shown in
Table 5. Based on the results obtained, the accuracy ranged from 3.03 to 5.34%.
3.3.4. Recovery
The extraction recoveries for DEU at low (1.444 ng/mL), medium (240.733 ng/mL), and high (456.798 ng/mL) plasma concentrations with six replicate injections each showed 83.73%, 50.42%, 50.64%. The overall recovery of DEU was found to be 61.60%. The recovery of DEU was found appropriate, precise, and reproducible (
Supplementary material Table S4).
3.3.5. Matrix effects
Six individual lots of human plasma were utilized and prepared extracted blank and post-extracted blank from each plasma and analyzed LQC and HQC levels. No significant matrix ions were observed. At LQC and HQC concentrations, the internal standard matrix factor was found 0.96 to 1.08 (
Table 6).
3.3.6. Stability
The stability of the analytes in human plasma was assessed under stock solution stability (storing the spiked plasma for 12 hrs at room temperature), under auto-sampler stability (for 24 hrs) and under wet extraction stability (at 2-8°C for 25 hrs). QC samples at two concentration levels (LQC and HQC) were subjected to different storage conditions and processed. The concentrations calculated for the stability samples and stability ranged between 85-115%.
4. Conclusions
Considering the information in this study, it can be said that a novel method is approved for the liquid-liquid extraction-based detection of deucravacitinib in human plasma at concentrations between 0.500 to 601.050 ng mL-1. In this concentration range, the precision and accuracy are within the appropriate limits. Estimated recoveries are deemed appropriate for the current LQC, MQC, and HQC processing techniques. It turned out that recoveries are due to matrix effects of ~60% but is consistent and reproducible. The drug was also discovered to be stable when subjected to the effects of wet extraction, auto-sampler, and stock solution stability. The proposed method showed excellent accuracy, precision, recovery, and sensitivity within the shortened run period. To date, no analytical approaches were reported for the quantification of DEU in biological fluids. The selective LC-MS/MS strategy was considering the first analytical method to develop a selective, ultra-sensitive, and accurate approach with high repeatability and reliability.
Supplementary Materials
The following supporting information can be downloaded at the website of this paper posted on
Preprints.org. Figure S1: a) Deucravacitinib, extracted blank plasma chromatogram, and b) Deucravacitinib, extracted LLOQ chromatogram Not applicable; Figure S2: a) Trimethoprim (IS), extracted blank plasma chromatogram, b) Trimethoprim (IS), extracted LLOQ chromatogram; Table S3: Calculation of % interference in blank; Table S4: Recovery results of Deucravacitinib.
Funding
This research received no external funding.
Data Availability Statement
Not applicable.
Acknowledgments
The authors thank IndiGlobal Labs Pvt. Ltd. for their gift samples. The project was supported by IndiGlobal Labs Pvt. Ltd., we thank IndiGlobal management for such support. We also thank Dr. Sambasiva Rao Puram for his valuable guidance during the project.
Conflicts of Interest
The authors declare no conflict of interest.
References
- Khaledian, S.; Abdoli, M.; Fatahian, R.; Zahabi, S. S., Quantum Dots in Cancer Cell Imaging. In Quantum Dots-Recent Advances, New Perspectives and Contemporary Applications, IntechOpen: 2023.
- McHugh, K. J.; Jing, L.; Behrens, A. M.; Jayawardena, S.; Tang, W.; Gao, M.; Langer, R.; Jaklenec, A. Biocompatible semiconductor quantum dots as cancer imaging agents. Adv. Mater. 2018, 30, 1706356. [Google Scholar] [CrossRef] [PubMed]
- Gudjonsson, J.; Johnston, A.; Sigmundsdottir, H.; Valdimarsson, H. Immunopathogenic mechanisms in psoriasis. Clin. Exp. Immunol. 2004, 135, 1–8. [Google Scholar] [CrossRef] [PubMed]
- Brandrup, F.; Holm, N.; Grunnet, N.; Henningsen, K.; Hansen, H. , Psoriasis in monozygotic twins: variations in expression in individuals with identical genetic constitution. Acta Derm. Venereol. 1982, 62, 229–236. [Google Scholar] [CrossRef] [PubMed]
- Chimalakonda, A.; Burke, J.; Cheng, L.; Catlett, I.; Tagen, M.; Zhao, Q.; Patel, A.; Shen, J.; Girgis, I. G.; Banerjee, S. , Selectivity profile of the tyrosine kinase 2 inhibitor deucravacitinib compared with Janus kinase 1/2/3 inhibitors. Dermatology and Therapy 2021, 11, 1763–1776. [Google Scholar] [CrossRef] [PubMed]
- Catlett, I. M.; Aras, U.; Hansen, L.; Liu, Y.; Bei, D.; Girgis, I. G.; Murthy, B. , First-in-human study of deucravacitinib: A selective, potent, allosteric small-molecule inhibitor of tyrosine kinase 2. Clin. Transl. Sci. 2023, 16, 151–164. [Google Scholar] [CrossRef] [PubMed]
- Catlett, I. M.; Hu, Y.; Gao, L.; Banerjee, S.; Gordon, K.; Krueger, J. G. , Molecular and clinical effects of selective tyrosine kinase 2 inhibition with deucravacitinib in psoriasis. J. Allergy Clin. Immunol. 2022, 149, 2010–2020. [Google Scholar] [CrossRef] [PubMed]
- Lé, A. M.; Puig, L.; Torres, T. , Deucravacitinib for the treatment of psoriatic disease. Am. J. Clin. Dermatol. 2022, 23, 813–822. [Google Scholar] [CrossRef] [PubMed]
- Putnam, W. C.; Kallem, R. R.; Subramaniyan, I.; Beg, M. S.; Edpuganti, V. , Bioanalytical method development and validation of a liquid chromatography-tandem mass spectrometry method for determination of β-lapachone in human plasma. Journal of Pharmaceutical and Biomedical Analysis 2020, 188, 113466. [Google Scholar] [CrossRef]
- El-Zaher, A. A.; Hashem, H. A.; Elkady, E. F.; Allam, M. A. , A validated LC-MS/MS bioanalytical method for the simultaneous determination of dapagliflozin or saxagliptin with metformin in human plasma. Microchem. J. 2019, 149, 104017. [Google Scholar] [CrossRef]
- Zimmer, D. , New US FDA draft guidance on bioanalytical method validation versus current FDA and EMA guidelines: chromatographic methods and ISR. Bioanalysis 2014, 6, 13–19. [Google Scholar] [CrossRef] [PubMed]
- Salman, B. I. , A Novel Design Eco-friendly Microwave-assisted Cu–N@ CQDs Sensor for the Quantification of Eravacycline via Spectrofluorimetric Method; Application to Greenness Assessments, Dosage Form and Biological Samples. Journal of Fluorescence 2023, 1–10. [Google Scholar] [CrossRef] [PubMed]
- Chae, Y.-J.; Song, Y.-K.; Chae, S.-H.; Kim, M. J.; Kang, J. S.; Lee, J.-Y.; Koo, T.-S.; Lee, K.-R. , Development and validation of an LC-MS/MS method for monitoring larotrectinib, a tropomyosin-related kinase inhibitor, in mouse and human plasma and application to pharmacokinetic studies. Journal of Analytical Science and Technology 2020, 11, 1–9. [Google Scholar] [CrossRef]
-
United States pharmacopoeia USP 43- NF 38. United States Pharmacopeia: 2021.
|
Disclaimer/Publisher’s Note: The statements, opinions and data contained in all publications are solely those of the individual author(s) and contributor(s) and not of MDPI and/or the editor(s). MDPI and/or the editor(s) disclaim responsibility for any injury to people or property resulting from any ideas, methods, instructions or products referred to in the content. |
© 2023 by the authors. Licensee MDPI, Basel, Switzerland. This article is an open access article distributed under the terms and conditions of the Creative Commons Attribution (CC BY) license (http://creativecommons.org/licenses/by/4.0/).


