1. Introduction
Mitochondria are evolutionarily derived from aerobic bacteria that became endosymbionts of the
Eukaryota having a double membrane around the nucleus. The translocation and compatibility of mitochondria between different cells are possible [
1]. Mitochondrial transfer is regarded as a way of cell to cell communication among other issues. This includes homoeostasis of mitochondrial fission/fusion, the production of reactive oxygen species (ROS), the exchange of mitochondrial DNA (mt-DNA) and nuclear DNA, the release of cytochrome c to induce cell death, and TCA metabolites to regulate DNA methylation, the upregulation of AMP-activated protein kinase (AMPK) activity [
2]. Tunneling Nanotubes (TNT), microvesicles, gap junctions and extrusions are four major mechanisms of mitochondrial transfer between cells [
3]. Because there is constant movement within cells of mitochondria along the cytoskeleton of contractile fibrils, several factors that can initiate the translocation of mitochondria, including ATP level, metabolites, steroids, Ca
2+ and ROS [
4]. In the reported articles regarding the mitochondrial movement and cellular responses, under normal cellular condition, the healthy mitochondria of vascular smooth muscle cells can move into mesenchymal stem cells (MSC) to increase cell proliferation [
5]. As for the pathological example, the movement of mitochondria from MSC can reduce the stress of osteoarthritis [
6]. The mitochondria donated by bone marrow-mesenchymal stem cells (BM-MSCs) can rescue cardioblasts from ischemia-induced cell death [
7]. Therefore, the translocation of mitochondria as a novel strategic therapy for cell/tissue revitalization is currently discussed [
8].
The most distinct feature between primary cultured cells and cancer cells is the limitation of the cell cycle. It became clear that mitochondria and the nucleus maintain a bidirectional regulation of each other in genome integrity and gene expression. During the interphase of mitosis, the mitochondria showed a hyperfused form, while being highly fragmented during metaphase and anaphase [
9]. The mitotic kinase CDK1/cyclin B that controls the cell cycle can increase the phosphorylation of DRP1 so that mitochondria carry out fission and this way enhance the fragmentation of mitochondria [
10]. It was also reported that inhibiting mitochondrial Drp1 can lead to delayed cell division by hindering S-phase and G2/M-phase transfer [11, 12]. The inhibition of Drp1 revealed an enhanced the therapeutic effect of drug-mediated cancer cell apoptosis [
13]. In the case a large amount of unhealthy mitochondria are accumulated, cells will trigger the mitochondrial fission coupled with subsequent mitophagy to remove unhealthy mitochondria to prevent further cell damage [
14]. Therefore, analysis the mitochondrial dynamics and the subsequent ATP production, metabolites levels and cell cycles in cancer was raised [
15].
An artificial way to introduce mitochondrial transfer, also known as mitochondrial transplantation, has been explored for several years [
16]. In breast cancer, mitochondrial transplantations resulted in the inhibition of cell growth, enhancement of cellular susceptibility to doxorubicin and paclitaxel, and increased cell apoptosis [
17]. By injecting mitochondria extracted from heathy cardiomyocytes, the ischemic cardiomyocytes showed a reduced infarction region and the improved ischemia/ reperfusion injury [
18]. Transplanting the mitochondria from muscle stem cells repairs the function of dystrophic myofibers and then improves the regeneration of the muscle [
19]. There were several methodologies of mitochondria transplantation reported. One is that mitochondria can be enveloped by lipid vesicles and therefore facilitate the fusion of exogenous mitochondria with target cells [
20]. Centrifugation is another method that promote the transplantation of mitochondria, which was first applied in improving the atrophic syndrome [
21]. In addition, the droplet-based microfluidic system in enhancing the transplantation of mitochondria was also reported [
22]. In the molecular aspect, proteins such as Miro 1 and Miro 2 proteins were found to be involved in mitochondrial trafficking [
23]. Therefore, the natural or artificial transfer of mitochondria were broadly discovered. The understanding of the effects of mitochondrial transplantation on cell physiology is an interesting topic subsequently.
Melanoma is the most serous type of skin cancer characterized by a high ability for metastases [
24]. In the present study, we hypothesized that the fast cell cycle characteristic of the B16F10 melanoma cell can be ameliorated by mitochondria purified from primary cells. Human umbilical vein endothelial cells (HUVEC) are a kind of primary cells that show a limited cell cycle and can be sub-cultured for only 10 to 15 passages. Blood vessels are important for cancer metastasis, and in the spatial distribution within the tumor, endothelial cells (ECs) are adjacent to cancer cells. Therefore, investigating the mitochondrial transfer and the subsequent physiological effects between melanoma cell and ECs is warranted. Here we firstly analyzed the basic information of mitochondrial membrane potential (MMP), ATP level, mitochondrial DNA (mt-DNA), mitochondrial protein (mt-protein) of HUVEC and B16F10. After mitochondrial transplantation, the cell migration, invasion, epithelial-mesenchymal transition (EMT) markers, mitochondrial dynamics and animal models were studied as well. The results provide valuable insights about the use of mitochondria with different efficiencies of changing cancer malignancies.
2. Materials and methods
2.1. Cell culture
Human umbilical vein endothelial cells (HUVEC) were purchased from Thermo Fisher Scientific (Waltham, MA, USA). HUVECs were cultured in M199 medium supplemented with fetal bovine serum (FBS, 20%, v/v), streptomycin (100 μg/mL) and penicillin (100 U/mL). B16F10 melanoma cells were purchased from Merck (Darmstadt, Germany) and cultured in RPMI 1640 medium (Gibco, Waltham, MA, USA) supplemented with FBS (10%, v/v), streptomycin (100 μg/mL), penicillin (100 U/mL) and sodium pyruvate (1%, g/v). Both HUVEC and B16F10 were incubated in a 37°C growth chambers with CO2 (5%, v/v).
2.2. Measurement of mitochondrial membrane potential (MMP)
The cells were trypsinized and collected by centrifugation. The cell pellets were re-suspended in 1 mL 1×PBS wash buffer and incubated with JC-1 reagent according to the user’s guideline (Thermo Fisher Scientific). Fluorescence was measured by Guava easyCyte, Luminex Company (Austin, TX, USA). Ratio of red light (λex 488 nm/ λem 661 nm) and green light (λex 488 nm/ λem 525 nm) were statistically calculated from 1×10⁶ cells.
2.3. Measurement of ATP level
The ATP assay reagent was purchased from Abcam (Waltham, MA, USA). According to the user’s guideline, the collected cells were re-suspended in 1 mL 1× PBS buffer and were lysed by 250 μL lysis buffer. Aliquoted 50 μL of cell lysate was incubated with 50 μL of assay buffer for 30 min. The ATP level was determined by ELISA plate reader at OD 480 nm.
2.4. Isolation of mitochondria
The mitochondria were isolated according to the user’s guideline (Abcam). The cells were trypsinized and then collected by centrifugation. The cells were lysed with 500 μL of cytosol extraction buffer by moderate shaking for 20 min. After centrifugation with 700 ×g for 20 min, the supernatant was transferred to a new tube for additional 10000 ×g centrifugation to precipitate the mitochondria. The putridity of isolated mitochondria was identified by the detectable level of COX IV protein through western blot analysis.
2.5. Purification of mitochondrial DNA
After harvesting the mitochondria from cells, the mitochondrial DNA (mt-DNA) was further purified by incubation with mitochondrial lysis buffer. The mitochondria were lysed with lysis buffer for 60 min and then the mt-DNA was precipitated with cold ethanol for additional 10 min. By centrifugation for 5 min, the mt-DNA pellet was dissolved in H2O and the concentration was determined by OD260/280. All the protocols followed the guideline of user’s manual (Abcam).
2.6. Extraction of mitochondrial protein (mt-protein)
The mitochondria harvested from cells were lysed by sonication with 100 µL of lysis buffer (250 mM HEPES pH 7.7, 1 mM EDTA, 0.1 mM neocuproine, 0.4% (w/v) CHAPS). After centrifugation, the supernatant was transferred to a new tube and the concentration of mt-protein was determined by using a BCA reagent (Thermo Fisher Scientific).
2.7. Mitochondria transplantation
The mitochondria isolated from 5×10⁶ HUVEC were stained by 50 mM MitoTracker-Green fluorescent dye (Thermo Fisher Scientific) for 30 min. The mitochondria in the 5×10⁶ B16F10 were stained with MitoTracker-Orange fluorescent dye for 30 min. After removing the redundant fluorescent dyes, the purified HUVEC mitochondria were co-incubated with B16F10 for indicated time intervals. The untransplanted HUVEC mitochondria were removed by replacing the fresh medium. By applying the fluorescent microscope (LEICA DMi8 S, Wetzlar, Germany), the exogenous HUVEC mitochondria were observed by λex 490 nm/ λem 516 nm (green color). The endogenous mitochondria of B16F10 were observed by λex 554 nm/ λem 576 nm (red color). Images were merged to determine the transplantation of HUVEC mitochondria into B16F10. For flow cytometric analysis, the B16F10 transplanted with HUVEC mitochondria were detached by trypsin and then suspended in 1×PBS buffer. The ratio of red light (endogenous mitochondria of B16F10) and green light (transplanted HUVEC mitochondria) that indicates the transplantation of mitochondria were statistically calculated from 1×10⁶ cells by flow cytometry (Guava easyCyte, Luminex Comp. Austin, TX, USA).
2.8. Wound healing assay
The mitochondria isolated from HUVEC were incubated with B16F10 to allow mitochondrial transplantation. In the wound healing assay that was applied to evaluate the cell migration rate, the gaps of B16F10 on the plate were created by a scratch with a 200 μL tip. Two amounts of HUVEC mitochondria 2.5×10⁶ (0.5× HUVEC Mito.) and 5×10⁶ (1× HUVEC Mito.) were incubated with 5×10⁶ B16F10 separately. The images from the initial of scratch and after the culture for 12 h and 24 h were captured by a digital camera (SONY DSC-H20, SONY Corp. Minato-ku, Tokyo, Japan) and then analyzed by TScratch software from six repeats.
2.9. Cell invasion assay
Fifty microliters of Corning™ Matrigel™ (Thermo Fisher Scientific) was added into the transwell (Greiner Bio-One Inc.) and incubated in the 37°C for 2 h. 5×10⁴ B16F10 cell transplanted with 0.5× or 1× HUVEC mitochondria were seeded on the surface of transwell and then incubated with 37°C for 24 h. The cells were fixed by paraformaldehyde (4%, w/v) for 15 min and then stained by Giemsa Stain (10%, v/v, Sigma-Aldrich, St. Louis, MO, USA) for 15 min. The redundant dye was removed by washing with H2O and then observed by microscope.
2.10. Western blot
The proteins of B16F10 transplanted with HUVEC mitochondria were extracted by lysis buffer: HEPES (50 mM, pH 7.7), EDTA (1 mM), neocuproine (0.1 mM), CHAPS (0.4%, w/v). Forty microgram of proteins were mixed with sample buffer: Tris-HCl (62.5 mM, pH 6.8), SDS (3%, w/v), 2-mercaptoethanol (5%, v/v) and glycerol (10%, v/v), and then separated by SDS-PAGE. The gel was blotted to a PVDF membrane (Millipore, Billerica, MA, USA) and then incubated with antibodies. The antibodies NANOG (1:2000), TGF-β (1:1000), SOX2 (1:1000) were purchased from BD (San Jose, CA, USA). N-cadherin (1:2000), SMAD (1:2000), p-SMADSer465 (1:2000), MFN2 (1:2000), DRP1 (1:2000), LC3 II (1:2000), MMP-9 (1:2000), α-SMA (1:2000) and Actin (1:3000) were purchased from Cell Signaling Tech (Danvers, MA, USA). GRP78 (1:2000), Cyclin D1 (1:2000) and Cyclin E1 (1:2000) were purchased from Thermo Fisher Scientific. The membranes were developed with the SuperSignal West Femto Maximum Sensitivity Substrate (Thermo Fisher Scientific) and observed by a luminescence imaging device (MiniChemi 500, Sagecreation Co, LTD, Beijing, China). The protein level was calculated by the Progenesis Samespots v2.0 software (NonLinear Dynamics, Newcastle, UK).
2.11. Xenograft Tumor Experiments
After the transplantation of HUVEC mitochondria, the B16F10 cells were cultured in RPMI 1640 medium (Gibco, Waltham, MA, USA) containing 10% FBS under 5% CO2 at 37°C. The B16F10 were harvested and subcutaneously inoculated (5×10⁶ cells/0.1 mL in PBS) into 6-week-old BALB/c nude mice (BioLASCO, Taipei City, Taiwan). The tumor volumes (V) were measured every 2 days and determined using the formula V = L×W2/2 (L, length; W, width). The tumors were harvested after 10 days.
2.12. Statistical analysis
Each experiment was repeated for at least three times. Data were expressed as means with standard error of the mean (SEM). Statistical differences were estimated using Fisher’s least significant difference (LSD). The changes were individually compared to the control by Fisher’s LSD for significant differences (p < 0.05).
4. Discussion
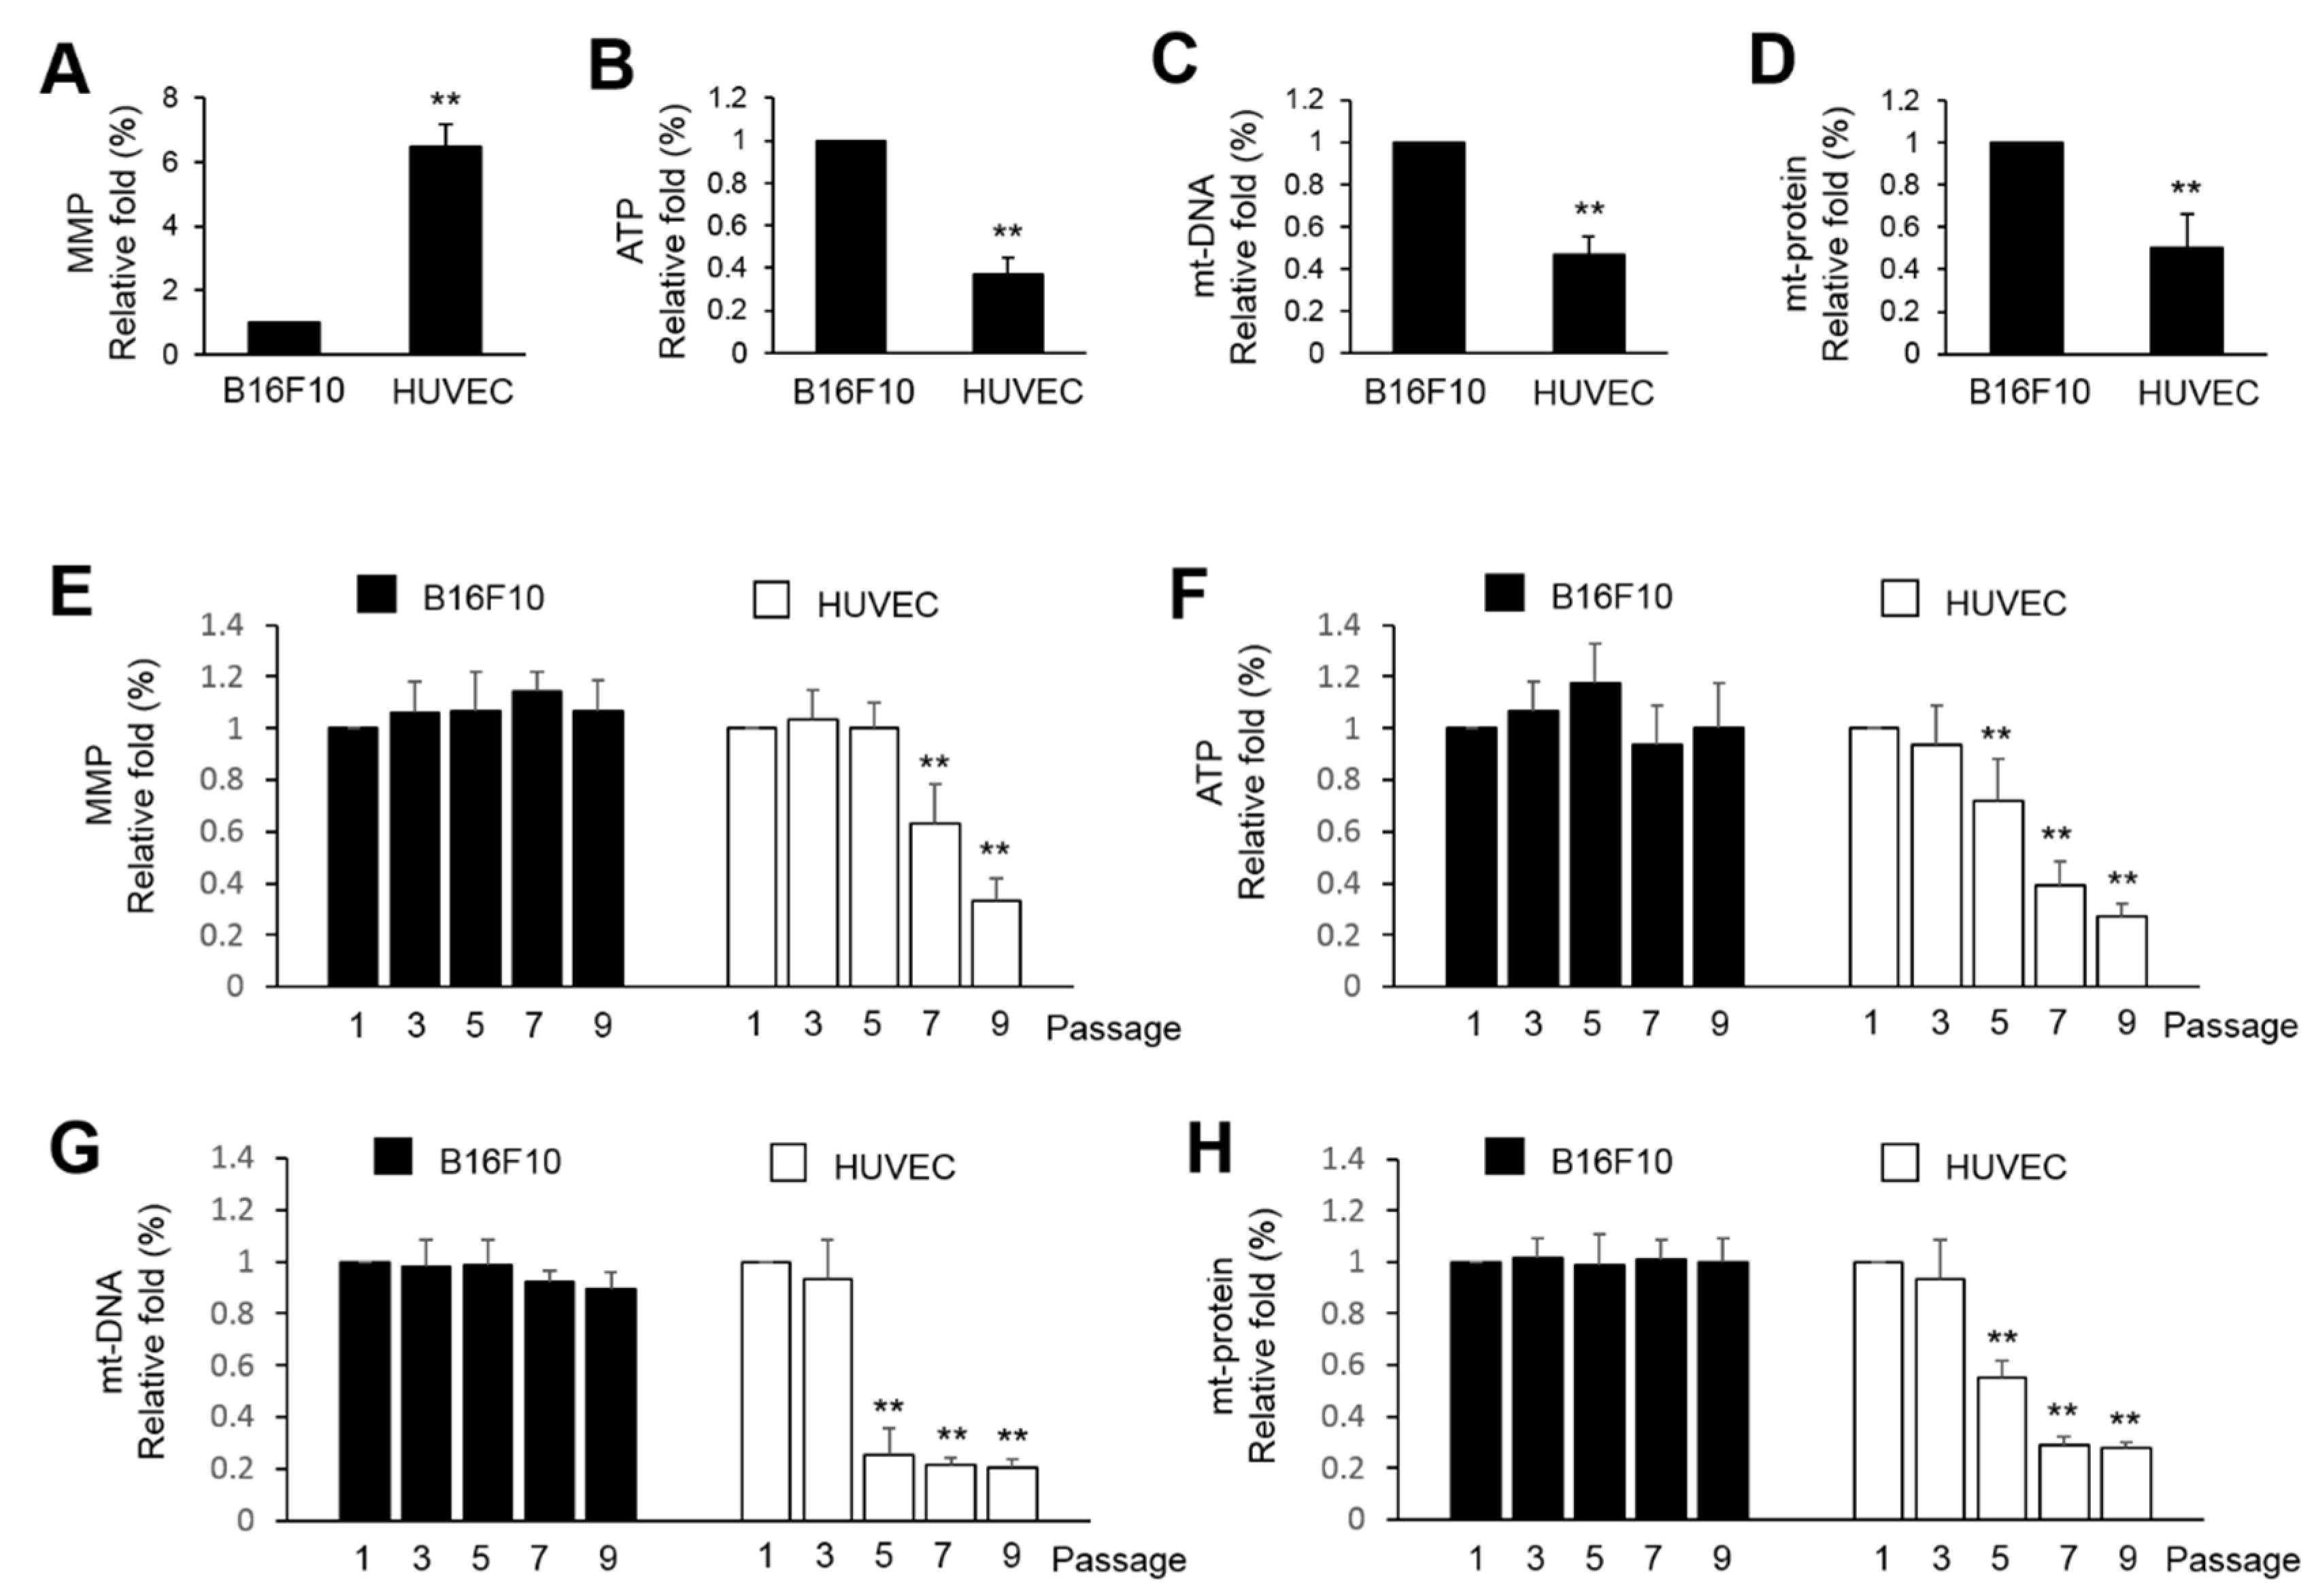
Cancer cells are generally regarded as high-energy consuming cells due to the high demand of energy for rapid cell proliferation. Therefore, application of mitochondria purified from normal cells to alter the mitochondrial function or the metabolic balance of cancer cells is possible. In the present study, the B16F10 showed a higher ATP level, mt-DNA and mt-protein, and lower levels of MMP than HUVEC (
Figure 1A). This partially indicates that HUVEC mitochondria might not be essential for ATP production in cancer cell and the production of ATP might come from glycolysis and what is known as the Warburg effect [
25]. Further analysis showed that immortalized B16F10 showed consistent levels in MMP, ATP production, mt-DNA and mt-protein. However, HUVEC cells were dominantly affected by the extension of passages. This implies that in normal cells, mitochondria are more susceptible to the aging of cells. That is why we try to use HUVEC mitochondria to shorten the lifespan of immortalized B16F10 cells.
Artificial transfer of mitochondria was reported in previous studies [
3,
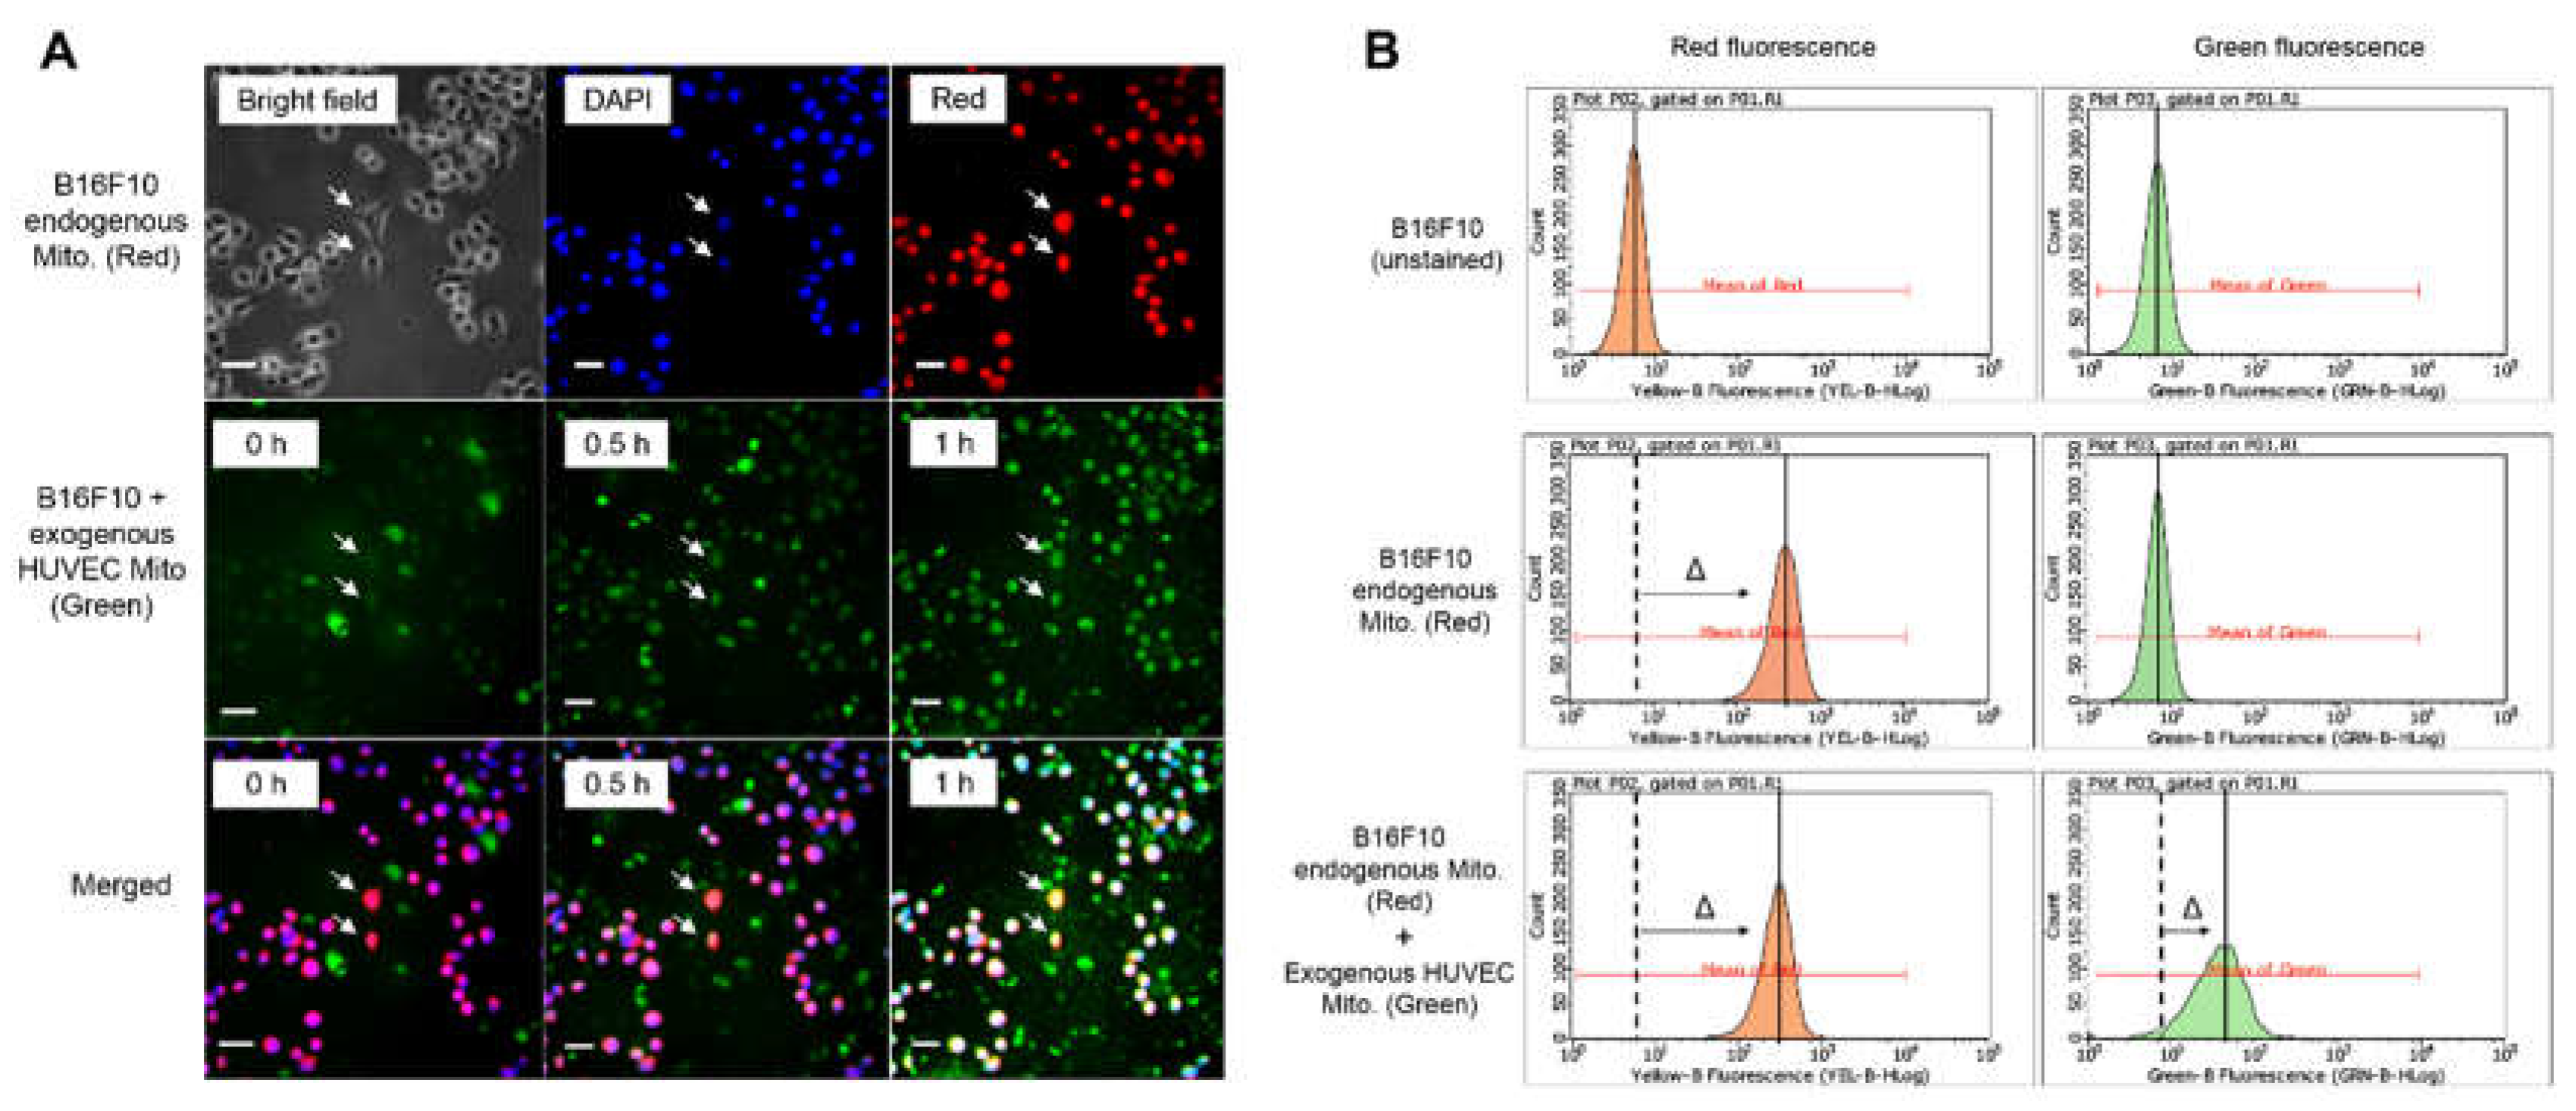
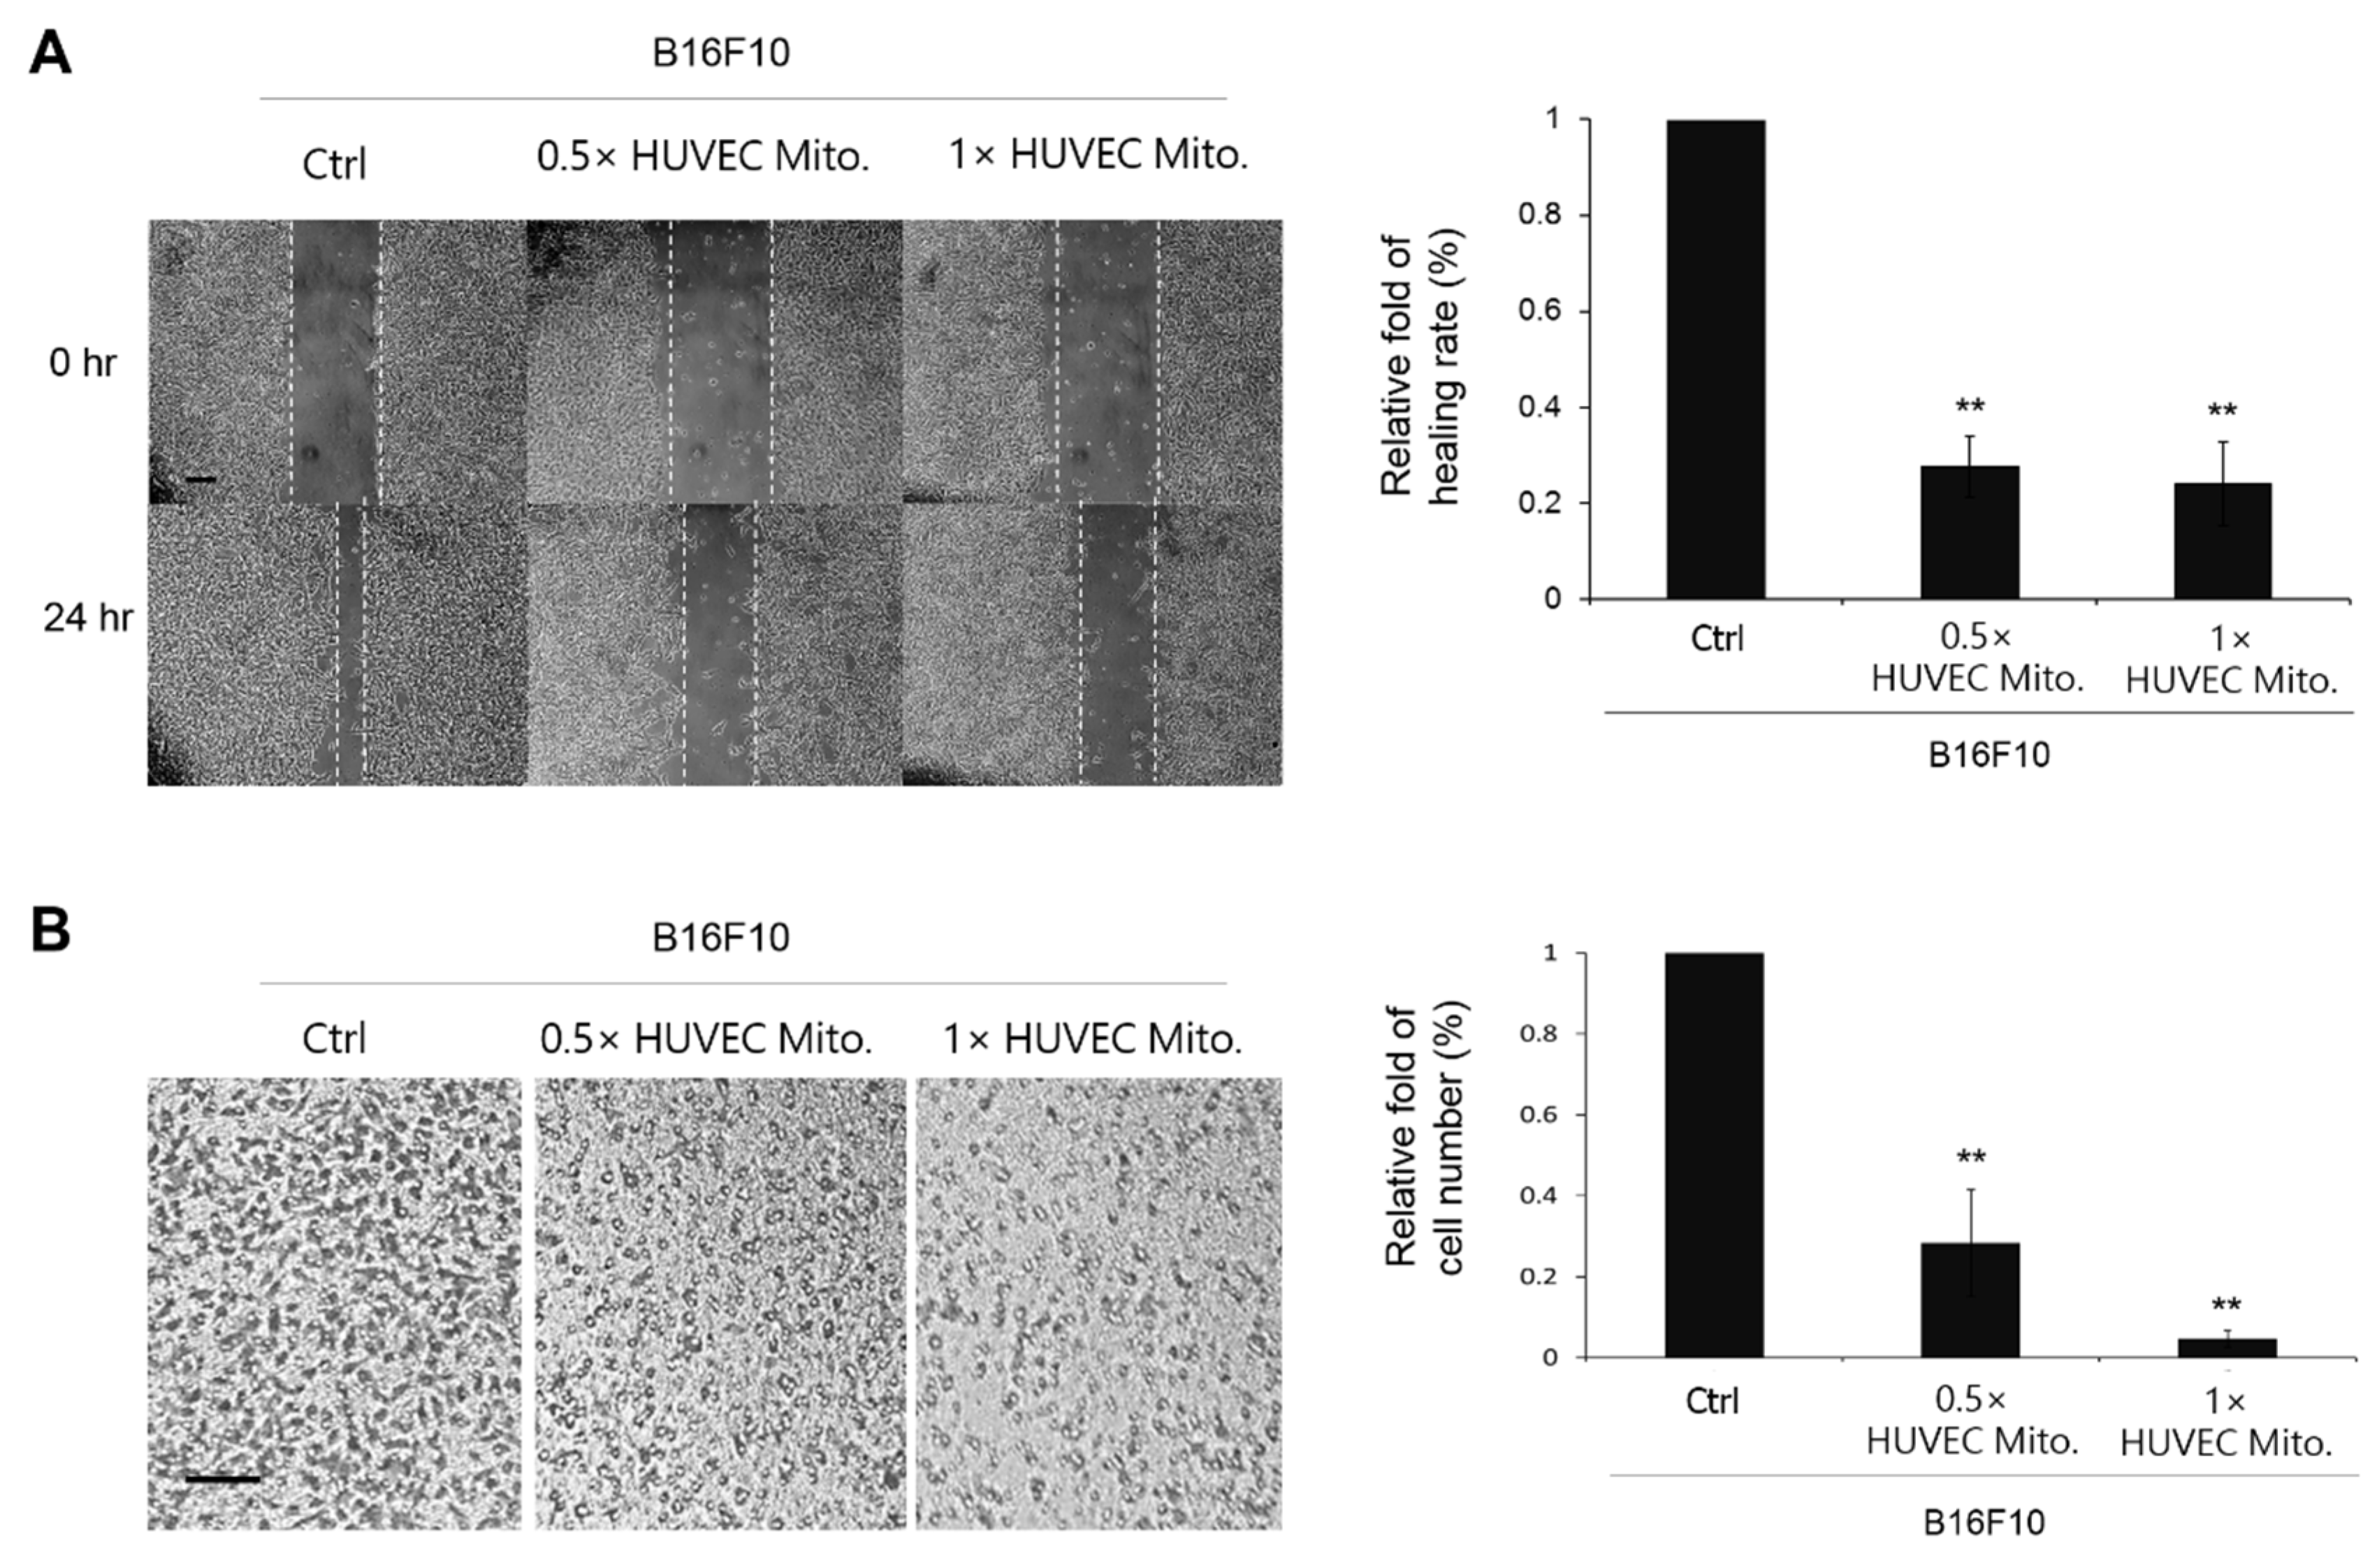
16]. In the present study, accepting the concept of endosymbiotic theory, we believe that heterologous mitochondria are compatible to survive in different cell types. Therefore, the purified HUVEC mitochondria were co-incubated with B16F10 directly. The absorption of HUVEC mitochondria by B16F10 was double confirmed by using fluorescent microscopy and flow-cytometry. As a result, the subsequent study of how the transplanted HUVEC mitochondria affected the physiological responses of B16F10 were examined. The retarded cell migration and invasion in the wound healing and transwell assay indicated that transplanted HUVEC mitochondria can change the malignance of B16F10 (
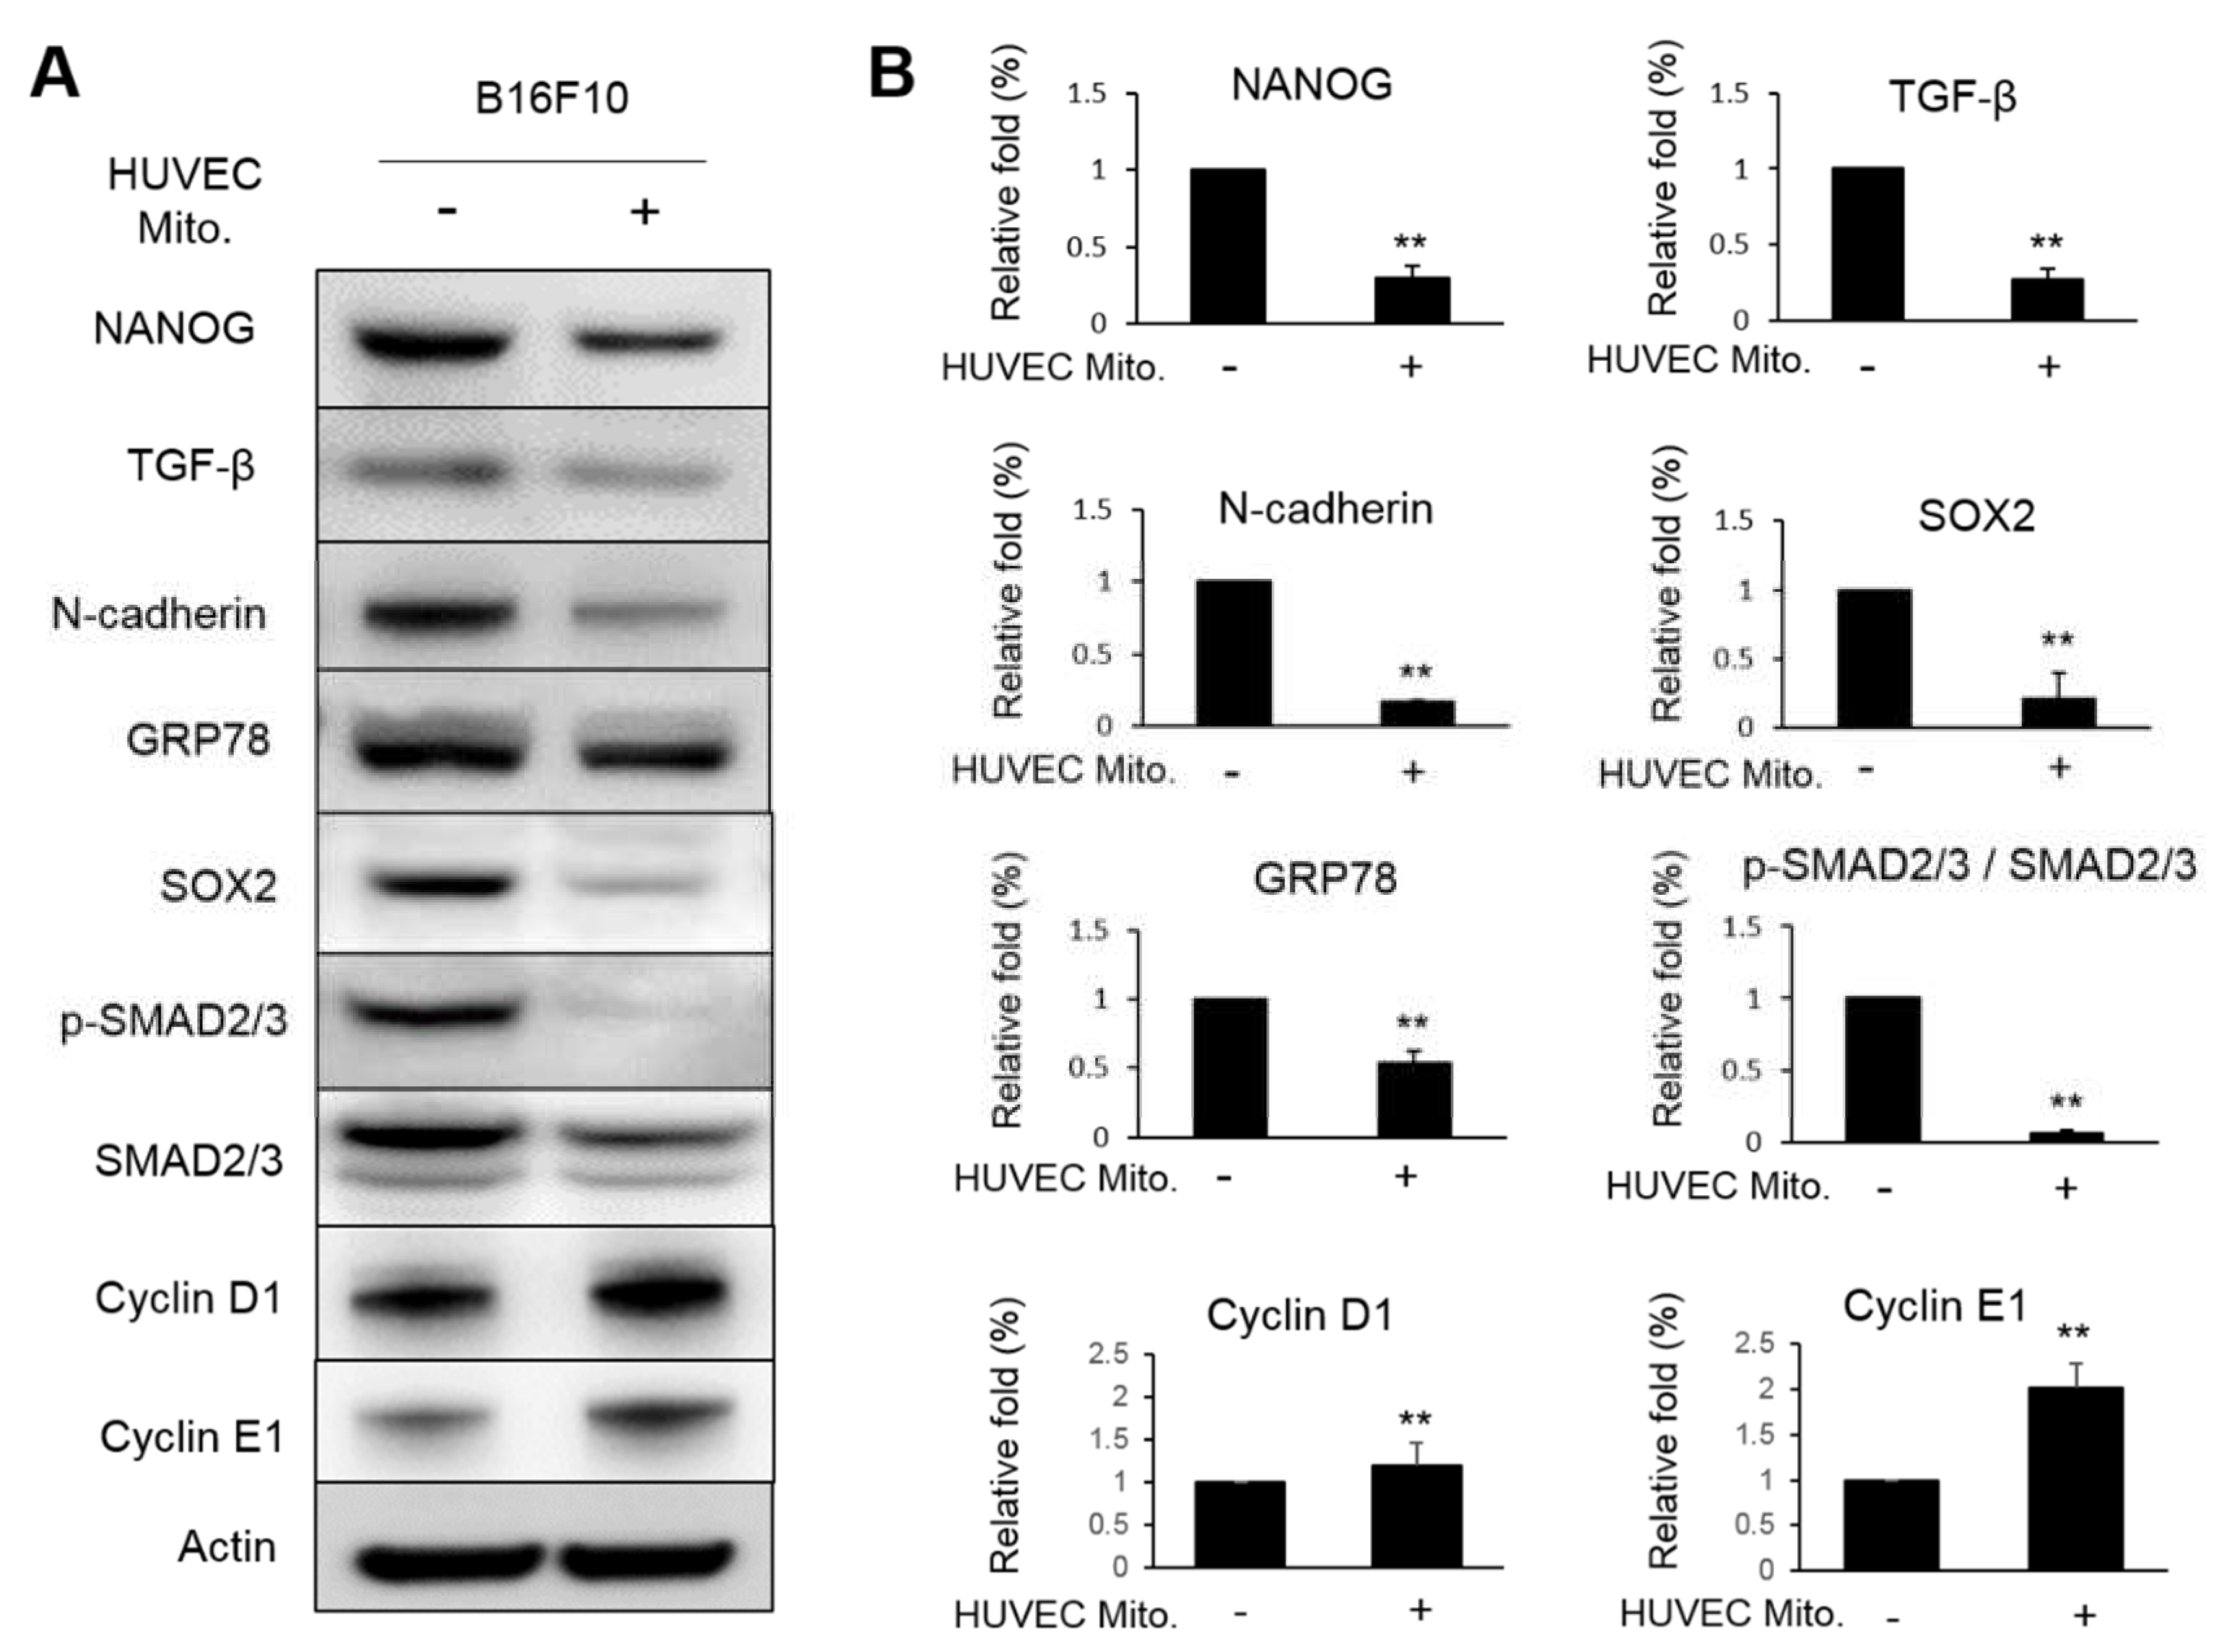
Figure 3). This was also supported by the decreased expressions of proteins involved in EMT (
Figure 4). NANOG is a transcription factor regarded as the most crucial marker in identifying cancer stem cells. It contains the homeobox domain that can regulate the embryogenesis, cellular reprogramming, cancer stemness and migration through complex interactions with SOX2 [
26]. The reported article also indicated that NANOG can promote prostate cancer cell proliferation via activating TGF-β signaling that can induce downstream components including the phosphorylation of SMAD [
27]. N-cadherin is a member of the cadherin family being widely discussed for their active role in epithelial-mesenchymal transition (EMT). In ovarian cancer, NANOG increased the expression of N-cadherin indicating the synergy effect of both proteins [
28]. N-cadherin is closely related to the progression of tumor malignance, such as transformation, adhesion, apoptosis, angiogenesis, invasion and metastasis [
29]. As for the glucose regulated protein (GRP78), it belongs to the family of heat shock proteins 70 (HSP70) shuttling between endoplasmic reticulum and mitochondria. GRP78 is expressed in cancer, trophoblastic and endothelial cell surfaces. GRP78 has been well noted about it’s role in promoting invasion and metastasis under the progression of carcinogenesis and cancer [
30]. SOX2, also known as sex determining region Y (SRY)-box 2 that is regarded as one of the transcription factors driving cancer stemness, accelerating tumor initiation, and promoting tumor aggressiveness [
31]. In the present study, all these proteins involved in the malignancy of B16F10 were suppressed by the transplantation of HUVEC mitochondria. However, two proteins involved in cell proliferation, cyclin D1 and cyclin E1 were paradoxically increased (
Figure 4). Actually, the inhibitory effect of TGF-β signaling on the cell-cycle arrest through the p21(WAF1/CIP1)-G1 cyclin/Cdks-p130 pathway in gastric-carcinoma cells was reported [
32]. Overexpression of TGF-β increases epithelial cancer cell migration and metastasis by inducing EMT [
33]. This implies that the decreased expression of TGF-β will loss the control to the cyclin D1 and E1 in B16F10 transplanted with HUVEC mitochondria. This was further discussed in a subsequent mice animal-model experiment.
Due to the variations of mitochondrial morphology and the genome copy number, it remains difficult to quantify how many mitochondria are present in a cell by the available methodologies such as flow-cytometry, electron microscopy or PCR. Therefore, it remains to be carefully investigated how many HUVEC mitochondria were actually transplanted into B16F10 as well as the subsequent competitive or cooperative interactions between exogenous and endogenous mitochondria. Presently, we try to check whether mitophagy plays an important role in balancing the amount or quality of B16F10 mitochondria after mitochondrial transplantation. Mitophagy is regarded as a recycling process for cells to remove abnormal mitochondria so that the cells can survive from diverse stresses [
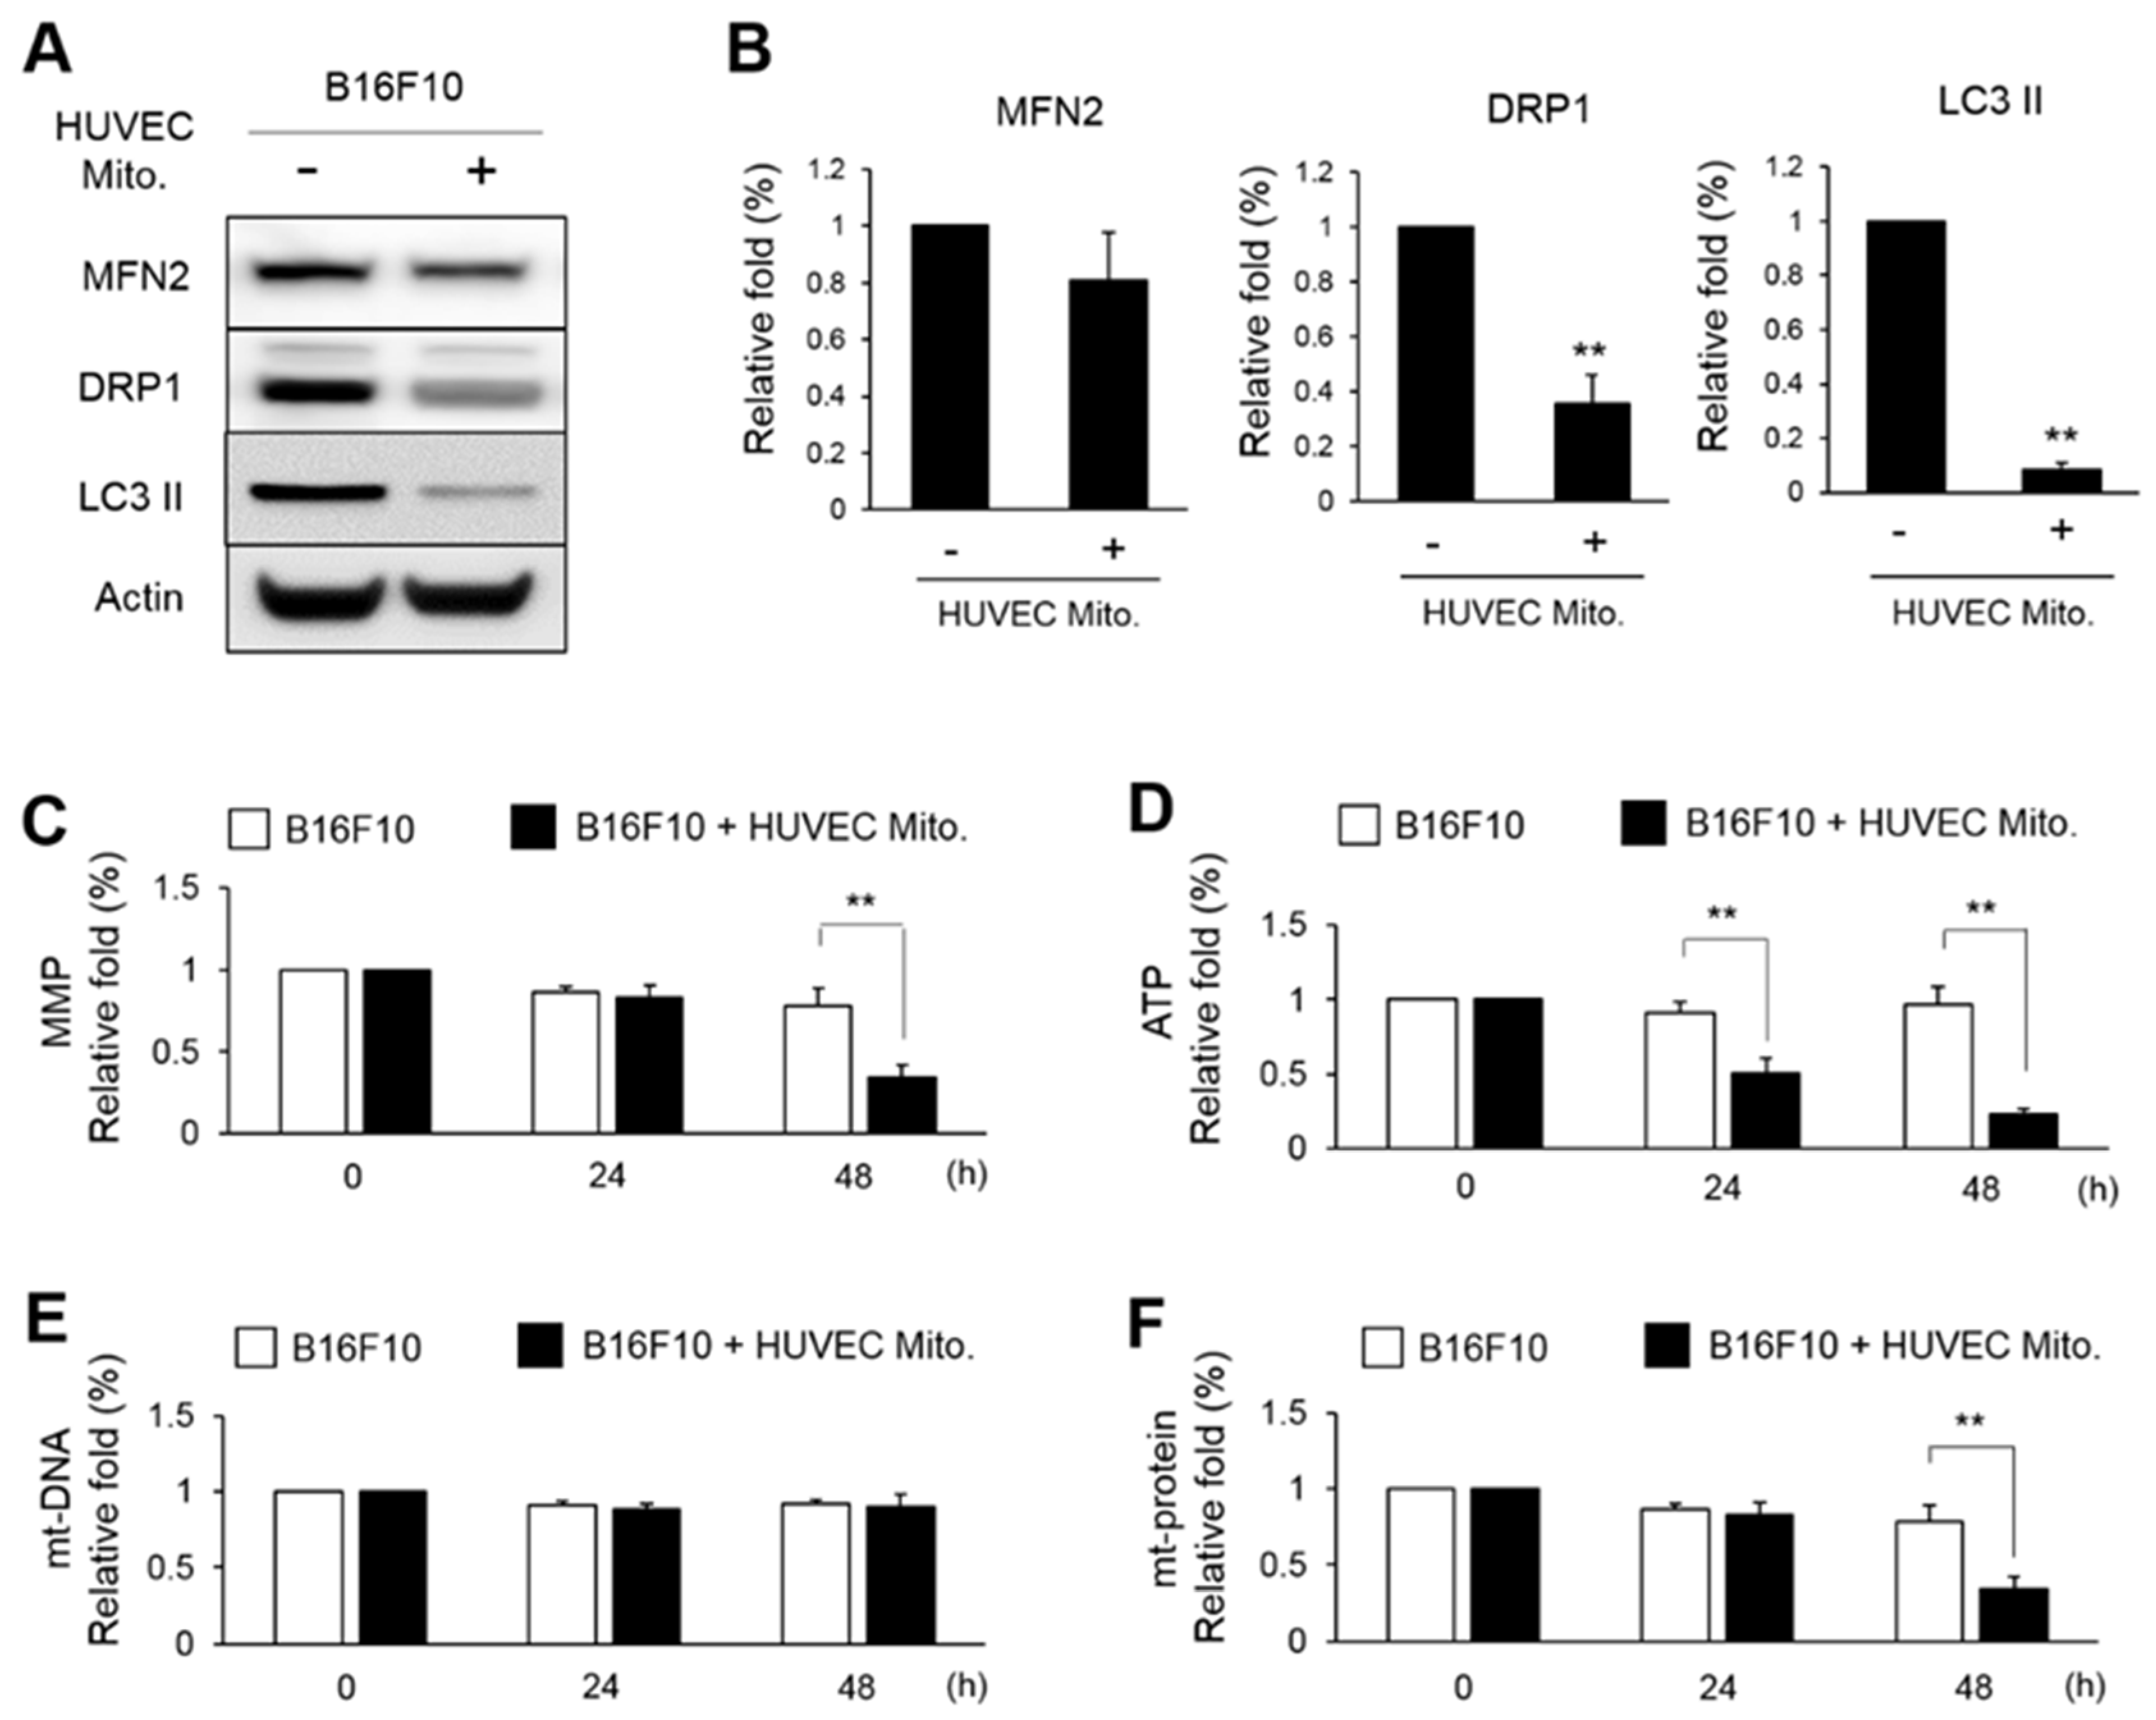
34]. In the present study, we found that mitochondrial fusion protein MFN2 showed no difference whereas the mitophagic proteins DRP1 and LC3 II were significantly reduced (
Figure 5). This indicated that transplanted HUVEC mitochondria might decline the mitophagy. The subsequent study also showed the mt-DNA was not reduced after HUVEC mitochondrial transplantation (
Figure 5E). Therefore, even the total amount of mitochondria in B16F10 was not changed, the function of mitochondria including MMP, ATP and mt-protein were down-regulated (
Figure 5C, D). Indeed, recent review article suggests that mitophagy promotes cancer cell migration, invasiveness, and EMT [
35]. This is why we proposed that HUVEC mitochondria-reduced the expression of mitophagy was associated with a reduced EMT (
Figure 5A,
Figure 4), and how HUVEC mitochondria reduce the malignance of B16F10 by modulating the dynamics (fusion/fission) and the mitochondrial function remain subject for future studies.
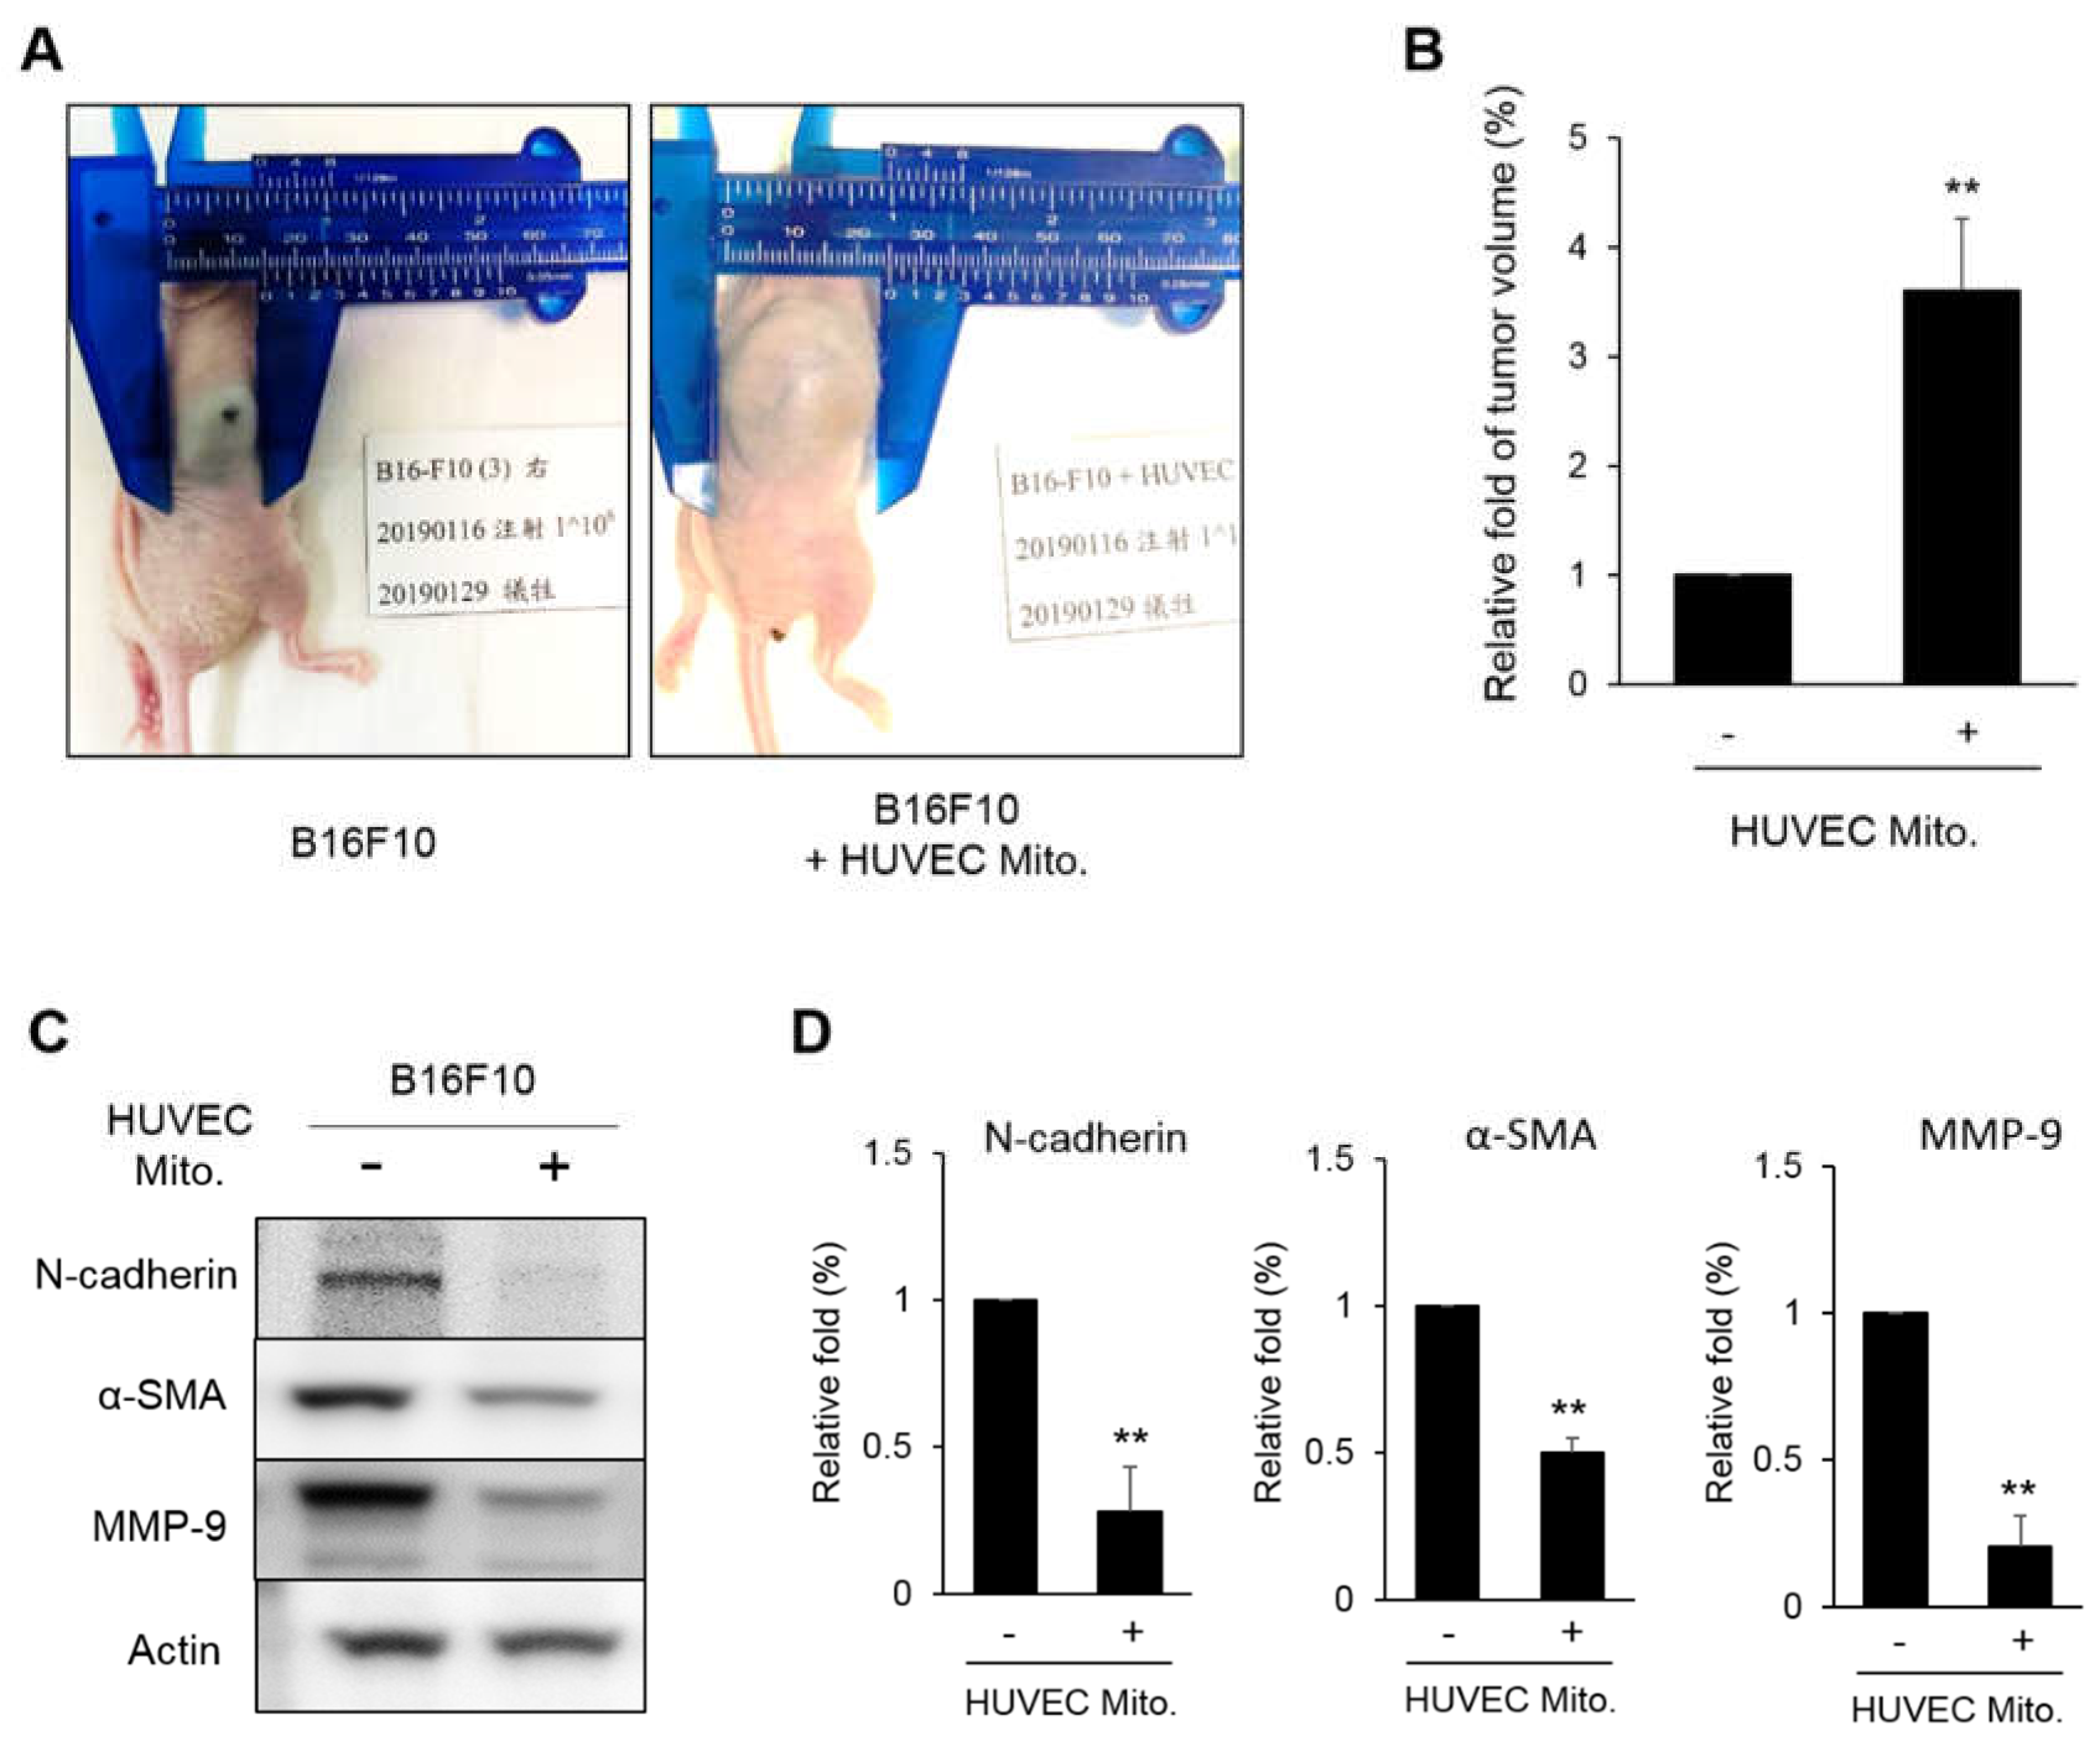
In the xenograft analysis, transplanted the HUVEC mitochondria promoted the growth of tumor (
Figure 6A). This can be explained by that the reduced TGF-β will loss the control to cyclin D1 and E1 so the B16F10 showed a higher cell proliferation. However, the proteins involved in EMT such as N-cadherin, α-SMA and MMP-9 were decreased (
Figure 6C). This implies that HUVEC mitochondria might change the use of cellular energy to the cell proliferation rather than for metastasis. We believe this novel idea should be studied more completely. Fortunately, at least two reported article support this idea. In colon cancer, a reciprocal balance between EMT and MET suggested that a reduced N-cadherin was associated with a higher E-cadherin level so that metastatic mesenchymal cells were decreased [35, 36]. That is the more localized, the lesser metastatic characteristics in tumor. We understand that the balance between EMT and MET is much complicated as we know so far, however, according to the present findings, we suspected that HUVEC mitochondria may not control the proliferation of melanoma, but can reduce the metastasis of melanoma.
Summarizing the present findings, the mitochondrial function and the cell migration of melanoma cells can be reduced by transplanting heterologous mitochondria harvested from primary cultured HUVEC. Although HUVEC mitochondria promoted the proliferation of a tumor, the inhibition of metastatic activity warrants further investigation.
Figure 1.
The basal function of mitochondria between HUVEC and B16F10. (A~D) The MMP, ATP, mitochondrial DNA (mt-DNA) and mitochondrial protein (mt-protein) were measured from 1×10⁶ of B16F10 and the 3rd passages of HUVEC. (E~H) Investigation of the MMP, ATP, mt-DNA and mt-protein in the B16F10 and HUVEC from the different passages. The relative fold change of three repeats was expressed as the mean ± S.E. Statistical differences were presented using Fisher’s LSD for significant difference (p < 0.05).
Figure 2.
The confirmation of HUVEC mitochondria transplanted into B16F10. The MitoTracker-Orange (red color) was applied to stain the endogenous mitochondria in B16F10. The MitoTracker-Green (green color) was used to stain the mitochondria isolated from HUVEC. (A) The B16F10 were transplanted with HUVEC mitochondria and were observed by fluorescent microscope at 0, 0.5 and 1 h. The represented B16F10 with yellow color were indicated by an arrow. The nuclei were revealed by DAPI. Bar = 10 μm. (B) The B16F10 transplanted with HUVEC mitochondria for 1 h were analyzed by flow cytometry. The B16F10 mitochondria were indicated by a shift to red peak and the transplanted HUVEC mitochondria can was observed by a shift to green peak.
Figure 3.
Transplanted HUVEC mitochondria retarded the migration and the invasion of B16F10. (A) In the wound healing assay, the migration of B16F10 after being transplanted with 2.5×10⁶ (0.5× HUVEC Mito.) and 5×10⁶ (1× HUVEC Mito.) for 0, 12 and 24 h were observed by microscopy. (B) In the transwell assay, 5×10⁴ B16F10 cell transplanted with 0.5× or 1× HUVEC mitochondria were seeded on the surface of transwell and then incubated at 37°C for 24 h. The cells were stained by Giemsa stain; bar representing 50 μm. The relative fold changes of the healing rates were calculated from three repeats and were expressed as means ± S.E. Statistical differences were presented using Fisher’s LSD for significant differences (p < 0.05).
Figure 4.
Transplanted HUVEC mitochondria decreased the expressions of malignant proteins in B16F10. (A) The translational levels of NANOG, TGF-β, N-cadherin, GRP78, SOX2, p-SMAD2/3, SMAD2/3, Cyclin D1 and Cyclin E1 in B16F10 that with or without the transplantation of HUVEC mitochondria were detected by western blot. (B) The relative folds of these proteins were statistically calculated from three repeats. The data were expressed as means ± S.E. The statistical differences were presented using Fisher’s LSD for significant differences (p < 0.05).
Figure 5.
Transplanted HUVEC mitochondria reduced the expressions of mitophagic proteins in B16F10. (A, B) The expressions of MFN2, DRP1 and LC3 II in the B16F10 transplanted with HUVE mitochondria were monitored by western blot and were statistically calculated from three repeats. (C~F) After HUVEC mitochondria to get transplanted for 24 h, the variations of MMP, ATP, mt-DNA and mt-protein in B16F10 were further measured for 0, 24 and 48 h. The relative fold of three repeats were expressed as means ± S.E. The statistical differences were presented using Fisher’s LSD for significant differences (p < 0.05).
Figure 6.
Xenograft analysis of melanoma tumor growth. (A, B) 5×10⁶ B16F10 cells transplanted with HUVEC mitochondria were inoculated into mice for 10 days. The tumor size measured from 6 mice were normalized to the control treatment and were statistically calculated. (C, D) The expressions of N-cadherin, α-SMA and MMP-9 in the tumors were analyzed by western blot. The relative fold of six repeats were statistically expressed as the mean ± S.E. The statistical differences were presented using Fisher’s LSD for significant differences (p < 0.05).
