1. Introduction
Tightly focused ultrashort laser pulses (pulsewidth ~ 0.01-10 ps) have been established as powerful tools for fabricating nano- and micro-optical structures and devices within the volume of transparent solid dielectrics in both pre- and filamentation regimes [
1,
2]. Key input parameters for laser writing in dielectric media include wavelength, duration, peak power, intensity, repetition rate, and total exposure of ultra-short pulses, while the optical characteristics of the final structures serve as output parameters of the technological process. Nevertheless, interactions between ultrashort laser pulses and dielectric materials are predominantly nonlinear, particularly in the filamentation regime [
3]. Given the scalability of filament parameters for ultrashort laser pulses, depending on focusing conditions [
4], it can be postulated that, in tightly focused regimes and associated microscale filamentation of ultrashort laser pulses, the defocusing solid-state electron-hole plasma in filaments may approach a near-critical state [
5], thereby strongly reflecting and becoming opaque to laser radiation, ultimately altering the fundamental outcomes of the laser writing process.
As a result, the application of dynamic methods for controlling parameters of ultrashort laser pulse interactions with dielectric media holds significant interest, encompassing measurements of nonlinear transmission [
6], harmonic generation [
7], supercontinuum generation [
8] (self-phase modulation, SPM [
3]), spontaneous [
9], and stimulated Raman scattering [
10], among others. Chirped ultrashort laser pulses, which exhibit temporal interaction dynamics with the material in the spectral representation [
11,
12], further pique interest for dynamic diagnostics. Time-resolved acquisition of the “laser-dielectric medium” interaction parameters is crucial also for the reason of non-linear transient effects – e.g., delayed Raman-Kerr non-linearity [
3], based on the instantaneous optical-phonon induced non-linear lattice polarization and considerably affecting the onset parameters for ultrashort-pulse laser filamentation. Hence, a combination of various complementary experimental capabilities provides direct visualization of key underlying physical processes, enables the construction of a comprehensive picture of the phenomenon and the extraction of valuable information on ultrafast nano- and microscale processes within dielectric volumes under the influence of ultrashort laser pulses in a non-contact mode.
In this investigation, the correlated intrapulse dynamics of self-phase modulation of laser radiation and Raman scattering generated in synthetic diamond were explored, specifically in pre- and filamentation regimes. By utilizing chirped ultrafast laser pulse techniques for the first time in this context, this study aimed to elucidate the dynamic effects of self-phase modulation, electron-phonon and phonon-phonon interactions in the material.
2. Materials and Methods
Transmission spectra were examined for a Type IIa synthetic diamond cube (dimensions - 2×2×2 mm) with six polished opposite facets, employing ultrashort laser pulses at the central 515-nm second harmonic wavelength of a Yb-laser Satsuma (Amplitude systemes, St. Etienne, France), corresponding to the spectral full-width at the half-maximum of 1.3 nm or ≈ 63 cm-1. The ultrashort laser pulses were precisely focused within the crystal volume, using a micro-objective with a numerical aperture NA = 0.25, to yield the focal spot radius at the 1/e-intensity level ≤ 2 μm. The spectral shape was maintained while varying the laser pulse duration through a technique that involved partial positive chirping (incomplete compression of stretched pulses for amplification, radial frequency increasing during the pulse) in the range τ=0.3-12 ps. Pulse durations were determined, using a single-pulse auto-correlator AA-10DD-12PS (Avesta Project Ltd., Moscow, Russia). Ultrashort laser pulse energy was adjusted using a thin-film transmission attenuator (Standa, Vilnius, Lithuania) in the range E=50-800 nJ (estimated peak energy density in linear focusing mode 0.4-7 J/cm2). The transmitted radiation was carefully collected by a fluorite microscope objective (LOMO, St. Petersburg, Russia) with a numerical aperture NA=0.2 and subsequently guided to the entrance slit of a spectrometer ASP-190 (Avesta Project Ltd., Moscow, Russia). Spectra were accumulated over a 10-second duration at the ultrashort laser pulse repetition rate of 10 kHz, and the sample was moved in steps by 50 μm, using a motorized translation stage for micro-positioning (Standa, Vilnius, Lithuania) after each spectrum acquisition.
Peak power and energy of ultrashort laser pulses were identified as critical parameters for filamentation in synthetic diamond samples. The onset of visible asymmetric elongation of glowing filamentation channels towards laser radiation was observed as a function of increasing laser pulse energy (peak power), as previously reported [
13,
14]. This observation suggested the formation of a nonlinear focus beyond the Rayleigh length (linear focus parameter). For linearly polarized ultrashort laser pulses with a wavelength of 515 nm and varying pulse durations, the threshold energy values were discovered to be in the range of ≈210-230 nJ [
15].
3. Results and discussion
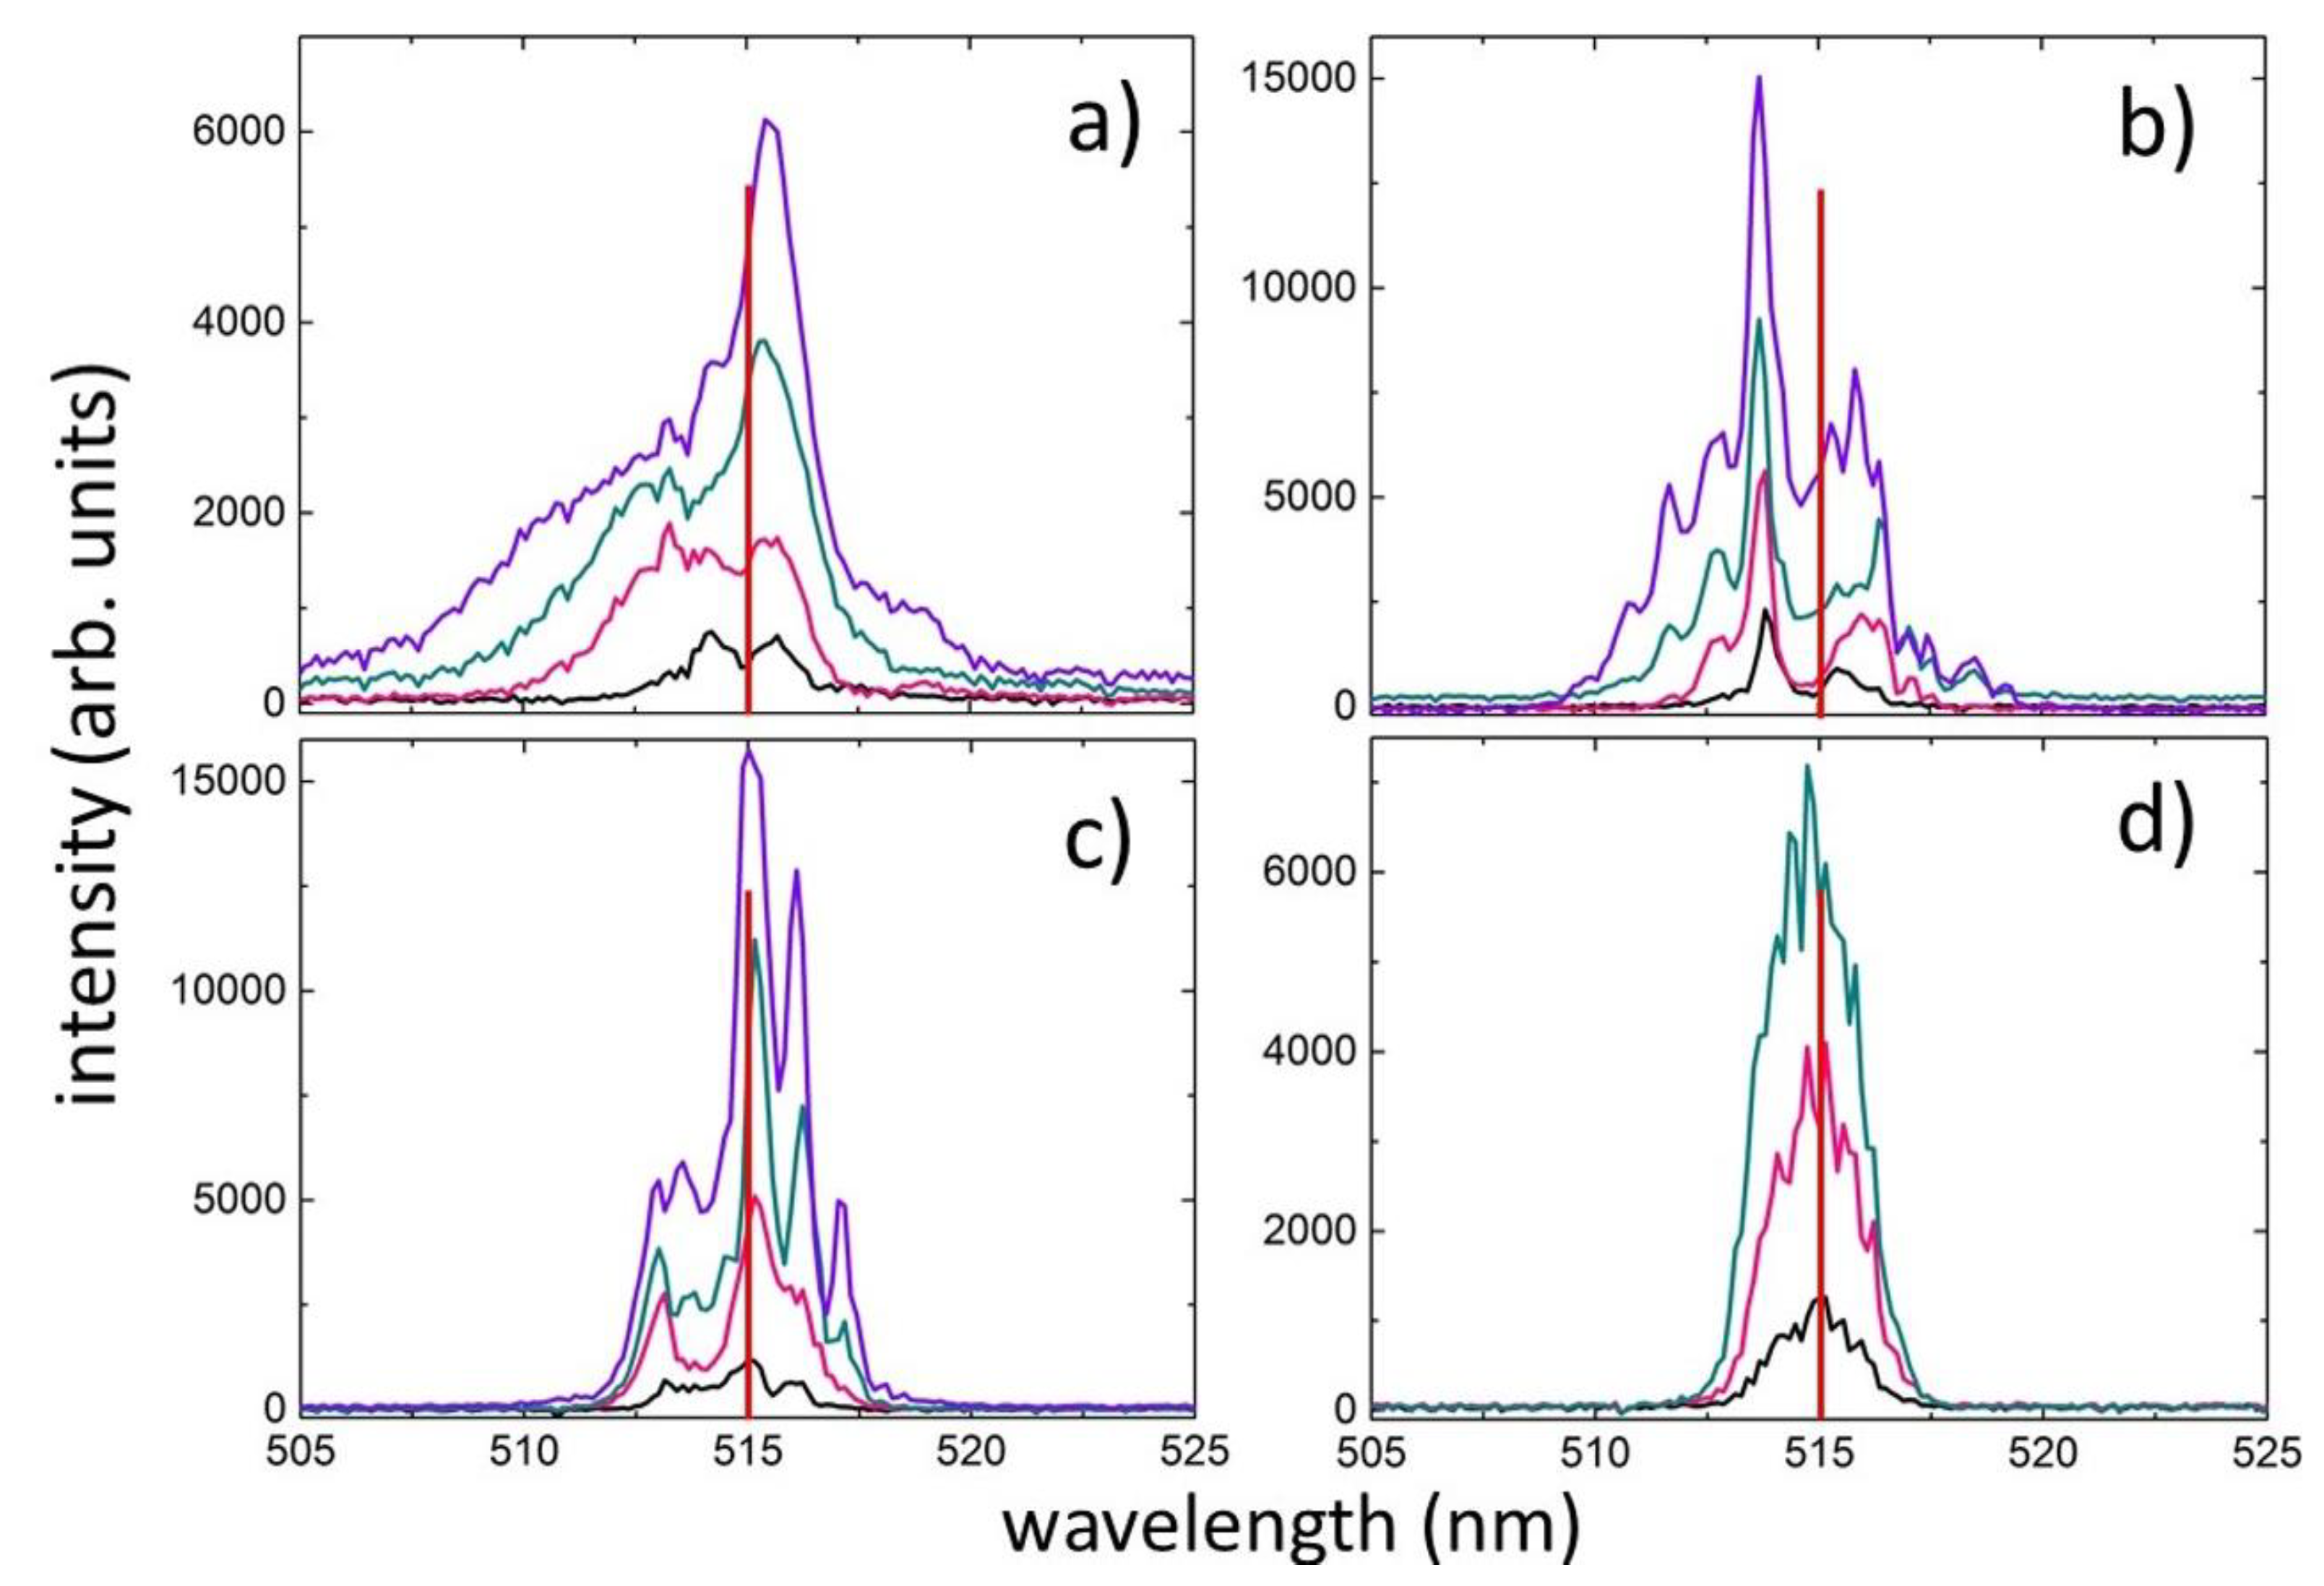
The spectra of transmitted ultrashort laser pulses as a function of pulse duration and energy below and above the threshold for filamentation onset (≥200 nJ [
15]) are shown in
Figure 1a–d. At the minimum duration τ=0.3 ps, ultrashort laser pulse energy increases above the threshold due to nonlinear SPM [
3], the spectrum significantly broadens in the 500-520 nm range (full width at the noise level), more pronounced on the blue wing (
Figure 1a). At a longer duration τ=1.3 ps, SPM-induced broadening of the laser pulse decreases (full width at the noise level) due to reduced peak ultrashort laser pulse intensity, becoming more symmetrical, but more modulated across the spectrum (
Figure 1b). The origins of periodic low-frequency spectral modulation under SPM conditions were discussed in [
16,
17], and other effects can be considered [
5]. Subsequently, at the ultrashort laser pulse duration τ=2.4 ps, the broadening further decreases (511-517 nm), but becomes more pronounced on the red wing (
Figure 1c). Finally, at the maximum duration τ=9.5 ps and lower peak intensity, the ultrashort laser pulse line maintains a Lorentzian-like shape and slightly homogeneously broadens (full width at the noise level - 512-517 nm,
Figure 1d) with minor spectral modulation.
The observed effects demonstrate the change in spectral width with increasing ultrashort laser pulse duration and peak radiation intensity, which is one of the key parameters, along with the electronic component of the nonlinear (Kerr) refractive index, for SPM [
3]. Additionally, the asymmetry of SPM broadening can usually be attributed to both the possibility of plasma shielding on the trailing edge of the ultrashort laser pulse (typically manifested as suppression of the "blue" SPM wing [
18] - not observed in this work) and the manifestation of a "delayed" phonon component of Kerr nonlinearity (Kerr-Raman effect [
3]) on the trailing ("blue") edge of positively chirped ultrashort laser pulses. The latter effect is observed even for ultrashort laser pulses with a duration of 0.3 ps (weak dispersive chirping upon passage through diamond) but reaches saturation for the positively chirped ultrashort laser pulses with τ=1.3 ps, simultaneously weakening the electronic contribution and manifesting stronger on the leading "red" edge of the ultrashort laser pulse. For the ultrashort laser pulses with τ=2.4 ps, due to electron-hole plasma thermalization with the crystal lattice (characteristic time - 1-2 ps [
2]) and weakened electronic contribution, the "delayed" nonlinearity manifests more strongly in SPM on the leading ("red") edge of the ultrashort laser pulse, while on the trailing edge, thermal filling of low-frequency acoustic phonon modes should weaken lattice polarization on Raman-active zone-center optical phonons due to acceleration of their symmetric decay into acoustic phonons [
19,
20]. Finally, for the long, low-intensity ultrashort laser pulses with τ=9.5 ps, the electronic and phonon components of Kerr non-linearity will be equally weakly expressed for heated or even melted material.
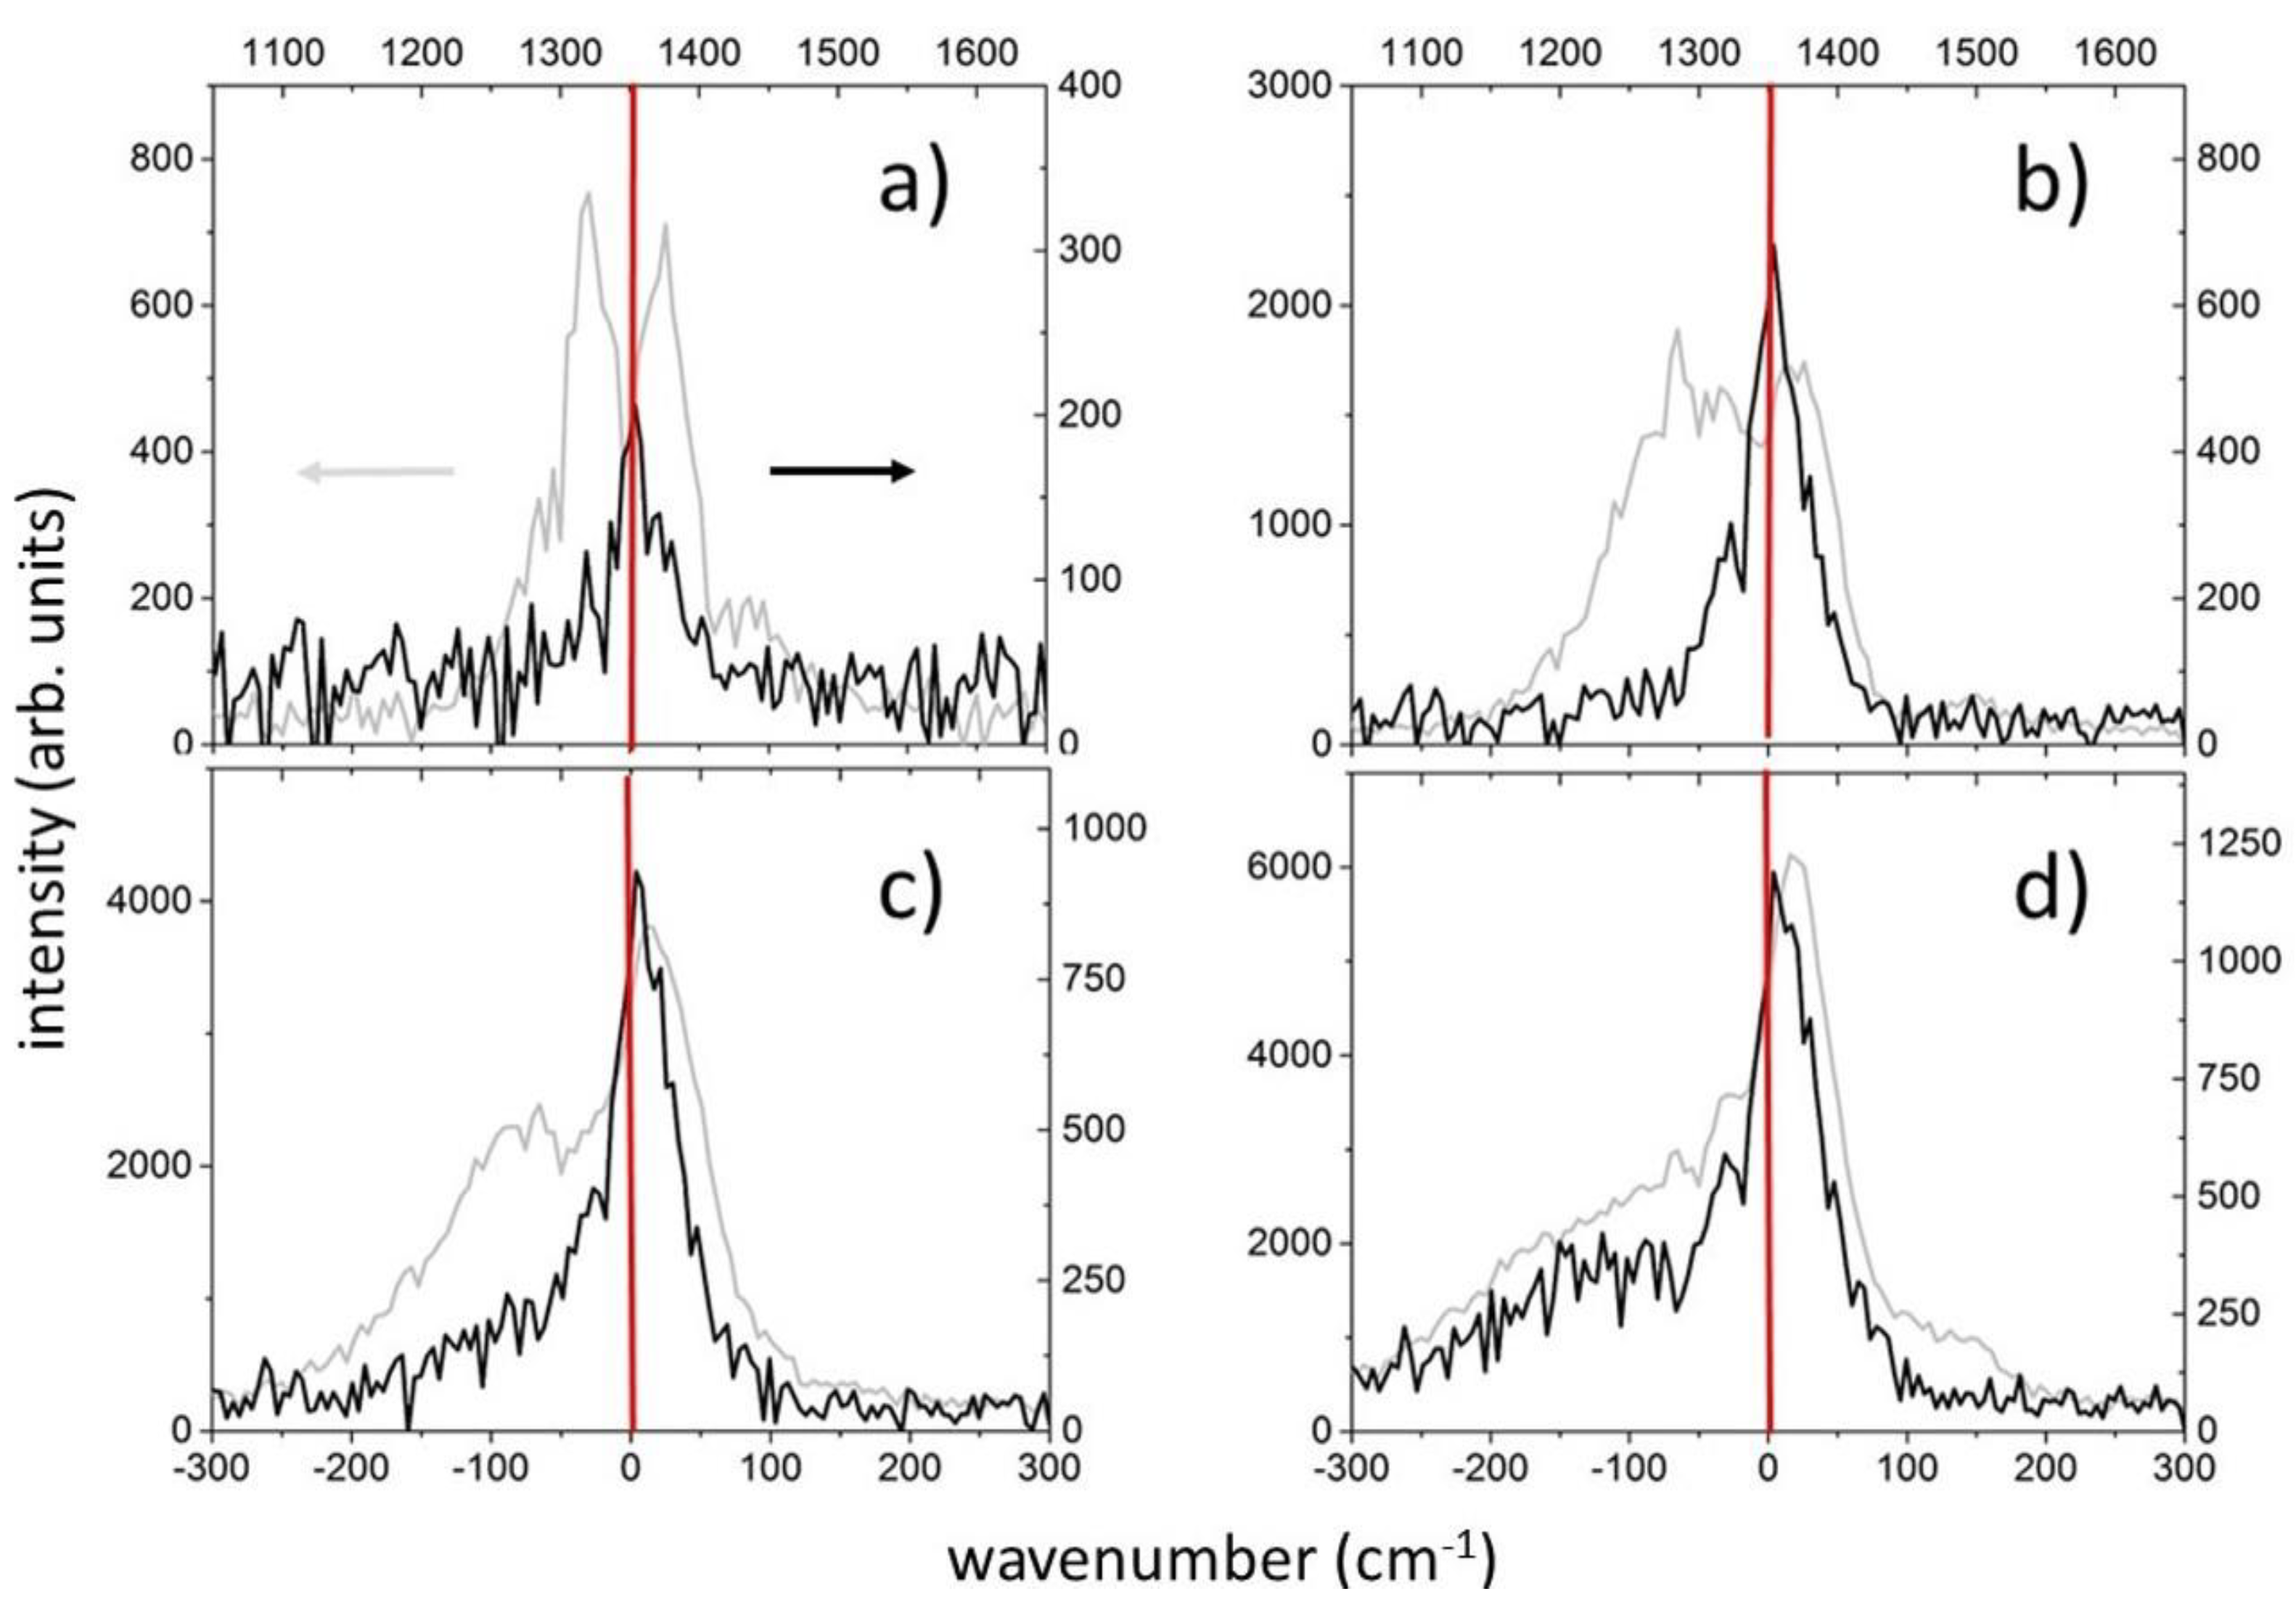
Intriguingly, as ultrashort laser pulses propagate through diamond, the generation of Raman signals of zone-center optical phonons occurs with a wave number of approximately 1340 cm⁻¹ (
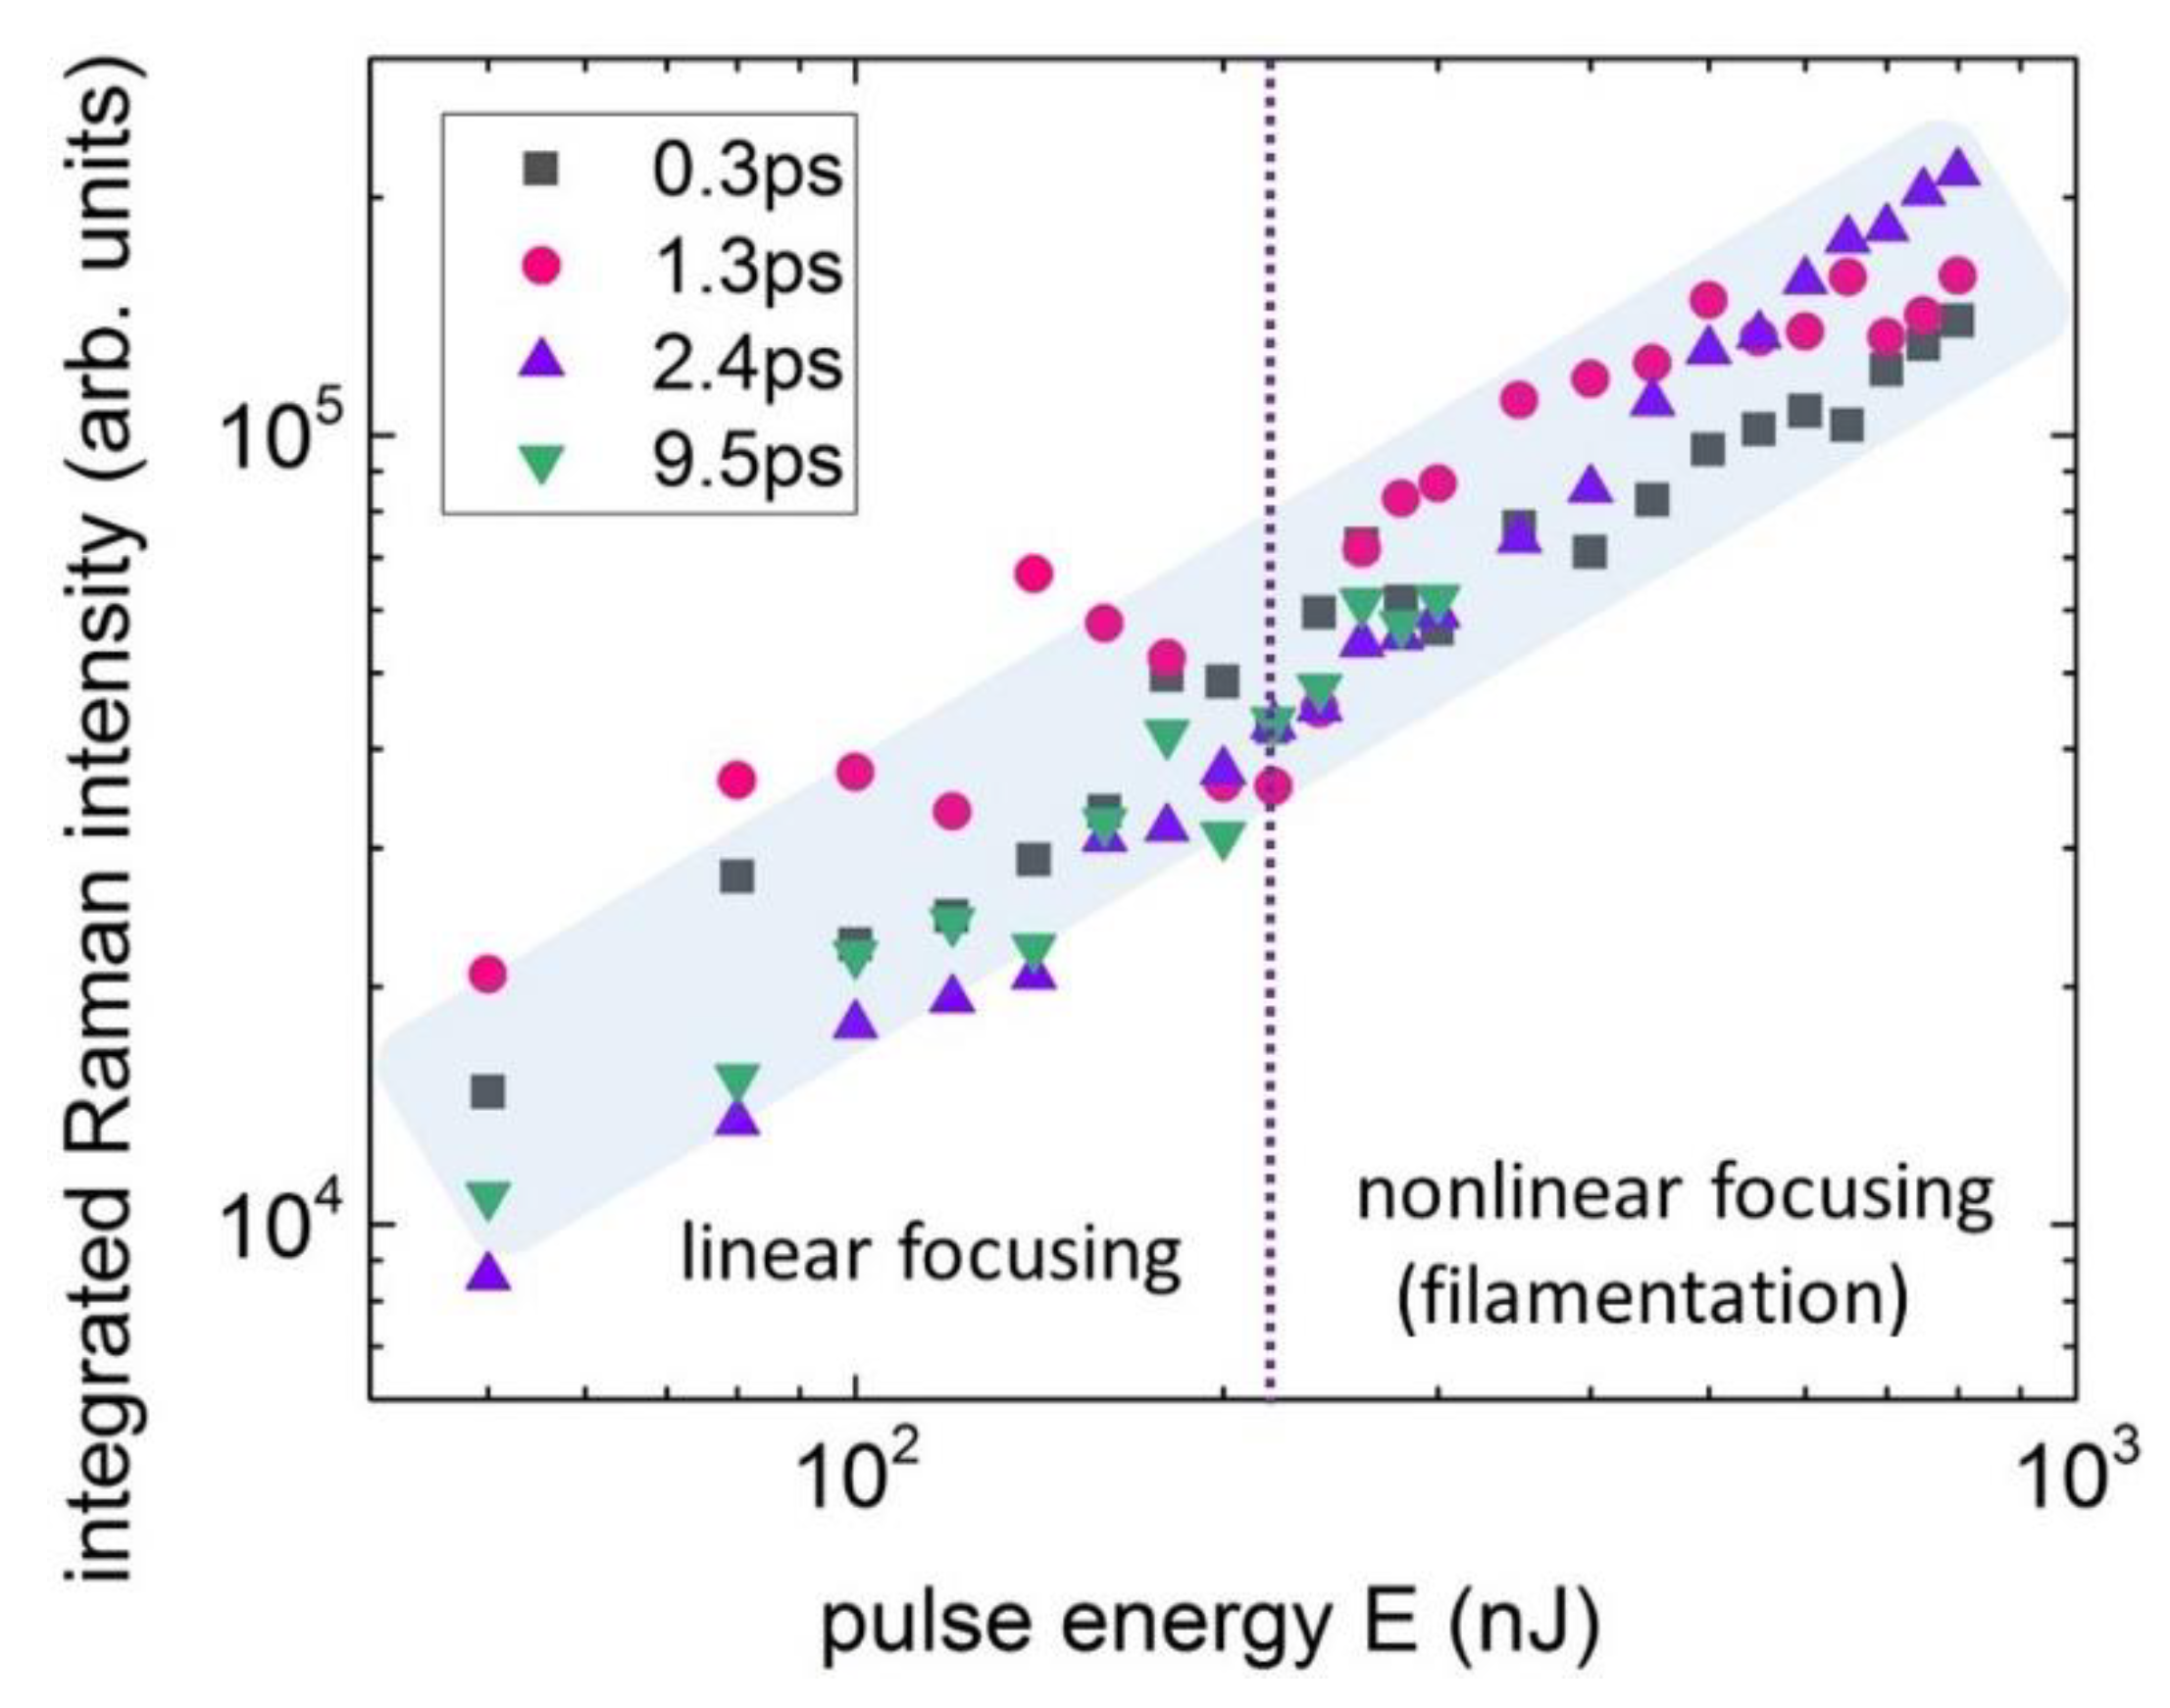
Figure 2a–d). The generation exhibits a spontaneous nature, as evidenced by the near-linear (angular slopes in the range of ≈0.8-1.2) dependence of the integrated intensity of the Raman signal on the pulse energy (
Figure 3). Specifically, at τ=0.3 ps, the intensity of the Raman signal is linear with respect to the energy in the sub-filamentation regime, up to 200 nJ (
Figure 2a,b), where the half-width of the Raman line is approximately equal to 50 cm⁻¹, corresponding to the width of the laser pulse. Moreover, as the energy of ultrashort laser pulses exceeds 200 nJ in the filamentation regime, the increase in the intensity of the Raman signal decelerates, the main peak progressively shifts towards 1360 cm⁻¹, and the width broadens due to the "red" wing following the laser pulse while maintaining the half-width of the main peak (
Figure 2c,d). In this case, the intensity of the Raman signal correlates with the intensity of the laser spectrum predominantly in the "blue" region (on the tail of ultrashort laser pulses in the self-phase modulation regime), while the efficiency of Raman generation in the "red" region is notably lower. Consequently, it is reasonable to presume the manifestation of the "delayed" phonon Kerr nonlinearity at the trailing edge of the ultrashort laser pulses with τ=0.3 ps in the filamentation regime.
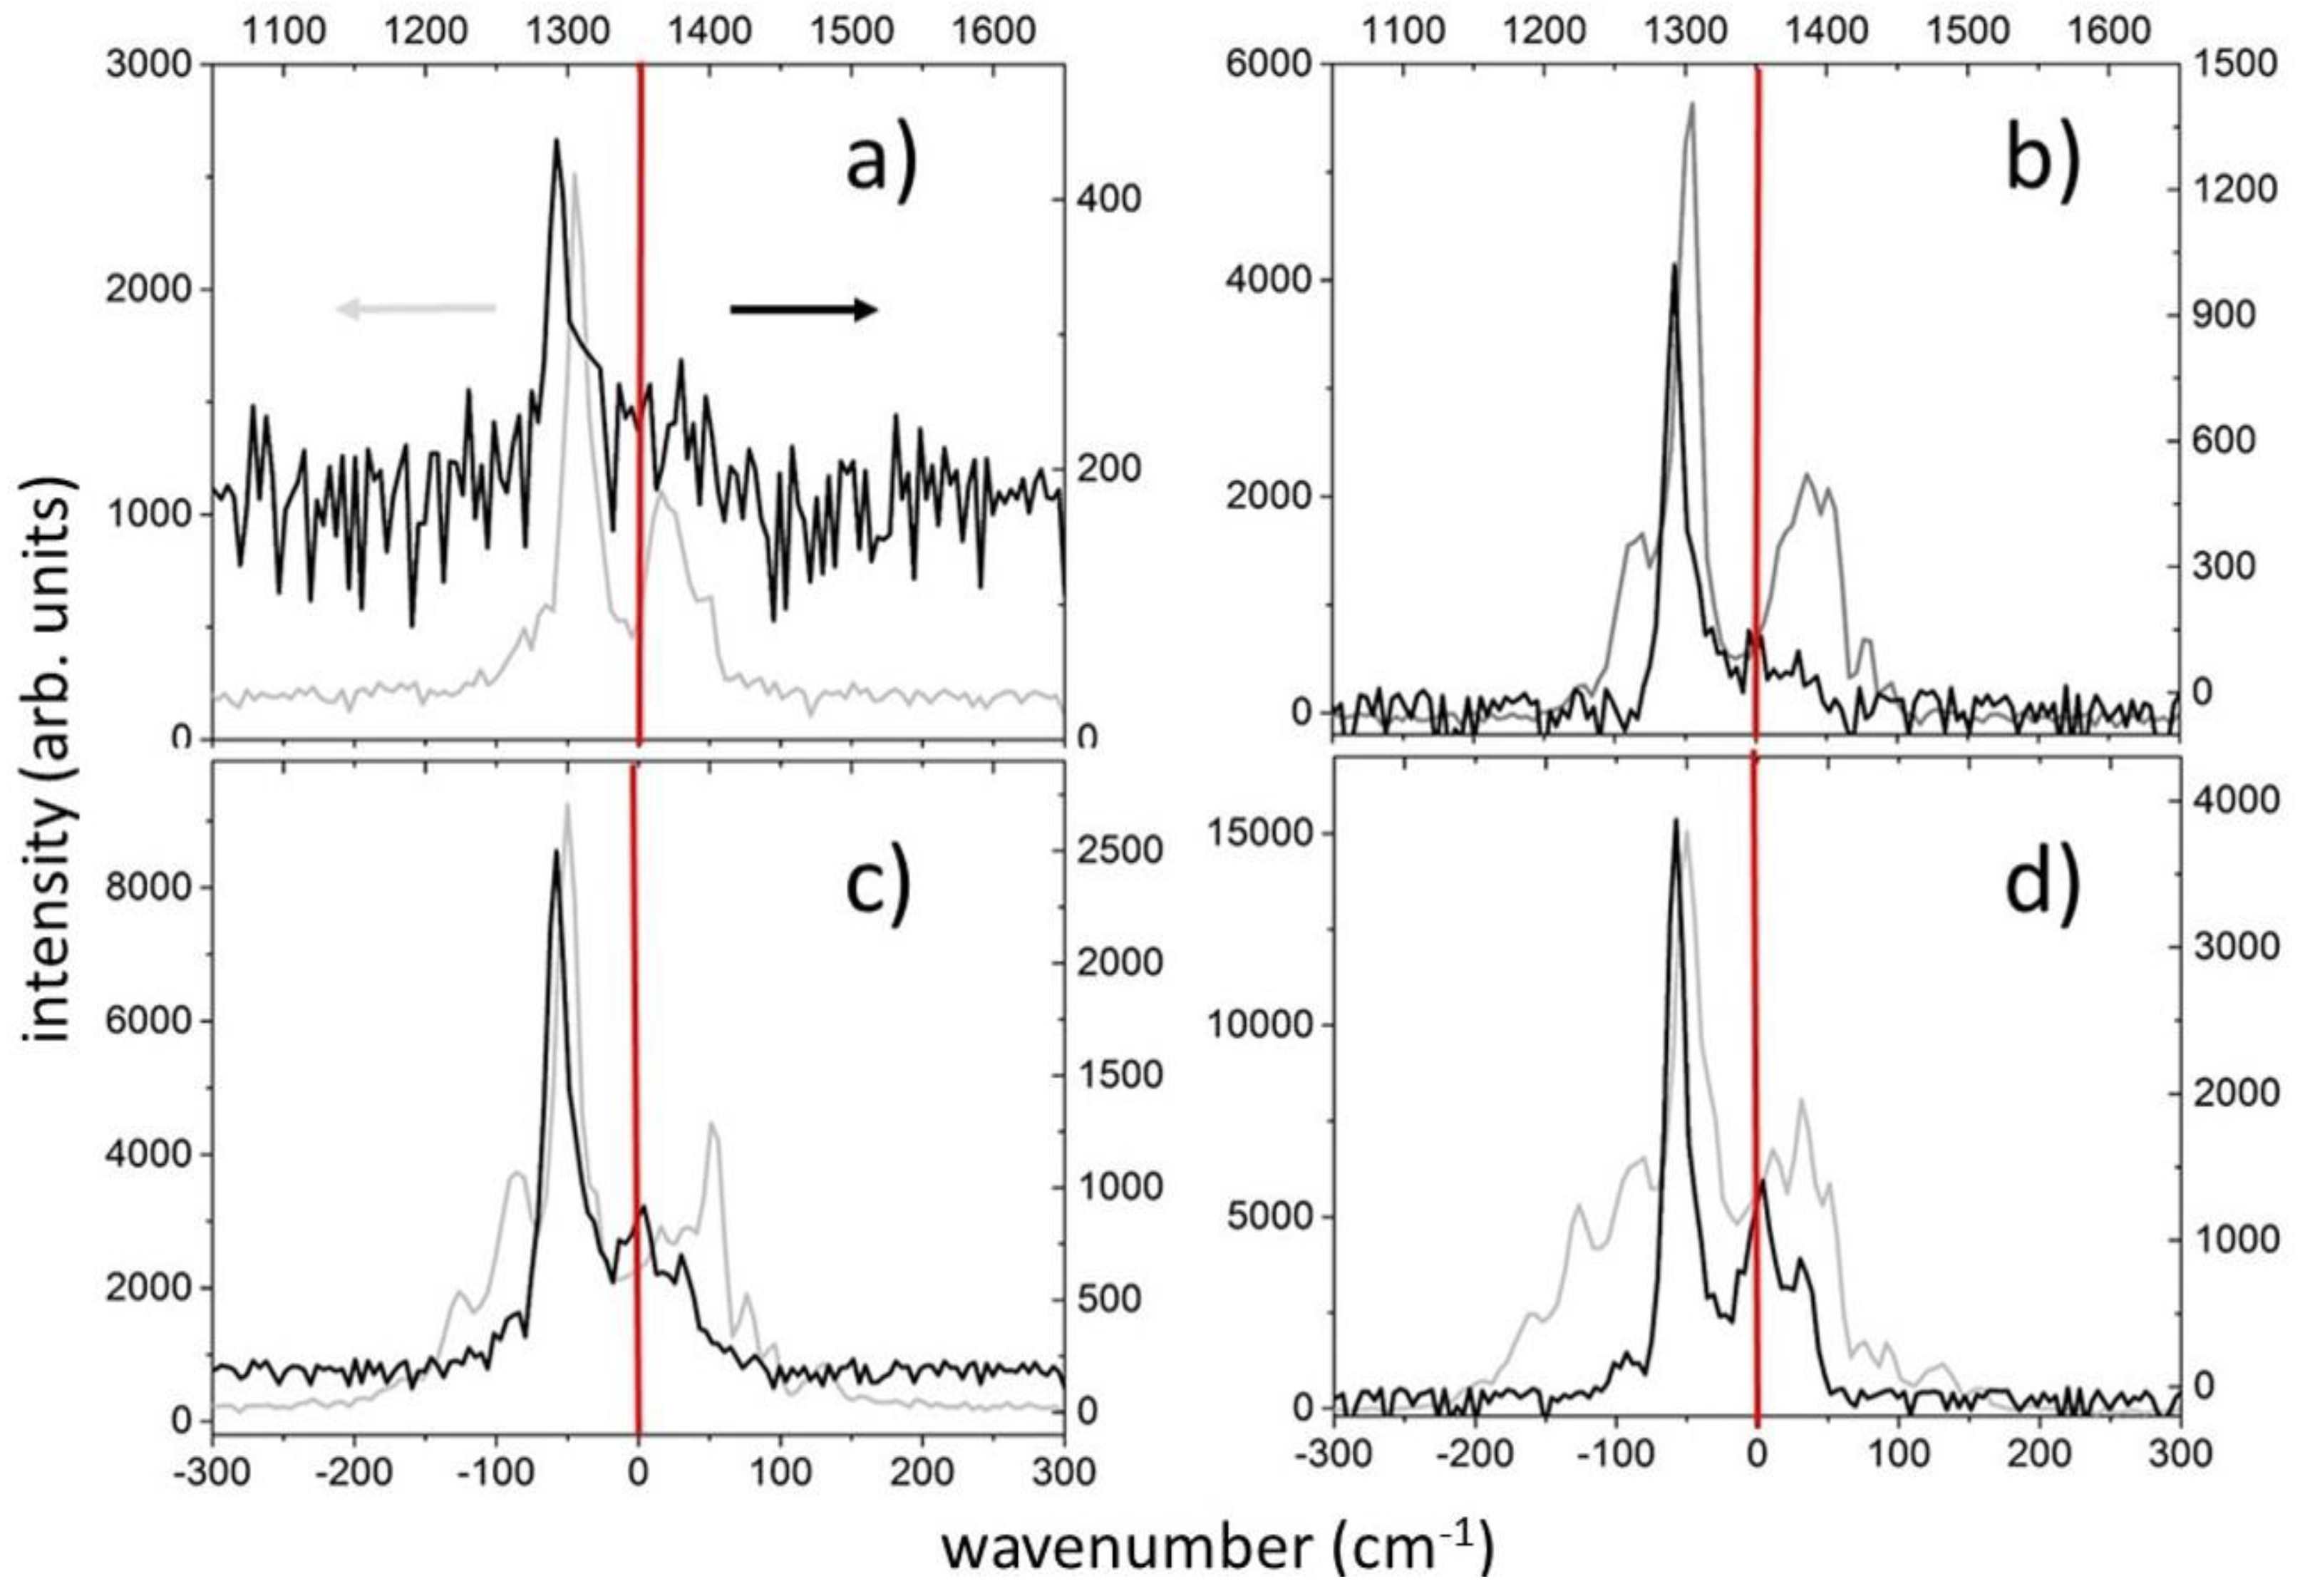
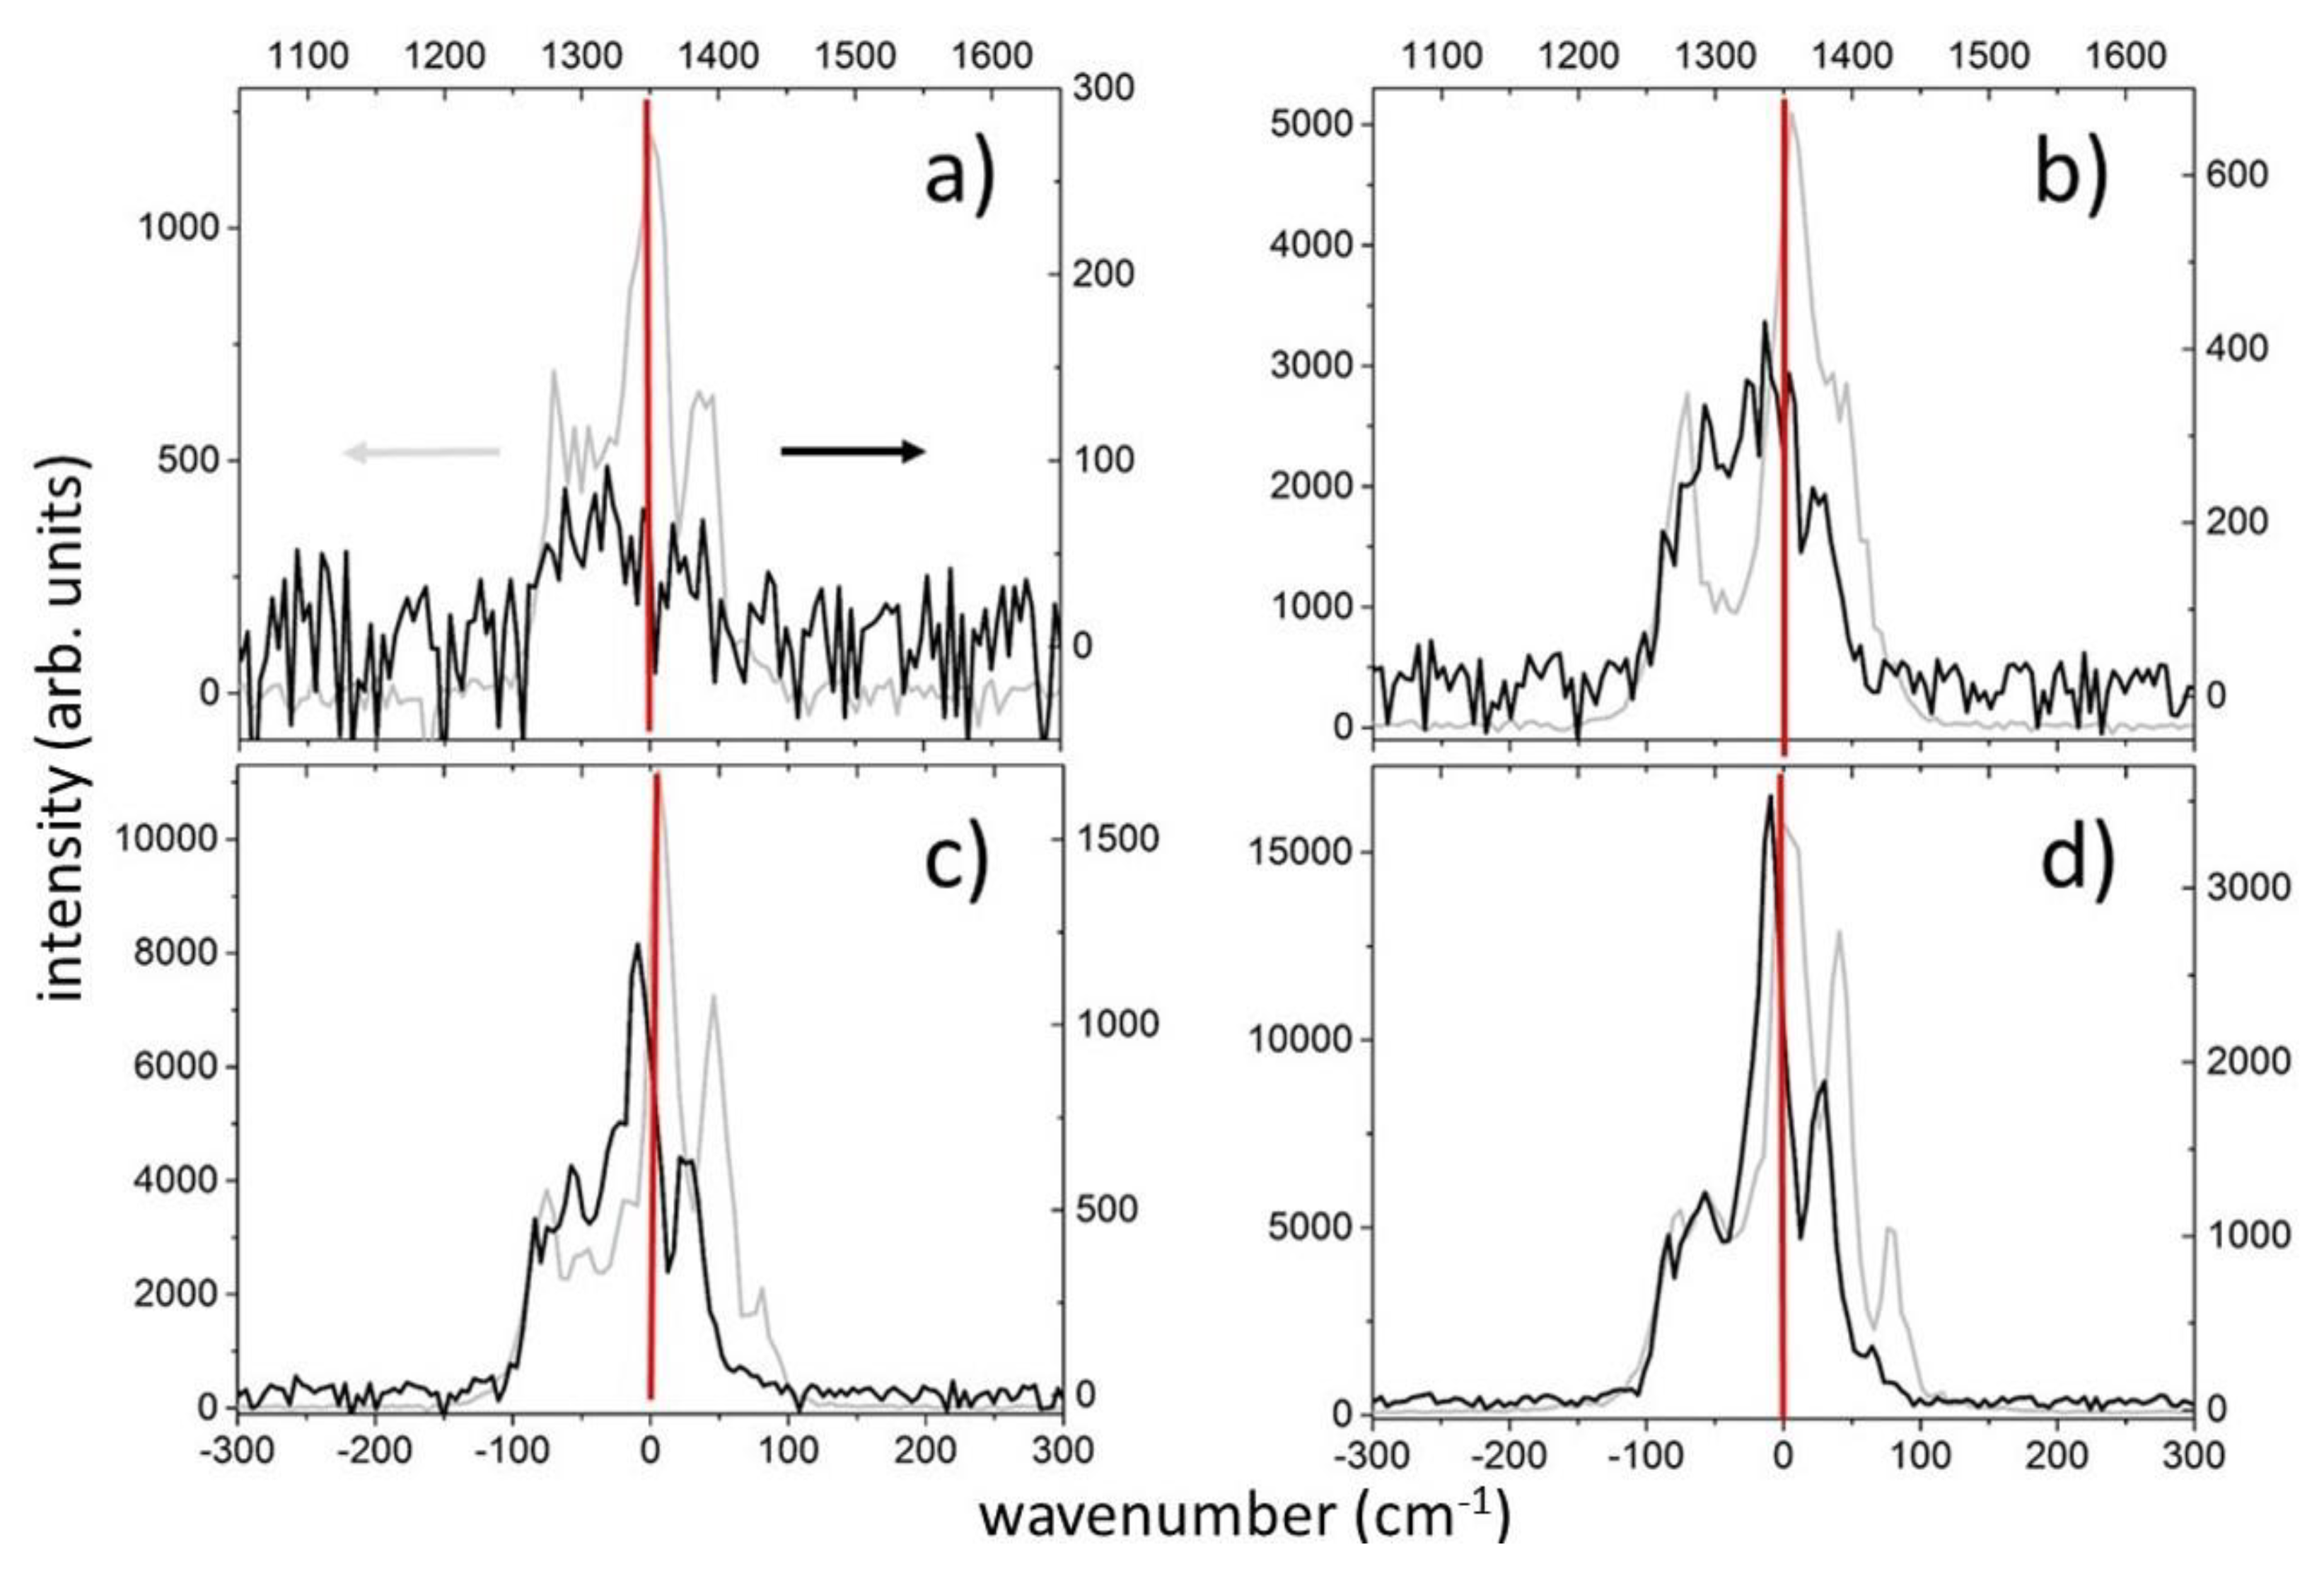
For positively chirped ultrashort laser pulses with the duration τ=1.3 ps, self-phase modulation broadening is more pronounced in the "blue" wing of the laser spectrum, with strong modulation starting at the energy E = 50 nJ (
Figure 4). Effective Raman generation is predominantly realized on the "red" wing, i.e., at the beginning of the chirped ultrashort laser pulses, where it is not yet weakened by thermally accelerated symmetric decay of Raman-active zone-center optical phonons into low-frequency acoustic phonons [
19,
20]. Despite clear filamentation of ultrashort laser pulses manifested as luminescent micro-tracks and pronounced self-phase modulation broadening and modulation of the laser spectrum at energies above 200 nJ, a linear output of the Raman signal is observed in the entire range of E, with a very narrow main peak (≈15 cm⁻¹) shifted to ≈1294 cm⁻¹. However, due to the significant excitation of optical phonons at the beginning of ultrashort laser pulses on (sub)picosecond timescales, the efficiency (integrated intensity) of Raman generation for this pulse duration is 20-30% higher (in the filamentation regime – up to 2 times) than for the shorter pulse with τ=0.3 ps (
Figure 3).
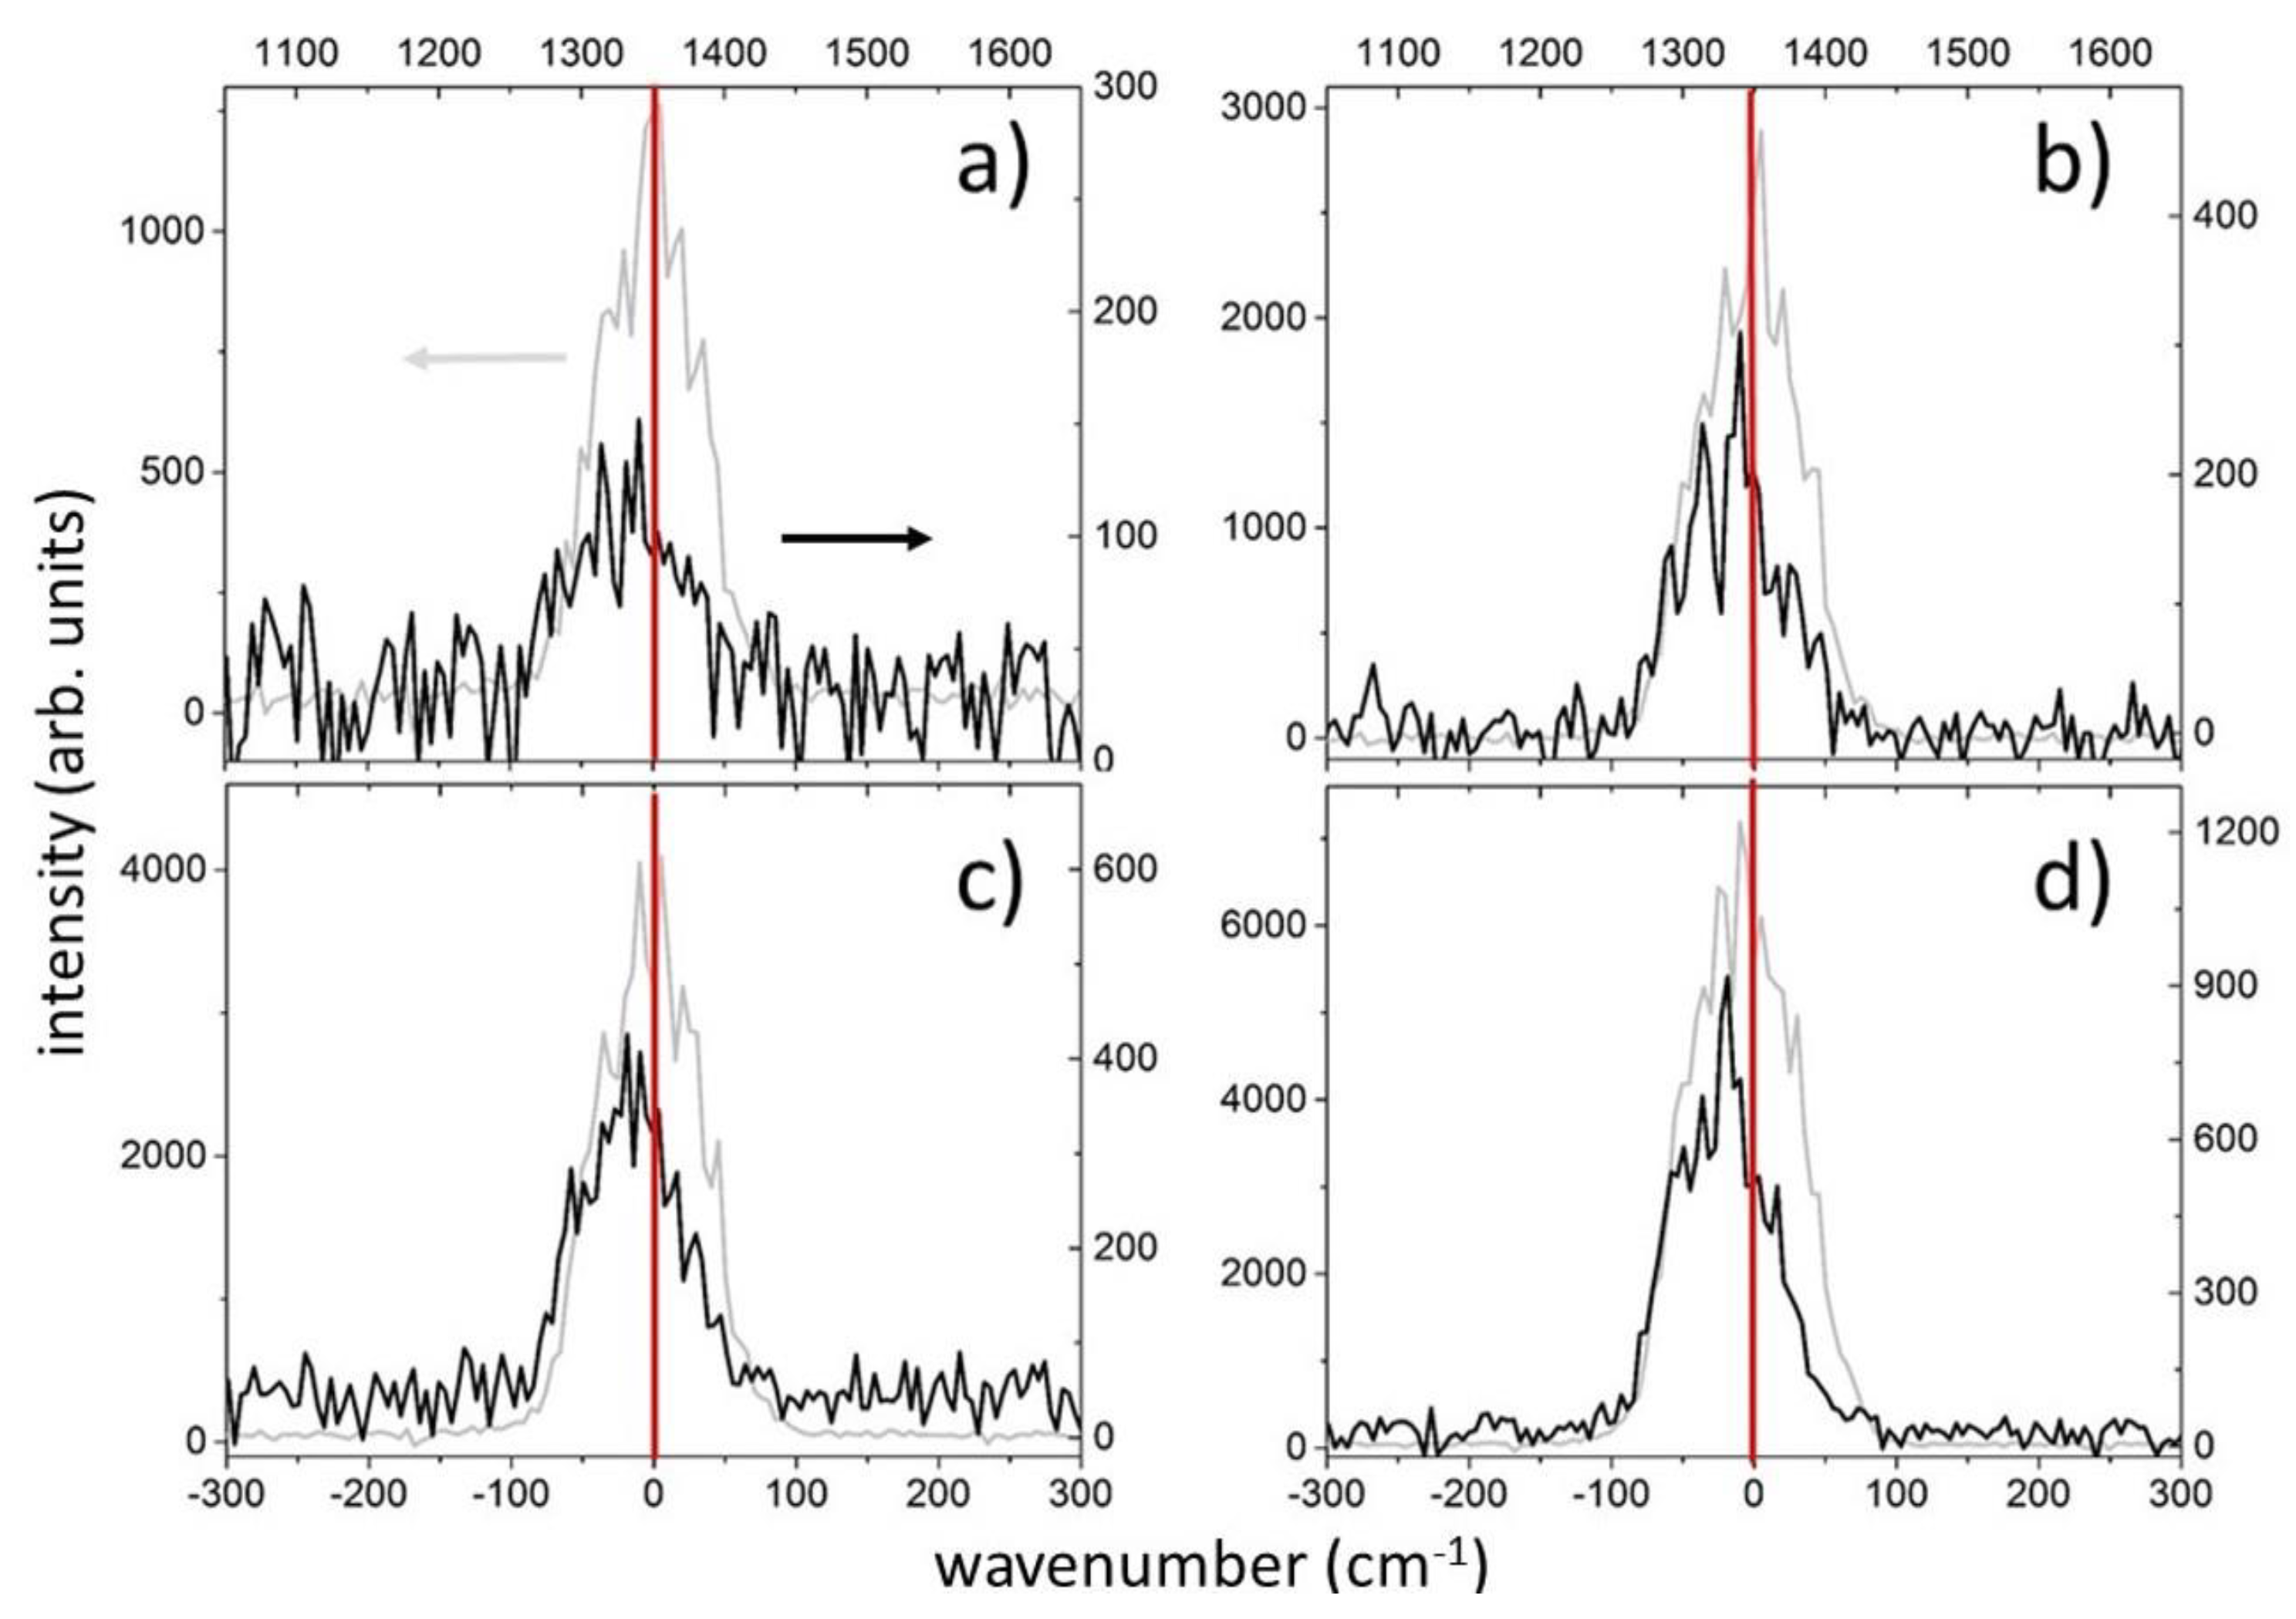
Moreover, for ultrashort laser pulses exhibiting the duration τ=2.4 ps, the Raman signal spectrum adequately replicates the SPM-broadened ultrashort laser pulse spectrum (
Figure 5a–d), considering that the latter is moderately symmetrically broadened and modulated. This can be attributed to both the low intensity of the long ultrashort laser pulses and the thermal suppression of the "delayed" nonlinearity resulting from the symmetrical decay of optical phonons into acoustic modes during a significant portion of the pulse. The centroid of the Raman spectrum lies in the range of 1325-1340 cm⁻¹, the spectrum has a FWHM of the main peak (if present) of ≈25-30 cm⁻¹, and its intensity is practically linearly dependent on the ultrashort laser pulse energy. The efficiency (integral intensity) of Raman generation for this pulse duration is significantly lower than for shorter pulses (
Figure 3), except in the filamentation regime. Thus, Raman signal generation in these conditions illustrates the full thermalization of the material for ultrashort laser pulse durations exceeding the electron-phonon and phonon-phonon thermalization times (in total ≈1-2 ps [
2]), possibly even with its melting at a certain point in the pulse.
In a similar way, both the spectra of the transmitted radiation and the Raman signal spectra for the ultrashort laser pulses with the duration τ=9.5 ps (
Figure 6a–d) exhibit Lorentzian-like and mutually correlating shapes, with the linear dependence of the Raman signal output on the ultrashort laser pulse energy E, reflecting the thermalized state of the material. At the same time, the overall decrease in the efficiency of spontaneous Raman generation (
Figure 3) may suggest significant heating and melting of the material in the focal region of its strong interaction with the ultrashort laser pulses.
Author Contributions
Conceptualization, S.K. and J.C.; methodology, P.D.; software, P.D.; validation, S.K., P.D. and J.C.; formal analysis, S.K.; investigation, P.D.; data curation, J.C.; writing—original draft preparation, S.K.; writing—review and editing, J.C.; visualization, P.D.; supervision, S.K.; project administration, P.D.; funding acquisition, S.K. All authors have read and agreed to the published version of the manuscript.
Figure 1.
Spectra of transmitted radiation from positively chirped ultrashort laser pulses with durations of 0.3 (a), 1.3 (b), 2.4 (c), and 9.5 (d) ps, and pulse energies of 50 (black), 200 (pink), 400 (green, for 9.5 ps – 300 nJ), and 800 (purple) nJ. The vertical red line indicates the central wavelength position of ultrashort laser pulses at 515 nm. The threshold energy for the onset of filamentation is above 200 nJ.
Figure 2.
Comparison of the spectra of transmitted ultrashort laser pulses (gray color, left/bottom axes) and their Raman components (black color, right/top axes) for duration of 0.3 ps and pulse energies of 50 (a), 200 (b), 400 (c), and 800 (d) nJ. The vertical red line indicates the central wavelength position of ultrashort laser pulses - 515 nm.
Figure 3.
Dependence of the spectrally-integrated intensity of Raman signal on ultrashort laser pulse energy for different pulse durations in linear and nonlinear (filamentation) focusing regimes, separated by a dashed vertical line. The colored band demonstrates the general linear nature of the curves, the angular slopes of which vary within the range of 0.8-1.2.
Figure 4.
Comparison of transmitted ultrashort laser pulse spectra (gray color, left/bottom axes) and their Raman components (black color, right/top axes) for pulse duration of 1.3 ps and pulse energies of 50 (a), 200 (b), 400 (c), and 800 (d) nJ. The vertical red line indicates the position of the central wavelength of the USP - 515 nm.
Figure 5.
Comparison of transmitted ultrashort laser pulse spectra (gray color, left/bottom axes) and their Raman components (black color, right/top axes) for pulse duration of 2.4 ps and pulse energies of 50 (a), 200 (b), 400 (c), and 800 (d) nJ. The vertical red line indicates the position of the central wavelength of the ultrashort laser pulse - 515 nm.
Figure 6.
Comparison of transmitted ultrashort laser pulse spectra (gray color, left/bottom axes) and their Raman components (black color, right/top axes) for pulse duration of 9.5 ps and pulse energies of 50 (a), 100 (b), 200 (c), and 300 (d) nJ. The vertical red line indicates the position of the central wavelength of the ultrashort laser pulse - 515 nm.
