1. Introduction
Metachromatic leukodystrophy (MLD) is an autosomal recessive hereditary neurodegenerative disease that belongs to the group of lysosomal storage diseases (LSD). It is characterized by damage to the myelin sheath, which covers most of the nerve fibers in the central (CNS) and peripheral nervous system (PNS). MLD is caused by a deficiency in the lysosomal enzyme arylsulfatase A (ARSA) (OMIM: 250100) or the saposin B activator protein (SapB) (OMIM: 249900). Clinically, the disease manifests as progressive motor and cognitive impairment [
1]. MLD is one of the most common leukodystrophies, with an incidence rate of 1:40,000. However, in some isolated populations, the incidence rate can be much higher, such as 1:75 among Habbani Jews and 1:2500 among the Navajo Indians [
2].
The term MLD refers to the presence of metachromatic granules in affected cells, which form due to the accumulation of sulfatides and sphingolipids found in myelin. In MLD, sulfatides build up in oligodendrocytes, microglia, CNS neurons, Schwann cells, PNS macrophages, and cells in various internal organs [
3,
4,
5,
6,
7,
8,
9].
Demyelination in MLD results in impaired motor function, spastic tetraparesis, ataxia, convulsions, optic nerve atrophy, and cognitive impairment [
10,
11]. The exact mechanisms of demyelination remain unknown, but it is believed that increased levels of sulfatides and decreased levels of their cleavage products cause instability in the myelin sheath, ultimately leading to demyelination [
12]. Furthermore, the accumulation of sulfatides on the endoplasmic reticulum (ER) membrane triggers calcium release into the cytoplasm, causing changes in calcium homeostasis that lead to cellular stress and apoptosis [
8].
Accumulation of sulfatides leads to neuronal degeneration, astrocyte dysfunction, and triggers an inflammatory response in MLD patients. Both plasma and cerebrospinal fluid (CSF) show elevated levels of monocyte chemoattractant protein 1 (MCP-1), interleukin 1 receptor antagonist (IL-1Ra), IL-8, macrophage inflammatory protein 1β (MIP-1β), and vascular endothelial growth factor (VEGF) [
13]. In MLD, there may not be a correlation between demyelination and the presence of metachromatic material. Consequently, complement activation via an alternative pathway exacerbates myelin damage in MLD by inducing or enhancing an anti-myelin immune response [
14]. Sulfatide accumulation and demyelination in the PNS can prompt the release of inflammatory cytokines, activate endoneurial macrophages, and recruit inflammatory myeloid cells and lymphocytes from the periphery. These processes contribute to apoptosis and can lead to the progression of demyelination and neuroinflammation, which are also observed in some other metabolic and neurodegenerative diseases [
15].
A residual enzymatic activity of 10-15% can be sufficient for sulfatide degradation and maintenance of normal life in ARSA deficiency [
16]. There is a pseudo-deficiency of ARSA, where the enzyme has low enzymatic activity (about 5-20%), but no disease phenotype is observed, as the residual activity is sufficient to catabolize its natural substrate [
17]. In some instances, a shortened protein can be synthesized without a change in activity [
18].
Based on residual enzymatic activity levels, MLD presents in various forms that differ in age of clinical manifestation and rate of disease progression: infantile (late infantile, from 0 to 4 years) [
19,
20], juvenile (from 4 to 15 years old) [
21,
22,
23], and adult form (over 15 years old) [
21,
24,
25,
26]. The late infantile form is the most common, occurring in 50-60% of all patients, while 20-30% are diagnosed with the juvenile form, and the adult form is the rarest, affecting about 15-20% of MLD patients [
1].
Currently, there is no effective treatment for MLD. Clinical cases involving bone marrow transplantation (BMT), hematopoietic stem cells (HSC), or umbilical cord blood transplantation have been reported, but the therapeutic efficacy of these approaches remains insufficient to prevent the worsening of neurological symptoms in patients [
27,
28]. Promising results have been achieved using gene therapy methods to deliver the wild-type ARSA gene within vectors based on various adeno-associated virus serotypes (AAV) [
29,
30], as well as using mesenchymal stem cells [
31,
32] and combined gene-cell therapy [
33].
A primary challenge in treating diseases affecting the nervous system is the poor permeability of the blood-brain barrier (BBB), which limits drug access to the nervous system when administered systemically and consequently reduces the effectiveness of many therapeutic approaches [
34,
35]. Moreover, successful distribution of therapeutic drugs throughout the nervous system, including the PNS, is crucial for preventing the progression of MLD.
AAVs are promising vectors for ARSA delivery into neurons. AAVs can trans-synaptically transduce neurons over a wide range from the injection site through anterograde transport [
36]. However, some studies have reported that anterograde transport down the axon is limited to specific serotypes, such as AAV5 [
37], but not in AAV1, AAV2, AAV6, AAV8, or AAV9, while other studies have demonstrated anterograde transport of AAV1, AAV2, and AAV6 [
36].
AAV5-ARSA administration into the brains of MLD mice resulted in prolonged expression of the ARSA gene (3-15 months), facilitating an almost complete disappearance of pathological changes in the brain and preventing sulfatide accumulation [
38]. Promising results have also been obtained using AAV9 encoding ARSA and the green fluorescent protein reporter gene. Injecting the viral vector into the jugular veins of newborn MLD mice led to prolonged expression of the ARSA gene (up to 15 weeks), primarily in muscle and heart cells, with moderate expression also found in CNS cells. In treated mice, sulfatide accumulation was significantly reduced in the brain and spinal cord, and their levels showed no difference compared to wild-type mice [
30].
Among new adeno-associated virus serotypes, AAVrh.10, isolated from non-human primates, migrated more efficiently from the intracerebral site compared to AAV1, AAV2, AAV5, AAV7, or AAV8 [
39,
40]. Injection of AAVrh.10-ARSA into the brains of 8-month-old MLD mice corrected the accumulation of certain sulfatides in oligodendrocytes, as this AAV serotype can apparently infect oligodendrocytes (up to 9%) [
40]. In a phase I/II clinical trial investigating this virus (NCT01801709), four children with pre-symptomatic or very early symptomatic stages received 12 injections of 1 x 10
12 or 4 x 10
12 (depending on age) AAVrh.10-ARSA transducing units into the brain’s white matter. ARSA activity in the CSF, which had been undetectable before treatment, was reported to reach 20-70% of control values after injections. However, symptoms in early-stage patients continued to worsen, and asymptomatic patients developed MLD not significantly different from the natural course of the disease [
29].
AAV-PHP.eB has been recently described as a highly efficient serotype for crossing the BBB following intravenous delivery, providing efficient transduction of the brain and spinal cord in GFAP-Cre mouse models expressing Cre under the control of the mouse GFAP promoter and C57Bl/6J mice [
41,
42]. A single intravenous administration of AAVPHP.eB-hARSA-HA into an MLD mouse model resulted in stable expression of the ARSA enzyme in the brain and spinal cord of experimental animals. Audouard et al. demonstrated a complete correction of sulfatide accumulation in the spinal cord of model animals [
43], which was not observed when AAVrh10-ARSA was injected into the brain [
40].
MLD is characterized by various clinical manifestations, and effective disease modeling is critical for studying its genetic basis, progression, diagnosis, and therapy [
1]. However, there are no large animal models currently available to study MLD. Each model has its own advantages and limitations. Pigs possess several distinct advantages that make them suitable for research as an animal model. They have a large size, enabling easy puncture procedures, as well as highly developed CNS and PNS, in addition to sharing important anatomical and physiological similarities with the human body.
Consequently, MLD gene therapy faces several challenges; addressing these would significantly increase its effectiveness. Further optimization of the administered AAV dose is crucial, along with the selection of the most effective serotype and route of administration for ARSA delivery into the CNS. In this study, a comparative analysis was conducted to assess the safety and efficacy of gene therapy using AAV9-ARSA when administered intravenously or intrathecally into minipigs.
3. Discussion
Metachromatic leukodystrophy (MLD) is a group of hereditary monogenic diseases characterized by lysosomal dysfunctions resulting from the accumulation of uncleaved substrate. Currently, gene and gene-cell therapy are considered promising approaches for the treatment of MLD. Gene-cell therapy utilizes genetically modified cells transduced with retro- and lentiviruses [
44,
45]. Clinical studies (NCT01560182) have shown that transplantation of CD34+ hematopoietic stem cells (HSCs) with ARSA overexpression to patients with pre-symptomatic or very early symptomatic MLD resulted in remyelination and normalization of motor activity. However, one of the nine patients who already had symptoms of the disease at the time of transplantation did not experience an improvement in motor activity [
33]. Despite these promising results, there are still a number of challenges, including long-term monitoring of efficacy and safety in patients, as retro- and lentivirus-based drugs are at risk of insertional mutagenesis [
46]. Genetically modified HSCs are also known to have a therapeutic effect using cross-correction mechanisms [
47].
Gene therapy shows great promise for treating LSD. ARSA encoding different AAV serotypes can be a potential therapy for MLD as AAVs can transduce neurons in a wide range from the injection site through anterograde neuronal transport [
48]. AAVs have several attractive features as vectors, such as low immunogenicity compared to other vectors, broad tropism, and the ability to transduce neurons over a wide range from the injection site. AAV can be easily constructed as a gene delivery vector by replacing the viral genome with the therapeutic cassette. Different AAV serotypes have different tropisms for different tissues. Among all the identified and characterized serotypes, AAV9 has the highest tropism for CNS and can cross the BBB [
49,
50].
AAV9 efficacy has been demonstrated in various preclinical models for CNS disorders, and in some clinical studies [
51]. Intrathecal administration of AAV9 ensures transgenes distribution throughout the nervous system. When administered intravenously, AAV9 can cross the BBB and enter the CNS [
52]. The effectiveness of intravenous administration of rAAV9 has been shown in a mouse model [
53]. In our study, intravenous and intrathecal administration of recombinant AAV9, containing a unique codon-optimized sequence of the human ARSA gene, were compared and analyzed for their efficacy and safety in minipigs.
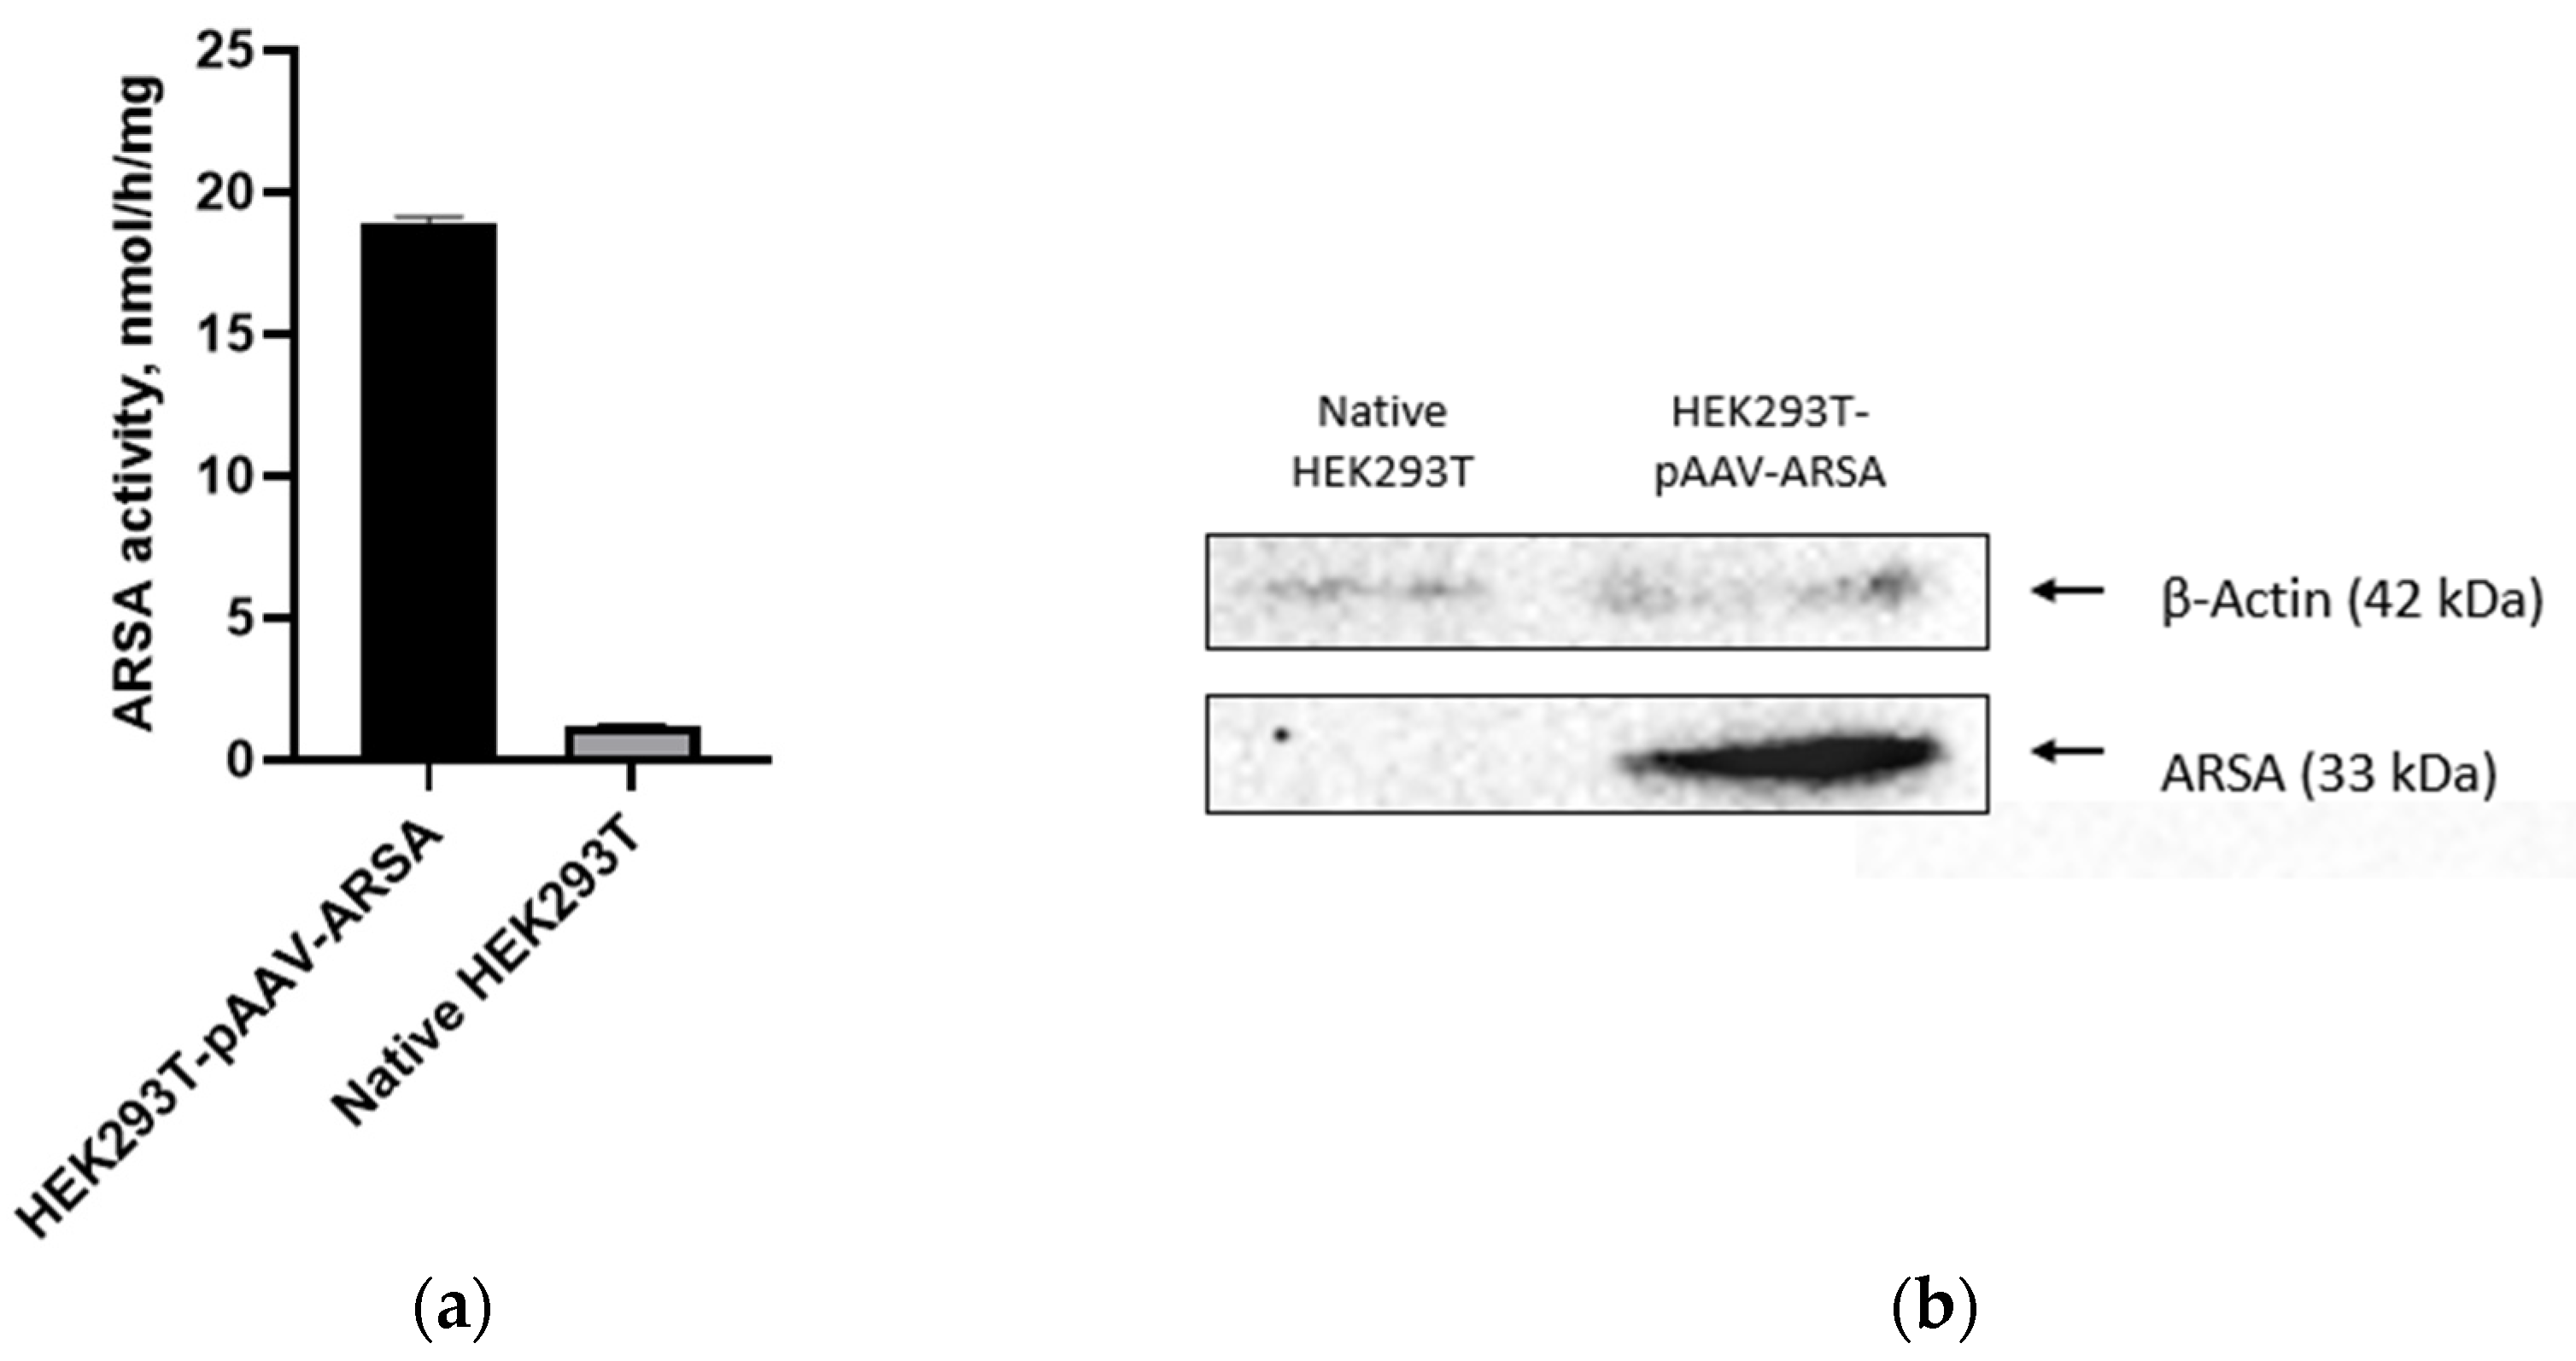
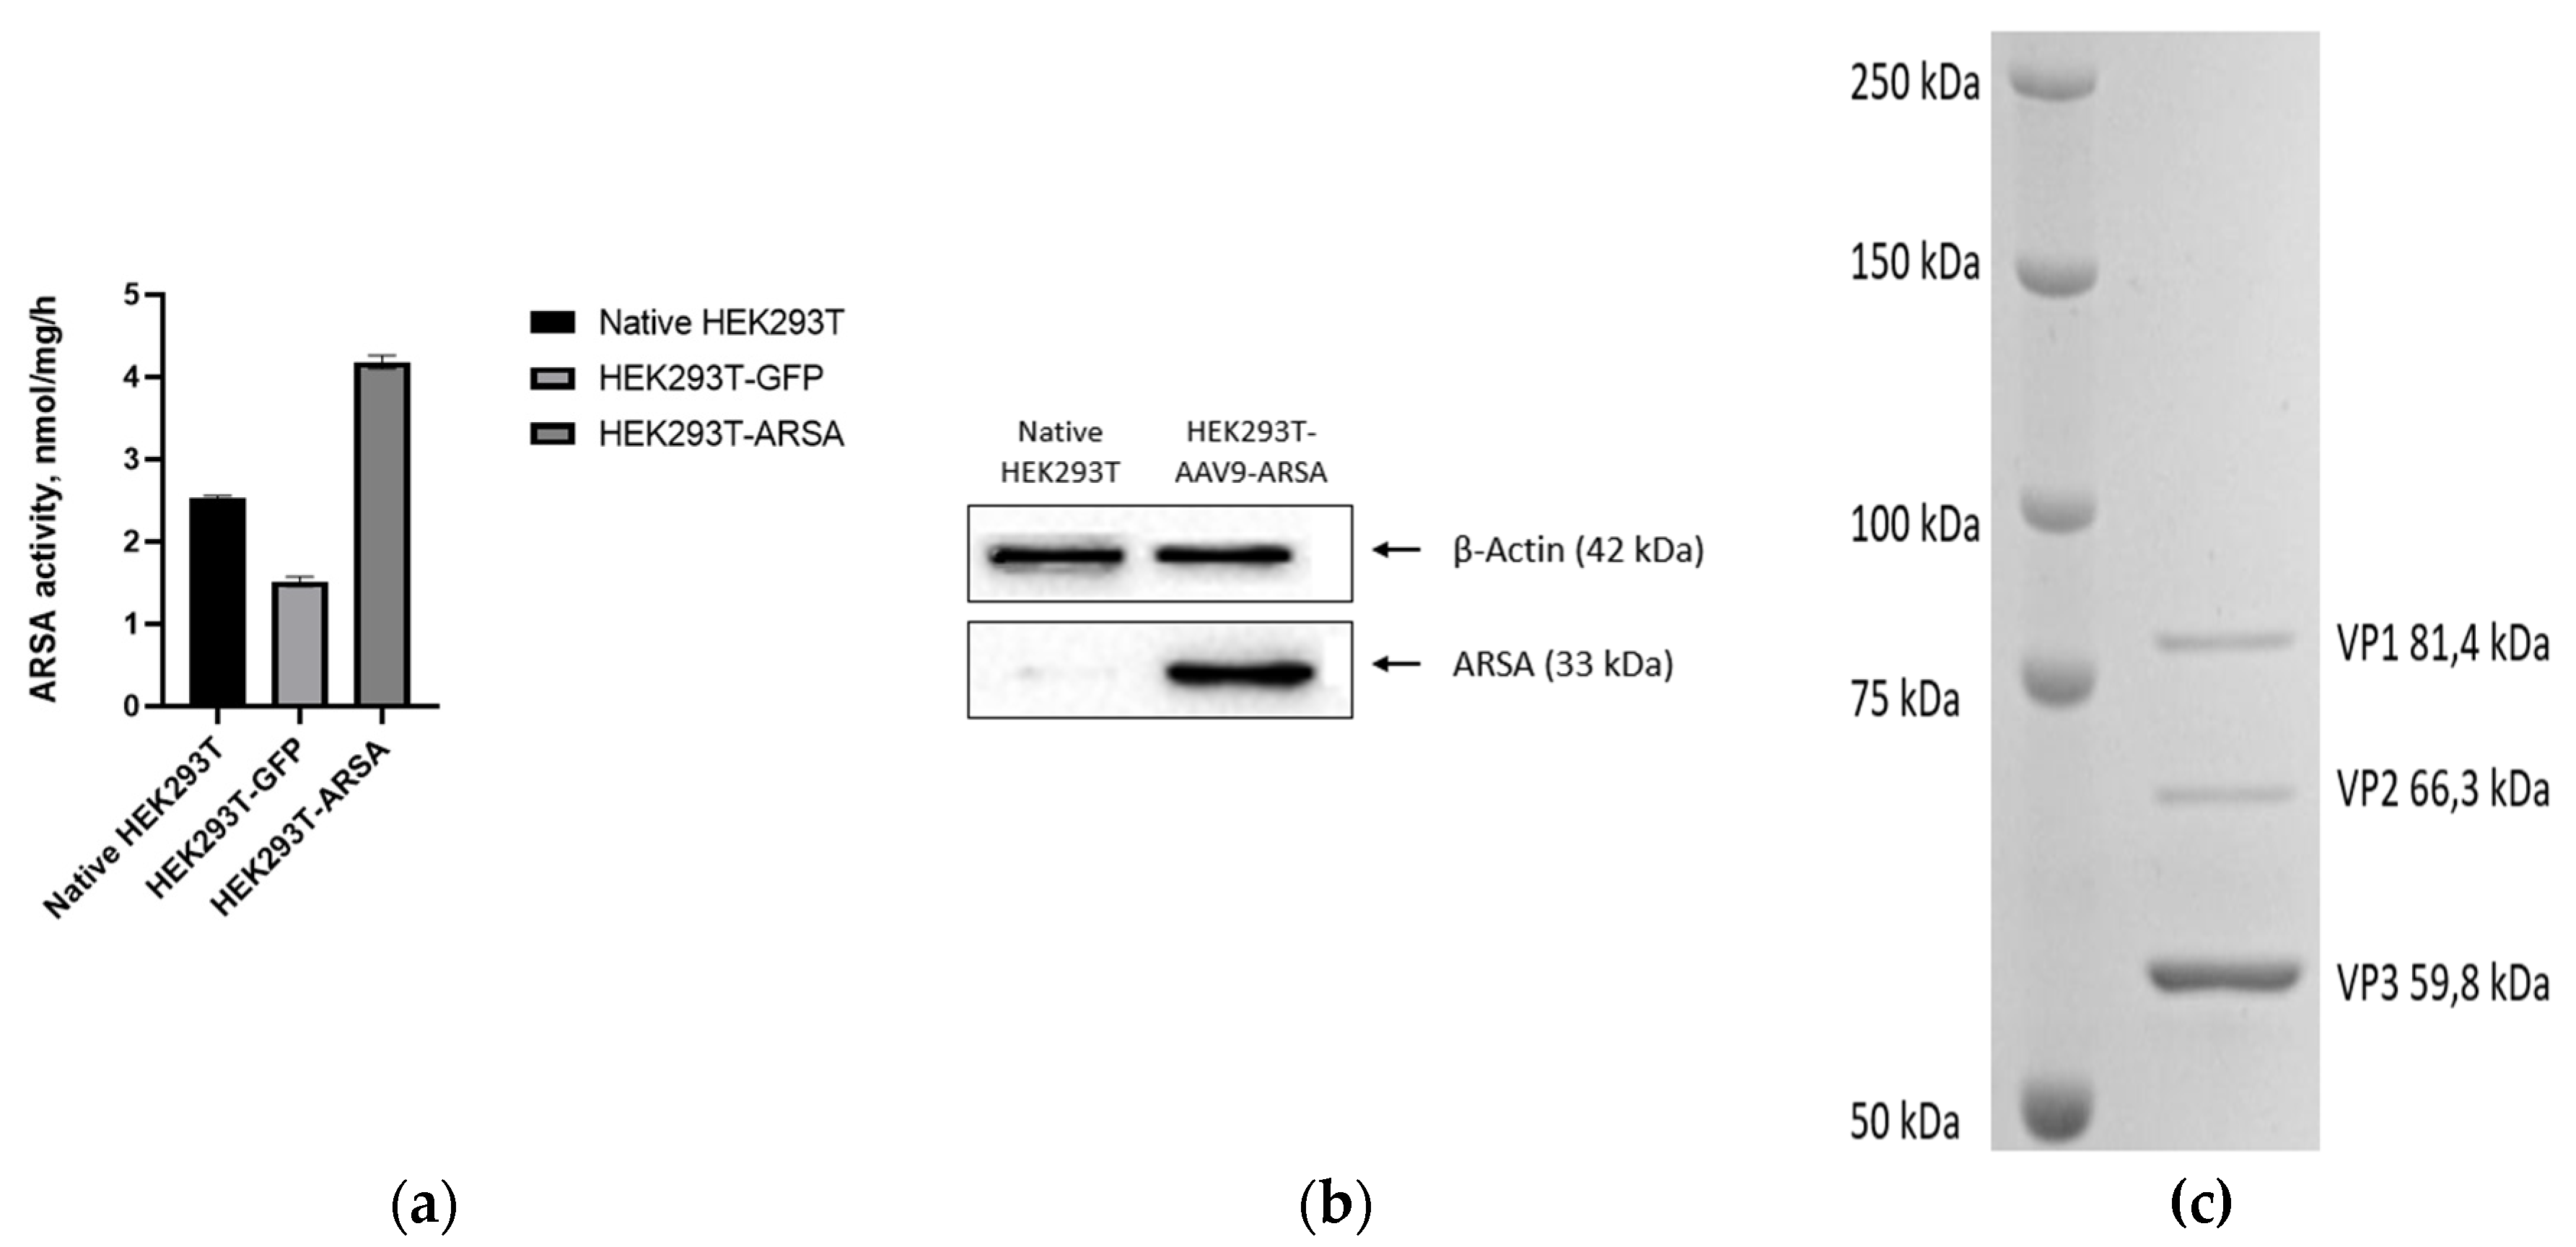
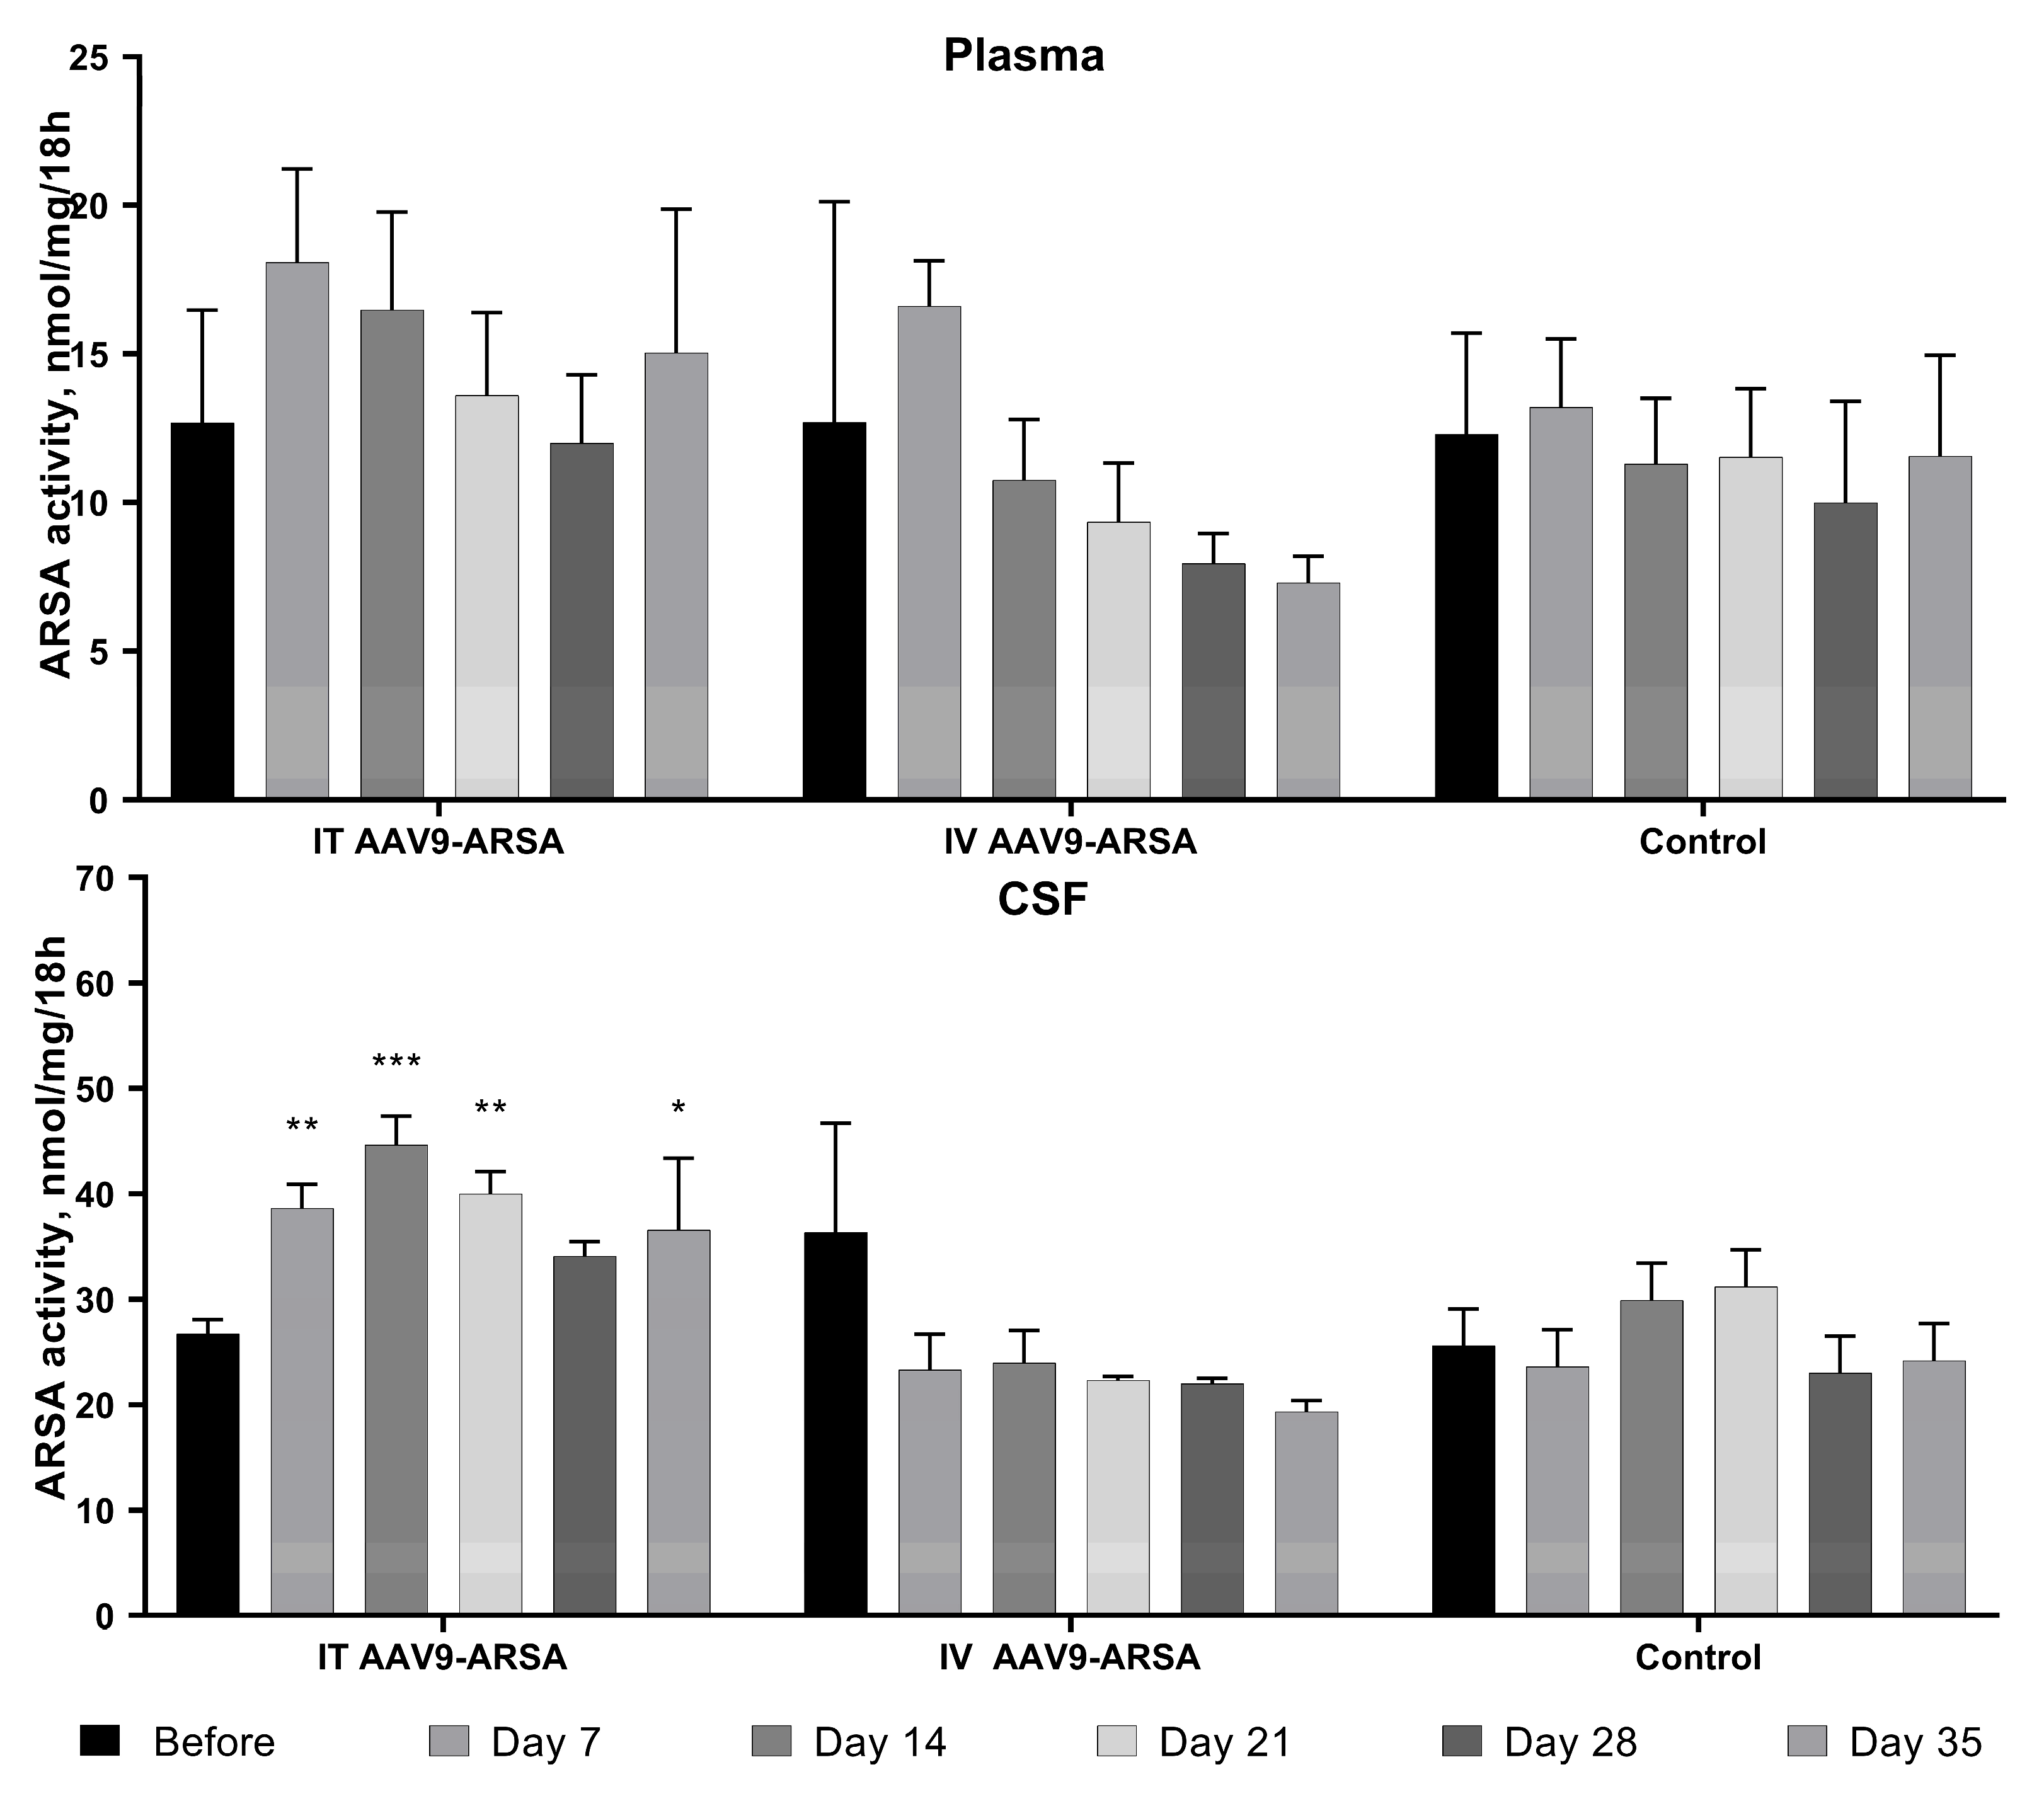
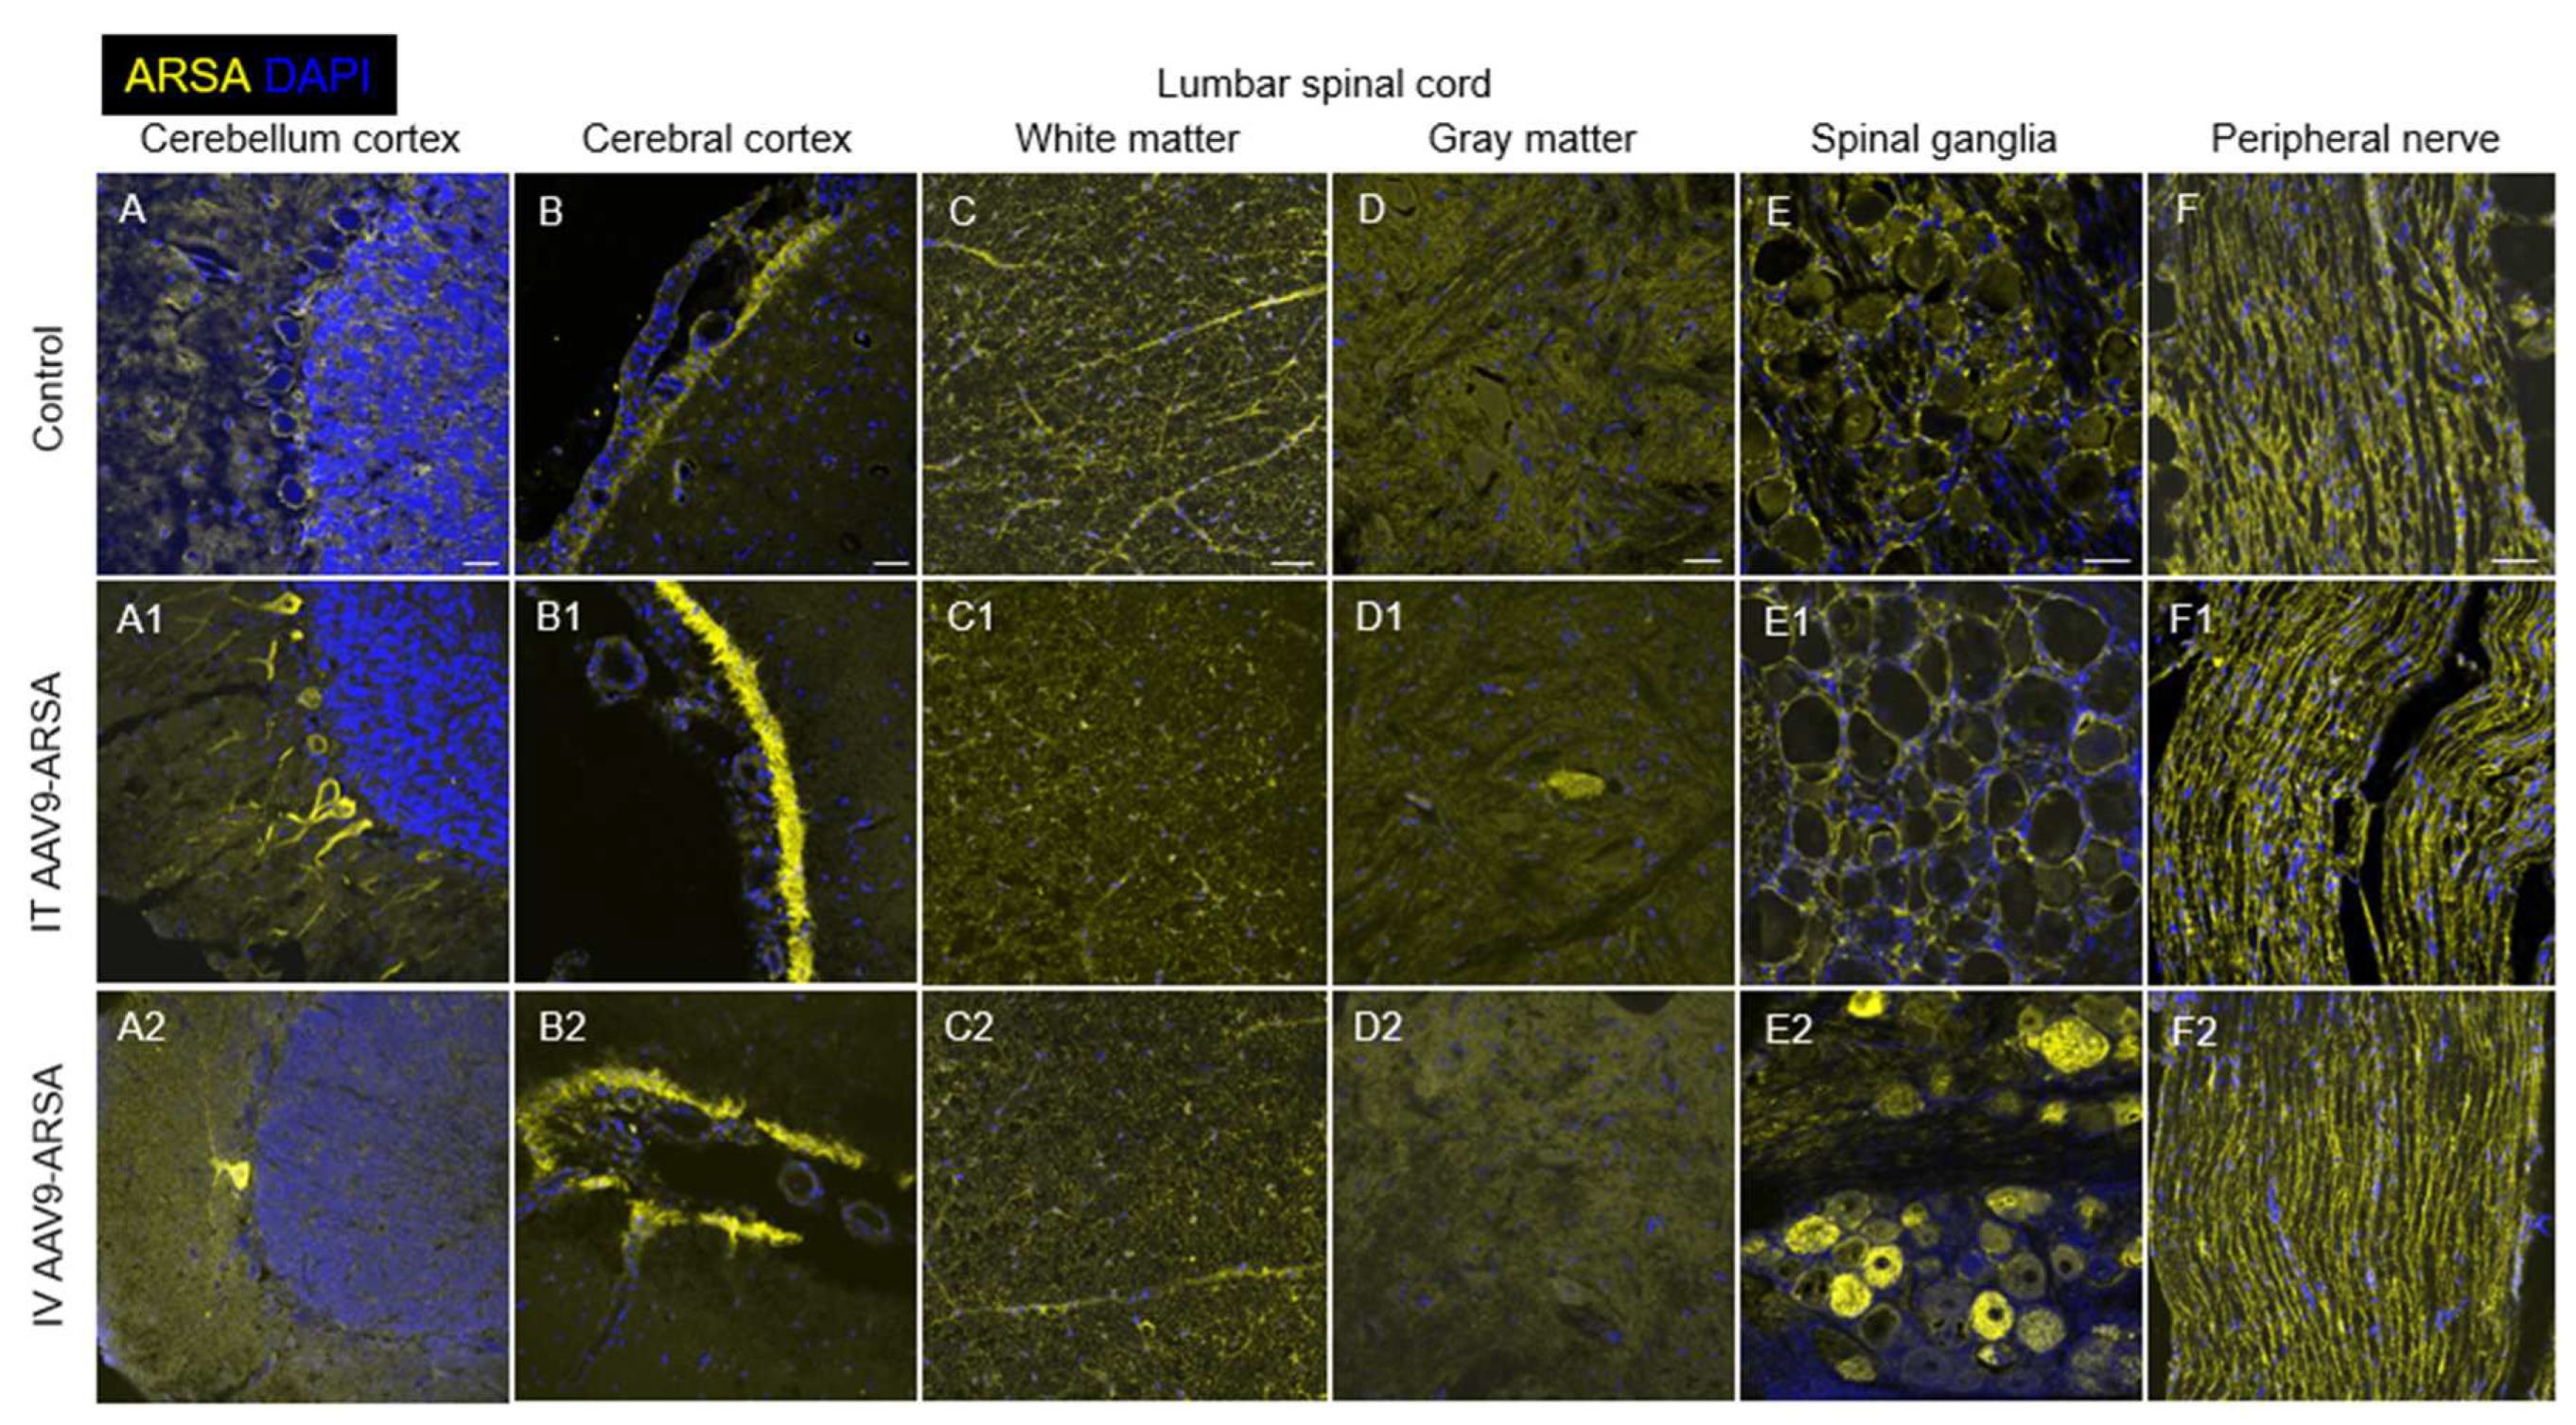
We produced recombinant AAV9-ARSA and confirmed in vitro ARSA overexpression using enzyme activity assay and western blot analysis. We then evaluated the ability of AAV9-ARSA to synthesize a functionally active enzyme after intrathecal or intravenous administration in minipigs. Following intrathecal administration of AAV9-ARSA, we observed an increase in ARSA enzymatic activity in the CSF, which is consistent with other studies [
54,
55]. RT-PCR results showed overexpression in the cerebellum, cervical, thoracic, and lumbar spinal cord following intrathecal administration. IHC also showed overexpression in the cerebellum and ventral horns of the lumbar region, as well as in neurons in the spinal cord, but no statistically significant difference was found between the groups. Other researchers have shown transduction of CNS and PNS neurons following intrathecal administration of AAV9-GFP to mice [
56,
57]. In our study, overexpression was not observed in the PNS.
We hypothesize that the differences in promoter usage, injection site, anatomical variations among experimental animals, and AAV vector design may have contributed to the observed discrepancies. Rachel M. Bailey et al. used a self-complementary AAV vector [
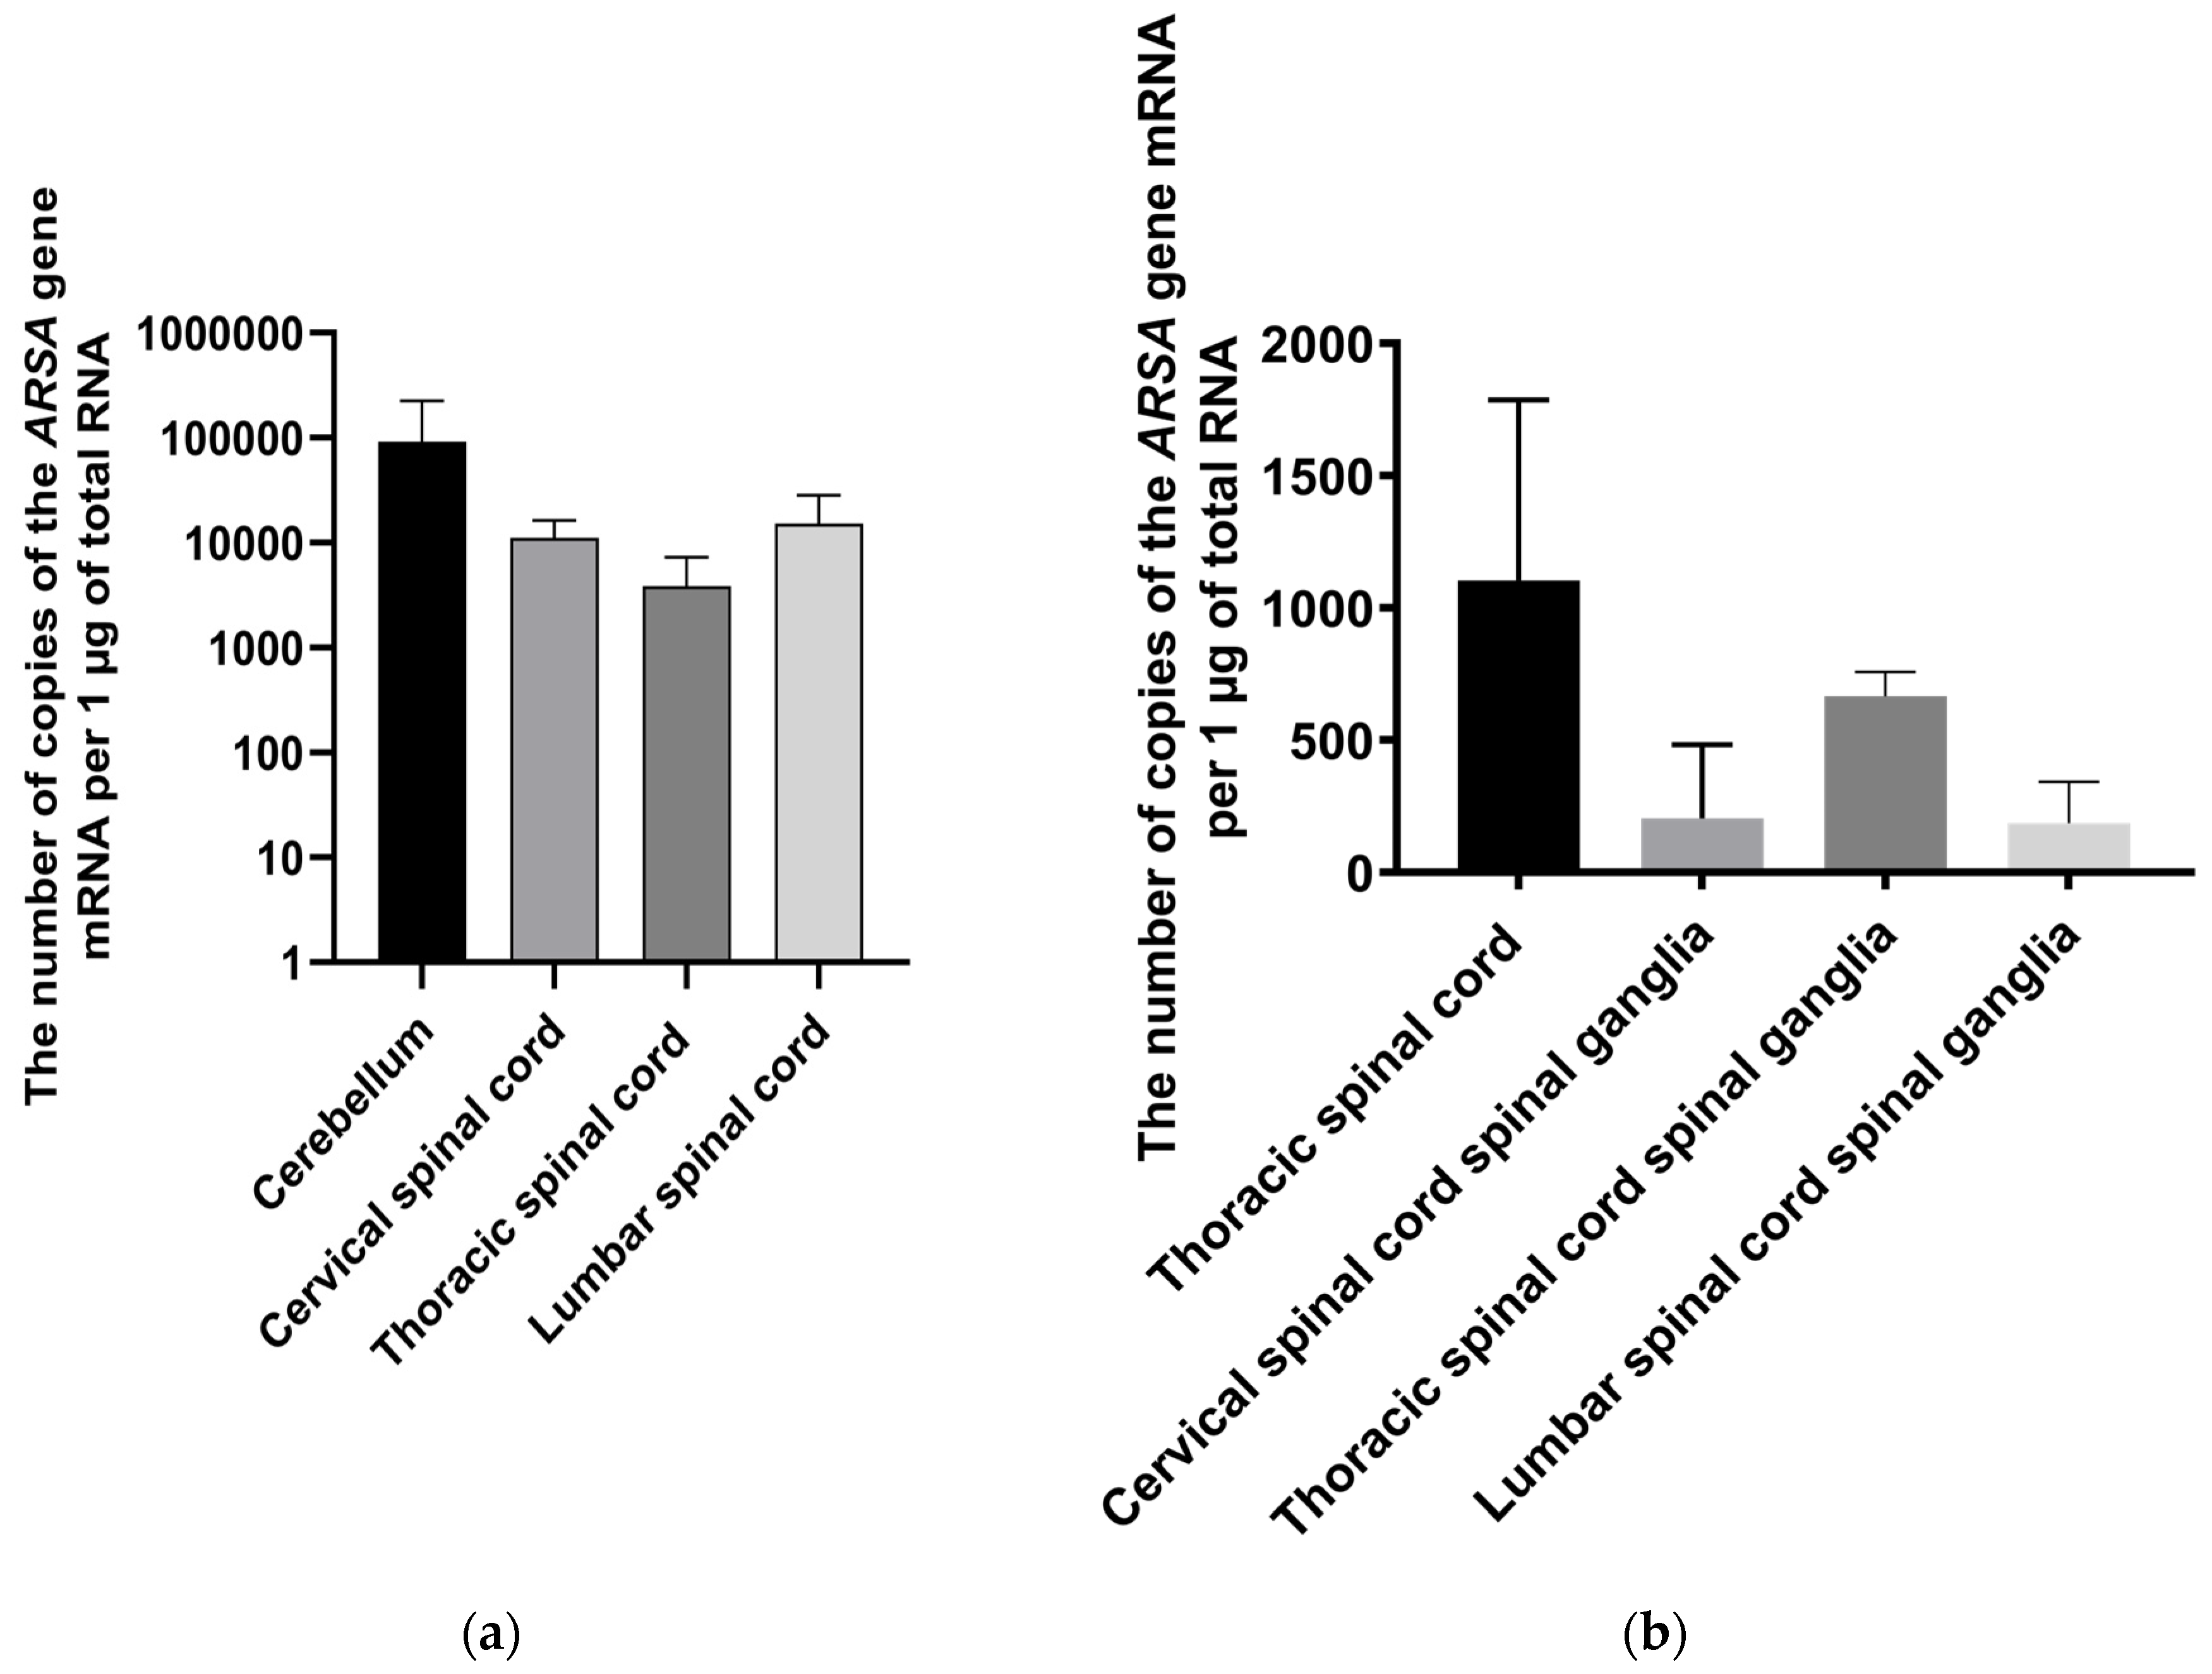
56] and reported increased enzymatic activity in the cerebellum, cervical, and thoracic spinal cord following intravenous administration of AAV9-ARSA. RT-PCR analysis demonstrated ARSA overexpression in the thoracic spinal cord and spinal ganglia of the cervical, thoracic, and lumbar regions. IHC analysis also revealed overexpression in the cerebellum and spinal ganglia. Our findings are supported by studies conducted by Yingqi Lin et al., where they demonstrated broad expression of the transgene in various organs of minipigs following intravenous administration of AAV9-GFP, with overexpression primarily observed in various regions of the brain, and without any adverse inflammatory reactions [
58].
In order to evaluate the safety of our research, we conducted a biochemical blood test, cytokine profiling in blood serum, and a pathomorphological analysis. High-dose intravenous administration of AAV9 has been reported to cause systemic and sensory neuron toxicity in non-human primates [
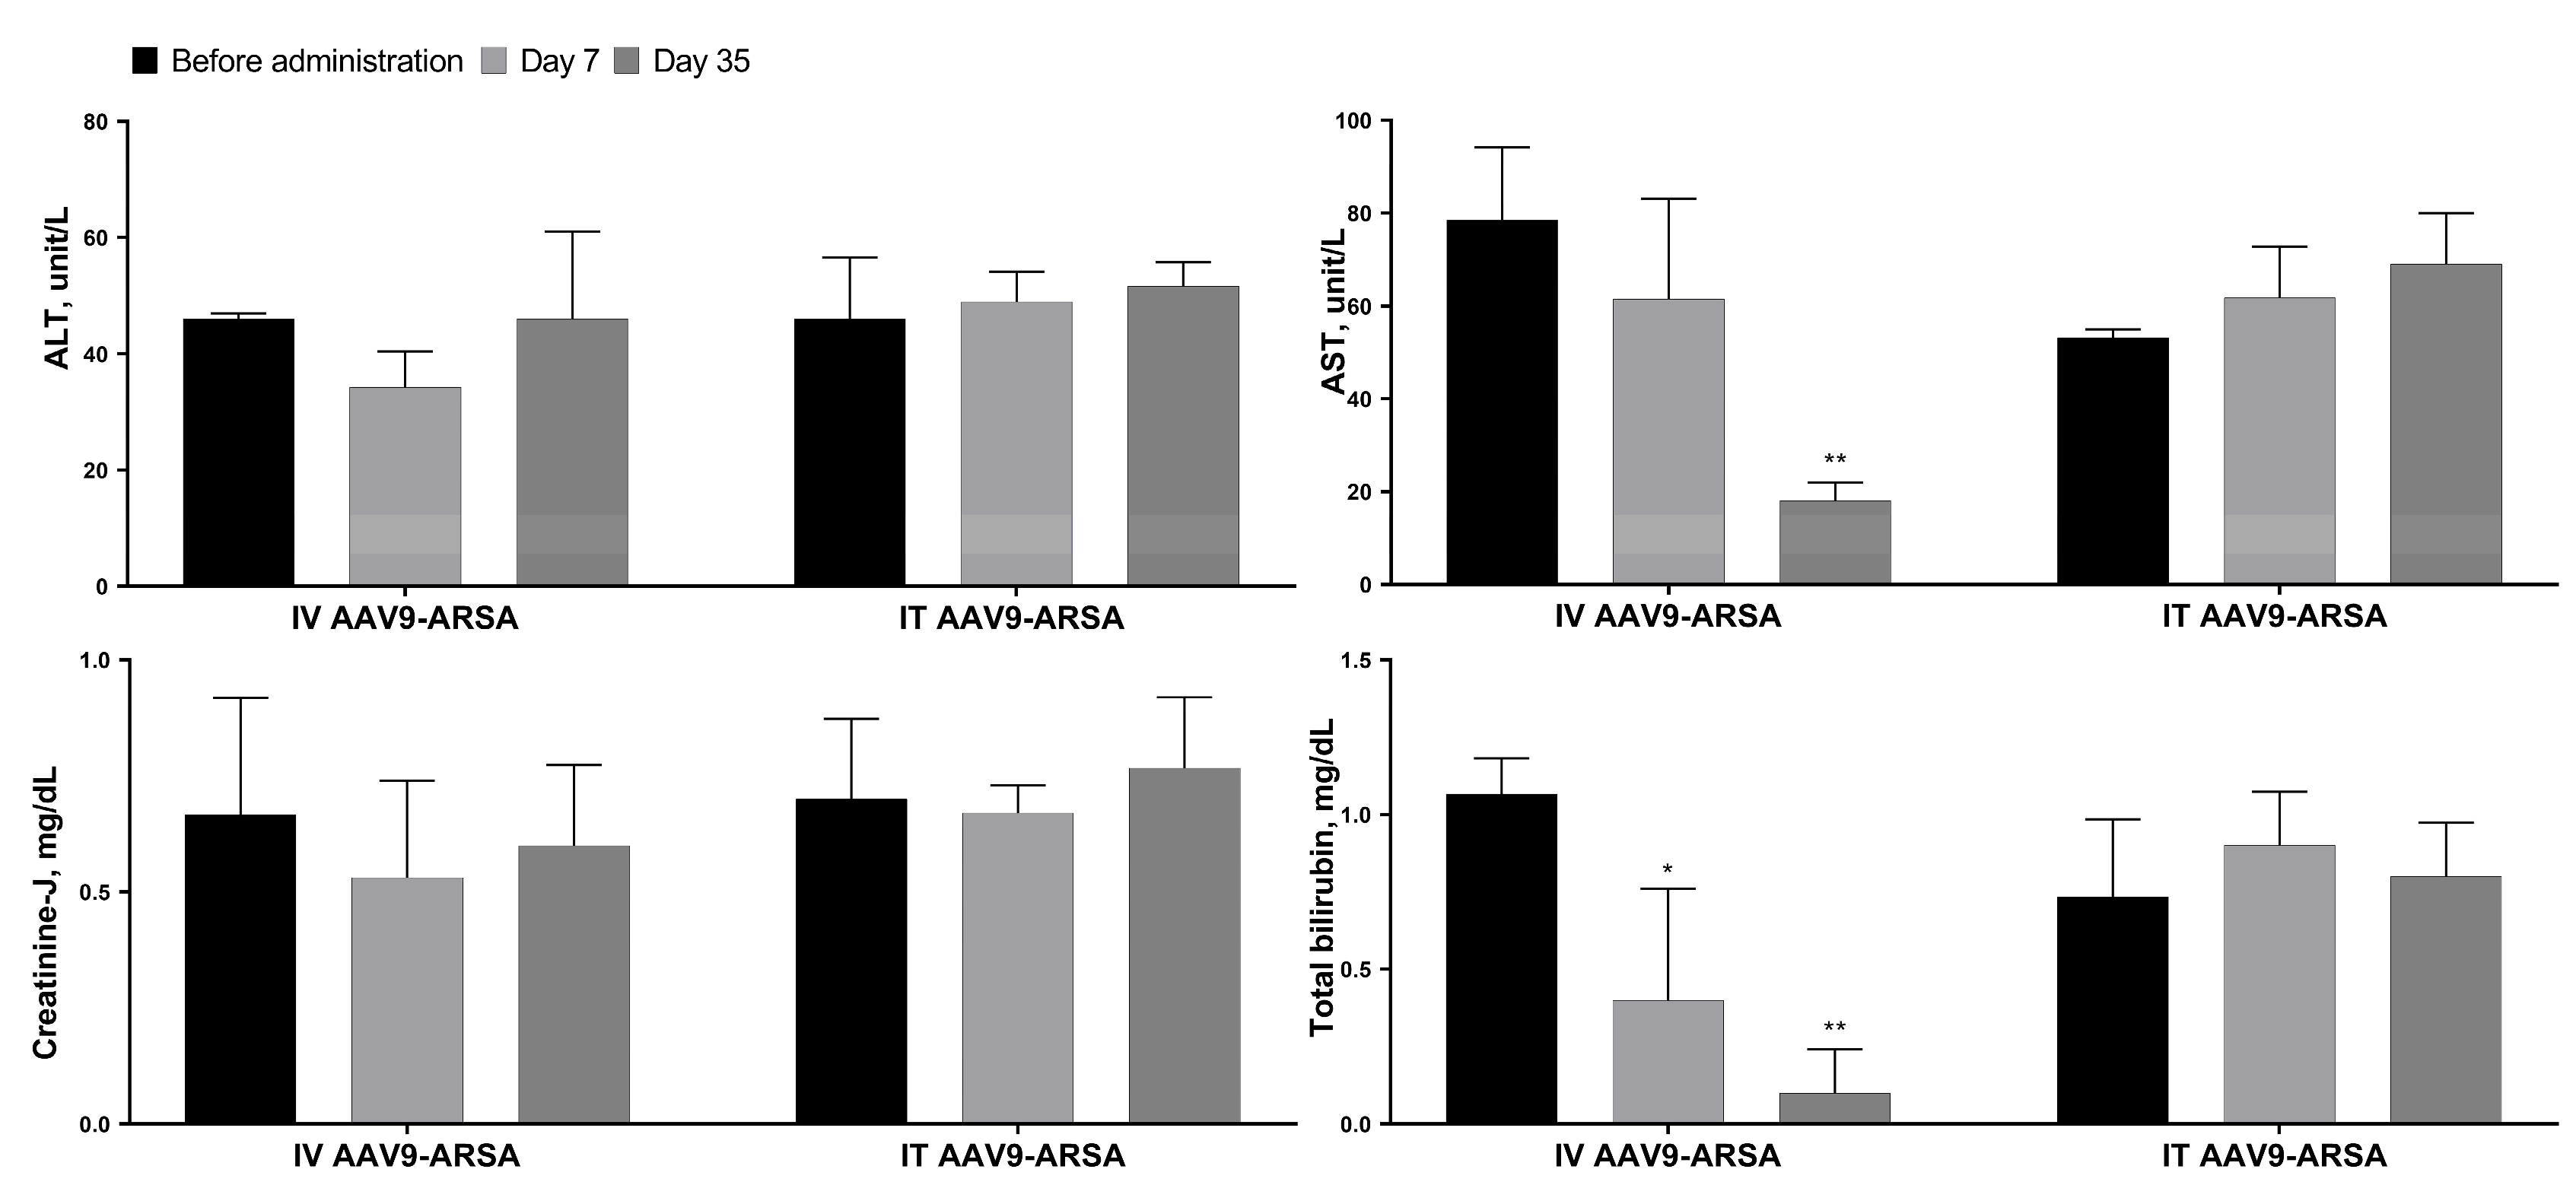
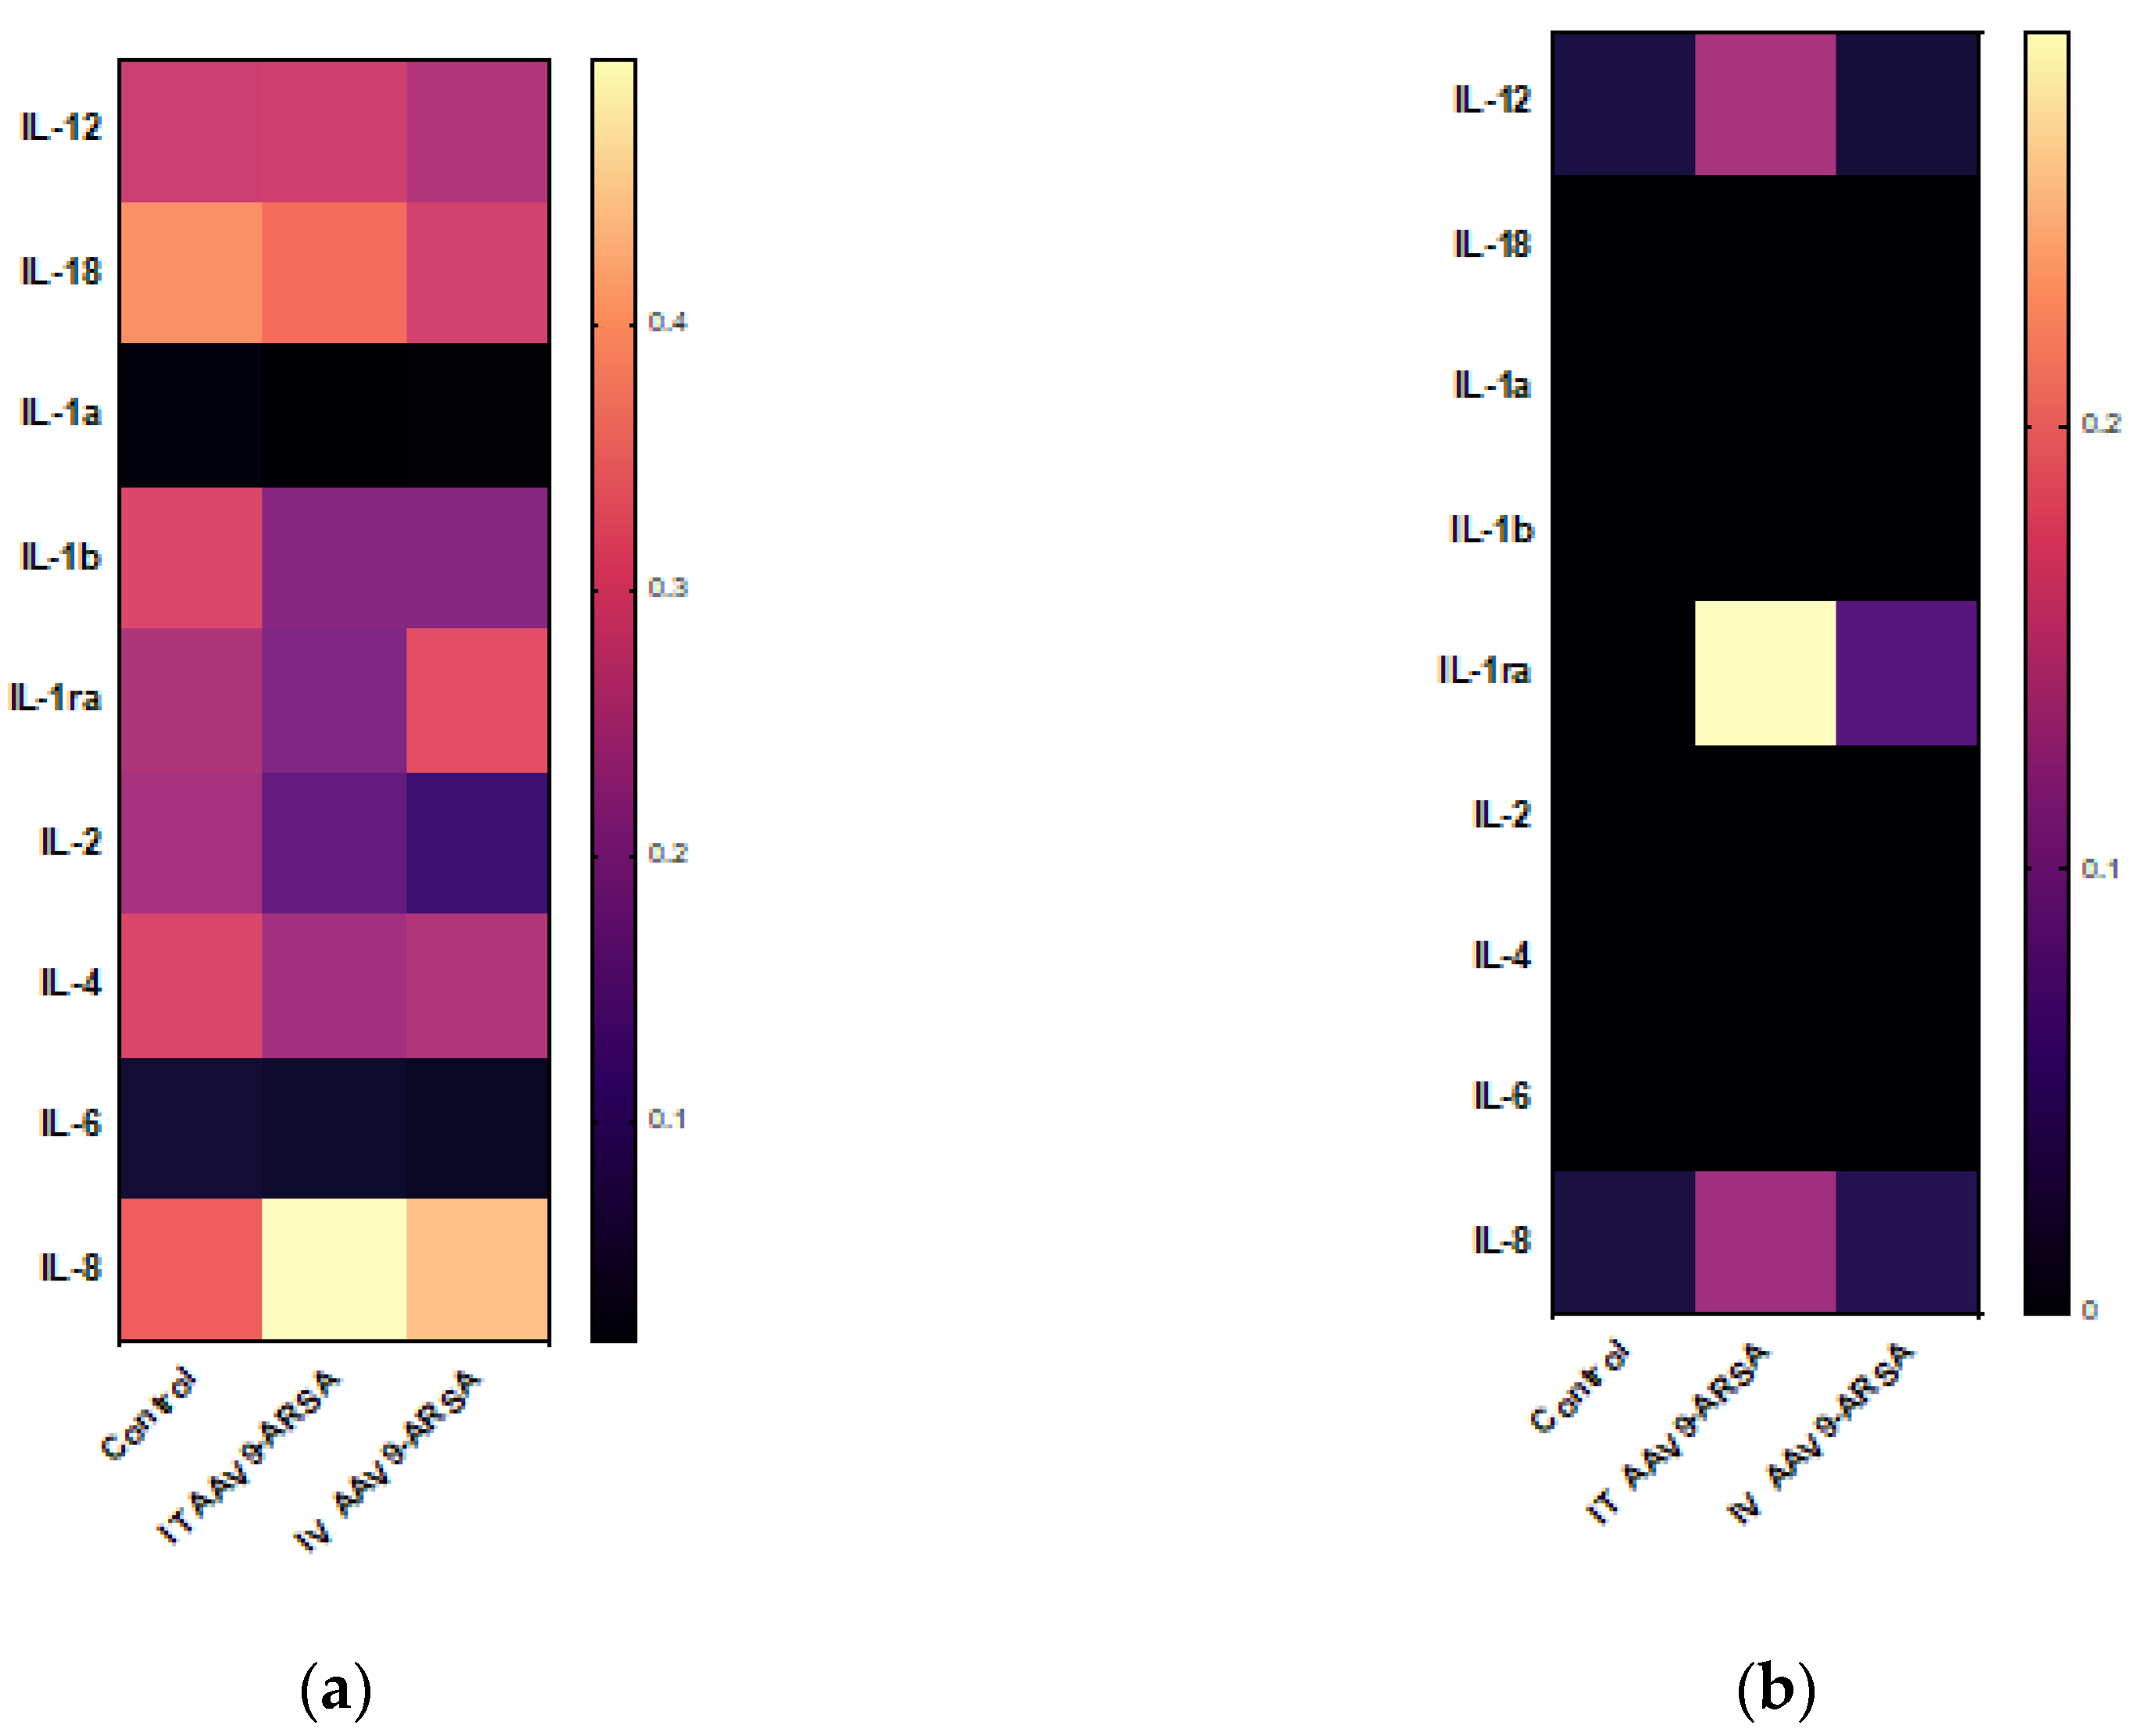
59]. However, in our study, biochemical analysis showed no increase in the levels of AST, ALT, total bilirubin, or creatinine-J, following both intrathecal and intravenous administration of AAV9-ARSA. Cytokine profiling analysis of the minipigs’ CSF revealed an increase in IL-1ra levels following both intrathecal and intravenous administration of AAV9-ARSA. IL-1ra is induced in response to various forms of stress, such as excess excitatory neurotransmitters during seizures, infections and inflammations, and neurotrauma [
60]. It can be synthesized in the CNS by neurons, microglia, and infiltrating macrophages [
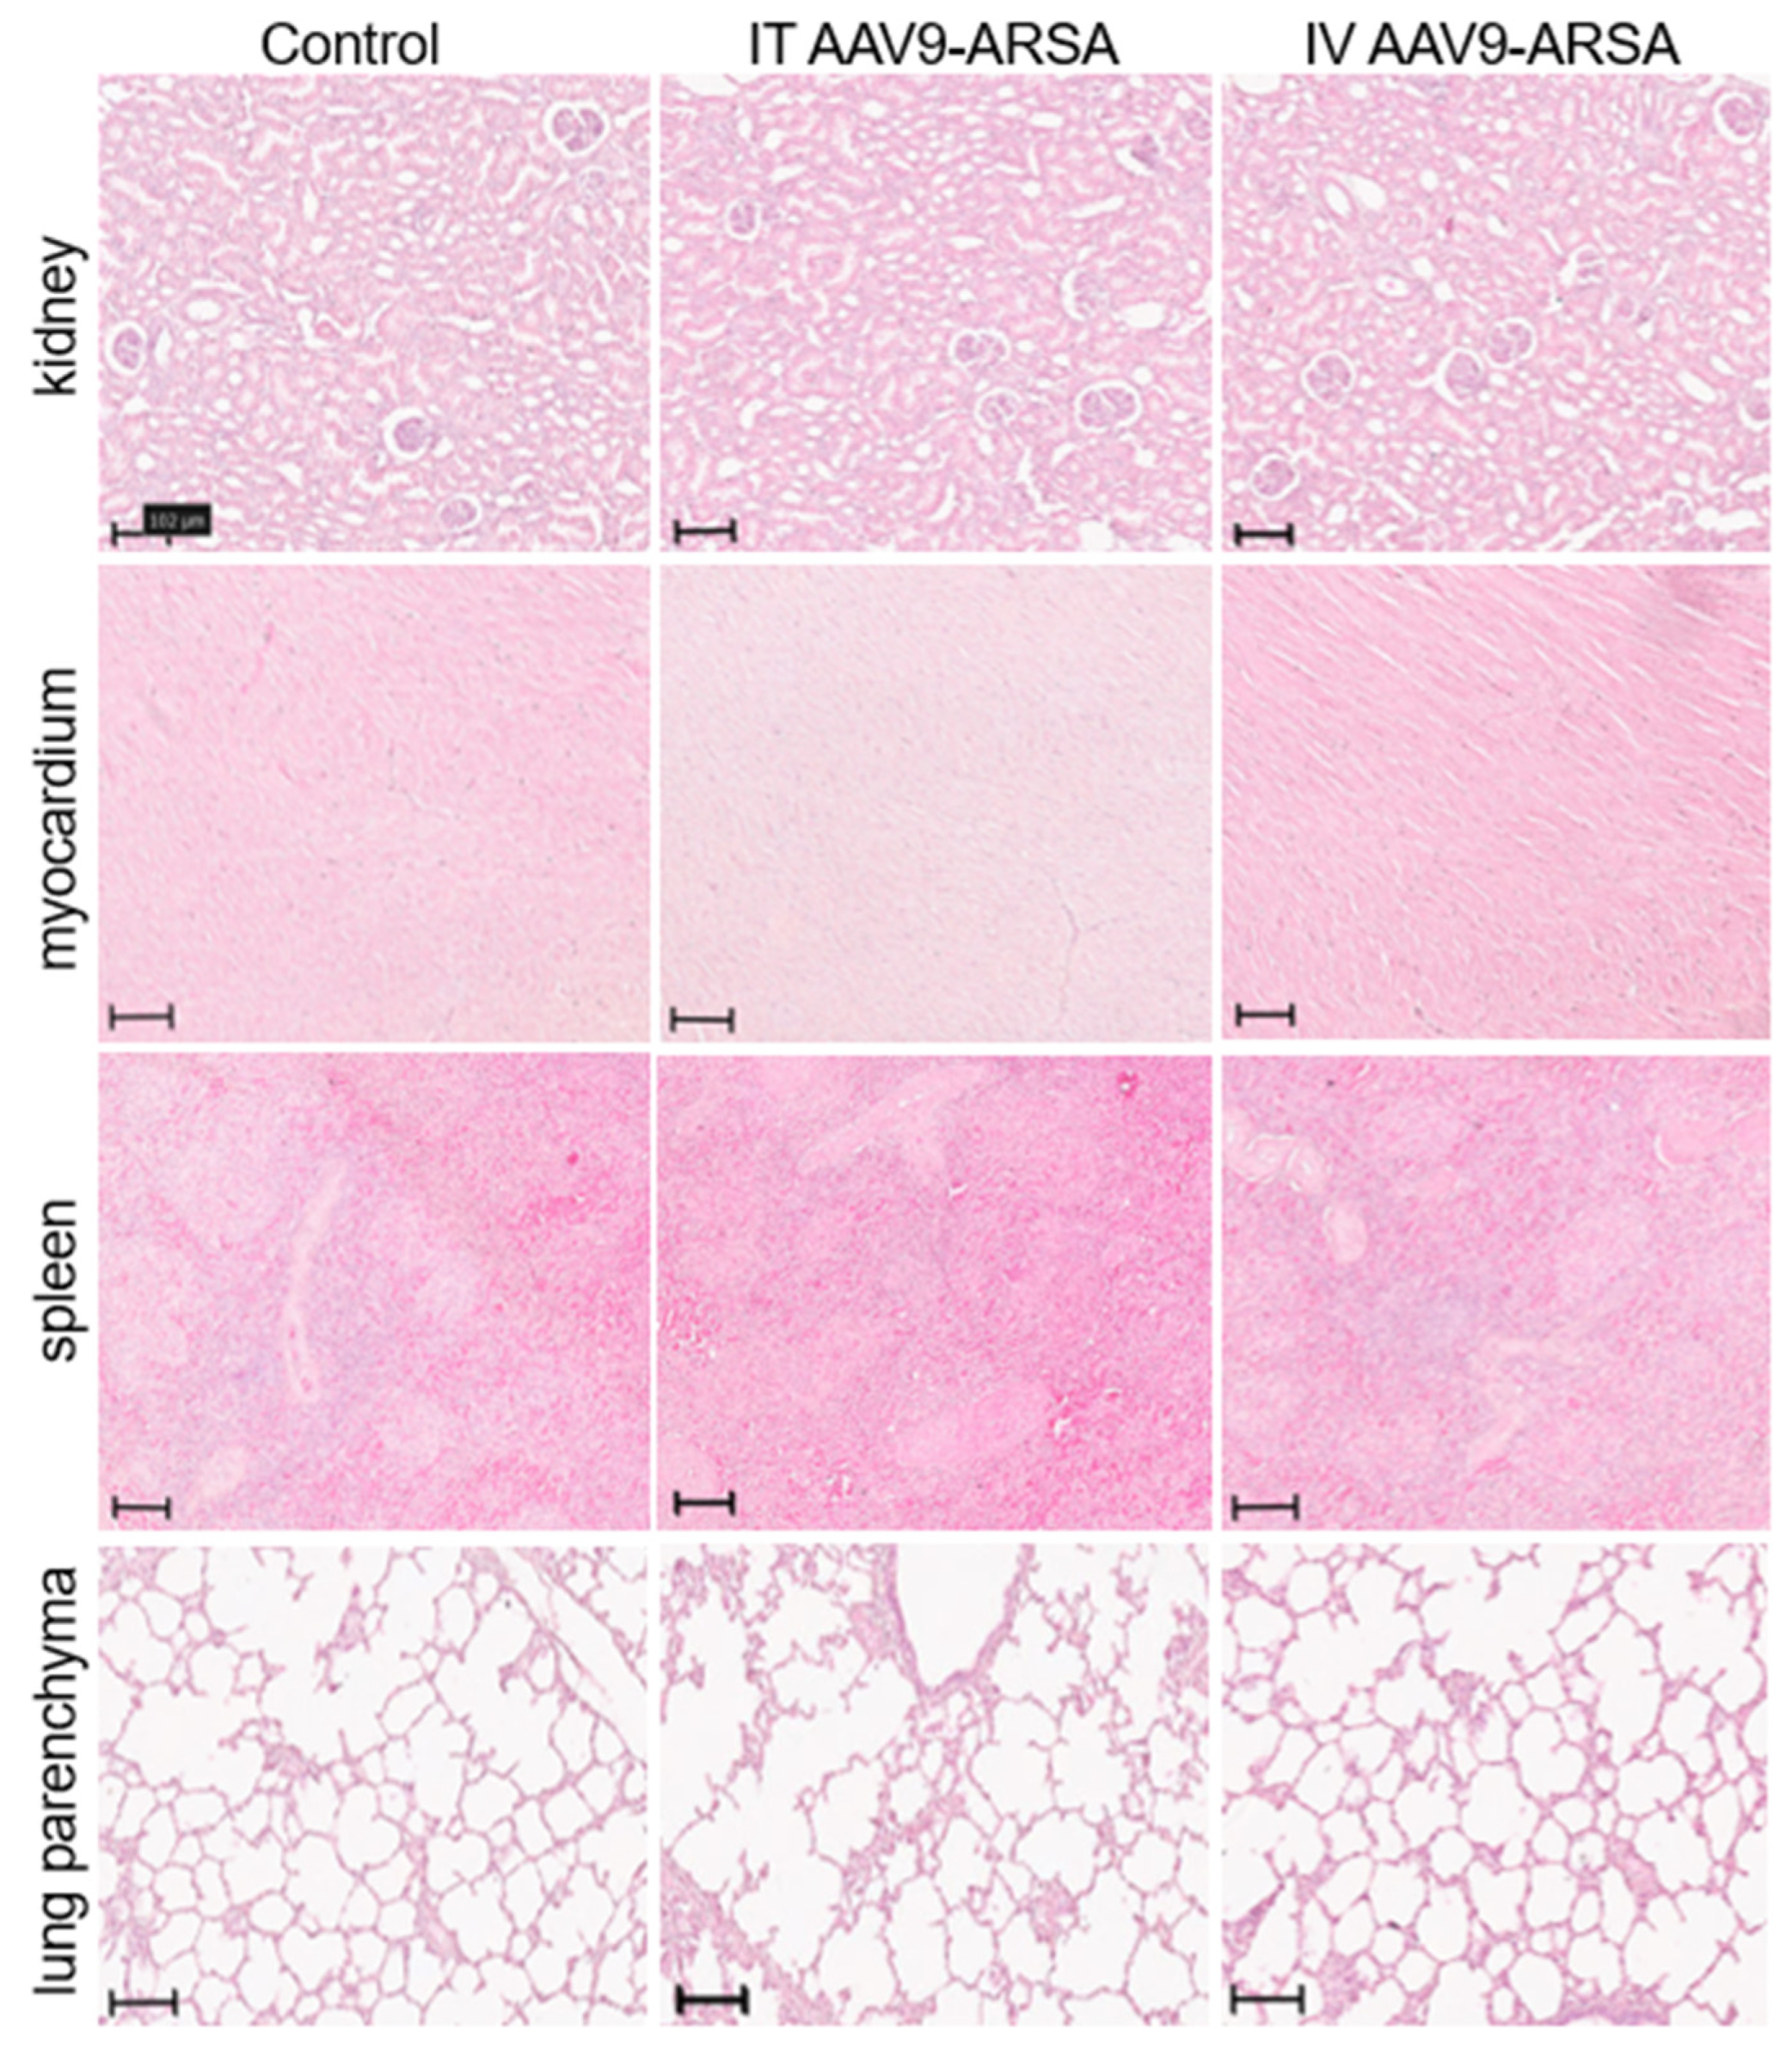
61]. The increase in IL-1ra levels observed in our study could be due to the weekly lumbar punctures performed for CSF sampling, which may have caused inflammation and increased IL-1ra levels to provide an anti-inflammatory response. Pathomorphological analysis did not reveal any abnormalities, and although it was not performed for the liver, biochemical analysis showed no evidence of hepatotoxicity.
We have demonstrated that both intravenous and intrathecal administration of AAV9-ARSA into minipigs results in an increase in enzymatic activity in the CNS. Intrathecal administration leads to transduction of CNS cells and expression of a functionally active ARSA enzyme. Intravenous administration, on the other hand, results in overexpression in the cerebellum, suggesting virus penetration into the CNS from the periphery. While the increase in enzymatic activity of ARSA in various parts of the CNS following intravenous administration of AAV9-ARSA has been demonstrated, immunocytochemical analysis did not confirm these findings. In addition, intravenous administration of AAV9-ARSA resulted in transduction of spinal ganglia neurons in the PNS, which was not observed with intrathecal administration of the same construct. This suggests that intravenous delivery of AAV9 may be useful for the treatment of PNS, but it requires higher doses of the vector compared to intrathecal administration, which is more invasive but uses lower doses.
4. Materials and Methods
4.1. Genetic Construct Design and Analysis
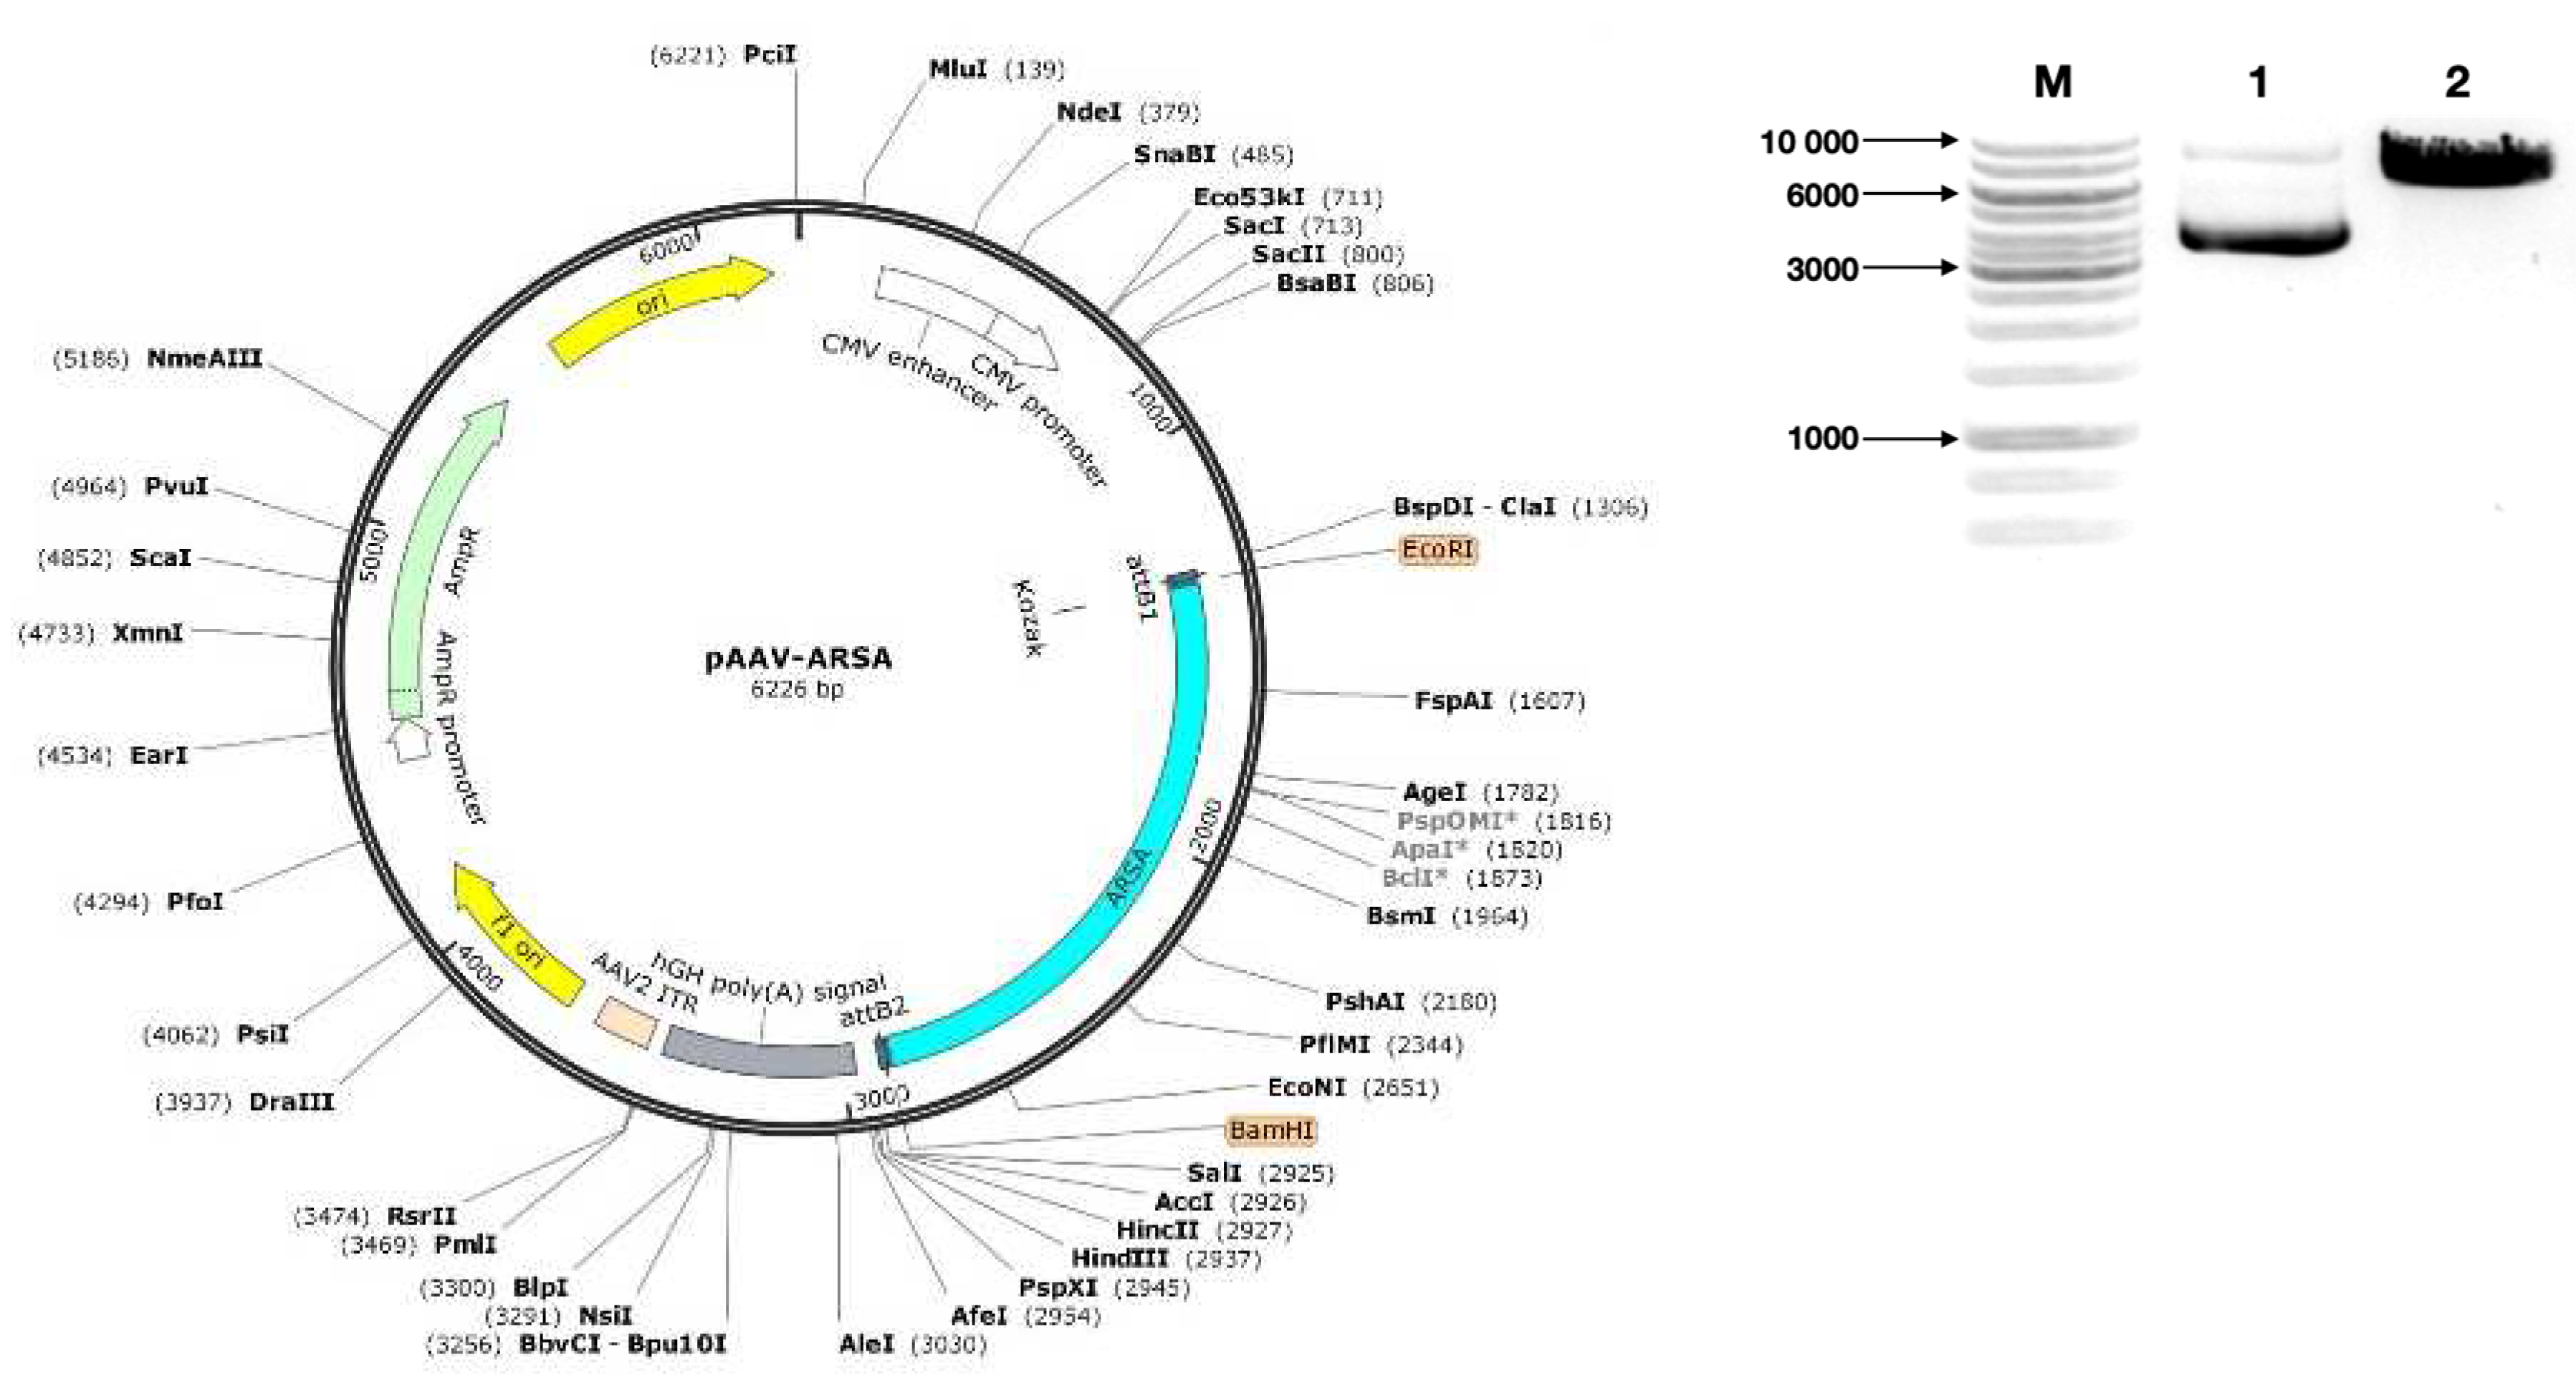
The OptimumGene algorithm was employed for the optimization of the ARSA gene codon composition, taking into consideration various factors that could potentially affect gene expression levels. These factors include codon shift, GC composition, CpG dinucleotide content, mRNA secondary structure, tandem repeats, restriction sites interfering with cloning, premature polyadenylation sites, and additional minor ribosome binding sites. The nucleotide sequence of the CDS mRNA of the human ARSA gene (GeneBank #NM_001085425.3, 1530 bp) was utilized as a matrix for codon optimization. Following codon optimization, the CDS mRNA of the ARSA gene was cloned into the pAAV-MCS plasmid vector (Agilent Technologies, USA) using recombinase at EcoRI/BamHI restriction sites. Codon optimization, de novo synthesis of the CDS mRNA nucleotide sequence of the ARSA gene, and its cloning into the pAAV-MCS plasmid vector were performed by GenScript (USA). The correct assembly of the genetic construct was verified through restriction analysis using BamHI restrictase (#ER0051, Thermo Fisher Scientific Inc., USA) and sequencing.
4.2. Production of preparative amounts of plasmid constructs required for AAV assembly
Escherichia coli TOP10 strain (Invitrogen, USA) was utilized for generating preparative amounts of plasmids through transformation. Cells were incubated in LS-LB medium without antibiotics. Competent cells were prepared using the CaCl2 method. Genetic transformation of competent cells was performed using heat shock, after which the transformed bacterial cells were incubated on a selective medium containing ampicillin. Plasmid DNA (pAAV-ARSA, pAAV-RC, and pHelper) was isolated from the resulting bacterial biomass (GeneJET Plasmid Miniprep Kit, #K0502, Thermo Fisher Scientific Inc., USA).
4.3. Preparation and purification of recombinant AAV
AAV viruses were produced using the standard co-transfection of three plasmids into AAV293 cells via the calcium phosphate method. AAV293 cells were cultured at 37°C in humid conditions with 5% CO2 in complete DMEM medium (PanEco, Russia), containing 10% fetal calf serum, L-glutamine, and 1% antibiotics such as penicillin and streptomycin. Cells were centrifuged 72 hours post-transfection, after which lysis buffer (NaCl, Tris-HCl pH 8.5, MgCl2, dH2O), DNase (Benzonase® Nuclease, Sigma-Aldrich, USA), and 25% sodium deoxycholate were added to the pellet. The lysates were purified and subjected to an iodixanol density gradient of 60%, 40%, 25%, and 15%. In the final stage of virus purification, a concentrator suitable for 50 kDa proteins (Vivaspin 20, membrane 50 kDa, Sartorius, UK) was utilized. Viral titer was determined through quantitative PCR using primers (forward 5’-3’ - GGAACCCCTAGTGATGGAGTT, reverse 5’-3’ - CGGCCTCAGTGAGCGA) and a probe targeting ITRs (5’-3’ (FAM) CACTCCCTCTCTGCGCGCTCG (BBQ).
4.4. Determination of the overall purity of virus particles
Overall purity of viral particles was determined by sodium dodecyl sulfate–polyacrylamide gel protein electrophoresis (SDS-PAGE). A polyacrylamide gel was prepared with an acrylamide concentration gradient (4% for the concentrating gel, and 10% for the separating gel). AAV9-ARSA was incubated at 70°C for 15 minutes prior to loading onto the gel. Protein marker (Thermo Scientific™, Cat. No. 26616) and the sample were added to their corresponding wells, and electrophoresis was performed at a constant voltage of 200 V.
After electrophoresis, the gel was stained with Coomassie blue (Thermo Fisher, Cat. No. LC6065) for 2-3 hours with gentle shaking. The gel was then washed in a solution of 40% methanol and 10% acetic acid until protein bands were visible. Finally, the image was captured using the ChemiDocXRS+ gel documentation system (BioRad, USA).
4.5. Western blot analysis
For transfection of HEK293T with recombinant AAV9-ARSA, cells were seeded in 6-well plate 24 hours prior. A mixture was prepared considering a multiplicity of infection (MOI) of 100 (100 viral particles per cell), with protamine sulfate added to achieve a final concentration of 10 μg/ml. Cell growth medium was replaced with the prepared transduction mixture. After 6 hours, the medium was switched to fresh. Transgene expression was assessed using Western blot analysis.
Western blot analysis was performed using the standard Laemmli method under denaturing conditions (SDS-PAGE). Protein transfer from gel to membrane (PVDF) was conducted using a Trans-Blot® SD Semi-Dry Electrophoretic Transfer Cell (BioRad, USA). Non-specific binding was prevented by incubating the membrane in blocking buffer. Membranes were then incubated with primary rabbit anti-ARSA monoclonal antibodies (#PAG619Hu01, Cloud-Clone Corp., USA), followed by incubation with secondary antibodies (polyclonal goat antibodies to human immunoglobulin G conjugated with horseradish peroxidase, Sigma, #A6154, USA). Visualization of the immunoprecipitate was carried out using ECL Western Blotting Substrate (#W1001, Promega, USA). The membrane was examined using the ChemiDocXRS+ gel documentation system (BioRad, USA).
4.6. Animals
All experimental procedures on animals were reviewed and approved by the local ethics committee of Kazan Federal University (Protocol No. 23, June 30, 2020). Healthy female minipigs at the age of 4 months (weighing 9-12 kg) were used in the study. Experimental animals (15 minipigs) were divided into 3 groups: (1) intrathecal administration of AAV9-ARSA, at a dose of 1 × 10¹² genomic copies (gc)/kg (n=5); (2) intravenous administration of AAV9-ARSA, at a dose of 3.77 × 10¹³ gc/kg (n=5); (3) control group with no AAV9-ARSA administration (n=5). Animals were housed in specialized animal care facilities of Kazan State Academy of Veterinary Medicine named after N.E. Bauman (KGAVM), under the supervision of qualified personnel. Animal euthanasia was performed in strict compliance with the recommendations for euthanasia of experimental animals of the European Commission.
4.7. Material Sampling
Prior to the virus injection, CSF and blood samples were taken as time point zero. Later, CSF and blood samples were taken 7, 14, 21, 28, 35 days following the virus injection, in order to analyze ARSA enzymatic activity in dynamics. On the 35th day after the virus injection, experimental animals were euthanized. To determine ARSA expression levels, quantitative RT-PCR was performed, as well as a test for ARSA enzymatic activity in homogenates of various parts of the nervous system.
Parts of the following organs were sampled from each animal: cerebellum, occipital lobe of the brain, cervical (C6-7), thoracic (Th6-7) and lumbar (L2-3) sections of the spinal cord with spinal roots and ganglia, lateral femoral cutaneous nerve, heart (left ventricle), lungs, kidneys, spleen, and liver. Each of the organ parts was placed in a 10% formalin solution. After 48 hours of fixation, each organ part was divided into 2 fragments; one was embedded in paraffin, and the other was transferred consecutively into 15%, and then 30% sucrose. Samples obtained from minipigs’ nervous tissue (in 30% sucrose) were placed in tissue freezing medium (Tissue-Tek O.C.T. Compound, Sakura). On a Microm HM 560 cryostat (Thermo Scientific), transverse or sagittal sections of the studied nervous system organs 20 μm thick were obtained and used for subsequent immunofluorescent analysis. Samples of internal organs embedded in paraffin were cut on a Minus S700A (RWD) microtome 5–7 µm thick, and then stained with hematoxylin and eosin.
4.8. Determination of ARSA enzymatic activity
To determine ARSA enzymatic activity in organ homogenates, total protein concentration in samples was determined using the Pierce™ BCA Protein Assay Kit (ThermoFisher Scientific Inc., USA). Samples were normalized according to total protein concentration. Next, 50 µl of cell lysate or tissue homogenate sample was incubated with a solution of nitrocatechol sulfate substrate (0.01 M p-Nitrocatechol sulfate dipotassium salt (#N7251, Sigma-Aldrich), 0.5 M sodium acetate, 5 × 10⁻⁴ Na4P2O7, 10% sodium chloride, pH = 5) for 1 hour at 37°C. The reaction was then stopped by adding 1 N sodium hydroxide. Sulfatase dilutions (#S9626, Sigma-Aldrich) were used as standards, and optical density was measured at a wavelength of 515 nm.
4.9. Quantitative polymerase chain reaction (qPCR)
Total RNA was isolated from animal organ parts using the TRIzol Reagent (Invitrogen, USA) following the manufacturer’s protocol. Primers and probes specific to human ARSA were designed using the GenScript Online Real-time PCR (TaqMan) Primer Design Tool (GenScript, USA) and synthesized by Evrogen (Russia). The primer sequences were as follows: forward 5’-CAAGGTACATGGCATTCGCA-3’ and reverse 5’-CTGTGGATAGTGGGTGTGGT-3’. The probe sequence was 5’-CCTGCCGCTGTGCATCTGCCA-3’ labeled with FAM (6-carboxyfluorescein) on the 5’ end and BHQ-1 (Black Hole Quencher 1) on the 3’ end. Isolated RNA was reverse transcribed into cDNA using the GoScript™ Reverse Transcription System (Promega, USA) according to the manufacturer’s instructions. Real-time PCR based on TaqMan was performed in 96-well MicroAmp plates (BioRad, USA), using a qPCR mix that contained 1 µl of cDNA template, 0.3 µl of primer and probe mixture (with a final concentration of 300 nM for each primer), 4.7 µl of MilliQ H2O, and 4 µl of 10x TaqMan-buffer (Lytech, Russia), with a final volume of 10 µl. PCR amplification was carried out using the CFX96 Touch™ Real-Time PCR Detection System (BioRad, USA) under the following temperature cycling conditions: preheating at 95°C for 3 min, 45 denaturation cycles at 95°C for 10 sec, and annealing at 55°C for 30 sec.
4.10. Biochemical blood analysis and cytokine profile analysis
To evaluate safety, biochemical blood analysis and cytokine profiling were performed. Whole blood was collected from animals into test tubes with gel and blood clotting activator. The samples were then centrifuged at 1900 rpm for 20 minutes to separate the serum, and levels of aspartate aminotransferase (AST), alanine aminotransferase (ALT), total bilirubin, and creatinine were measured using a ChemWell 2900 biochemical analyzer (USA).
Porcine serum and CSF samples were analyzed using the MILLIPLEX MAP Porcine Cytokine/Chemokine Magnetic Bead Panel - Immunology Multiplex Assay (PCYTMG-23K-13PX, Merck), which included GM-CSF (colony-stimulating factor 2 (granulocyte-macrophage)), IFNγ (interferon gamma), IL-1α (interleukin 1 alpha), IL-1β, IL-1ra (IL-1 antagonist), IL-2, IL-4, IL-6, IL-8, IL-10, IL-12, IL-18, and TNF-α (tumor necrosis factor-alpha). For each sample, 50 microliters were used to determine analyte concentrations. Data were analyzed using a Luminex 200 analyzer with MasterPlex CT control software and MasterPlex QT analysis software (MiraiBio division of Hitachi Software, USA).
4.11. Immunofluorescence Analysis
To analyze the tissue expression of the ARSA protein, cryostat transverse or sagittal sections of central (CNS) and peripheral (PNS) nervous system organs obtained from minipigs were used. For immunofluorescent labeling, sections were blocked with 5% normal goat serum, then incubated with primary antibody (anti-ARSA, Cloud-Clone), and subsequently with secondary antibodies (Alexa 546, Abcam). Following successive washes in PBS, sections were counterstained with 4’,6-diamidino-2-phenylindole (DAPI) (10 μg/ml in PBS, Sigma-Aldrich) to visualize nuclei. Sections were mounted with medium (ImmunoHistoMount, Santa Cruz) and examined using a LSM 700 confocal scanning microscope (Carl Zeiss).
4.12. Statistical Analysis
Obtained data were analyzed using GraphPad Prism 8 software (GraphPad Software). The Shapiro-Wilk test and one-way analysis of variance (ANOVA) followed by Tukey’s post hoc test were applied to determine statistically significant differences, which were designated as * for p < 0.05, ** for p < 0.01, *** for p < 0.001, and **** for p < 0.0001.
Figure 1.
Characterization and analysis of the expression plasmid vector pAAV-ARSA. (a) pAAV-ARSA plasmid map; (b) Analysis of restriction results for plasmid DNA, M – GeneRullerTM DNA Ladder 1kb marker, 1 – pAAV-ARSA restriction with BamHI enzyme (Cat. No. ER0051, Thermo Fisher Scientific Inc., USA), 2 – pAAV-ARSA cDNA.
Figure 2.
(a) Analysis of ARSA enzymatic activity in HEK293T cell lysate after pAAV-ARSA transfection; (b) Western blot analysis of ARSA proteins in native and genetically modified HEK293T pAAV-ARSA.
Figure 2.
(a) Analysis of ARSA enzymatic activity in HEK293T cell lysate after pAAV-ARSA transfection; (b) Western blot analysis of ARSA proteins in native and genetically modified HEK293T pAAV-ARSA.
Figure 3.
(a) Analysis of ARSA enzymatic activity in HEK293T cells lysate following AAV9-ARSA transduction. (b) Western blot analysis of ARSA proteins in native and genetically modified HEK293T AAV9-ARSA. (c) Determination of overall purity of AAV-ARSA by SDS-PAGE protein electrophoresis, where VP1, VP2, VP3 are viral proteins.
Figure 4.
Analysis of ARSA enzymatic activity in plasma and CSF of minipig gc following AAV9-ARSA administration. Data are presented as mean ± S.D. * – p < 0.05, ** – p < 0.01, *** – p < 0.001. IT AAV9-ARSA – intrathecal administration of AAV9-ARSA; IV AAV9-ARSA – intravenous administration of AAV9-ARSA.
Figure 5.
Analysis of ARSA enzymatic activity in homogenates of various organ parts of the minipigs’ nervous system following administration of AAV9-ARSA. Data are presented as mean ± S.D. * – p < 0.05, ** – p < 0.01. Control – control group of animals; IT AAV9-ARSA – intrathecal administration of AAV9-ARSA; IV AAV9-ARSA – intravenous administration of AAV9-ARSA.
Figure 6.
Copy number of ARSA gene mRNA in different parts of the nervous system of minipigs on the 35th day following AAV9-ARSA administration. Data obtained by quantitative PCR. Data are presented as mean ± S.D. (a) following intrathecal administration of AAV9-ARSA; (b) following intravenous administration of AAV9-ARSA.
Figure 7.
Biochemical parameters of the minipigs’ blood sera following AAV9-ARSA administration. IT AAV9-ARSA - intrathecal administration of AAV9-ARSA, IV AAV9-ARSA - intravenous administration of the AAV9-ARSA vector. * p <0.05, ** p < 0.01.
Figure 7.
Biochemical parameters of the minipigs’ blood sera following AAV9-ARSA administration. IT AAV9-ARSA - intrathecal administration of AAV9-ARSA, IV AAV9-ARSA - intravenous administration of the AAV9-ARSA vector. * p <0.05, ** p < 0.01.
Figure 8.
Analysis of inflammatory cytokines and chemokines levels following intrathecal and intravenous administration of AAV9-ARSA. (a) Cytokine profile of porcine blood serum. (b) Cytokine profile of porcine CSF. IT AAV9-ARSA - intrathecal administration of AAV9-ARSA, IV AAV9-ARSA - intravenous administration of AAV9-ARSA.
Figure 9.
Pathological analysis of kidney, heart, spleen, and lungs tissues in the control and experimental groups on the 35th day following AAV9-ARSA administration. Staining with hematoxylin and eosin. Control – control group of animals, IT AAV9-ARSA - intrathecal administration of AAV9-ARSA, IV AAV9-ARSA - intravenous administration of the AAV9-ARSA vector.
Figure 10.
Assessment of ARSA (yellow) expression in different regions of nervous tissue in the control group of animals (A-F), and in experimental groups 1 and 2 on day 35 after intrathecal (A1-F1), and intravenous (A2-F2) administration of AAV9-ARSA, respectively. Nuclei are stained with DAPI (blue). Scale bar: 50 µm. Control – control group of animals; IT AAV9-ARSA - intrathecal administration of AAV9-ARSA, IV AAV9-ARSA - intravenous administration of AAV9-ARSA vector.
