Submitted:
18 April 2023
Posted:
19 April 2023
You are already at the latest version
Abstract

Keywords:
1. Introduction
2. Experimental details
3. Results and discussion
3.1. EDS and XRD analyses
3.2. Vibrational analysis
3.3. Uv-vis. analysis
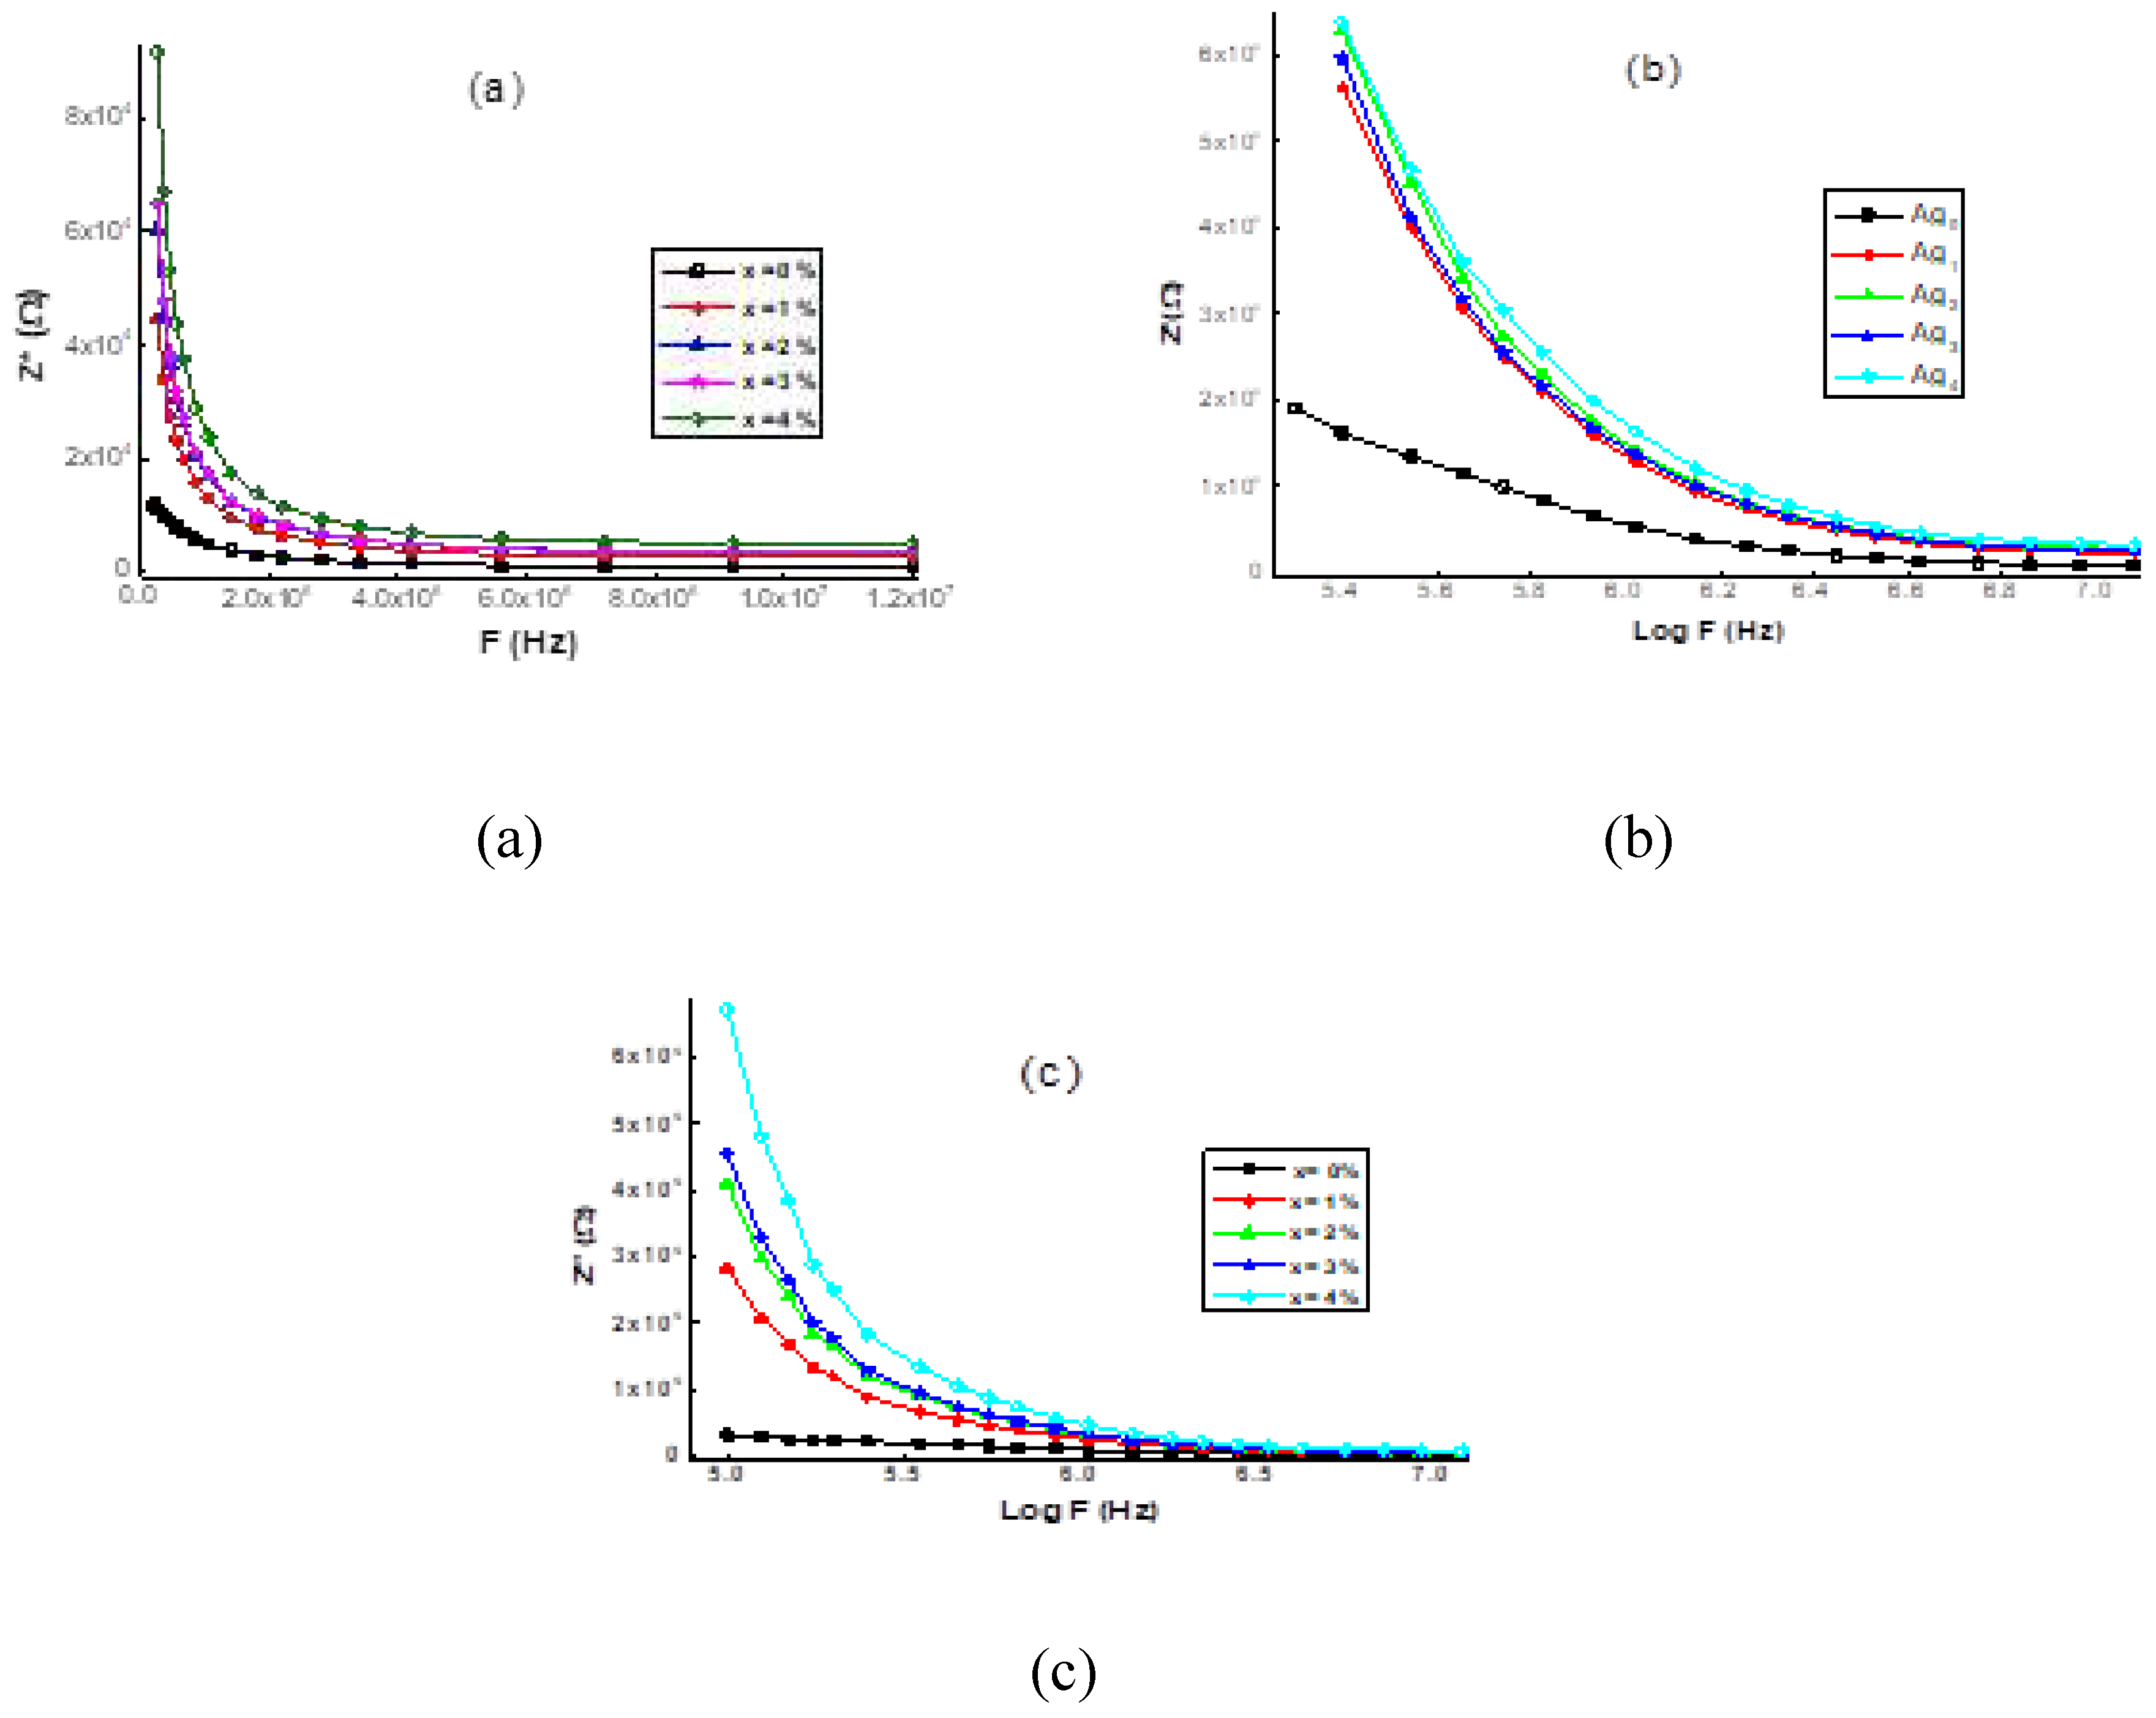
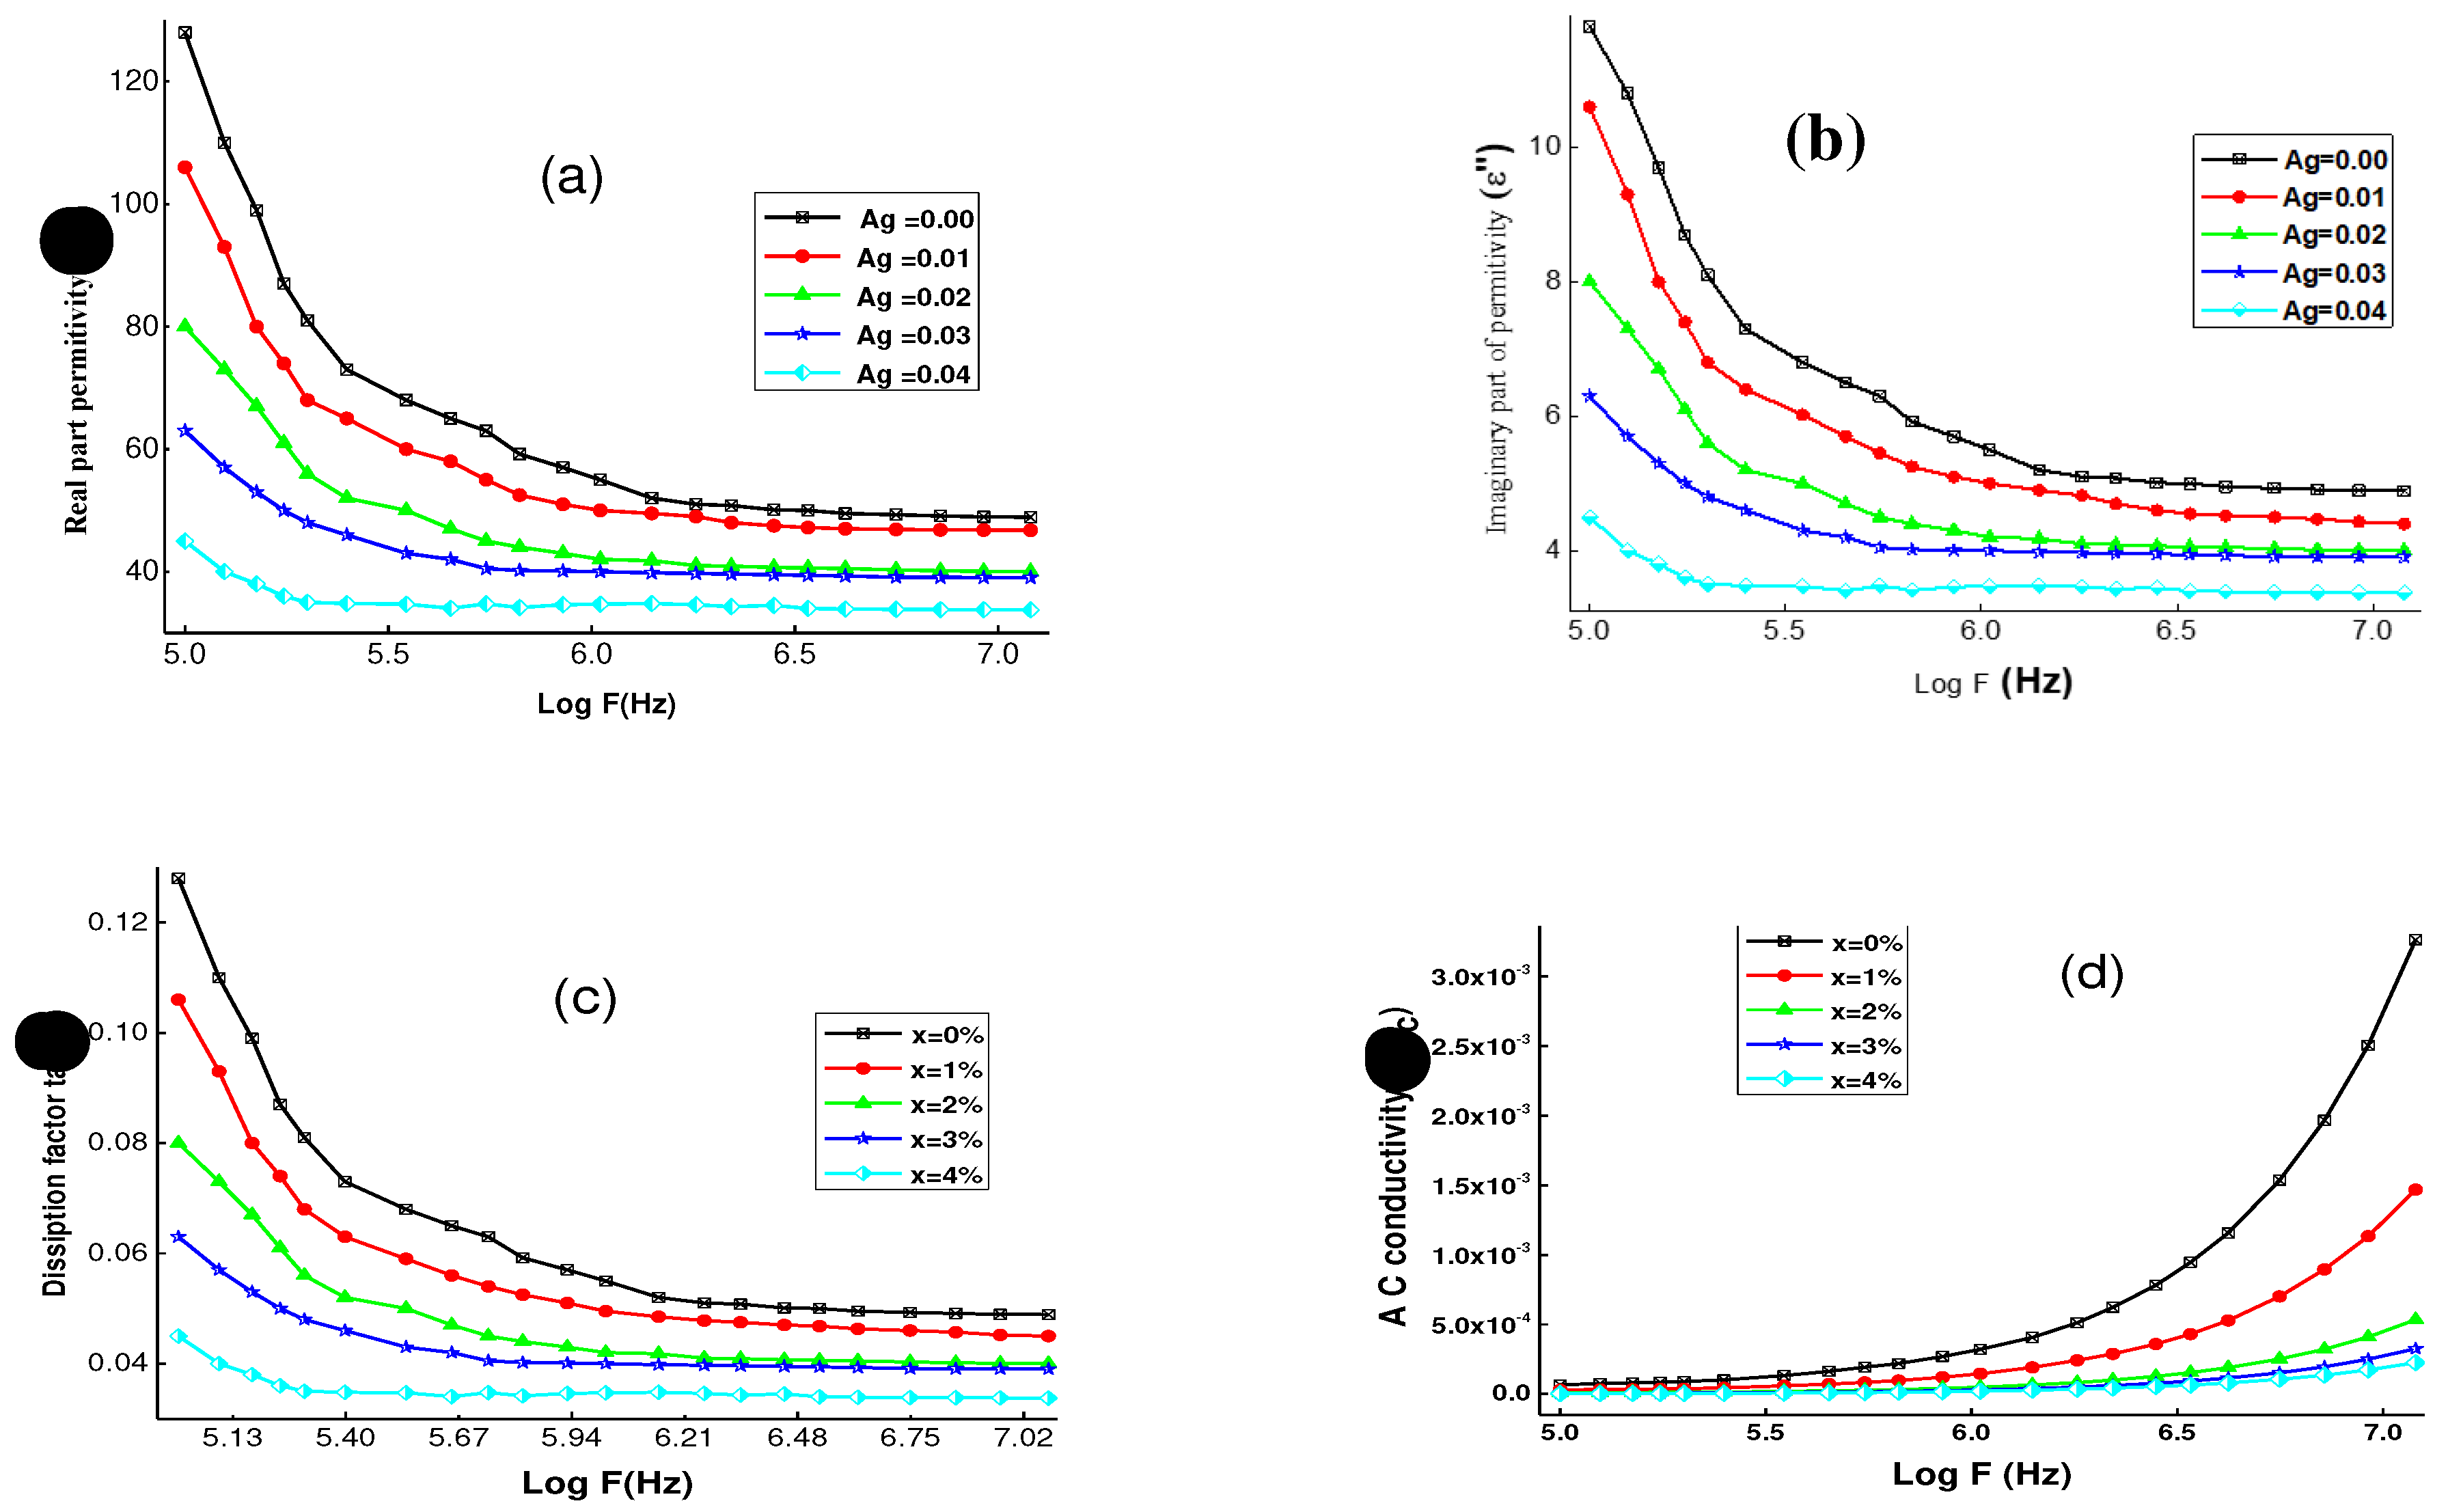
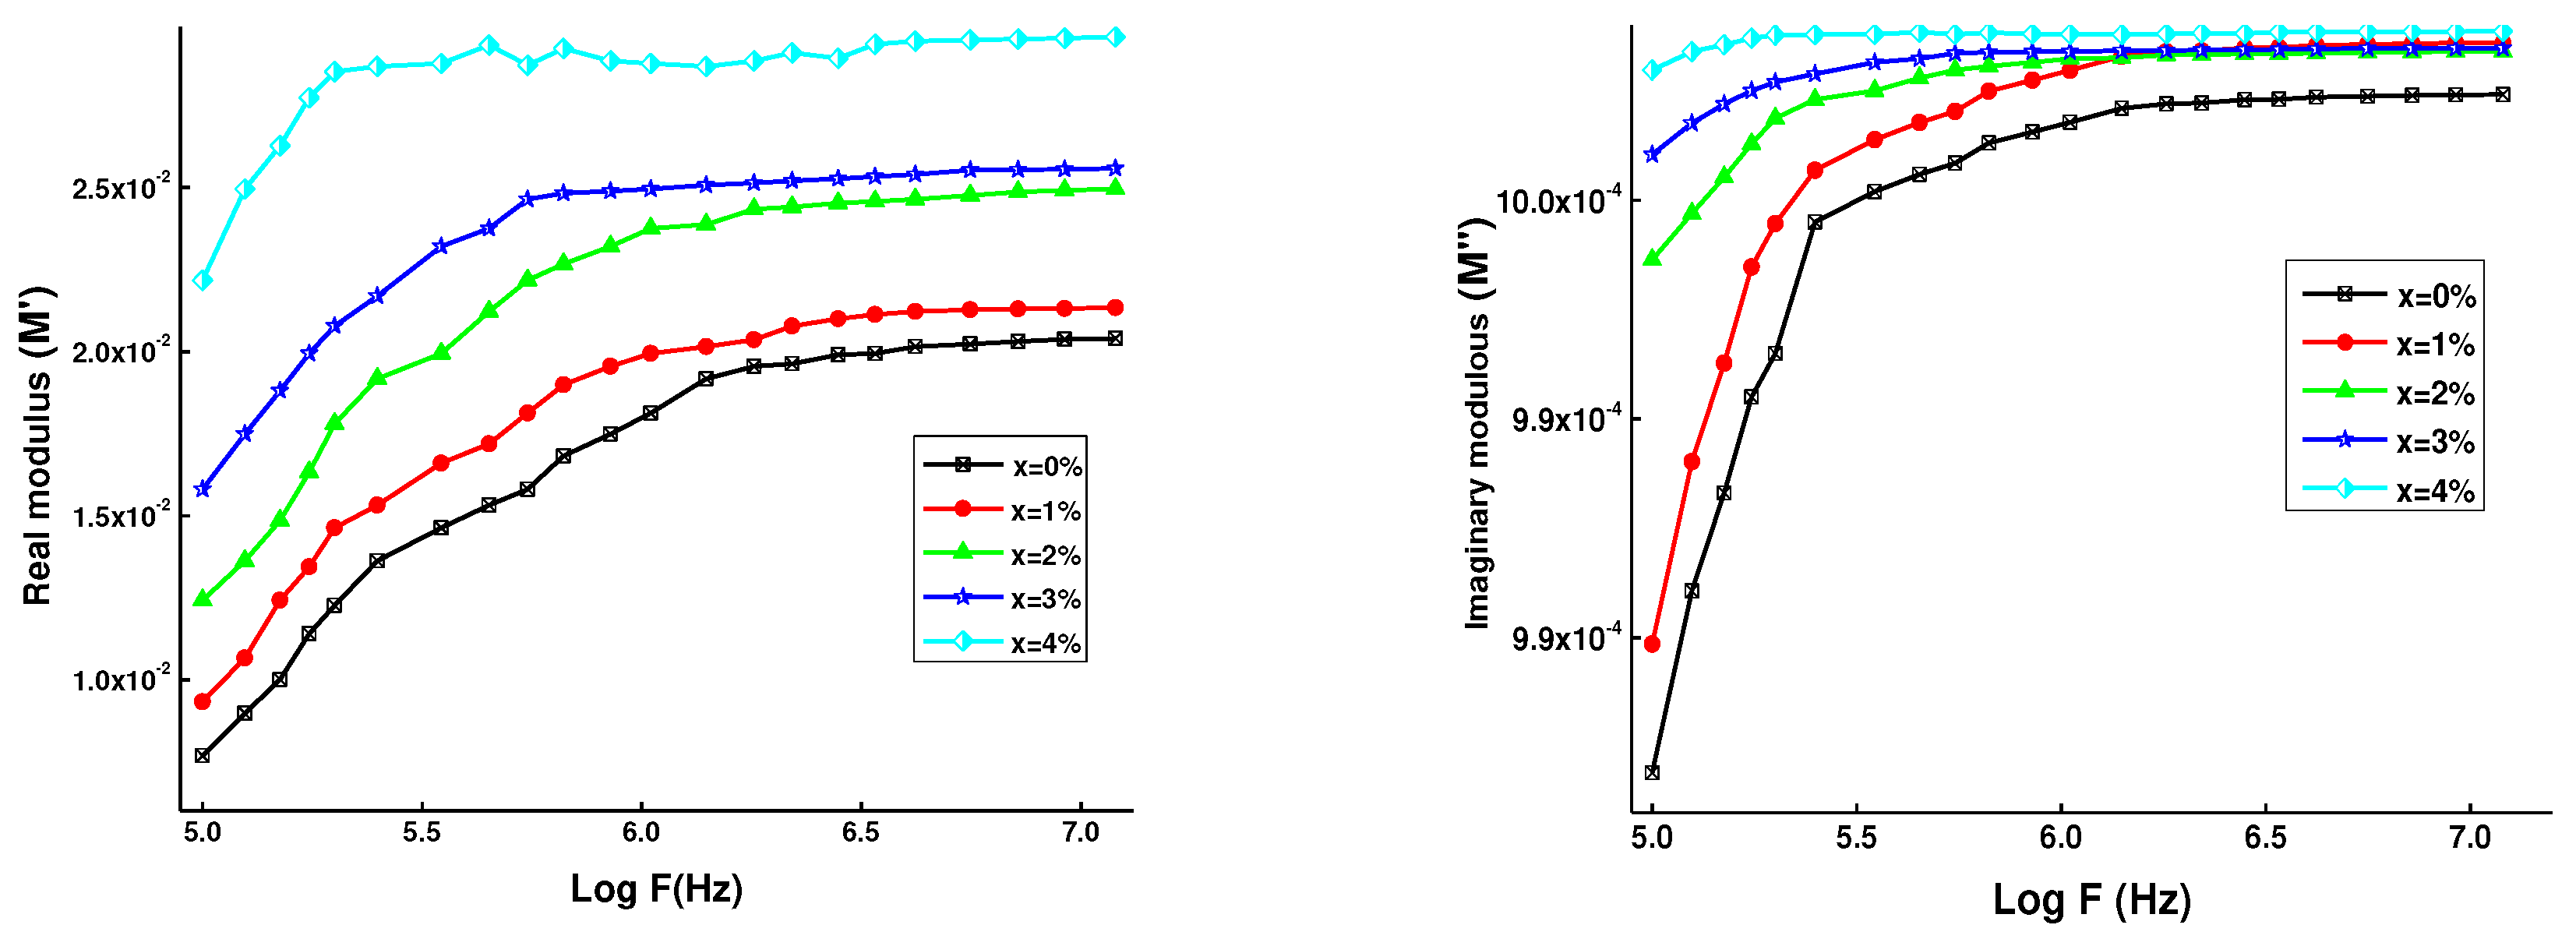
3.4. Dielectric analysis
Conclusion
Acknowledgments
References
- S. Gotbi, et al., Infrastructures, 7 (2022) 97.
- S. Yanagiya, et al., Materials 3 (2010) 318.
- M. V. Lalic, et al., Braz. J. Phys. 34 (2004) 611.
- C. K. Ghosh, et al., J. Mater. Sci. 46 (2011) 1613.
- K. Park, K.Y. Ko, W.-S. Seo, J. Euro. Ceram. Soc. 25 (2005) 2219–2222.
- M. V. Lalic, et al., J. Phys. Cond. Mater. 14 (2002) 5517.
- J. Cai, H. Gong, J. Appl. Phys. 98 (2005) 033707.
- H. Kawazoe, et al., Nature 389 (1997) 939–942.
- B. J. Abdullah, Mater. Sci. Semicond. Proc. 137 (2022) 106214.
- J. F. H. L. Monteiro, et al., Ceramic Inter. 44 (2018) 14101-14107.
- P.P. Sahay, et al., Curr. Appl. Phys. 13 (2013) 479-486.
- Zulfiqar, et al., Ceram. Int. 42 (2016)17128.
- T. Sahu, B. Behera, J. Mater. Sci.: Mater. Electron. 29 (2018) 7412–7424.
- N. Dodiya, D. Varshney, J. Molecular Structure 1031 (2013) 104–109.
- S. Pantian, et al., Current Apllied Physics 17 (2017) 1264-1270.
- E.M.M. Ibrahim et al., J. Alloy. Compd. 804 (2019) 272-280.
- K. Park et al., Mater. Sci. Eng. B 129 (2006) 1–7.
- S. Shibasaki, et al., Phys. Rev. B 74 (2006) 235110.
- S.A. Saleh, J. Taibah Uni. Sci., 16 (2022) 280-287.
- S.A. Saleh, Mate. Sci. Appl. 2 (2011) 950.
- J. Pellicer-Porres, et al., Phys. Rev. B 74 (2006) 184301.
- D. Bhattacharya et al., Ceramics International 47 (2021) 9907-9922.
- N. P. Salke, et al., Vibrational Spectroscopy 81 (2015) 112-118.
- M. Aziziha, et al., J. Phys. Chem. C 123 (2019) 30604-30612.
- A. Yassin, et al., J. Phys. D Appl. Phys. 46 (2013).
- Aktas, et al., J. Phys-Condens Mat, (2012) 24.
- R. Seoudi, et al., J. Electron. Mater. 44 (2015) 3367-3374.
- T. Prakash, et al., J. Nanosc. Nanotechnol., 8 (2008) 4273-4278.
- M. Aqeel, et al., Appl. Nanoscience 10 (2020) 2045-2055.
- P.O. Offor, et al., J. Solid State Electrochem 21 (2017) 2687-2697.
- Y. Chuai, et al., J. Mater. Sci. 51 (2016) 3592-3599.
- B. Saha et al., Mater. Lett. 63 (2009) 394-396.
- H.M. Ali, and S.A. Saleh, Thin Solid Films 556 (2013) 552-559.
- S.A. Saleh, et al, Physica Scripta 84 (2011) 015604.
- B. Nandan, et al, J Nanopart Res 15 (2013) 1999.
- V. Senthilkumara, et al, Philo. Mag. Lett. 90 (5), (2010) 337.
- S. Traiphop, et al., Chiang Mai J. Sci., 49 (2022) 205-216.
- S.T. Hayle, and G.G. Gonfa, Amer. J. Nanosci. Nanotechn., 2 (2014) 1.
- N. Ahmad, et al., Ceram. Int. 44 (2018)15972–15980.
- W. Ben Soltan, et al., J. Mater. Sci. Mater. Electron. 28 (2017) 6649-6656.
- S.T. Dadami et al. Ceramics International 43 (2017) 16684–16692.
- S. Mohanty, et al., J Mater Sci: Mater Electron (2015) 26:9640–9648.
- K.P. Padmasree, A.F. Fuentes, Mater. Chem. Phys. 223 (2019) 466–472.
- T. Bhasin et al., J. Alloys Compd. 748 (2018) 1022-1030.
- M. Javed Iqbal, et al., J. Appl. Phys. 111 (2012).
- S. Naseem et al., J. Magn. Magn. Mater. 447 (2018) 155–166.
- M. Mehedi Hassan et al., Mater. Res. Bull. 47 (2012) 3952–3958.
- H.B. Sharma, et al., J. Alloy. Compd. 599 (2014) 32–39.
- W. Shockley, W.T. Read, Phys. Rev. 87 (1952) 835–42.
- S. Mehraj and M.S. Ansari, Phys. E Low-dimensional Syst. Nanostructures 65 (2015) 84–92.
- Md. R. Islam et al., J. Alloys Compd. 735 (2018) 2584-2596.
- K. Rajwali, et al., Chinese Phys. B 24 (2015) 127803.
- R. Khan, et al., J. Mater. Sci. Mater. Electron. 27 77 (2016) 25–30.
- N. Ahmad, S. Khan, M.M.N. Ansari, Mater. Res. Express 5 (2018) 035045.
- M.A. El-Hiti, J. Phys. D: Appl. Phys. 29 (1996) 501–504.
- Saleh et al., J. nanoparticles research, 22 (2020) 4763.
- P.T. Phong et al., Ceramics International 42 (2016) 7414–7421.
- D. Xu et al., J. Alloys Compd. 773 (2019) 853-859.

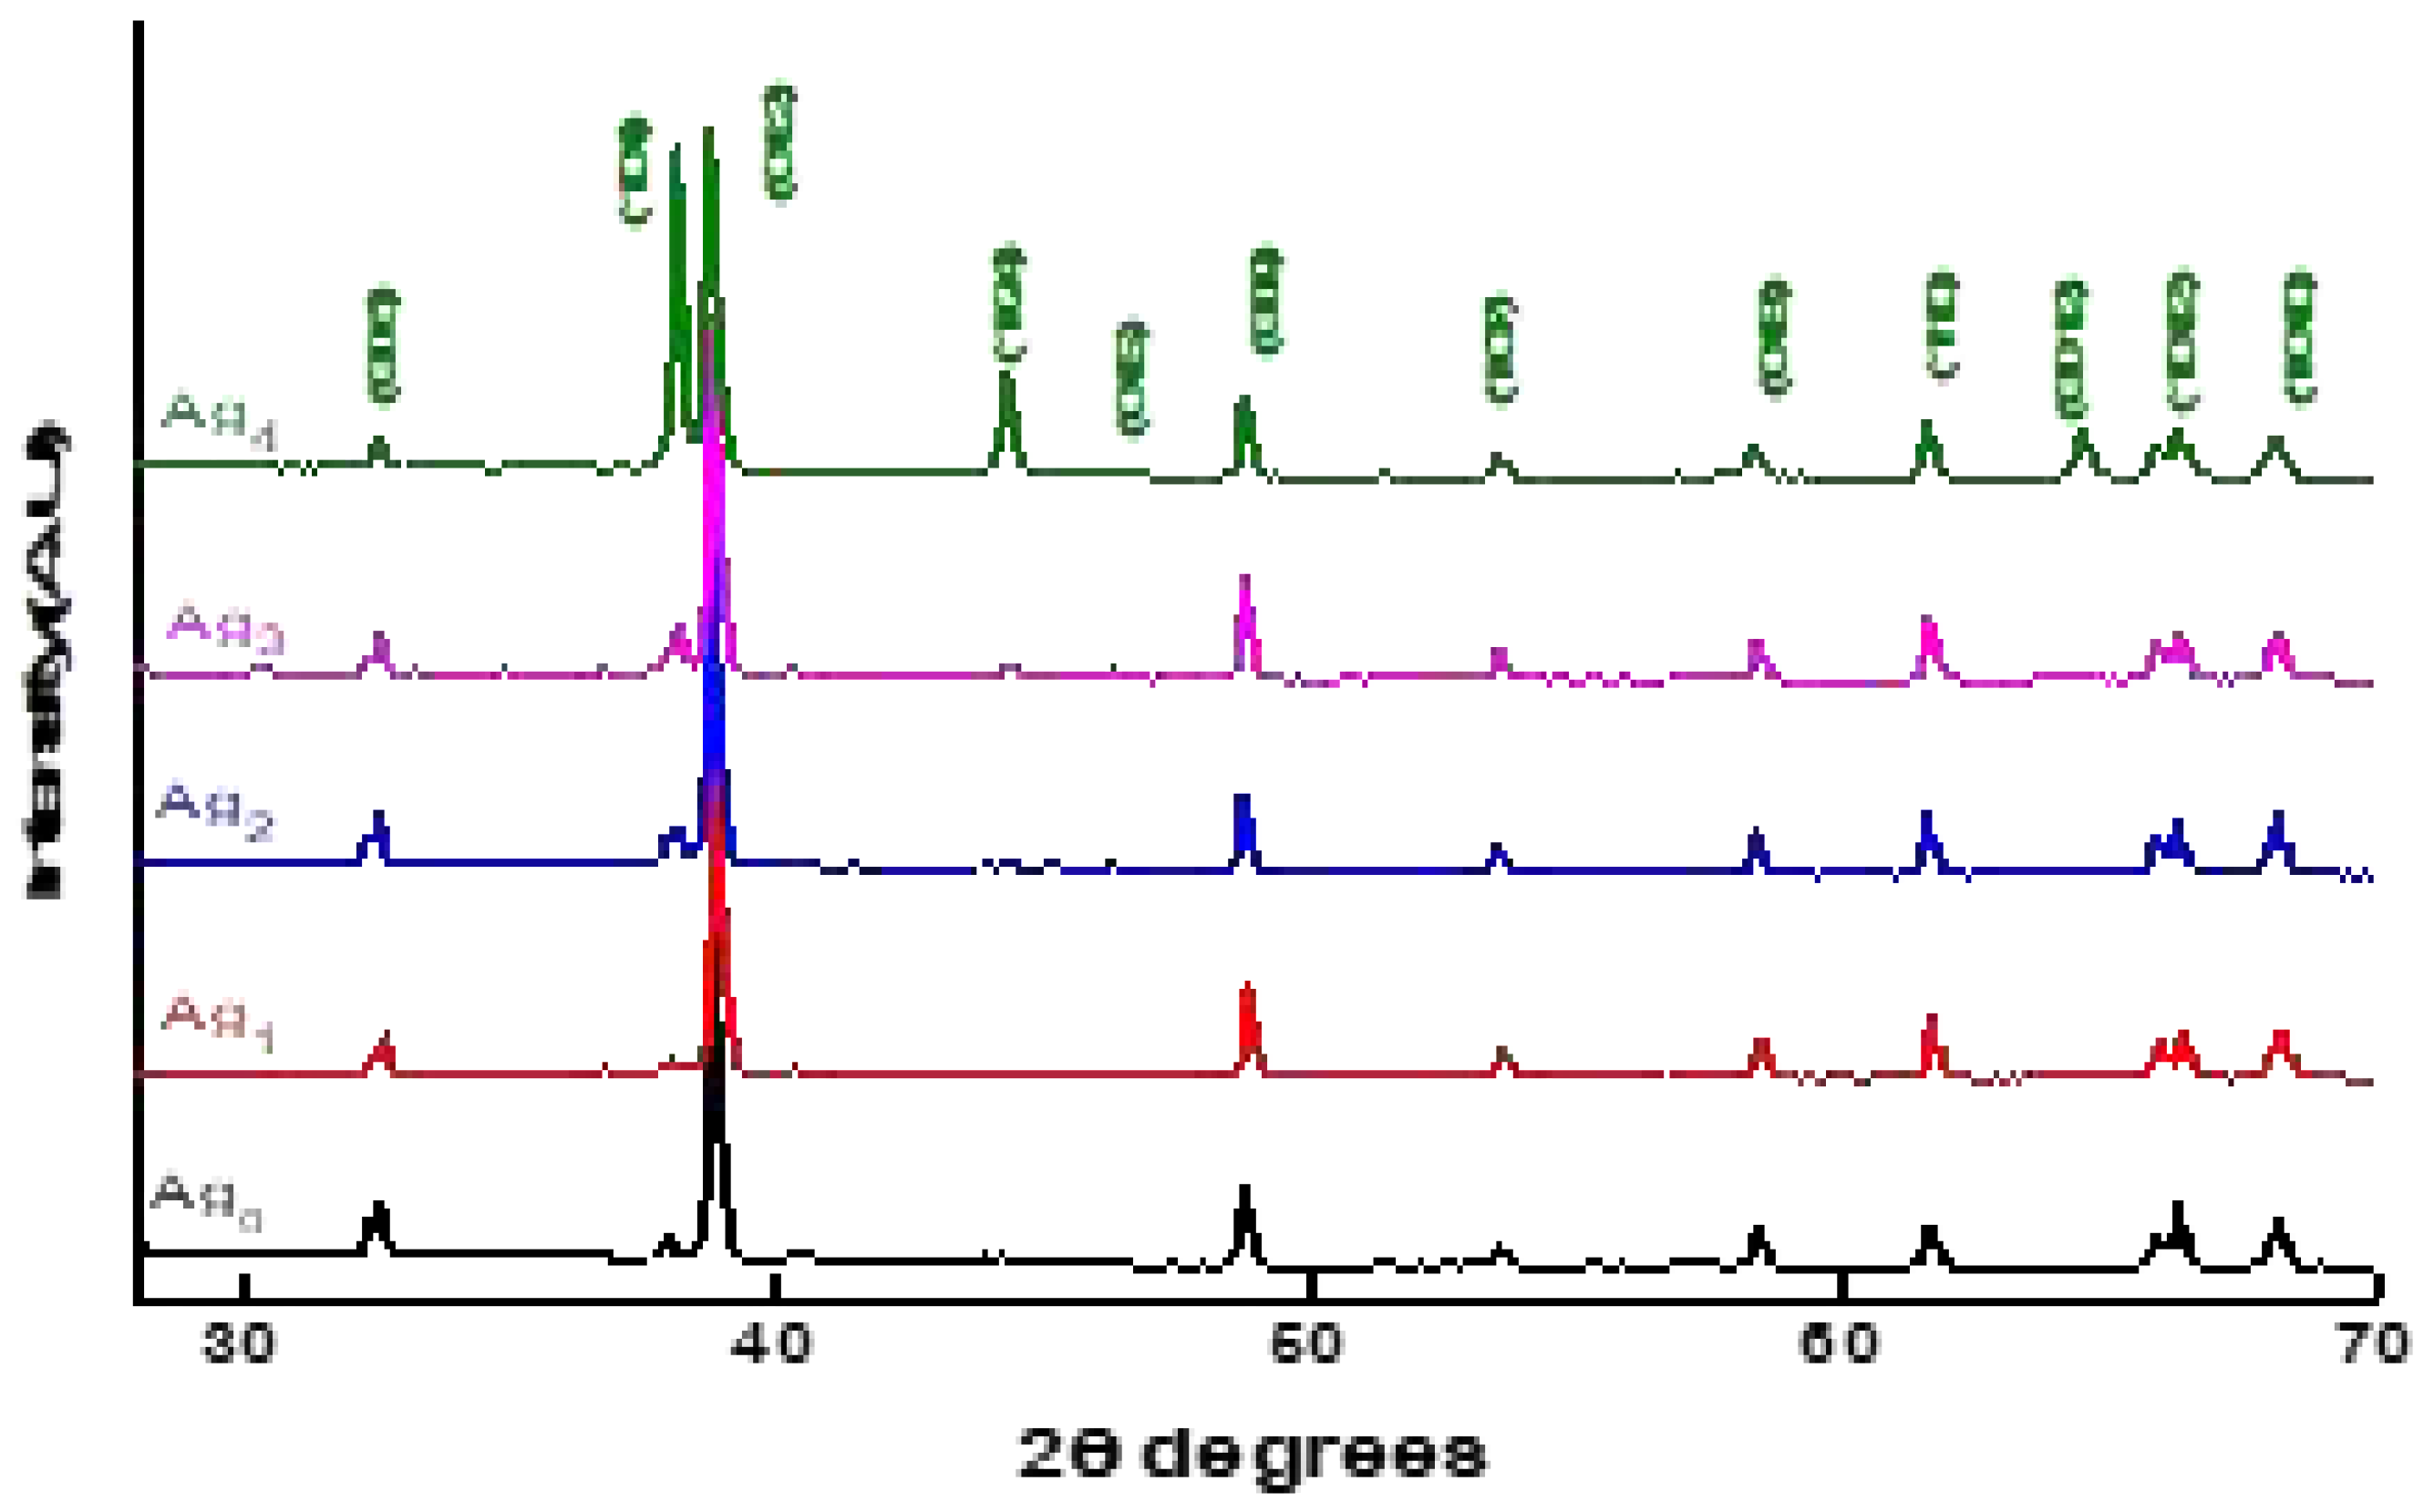
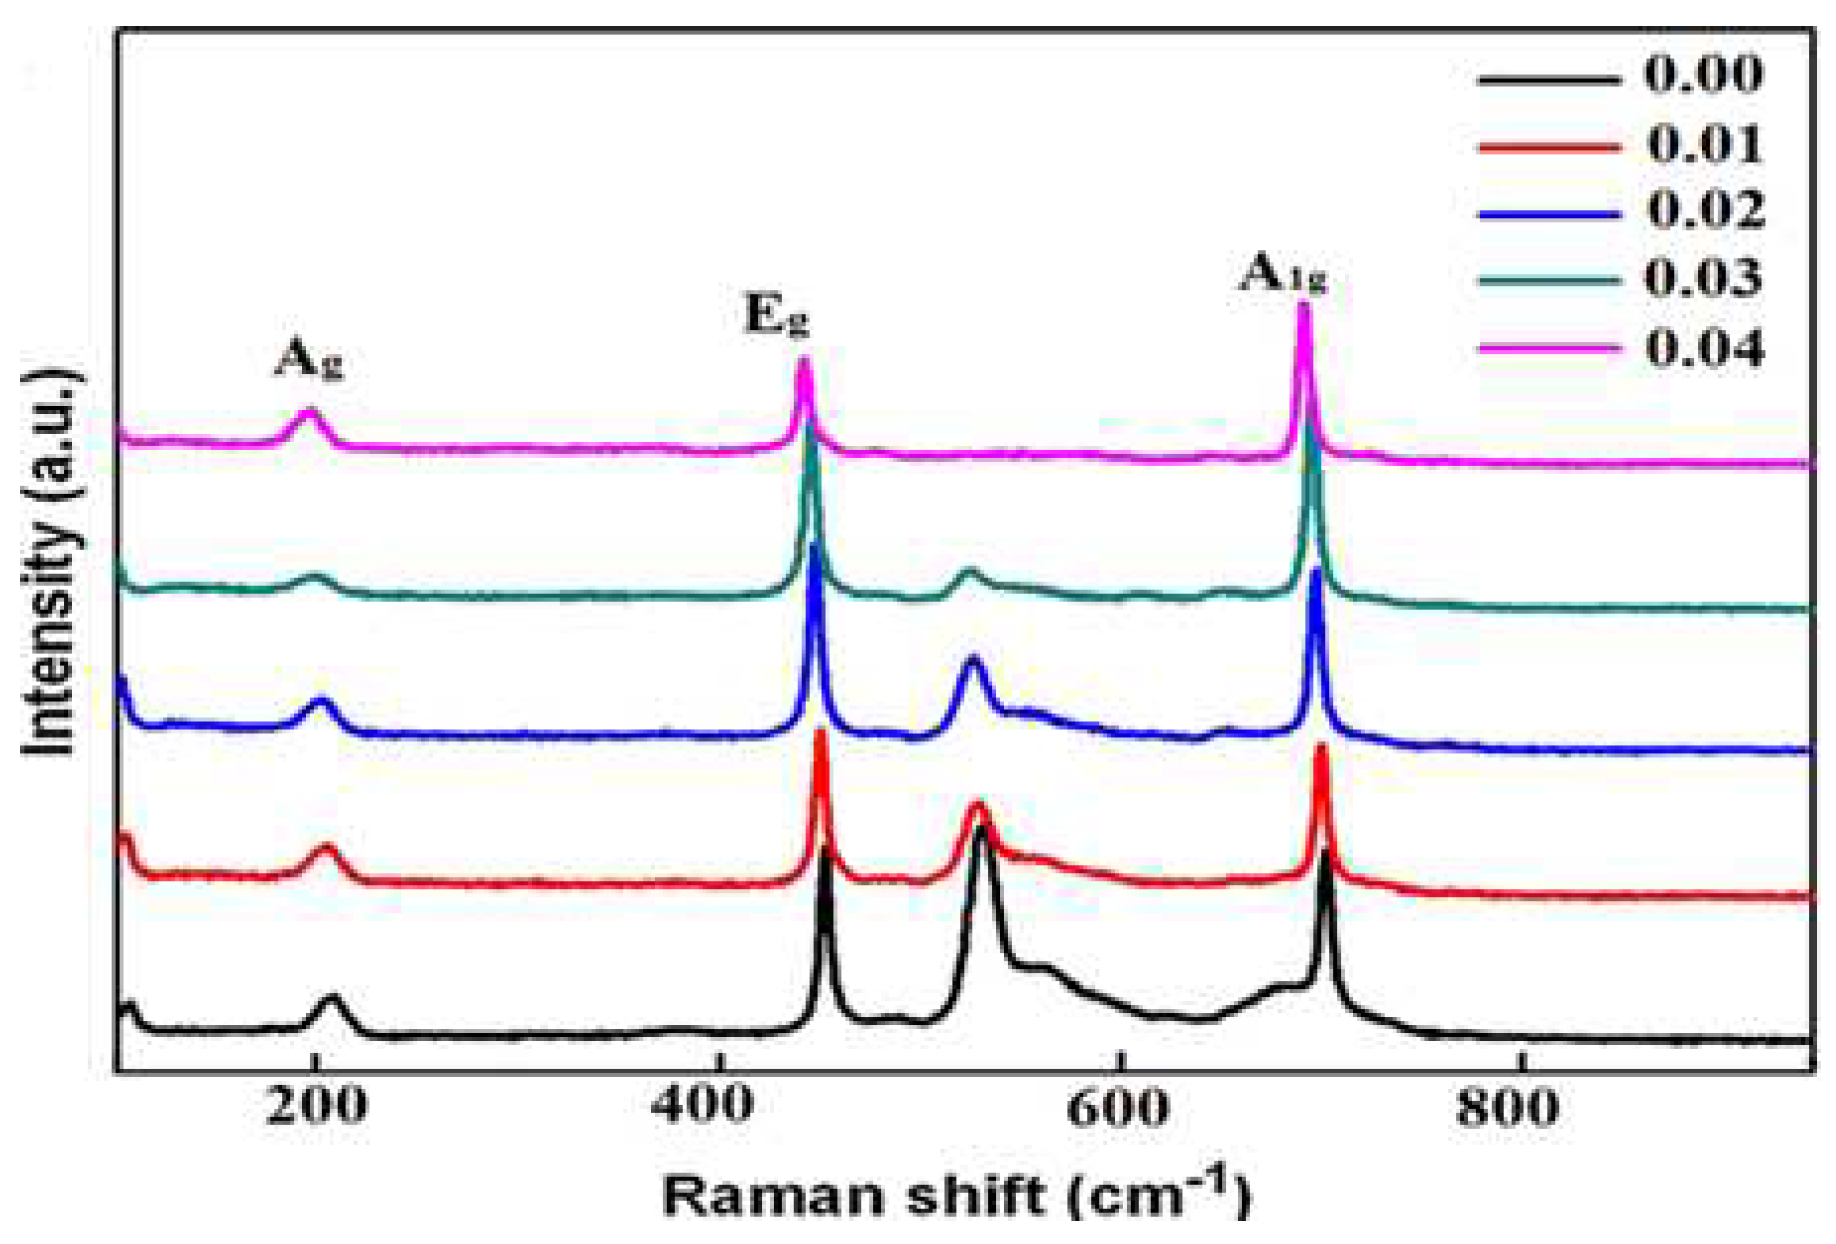

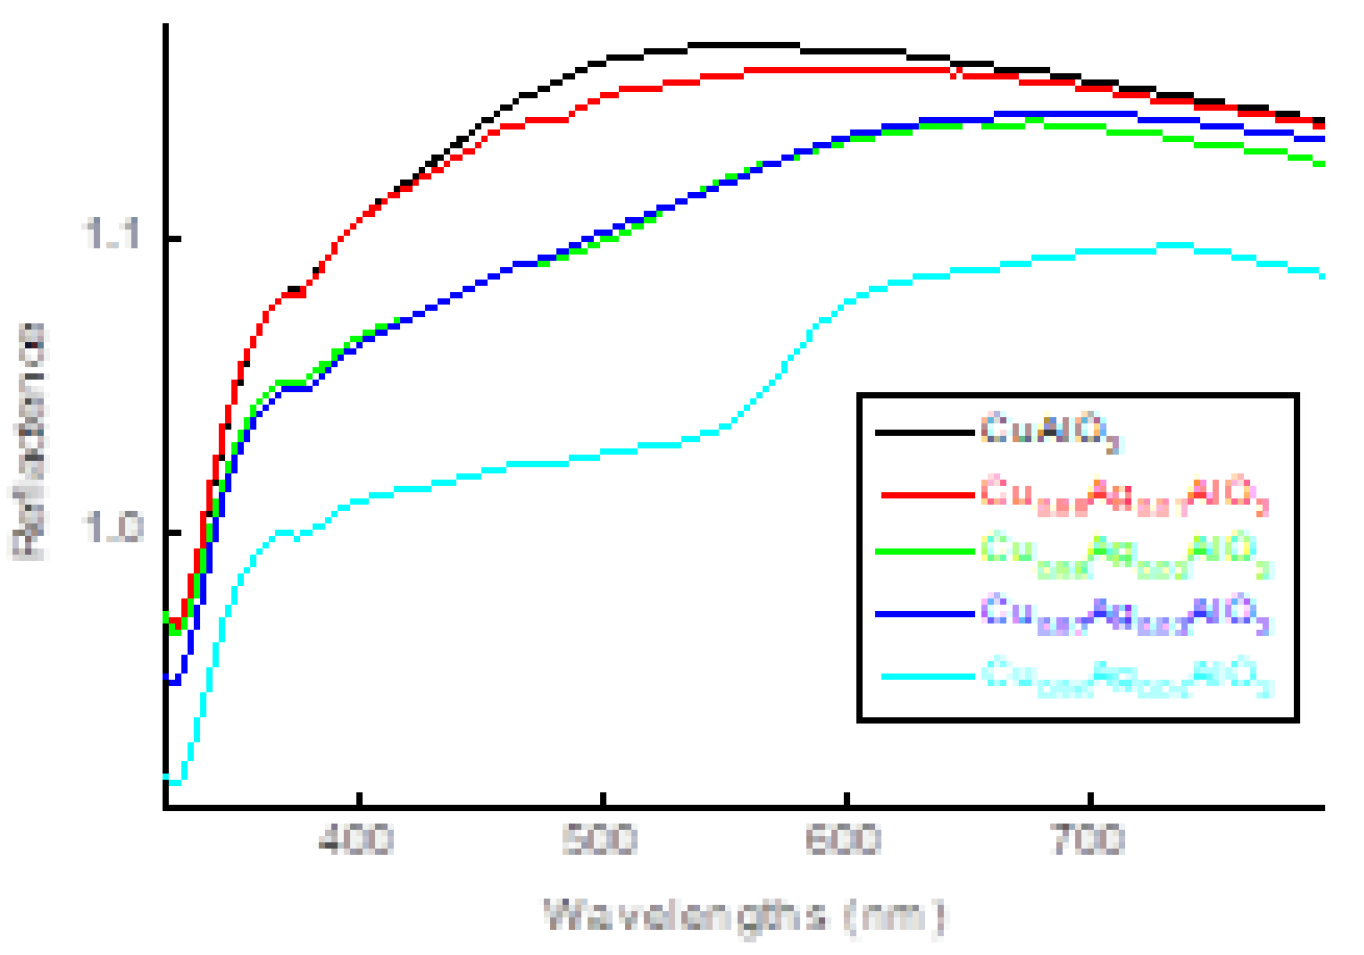
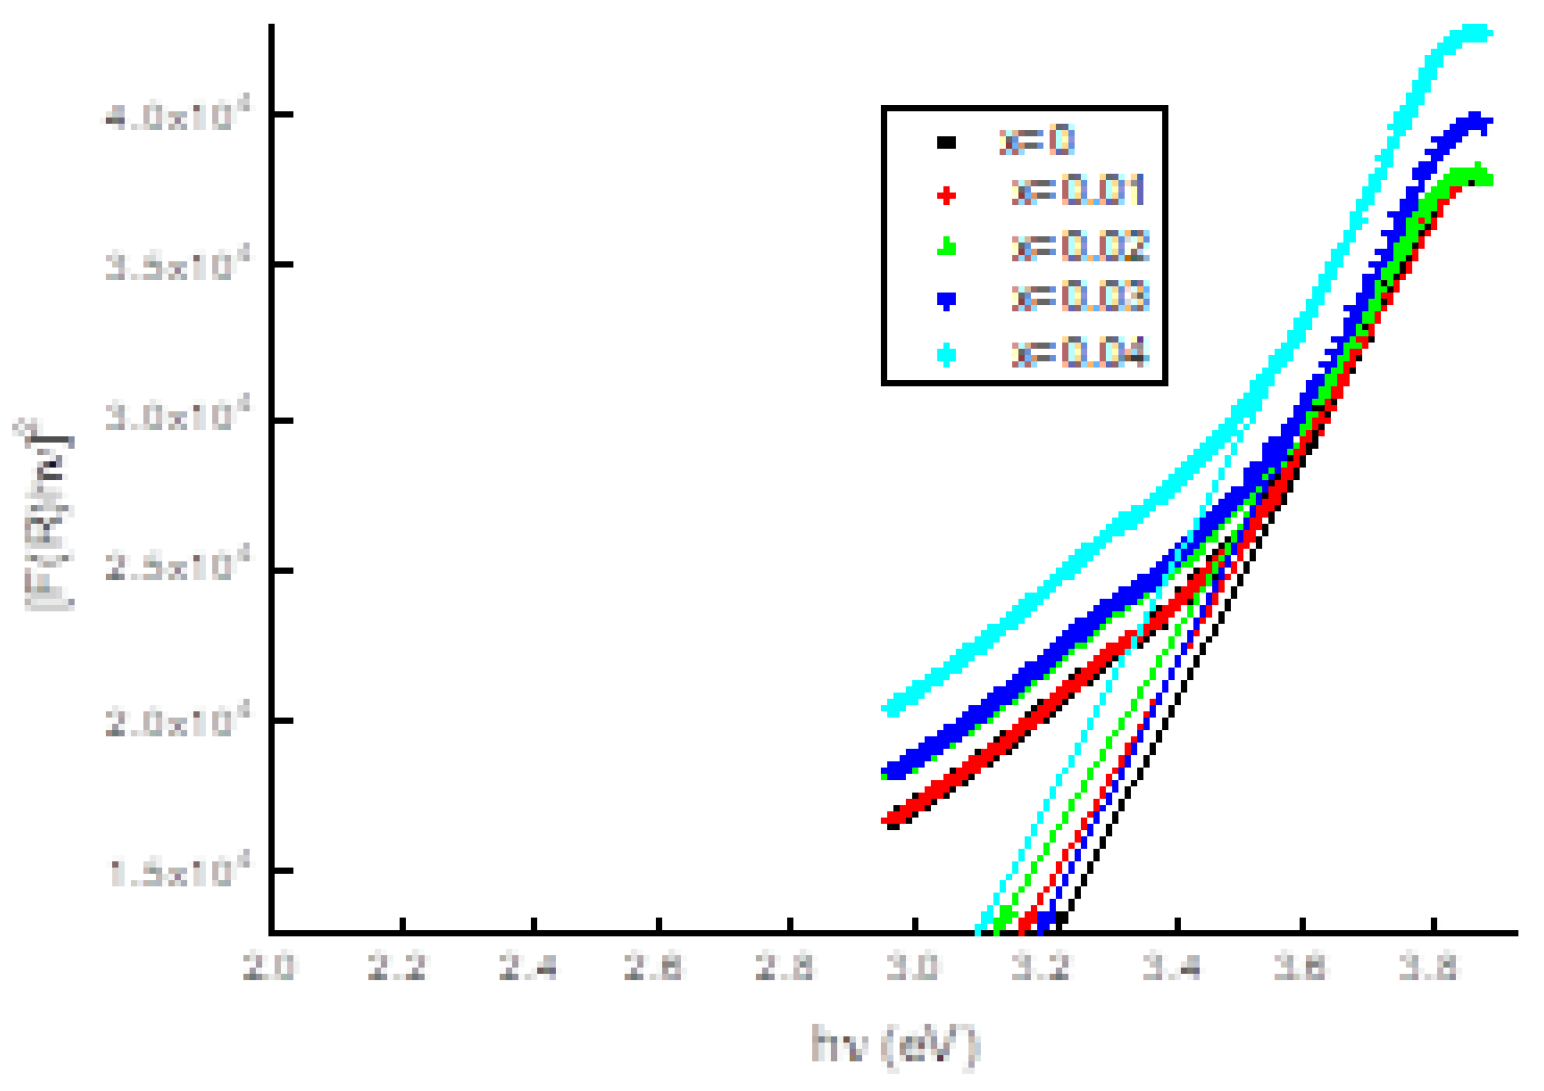
| name | δ (nm) | ε∗1012 (cm-2) | a-axis length (Å) | c-axis length (Å) | V (Å3) | EOpt.(eV) |
|---|---|---|---|---|---|---|
| CuAlO2 | 45 | 4.94 | 3.0586 | 17.169 | 139.09 | 3.22 |
| Cu0.99Ag0.01AlO2 | 49 | 4.17 | 3.0590 | 17.185 | 139.26 | 3.19 |
| Cu0.98Ag0.02AlO2 | 60 | 2.78 | 3.0596 | 17.223 | 139.63 | 3.16 |
| Cu0.97Ag0.03AlO2 | 78 | 1.64 | 3.0589 | 17.266 | 139.91 | 3.12 |
| Cu0.96Ag0.04AlO2 | 92 | 1.18 | 3.0587 | 17.298 | 140.14 | 3.09 |
Disclaimer/Publisher’s Note: The statements, opinions and data contained in all publications are solely those of the individual author(s) and contributor(s) and not of MDPI and/or the editor(s). MDPI and/or the editor(s) disclaim responsibility for any injury to people or property resulting from any ideas, methods, instructions or products referred to in the content. |
© 2023 by the authors. Licensee MDPI, Basel, Switzerland. This article is an open access article distributed under the terms and conditions of the Creative Commons Attribution (CC BY) license (http://creativecommons.org/licenses/by/4.0/).


