Submitted:
18 April 2023
Posted:
19 April 2023
You are already at the latest version
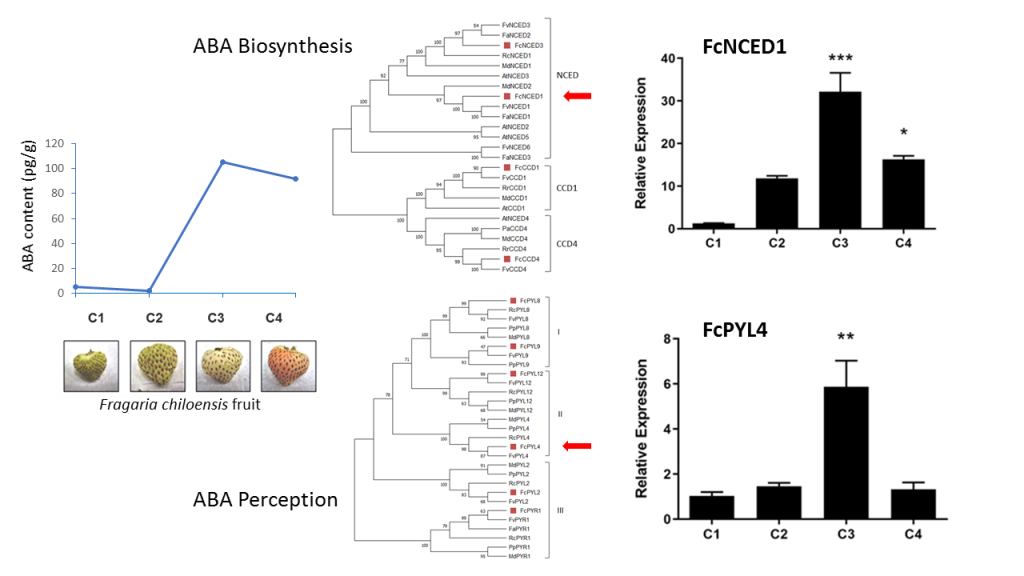
Abstract
Keywords:
1. Introduction
2. Results
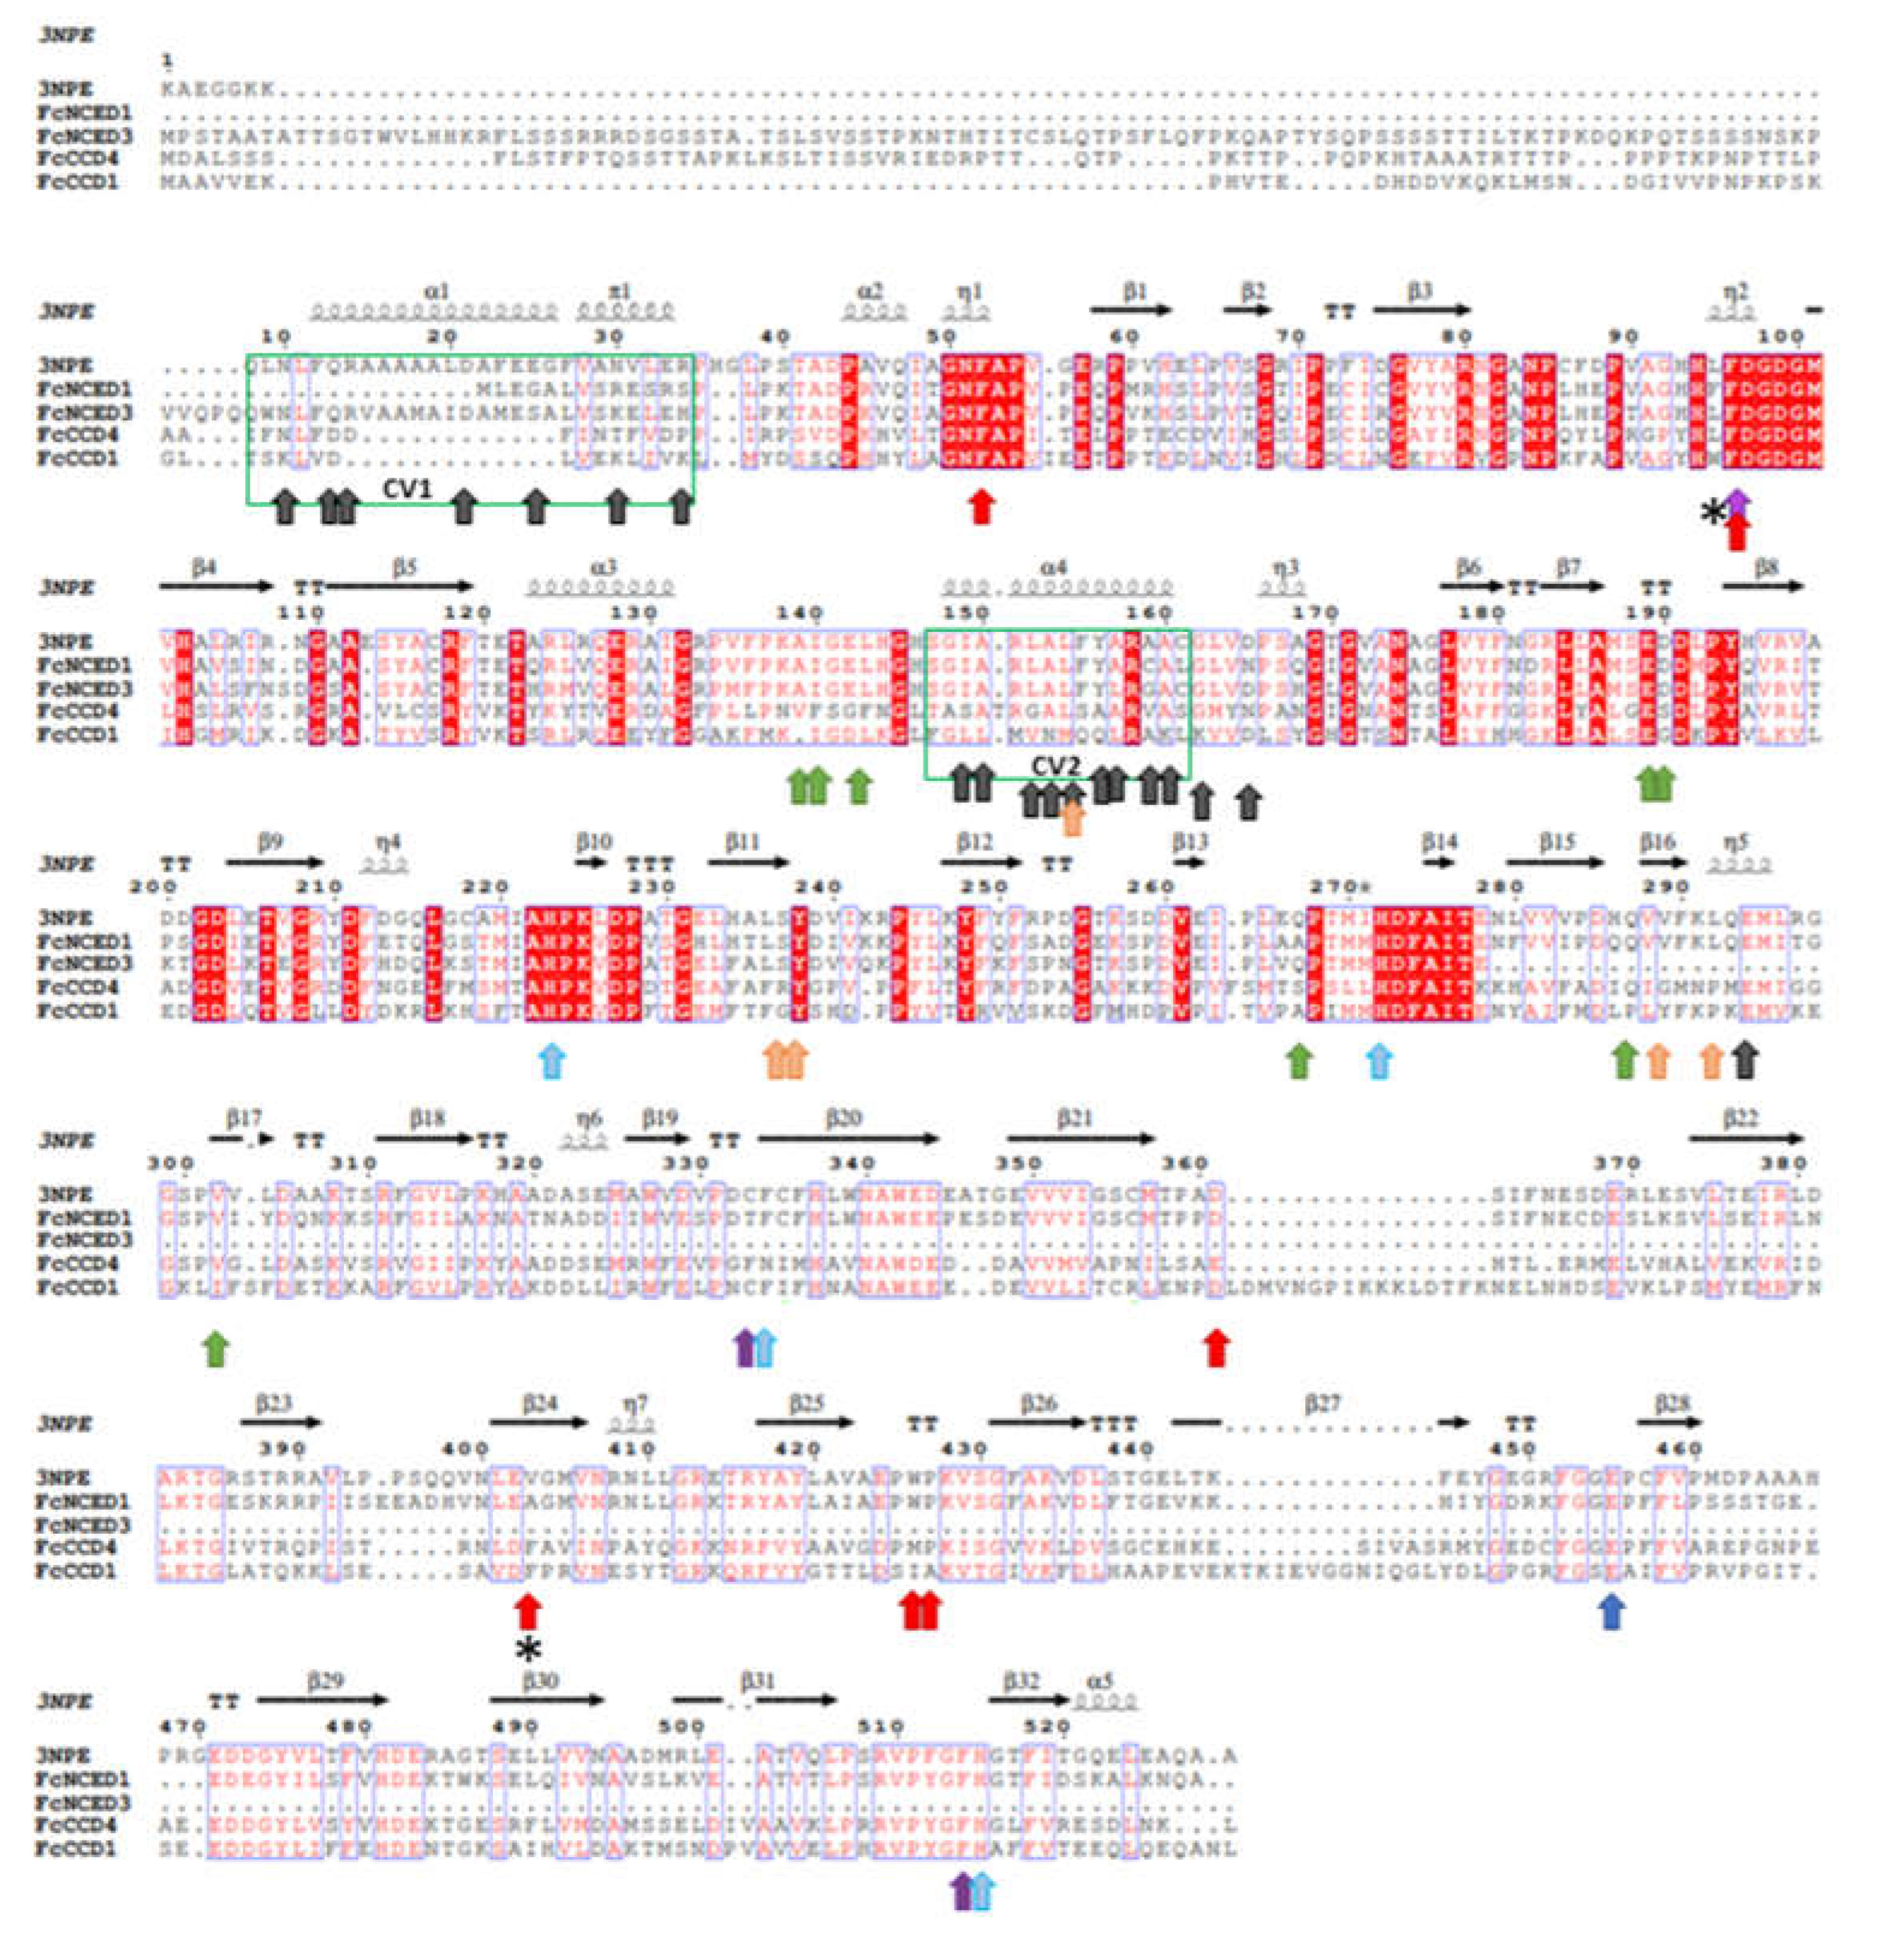
2.1. Identification of FcNCED/Ccds Family Genes and Analysis of Deduced Amino Acid Sequences
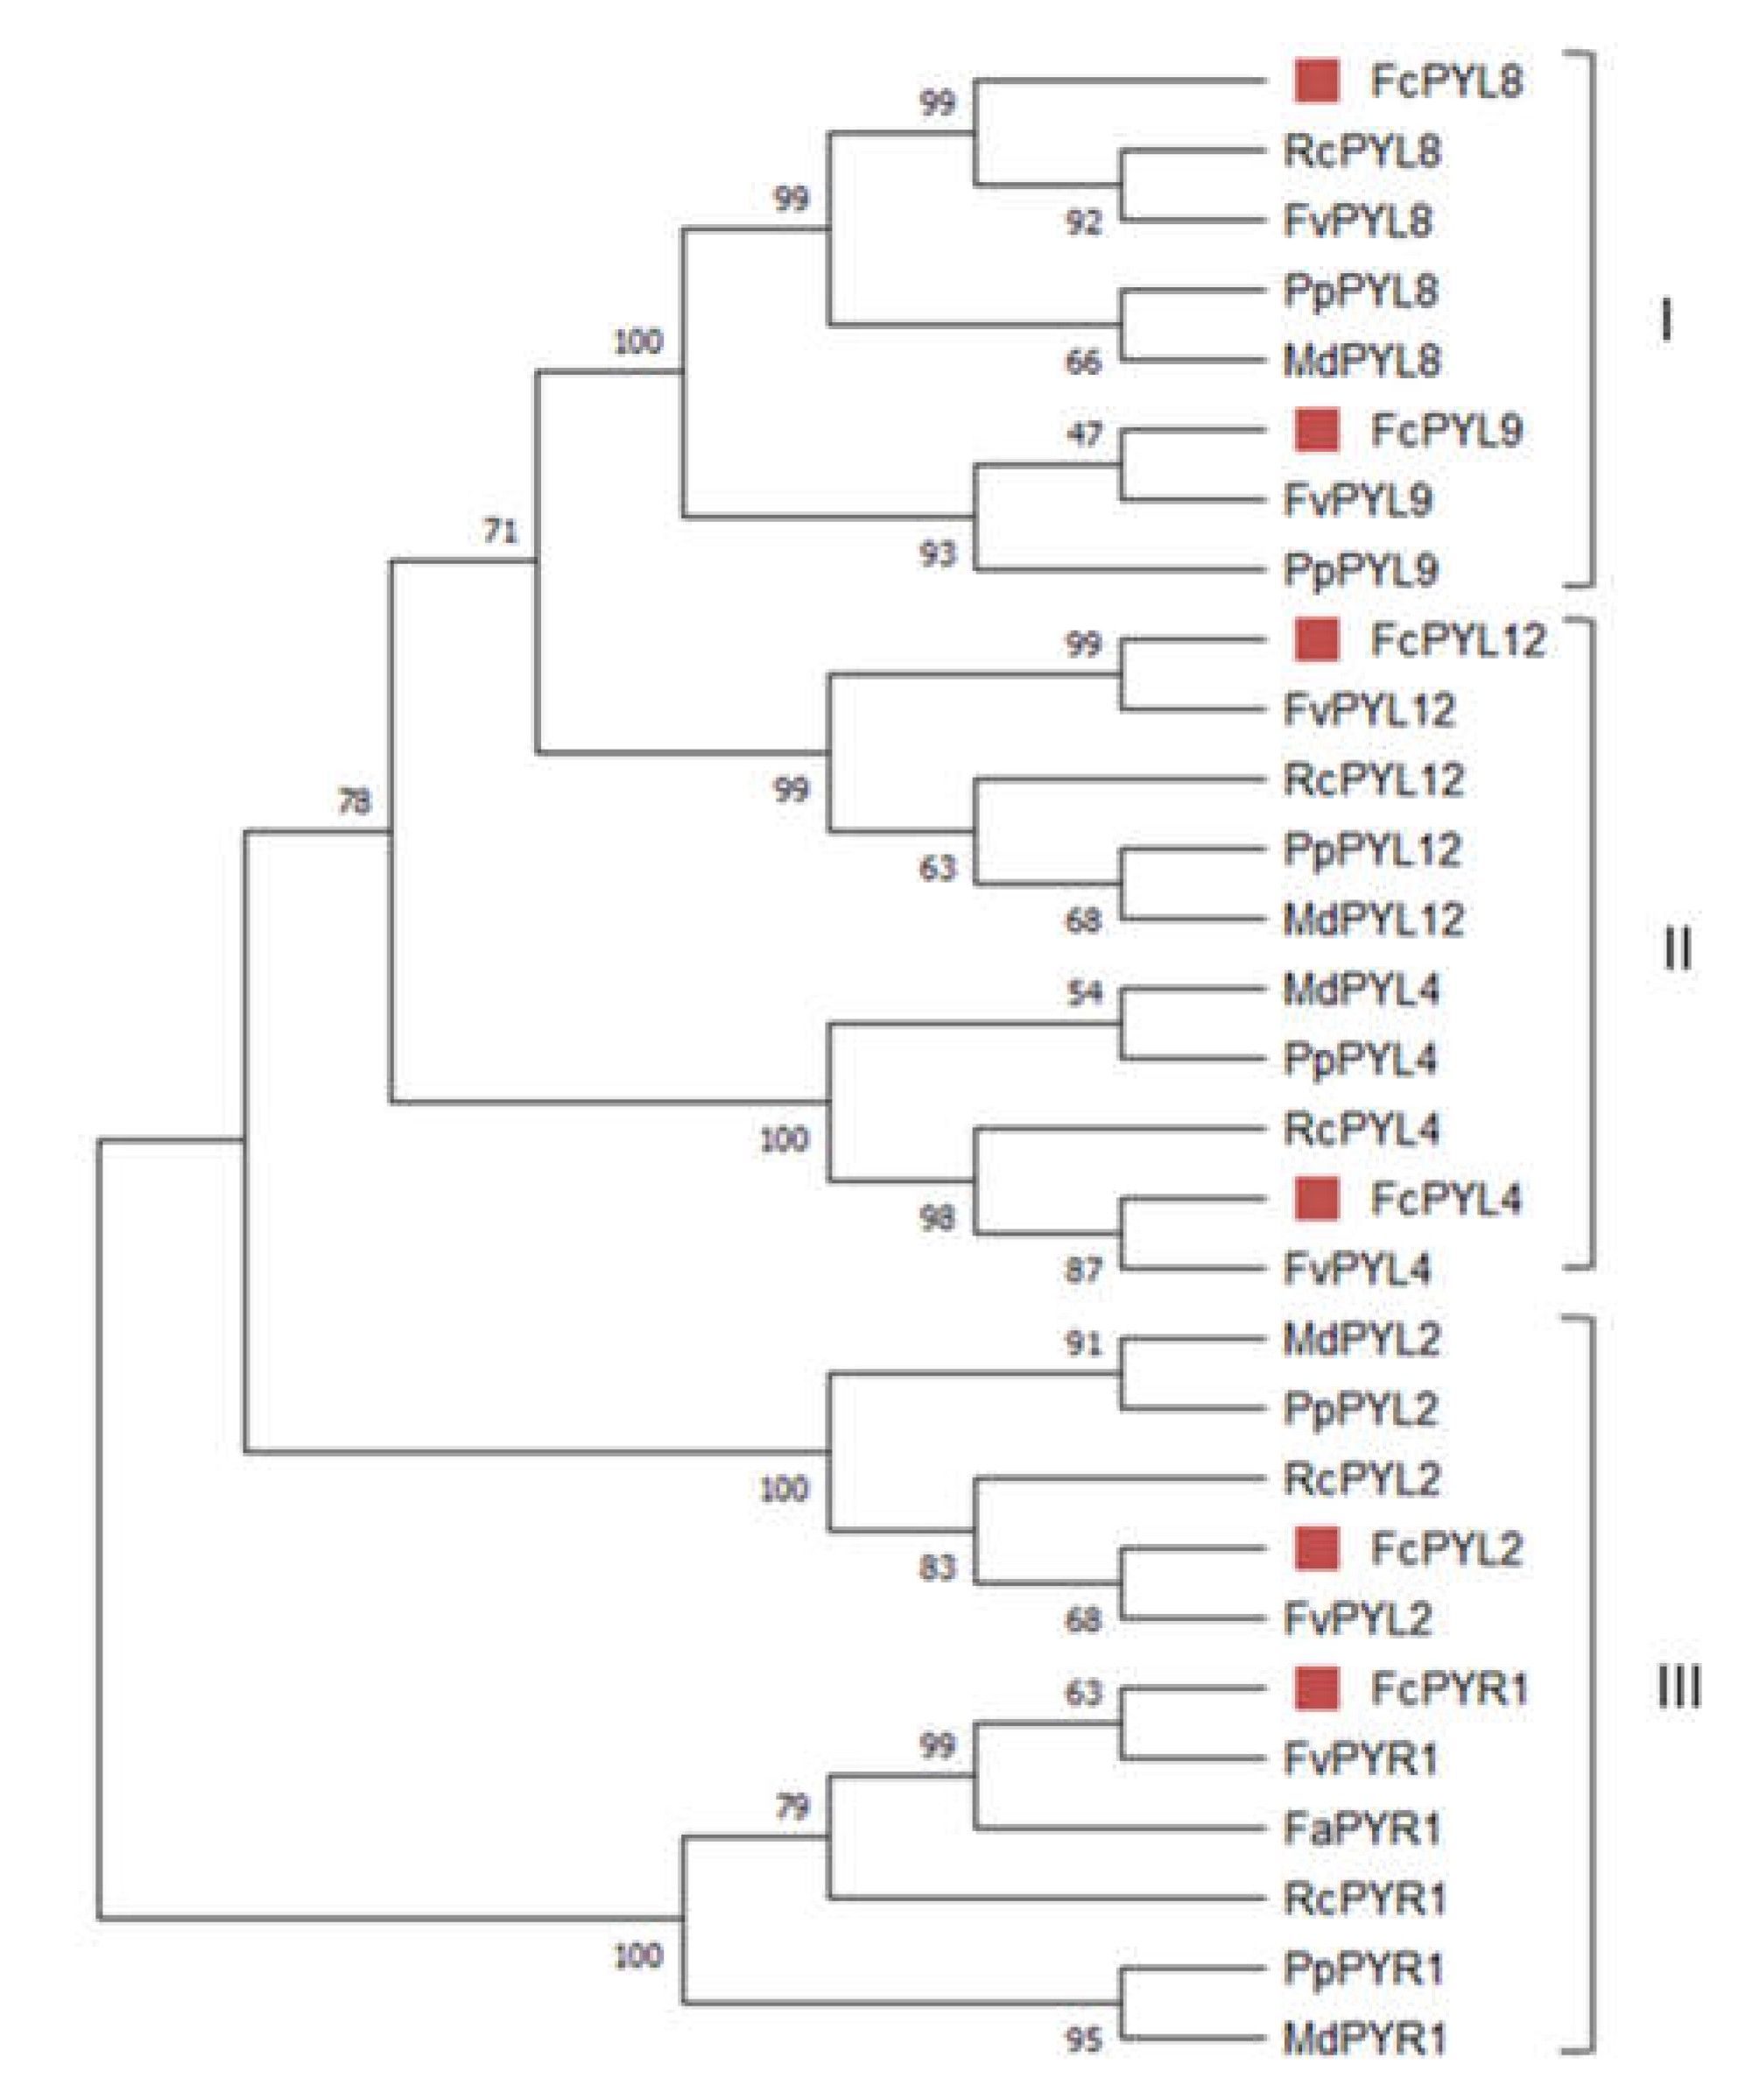
2.2. Identification of FcPYR/PYL Family Genes and Analysis of Amino Acid Sequences
2.3. Expression Analysis of ABA Biosynthesis Related Genes in F. chiloensis
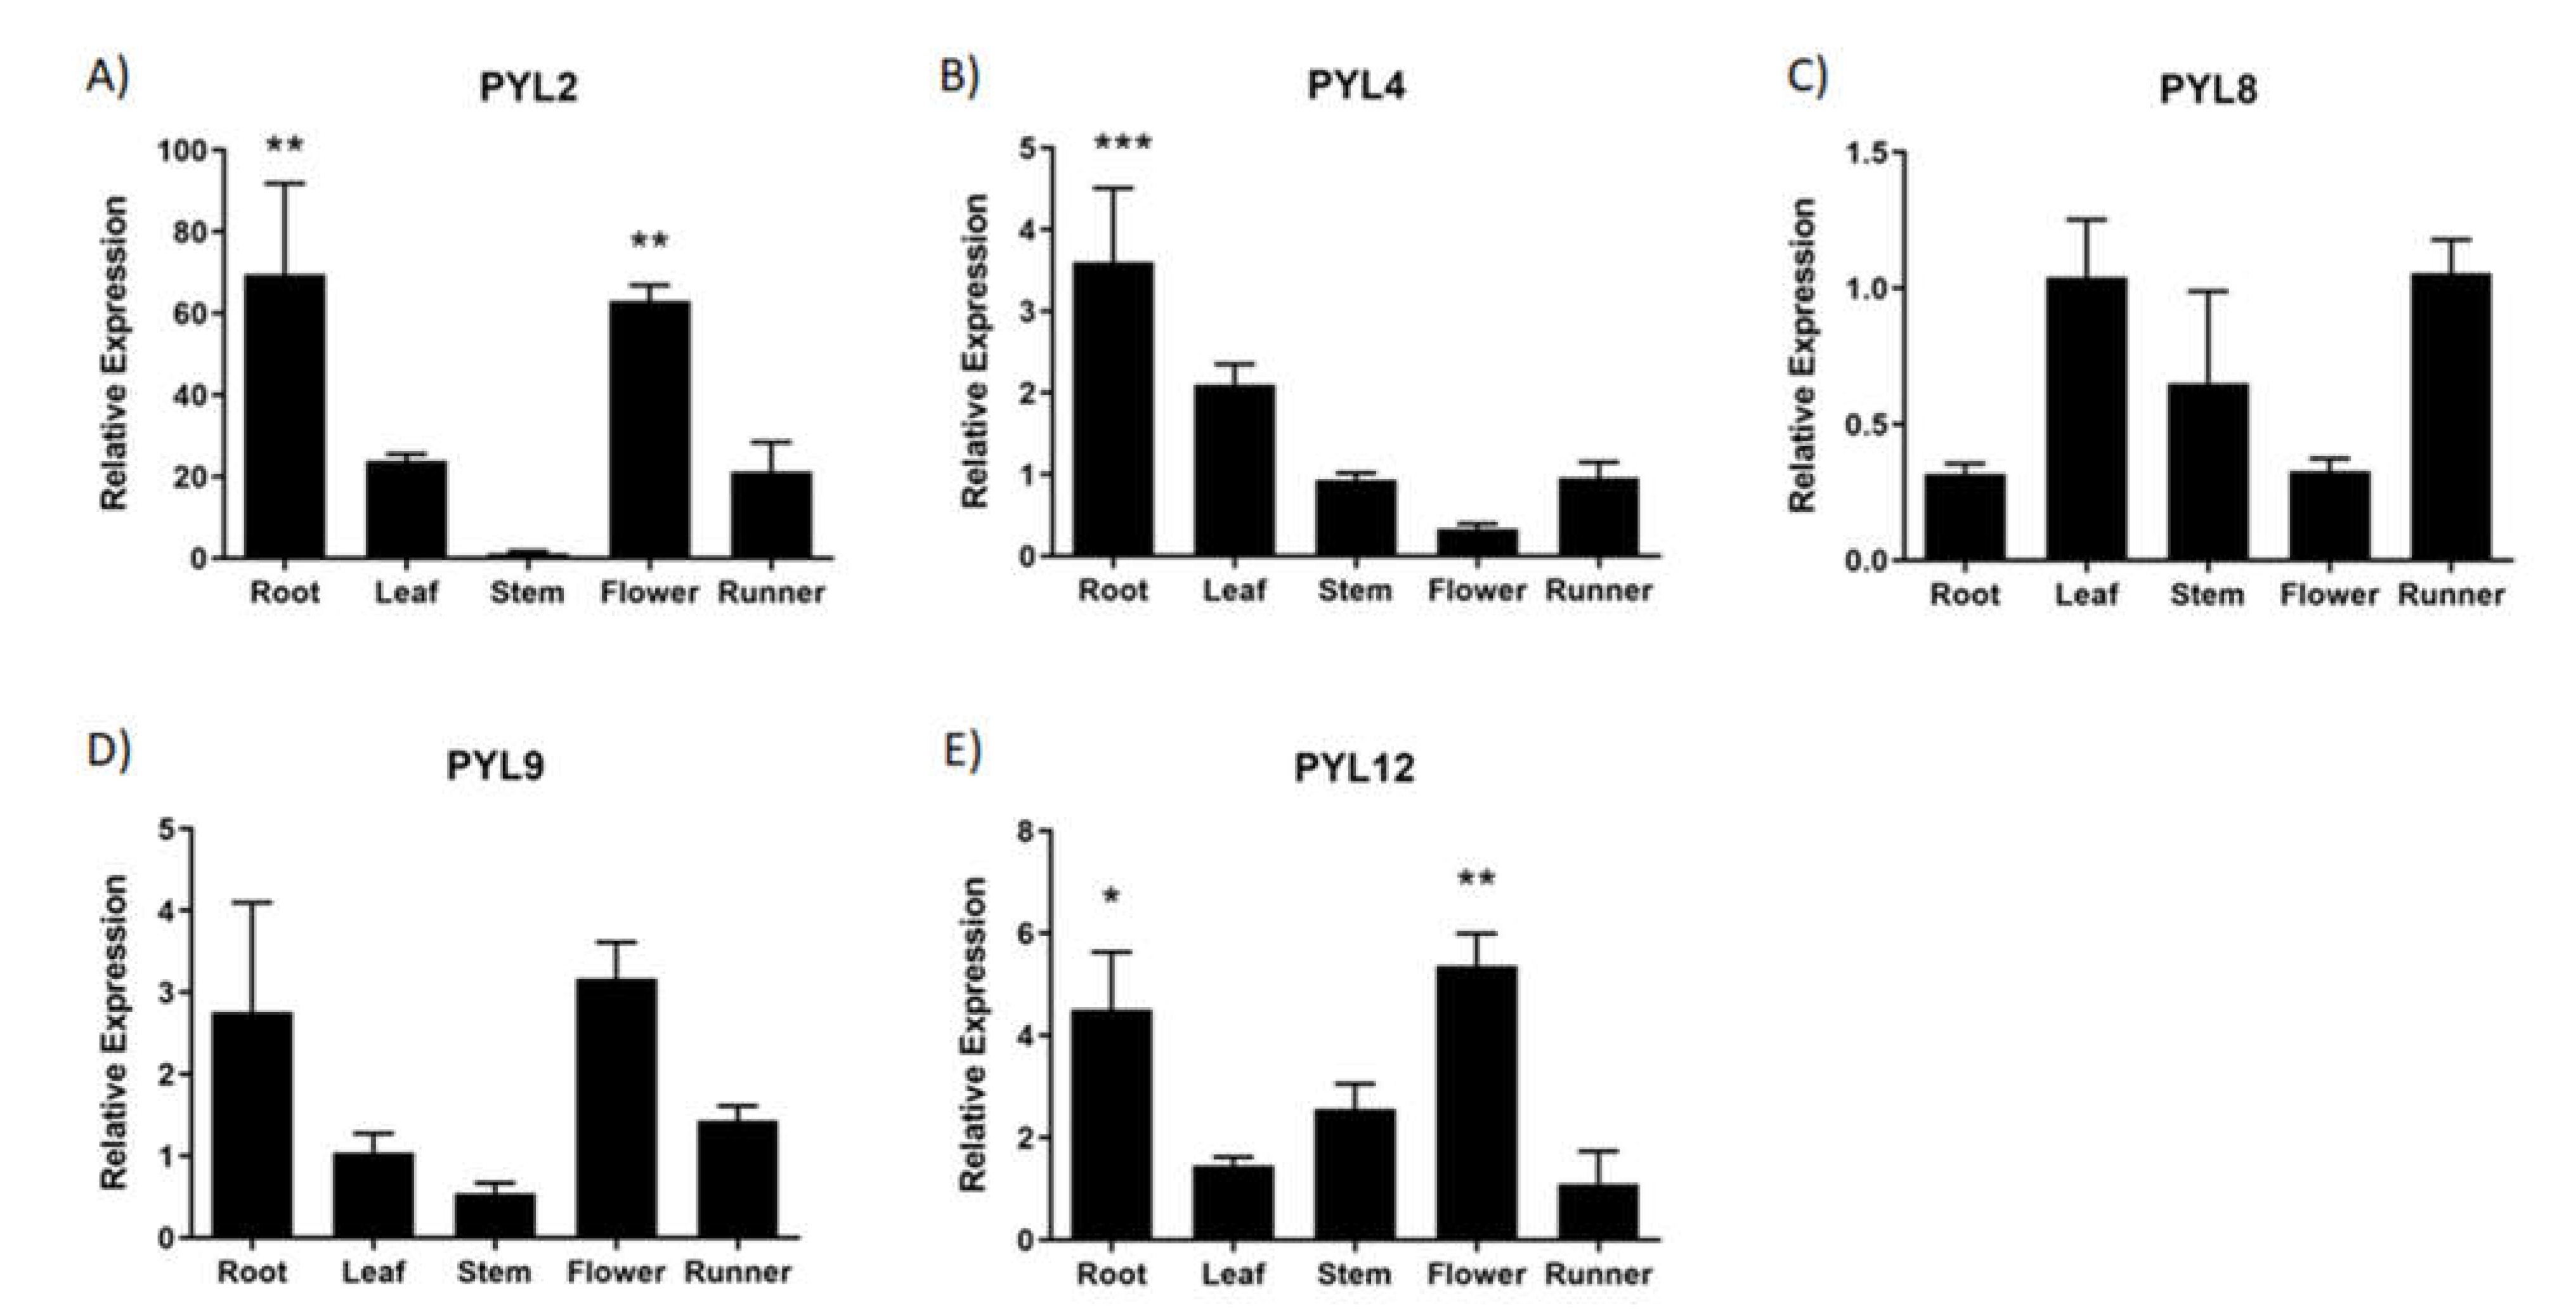
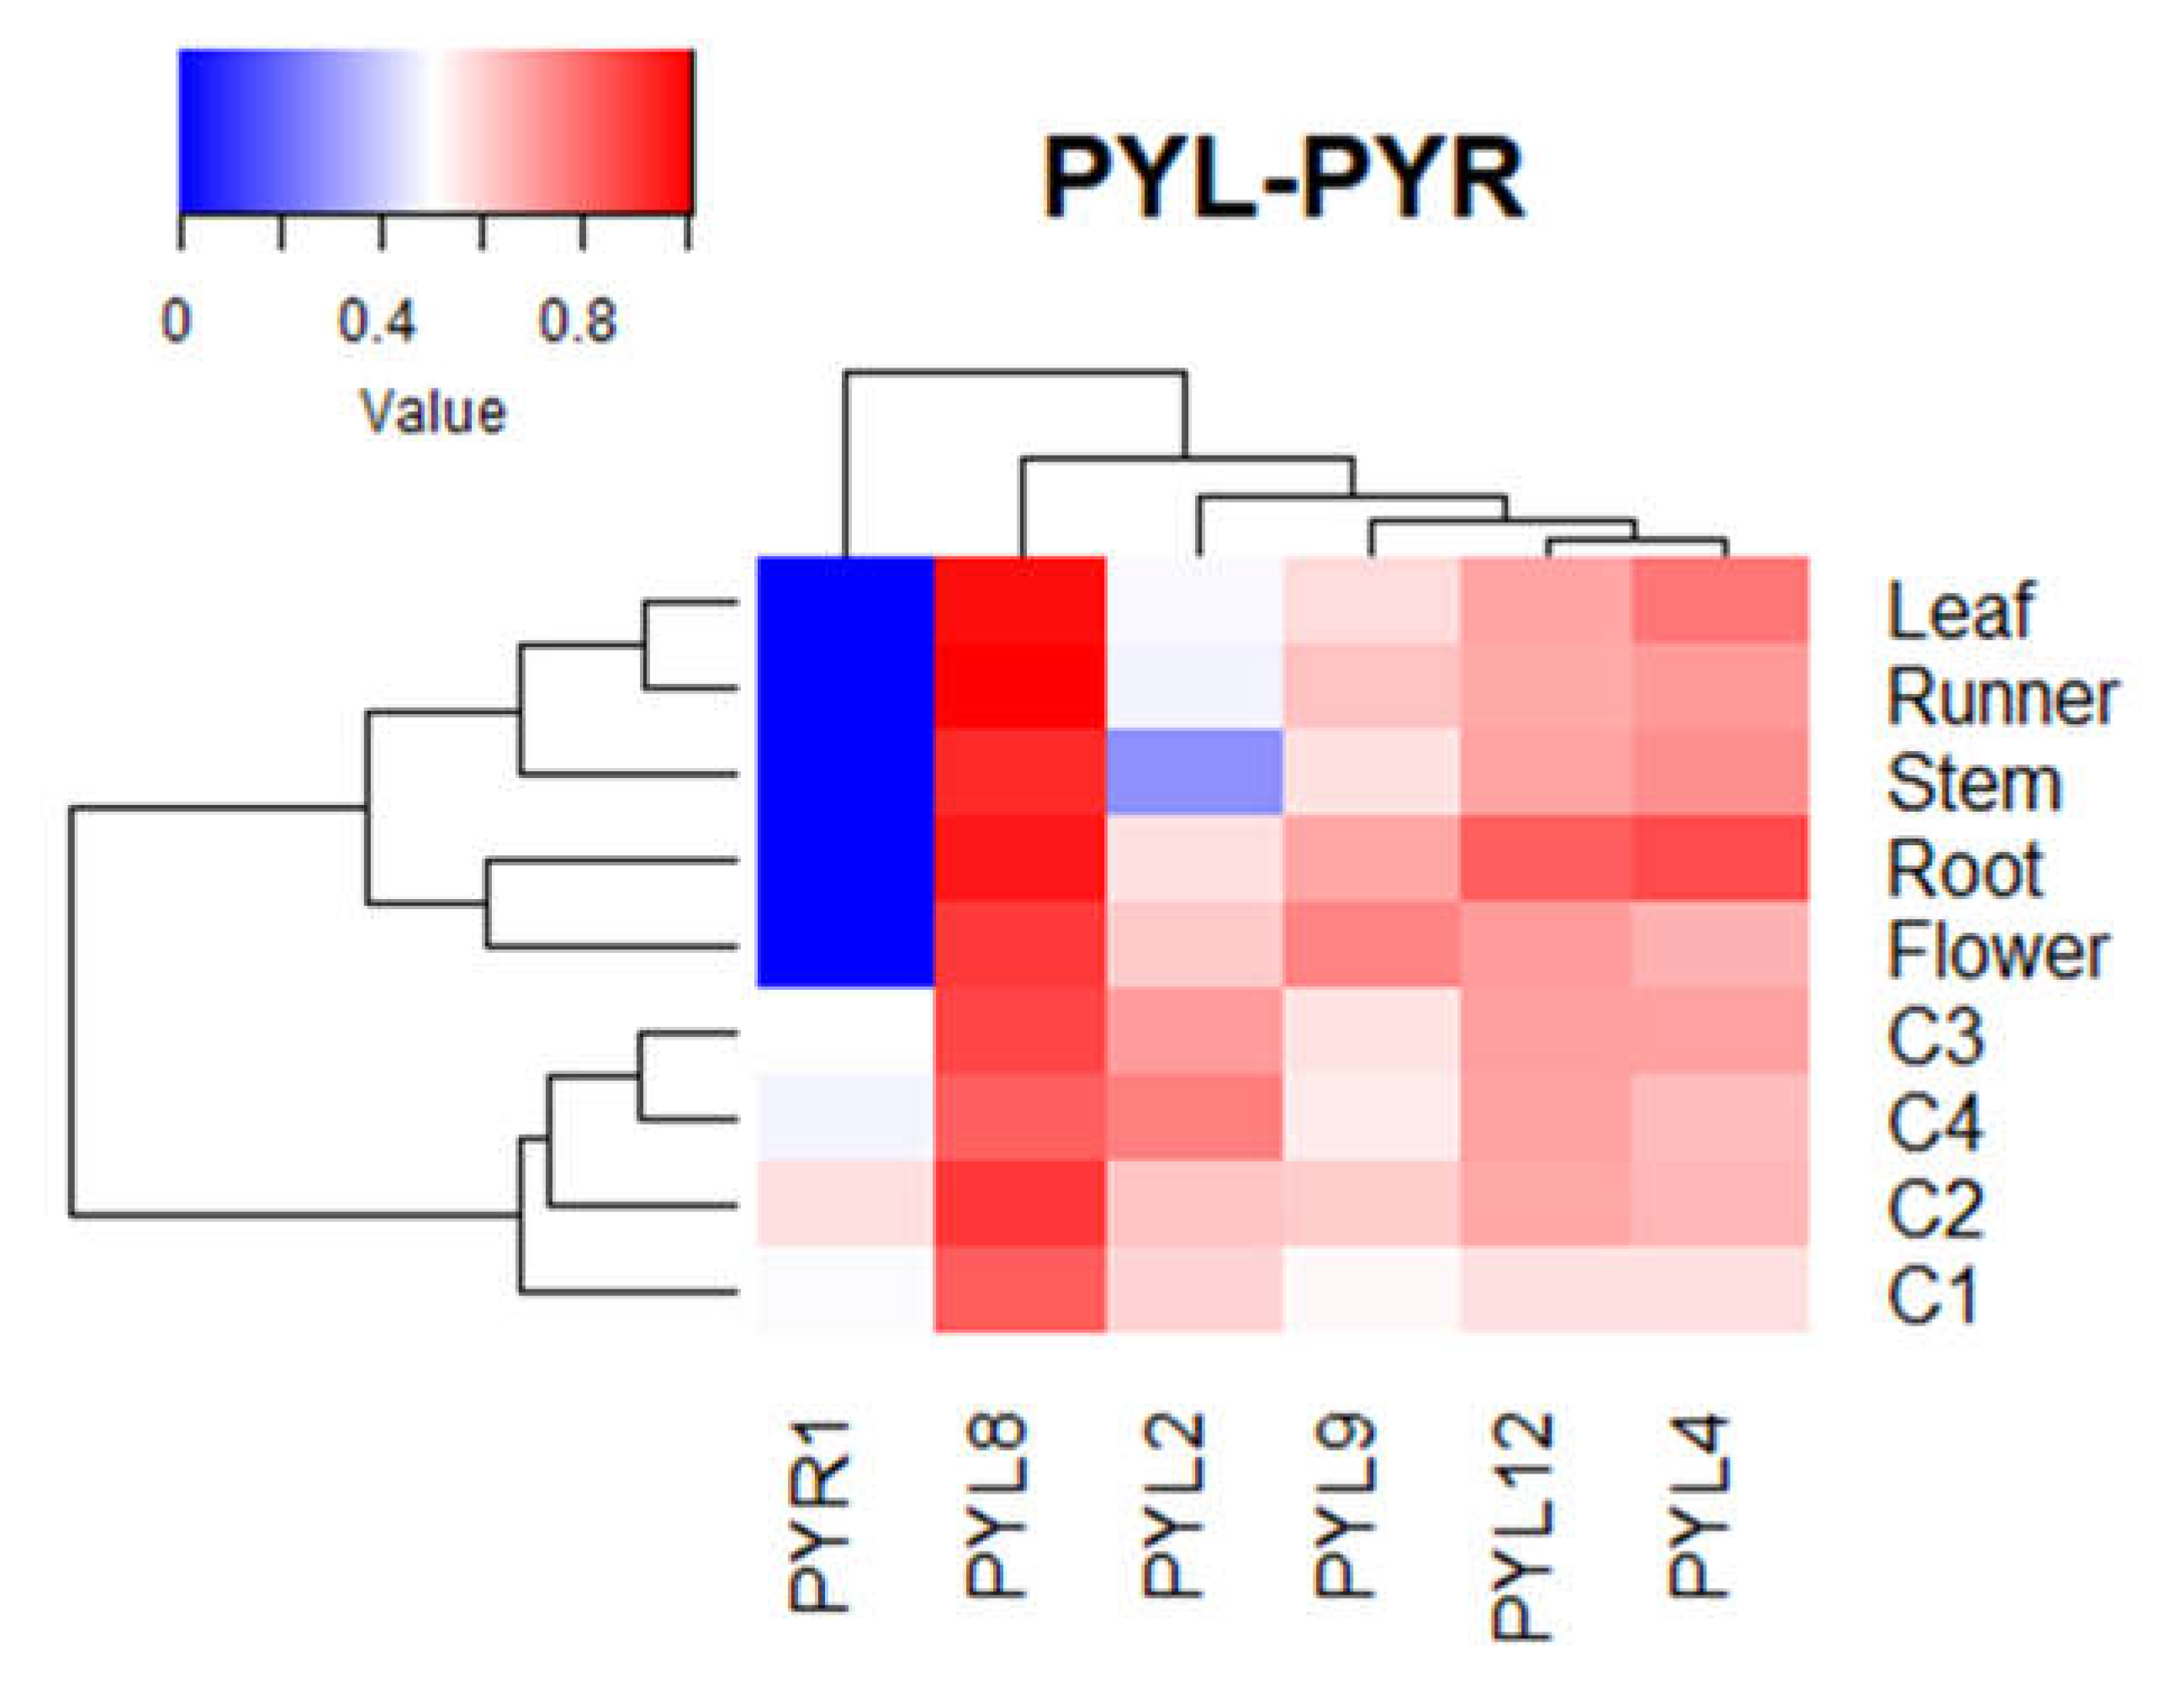
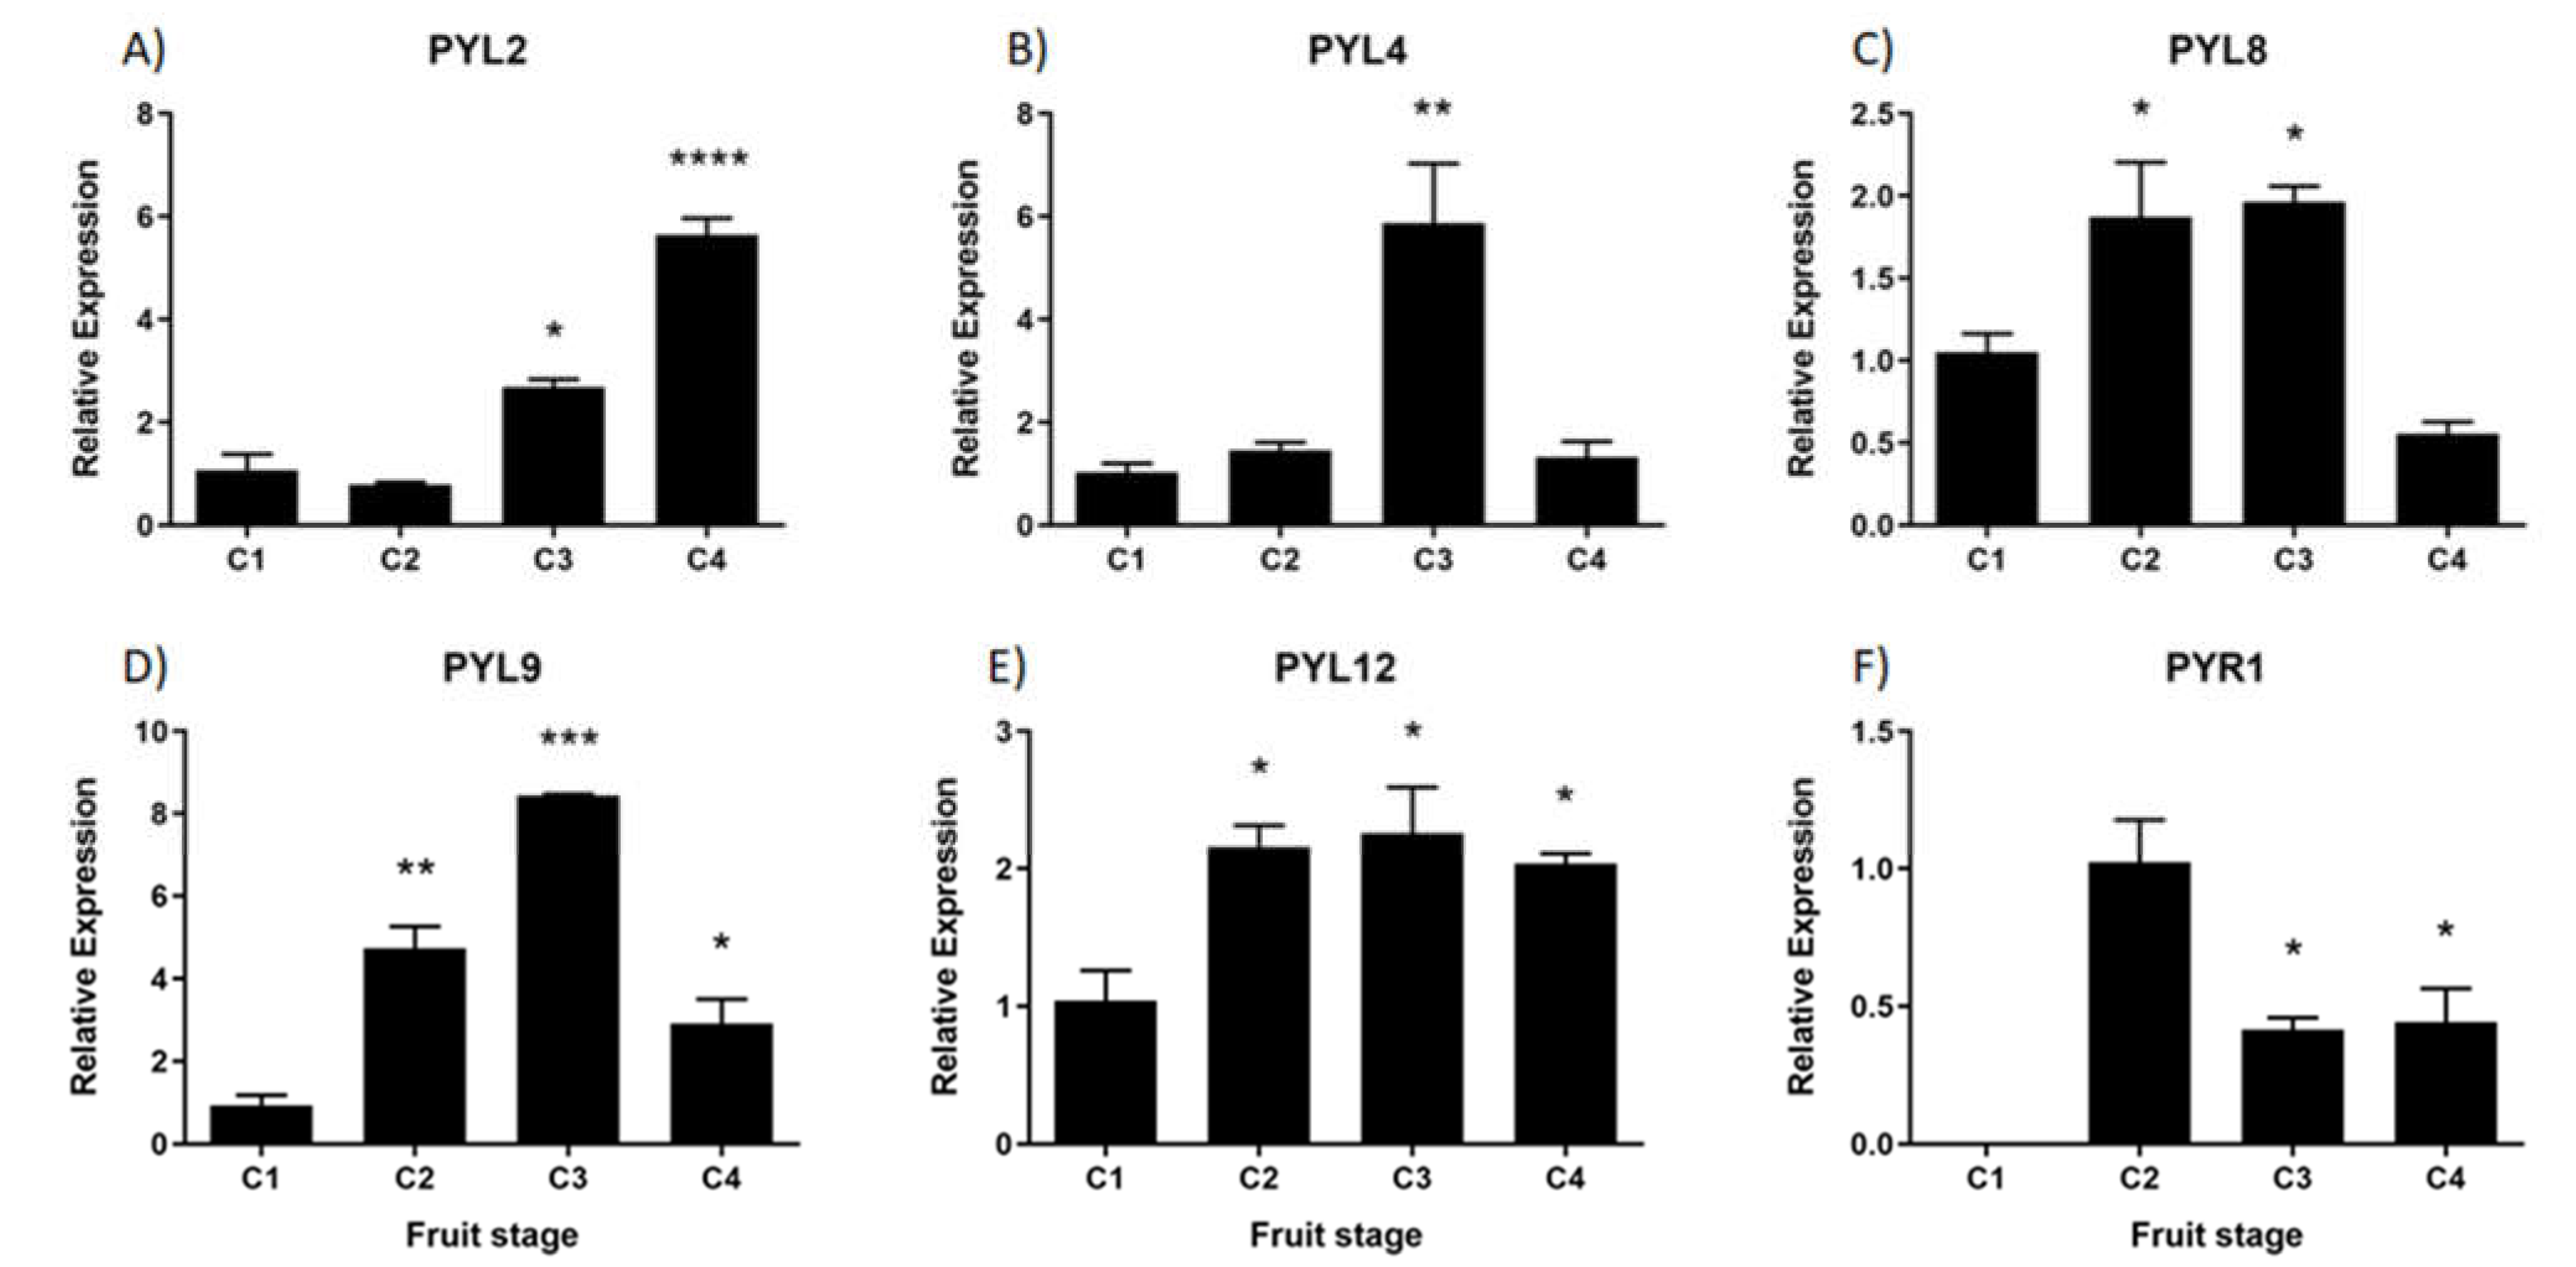
2.4. Expression Analysis of ABA Receptor Genes During Development of F. chiloensis Fruit and Vegetative Tissues
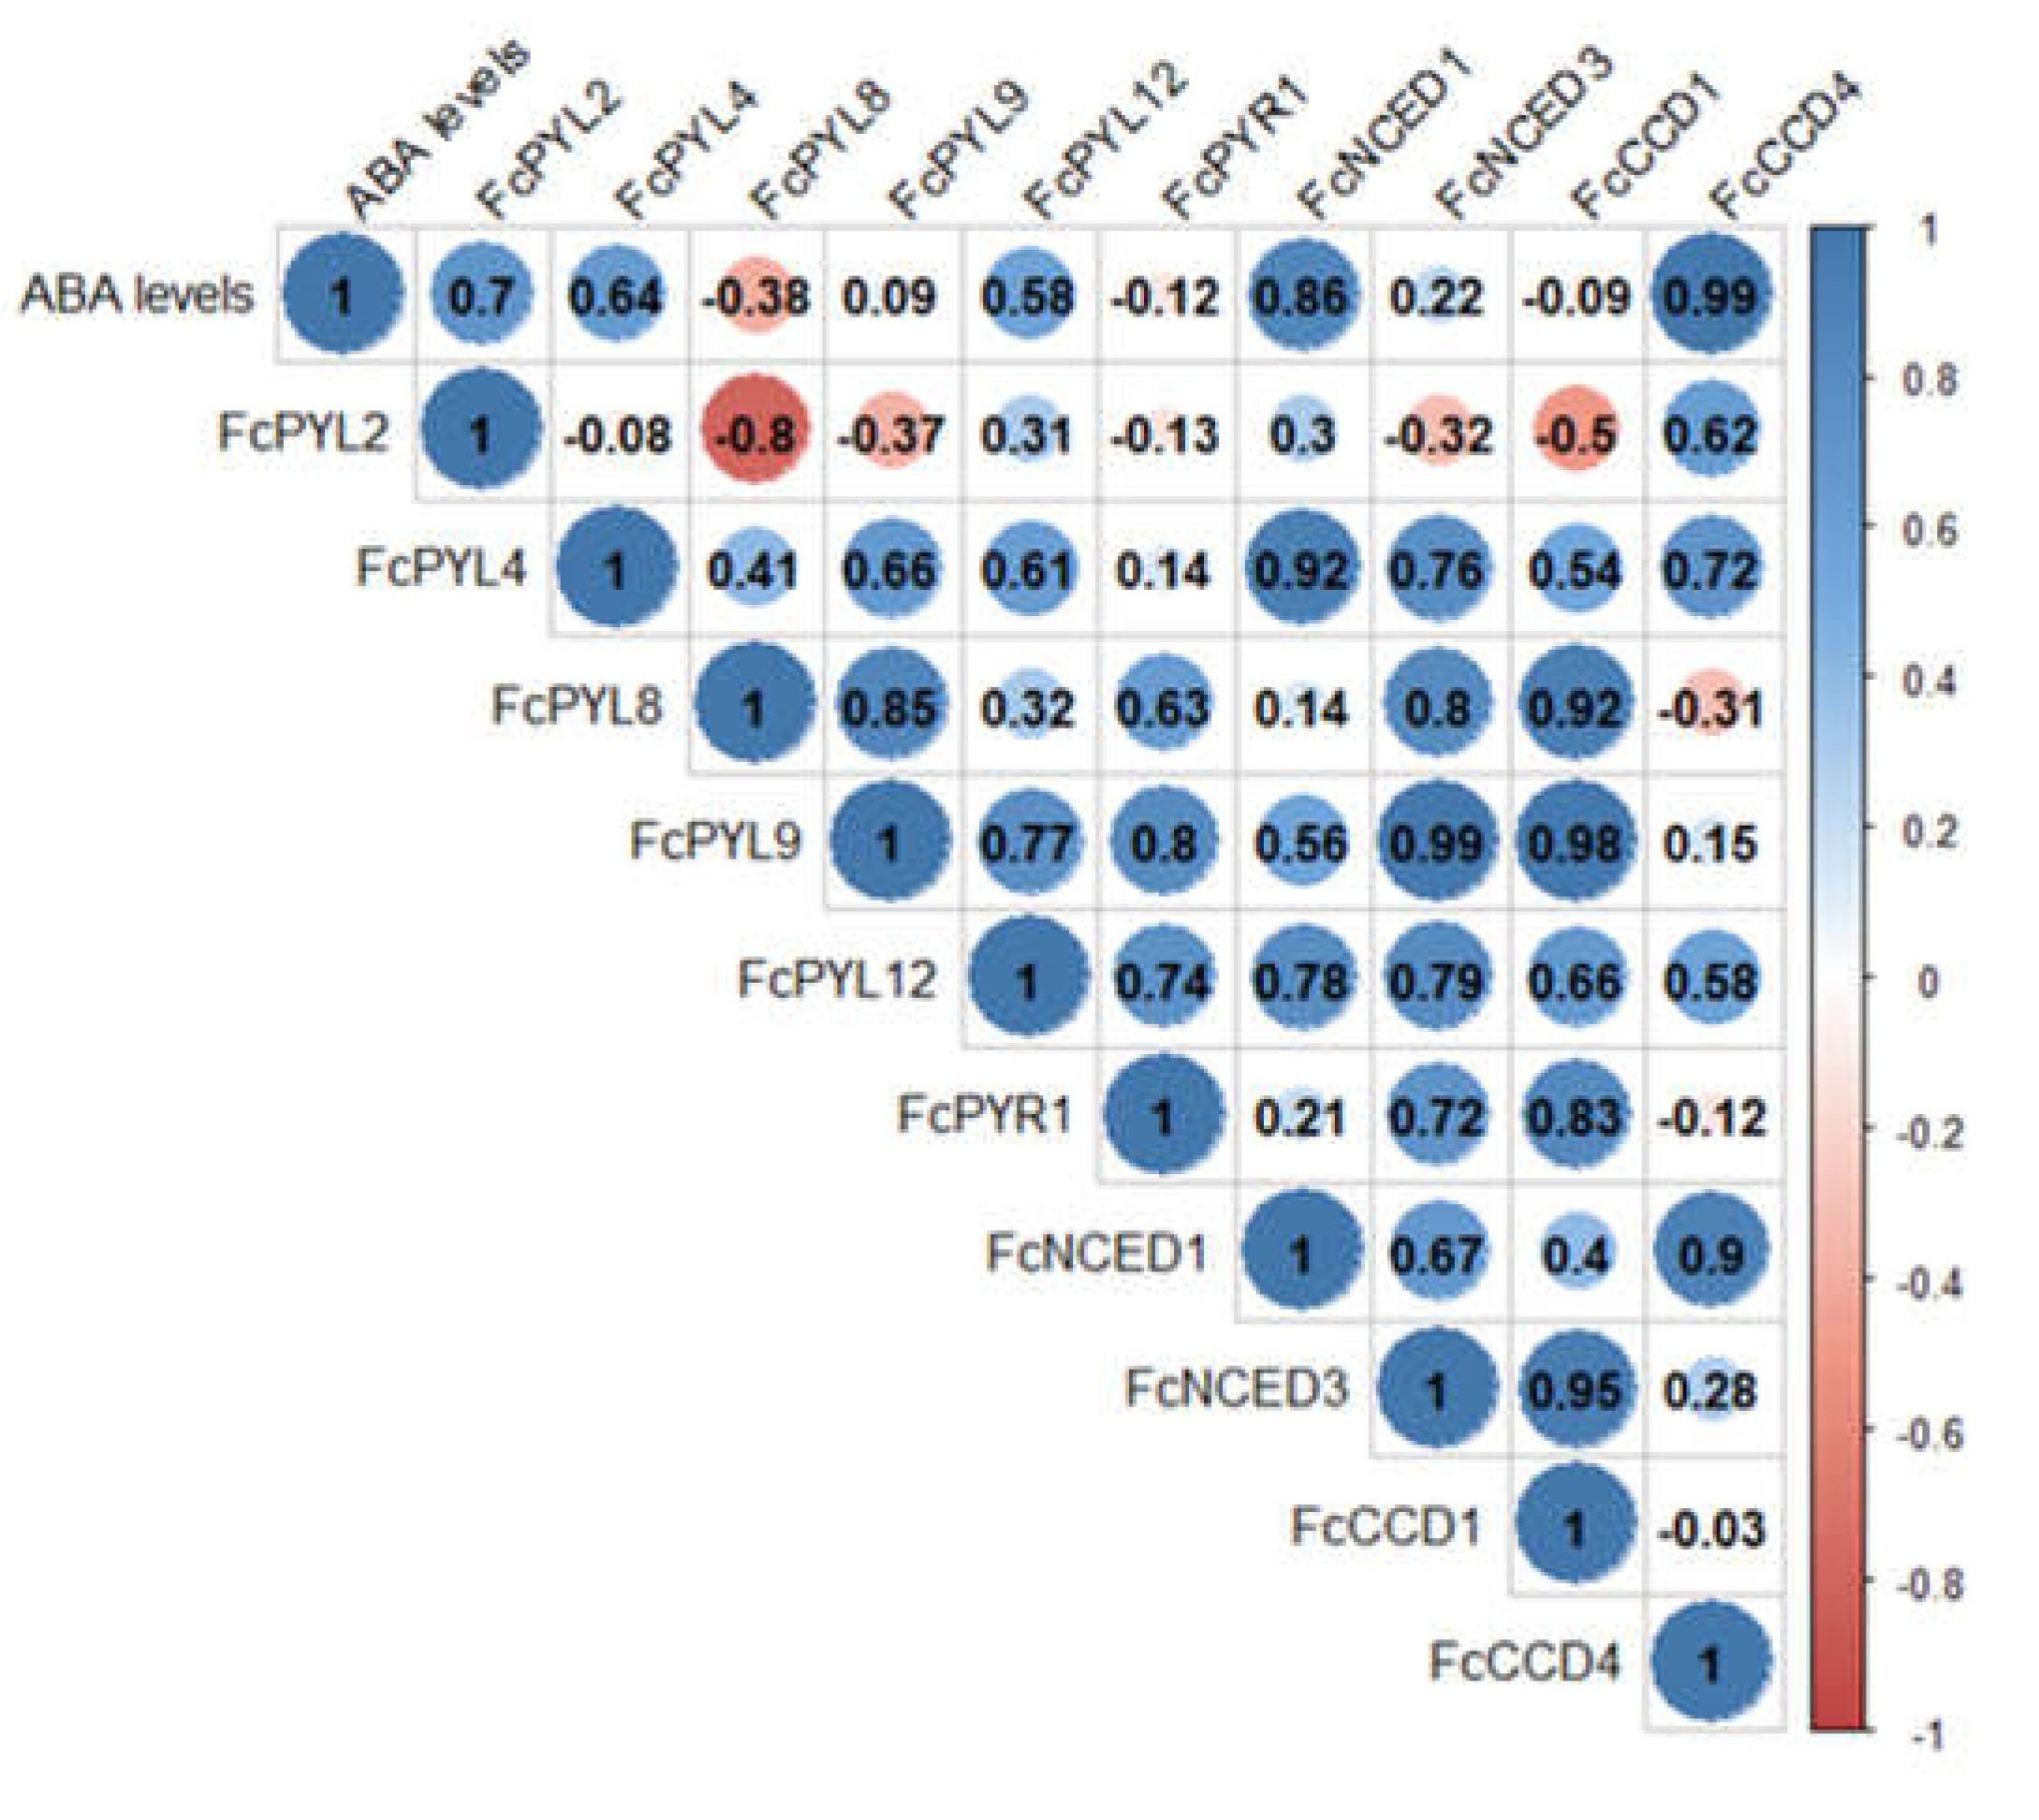
2.5. During Fruit Development ABA Levels Correlates with ABA Biosynthesis Genes and ABA Receptor Genes
3. Discussion
4. Materials and Methods
4.1. Plant Material
4.2. F. chiloensis Gene Sequences
4.3. Phylogenetic Analysis and Motif Analysis
4.4. RNA Extraction and Expression Analysis by Real Time PCR (qPCR)
4.5. Heatmap Analysis
4.6. Statistical Analysis
Supplementary Materials
Author Contributions
Funding
Institutional Review Board Statement
Data Availability Statement
Acknowledgments
Conflicts of Interest
References
- Figueroa, C.R.; Pimentel, P.; Gaete-Eastman, C.; Moya, M.; Herrera, R.; Caligari, P.D.S.; Moya-León, M.A. Softening rate of the Chilean strawberry (Fragaria chiloensis) fruit reflects the expression of polygalacturonase and pectate lyase genes. Postharvest Biol. Technol. 2008, 49, 210–220. [Google Scholar] [CrossRef]
- Letelier, L.; Gaete-Eastman, C.; Peñailillo, P.; Moya-León, M.A.; Herrera, R. Southern species from the biodiversity hotspot of central Chile: A source of color, aroma, and metabolites for global agriculture and food industry in a scenario of climate change. Front. Plant Sci. 2020, 11, 1002. [Google Scholar] [CrossRef]
- Molinett, S.A.; Alfaro, J.F.; Sáez, F.A.; Elgueta, S.; Moya-León, M.A.; Figueroa, C.R. Postharvest treatment of hydrogen sulfide delays the softening of Chilean strawberry fruit by downregulating the expression of key genes involved in pectin catabolism. Int. J. Mol. Sci. 2021, 22, 10008. [Google Scholar] [CrossRef]
- Giovannoni, J. Molecular biology of fruit maturation and ripening. Annu. Rev. Plant Physiol. Plant Mol. Biol. 2001, 52, 725–749. [Google Scholar] [CrossRef]
- Moya-León, M.A.; Mattus-Araya, E.; Herrera, R. Molecular events occurring during softening of strawberry fruit. Front. Plant Sci. 2019, 10, 615. [Google Scholar] [CrossRef]
- Symons, G.M.; Chua, Y.-J.; Ross, J.J.; Quittenden, L.J.; Davies, N.W.; Reid, J.B. Hormonal changes during non-climacteric ripening in strawberry. J. Exp. Bot. 2012, 63, 4741–4750. [Google Scholar] [CrossRef]
- Jiang, Y.; Joyce, D.C. ABA effects on ethylene production, PAL activity, anthocyanin and phenolic contents of strawberry fruit. Plant Growth Regul. 2003, 39, 171–174. [Google Scholar] [CrossRef]
- Opazo, M.C.; Figueroa, C.R.; Henríquez, J.; Herrera, R.; Bruno, C.; Valenzuela, P.D.T.; Moya-León, M.A. Characterization of two divergent cDNAs encoding xyloglucan endotransglycosylase/hydrolase (XTH) expressed in Fragaria chiloensis fruit. Plant Sci. 2010, 179, 479–488. [Google Scholar] [CrossRef]
- Medina-Puche, L.; Blanco-Portales, R.; Molina-Hidalgo, F.J.; Cumplido-Laso, G.; García-Caparrós, N.; Moyano-Cañete, E.; Caballero-Repullo, J.L.; Muñoz-Blanco, J.; Rodríguez-Franco, A. Extensive transcriptomic studies on the roles played by abscisic acid and auxins in the development and ripening of strawberry fruits. Funct. Integr. Genomics 2016, 16, 671–692. [Google Scholar] [CrossRef]
- Mattus-Araya, E.; Guajardo, J.; Herrera, R.; Moya-León, M.A. ABA speeds up the progress of color in developing F. chiloensis fruit through the activation of PAL, CHS and ANS, key genes of the phenylpropanoid/flavonoid and anthocyanin pathways. Int. J. Mol. Sci. 2022, 23, 3854. [Google Scholar] [CrossRef]
- Mattus-Araya, E.; Stappung, Y.; Herrera, R.; Moya-León, M.A. Molecular actors involved in the softening of Fragaria chiloensis fruit accelerated by ABA treatment. J. Plant Growth Regul. 2023, 42, 433–448. [Google Scholar] [CrossRef]
- Jia, H.-F.; Chai, Y.-M.; Li, C.-L.; Lu, D.; Luo, J.-J.; Qin, L.; Shen, Y.-Y. Abscisic acid plays an important role in the regulation of strawberry fruit ripening. Plant Physiol. 2011, 157, 188–199. [Google Scholar] [CrossRef]
- Given, N.K.; Venis, M. A.; Gierson, D. Hormonal regulation of ripening in the strawberry, a non-climacteric fruit. Planta 1988, 174, 402–406. [Google Scholar] [CrossRef]
- Gu, T.; Jia, S.; Huang, X.; Wang, L.; Fu, W.; Huo, G.; Gan, L.; Ding, J.; Li, Y. Transcriptome and hormone analyses provide insights into hormonal regulation in strawberry ripening. Planta 2019, 250, 145–162. [Google Scholar] [CrossRef]
- Chen, K.; Li, G.-J.; Bressan, R.A.; Song, C.-P.; Zhu, J.-K.; Zhao, Y. Abscisic acid dynamics, signaling, and functions in plants. J. Integr. Plant Biol. 2020, 62, 25–54. [Google Scholar] [CrossRef]
- Rai, M.K.; Shekhawat, N.S.; Harish, Gupta, A. K.; Phulwaria, M.; Ram, K.; Jaiswal, U. The role of abscisic acid in plant tissue culture: A review of recent progress. Plant Cell Tissue Organ Cult. 2011, 106, 179–190. [Google Scholar] [CrossRef]
- Finkelstein, R. Abscisic acid synthesis and response. The Arabidopsis Book/American Society of Plant Biologists 2013, 11, e0166. [Google Scholar] [CrossRef]
- Kushiro, T.; Okamoto, M.; Nakabayashi, K.; Yamagishi, K.; Kitamura, S.; Asami, T.; Hirai, N.; Koshiba, T.; Kamiya, Y.; Nambara, E. The Arabidopsis cytochrome P450 CYP707A encodes ABA 8′-hydroxylases: Key enzymes in ABA catabolism. EMBO J. 2004, 23, 1647–1656. [Google Scholar] [CrossRef]
- Lim, E.-K.; Doucet, C. J.; Hou, B.; Jackson, R.G.; Abrams, S.R.; Bowles, D.J. Resolution of (+)-abscisic acid using an Arabidopsis glycosyltransferase. Tetrahedron: Asymmetry 2005, 16, 143–147. [Google Scholar] [CrossRef]
- Liu, Z.; Yan, J.-P.; Li, D.-K.; Luo, Q.; Yan, Q.; Liu, Z.-B.; Ye, L.-M. , Wang, J.-M.; Li, X.-F.; Yang, Y. UDP-Glucosyltransferase71C5, a major glucosyltransferase, mediates abscisic acid homeostasis in Arabidopsis. Plant Physiol. 2015, 167, 1659–1670. [Google Scholar] [CrossRef]
- Lee, K. H.; Piao, H. L.; Kim, H.-Y.; Choi, S. M.; Jiang, F.; Hartung, W.; Hwang, I.; Kwak, J. M.; Lee, I.-J.; Hwang, I. Activation of glucosidase via stress-induced polymerization rapidly increases active pools of abscisic acid. Cell 2006, 126, 1109–1120. [Google Scholar] [CrossRef] [PubMed]
- Bai, Q.; Huang, Y.; Shen, Y. The physiological and molecular mechanism of abscisic acid in regulation of fleshy fruit ripening. Front. Plant Sci. 2021, 11. [Google Scholar] [CrossRef] [PubMed]
- Cutler, S.R.; Rodriguez, P.L.; Finkelstein, R.R.; Abrams, S.R. Abscisic acid: Emergence of a core signaling network. Annu. Rev. Plant Biol. 2010, 61, 651–679. [Google Scholar] [CrossRef] [PubMed]
- Hao, Q.; Yin, P.; Li, W.; Wang, L.; Yan, C.; Lin, Z.; Wu, J. Z.; Wang, J.; Yan, S. F.; Yan, N. The molecular basis of ABA-independent inhibition of PP2Cs by a subclass of PYL proteins. Mol. Cell 2011, 42, 662–672. [Google Scholar] [CrossRef]
- Ji, K.; Chen, P.; Sun, L.; Wang, Y.; Dai, S.; Li, Q.; Li, P.; Sun, Y.; Wu, Y.; Duan, C.; Leng, P.; Ji, K.; Chen, P.; Sun, L.; Wang, Y.; Dai, S.; Li, Q.; Li, P.; Sun, Y.; et al. Non-climacteric ripening in strawberry fruit is linked to ABA, FaNCED2 and FaCYP707A1. Funct. Plant Biol. 2012, 39, 351–357. [Google Scholar] [CrossRef] [PubMed]
- Hou, B.-Z.; Chen, X.-H.; Shen, Y.-Y. Interactions between strawberry ABA receptor PYR/PYLs and protein phosphatase PP2Cs on basis of transcriptome and yeast two-hybrid analyses. J. Plant Growth Regul. 2021, 40, 594–602. [Google Scholar] [CrossRef]
- Liao, X.; Li, M.; Liu, B.; Yan, M.; Yu, X.; Zi, H.; Liu, R.; Yamamuro, C. Interlinked regulatory loops of ABA catabolism and biosynthesis coordinate fruit growth and ripening in woodland strawberry. Proc. Natl. Acad. Sci. USA 2018, 115, E11542–E11550. [Google Scholar] [CrossRef]
- Opazo, M.C.; Lizana, R.; Pimentel, P.; Herrera, R.; Moya-León, M.A. Changes in the mRNA abundance of FcXTH1 and FcXTH2 promoted by hormonal treatments of Fragaria chiloensis fruit. Postharvest Biol. Technol. 2013, 77, 28–34. [Google Scholar] [CrossRef]
- Carrasco-Orellana, C.; Stappung, Y.; Mendez-Yañez, A.; Allan, A.C.; Espley, R.V.; Plunkett, B.J.; Moya-Leon, M.A.; Herrera, R. Characterization of a ripening-related transcription factor FcNAC1 from Fragaria chiloensis fruit. Sci. Rep. 2018, 8, 10524. [Google Scholar] [CrossRef]
- Méndez-Yañez, A.; González, M.; Carrasco-Orellana, C.; Herrera, R.; Moya-León, M.A. Isolation of a rhamnogalacturonan lyase expressed during ripening of the Chilean strawberry fruit and its biochemical characterization. Plant Physiol. Biochem. 2020, 146, 411–419. [Google Scholar] [CrossRef]
- Messing, S.A.J.; Gabelli, S.B.; Echeverria, I.; Vogel, J.T.; Guan, J.C.; Tan, B.C.; Klee, H.J.; McCarty, D.R.; Amzel, L.M. Structural insights into maize Viviparous14, a key enzyme in the biosynthesis of the phytohormone abscisic Acid. Plant Cell 2010, 22, 2970–2980. [Google Scholar] [CrossRef] [PubMed]
- Ruiz-Partida, R.; Rosario, S.M.; Lozano-Juste, J. An update on crop ABA receptors. Plants 2021, 10, 1087. [Google Scholar] [CrossRef] [PubMed]
- Melcher, K.; Ng, L.-M.; Zhou, X.E.; Soon, F.-F.; Xu, Y.; Suino-Powell, K. M.; Park, S.-Y.; Weiner, J.J.; Fujii, H.; Chinnusamy, V.; Kovach, A.; Li, J.; Wang, Y.; Li, J.; Peterson, F.C.; Jensen, D.R.; Yong, E.-L.; Volkman, B.F.; Cutler, S. R.; … Xu, H. E. A gate-latch-lock mechanism for hormone signaling by abscisic acid receptors. Nature 2009, 462, 602–608. [Google Scholar] [CrossRef] [PubMed]
- Yin, P.; Fan, H.; Hao, Q.; Yuan, X.; Wu, D.; Pang, Y.; Yan, C.; Li, W.; Wang, J.; Yan, N. Structural insights into the mechanism of abscisic acid signaling by PYL proteins. Nat. Struct. Mol. Biol. 2009, 16, 1230–1236. [Google Scholar] [CrossRef] [PubMed]
- Cheng, D.; Wang, Z.; Li, S.; Zhao, J.; Wei, C.; Zhang, Y. Genome-wide identification of CCD gene family in six Cucurbitaceae species and its expression profiles in melon. Genes 2022, 13, 262. [Google Scholar] [CrossRef] [PubMed]
- Yue, X.-Q.; Zhang, Y.; Yang, C. -K. ; Li, J.-G.; Rui, X.; Ding, F.; Hu, F.-C.; Wang, X.-H.; Ma, W.-Q.; Zhou, K.-B. Genome-wide identification and expression analysis of carotenoid cleavage oxygenase genes in Litchi (Litchi chinensis Sonn.) BMC Plant Biology 2022, 22, 394. [Google Scholar] [CrossRef]
- Gaete-Eastman, C.; Stappung, Y.; Molinett, S.; Urbina, D.; Moya-León, M.A.; Herrera, R. RNAseq, transcriptome analysis and identification of DEGs involved in development and ripening of Fragaria chiloensis fruit. Front. Plant Sci. 2022, 13, 976901. [Google Scholar] [CrossRef] [PubMed]
- Wei, Y.; Wan, H.; Wu, Z.; Wang, R.; Ruan, M.; Ye, Q.; Li, Z.; Zhou, G.; Yao, Z.; Yang, Y. A comprehensive analysis of carotenoid cleavage dioxygenases genes in Solanum lycopersicum. Plant Mol. Biol. Rep. 2016, 34, 512–523. [Google Scholar] [CrossRef]
- Walter, M.H.; Strack, D. Carotenoids and their cleavage products: Biosynthesis and functions. Nat. Prod Rep. 2011, 28, 663–692. [Google Scholar] [CrossRef]
- Sun, Z.; Hans, J.; Walter, M.H.; Matusova, R.; Beekwilder, J.; Verstappen, F.W.A. Cloning and characterisation of a maize carotenoid cleavage dioxygenase (ZmCCD1) and its involvement in the biosynthesis of apocarotenoids with various roles in mutualistic and parasitic interactions. Planta 2008, 228, 789–801. [Google Scholar] [CrossRef]
- Ilg A, Beyer P, Al-Babili S. Characterization of the rice carotenoid cleavage dioxygenase 1 reveals a novel route for geranial biosynthesis. FEBS J. 2009, 276, 736–747. [Google Scholar] [CrossRef]
- Ohmiya, A.; Kishimoto, S.; Aida, R.; Yoshioka, S.; Sumitomo, K. Carotenoid cleavage dioxygenase (CmCCD4a) contributes to white color formation in chrysanthemum petals. Plant Physiol. 2006, 142, 1193–1201. [Google Scholar] [CrossRef]
- García-Limones, C.; Schnäbele, K.; Blanco-Portales, R.; Luz Bellido, M.; Caballero, J.L.; Schwab, W.; Muñoz-Blanco, J. Functional characterization of FaCCD1: A carotenoid cleavage dioxygenase from strawberry involved in lutein degradation during fruit ripening. J. Agric. Food Chem. 2008, 56, 9277–9285. [Google Scholar] [CrossRef]
- Floss, D.S.; Walter, M.H. Role of carotenoid cleavage dioxygenase 1 (CCD1) in apocarotenoid biogenesis revisited. Plant Signaling Behav. 2009, 4, 172–175. [Google Scholar] [CrossRef]
- Adami, M.; De Franceschi, P.; Brandi, F.; Liverani, A.; Giovannini, D.; Rosati, C.; Dondini, L.; Tartarini, S. Identifying a carotenoid cleavage dioxygenase (CCD4) gene controlling yellow/white fruit flesh color of peach. Plant Mol. Biol. Rep. 2013, 31, 1166–1175. [Google Scholar] [CrossRef]
- Rodrigo, M.J.; Alquézar, B.; Alós, E.; Medina, V.; Carmona, L.; Bruno, M.; Al-Babili, S.; Zacarías, L. A novel carotenoid cleavage activity involved in the biosynthesis of Citrus fruit-specific apocarotenoid pigments. J. Exp. Bot. 2013, 64, 4461–4478. [Google Scholar] [CrossRef]
- Watanabe, K.; Oda-Yamamizo, C.; Sage-Ono, K.; Ohmiya, A.; Ono, M. Alteration of flower colour in Ipomoea nil through CRISPR/Cas9-mediated mutagenesis of carotenoid cleavage dioxygenase 4. Transgenic Res. 2018, 27, 25–38. [Google Scholar] [CrossRef]
- Zheng, X.; Zhu, K.; Sun, Q.; Zhang, W.; Wang, X.; Cao, H. , et al. Natural variation in CCD4 promoter underpins species-specific evolution of red coloration in citrus peel. Mol. Plant. 2019, 12, 1294–1307. [Google Scholar] [CrossRef]
- Wang, R.K.; Wang, C.E.; Fei, Y.Y.; Gai, J.Y.; Zhao, T.J. Genome-wide identification and transcription analysis of soybean carotenoid oxygenase genes during abiotic stress treatments. Mol. Biol. Rep. 2013, 40, 4737–4745. [Google Scholar] [CrossRef]
- Pasare, S.A.; Ducreux, L.J.M.; Morris, W.L.; Campbell, R.; Sharma, S.K.; Roumeliotis, E. , et al. The role of the potato (Solanum tuberosum) CCD8 gene in stolon and tuber development. New Phytol. 2013, 198, 1108–1120. [Google Scholar] [CrossRef]
- Ha, C.V.; Leyva-González, M.A.; Osakabe, Y.; Tran, U.T.; Nishiyama, R.; Watanabe, Y. Positive regulatory role of strigolactone in plant responses to drought and salt stress. Proc. Natl. Acad. Sci. USA 2014, 111, 851–856. [Google Scholar] [CrossRef]
- Pan, X.; Zheng, H.; Zhao, J.; Xu, Y.; Li, X. ZmCCD7/ZpCCD7 encodes a carotenoid cleavage dioxygenase mediating shoot branching. Planta 2016, 243, 1407–1418. [Google Scholar] [CrossRef]
- Wheeler, S.; Loveys, B.; Ford, C.; Davies, C. The relationship between the expression of abscisic acid biosynthesis genes, accumulation of abscisic acid and the promotion of Vitis vinifera L. berry ripening by abscisic acid. Aust. J. Grape Wine Res. 2010, 15, 195–204. [Google Scholar] [CrossRef]
- Shen, X.; Zhou, K.; Liu, L.; Zhang, K.; Yuan, H.; Liao, X.; et al. A role for PacMYBA in ABA-regulated anthocyanin biosynthesis in red-colored sweet cherry cv. Hong Deng (Prunus avium L.). Plant Cell Physiol. 2014, 55, 862–880. [Google Scholar] [CrossRef]
- Singh, S.P.; Saini, M.K.; Singh, J.; Pongener, A.; Sidhu, G.S. Preharvest application of abscisic acid promotes anthocyanins accumulation in pericarp of litchi fruit without adversely affecting postharvest quality. Postharvest Biol. Technol. 2014, 96, 14–22. [Google Scholar] [CrossRef]
- Tian, X.; Ji, J.; Wang, G.; Jin, C.; Guan, C.; Wu, D.; Li, Z. Cloning and expression analysis of 9-cis-epoxycarotenoid dioxygenase gene 1 involved in fruit maturation and abiotic stress response in Lycium chinense. J. Plant Growth Regul. 2015, 34, 465–474. [Google Scholar] [CrossRef]
- Zhang, M.; Leng, P.; Zhang, G.; Li, X. Cloning and functional analysis of 9-cis-epoxycarotenoid dioxygenase (NCED) genes encoding a key enzyme during abscisic acid biosynthesis from peach and grape fruits. J. Plant Physiol. 2009, 166, 1241–1252. [Google Scholar] [CrossRef]
- Agustí, J.; Zapater, M.; Iglesias, D.J.; Cercós, M.; Tadeo, F.R.; Talón, M. Differential expression of putative 9-cis-epoxycarotenoid dioxygenases and abscisic acid accumulation in water stressed vegetative and reproductive tissues of citrus. Plant Sci. 2007, 172, 85–94. [Google Scholar] [CrossRef]
- Ibdah, M.; Azulay, Y.; Portnoy, V.; Wasserman, B.; Bar, E.; Meir, A.; Burger, Y.; Hirschberg, J.; Schaffer, A.A.; Katzir, N.; Tadmor, Y.; Lewinsohn, E. Functional characterization of CmCCD1, a carotenoid cleavage dioxygenase from melon. Phytochemistry 2006, 67, 1579–1589. [Google Scholar] [CrossRef] [PubMed]
- Santiago, J.; Dupeux, F.; Round, A.; Antoni, R.; Park, S.Y.; Jamin, M.; Cutler, S.R.; Rodriguez, P.L.; Márquez, J.A. The abscisic acid receptor PYR1 in complex with abscisic acid. Nature 2009, 462, 665–668. [Google Scholar] [CrossRef] [PubMed]
- Wang, G.; Qi, K.; Gao, X.; Guo, L.; Cao,P. ; Li, Q.; Qiao, X.; Gu, C.; Zhang, S. Genome-wide identification and comparative analysis of the PYL gene family on eight Rosacease species and expression analysis of seeds germination in pear. BMC Genomics 2022, 23, 233. [Google Scholar] [CrossRef]
- Zhao, Y.; Qi, G.; Ren, F.; Wang, Y.; Wang, P.; Wu, X. Analysis of PYL genes and their potential relevance to stress tolerance and berry ripening in grape. J. Amer. Soc. Hort. Sci. 2020, 145, 308–317. [Google Scholar] [CrossRef]
- Romero, P.; Lafuente, M.T.; Rodrigo, M.J. The citrus ABA signalosome: Identification and transcriptional regulation during sweet orange fruit ripening and leaf dehydration. J. Exp. Bot. 2012, 63, 4931–4945. [Google Scholar] [CrossRef]
- Gonzalez-Guzman, M.; Pizzio, G.A.; Antoni, R.; Vera-Sirera, F.; Merilo, E.; Bassel, G.W.; Fernandez, M.A.; Holdsworth, M.J.; Perez-Amador, M.A.; Kollist, H.; et al. Arabidopsis PYR/PYL/RCAR receptors play a major role in quantitative regulation of stomatal aperture and transcriptional response to abscisic acid. Plant Cell 2012, 24, 2483–2496. [Google Scholar] [CrossRef]
- Kai, W.; Wang, J.; Liang, B.; Fu, Y.; Zheng, Y.; Zhang, W.; Li, Q.; Leng, P. PYL9 is involved in the regulation of ABA signaling during tomato fruit ripening. J. Exp. Bot. 2019, 70, 6305–6319. [Google Scholar] [CrossRef]
- Jung, S.; Lee, T.; Cheng, C.-H.; Buble, K.; Zheng, P.; Yu, J.; Humann, J.; Ficklin, S. P.; Gasic, K.; Scott, K.; Frank, M.; Ru, S.; Hough, H.; Evans, K.; Peace, C.; Olmstead, M.; DeVetter, L. W.; McFerson, J.; Coe, M.; … Main, D. 15 years of GDR: New data and functionality in the Genome Database for Rosaceae. Nucleic Acids Res. 2019, 47, D1137–D1145. [Google Scholar] [CrossRef]
- Gaete-Eastman, C.; Mattus-Araya, E.; Herrera, R.; Moya-León, M.A. Evaluation of reference genes for transcript normalization in Fragaria chiloensis fruit and vegetative tissues. Physiol. Mol. Biol. Plants 2022, 28, 1535–1544. [Google Scholar] [CrossRef]
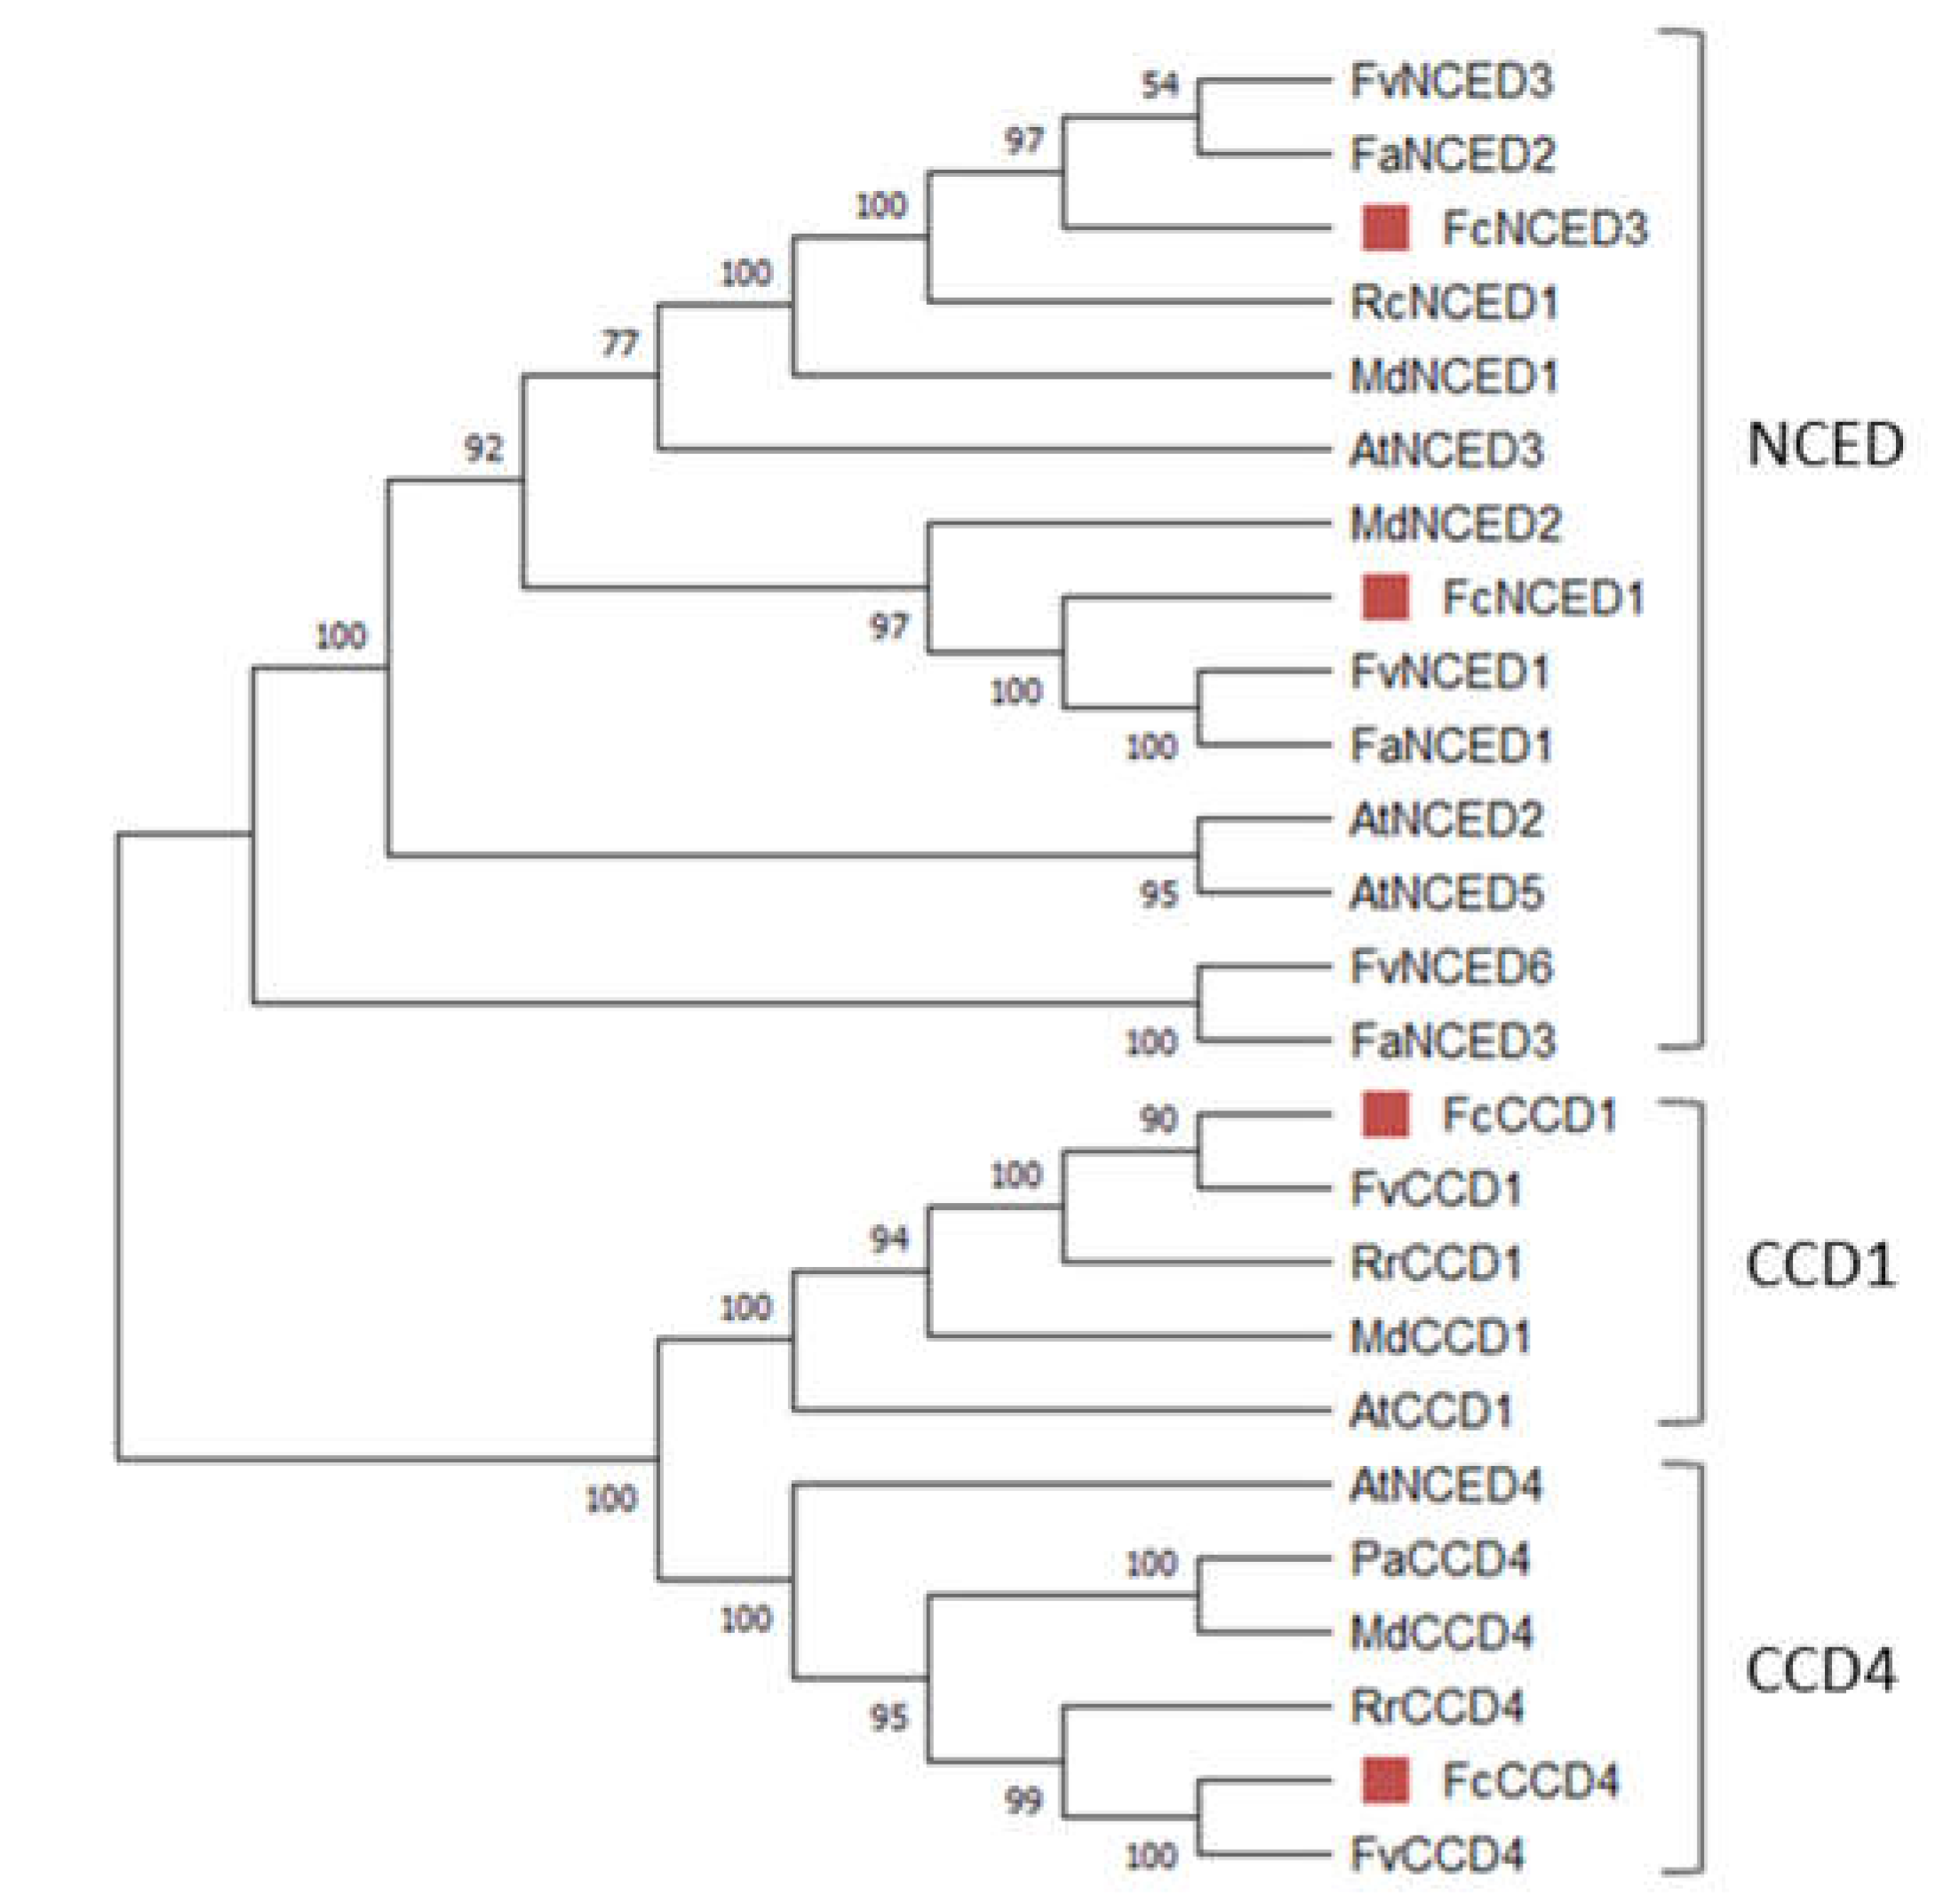
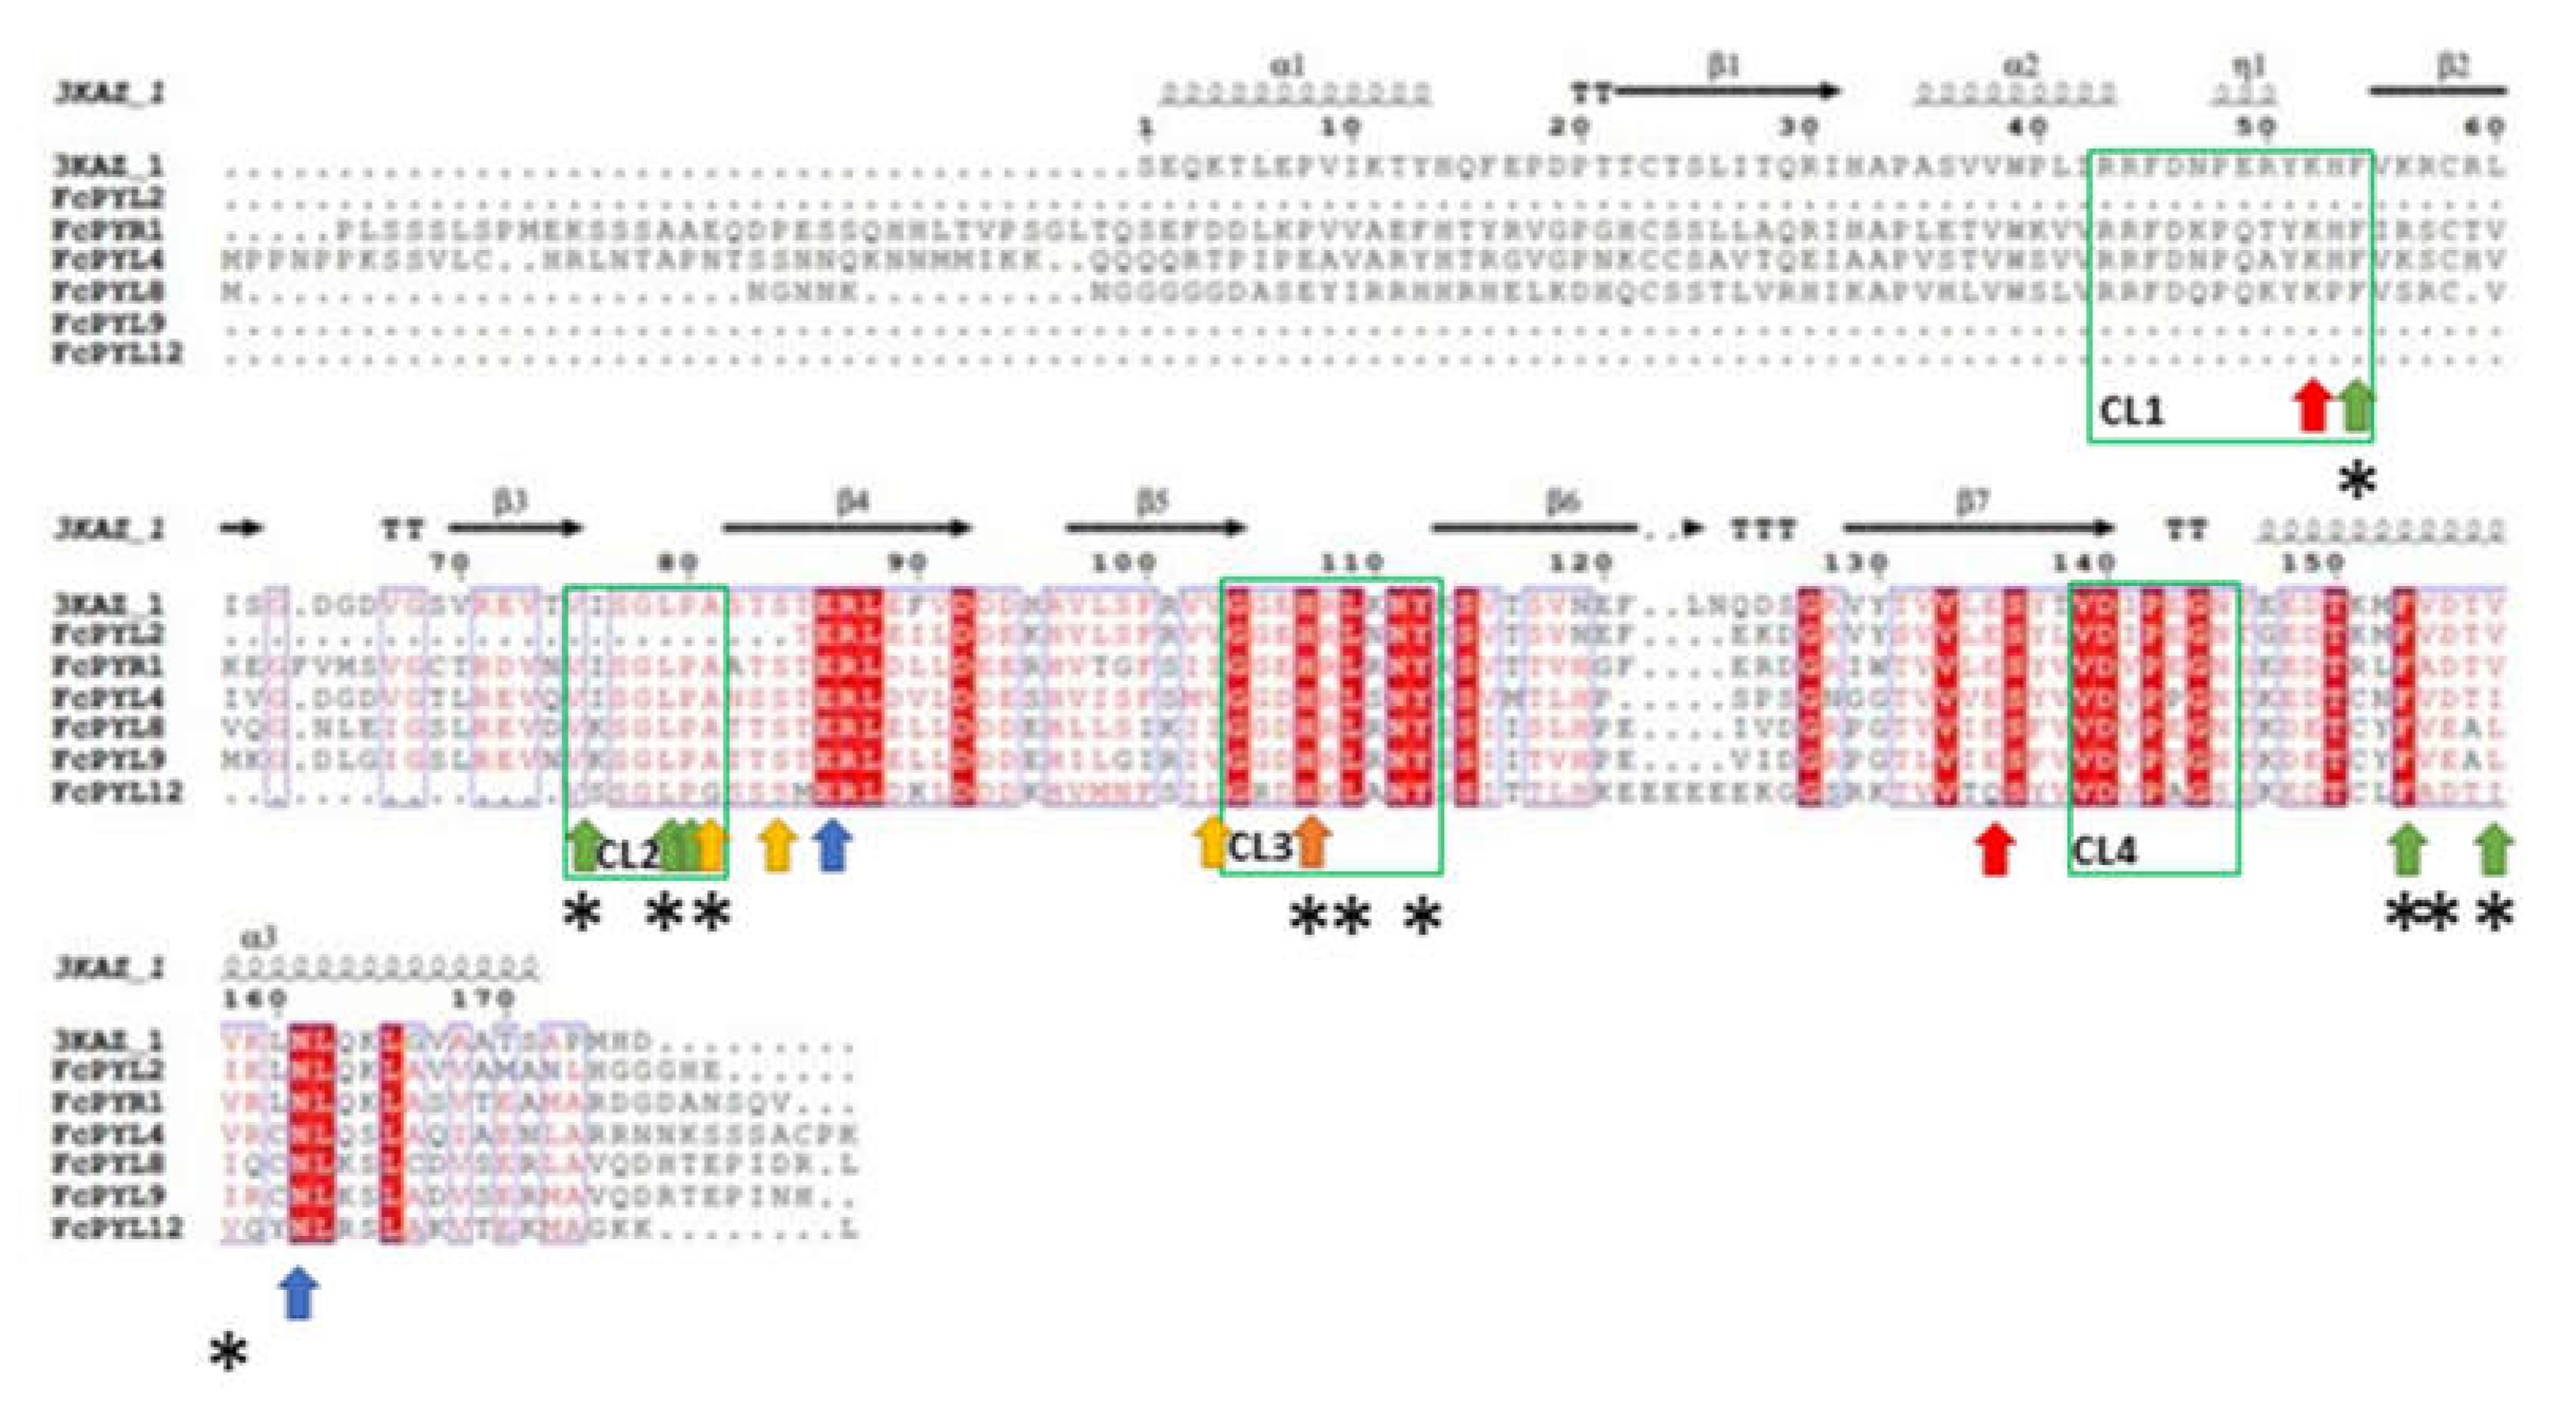
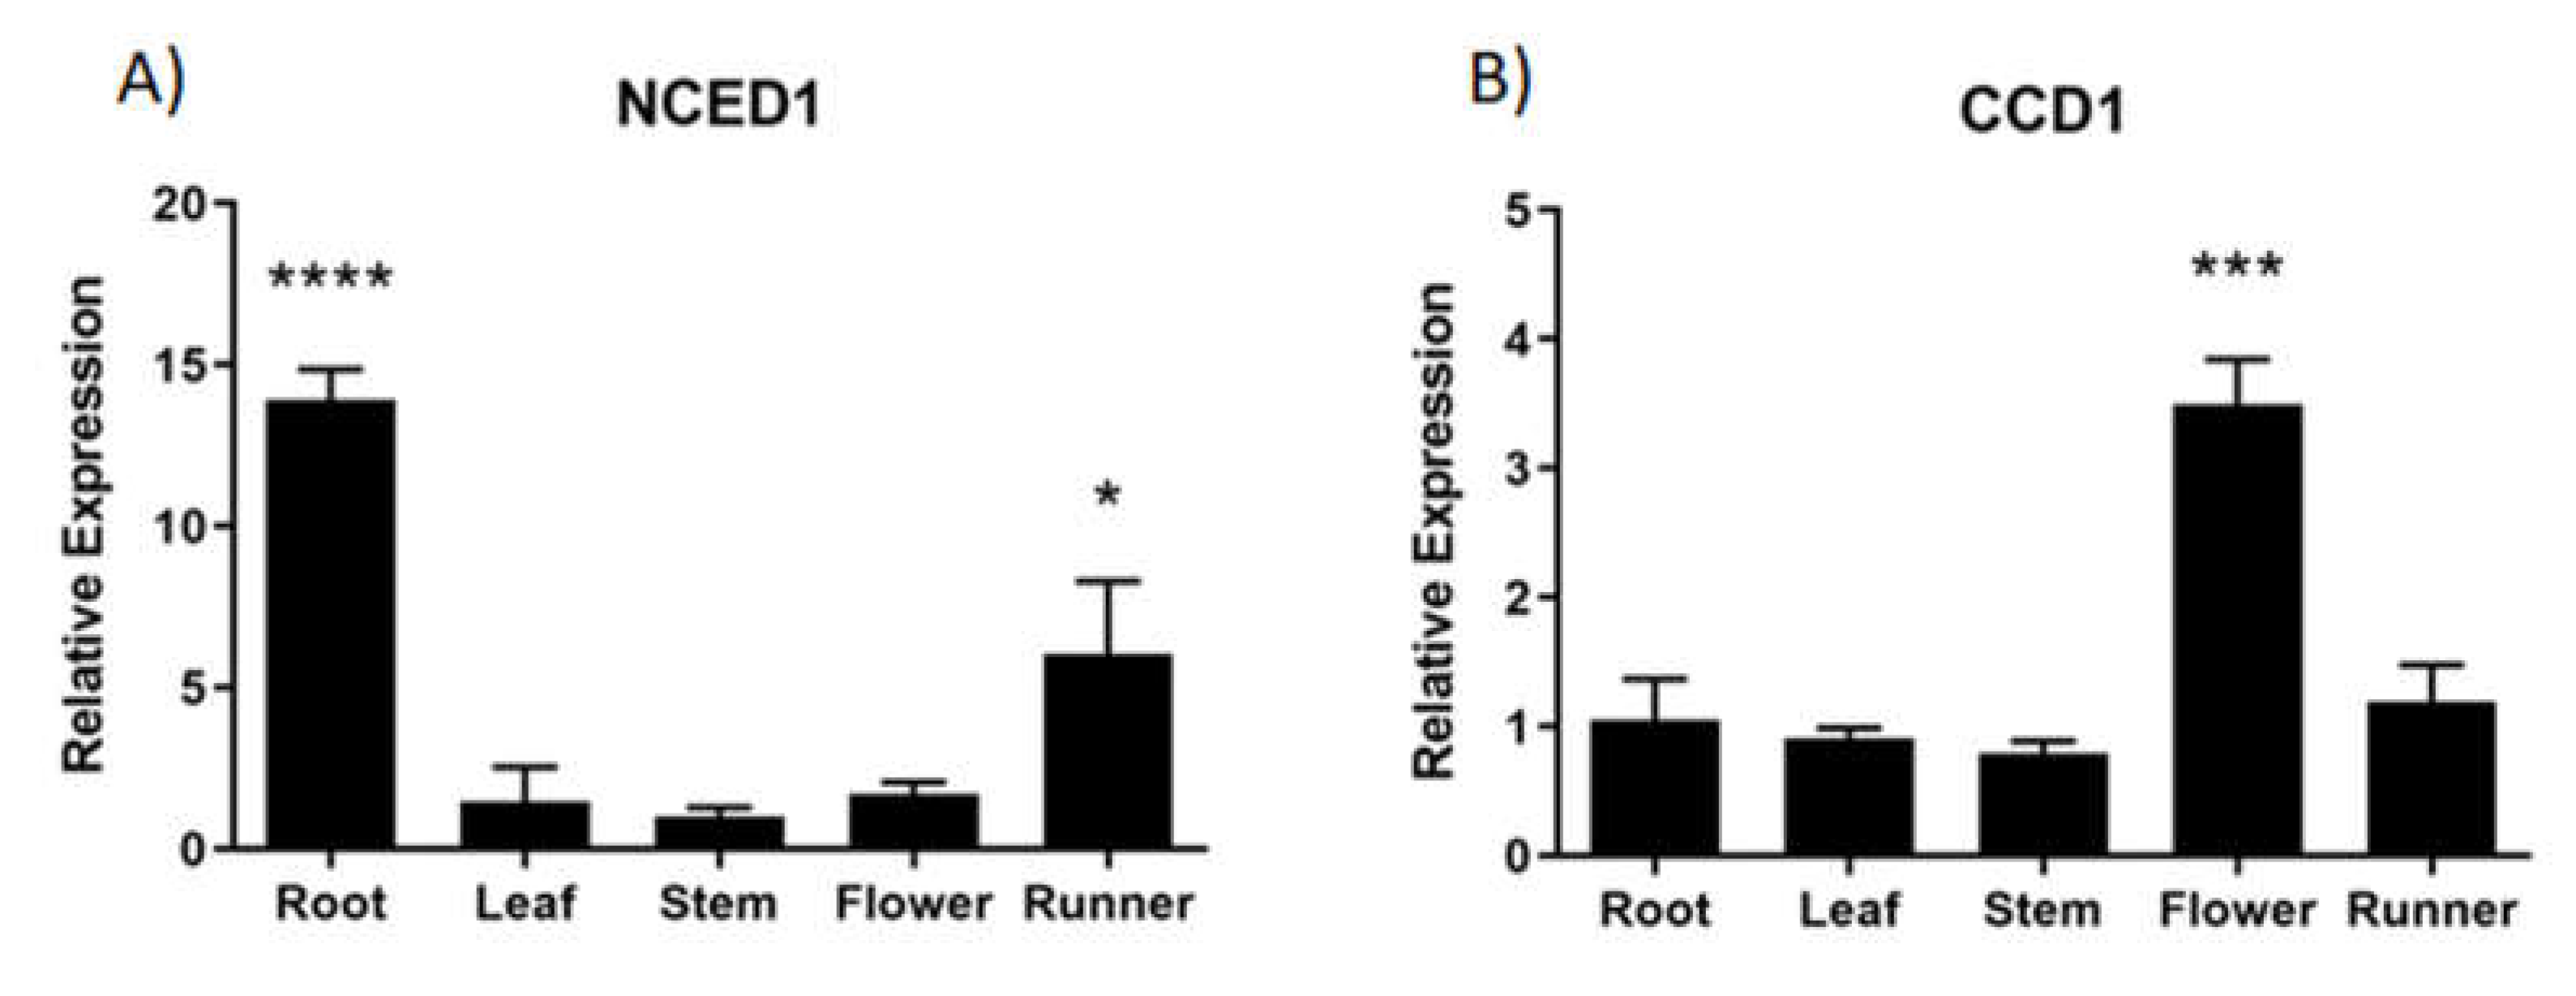
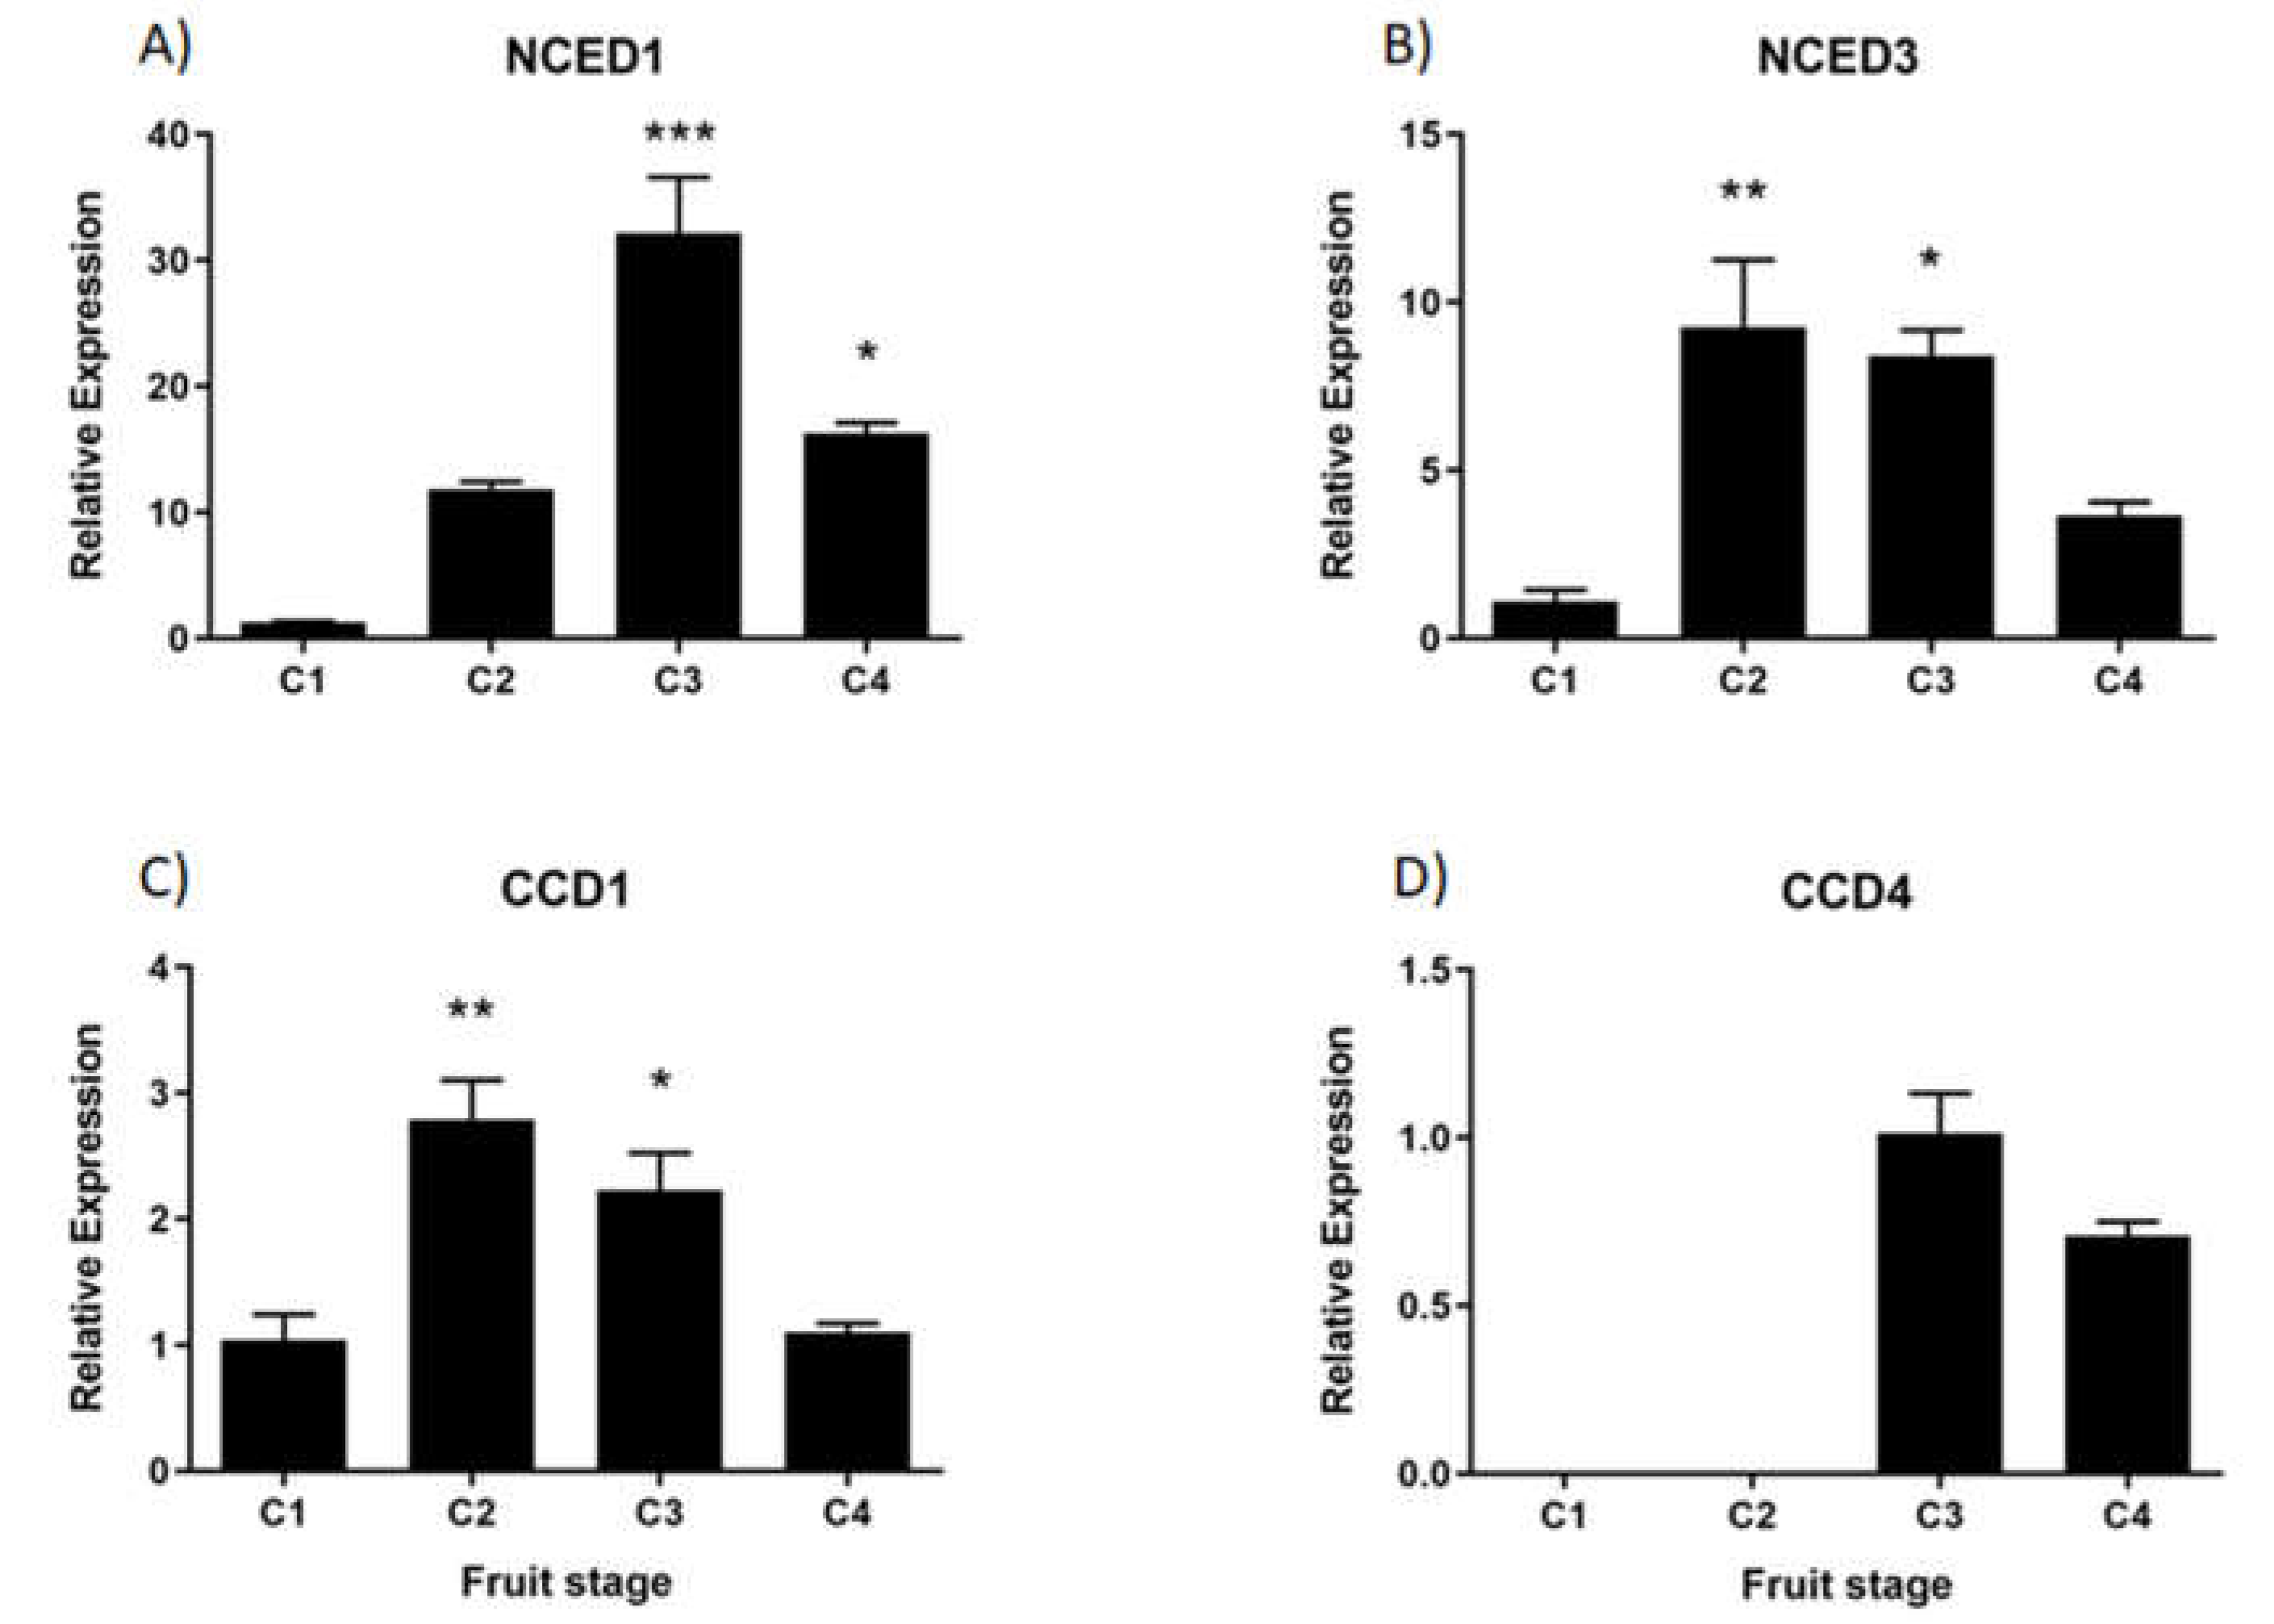
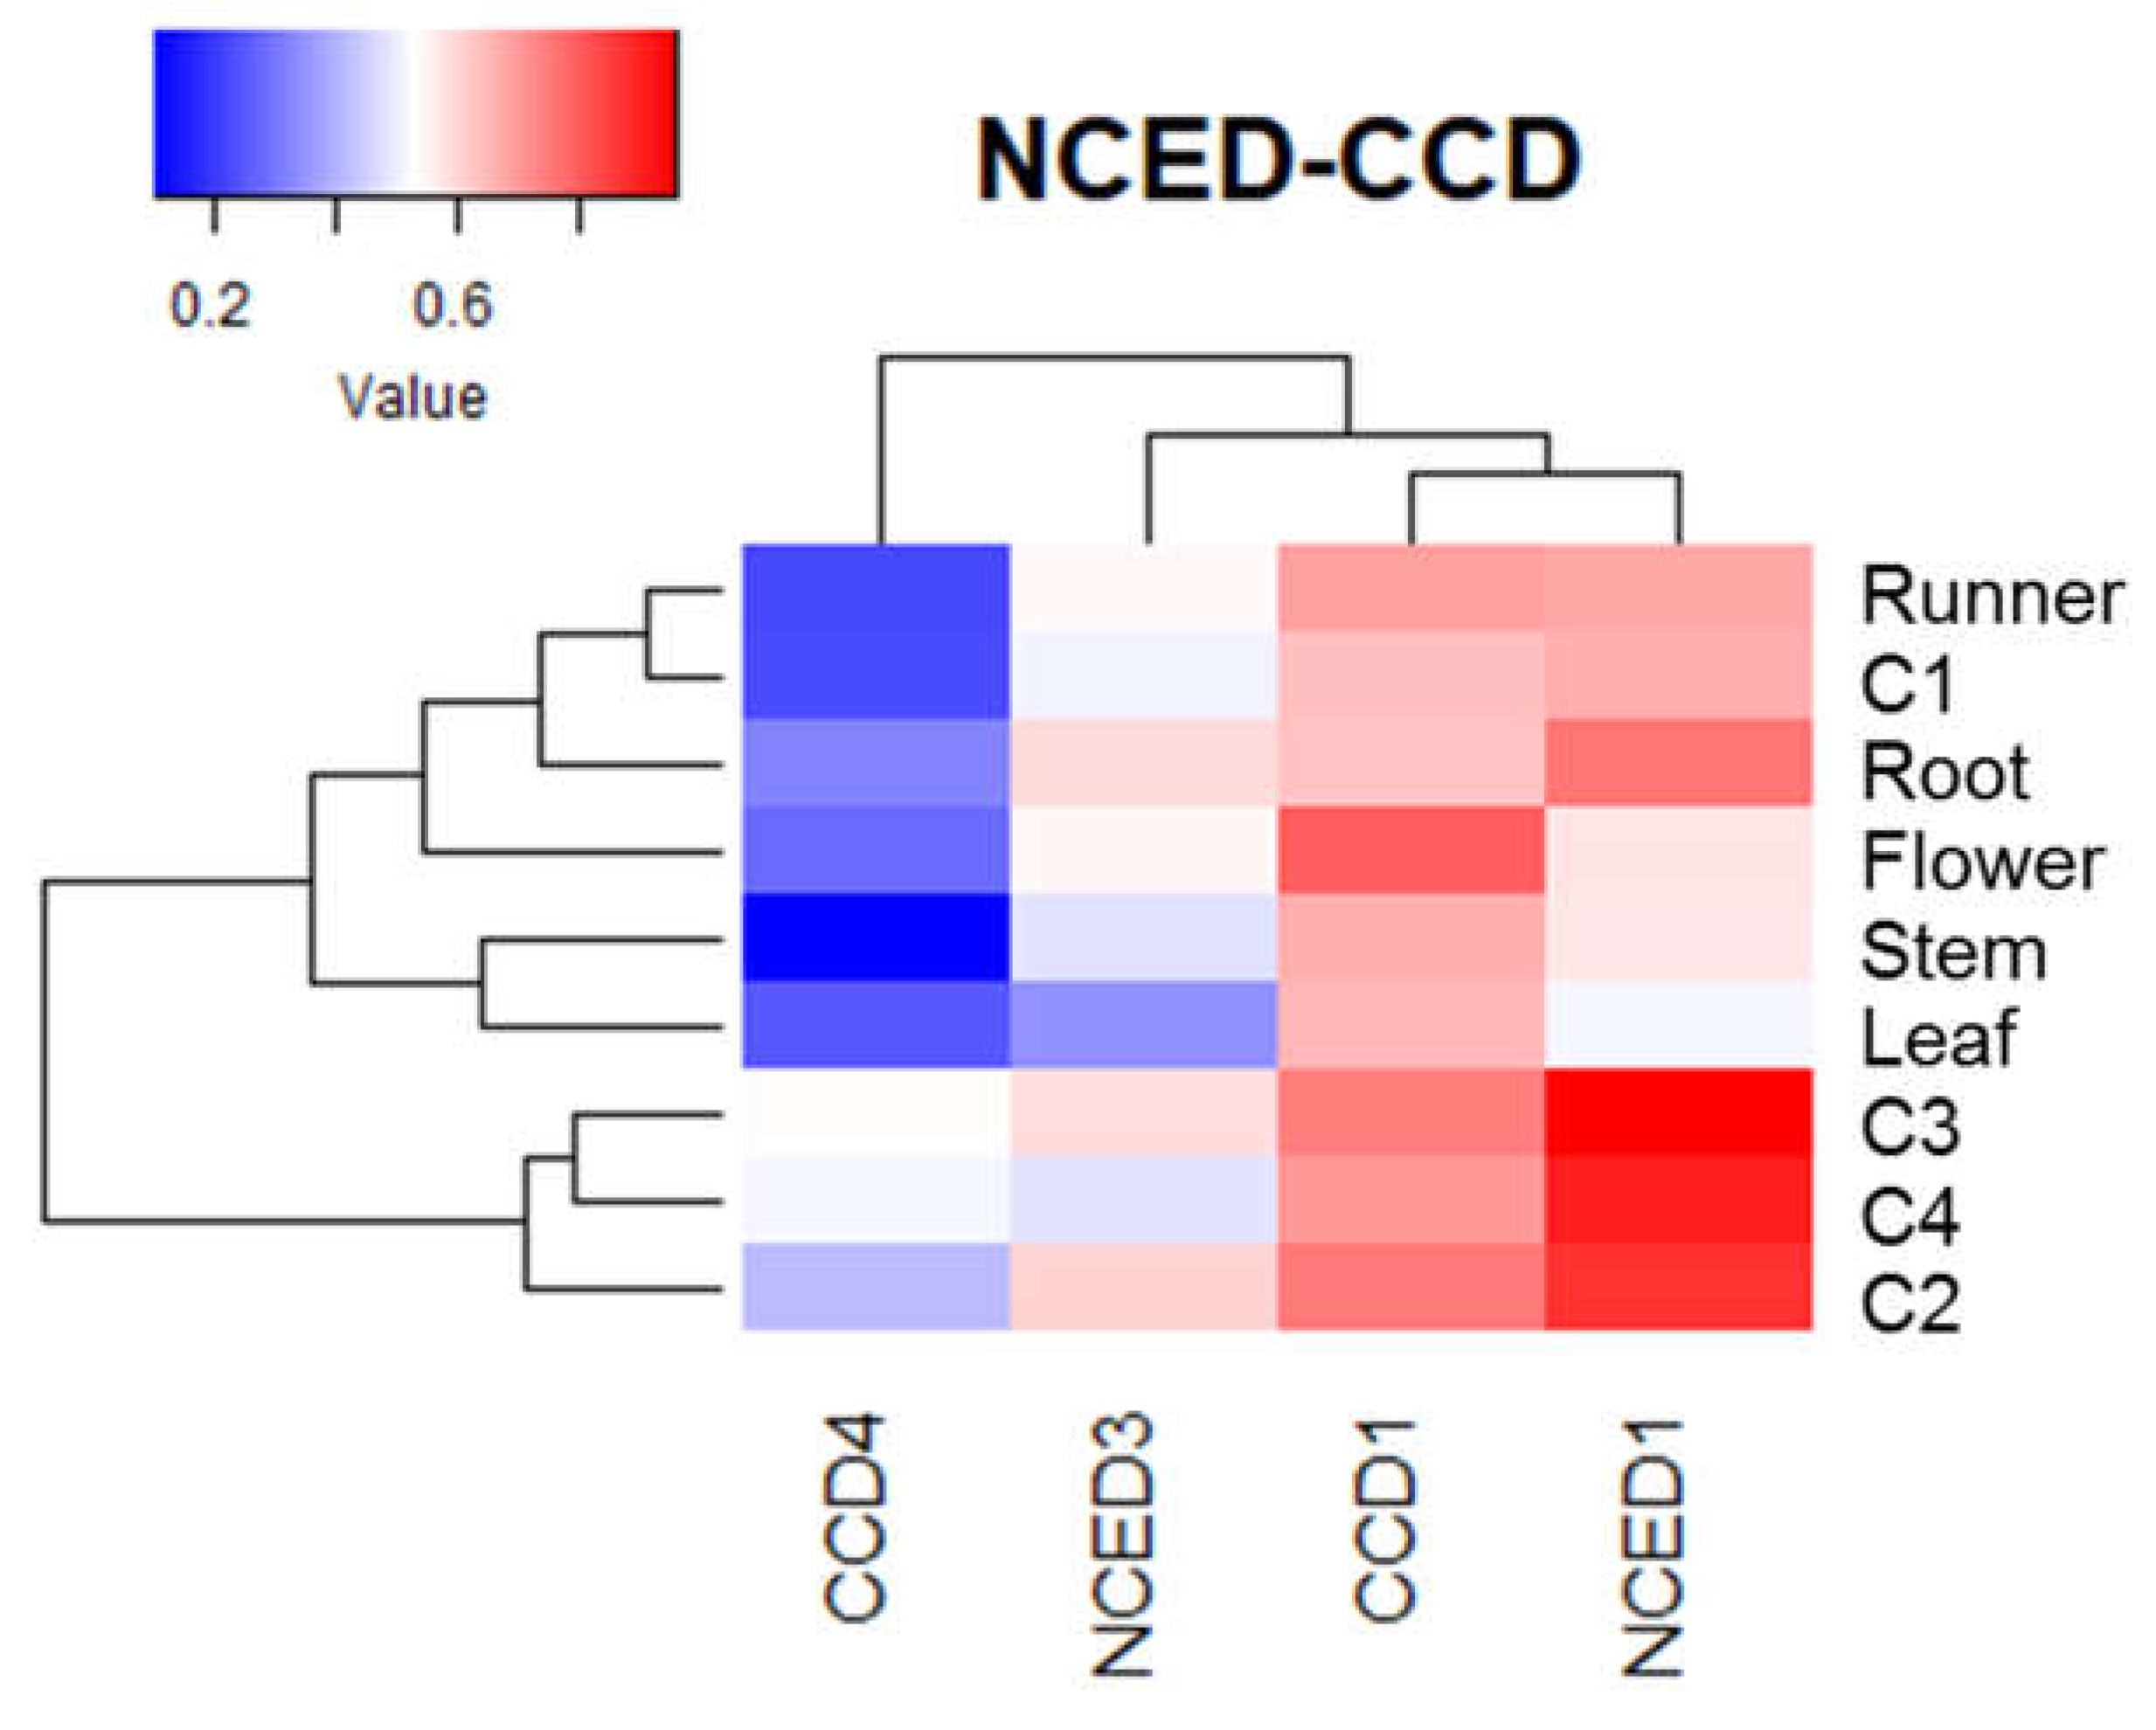
| Gene | Transcript ID | Domain Type | Seq Length (aa) |
|---|---|---|---|
| FcNCED1 | comp919_c0_seq1 | Retinal pigment epithelial membrane protein | 501 |
| FcNCED3 | comp27198_c0_seq1 | Retinal pigment epithelial membrane protein | 392 |
| FcCCD1 | comp799_c0_seq1 | Retinal pigment epithelial membrane protein | 568 |
| FcCCD4 | comp503_c0_seq1 | Retinal pigment epithelial membrane protein | 581 |
| Gene | Transcript ID | Domain Type | Seq Length (aa) |
|---|---|---|---|
| FcPYR1 | comp13086_c0_seq1 | Polyketide cyclase/dehydrase and lipid transport | 216 |
| FcPYL2 | comp7632_c0_seq1 | ND | 93 |
| FcPYL4 | comp22550_c0_seq1 | Polyketide cyclase/dehydrase and lipid transport | 218 |
| FcPYL8 | comp2447_c0_seq3 | Polyketide cyclase/dehydrase and lipid transport | 189 |
| FcPYL9 | comp3997_c0_seq2 | Polyketide cyclase/dehydrase and lipid transport | 121 |
| FcPYL12 | comp2932_c0_seq1 | Polyketide cyclase/dehydrase and lipid transport | 167 |
| Gene | Sequence (5’ → 3’) | Efficiency | |
|---|---|---|---|
| FcNCED1 | Fw | GATCTACCTTGGCGAAACCA | 90.0% |
| Rv | GAGGCGGATCATGTGAACTT | ||
| FcNCED3 | Fw | ACGACTTCGCCATTACCG | 92.1% |
| Rv | AGCATCGCTCGATTCT | ||
| FcCCD1 | Fw | GCCAAGCATATGACACTCCTC | 98.0% |
| Rv | TCCTCGTTAGAAGGCCTGAA | ||
| FcCCD4 | Fw | CATTCCCGACCAAGATAGGA | 94.3% |
| Rv | GCCGTCCTTTGAGTAAACC | ||
| FcPYL2 | Fw | GCCATGGTGGTCAACTGTTA | 100.5% |
| Rv | CTGGGATTCTGGGGTACAC | ||
| FcPYL4 | Fw | ATGCCTCCCAACCCACCCAA | 104.0% |
| Rv | CGCTGCTGCTGCTGCTTCTT | ||
| FcPYL8 | Fw | TGAAGCTTCCGAGCTTTCAT | 92.1% |
| Rv | GGTCCTTAAACTTTGACGGAAG | ||
| FcPYL9 | Fw | GATGCACCTGCTAACAAAAGG | 90.1% |
| Rv | CAATCGTGTTTCTCATTTGTGC | ||
| FcPYL11 | Fw | GAAAGGATGGCTGGTAATTGA | 91.0% |
| Rv | CGCTACAACAAGAAGTCAAGAA | ||
| FcPYL12 | Fw | TTTCCTATCCTGCTGCTGCT | 96.1% |
| Rv | GCTTAGAATCCGAAACGGACTA | ||
| FcPYR1 | Fw | GCTACCCAAATTGCTGAACC | 99.3% |
| Rv | GAATGACGAAAATGTCCTTGG | ||
Disclaimer/Publisher’s Note: The statements, opinions and data contained in all publications are solely those of the individual author(s) and contributor(s) and not of MDPI and/or the editor(s). MDPI and/or the editor(s) disclaim responsibility for any injury to people or property resulting from any ideas, methods, instructions or products referred to in the content. |
© 2023 by the authors. Licensee MDPI, Basel, Switzerland. This article is an open access article distributed under the terms and conditions of the Creative Commons Attribution (CC BY) license (http://creativecommons.org/licenses/by/4.0/).


