3.1. Mesoporous Bioactive Glass MBG 80S15
MBG synthesis was performed by sol-gel method using Pluronic F127 as a structure-directing agent. During the synthesis process, the evaporation of organic solvent progressively increases the block copolymer concentration. When the concentration of Pluronic F127 reaches the critical micelle concentration, micellar aggregates form through the self-assembly process of silica-surfactant composite micelles, which organize into liquid-crystalline mesophases. Calcination process allows to remove the organic surfactant template and retain inorganic framework to obtain highly ordered mesostructured bioactive glass materials [
9], [
18].
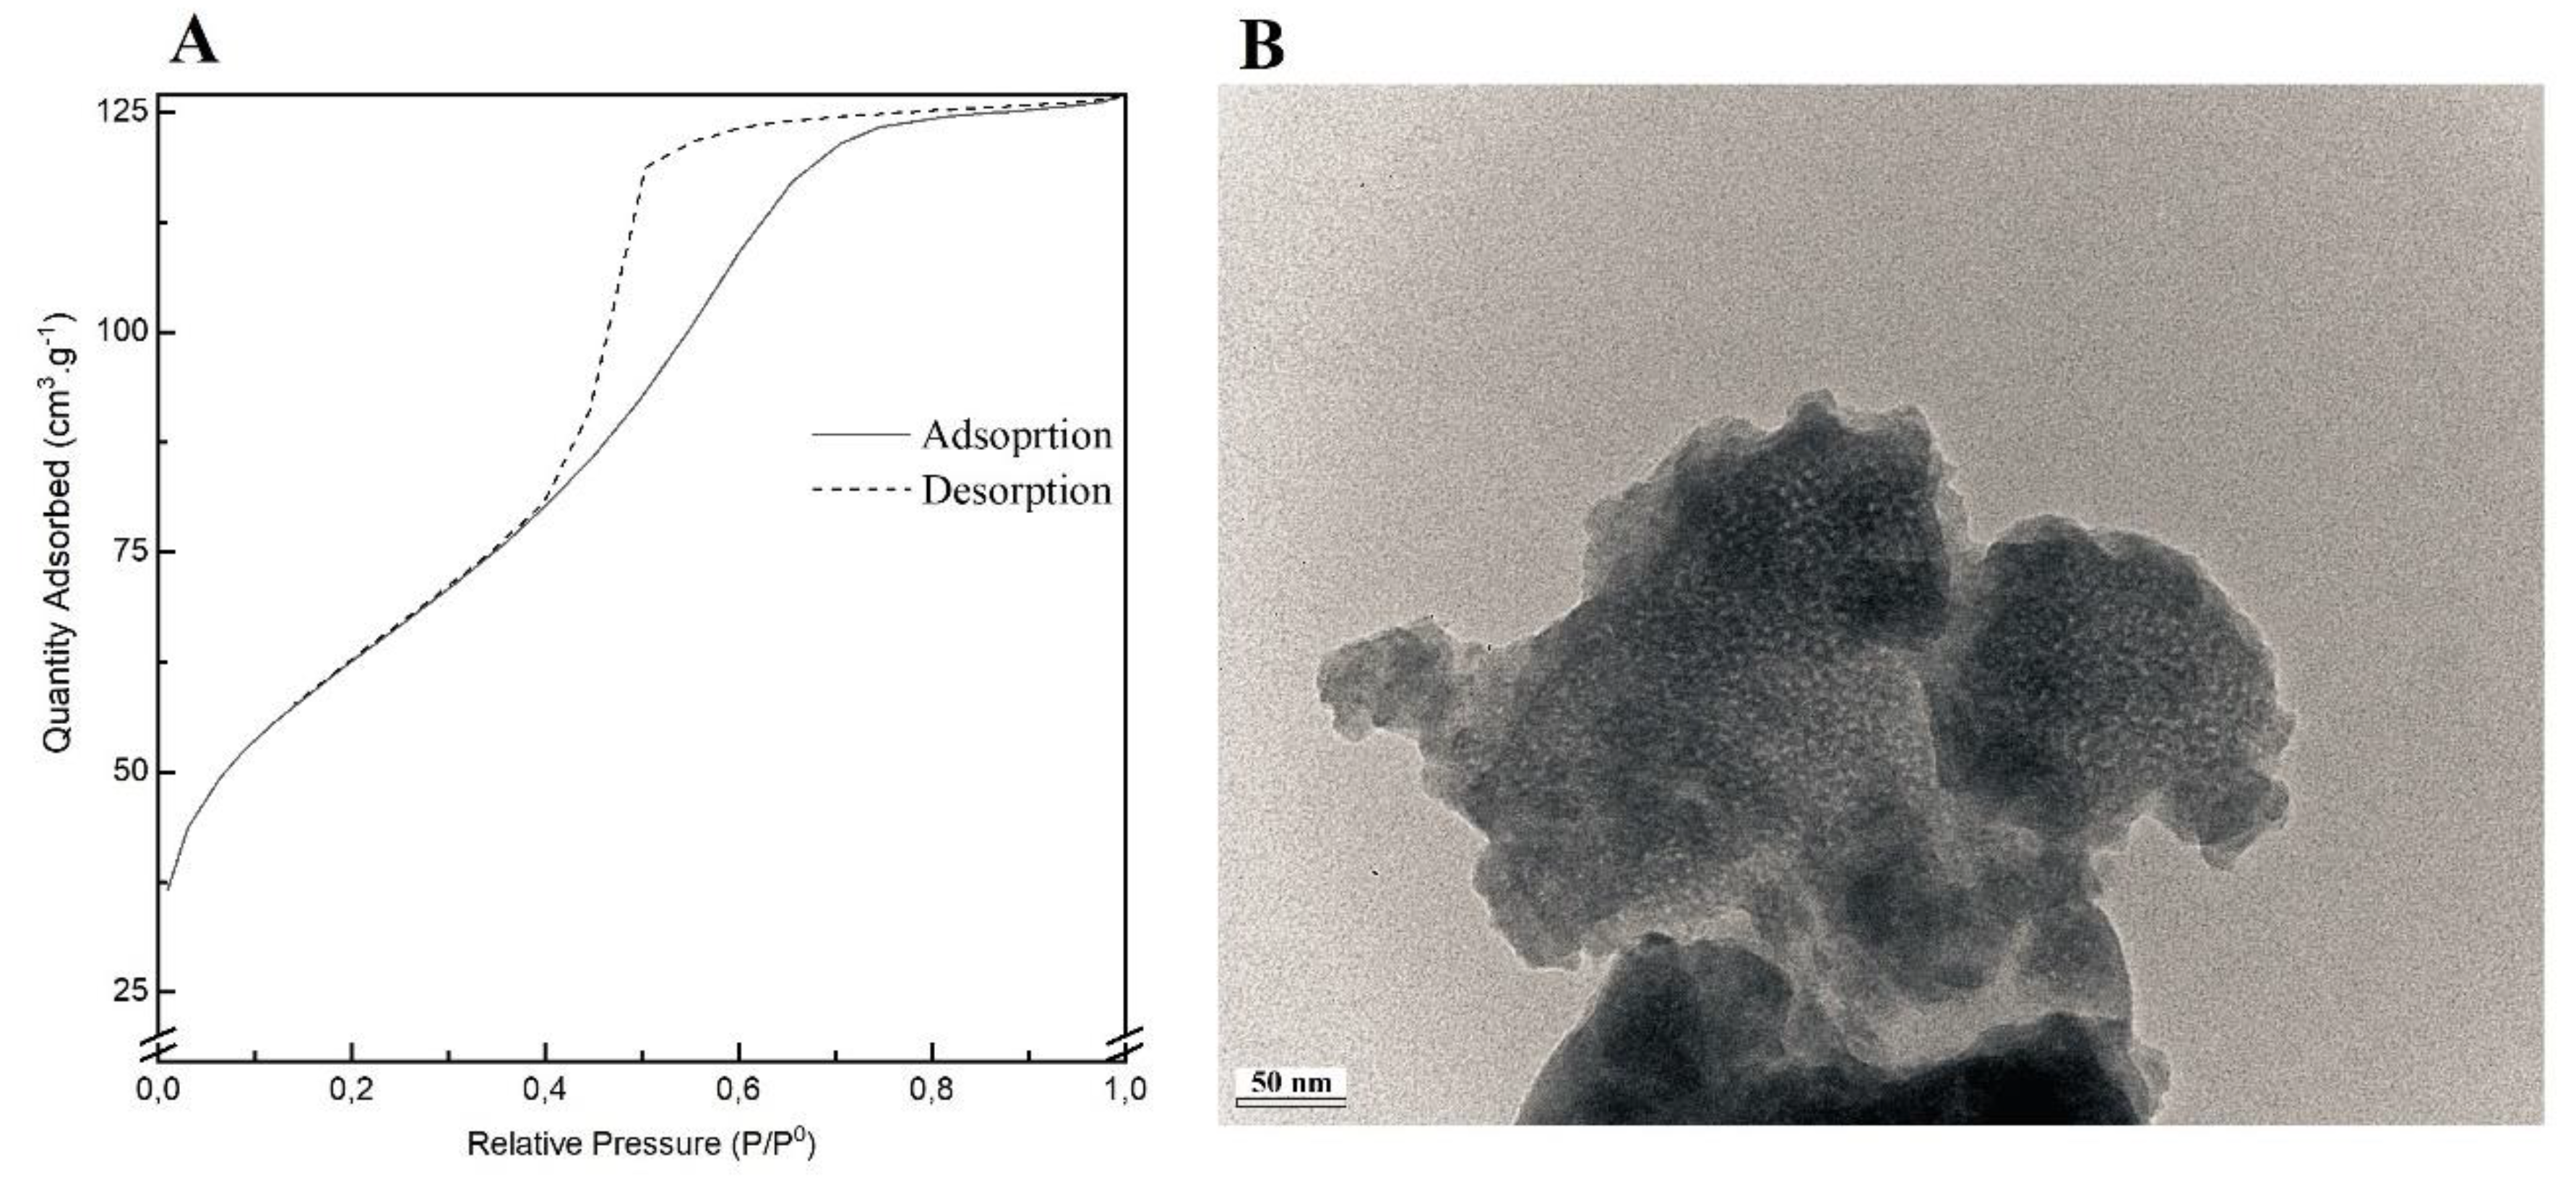
Figure 1A shows the nitrogen adsorption-desorption isotherms of the MBG 80S15 calcined powder. The shape of the isotherms corresponds to type IV, typical of a mesoporous structure. Furthermore, the sample shows the type H1 hysteresis loops in the relative pressure of about 0.40, which features the cylindrical pores, in accordance with the p6mm mesostructure. The BET surface area of the MBG calculated from the linear part of the BET plot reached 232 m2.g-1. The pore size distribution curves were calculated from the adsorption and desorption branches using the BJH model. The MBG presents a relatively narrow pore size distribution, and the peak pore size was around 5.9 nm and 6.0 nm for adsorption and desorption branches, respectively. This proximity between pore size results can be an indicator of a perfect cylindrical channel. The pore volume was also calculated using the BJH model and the result was about 0.25 cm3.g-1 for both the adsorption and desorption branches.
TEM image of MBG 80S15 is shown in Figure 1B. It can be observed brighter spot areas, which can be an indicator of the mesoporous structure as expected. However, the cylindrical ordered structure of the mesoporous is not evident. Analysis of sample structure by TEM is hindered by the powder aggregation due to multiple layers formation, which increases the sample opacity. On the other hand, the TEM equipment resolution also limits the proper visualization of the MBG mesoporosity.
Figure 1.
Nitrogen adsorption-desorption isotherms (A) and TEM image (B) of MBG 80S15 powder.
Figure 1.
Nitrogen adsorption-desorption isotherms (A) and TEM image (B) of MBG 80S15 powder.
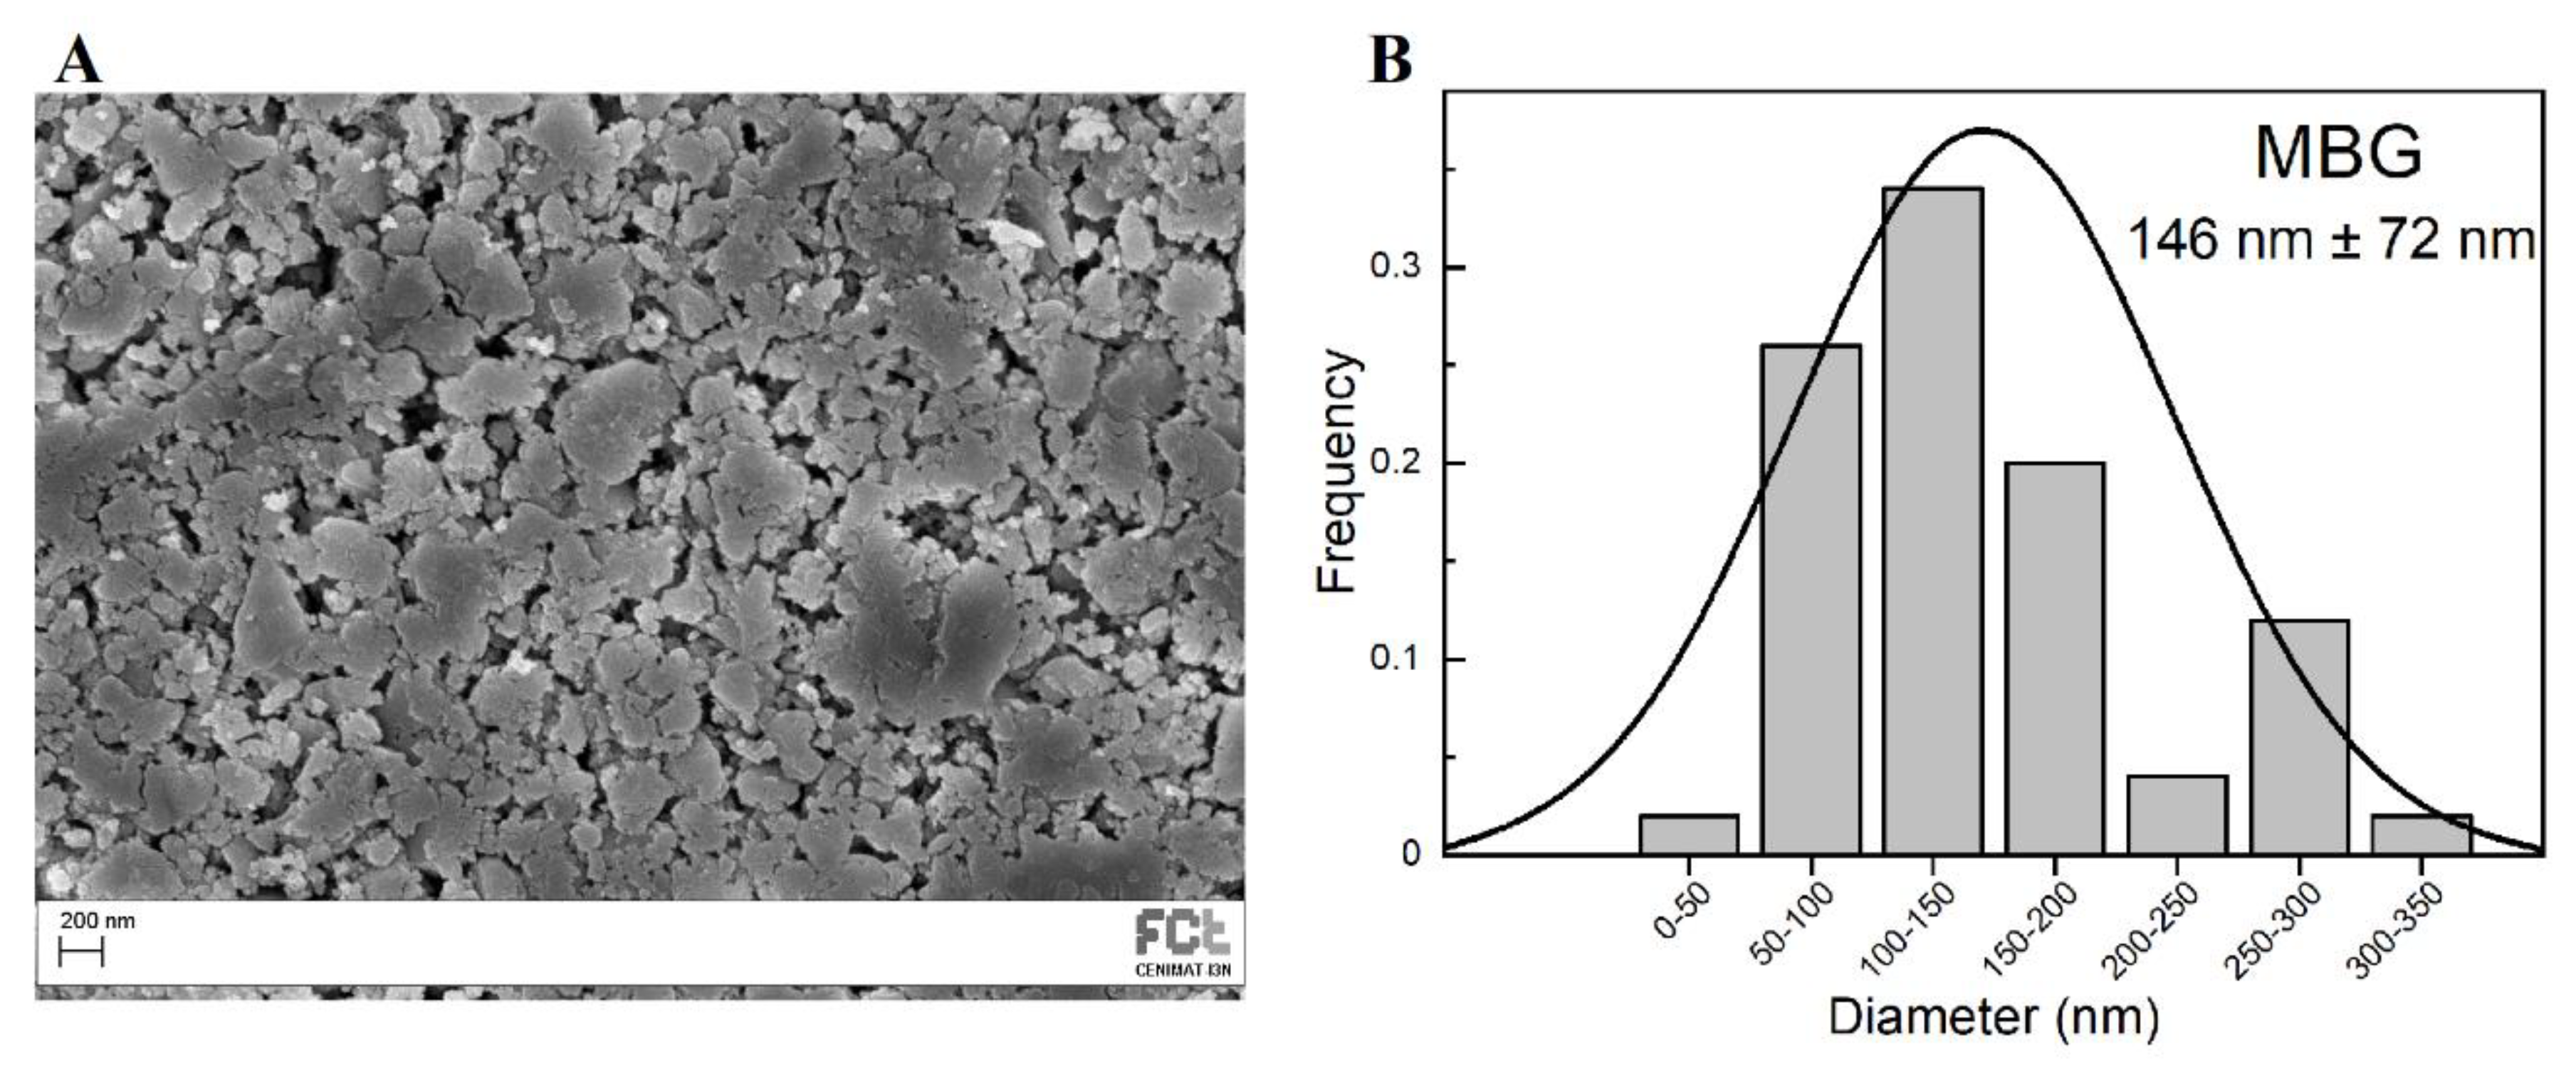
SEM image of produced MBG 80S15 after 6 h of planetary ball-milling is presented in Figure 2A. It can be observed that the size of MBG particles is in the nanoscale range as shown in the respective particle size distribution graph Figure 2B. The average diameter of MBG particles is around 146 ± 72 nm. It is worth pointing out the reduced dimensions of these particles considering they become easier to disperse in an electrospinning solution compared to micro-sized MBG particles.
Figure 2.
SEM image of MBG 80S15 pellet (A) and the respective particle size distribution graph after 6 h of ball-milling (B).
Figure 2.
SEM image of MBG 80S15 pellet (A) and the respective particle size distribution graph after 6 h of ball-milling (B).
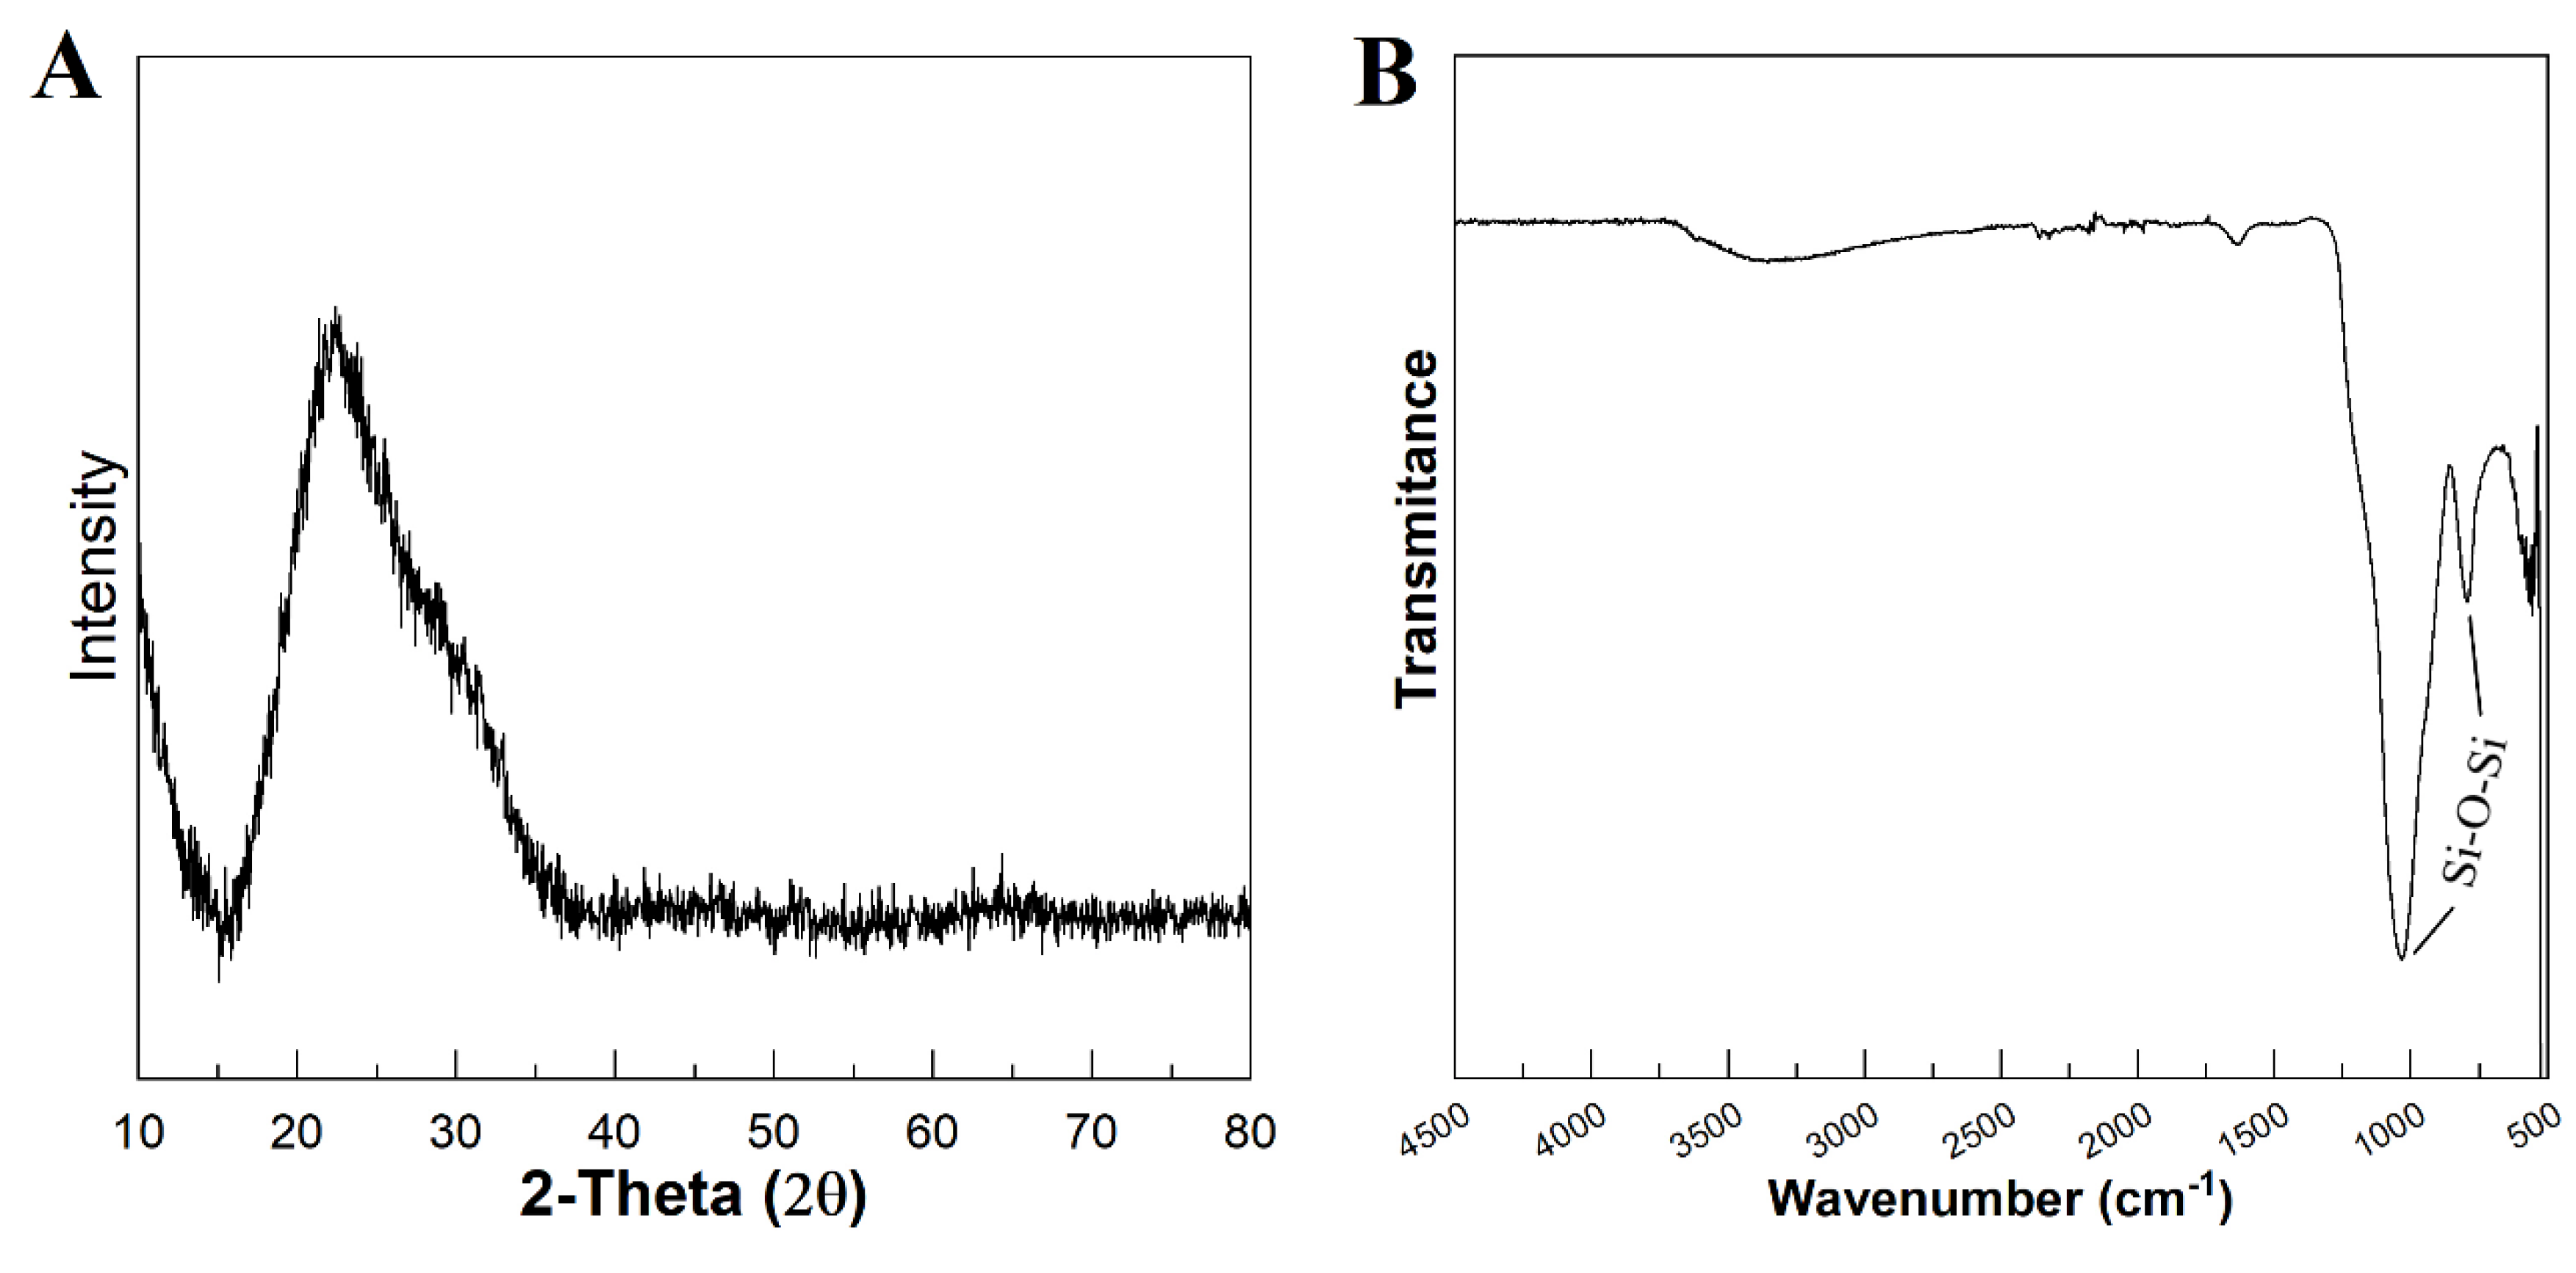
Figure 3 A represents the XRD pattern of the produced MBG 80S15. It can be observed that there are no diffraction peaks appearing on the pattern of the sample, except a broad reflection at 2θ = 15–35° (characteristic of silicate glasses) which suggests that produced MBG 80S15 exist in amorphous state. The temperature assigned to the occurrence of crystallization is about 810 °C [
18]. It is important to note that MBG was calcinated at 700 °C to ensure that mesoporous structure keeps its stability. When the MBGs are calcined at temperatures higher than 810 °C, the inorganic wall becomes crystalline and the mesostructure collapses.
Figure 3.
XRD pattern (A) and FTIR spectra (B) of MBG 80S15 powder calcined at 700 °C for 5 h.
Figure 3.
XRD pattern (A) and FTIR spectra (B) of MBG 80S15 powder calcined at 700 °C for 5 h.
Figure 3 B shows the FTIR spectrum of the produced MBG 80S15 powder. It is shown that the sample exhibit characteristic absorption bands of a silicate glass. The spectrum shows the Si-O-Si asymmetrical stretching vibration at 1040 cm-1 and Si-O-Si symmetrical stretching vibration at 806 cm-1. The band associated to Si-O bending (rocking) vibration at 470 cm-1 was not detected due to the equipment resolution (the measuring process starts at 500 cm-1) [19, 20].
3.4. Mechanical Response – Tensile Tests
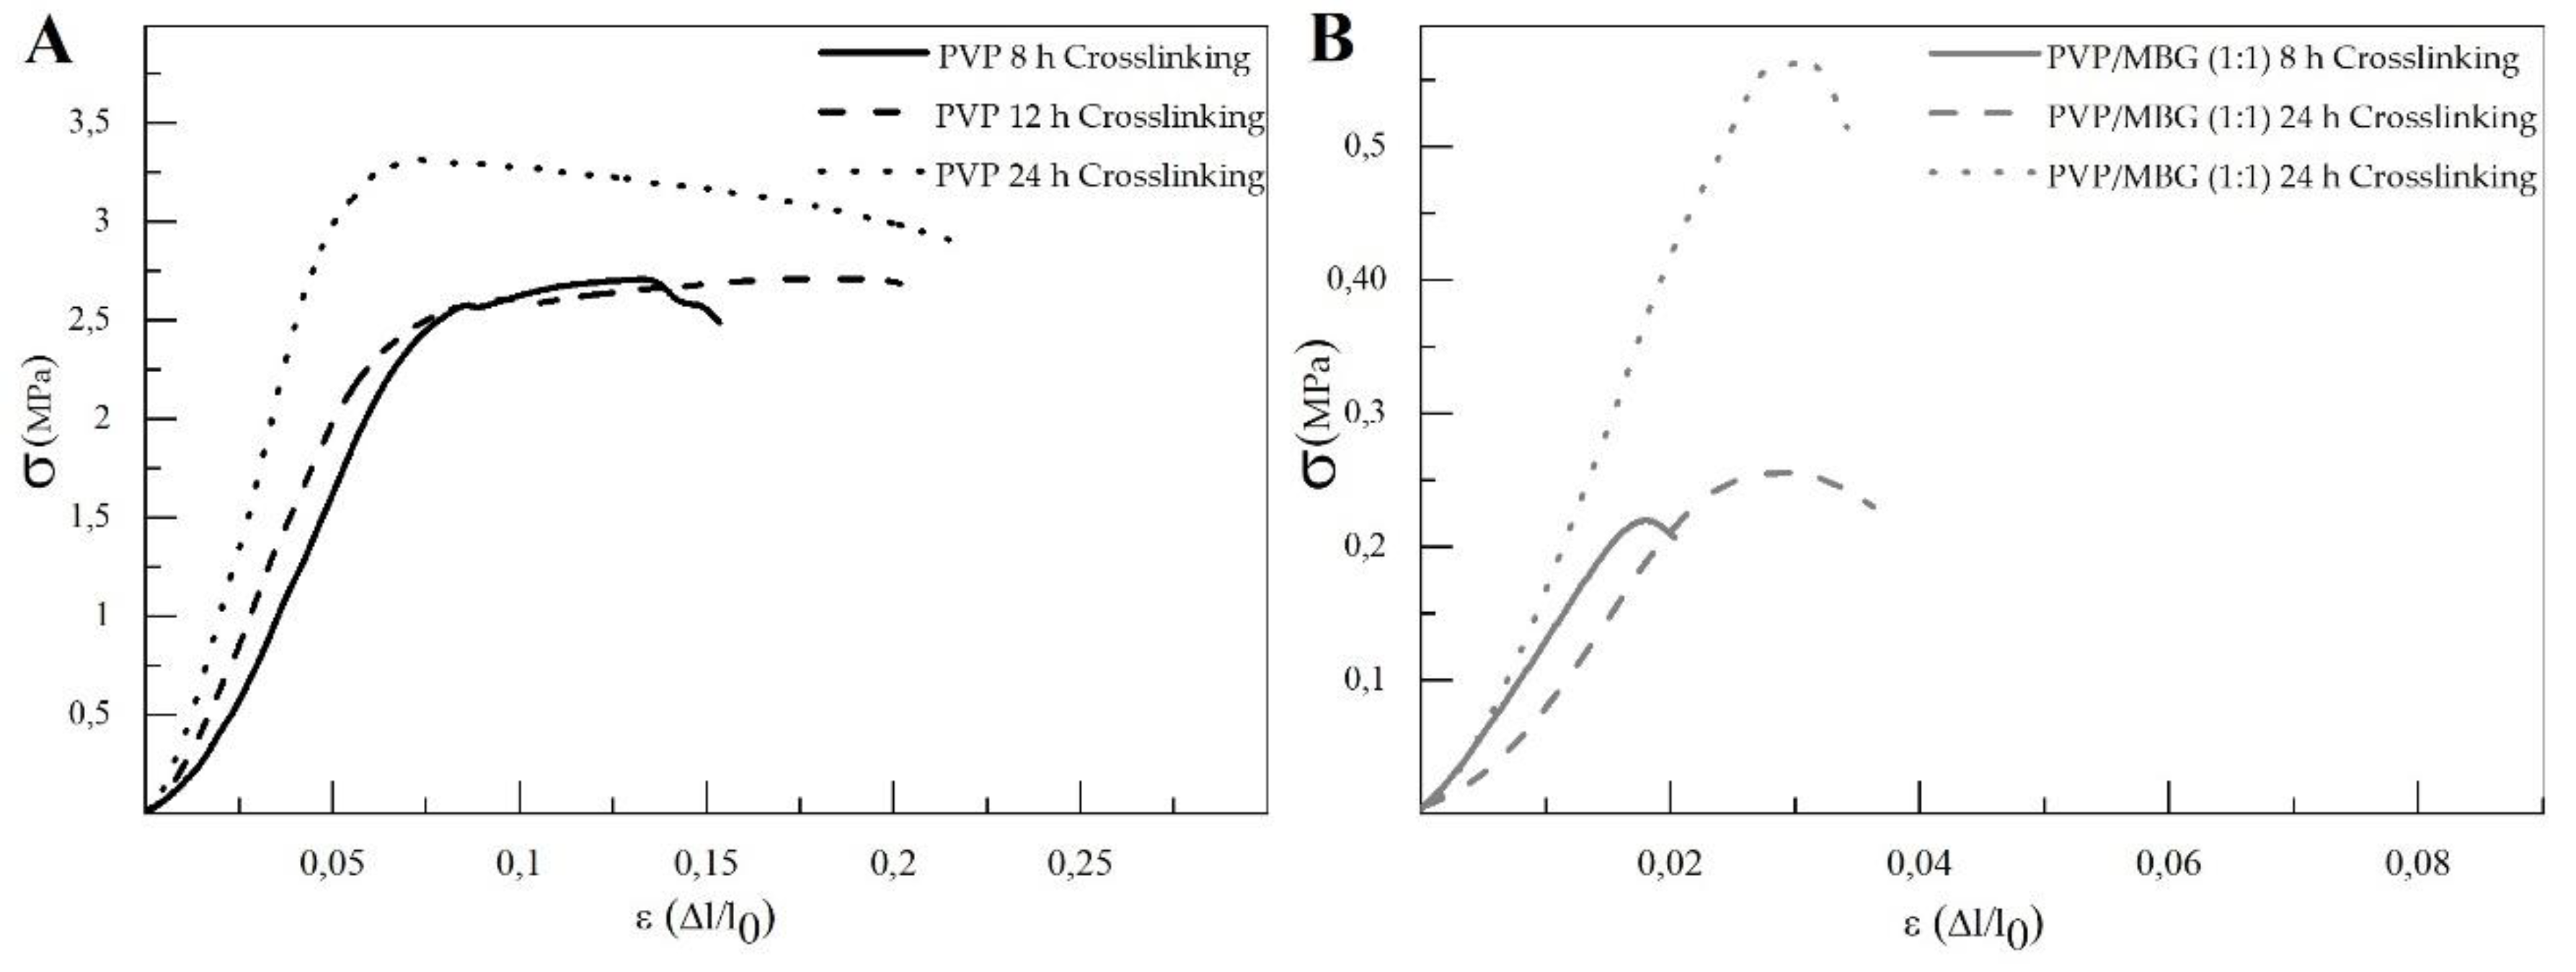
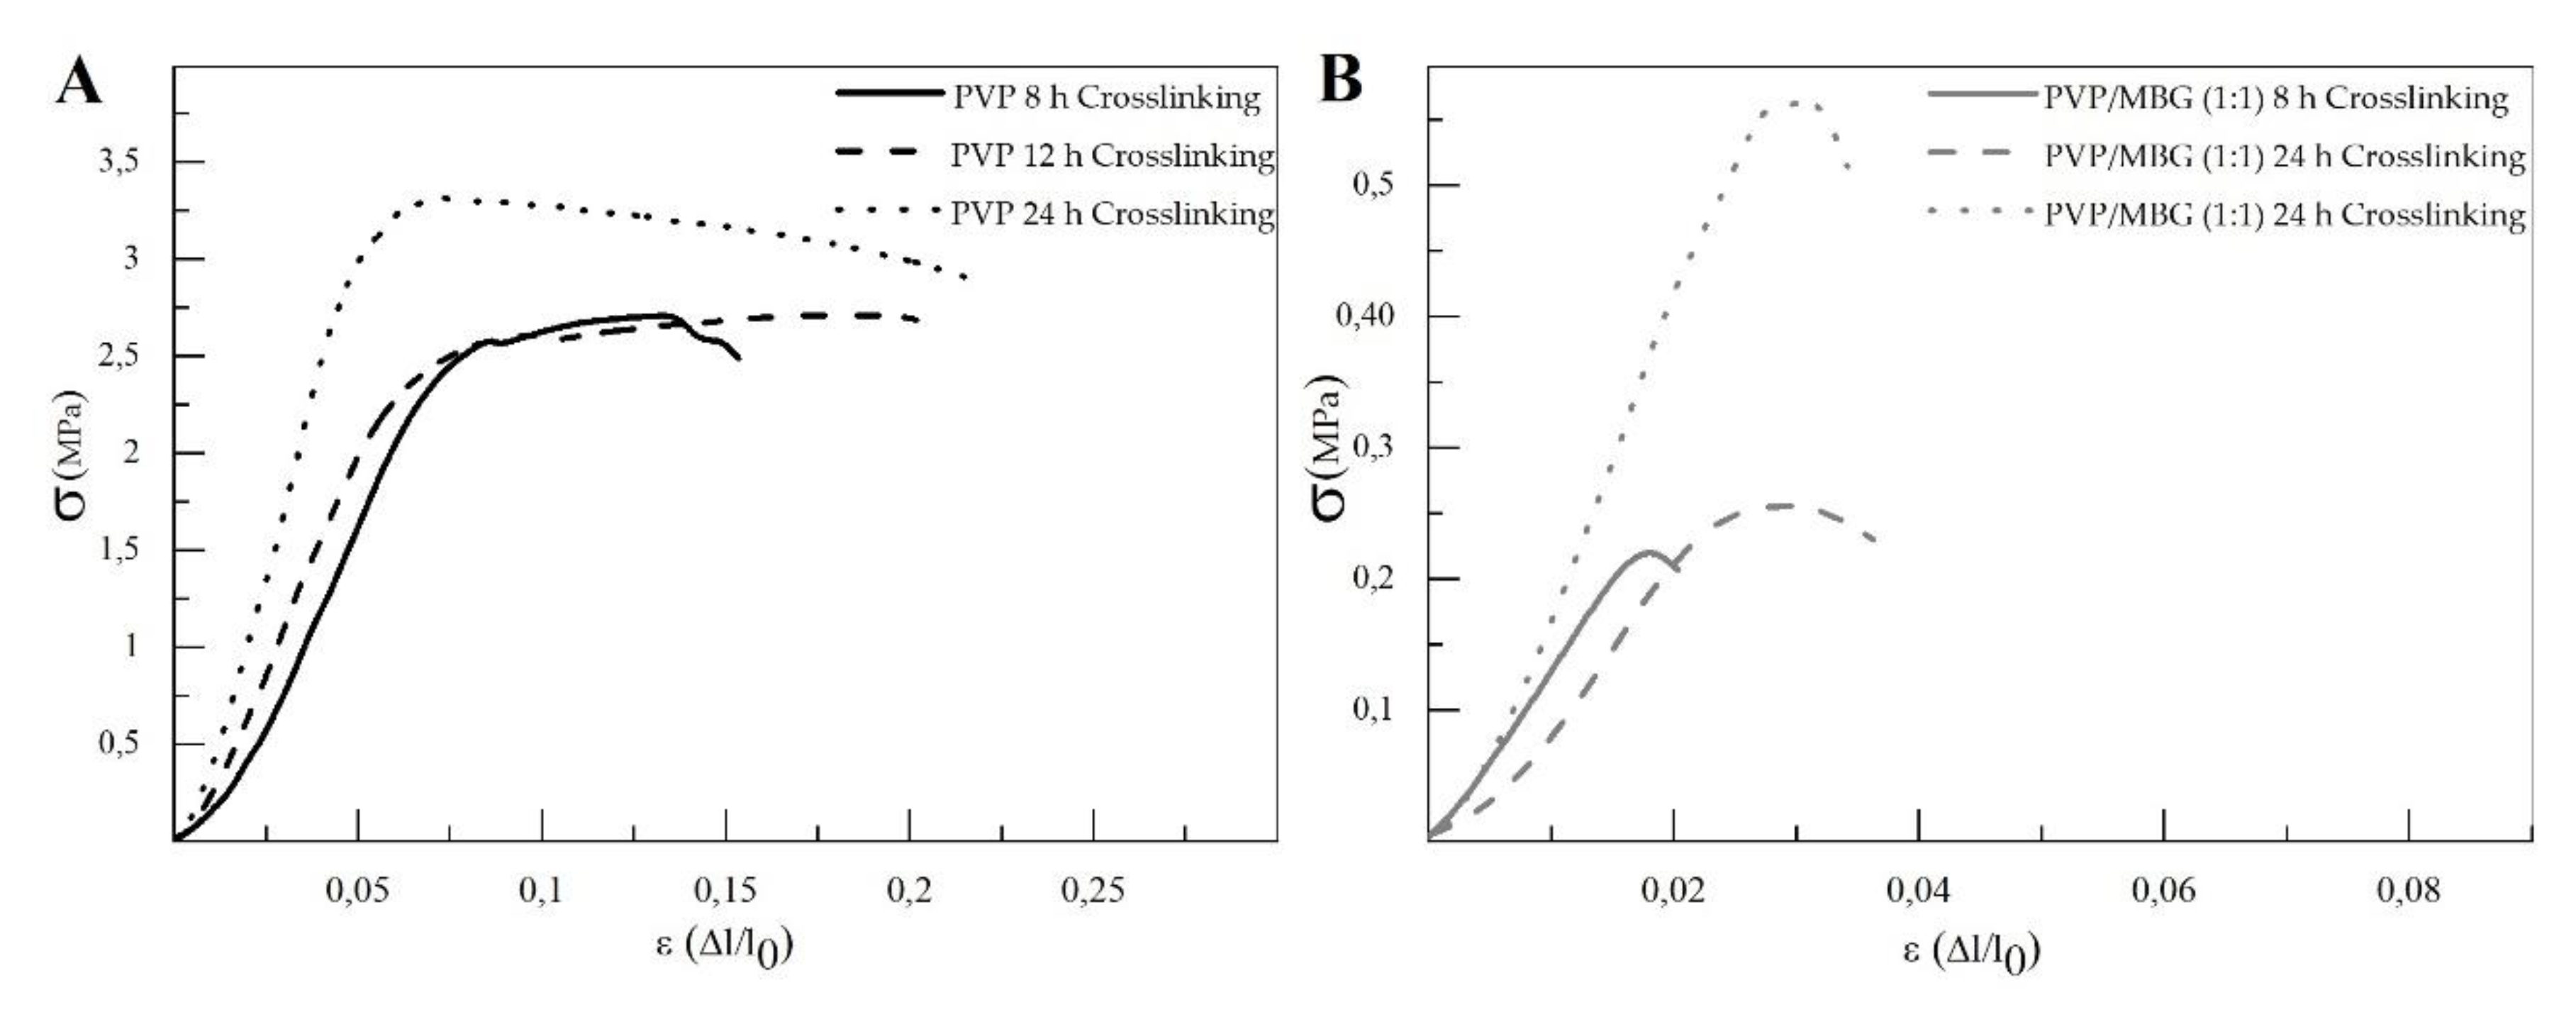
The different membranes of PVP and PVP/MBG (1:1) composites thermal crosslinked at 165 °C for 8, 12, and 24 hours were submitted to uniaxial stress-strain tests as shown in These results allow us to investigate the effect of thermal crosslinking and MBG nanoparticle incorporation on the mechanical properties of the electrospun matrices.
The comparison between plain PVP (
Figure 10 A) and PVP/MBG (1:1) (
Figure 10 B) stress-strain curves shows that mechanical properties were significantly modified with the MBG nanoparticles incorporation. With the incorporation of MBG nanoparticles, plastic deformation of the composite membranes is almost negligible since membrane rupture occurs almost immediately. This behaviour is characteristic of brittle materials. Furthermore, the three mechanical parameters that characterize the membranes were obtained from the stress-strain curves: Young's Modulus (E); the yield strength (σ
YS); and the ultimate tensile strength (UTS). The results for each membrane are shown in
Table 2 and corroborate the changes in the mechanical properties. The presence of MBG in the PVP fibres implies a significant reduction in the three mechanical parameters calculated. The Young's modulus decreases by a factor of around 14 up to 21 times with the presence of MBG nanoparticles. This decrease along with the reduction in UTS values could be justified by the increase in the inhomogeneity in the average fibre diameter, as reported in the SEM and TEM images of the composites. In fact, the poor dispersion of MBG nanoparticles at high concentrations leads to the formation of clusters, which decreases the homogeneity of PVP fibres. Higher amount of MBG is suitable for the preservation of scaffolds bioactivity, but it is likely to be responsible for the brittle mechanical behaviour of the composite samples. Reducing the amount of MBG particles inside the composite matrices leads to a trade-off between high mechanical properties and bioactivity. However, the high bioactivity of the composite fibres in necessary for BTE applications [29, 30]. In fact, other researchers have already reported that there is a threshold limit for bioactive glass particles concentration beyond which the nanoparticles caused a defective situation rather than reinforcing the polymer matrices, so that the nanocomposites became more brittle [
26].
Figure 10.
These results allow us to investigate the effect of thermal crosslinking and MBG nanoparticle incorporation on the mechanical properties of the electrospun matrices.
Figure 10.
These results allow us to investigate the effect of thermal crosslinking and MBG nanoparticle incorporation on the mechanical properties of the electrospun matrices.
The comparison between plain PVP (
Figure 10 A) and PVP/MBG (1:1) (
Figure 10 B) stress-strain curves shows that mechanical properties were significantly modified with the MBG nanoparticles incorporation. With the incorporation of MBG nanoparticles, plastic deformation of the composite membranes is almost negligible since membrane rupture occurs almost immediately. This behaviour is characteristic of brittle materials. Furthermore, the three mechanical parameters that characterize the membranes were obtained from the stress-strain curves: Young's Modulus (E); the yield strength (σ
YS); and the ultimate tensile strength (UTS). The results for each membrane are shown in
Table 2 and corroborate the changes in the mechanical properties. The presence of MBG in the PVP fibres implies a significant reduction in the three mechanical parameters calculated. The Young's modulus decreases by a factor of around 14 up to 21 times with the presence of MBG nanoparticles. This decrease along with the reduction in UTS values could be justified by the increase in the inhomogeneity in the average fibre diameter, as reported in the SEM and TEM images of the composites. In fact, the poor dispersion of MBG nanoparticles at high concentrations leads to the formation of clusters, which decreases the homogeneity of PVP fibres. Higher amount of MBG is suitable for the preservation of scaffolds bioactivity, but it is likely to be responsible for the brittle mechanical behaviour of the composite samples. Reducing the amount of MBG particles inside the composite matrices leads to a trade-off between high mechanical properties and bioactivity. However, the high bioactivity of the composite fibres in necessary for BTE applications [29, 30]. In fact, other researchers have already reported that there is a threshold limit for bioactive glass particles concentration beyond which the nanoparticles caused a defective situation rather than reinforcing the polymer matrices, so that the nanocomposites became more brittle [
26].
Figure 10.
Representative stress-strain curves of plain PVP and PVP/MBG (1:1) composite membranes crosslinked for different times: 8, 12, and 24 hours.
Figure 10.
Representative stress-strain curves of plain PVP and PVP/MBG (1:1) composite membranes crosslinked for different times: 8, 12, and 24 hours.
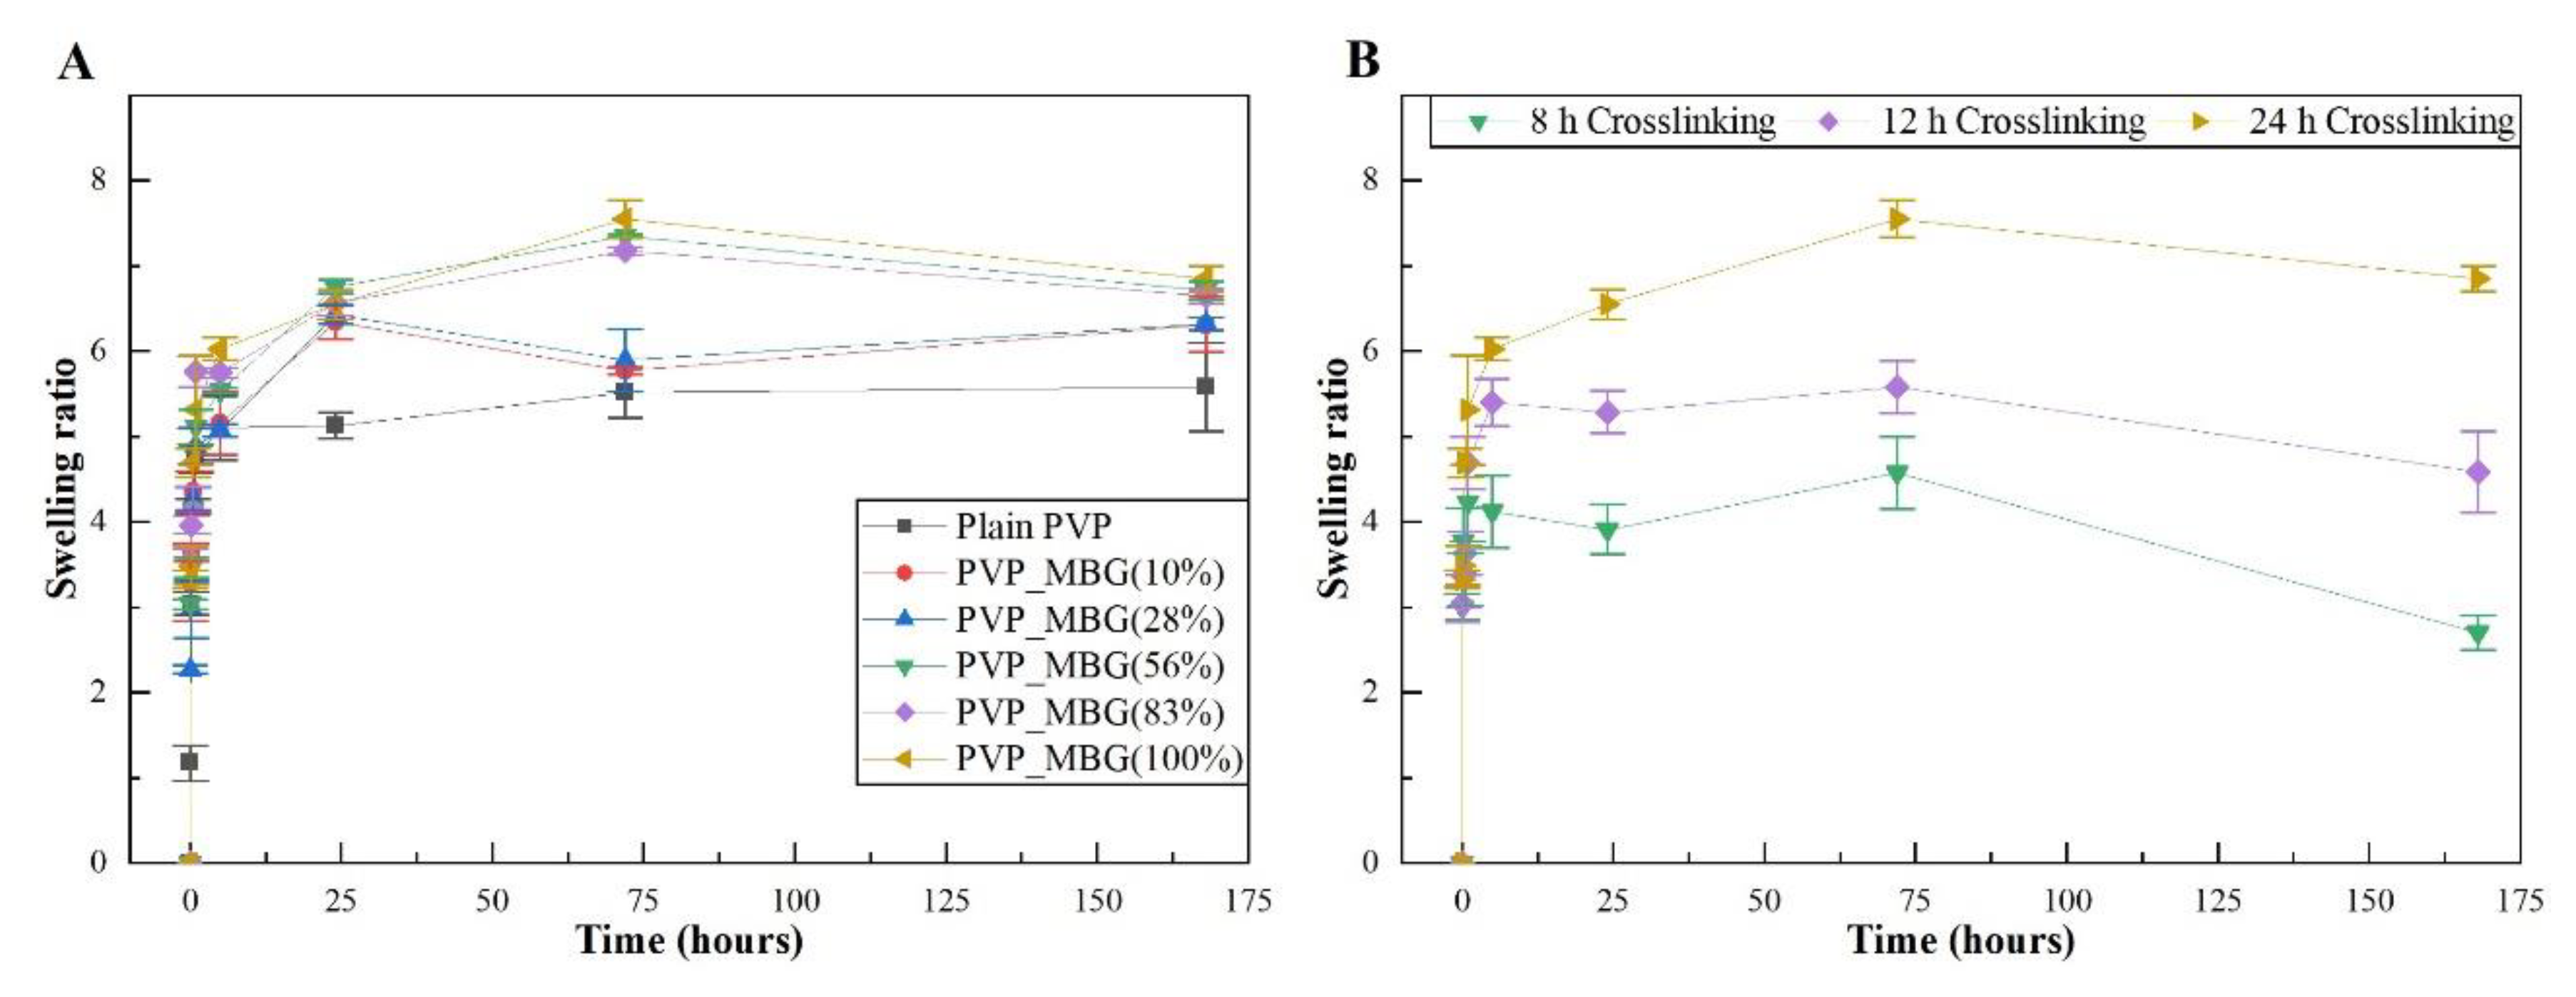
The time of thermal crosslinking also affected the mechanical properties of the samples. In general, the changes were very similar for plain PVP and PVP/MBG (1:1) composites. For instance, the plain PVP samples crosslinked for 8 and 12 hours exhibited a similar mechanical behaviour under tensile forces, which also occurred for PVP/MBG (1:1) composites crosslinked during 8 and 12 hours. Furthermore, when the samples were crosslinked for 24 hours, the mechanical parameters reached higher values. The Young's modulus increases by a factor of around 1.8 up to 1.9 when the crosslinking time increases from 8 to 24 hours, in both PVP and PVP/MBG (1:1) composites. In general, it is expected that crosslinking processes affect the mechanical properties of polymers since new interactions between polymer chains are being created. These results show that more crosslinking time is responsible for enhancing the mechanical strength of the samples. Thus, for periods of 8 and 12 hours at 165 °C, the crosslinking process is not complete yet, while 24 hours of thermal crosslinking mean higher bonding levels between the PVP chains.
3.6. Bioactivity Assay
The bioactivity of MBG 80S15 pellets and PVP/MBG (1:1) composites was investigated in vitro by soaking the samples in SBF to detect the formation of HA on the surface. The samples were characterized by SEM, XRD, and FTIR.
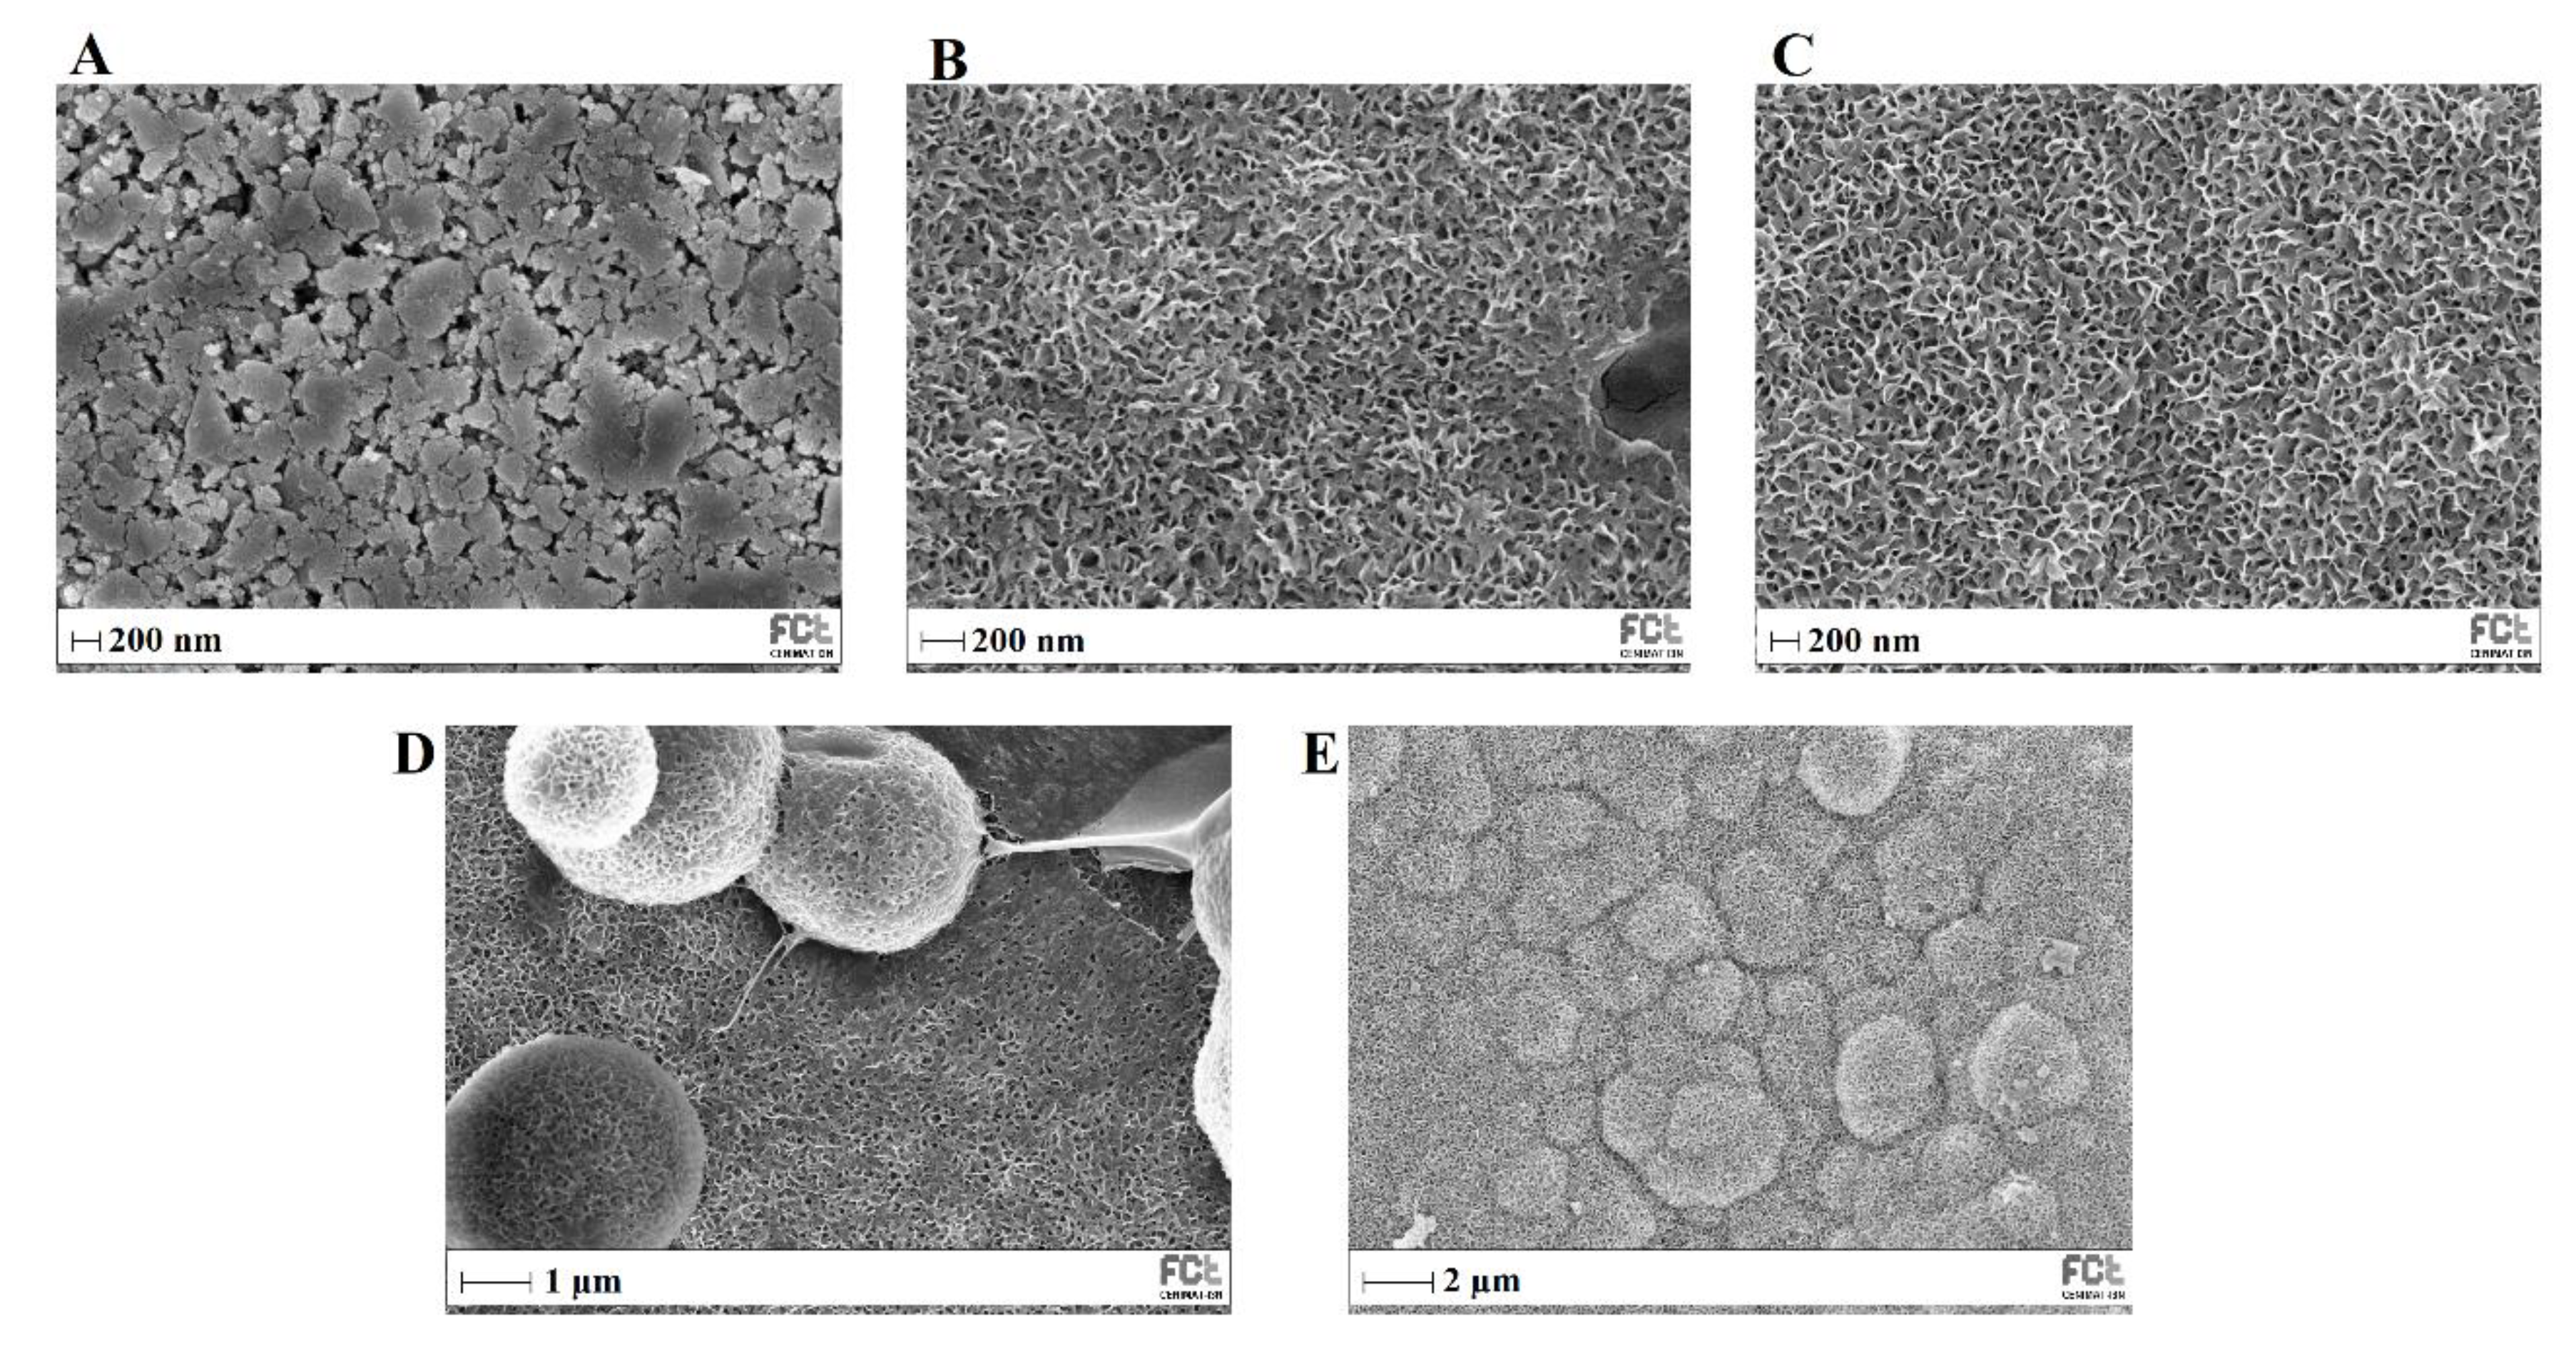
Figure 12 shows SEM images of MBG 80S15 before and after different immersion intervals in SBF. Before soaking in SBF solution (
Figure 12 A), the MBG particle’s surface was smooth. After soaking for 24 h, the surfaces of the MBG pellets have important changes. It can be observed that a layer composed of needle-shaped crystallites fully covered the surface. EDS analysis confirmed that the chemical composition can be assigned to an HCA phase considering the Ca/P ratio slightly below 1.67 (
Table 3). Furthermore, the thickness of the HCA layer continues to growth over time. After 5 days of immersion, cauliflower-like clusters with needlelike crystallites shape spontaneously to reduce surface energy. These clusters grow over time, so that after MBG soaking in SBF for 10 days all the surface is covered with cauliflower-like clusters.
Figure 12.
SEM images of MBG 80S15 before (A) and after soaking in SBF for 1 day (B), 3 days (C), 5 days (D), and 10 days (E).
Figure 12.
SEM images of MBG 80S15 before (A) and after soaking in SBF for 1 day (B), 3 days (C), 5 days (D), and 10 days (E).
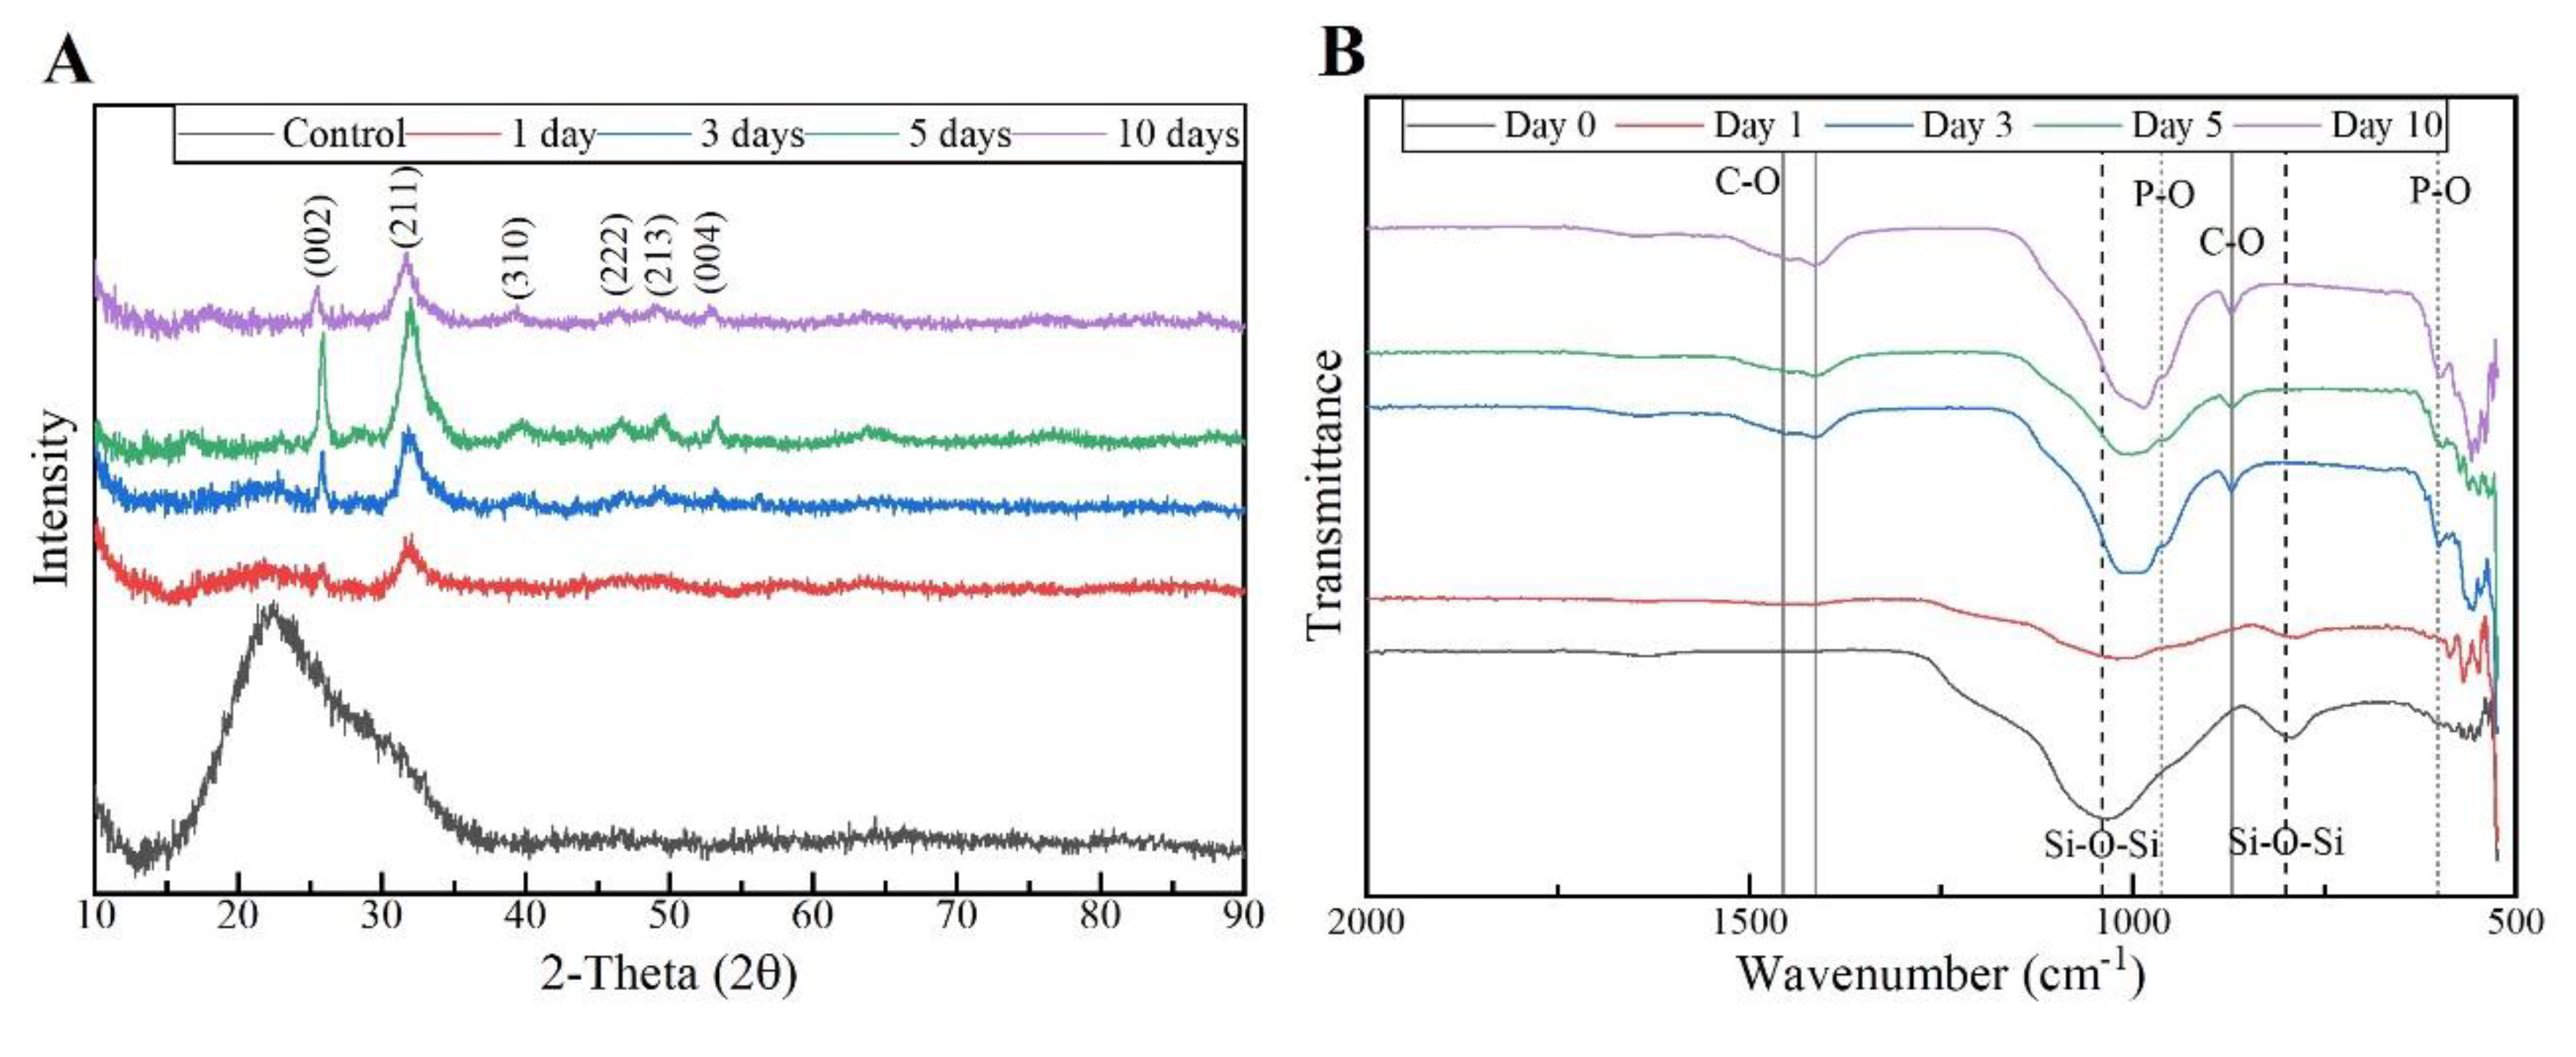
The respective XRD results of the MBG 80S15 pellets soaked in SBF for 1, 3, 5, and 10 days are shown in
Figure 13 A. As mentioned before, MBG showed the common broad band of amorphous materials at about 15-35°(2θ) before soaking in SBF. After 1 day of immersion in SBF, the XRD pattern of MBG 80S15 showed a major peak located at 32° (2θ) and another peak located at 26°(2θ), which could be assigned to the (211) and (002) reflection of an apatite-like phase [
9]. After immersing for 3 days, the four new diffraction peaks at 39, 46, 49, and 53° (2θ) were assigned to the (310), (222), (213), and (004) reflections of HCA, respectively. As the immersion and mineralization time increased to 5 days, the diffraction peaks became more intense. The above-mentioned newly formed diffraction peaks are in accordance with the standard card of HCA (JCPD 24-0033). The XRD results demonstrated that the MBG 80S15 had good bioactivity in vitro and their mineralization product was HCA. Furthermore, the crystallinity of HCA became higher as immersion time increased [
1].
Figure 13.
XRD patterns (A) and FTIR spectra (B) of MBG 80S15 after soaking in SBF for different periods of time.
Figure 13.
XRD patterns (A) and FTIR spectra (B) of MBG 80S15 after soaking in SBF for different periods of time.
The growth of HCA on MBG 80S15 surface was further investigated by FTIR spectroscopy analysis.
Figure 13 B illustrates the IR spectra for MBG 80S15C samples after the same time periods soaked in SBF that were studied by SEM. Before immersion in SBF, the adsorption bands at 800 and 1040 cm
-1 can be indexed to Si-O-Si bonds. However, when soaking in SBF for 3 days, three P–O crystalline vibrational bands near to 568, 602, and 963 cm
-1 were detected (the noise near 500 cm
-1 hindered the accurate analysis of 568 cm
-1 band). Furthermore, other three new vibrational bands were detected near to 1456, 1414, and 870 cm
-1, which are assigned with C-O bond indicating the growth of the HCA layer on the surface of MBG 80S15 [
33,
34,
35].
The above SEM, XRD, and FTIR results indicate that the MBGs 80S15 can induce the formation of an HCA layer on their surface even for short SBF soaking periods, which corroborates the superior in vitro bone forming bioactivity. Therefore, pointing out the interesting properties of the MBG 80S15 as a material for bone tissue engineering.
Figure 14.
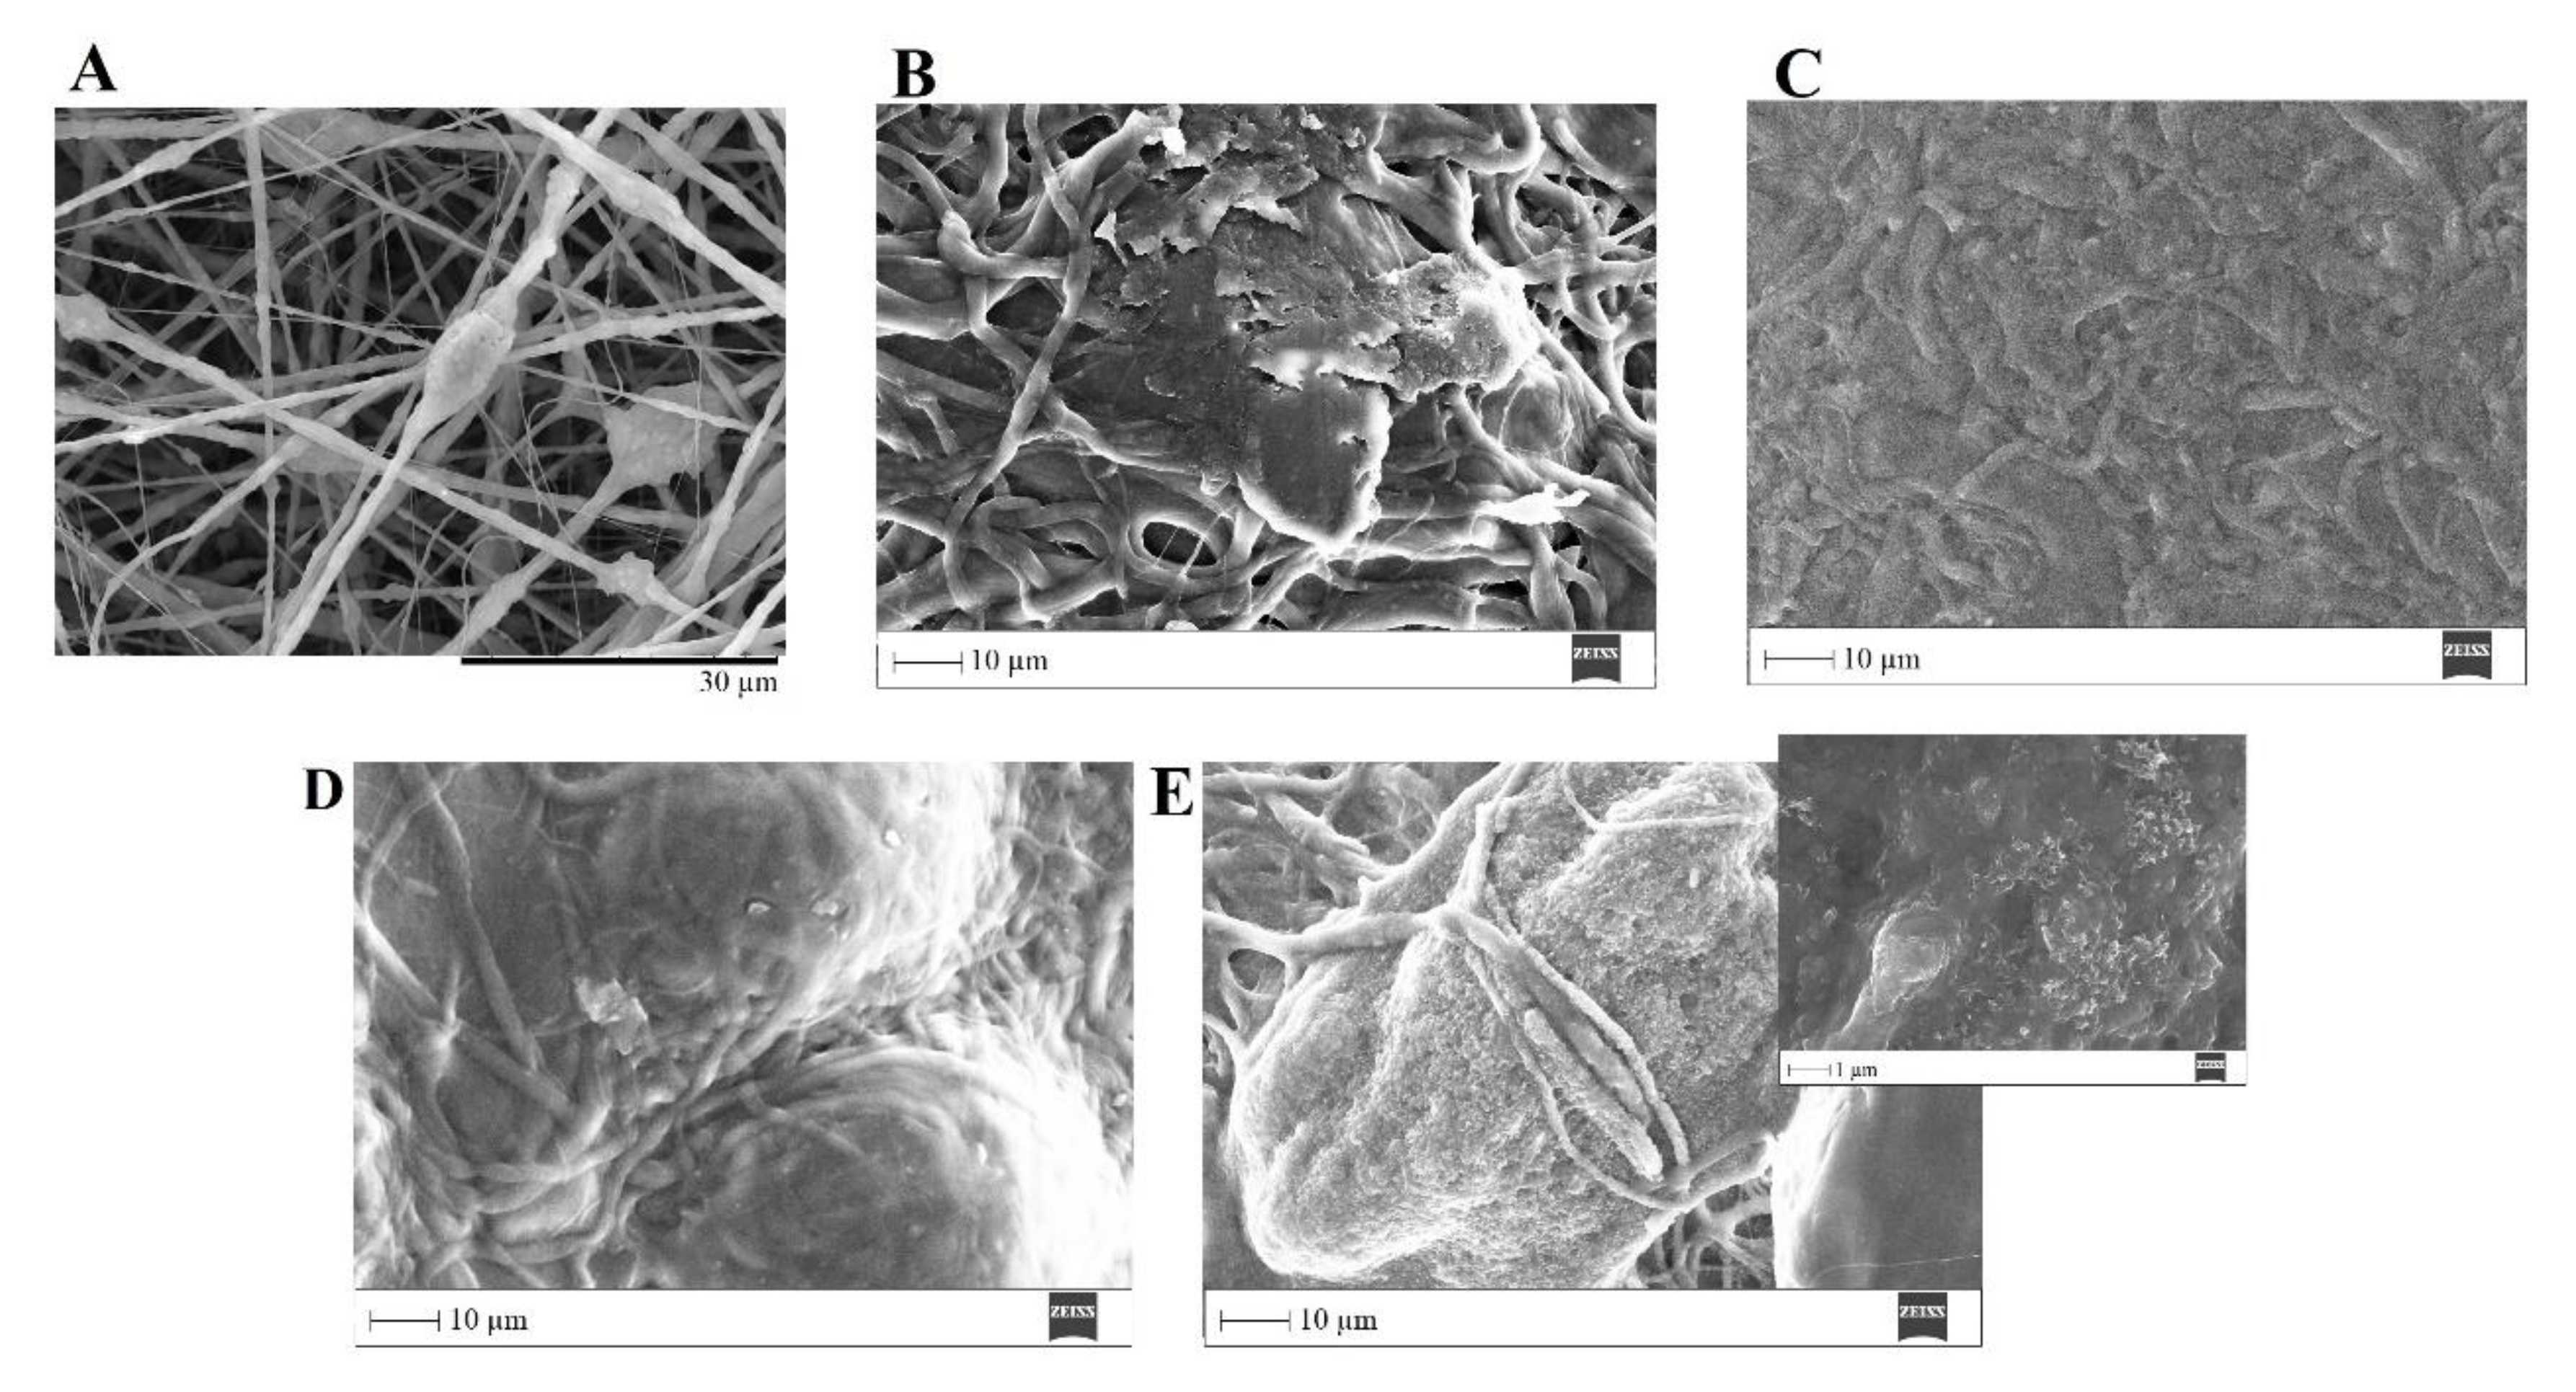
SEM images of PVP/MBG (1:1) composite crosslinked for 8 h before (A) and after soaking in SBF for 1 day (B), 3 days (C), 5 days (D), and 10 days (E, and respective inset micrograph at higher magnification).
Figure 14.
SEM images of PVP/MBG (1:1) composite crosslinked for 8 h before (A) and after soaking in SBF for 1 day (B), 3 days (C), 5 days (D), and 10 days (E, and respective inset micrograph at higher magnification).
Figure 15.
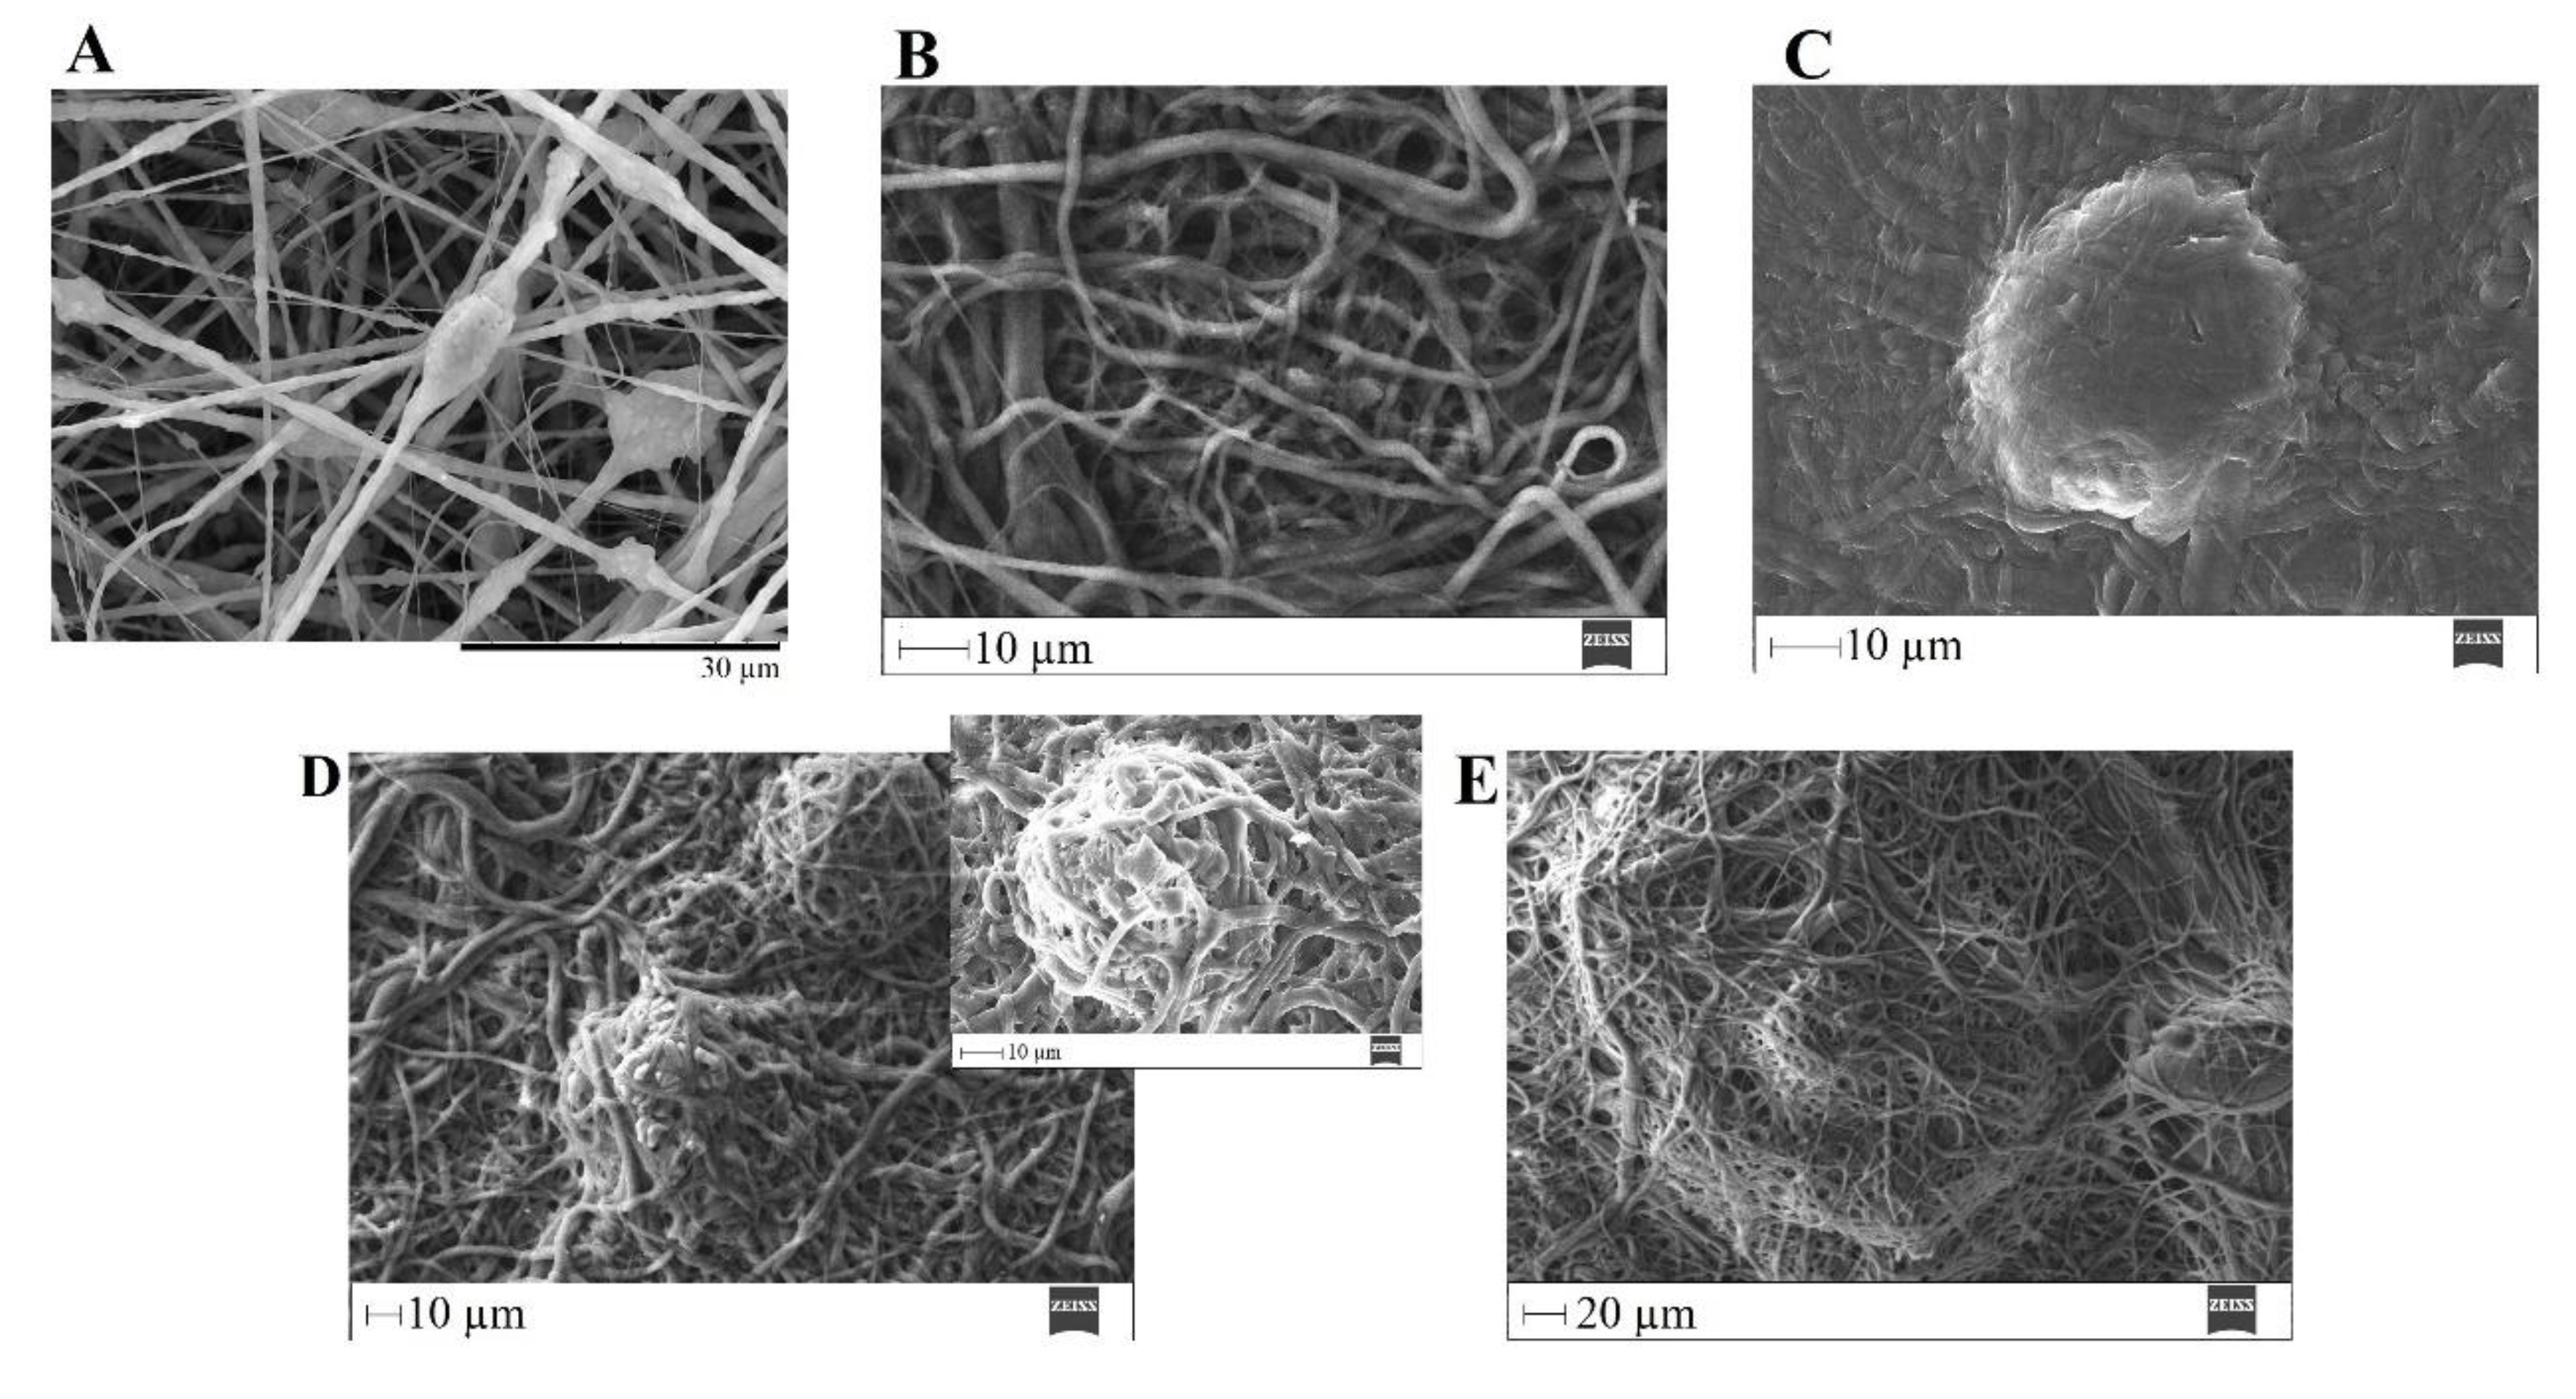
SEM images of PVP/MBG (1:1) composite crosslinked for 12 h before (A) and after soaking in SBF for 1 day (B), 3 days (C), 5 days (D, and respective inset micrograph), and 10 days (E).
Figure 15.
SEM images of PVP/MBG (1:1) composite crosslinked for 12 h before (A) and after soaking in SBF for 1 day (B), 3 days (C), 5 days (D, and respective inset micrograph), and 10 days (E).
Figure 16.
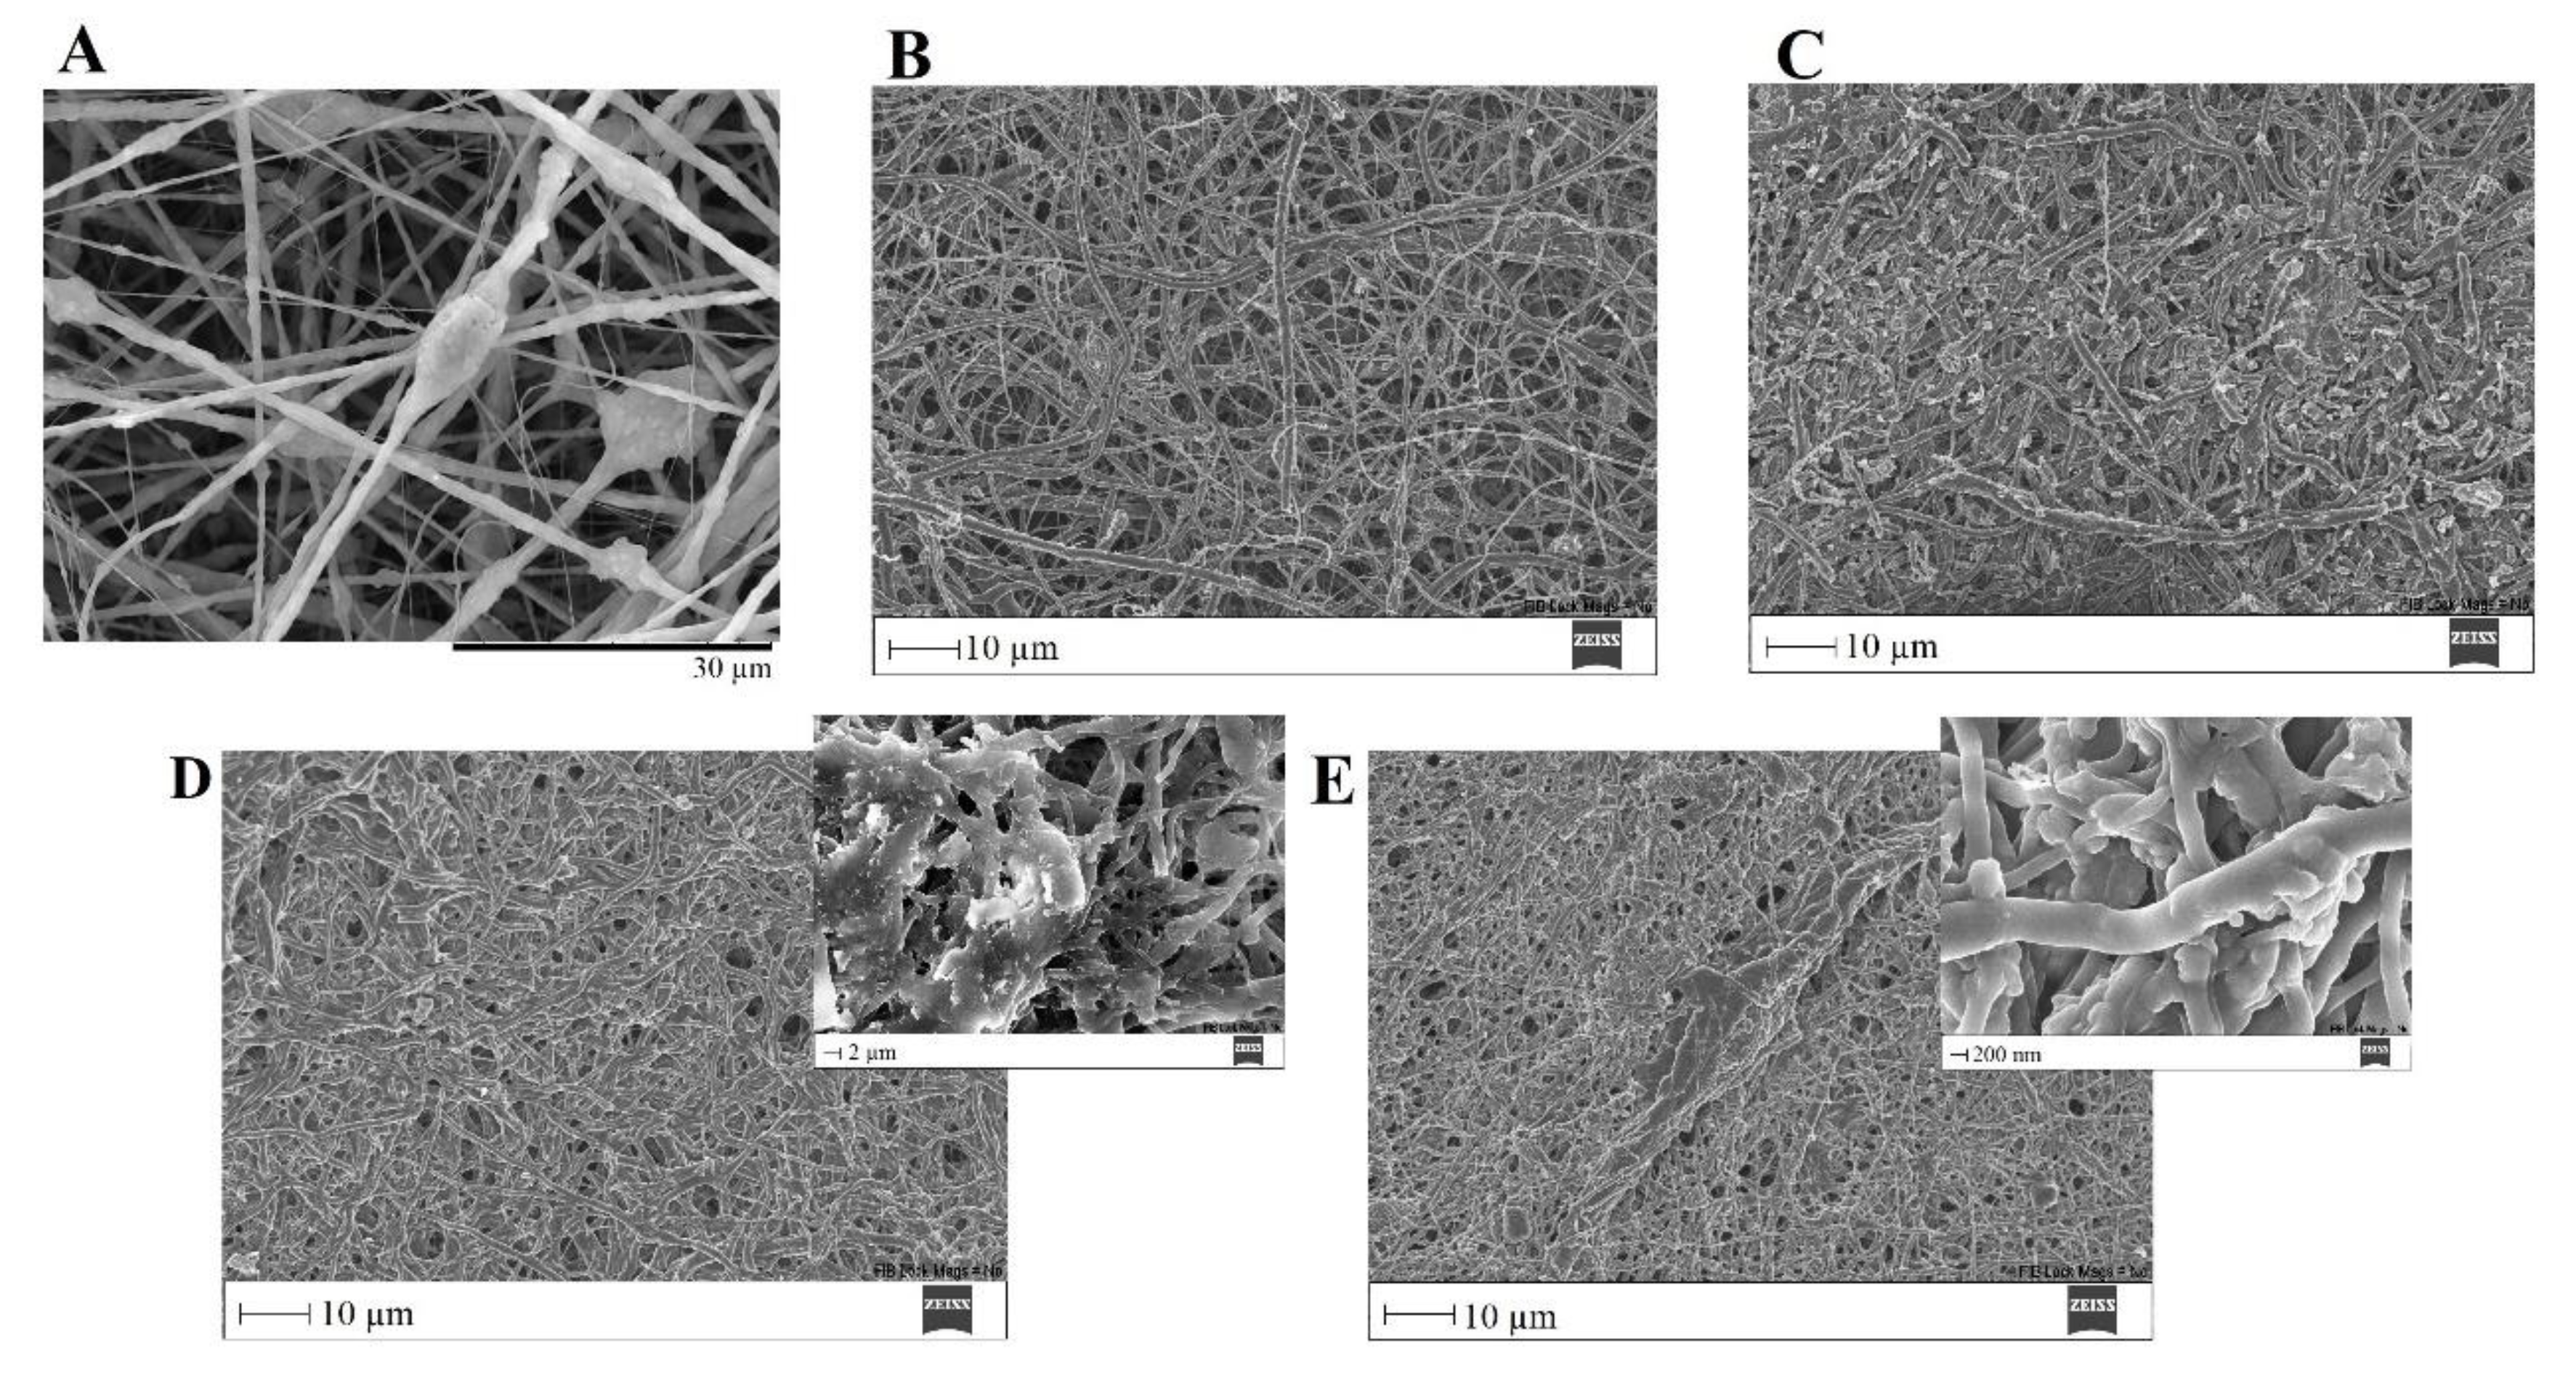
SEM images of PVP/MBG (1:1) composite crosslinked for 24 h before (A) and after soaking in SBF for 1 day (B), 3 days (C), 5 days (D, and respective inset micrograph), and 10 days (E, and respective inset micrograph).
Figure 16.
SEM images of PVP/MBG (1:1) composite crosslinked for 24 h before (A) and after soaking in SBF for 1 day (B), 3 days (C), 5 days (D, and respective inset micrograph), and 10 days (E, and respective inset micrograph).
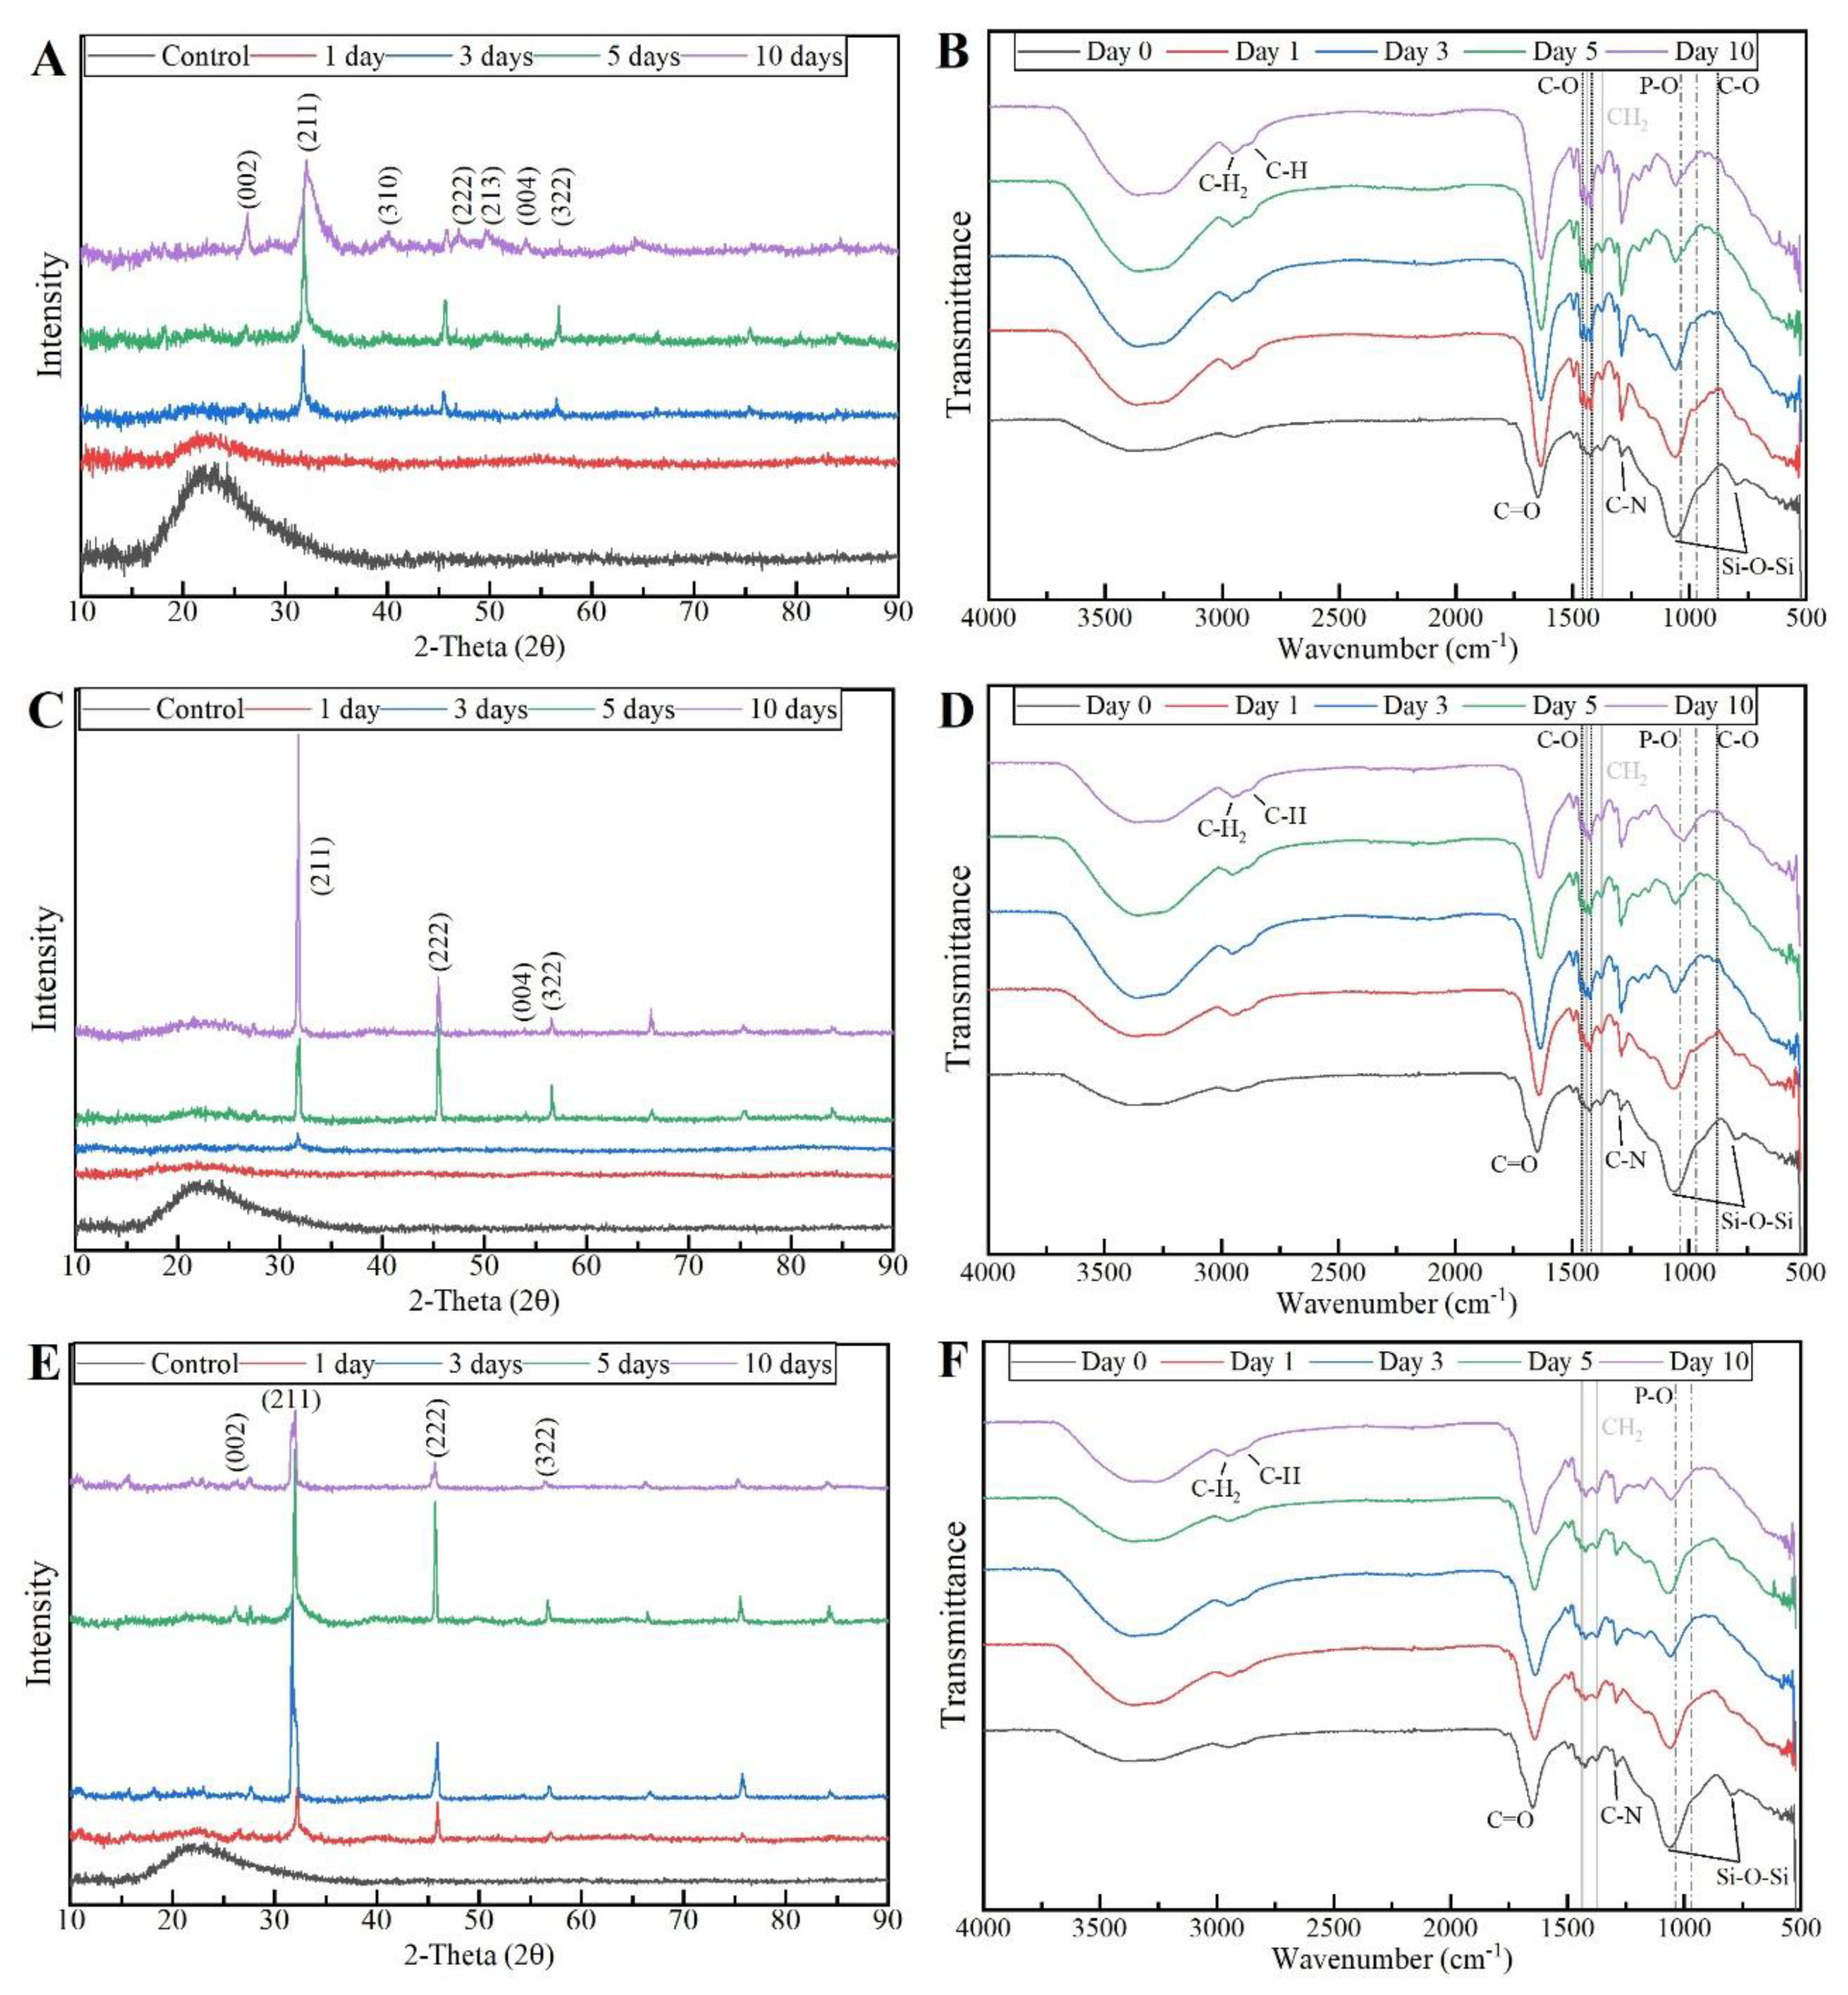
The bone-bonding potential of a biomaterial is often estimated by examining its ability to form the HCA layer on its surface when exposed to SBF. In order to study the formation of this layer, the PVP/MBG (1:1) composite scaffolds were also analysed by SEM, XRD, and FTIR before and after being soaked in SBF. Furthermore, the bioactive behaviour of the composite scaffolds is also dependent on the degradation ratio of the polymeric matrices, which in turn is dependent on the crosslinking conditions. To study the best crosslinking conditions considering the effect on enhancing the bioactivity of the scaffolds, the bioactivity assay was carried out on scaffolds crosslinked at 165 °C for 8 hours (Figure 14), 12 hours (Figure 15), and 24 hours (Figure 16). The SEM analysis of the surface morphology of the scaffolds before and after soaking in SBF for 1, 3, 5 and 10 days. After immersion for 1 day, the surface of the samples crosslinked for 8, 12, and 24 hours becomes rougher. The samples’ porosity decreases when compared with the samples before immersion in SBF, this effect is more accentuated for the samples crosslinked for 8 and 12 hours. Several precipitates were clearly observed on the nanocomposite surface over immersion time. However, this effect is delayed for samples crosslinked for 24 hours, probably due to the slower degradation of the PVP fibres hindering the contact between MBG glass particles and the medium. The bioactivity of the scaffolds can be clearly noticed for the samples crosslinked for 8 and 12 hours with the micrographs showing the spherical structures associated with the typical cauliflower-like structure. However, there are PVP fibres that have not been completely degraded yet. Figure 14 E and the respective inset micrograph show that HCA growth stretches the PVP fibres, this phenomenon can accelerate the degradation rate of the scaffolds when compared with the degradation rate studied for immersion in PBS. It is worth pointing out that the above-mentioned makes it impossible to evaluate the bioactivity of composites crosslinked for 3, 4, and 5 hours since the samples did not keep their physical integrity when soaked into SBF.
EDS analysis (
Table 3) of the nanofibrous mats surface before and after soaking in SBF allowed the determination of the atomic concentration of silicon, calcium, and phosphorus. In general, all samples showed a decrease in silicon concentration over time, and an increase in calcium and phosphorus concentrations. Moreover, the earliest apatite precipitate is usually “Ca deficient” exhibiting a Ca/P ratio below 1.67. Throughout the HCA layer formation, the HA composition increases, and the Ca/P ratio also increases asymptotically towards Ca/P≈1.67 [
36].
In general, the SEM analysis for bioactivity assay of PVP/MBG (1:1) composites revealed quite similar results considering the HCA precipitation for samples crosslinked for 8 and 12 hours, while the HCA precipitation on fibres’ surface seems to be delayed for the samples crosslinked for 24 hours.
To confirm the formation of the HCA layer on fibre’s surface, the PVP/MBG (1:1) composites thermal crosslinked for 8, 12, and 24 hours were also analysed by XRD and FTIR before and after being soaked in SBF. XRD patterns are illustrated in
Figure 17 A, C, and E for the three types of scaffolds previously studied by SEM (8, 12, and 24 hours of thermal crosslinking). All samples exhibited no diffraction peaks before soaking in SBF, as expected due to the amorphous structure of both MBG and the PVP. However, significant changes in the XRD patterns occur after immersion in SBF for the three types of composite membranes. The samples thermal crosslinked for 8 hours revealed different diffraction peaks as the immersion time increased at 2θ = 26°, 32°, 40°, 46°, 49°, 53°, and 57°, which correspond to the reflection of crystalline planes with the Miller indices (002), (211), (310), (222), (213), (004), and (322), respectively. In the case of composites thermal crosslinked for 12 hours, as the SBF immersion time increased, the XRD patterns show diffraction peaks at 2θ = 32°, 46°, 53°, and 57°, which correspond to the reflection of crystalline planes with the Miller indices (211), (222), (004), and (322), respectively. Lastly, in the above-mentioned conditions, the XRD patterns of the composites thermal crosslinked for 24 hours show diffraction peaks at 2θ = 26°, 32°, 46°, and 57°, which correspond to the reflection of crystalline planes with the Miller indices (002), (211), (222), and (322), respectively. As previously discussed for MBG 80S15 bioactivity assay, the newly formed diffraction peaks for the three types of polymeric composites studied are in concordance with the standard card of HCA (JCPD 24-0033). The XRD patterns of the scaffolds thermal crosslinked for 8 and 12 hours showed sharper and more intense peaks when compared to the scaffolds thermal crosslinked for 24 hours. These results indicate higher crystallinity and large amounts of HCA present in the samples.
Figure 17.
XRD patterns and FTIR spectra of PVP/MBG (1:1) composites crosslinked for 8 h (A, B), 12 h (C, D), and 24 h (E, F) after soaking in SBF for different periods of time: 1, 3, 5, and 10 days.
Figure 17.
XRD patterns and FTIR spectra of PVP/MBG (1:1) composites crosslinked for 8 h (A, B), 12 h (C, D), and 24 h (E, F) after soaking in SBF for different periods of time: 1, 3, 5, and 10 days.
These XRD results are in accordance with FTIR analysis, revealing the formation of the HCA structure. Starting with the FTIR spectrum of PVP/MBG (1:1) before immersion in SBF, the following absorption bands are assigned to the PVP: the band located around 1648 cm
-1 can be ascribed to the stretching vibration of the C=O in the pyrrolidone group; the broad near to 2850-3000 cm
-1 is associated with the CH stretching modes, which can be assigned to five overlapping signals: asymmetric CH
2 stretching (polymer chain: 2983 cm
-1, ring: 2954 cm
-1), symmetric CH
2 stretching (polymer chain: 2919 cm
-1; ring: 2885 cm
-1) and ternary CH (2852 cm
-1); the bands at 1427 cm
-1 and 1372 cm
-1 also correspond to the CH deformation modes from the CH
2 group; the absorption bands at 1288 cm
-1 are related to C–N bending vibration from the pyrrolidone structure [
37]. On the other hand, the adsorption bands at 470 (not shown in graphs due to the noise), 802, and 1058 cm
-1 can be assigned to Si-O-Si bonds of the MBG 80S15. After immersion in SBF, the membranes thermal crosslinked for 8 and 12 hours showed similar FTIR spectra over time: the P–O symmetric stretching vibrational bands near 970 cm
-1 was detected (the noise near 500 cm
-1 hindered the accurate analysis of the other two characteristics bands of the P–O bond: 568 and 600 cm
-1, associated with bending modes); after 5 days of immersion in SBF, the vibrational band near 970 cm
-1 was no longer detected due to the shift of the 1058 cm
-1 band assigned to Si-O-Si band. This shift was related to the overlapping of a new band at 1036 cm
-1, which is associated with the asymmetric stretching of P–O bond [
38]; three vibrational bands near 1458, 1417, and 880 cm
-1 were also detected and assigned with C-O bond. However, it was noticed the bands near to 1458 and 1417 cm
-1 increased the intensity over immersion time, while the band at 880 cm
-1 only reveal a slight change in intensity.
The above-mentioned changes in the FTIR spectra were not detected for the samples thermal crosslinked for 24 hours, except the shift associated with the new band at 1036 cm-1 after 10 days after immersion in SBF. The FTIR analysis are in accordance with the SEM results, indicating the growth of the HCA layer over time, which seem to be delayed for the scaffolds thermal crosslinked for 24 hours.
The mechanism of apatite formation upon contact of MBG 80S15 with SBF consists of five stages: 1) fast ion exchange of alkali ions with hydrogen ions from the liquid medium; 2) glass network dissolution; 3) silica-gel polymerization; 4) and 5) chemisorption and crystallization of the carbonated hydroxyapatite layer. The detailed analysis of the reactions involved has been reported by Hench [
39]. Stages 1) and 2) explain the fading of the band at 802 cm
-1 (Si-O-Si), which was noticed for all the scaffolds studied. Furthermore, stages 1 and 2 strongly depend on the PVP degradation rate, thus allowing us to state that crosslinking directly affects the bioactivity of the polymeric composite scaffolds studied. On the other hand, as shown in the swelling assay, the high wettability of PVP may favour the SBF interaction with the MBG nanoparticles, allowing the apatite mineralization inside PVP fibres and subsequent growth in the radial direction [
40].
This study is consistent with the previous reports, which demonstrated that the inclusion of the BG particles into the polymeric matrices enhanced the in vitro hydroxyapatite formation onto the surface of the nanocomposites under a SBF medium. For instance, Lin et al,.[
41], Allo
et al., [
42], and Liverani
et al., [
29] made different studies and achieve similar conclusions. The researchers found that the incorporation of bioactive glasses into a PCL [41, 42] and PCL/chitosan [
29] nanofibrous matrices significantly enhanced its apatite formation ability in SBF compared with individual polymeric membranes. In addition, Han
et al., [
43] indicated the higher bioactivity of composite nanofibers compared to pure PAN-based carbon nanofibers. Meanwhile, Yang
et al., [
44] also reported that the presence of BG nanoparticles in the carbon nanofiber composites had increased the rates of the heterogeneous apatite nucleation [
40].
