1. Introduction
Antisense oligonucleotides (ASONs) have been developed rapidly since the discovery in 1978, which inhibit viral replication in cell culture [
1]. They are currently used for the treatment of metabolic and genetic diseases, cancer, and the prevention of infectious diseases, et al. The advantages of ASONs include (i) their interaction with target genes by Watson–Crick base pairing, which provides specificity and affinity; and (ii) their ability to directly down-regulate or upregulate gene expression, leading to the modulation of RNA metabolism [
2,
3].
ASON applications face multiple obstacles. A major issue is the degradation of naked ASONs by nucleases in plasma [
4]. The half-life of naked ASONs is about 5 min, as determined in pharmacokinetic studies conducted with primates [
5,
6]. Numerous chemical modifications (e.g., of internucleoside linkage, deoxyribose/ribose, and nucleobases) have been developed to improve ASON resistance to nuclease digestion [
7]. ASON derivatization and bioconjugation have also been applied to confer resistance to serum enzyme degradation; for example, 5' and 3' spacer arms have been used to protect ASONs from exonuclease degradation [
8].
Two broad strategies are currently applied for ASON delivery. With nanoscale delivery, ASONs are incorporated into nanocarriers for tissue distribution and cellular interactions. With molecular scale delivery, ASONs are chemically modified most commonly with targeting ligands, and the molecular nature of the conjugates was preserved [
9]. Such conjugates have received increasing interest recently because they enable selective delivery to specific cells and tissues via receptor-mediated mechanisms while avoiding the toxicity associated with many nanocarriers [
9,
10]. Another advantage of conjugates is that they are well-defined molecular entities, whereas nanoparticles (NPs) are heterogeneous.
Several small molecules show high degrees of affinity and selectivity for various receptors. The ligand anisamide (AA) binds to sigma receptors, which are well-known membrane-bound proteins that are overexpressed in diverse human tumors, including melanoma, non-small cell lung carcinoma, breast tumors of neural origin, and prostate cancer [
11,
12]. Garg et al. [
13] found that the addition of AA to chitosan/poly (ethylene glycol) NPs significantly increased the NPs’ affinity and thus drugs were delivered to human lung carcinoma cells
in vitro successfully.
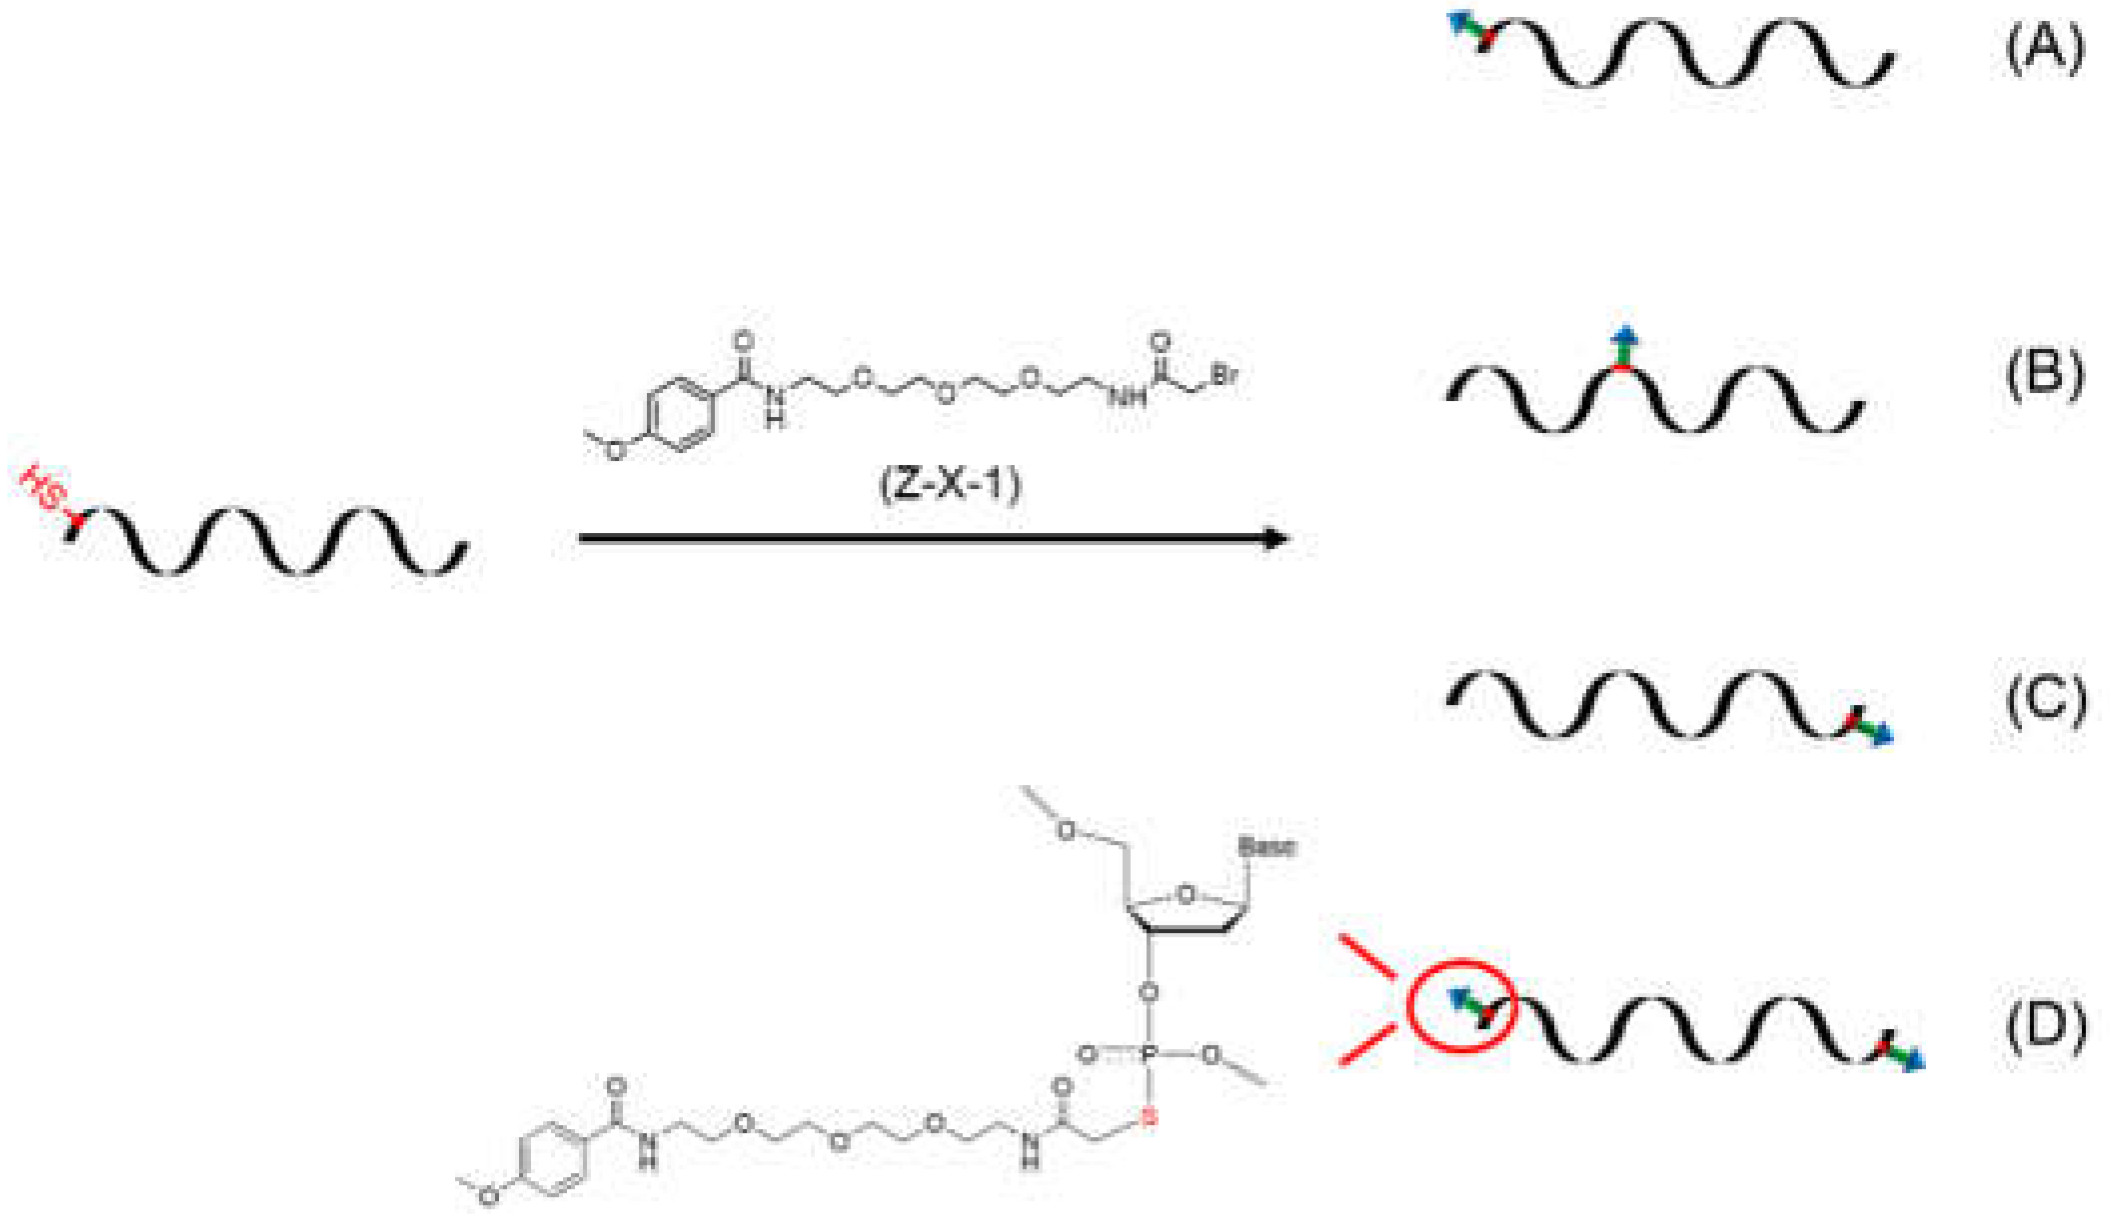
In this work, a novel category of ASONs with AA conjugation for oncotherapy is proposed (
Figure 1). Conjugation can be achieved between an acetyl bromide–modified AA derivate and an ASON with phosphorothioate (PS) modification to improve anti-enzymatic stability and the cellular uptake capability, with the potential to enhance antitumor activity.
As a proof of concept, the native sequence of GTI-2040, a 20-mer ASON developed by Loris Therapeutics (Toronto, Canada) for the treatment of cancer, was used as the lead molecule in this study. GTI-2040 is complementary to a coding region in the mRNA of the R2 small subunit component of human ribonucleotide reductase (RR) [
14,
15]. Five conjugates with different structures were synthesized, and their biophysical properties and tumor cell inhibition capacities were characterized. The antineoplastic effects of the optimal molecule were examined further
in vitro and
in vivo.
2. Materials and Methods
2.1. Materials
Dimethyl sulfoxide (DMSO), triethylamine, pyridine, ammonia, dichloromethane, methanol, petroleum ether, ethyl acetate, sodium carbonate, and magnesium sulfate were obtained from China National Medicines Corporation, Ltd. Sodium chloride was provided by Xilong Science Co., Ltd. Column chromatography silica gel was provided by Qingdao Marine Chemical Co., Ltd. Pure water was obtained from WaHaHa. Hydrochloric acid was provided by Beijing Tongguang Fine Chemical Co., Ltd. Tetraethylene glycol (CAS: R4XRE0RD), bis(t-butyloxycarbonyl) amine (CAS: GC190009), p-methoxybenzoyl chloride (CAS: 97LERTHD), anhydrous dichloromethane (CAS: BMROAEFH), bromoacetyl bromide (CAS: 9MTRRE3X), and 4-toluenesulfonyl chloride were obtained from Energy Chemical (Shanghai, China). Cesium carbonate (CAS: K1624005) was purchased from Aladdin.
2.2. Synthesis of Z-X-1 and Z-X-2 Compounds
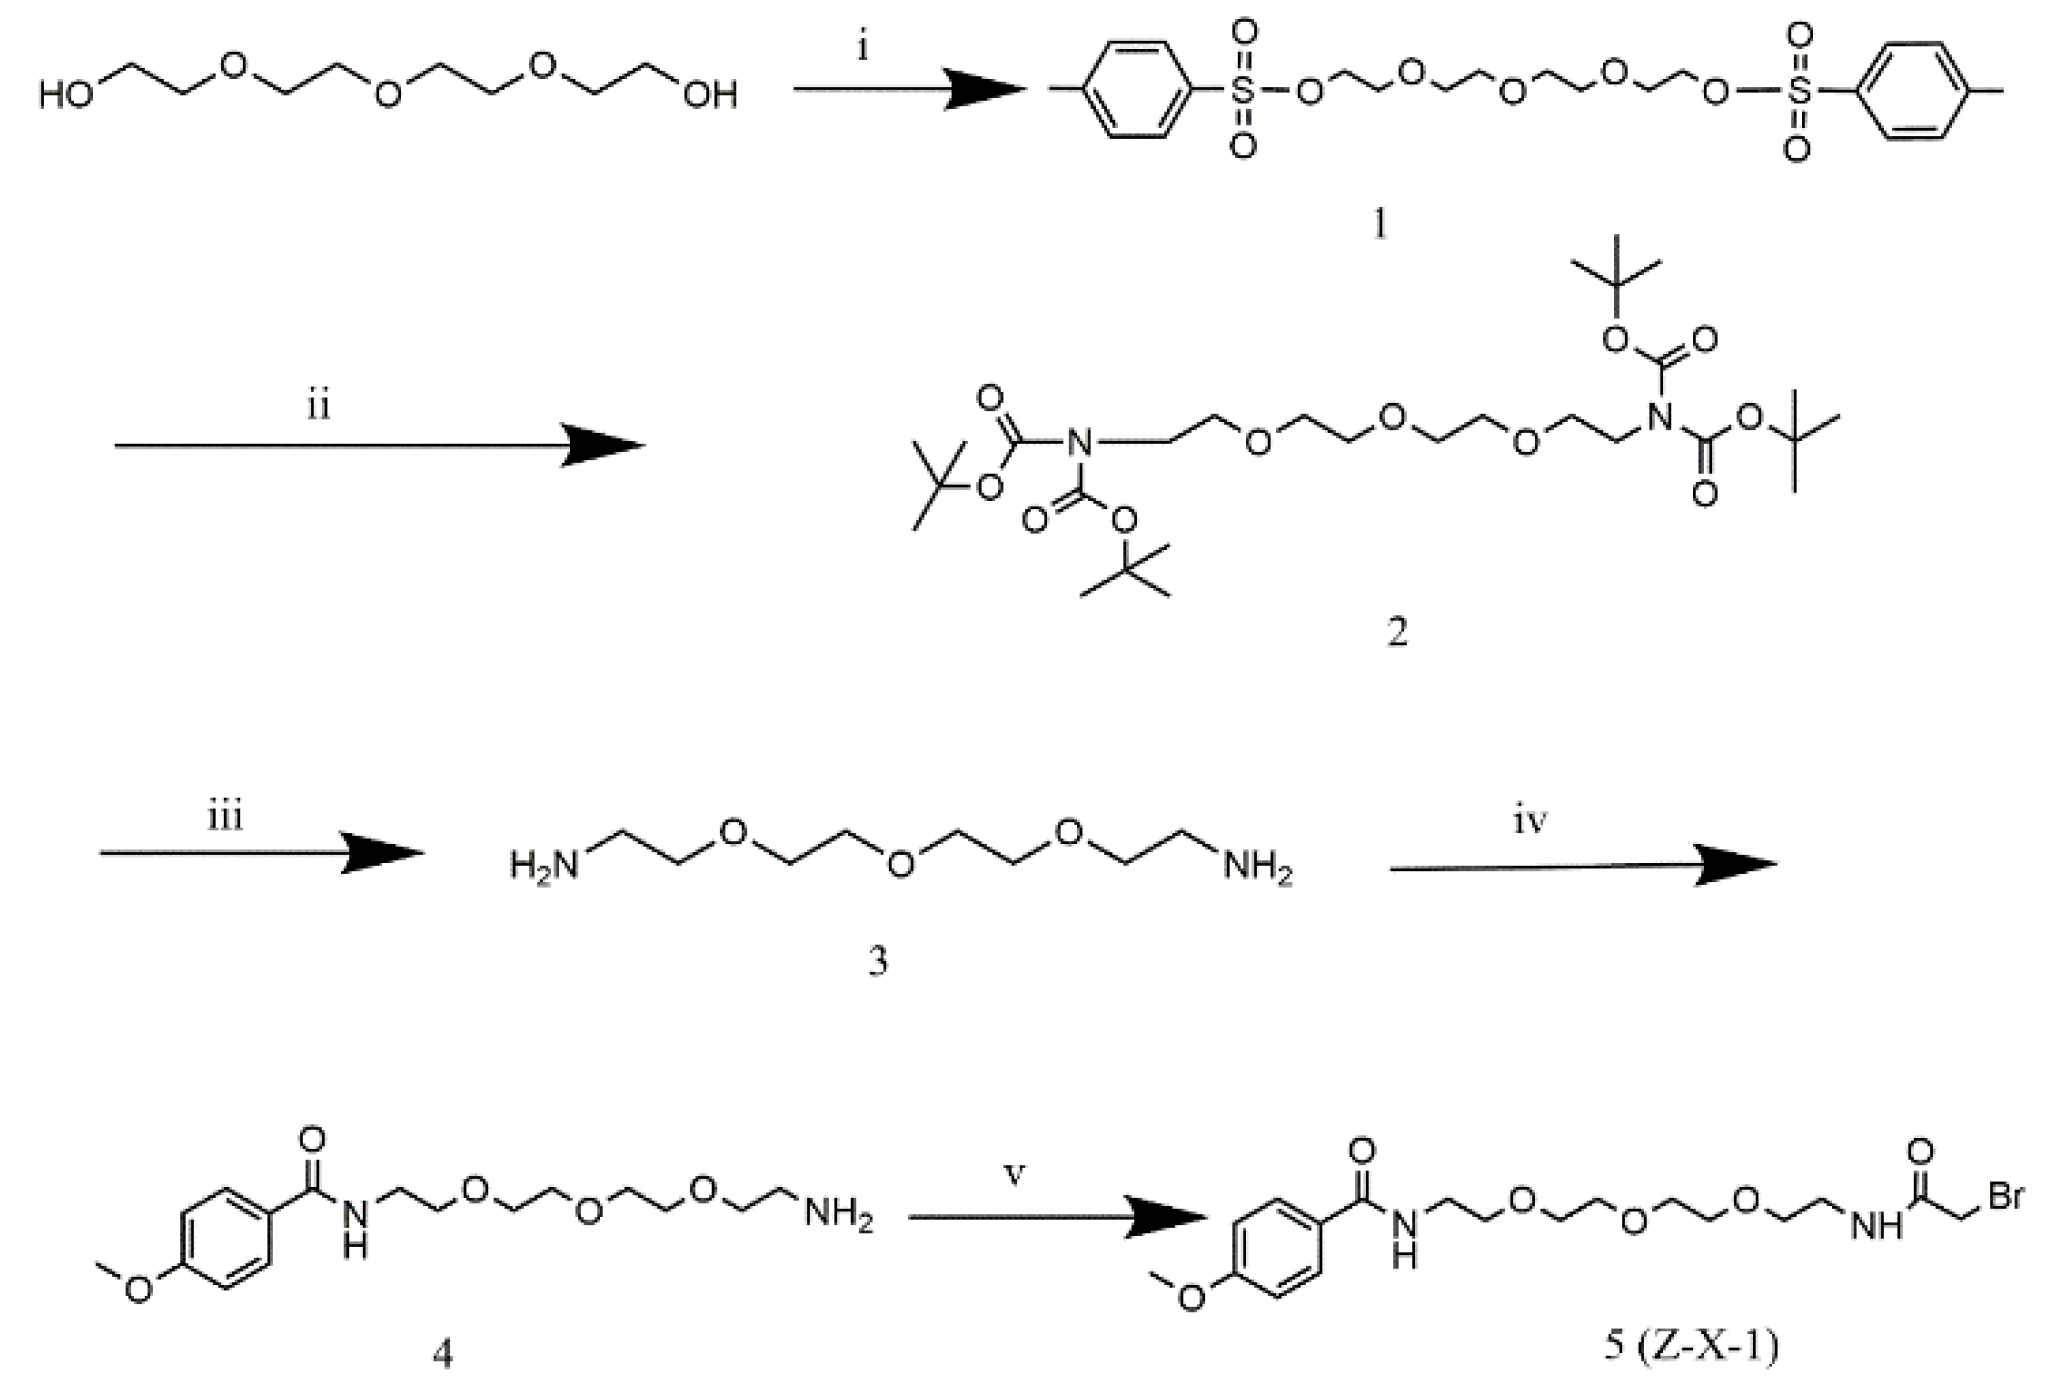
The synthesis of Z-X-1 and Z-X-2 compounds was shown in
Scheme 1 and 2 (Details were given in Supporting information). All new compounds were fully characterized by high-resolution mass spectrometry (HRMS; HD-MS, Waters, America) and
1H nuclear magnetic resonance (NMR; Agilent INOVA, Agilent, America) imaging.
2.3. Oligonucleotide Synthesis and Characterization
Oligonucleotides were purchased from TSINGKE Co., Ltd. (China). Matrix-assisted laser desorption ionization–time of flight mass spectrometry (MALDI-TOF MS; KRATOS Analytical, Shimadzu Group, Japan) was used to determine their molecular weights. The acceleration voltage was 20 kV, and 2′,4′,6′-trihydroxyacetophenone was used as the matrix.
2.4. Preparation of AA-ASON Conjugates (T2–T6)
The Z-X-1 and Z-X-2 compounds were dissolved in d6-DMSO (8 mM) and mixed with ASONs Z1, Z2, Z3, and Z4 (400 mM) (table S1), respectively, in sterilized water. The molar ratio between the ASONs and compound 1 was 1:10. The mixtures were shaken gently at 50°C for 4 h to complete the reactions. The resulting T2–T6 were purified by reverse-phase high-performance liquid chromatography (HPLC; A: 0.1 M acetic acid/triethylamine containing 5% acetonitrile; B: acetonitrile; B in A from 5–70% over 20 min at 1 mL/min). Desalting was performed using SEP-PAK cartridges (Oasis MCX, C18; Waters, USA), with repeated washing in sterilized double-distilled water followed by lyophilization and storage at 18°C.
2.5. Assessemnt of ASON Resistance to Degradation in Serum- and DNase I–Containing Buffers
To verify the anti–nuclease degradation properties of the ASONs, each 1 optical density (OD) oligodeoxynucleotide was added to culture medium containing 40% fetal bovine serum (FBS) or DNase I enzyme. The buffers were incubated at 37°C and sampled at 0, 0.5, 1, 2, 3, 4, 5, 6, and 7 h. A polyacrylamide gel electrophoresis (PAGE) assay and ImageJ software (Broken Symmetry Software) were used to analyze the results.
2.5. Target mRNA binding assay
T1 (1 OD) and T6 (1 OD) were tested with simulated target mRNA areas (1 OD) in phosphate-buffered saline (PBS) with 100 mM NaCl and 10 mM MgCl2 (1 mL). Changes in absorbance at 260 nm with a temperature increase from 20°C to 90°C (at 1°C/min) were observed using a Cary-100 Bio UV−visible spectrophotometer (Varian, Palo Alto, CA, USA). Melting temperature (Tm) values were calculated from the first derivative plots of absorbance against temperature.
2.6. In-Vitro Studies
2.6.1. Cell Culture
The antitumor activity of the ASONs was evaluated in vitro with MCF-7 cells (National Infrastructure of Cell Line Resources, Beijing, China). The cells were maintained in Roswell Park Memorial Institute 1640 culture medium complemented with 10% FBS. They were cultured at 37°C and 5% CO2 until subconfluence (75–85%).
2.6.2. Assessment of Cellular Uptake
MCF-7 cells were seeded in glass-bottomed dishes for 24 h at densities of 6 and 8 × 10⁴/mL. Fluorescein amidite (FAM)-labeled ASONs (2 μM) were added and incubated for 1 h. The cells were then fixed with 4% paraformaldehyde and washed three times with PBS, and confocal scanning laser microscopy (CLSM) was used to evaluate cellular uptake. With a confocal microscope (SUNNY CSIM 110), lasers at 405 and 488 nm were used for the fluorescence excitation of DAPI and FAM, respectively.MCF-7 cells were seeded in 12-well plates (3 × 10⁵ cells/well) for 24 h. FAM-labeled ASONs were then added to each well and incubated for 1 h. The cells were distributed equally into 300 mL PBS, followed immediately by flow cytometric analysis (FACSCalibur; BD Biosciences, Ramsey, MN, USA). The fluorescence intensity values for 10,000 events/sample were analyzed at an excitation/emission ratio of 494/522 nm. The relative mean fluorescence intensity (MFI) refers to the fluorescence intensity of different AA-ASONs divided by the PBS group, respectively.
2.6.3. Cytotoxicity Study with Linear Polyethylenimine or Direct Administration
Linear polyethylenimine (PEI) reagent (cat. #40816ES03; Shanghai YEASEN Biotechnology) was used for transfection. It was added with prepared ASONs (PEI transfection: 0.6 μM; direct administration: 2 μM) to MCF-7 cells and incubated for 24 h. Then, the MCF-7 cell proliferation rate was determined using the cell counting kit 8 (CCK8) method. A microplate reader (E-max; Molecular Devices, Sunnyvale, CA, USA) was used to measure the density of each well at 450 nm.
2.6.4. The Mechanism of Cellular Uptake Studies
THE method was same as the part flow cytometric analysis of 2.6.2.
2.7. Cell Apoptosis Experiment
To further confirm the antitumor effect of T6, the apoptosis of tumor cells was measured. Cell apoptosis was analyzed using our previously reported method [
16]. Briefly, prepared ASONs were incubated with MCF-7 cells for 24 h. Cells (1 × 10
5) were collected and resuspended in 100 μL binding buffer complemented with annexin V–fluorescein isothiocyanate (FITC) and propidium iodide (PI) for 15 min. The samples were subjected to flow cytometry (FACSCalibur; BD Biosciences).
2.8. Reverse-Transcriptase Quantitative Polymerase Chain Reaction Assay
A reverse-transcriptase quantitative polymerase chain reaction (RT-qPCR) assay was performed according using our previously reported method [
17]. Briefly, MCF-7 cells were seeded in six-well plates (5 × 10
4 cells/well). After 48 h incubation, corresponding T1 or T6 (0.2 μM) was added and the samples were incubated for another 48 h. TRIzol Reagent (Invitrogen, Carlsbad, CA, USA) was used to isolate the total cell RNA, and the PrimeScript RT reagent kit with gDNA eraser (code DRR047A; TaKaRa) was used to synthesize cDNA. SYBR Premix Ex Taq II reagent (code DRR081A; TaKaRa) was used to perform RT-qPCR with the standard cycling program (40 cycles of 95°C for 30 s and 60°C for 5 s). A CFX96 real-time PCR detection system (Bio-Rad Laboratories Ltd., Hercules, CA, USA) was used to obtain melting curves with a temperature increase from 65°C to 95°C at 0.5°C/5 s). The forward and reverse primer sequences for RRM2 are shown in
Table 1. The CFX Manage software (version 1.0; Bio-Rad Laboratories Ltd.) was used to perform calculations. The results are expressed as fold changes in expression [2^ (-ΔΔCt)] on a linear scale.
2.9. In Vivo Studies
Nude BALB/c mice (aged 6–7 weeks, weighing 20 ± 2 g) (Beijing Keyu Animal Breeding Center, Beijing, China) were used for the in vivo assessment of the ASONs’ antitumor activity. MCF-7 cells (1 × 10⁵) suspended in 100 μL PBS were injected subcutaneously into the animals’ right flanks. The treatments were begun after the average tumor volume had reached about 80 mm3. Fifteen tumor-bearing animals were divided randomly into PBS, T1, and T6 groups. The treatments [0.1 mL (0.3 mmol/L)] were administered by intra-tumor injection daily for 14 days. The mice were sacrificed after the last treatment administration. The tumor volumes [(length × width × height) / 2] were measured with a caliper. The tumors were collected and fixed in 10% formalin overnight, embedded in paraffin, and sectioned at 4 μm thickness. The sections were deparaffinized, rehydrated, and stained with hematoxylin and eosin (H&E).
2.10. Statistical Analysis
All data are presented as means ± standard deviations. Significant differences were calculated by a two-tailed Student’s t-test.The significance level was set to p < 0.05.
3. Results and Discussion
3.1. Z-X-1 and Z-X-2 Compounds
The Z-X-1 compound was synthesized with a typical AA region connected to an active acetyl bromide group by a flexible oxyalkyl chain as a ligand for conjugation with ASONs. The Z-X-2 compound was synthesized by replacing the nitrogen atom in AA with an oxygen atom as a negative control. The HRMS and
1H NMR results confirmed that the desired structures and intermediates had been obtained (
Figures S1–S14).
Scheme 1.
The synthetic route of the Z-X-1 compound. (i) Toluenesulfonyl chloride, CHCl2, room temperature, overnight; (ii) Bis(tert-butoxycarbonyl) amine, cesium carbonate, SOCl2, 80℃, 2 h; (iii) hydrochloric acid/ethyl acetate, room temperature, overnight; (iv) p-methoxybenzoyl chloride, CHCl2, 0℃ to room temperature, 3 h; (v) bromoacetyl bromide, Et3N, CHCl2, room temperature, overnight.
Scheme 2.
The synthetic route of the Z-X-2 compound. (i) Toluenesulfonyl chloride, CHCl2, room temperature, overnight; (ii) bromoacetyl bromide, Et3N, CHCl2, room temperature, overnight.
Scheme 2.
The synthetic route of the Z-X-2 compound. (i) Toluenesulfonyl chloride, CHCl2, room temperature, overnight; (ii) bromoacetyl bromide, Et3N, CHCl2, room temperature, overnight.
3.2. ASON Conjugation
The acetyl bromide group’s ability to react with any PS group in the solution phase facilitates the design of ASON–AA conjugating with different ligand sites and amounts. ASONs with different PS modifications (at the 3’-terminal and/or 5’- terminal and in the middle) were used for conjugation (
Table 2). The confirmation of ASON molecular weights by MALDI-TOF MS is shown in
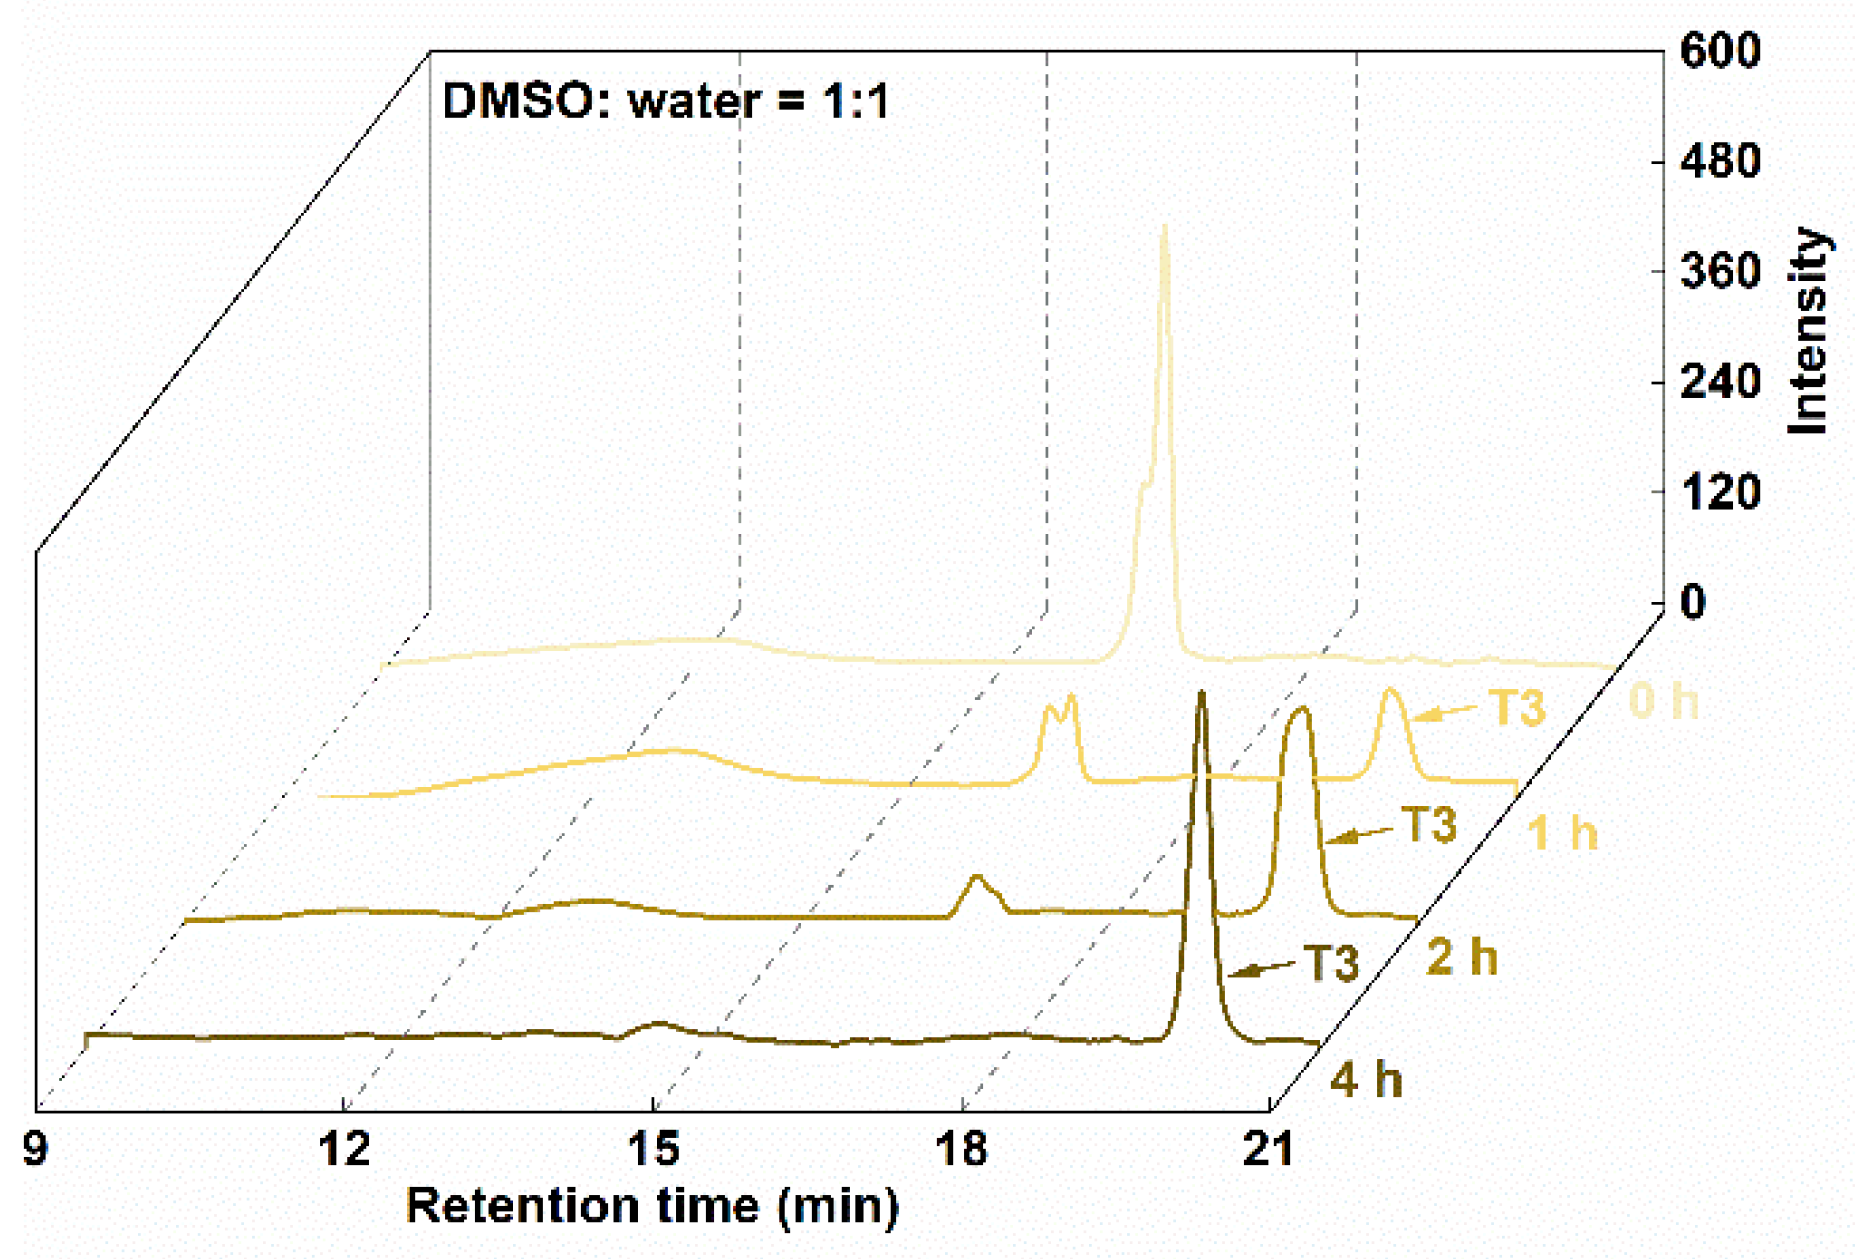
Figures S19–S24. Conjugation was attempted under several reaction conditions with different components and phase solvent ratios; the synthesis of T3, as an example, is detailed in
Table 3. The conditions affected reaction times and yields. The best condition was identified as reaction for 4 h in d
6-DMSO/aqueous solution, which provided a high yield (98.9%), as confirmed by HPLC analysis (
Figure 2).
3.2. Anti-Serum and Anti-Enzymolysis Stability
Serum contains substantial nucleases that readily degrade naked DNA. DNase I is an endonuclease that nonspecifically cleaves single- and double-stranded DNA [
18].
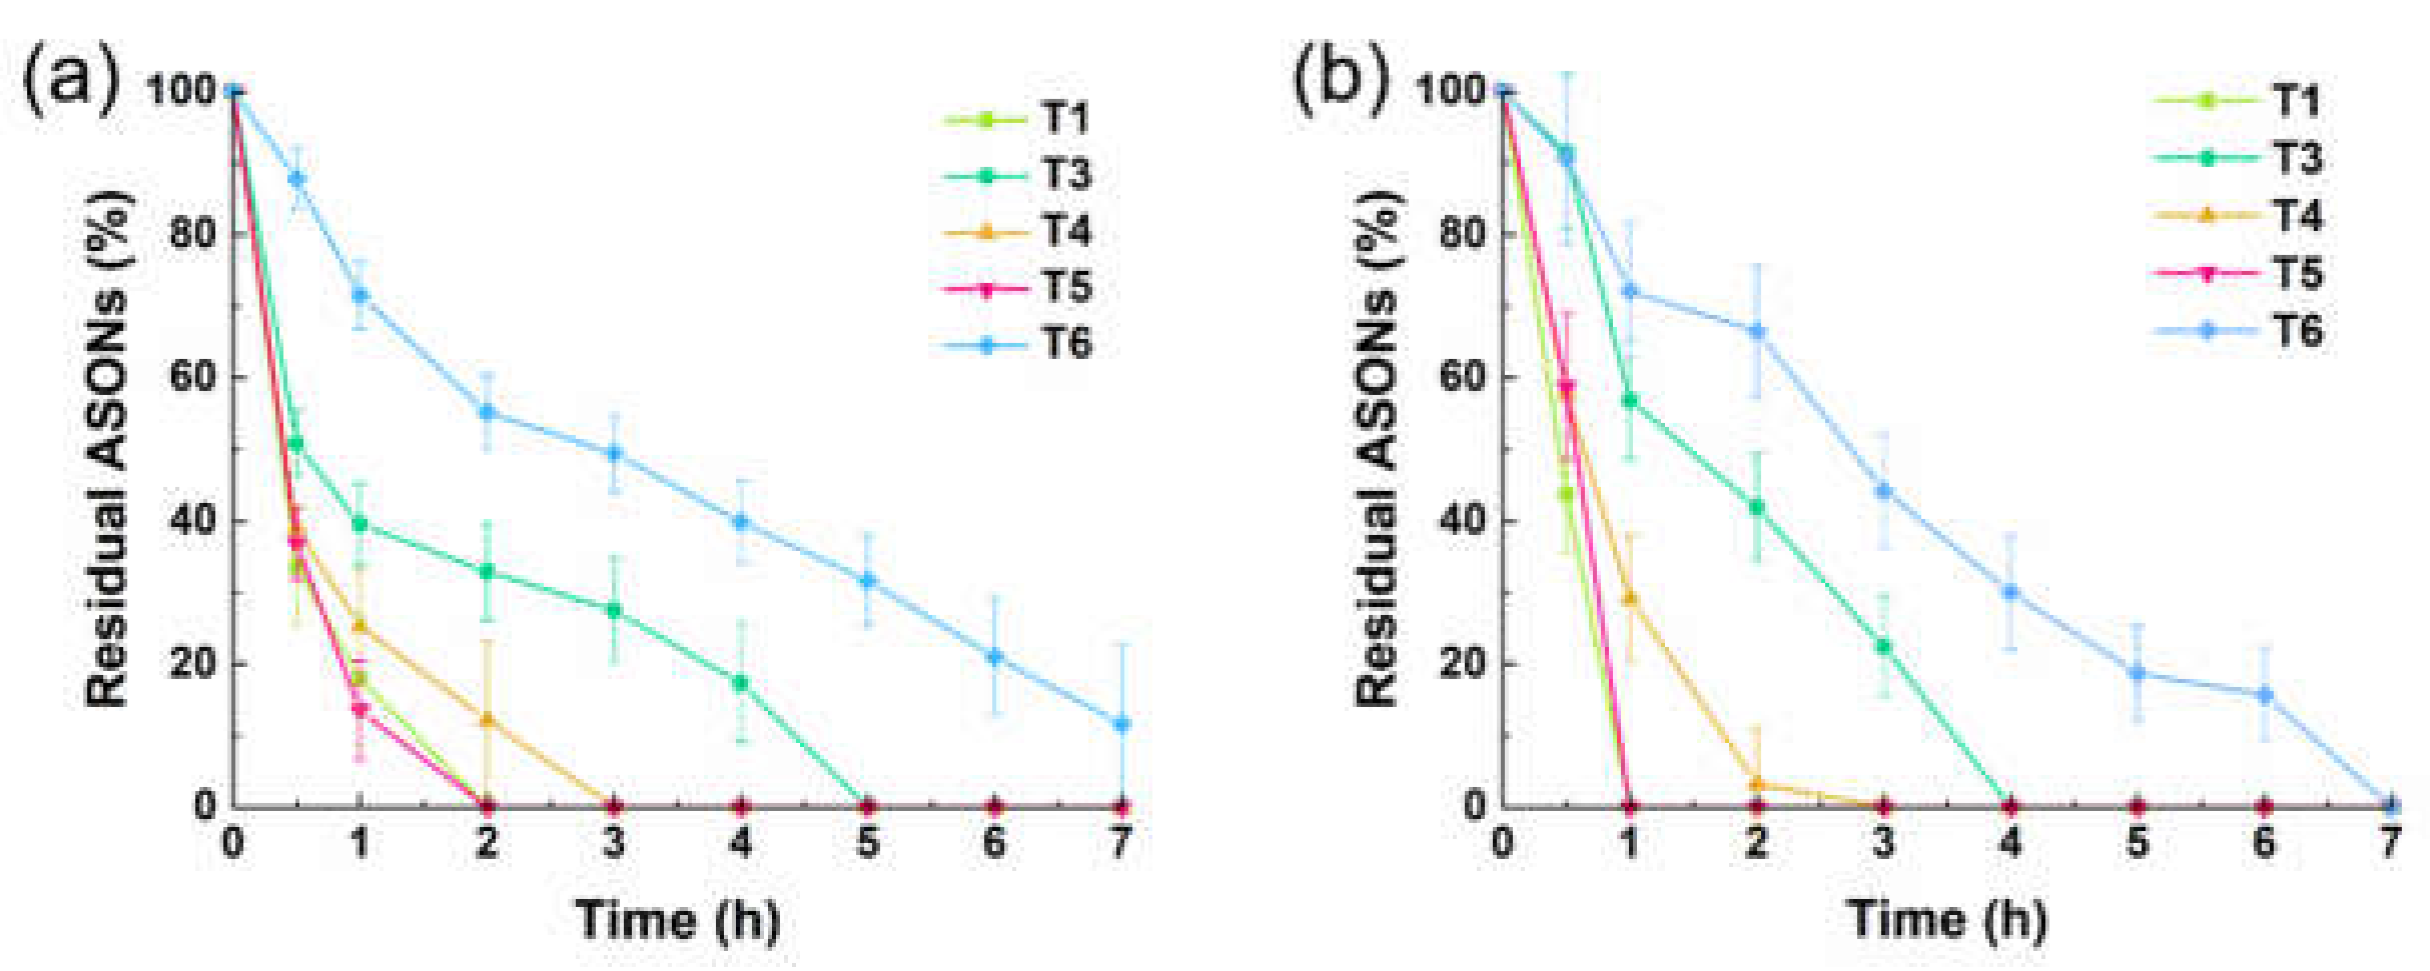
In serum condition, native linear T1 degraded completely within 2 h (
Figure 3a). Among the single AA–ASON conjugates, the intermediately modified T5 degraded most rapidly. T3, with AA conjugation at the 3'-end, was more stable than T4, with AA conjugation at the 5'-end. This result can be explained by the mediation of degradation primarily by a 3'-exonuclease, and the ability of AA coupling to near-3'-end ASONs to protect against serum 3'-exonuclease–mediated degradation [
19,
20]. T6, with double-end protection, was the most stable one, with >10% remaining after 7 h.
The degradation trends of T1 and T3–T6 in DNase I–containing medium were similar to those in serum, with T6 being the most stable ASON (
Figure 3b). These results indicate that double-ended AA–ASON conjugation greatly improves the stability against enzymatic degradation.
3.4. In-Vitro Cellular Uptake
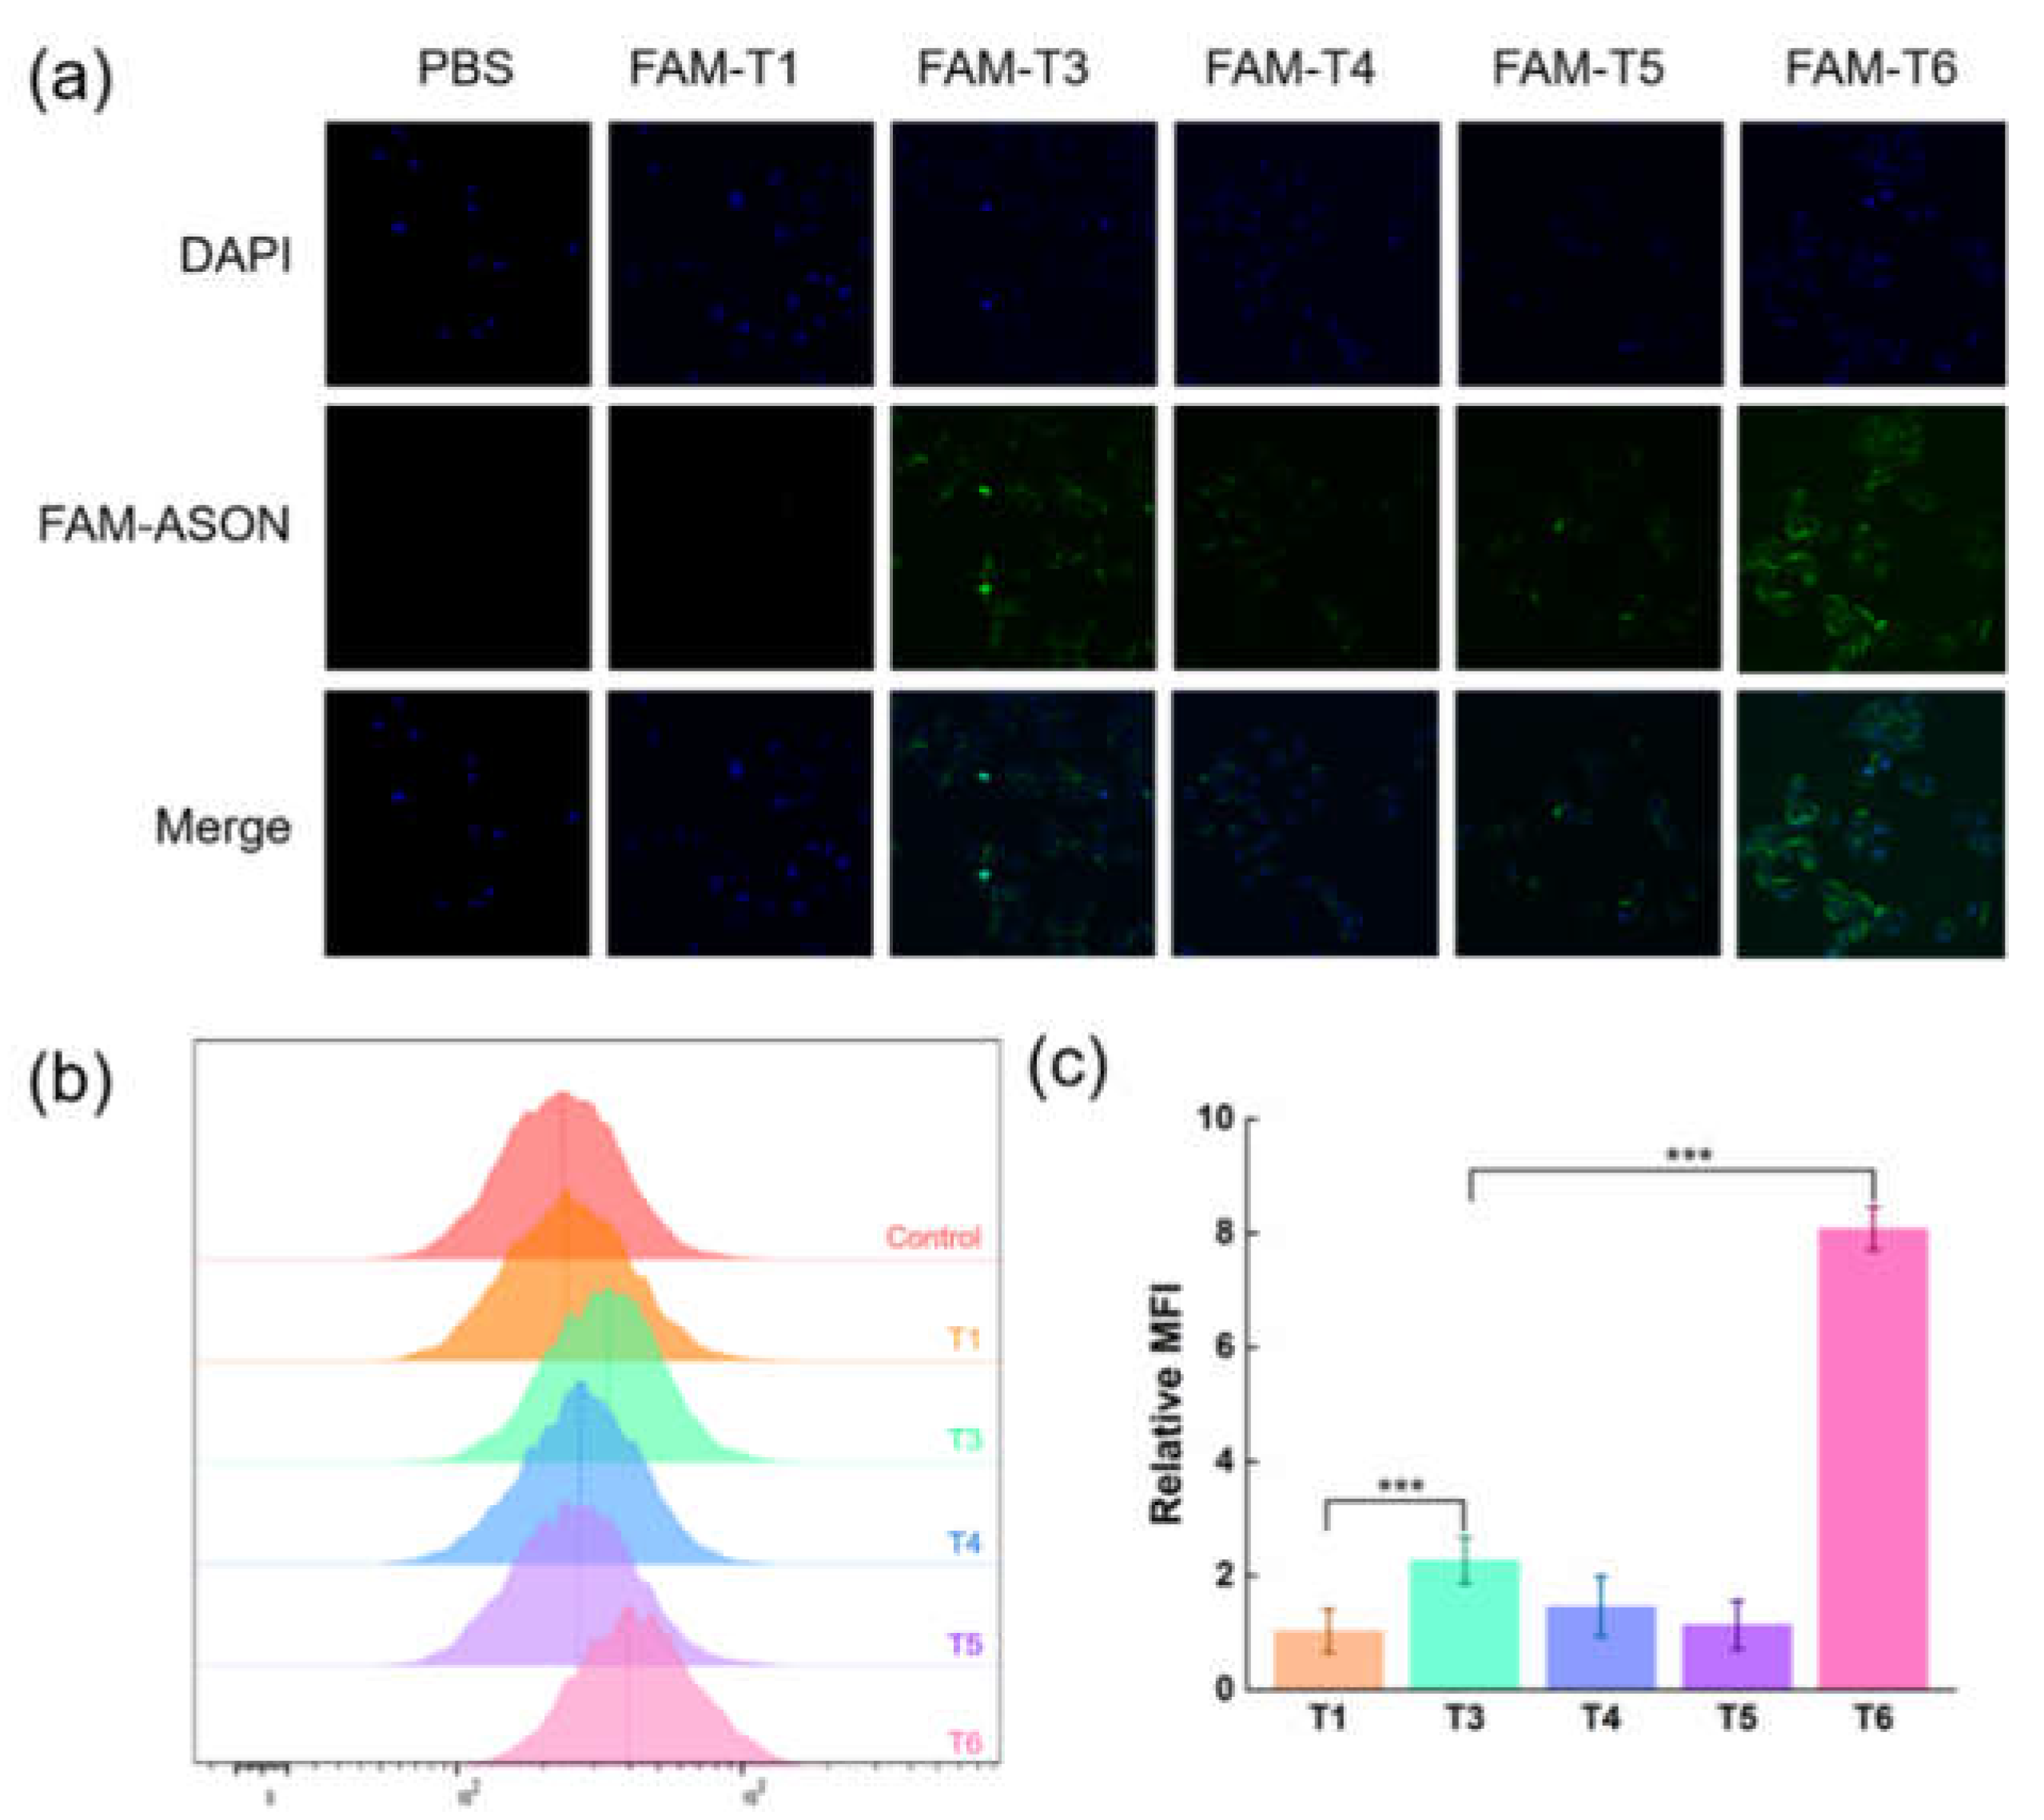
CLSM revealed almost no fluorescence intensity in the T1 group and more pronounced intensities in the other groups (
Figure 4a). Among the single-AA ASONs, T3 had stronger fluorescence intensity than did T4 and T5. T6 showed the greatest fluorescence intensity, not only around the cell membranes but also partly penetrating the nuclei. These results indicate that ASONs conjugated with AA groups entered cells more efficiently than did the native ASON, and that double-ended AA conjugation yielded the best results. They also indicate that the AA amount and positions affect the cellular uptake ability. The results of flow cytometry were in agreement with those of CLSM (
Figure 4b). The mean fluorescence intensities (MFIs) of T3–T5 were greater, respectively, than that of T1. In addition, the MFI of T6 was 7.7 times greater than that of T1 (
p < 0.001).
The Z-X-2 compound was selected as the negative control ligand and used to synthesize an anisyl ester–ASON conjugation (T2) because the N atom is an important pharmacophoric element in the binding of phenyl alkyl molecules to α receptors [
21]. The cellular uptake abilities of T2 and T1 did not differ significantly, with almost no fluorescence observed in both cases (
Figure S25).
3.5. In-Vitro Cytotoxicity
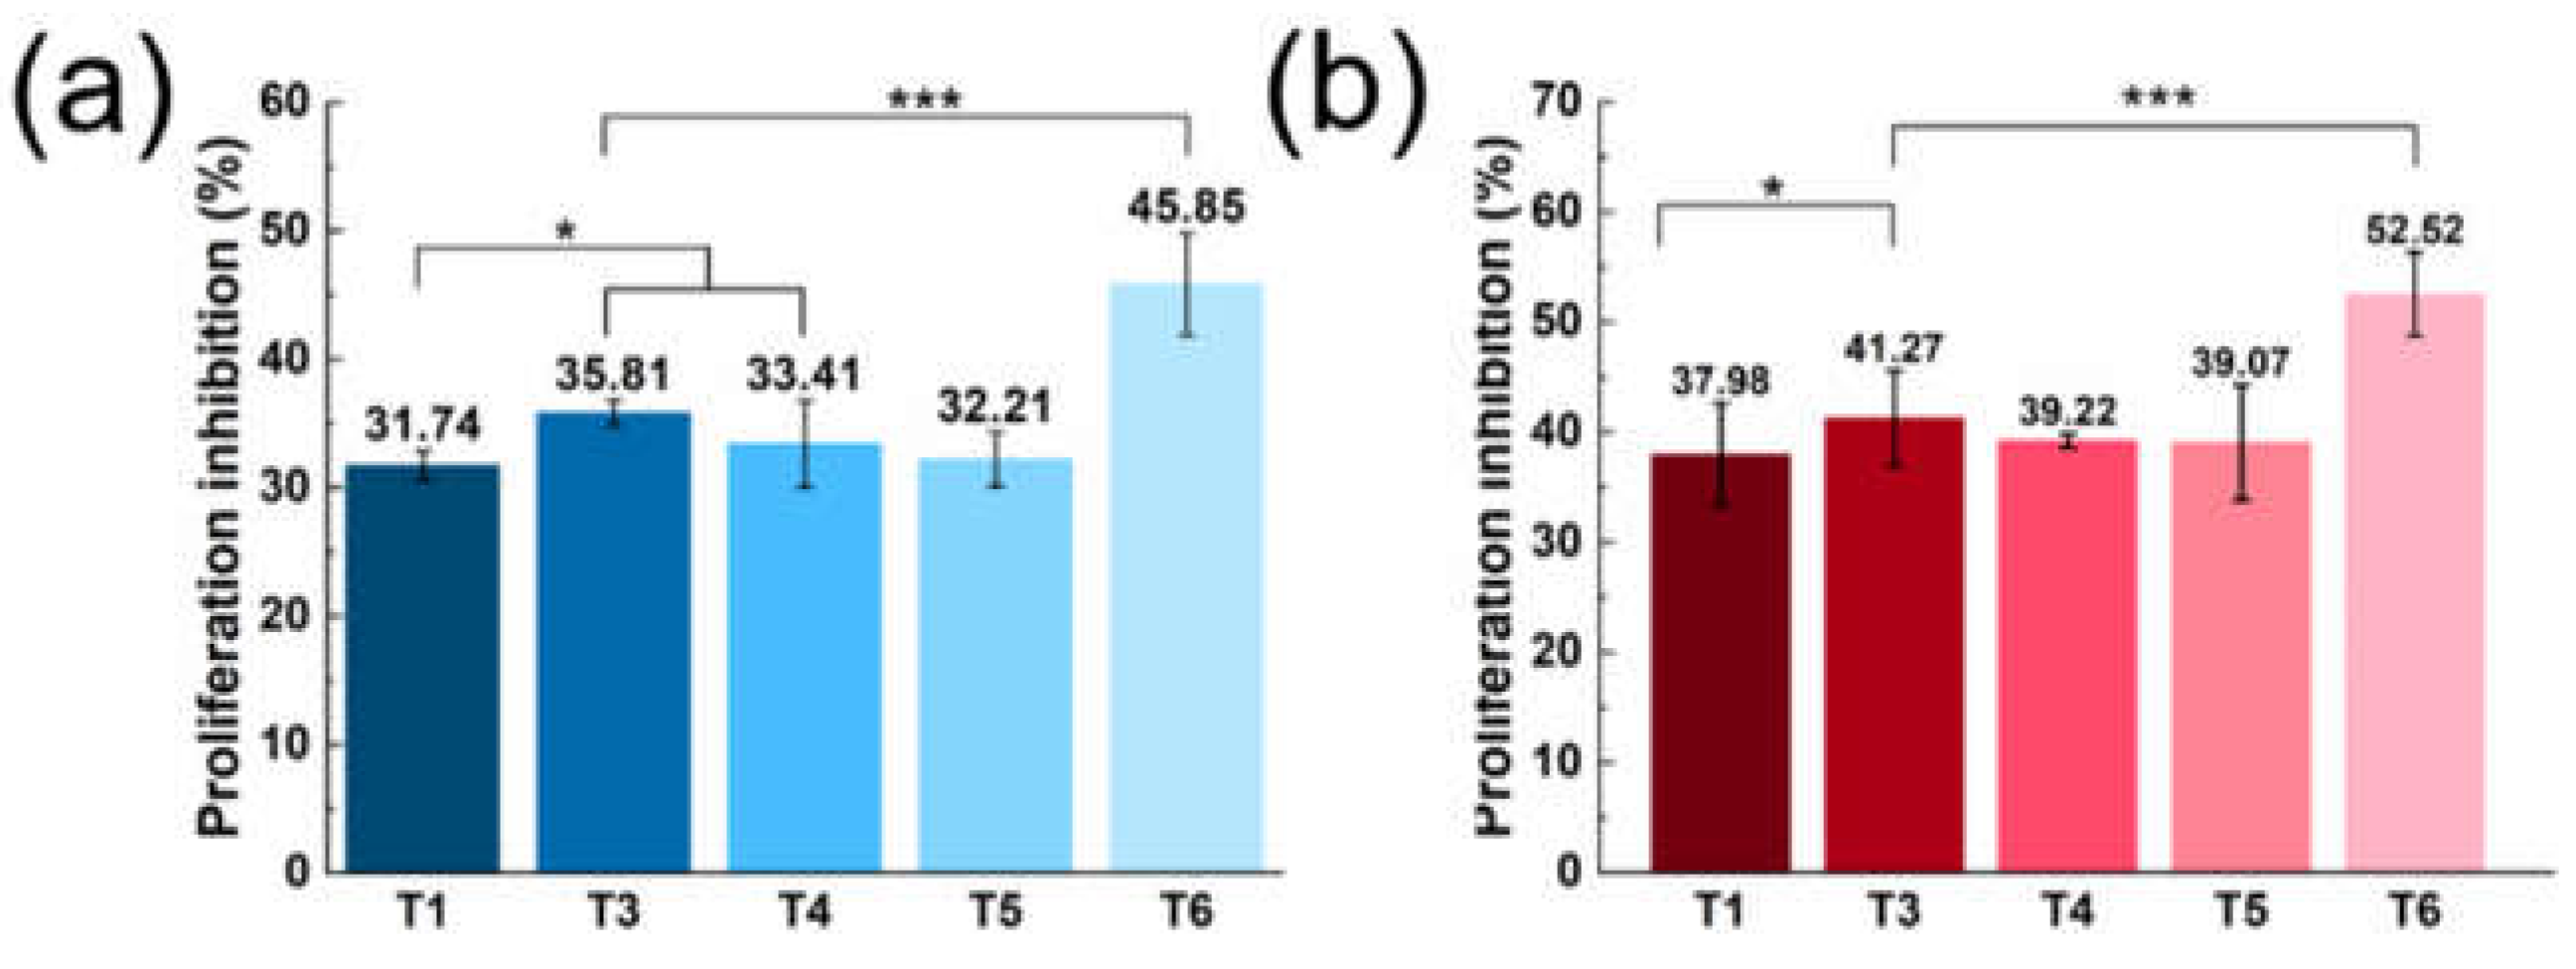
T1, T3, and T4–T6 were subjected to cytotoxicity assays, and the inhibition of tumor cell proliferation was assessed using the CCK8 method. Linear PEI was a common nucleic acid transfection reagent [
22]. With PEI transfection, the T6 group showed greater inhibition of tumor cell proliferation than did groups T3–T5 (all
p < 0.001) and the T1 group (
Figure 5a).
ASON can enter cells via endocytosis, and no ASON drug currently on the market employs a nanocarrier; thus, the improvement of ASON cellular uptake is of importance. In the direct administration (i.e., without transfection) cytotoxicity assays, the T6 group still showed the best proliferation inhibition (
p < 0.001 vs. T3–T5;
Figure 5b). This inhibition ability may be due to T6’s double-ended protective structure and improved cellular uptake ability.
Taken together, the results led to the selection of T6 as the optimal molecule for further research.
3.6. Binding Affinity of T6 to Target mRNA
Melting temperatures during incubation with a simulated target RNA region did not differ significantly between the T6 and T1 groups (
Table 4), suggesting that the conjugated structure of T6 did not affect its binding to the target mRNA.
5.7. Mechanism of Cellular Uptake
To investigate the cellular uptake mechanism of T6, three pharmaceutical endocytosis inhibitors [amiloride, chlorpromazine (CPZ), and methyl-β-cyclodextrin(MβCD)] were used to block the established pathways, and their contributions were assessed using flow cytometry. Amiloride inhibits caveolin-mediated macropinocytosis, CPZ inhibits clathrin-mediated endocytosis, and MβCD inhibits caveolin-mediated endocytosis. Treatment with the three inhibitors (amiloride, CPZ and MβCD) did not significantly reduce the cellular uptake ability of T6 (
Figure 6a). However, this ability was inhibited significantly when the MCF-7 cells were pretreated with haloperidol (a sigma receptor antagonist;
Figure 6b) [
23,
24]. These results suggest that the enhanced cellular uptake of T6 was mediated primarily by sigma receptors.
5.8. In-Vitro Antitumor Mechanism of T6
To further confirm the antitumor effect of T6, the apoptosis of tumor cells was measured by flow cytometry. Annexin V–FITC
–/PI
– cells were identified as living (lower left quadrant), annexin V–FITC
+/PI
– cells were taken to be in the early stage of apoptosis (upper left quadrant), annexin V–FITC
+/PI
+ cells were taken to be in the late stage of apoptosis (upper right quadrant), and annexin V–FITC
–/PI
+ cells were identified as necrotic (upper left quadrant). The apoptosis-promoting effect was reflected by the proportions of fluorescence scatter intensity in Q2 and Q4 regions. The T6-treated group showed a significant apoptotic effect, with an apoptotic cell population of 30.44% relative to those of the PBS-treated group (15.10%) and the T1-treated group (18.29%;
Figure 7) (both
p < 0.001).
5.9. RT-qPCR Results
RR has large (R1) and small (R2) subunits. R2 is encoded by the RRM2 gene on chromosome 12, which acts as a tumor promoter and cooperates with various oncogenes to enhance cellular transformation and the malignancy potential [
25,
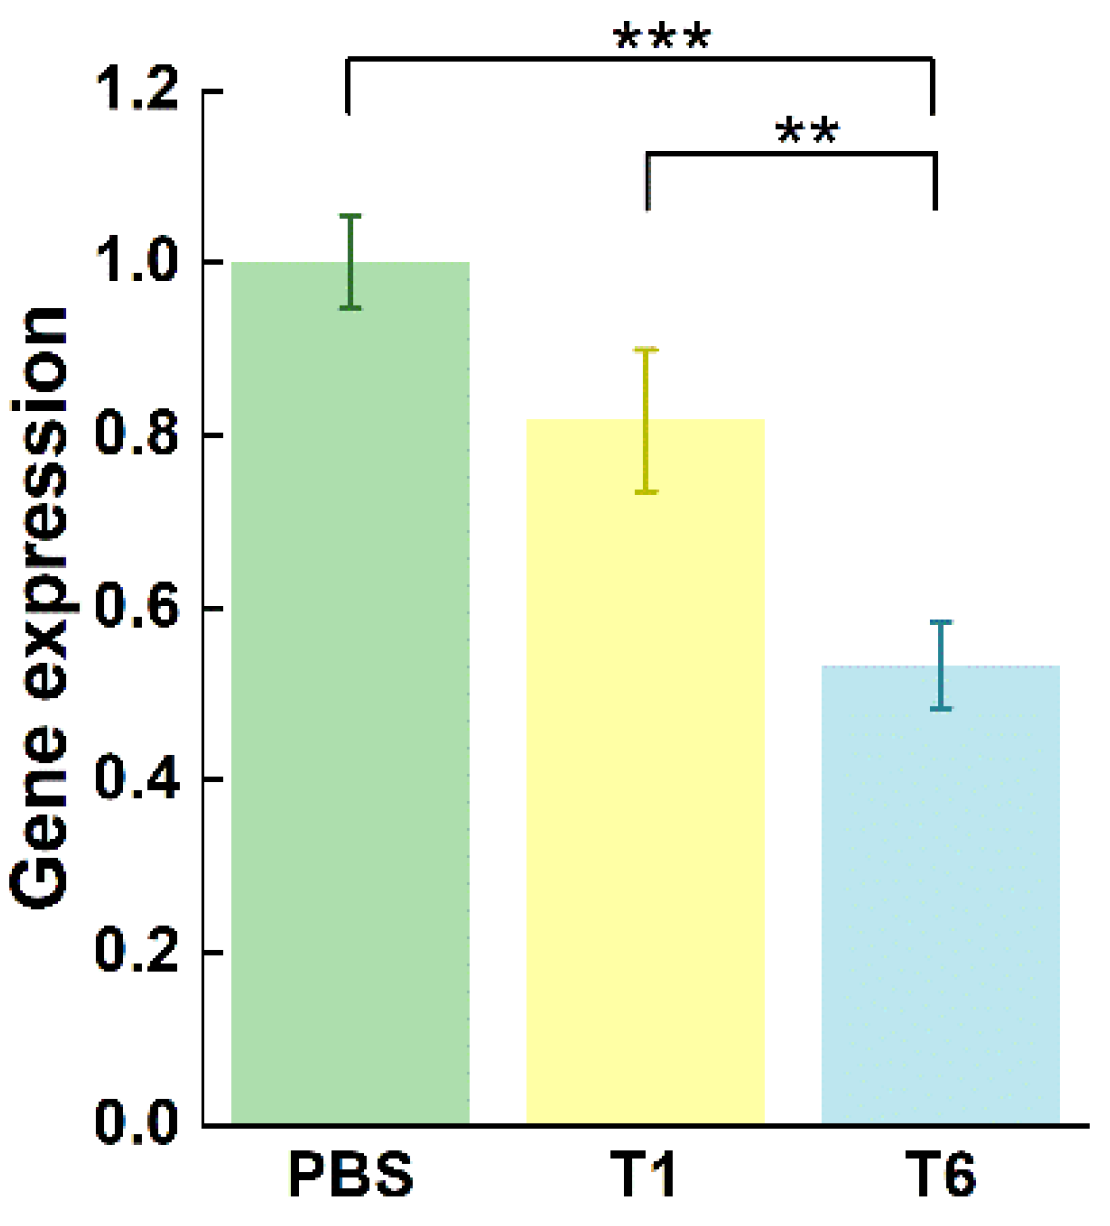
26]. The ASON GTI-2040 has been shown to directly and specifically inhibit the complementary binding of RRM2 mRNA to the coding region. Thus, an RT-qPCR assay was performed to compare the relative expression of RRM2 mRNA among study groups. The mRNA expression of RRM2 in MCF-7 cells was sharply decreased in the T6-treated group relative to that in the T1- and PBS-treated groups (both p < 0.001;
Figure 8). These results demonstrate that T6 significantly suppressed RRM2 mRNA expression.
5.10. In-Vivo Antitumor Capacity of T6
We evaluated the
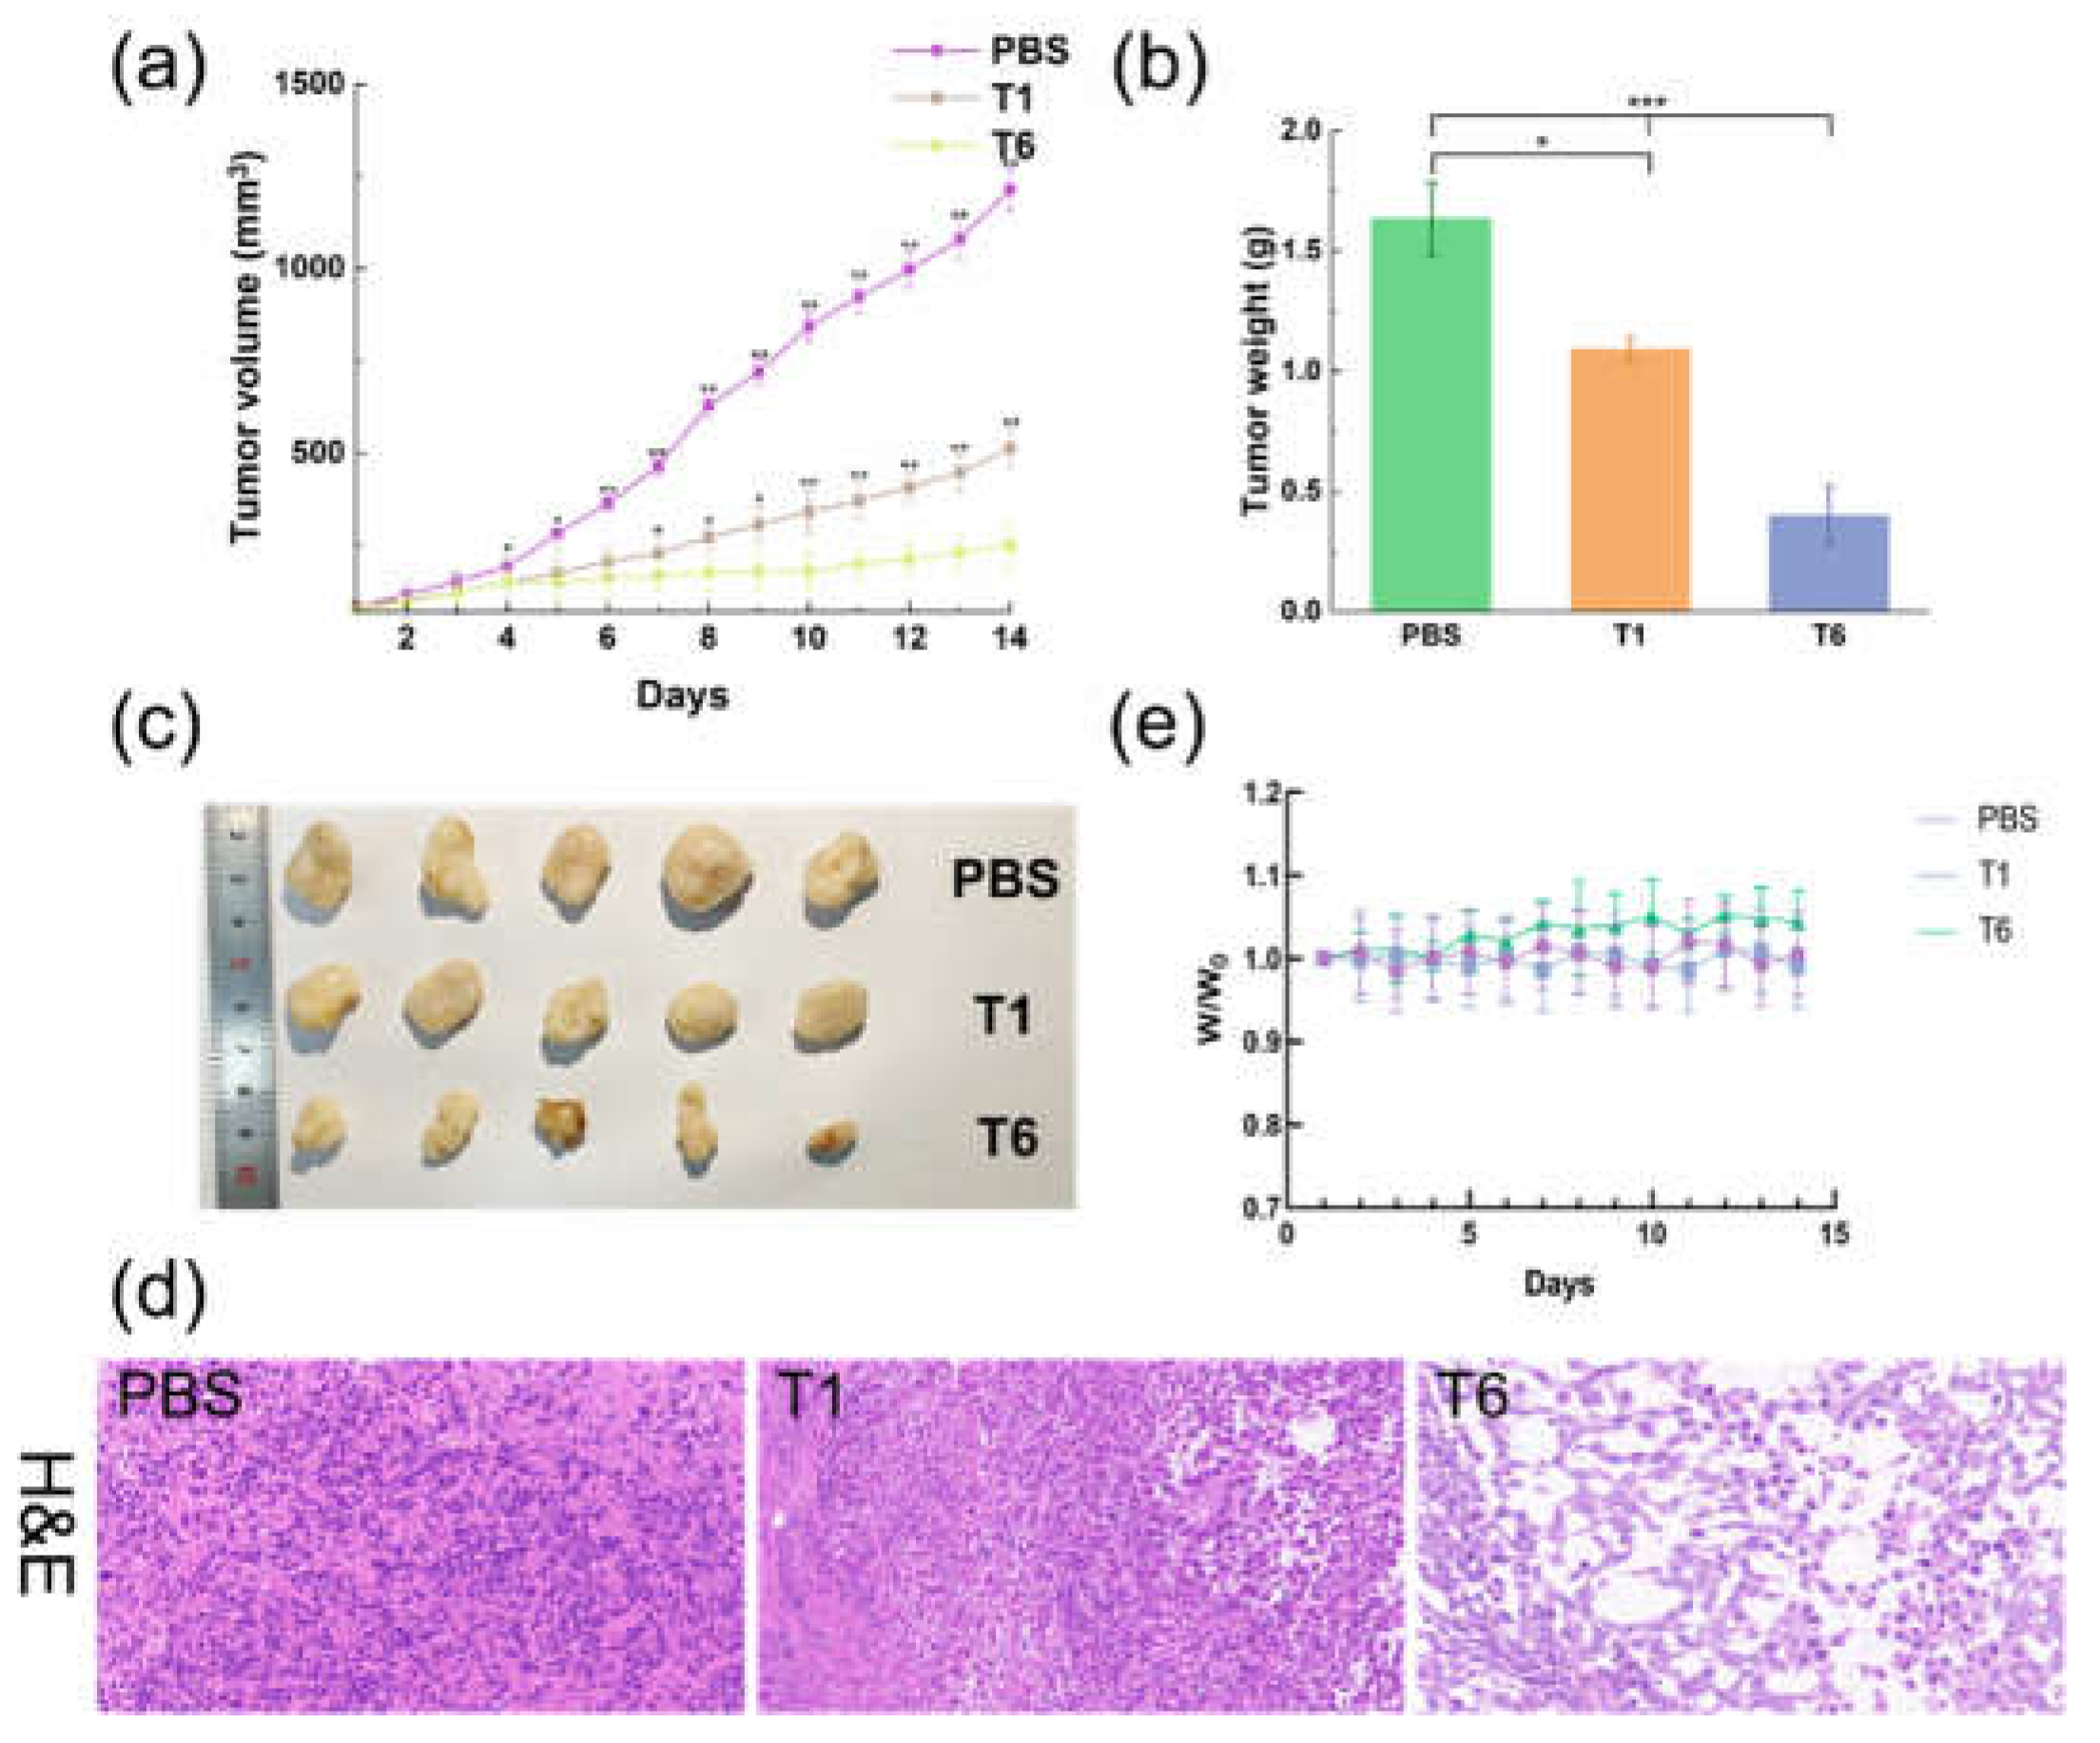
in-vivo antitumor activity of PBS, T1, and T6 in a nude mouse model with human breast cancer (MCF-7) cells. Intratumoral injections were administered daily. We assessed the therapeutic efficacy of the treatment regimens by measuring tumor growth and weight. Tumors formed and grew rapidly in mice treated with PBS. T1 had a moderate tumor inhibition effect, and T6 significantly slowed tumor growth (
Figure 9a–c).
Histological analysis of H&E-stained samples revealed no obvious malignant necrosis in the PBS and T1 groups but massive cell remission and a high rate of apoptosis in the T6 group (
Figure 9d), confirming that T6 efficiently suppressed tumor growth. These results are likely attributable to the increased resistance of T6 to nuclease degradation and cellular uptake, observed
in vivo. No significant change in mouse body weight was observed during treatment in any groups (
Figure 9f), demonstrating the biocompatibility of T6.
4. Conclusions
In this work, a solution-conjugated AA–ASON class was synthesized and evaluated. Conjugation with AA at the 5’ and 3’ ends significantly enhanced the conjugate’s stability against enzymatic hydrolysis, receptor-specific cellular uptake, and biological effects. The functionalization of any ASON site is a new strategy for the design of other nucleic acid drugs.
Supplementary Materials
The following supporting information can be downloaded at the website of this paper posted on Preprints.org. Figures S1–S14, 1H NMR and HRMS spectra of the Z-X-1 and Z-X-2 compounds; Table S1, The sequences and molecular weights of Z1-Z4; Figure S15-S18 Figures S15–S20, The MALDI-TOF-MS spectra of Z1–Z4; Figure S19-S24, The MALDI-TOF-MS spectra of T1–T6; Figure S25, Cellular uptake ability of T1–T3. (a) Confocal images and (b) flow cytometry analysis of MCF-7 cells treated with PBS and T1–T3. (c) Relative MFIs of treated MCF-7 cells.
Author Contributions
Conceptualization: Z.Z. and L.X.; data curation: Z.Z. and Z.C.; formal analysis: Z.Z. and Z.C.; funding acquisition: L.X.; investigation: Z.C. and Y.L.; methodology: Z.X., Y.L. and X.F.; project administration: X.P.; resources: L.X.; software: Z.X.; supervision: L.X. and X.F.; validation: Y.L.; visualization: Z.Z. and Z.C.; writing—original draft: Z.Z. and Z.C.; writing—review and editing: L.X. and X.F. All authors have read and agreed to the published version of the manuscript.
Funding
This work was financially supported by Beijing Nova Program (20220484229).
Institutional Review Board Statement
The animal study protocol was in accordance with the Guide for the Care and Use of Laboratory Animals of the Association for Assessment and Accreditation of Laboratory Animal Care and approved by the Animal Care and Use Committee of National Beijing Center for Drug Safety Evaluation and Research (BJ. No20200910S1300810)
Informed Consent Statement
Not applicable.
Data Availability Statement
Not applicable.
Conflicts of Interest
The authors declare no conflict of interest.
References
- Milligan JF, Matteucci MD, Martin JC. Current concepts in antisense drug design. J Med Chem. 1993;36(14):1923-1937. [CrossRef]
- Crooke ST, Baker BF, Crooke RM, Liang XH. Antisense technology: an overview and prospectus. Nat Rev Drug Discov. 2021;20(6):427-453. [CrossRef]
- Thompson AJ, Patel K. Antisense inhibitors, ribozymes, and siRNAs. Clin Liver Dis. 2009;13(3):375-390.
- Roberts T C, Langer R, Wood M J A. Advances in oligonucleotide drug delivery. Nat. Rev. Drug Discov. 2020;19(10): 673-694. [CrossRef]
- Agrawal S, Temsamani J, Galbraith W, Tang J. Pharmacokinetics of antisense oligonucleotides. Clin Pharmacokinet. 1995;28(1):7-16. [CrossRef]
- Kool ET. Circular oligonucleotides: new concepts in oligonucleotide design. Annu Rev Biophys Biomol Struct. 1996;25:1-28.
- Samad MA, Pandiri K, Bojanapally AP. Antisense oligonucleotides: pharmacology and delivery strategies. Int. J. Appl. Pharm. Sci. Res. 2020;5(1): 7-11. [CrossRef]
- Arar K, Aubertin AM, Roche AC, Monsigny M, Mayer R. Synthesis and antiviral activity of peptide-oligonucleotide conjugates prepared by using N alpha-(bromoacetyl)peptides. Bioconjug Chem. 1995;6(5):573-577. [CrossRef]
- Juliano RL. The delivery of therapeutic oligonucleotides. Nucleic Acids Res. 2016;44(14):6518-6548. [CrossRef]
- Bortolozzi A, Manashirov S, Chen A, Artigas F. Oligonucleotides as therapeutic tools for brain disorders: Focus on major depressive disorder and Parkinson's disease. Pharmacol Ther. 2021;227:107873.
- Banerjee R, Tyagi P, Li S, Huang L. Anisamide-targeted stealth liposomes: a potent carrier for targeting doxorubicin to human prostate cancer cells. Int J Cancer. 2004;112(4):693-700. [CrossRef]
- Garg NK, Dwivedi P, Campbell C, Tyagi RK. Site specific/targeted delivery of gemcitabine through anisamide anchored chitosan/poly ethylene glycol nanoparticles: an improved understanding of lung cancer therapeutic intervention. Eur J Pharm Sci. 2012;47(5):1006-1014. [CrossRef]
- Vilner BJ, John CS, Bowen WD. Sigma-1 and sigma-2 receptors are expressed in a wide variety of human and rodent tumor cell lines. Cancer Res. 1995 Jan 15;55(2):408-13.
- Lee Y, Vassilakos A, Feng N, et al. GTI-2040, an antisense agent targeting the small subunit component (R2) of human ribonucleotide reductase, shows potent antitumor activity against a variety of tumors. Cancer Res. 2003;63(11):2802-2811.
- Xiao GG, Zhou BS, Somlo G, et al. Identification of F-box/LLR-repeated protein 17 as potential useful biomarker for breast cancer therapy. Cancer Genomics Proteomics. 2008;5(3-4):151-160.
- Zhang Z, Ren H, Chen Z, et al. Dumbbell-Shaped Antisense Oligonucleotide Prodrugs Showed Improved Antinuclease Stability and Anticancer Efficacy. Mol Pharm. 2022;19(11):3915-3921. [CrossRef]
- Liu J, Li Y, Liu S, Zhang Y, Luo Y, Yang Y, Zhuang X, Wang X, Zhao B, Xu T, Xu L. Alkoxy cyanoacrylate-based nanoparticles with stealth and brain-targeting properties. J Drug Target. 2022 Feb;30(2):219-231. [CrossRef]
- Chiou HC, Tangco MV, Levine SM, et al. Enhanced resistance to nuclease degradation of nucleic acids complexed to asialoglycoprotein-polylysine carriers. Nucleic Acids Res. 1994;22(24):5439-5446. [CrossRef]
- Boado RJ, Pardridge WM. Complete protection of antisense oligonucleotides against serum nuclease degradation by an avidin-biotin system. Bioconjug Chem. 1992;3(6):519-523. [CrossRef]
- Manoharan M, Johnson L K, Bennett C F, et al. Cholic acid-oligonucleotide conjugates for antisense applications. Bioorg. Med. Chem. 1994;4(8): 1053-1060. [CrossRef]
- Ablordeppey SY, Fischer JB, Glennon RA. Is a nitrogen atom an important pharmacophoric element in sigma ligand binding?. Bioorg Med Chem. 2000;8(8):2105-2111. [CrossRef]
- Bologna JC, Dorn G, Natt F, Weiler J. Linear polyethylenimine as a tool for comparative studies of antisense and short double-stranded RNA oligonucleotides. Nucleosides Nucleotides Nucleic Acids. 2003;22(5-8):1729-1731. [CrossRef]
- Li SD, Huang L. Targeted delivery of antisense oligodeoxynucleotide and small interference RNA into lung cancer cells. Mol Pharm. 2006;3(5):579-588. [CrossRef]
- Banerjee R, Tyagi P, Li S, Huang L. Anisamide-targeted stealth liposomes: a potent carrier for targeting doxorubicin to human prostate cancer cells. Int J Cancer. 2004;112(4):693-700. [CrossRef]
- Zhou B, Yen Y. Characterization of the human ribonucleotide reductase M2 subunit gene; genomic structure and promoter analyses. Cytogenet Cell Genet. 2001;95(1-2):52-59. [CrossRef]
- Kirschbaum MH, Frankel P, Synold TW, et al. A phase I pharmacodynamic study of GTI-2040, an antisense oligonucleotide against ribonuclotide reductase, in acute leukemias: a California Cancer Consortium study. Leuk Lymphoma. 2016;57(10):2307-2314. [CrossRef]
Figure 1.
The design of ASONs for AA conjugation.
Figure 1.
The design of ASONs for AA conjugation.
Figure 2.
The HPLC spectra of T3.
Figure 2.
The HPLC spectra of T3.
Figure 3.
The stability of T1 and T3–T6 against enzymatic degradation in serum- (a) and DNase I– (b) containing media.
Figure 3.
The stability of T1 and T3–T6 against enzymatic degradation in serum- (a) and DNase I– (b) containing media.
Figure 4.
The cellular uptake of the ASON conjugates. (a) Confocal images and (b) flow cytometric analyses of treated MCF-7 cells [nuclei are labeled with DAPI (blue) and ASONs are labeled with FAM (green); scale bar = 40 μm]. (c) Relative MFIs of treated MCF-7 cells. ***p < 0.001 vs T3. The data are presented as means ± standard deviations (n = 3).
Figure 5.
The cytotoxicity of T1 and T3–T6 with PEI transfection and an ASON concentration of 0.2 μM (a), and with direct administration with an ASON concentration of 0.6 μM (b). *p < 0.05, ***p < 0.001 vs. T3. The data are presented as means ± standard deviations (n = 4).
Figure 5.
The cytotoxicity of T1 and T3–T6 with PEI transfection and an ASON concentration of 0.2 μM (a), and with direct administration with an ASON concentration of 0.6 μM (b). *p < 0.05, ***p < 0.001 vs. T3. The data are presented as means ± standard deviations (n = 4).
Figure 6.
Cellular uptake pathways of T6 with untreated MCF-7 cells and cells pretreated with three pharmaceutical endocytosis inhibitors (amiloride, CPZ, and MβCD; a) and a sigma receptor antagonist (haloperidol; b).
Figure 6.
Cellular uptake pathways of T6 with untreated MCF-7 cells and cells pretreated with three pharmaceutical endocytosis inhibitors (amiloride, CPZ, and MβCD; a) and a sigma receptor antagonist (haloperidol; b).
Figure 7.
The apoptosis of MCF-7 cells treated with PBS, T1, and T6. (a) Cell apoptosis analysis detected by flow cytometry. (b) Statistical result of apoptotic MCF-7 cells. ***p < 0.001 vs T6. The data are presented as the mean ± standard deviation (n = 3).
Figure 7.
The apoptosis of MCF-7 cells treated with PBS, T1, and T6. (a) Cell apoptosis analysis detected by flow cytometry. (b) Statistical result of apoptotic MCF-7 cells. ***p < 0.001 vs T6. The data are presented as the mean ± standard deviation (n = 3).
Figure 8.
Relative expression of RRM2 mRNA after MCF-7 cells were treated with PBS, 2 μM T1, or 2 μM T6. **p < 0.01, ***p < 0.001 vs T6. The data are presented as the mean ± standard deviation (n = 3).
Figure 8.
Relative expression of RRM2 mRNA after MCF-7 cells were treated with PBS, 2 μM T1, or 2 μM T6. **p < 0.01, ***p < 0.001 vs T6. The data are presented as the mean ± standard deviation (n = 3).
Figure 9.
In-vivo antitumor activity of T6, T1, and PBS. (a) Growth of MCF-7 tumor xenografts in mice under the different treatments. *p < 0.05, **p < 0.01 vs. T6. The data are presented as means ± standard deviations (n = 5). (b) Post-treatment tumor weights. *p < 0.05, **p < 0.01 vs. PBS. The data are presented as means ± standard deviations (n = 5). (c) Photograph of tumors isolated from mice after different treatments. (d) H&E staining of MCF-7 tumor tissues after 14 days of treatment. (e) Body weights of MCF-7 tumor–bearing mice under treatment.
Table 1.
RT-qPCR primers.
Table 1.
RT-qPCR primers.
| Gene |
Sequence |
| β-actin |
Forward: 5′-CGAGCGCGGCTACAGCTT-3′ |
| Reverse: 5′-CCTTAATGTCACGCACGATT-3′ |
| RRM2 |
Forward: 5′-ATGAAAACTTGGTGGAGCGATT-3′ |
| Reverse: 5′-TGGCAATTTGGAAGCCATAGA-3′ |
Table 2.
ASON sequences and molecular weights.
Table 2.
ASON sequences and molecular weights.
| No. |
Sequence (5’-3’) |
Molecular Weight (Estimated) |
Molecular Weight (Actual) |
| T1 |
GGCTAAATCGCTCCACCAAG |
6071.0 |
6071.0 |
| T2 |
GGCTAAATCGCTCCACCAA#G |
6453.3 |
6453.1 |
| T3 |
GGCTAAATCGCTCCACCAA*G |
6455.0 |
6454.7 |
| T4 |
G*GCTAAATCGCTCCACCAAG |
6455.0 |
6453.3 |
| T5 |
GGCTAAATCG*CTCCACCAAG |
6455.0 |
6454.7 |
| T6 |
G*GCTAAATCGCTCCACCAA*G |
6836.8 |
6836.1 |
Table 3.
Optimization of coupling conditions.
Table 3.
Optimization of coupling conditions.
| Composition of coupling solvent |
Coupling solvent ratio |
Reaction time (h) |
Yield (%) |
| Organic phase(A) |
aqueous(B) |
A |
B |
| d6-DMSO |
Sterile water |
1 |
1 |
4 |
98.9 |
| d6-DMSO |
Sterile water |
1 |
4 |
5 |
95 |
| Acetonitrile |
Sterile water |
1 |
1 |
12 |
0 |
| Acetonitrile |
Sterile water |
1 |
4 |
12 |
0 |
| Acetonitrile |
PBS |
1 |
1 |
12 |
0 |
| Acetonitrile |
PBS |
1 |
4 |
12 |
0 |
| Acetonitrile |
PBS+100 mM NaCl |
1 |
1 |
12 |
0 |
| Acetonitrile |
PBS+100 mM NaCl |
1 |
4 |
12 |
0 |
| Methanol |
Sterile water |
1 |
1 |
6 |
70.1 |
| Methanol |
Sterile water |
1 |
4 |
6 |
64.3 |
| Methanol |
PBS |
1 |
1 |
12 |
27.2 |
| Methanol |
PBS |
1 |
4 |
12 |
25.8 |
| Methanol |
PBS+100 mM NaCl |
1 |
1 |
12 |
28.9 |
| Methanol |
PBS+100 mM NaCl |
1 |
4 |
12 |
25.3 |
Table 4.
the Tm values of T1 and T6 binding to the target mRNA#.
Table 4.
the Tm values of T1 and T6 binding to the target mRNA#.
| |
T1 |
T6 |
| Tm
|
67.54 ± 0.26 |
68.56 ± 1.51 |
| P value |
|
0.30 |
|
Disclaimer/Publisher’s Note: The statements, opinions and data contained in all publications are solely those of the individual author(s) and contributor(s) and not of MDPI and/or the editor(s). MDPI and/or the editor(s) disclaim responsibility for any injury to people or property resulting from any ideas, methods, instructions or products referred to in the content. |
© 2023 by the authors. Licensee MDPI, Basel, Switzerland. This article is an open access article distributed under the terms and conditions of the Creative Commons Attribution (CC BY) license (http://creativecommons.org/licenses/by/4.0/).
