
Submitted:
21 April 2023
Posted:
21 April 2023
You are already at the latest version
Abstract
Infection with the porcine reproductive and respiratory syndrome virus type 1 (PRRSV-1) has serious economic consequences for the pig industry. Swine practitioners and other agricultural advisors often describe an increase in antibiotic use when PRRSV-1 is circulating. Our objective was to assess the impact of PRRSV-1 stabilization programmes on reducing antibiotic use. The study was carried out on 19 French farrow-to-finish farms that successfully implemented a PRRSV-1 stabilization protocol between 2007 and 2019. For each farm, antibiotic consumption (expressed in mg/PCU and ALEA) were compared one year before (P1) and one year after (P2) the implementation of such a protocol and the change between P1 and P2 were calculated in percentages. Data were then analysed by level of consumption. Antibiotic use decreased significantly between P1 and P2 if expressed in mg/PCU and showed a decreased tendency in terms of exposure (ALEA). Concerning the change from P1 to P2, our results showed that the higher consumption levels in P1, the greater antibiotic reduction in P2. This study highlights the ability of a stabilization protocol against PRRSV-1 to reduce antibiotic use, especially on farms that have high consumption. These hopeful results show that further investigations about the relationship between PRRSV-1 and antibiotic usage could be beneficial.
Keywords:
porcine reproductive and respiratory syndrome virus
; health management
; antibiotic usage
; pig production sector
; PRRSV-1 stabilization program
1. Introduction
Porcine reproductive and respiratory syndrome virus (PRRSV) is classified within the genus Arterivirus and causes enzootic viral disease. In the west of France, and particularly in Brittany, where nearly 70% of French pork production is concentrated, it affects more than 60% of farms, with many respiratory and reproductive problems, generating serious economic consequences [1,2,3]. Within the Arterivirus family, the species Betaarterivirus suid 1 (PRRSV-1) are most widespread in Europe while the Betaarterivirus suid 2 is mainly present in North America and Asia [4,5]. Regarding the impact of PRRSV-1 circulation in herds on antibiotic consumption, agricultural advisors have noted an increase of antibiotic usage when PRRSV-1 is present, but few reports support this observation. However, the observation makes sense in view of bacterial co-infections that frequently require antibiotic treatments [6,7].
For several years, PRRSV stabilization protocols have been evaluated and implemented, mainly in North America, using mass vaccination and improvements in biosecurity measures [8,9]. In France, since the 2000s, combining the mass vaccination of sows and their piglets with a modified-live virus (MLV) vaccine, together with closure of the farm and unidirectional pig and human flows have been widely implemented [10].
The success of such protocols is established by the demonstration of the absence of viral circulation in the breeding herd. Based mainly on blood samples in weaning piglets, sampling protocols are described in the American Association of Swine Veterinarians (AASV) guidelines [11]. This permits the classification of farms as: naïve, stable, or unstable (with different prevalence levels).
Measuring antibiotic use is not an easy task. First, antibiotics can be used in different ways; treatments can be administered individually or, when many animals need to be treated, group treatments are often provided orally via the feed or the water [12]. All characteristics related to antibiotic usage should be considered, e.g., treatment type (metaphylactic or prophylactic), antibiotic class, route of administration (injectable, premix, oral solutions). Secondly, the methods for quantifying usage are various. Many indicators are available to measure antimicrobial use in veterinary medicine; and results can differ substantially depending on the method used [13]. The selection of appropriate indicators of antibiotic usage therefore requires a clear objective that will permit reliable comparisons through standardized parameters.
In the global effort to combat antimicrobial resistance, reducing antibiotic use is a key point of improvement on swine farms. Several studies have already shown some useful measures for reducing antibiotic usage, e.g., biosecurity measures [14]. In France, two initiatives, named Plan ‘Ecoantibio’ 1 and 2, have been launched to address the recommendations on antibiotic use of the World Organization for Animal Health (WOAH), the World Health Organization (WHO) and the United Nations Food and Agriculture Organization (FAO). The first plan (EcoAntibio-1) induced a decrease of 41.5 % in pig in antibiotic consumption between 2011 and 2016 [15]. With the second plan (EcoAntibio-2), which aimed to keep up efforts and analyse any issues in the first plan, antibiotic use decreased even further. The overall level of antibiotic exposure in the pig production sector has decreased by 55.5% since 2011.
To our knowledge, no study on the implementation of PRRSV-1 control measures, particularly by way of stabilization programmes, has shown an impact on antibiotic use. The aim of our study was to evaluate the impact of PRRSV-1 stabilization protocols on antibiotic usage, and to promote these programmes with tangible information for practitioners.
2. Results
2.1. Features of the Analysed Data
2.1.1. General Characteristics
In total, 19 farrow-to-finish farms located in Brittany (France) were included in the study (Table 1). All had implemented a successful PRRSV-1 stabilization protocol between 2007 and 2019. The majority of farms (14 out of 19) were managed in a 7-batch management system with weaning at 28 days of age. Numbers of slaughtered pigs and sows were recorded to calculate the weight of animals potentially treated. The number of sows ranged from 100 to 600 (mean: 273), and the number of fattening pigs ranged from 1762 to 16662 (mean: 5806).
On all farms, piglets were vaccinated against Mycoplasma hyopneumoniae and porcine circovirus type 2 (PCV-2). All farms purchased their gilts (PRRSV naive) from an external multiplier.
2.1.2. Global Antibiotic Consumption Data
Records of antibiotic consumption allowed the calculation of two indicators: the Animal Level Exposure of Antimicrobials (ALEA), which is the French exposure indicator, and consumption measured in mg/PCU, the European indicator.
The antibiotic classes included fluoroquinolones, aminocyclitols, beta-lactams, trimethoprim and sulphonamides, macrolides, tiamulin and lincomycin, florfenicol, colistin, quinolones and tetracyclines. Their distribution is described in Figure 1. Antimicrobial classes with the highest weighted treatment occurrence (as a percentage of total) for both periods were tetracyclines, macrolides, tiamulin and lincomycin (referred to as MTL) and colistin.
Antibiotic treatment data were divided between two periods: one period (P1) one year before the implementation of PRRSV-1 control measures, and a second period of the year following the end of PRRSV-1 monitoring, as an indicator of the success of the stabilization protocol (P2). Data concerned a constant number of sows in both periods and respectively 110319 and 116364 slaughtered pigs in P1 and P2. Considering all treatments, a total of 624 g of antibiotics were administered in P1 compared to 607 g in P2, corresponding to a total volume of 1231 g antibiotics. In terms of absolute quantity used, collective treatments represented almost 30 times that of individual treatments (Table 2).
2.2. The Impact of PRRSV-1 Stabilization Programmes
2.2.1. On Overall Antibiotic Consumption
Total consumptions per farm were obtained by summing all ALEA per treatment. The same was done for mg/PCU. Eleven farms out of 19 had reduced their consumption between periods P1 and P2 when measured as mg/PCU and eight when measured as ALEA (Figure 2). On average, we observed a reduction of 0.80 for ALEA value and 54 mg for the mg/PCU indicator.


| Indicators | Categories | Number of farms | Limits1 |
|---|---|---|---|
| ALEA | |||
| Low | 4 | < 0.5 | |
| Medium | 8 | 0.5 – 0.9 | |
| High | 7 | > 0.9 | |
| mg/PCU | |||
| Low | 10 | < 100 | |
| High | 9 | ≥ 100 |
2.2.2. According to the Level of Antibiotic Consumption in P1
Levels of consumption in P1 seemed to impact the change in usage, both for ALEA and for mg/PCU; the higher the level of consumption in P1, the greater the reduction in antibiotic use in P2 (Figure 4). Indeed, in high consuming herds, the overall level of antibiotic use decreased from 1389.47 mg/PCU to 852.20 mg/PCU and, for the ALEA indicator, from 11.56 to 5.20. For this level of consumption, only one farm increased its use between P1 and P2 for the ALEA indicator, due to a large increase of colistin use and two farms increased their mg/PCU: the farm with increased ALEA values and another one, with a huge increase of macrolides, tiamulin and lincomycin (MTL) use in P2.
When considering low levels of consumption in P1, as illustrated in Figure 4, it is more difficult to show a substantial reduction of antibiotic usage. Some farms (five out of ten for mg/PCU value and one out of four for ALEA value) decreased their usage, while for the others, consumption stayed stable.
Regarding the change in antibiotic consumption (Formula (3), see paragraph 4.3), the main report in our study concerned high consumers. On average, farms with a high level of consumption in P1 reduced their usage by 48.8% for mg/PCU and by 13.5% for ALEA. A statistically significant decrease among high consumers was observed compared to low consumers (p=0.006). To a lesser extent, between medium and high consumers, antibiotic use tended to decrease (p=0.08). However, no significant difference was found between low and medium consumers (p=0.25). For mg/PCU, farms with a high level of consumption in P1 tended to have a greater reduction of consumption than farms with a low level of consumption in P1 (p=0.07).
3. Discussion
In this study, we recorded longitudinal data on antibiotic usages from different farms before and after the implementation of a successful PRRSV-1 stabilization protocol. PRRSV-1 stabilization programmes on our selected farms were implemented between 2007 and 2019. We analysed these usages using two indicators: ALEA and mg/PCU values and also considered the level of consumption in P1. Results of this analysis emphasize the impact of a PRRSV-1 stabilization protocol on antibiotic consumption. These promising results show the importance of further investigations into the relationship between PRRSV-1 and antibiotic usage.
3.1. Evaluation of Methods
The ALEA indicator for antibiotic usage is widely used in French analysis. The ALEA values observed in our study are consistent with the averages found by other authors [15,16,17]. This value permits comparisons between countries and periods of time. Different indicators have been proposed and published [13,18,19]. However, unlike most indicators, ALEA is an indicator based on animal course doses administered [20,21]. Differences between nationally established animal defined daily dosages may have a substantial influence on the results of antimicrobial consumption in swine herds. Thus, harmonized units of measurement and animal weights were used to enable international comparison [22,23,24]. Calculations based on the ALEA indicator are more precise because tonnages sold do not accurately reflect their use. To evaluate the exposure of animals to antibiotics, it is therefore necessary to take into account dosage, duration of administration and of course, any change in the number of animals on the farm [25].
Knowledge of variations in several indicators and the expression of the data using different units gives more precise values of antibiotic consumption. Using various indicators in a complementary approach permits more detailed conclusions to be drawn. In our study, the mg/PCU indicator was used in addition to ALEA values. This indicator is widely used on a European scale. As described by the UK government: “The mg/PCU is a unit of measurement developed by the European Medicines Agency to monitor antibiotic use and sales across Europe” [26]. It accurately represents the volume of antibiotic usage for standardized animal weights (separate benchmarking values calculated according to different physiological stages).
A limited number of studies have compared several indicators applied to the same antimicrobial usage data in order to achieve the same objective. Some of them investigated the impact of denominator selection when comparing antimicrobial usage based on sales data between countries. For example, Bondt et al. showed that antimicrobial usage, expressed in milligrams of active substance per PCU, overestimated the true difference in usage in the Netherlands compared to Denmark, even though the two countries have similar animal demographics [27]. In our study, we have chosen this indicator in addition to ALEA in order to guarantee an international scope for our results.
3.2. Data Quality
All data recorded were based on data available from our software, on the delivery of drugs and prescribed by only one veterinarian over the entire analysis period. Indeed, some studies explored the relationship between veterinarian’s prescribing and antibiotic usage by farmers. For example, a study conducted by Coyne et al., helped to explain the link between the antimicrobial prescribing behaviours by veterinarians and antibiotic usage levels in farms [28]. Another, by Singer et al., concluded that veterinarians must continue to develop antibiotic control programmes to ensure that antibiotics are used only when necessary [29]. Thus, the impact of a veterinarian’s perceptions on antibiotic usage can influence the level of consumption in farms [30,31]. To limit bias potentially generated by the prescribing veterinarians, in our study, only farms followed by the same farm veterinarians during both periods were selected.
As our study was retrospective, some information was lacking to explain the absence of a reduction in some herds. For example, details about treatment type (e.g., oral vs. individual, antibiotic classes) and usage indications could have allowed us to explain more accurately some of the results. The physiological stages of treated animals were not recorded in our dataset. For this reason, it was not possible to explain some increases in antibiotic use in P2. Further studies taking these parameters into account would be helpful.
3.3. Antibiotic Usage Changes
In order to reduce antibiotic consumption in breeding herds and to minimize the risks of antibiotic resistance in humans, the European Union implemented a plan to control risks in 2011. EcoAntibio-1 aimed for a reduction of 25% of total antibiotic consumption between 2012 and 2017. In our study, ten farms carried out their PRRSV-1 stabilization protocols before 2012 and six did so between 2012 and 2017. A second plan (Ecoantibio-2) was implemented between 2017 to 2021, aimed at continuing the goals of the first project. Three farms – selected for our study – had implemented their PRRSV-1 stabilization programme during this plan. Our results might have been impacted by the measures of EcoAntibio plans but to a minor extent. Indeed, the bias induced by the implementation of these plans should be small as such plans take many years, our comparisons were realised in a limited period. To eliminate this bias, it would be interesting to have a large sample to compare only farms that implemented the stabilization protocol during the same period. However, such study is not feasible at our practice level.
3.4. Classes of Consumption’s Levels
In France, the National Agency for Food, Environment and Occupational Health and Safety (ANSES) found a 41.5% decrease of antibiotic consumption between 2011 and 2016, swine exposure levels have continued to decrease in recent years (in 2020, -23.8% from the ALEA value of 2016) [32]. However, antibiotic exposure remains high in pig production showing an ALEA of 0.46 in 2021 [33]. In our study, we found an ALEA mean of 0.91 in P1 and 0.73 in P2. Two main reasons could explain this difference: due to a geographical reason (1) or health status regarding PRRSV (2).
(1) All consumption levels used for comparison are measured at national level. In our case, it is a regional study based only on farms located in Brittany where the prevalence of PRRSV-1 is high. It would be appropriate to include farms spread all over France for comparison. The mg/PCU indicator is also impacted by this point.
(2) Secondly, only PRRSV-1 unstable farms were included in our study which may explain the higher level of antibiotic use due to their poorer health status. Indeed, Trevisi et al. had previously shown that PRRSV status significantly influenced the use of antibiotics in weaning and fattening stages [34].
Choosing farms according to their level of consumption in P1 would have allowed us to classify them into high, medium, and low consumers independent of the year of inclusion. A more detailed study of the relationship between consumption levels and antibiotic usage reduction would then have been available. However, in view of the changing trend of antibiotic use in pig farming, the classification of farms could have differed depending on the year. Combined with the limited number of farms and the different years of inclusion in our study, such a classification was therefore not possible.
Finally, a superior study protocol would include control farms (i.e., unstable with no implementation of control measures) to allow a comparison between farms which carried out a successful PRRSV-1 stabilization programme. However, this was not feasible with regard to ethics and welfare.
4. Materials and Methods
4.1. Study Design
4.1.1. Selected Farms
With the objective of having sufficient farms to perform statistical analysis, our study included 20 farrow-to-finish farms. They were selected on the basis of the following criteria:(i) Farms should have implemented a successful PRRSV-1 stabilization programme. This consisted of mass vaccination of sows and their piglets with a MLV vaccine, together with herd closure and unidirectional pig and human flows. All steps of the implementation of PRRSV-1 stabilization programmes are described in Berton et al., 2017 [10]. Based mainly on blood samples from weaning piglets, the success of such protocols was confirmed by the absence of viral circulation in the breeding herds following AASV guidelines [11]. (ii) All descriptive data of antibiotics by all administration routes had to be available.(iii) Biomass data should be accessible (for slaughtered pigs and sows).(iv) The prescribing veterinarians and pig farmers had to be the same during both periods (P1 and P2).
For one farm, data were not available, so only nineteen farms were included in the study. Data recorded for each farm included: number of animals treated and potentially treated, years of PRRSV-1 stabilization protocol implementation, batch management, health status, etc.
4.1.2. Antibiotic Data Recorded
All data were collected concerning antibiotic usage one year before implementation of control measures (P1) and one year following the end of PRRSV-1 monitoring indicating the success of the plan (P2). Data were recorded from our drug prescription software. These records included the type of drug (antibiotic families and substance administered), number of antibiotic treatments, and routes of administration. The posology (expressed in mg of active ingredient/kg pig weight/day) of each treatment was also recorded to calculate the quantity of antimicrobial active ingredient contained in each treatment. We also recorded whether administered treatments concerned individual or collective treatment.
4.1.3. Design of the Antibiotic Consumption Categories
The high variability of antibiotic usage in P1 led us to assess the impact of consumption level in P1 on antibiotic usage reduction after the implementation of a stabilization protocol. For that, three categories of consumption’ levels were used for ALEA and two levels for mg/PCU (Table 3).
4.2. Calculation of Indicators
Two indicators were chosen to describe animal exposure to antibiotics and were calculated for each farm. The first one is the ALEA, used by the French authorities to monitor antibiotic sales each year (Formula (1)). It is calculated as follows:
Formula (1) considers the amount of active substances used (in milligrams), the number of animals treated, the dose, the treatment days, and the current animal weight during therapy (in kilograms). The ALEA value is expressed without a unit. The biomass at risk of being treated is calculated as the number of sows present at the farm and the number of slaughtered pigs produced during both periods multiplied by their theoretical weights. These were calculated using the National Research Institute for Agriculture, Food and Environment (INRAE) recommendations, namely 105 kg for pigs and 300 kg for sows.
The other indicator chosen is the mg/PCU (Formula (2)), the European indicator used to evaluate antibiotic usage. It takes into account a unique standardized biomass. The main advantage of using biomass is that it allows different animal species to be combined within the same population; this is the approach used by the European Surveillance of Veterinary Antimicrobial Consumption (ESVAC) project to compute the Population Correction Unit (PCU) [20]. It is calculated as follows:
Formula (2) considers only the amount of active substances used (in mg) and the potential animal weight treated. Calculations of biomass were performed using 65 kg for slaughtered pigs and 250 kg for sows.
4.3. Statistical Analysis
All data were recorded using Excel v.22.10 (Microsoft Corporation, Redmond, USA) and calculations were performed with the same software. First, mean comparisons were applied to compare antibiotic usages between P1 and P2 using non-parametric tests (Kruskal-Wallis test) because our data were not normally distributed. Secondly, the change from P1 to P2 was calculated as follows for both indicators (Formula (3)):
Formula (3) gives a percentage of change, calculated for each farm. This percentage was compared between each consumer category determined by the level of consumption in P1 (Table 3). For ALEA, a Wilcoxon test was used to compare the three groups (low, medium, and high levels of consumption). For mg/PCU, only two groups were compared by a Kruskal-Wallis test. For each analysis, the statistically significant difference was set at p≤0.05, with 0.05<p≤0.10 considered as a tendency. All statistical analysis was performed using R Studio (v 4.2.2, R Core Team, 2022).
5. Conclusions
After careful interpretation of our results and considering the limitations of the study, we showed that the implementation of a PRRSV-1 stabilization programme might help reduce antibiotic usage, independently of the indicator used (ALEA or mg/PCU). To our knowledge, it is the first study showing the impact of such stabilization programmes on antibiotic usage. These promising results show that further investigations into the benefits of PRRSV-1 control measures and antibiotic usage in swine herds could be beneficial, as such measures can positively impact the reduction of antibiotic use.
Author Contributions
Conceptualization, A.L.; P.B. and C.T.; methodology, C.T.; A.L and P.B.; validation, A.L., G.B. and V.N.; investigation, C.T. and P.B.; resources, C.T. and P.B.; G.B.; A.L.; V.N.; M.B.; data curation, C.T.; writing—original draft preparation, C.T. and A.L.; writing—review and editing, C.T.; A.L.; V.N. and G.B.; supervision, A.L. All authors have read and agreed to the published version of the manuscript.
Informed Consent Statement
Informed consent was obtained from all farms involved in the study.
Acknowledgments
The authors are very grateful to all the pig farmers who contributed to this study.
Conflicts of Interest
The authors declare no conflict of interest.
References
- Nieuwenhuis N; Duinhof TF; Van Nes A. Economic analysis of outbreaks of porcine reproductive and respiratory syndrome virus in nine sow herds. Vet. Record 2012, 170, 225–225. [Google Scholar] [CrossRef]
- Nathues H; Alarcon P; Rushton J; Jolie R; Fiebig K; Jimenez M; et al. Cost of porcine reproductive and respiratory syndrome virus at individual farm level – An economic disease model. Preventive Veterinary Medicine 2017, 142, 16–29. [Google Scholar] [CrossRef] [PubMed]
- Renken C; Nathues C; Swam H; Fiebig K; Weiss C; Eddicks M; et al. Application of an economic calculator to determine the cost of porcine reproductive and respiratory syndrome at farm-level in 21 pig herds in Germany. Porcine Health Management 2021, 7, 3. [Google Scholar] [CrossRef] [PubMed]
- Adams MJ; Lefkowitz EJ; King AMQ; Harrach B; Harrison RL; Knowles NJ; et al. Changes to taxonomy and the International Code of Virus Classification and Nomenclature ratified by the International Committee on Taxonomy of Viruses (2017). Arch Virol 2017, 162, 2505–2538. [Google Scholar] [CrossRef]
- Walker PJ; Siddell SG; Lefkowitz EJ; Mushegian AR; Adriaenssens EM; Dempsey DM; et al. Changes to virus taxonomy and the Statutes ratified by the International Committee on Taxonomy of Viruses (2020). Arch Virol 2020, 165, 2737–2748. [Google Scholar] [CrossRef]
- Saade G; Deblanc C; Bougon J; Marois-Créhan C; Fablet C; Auray G; et al. Coinfections and their molecular consequences in the porcine respiratory tract. Vet Res 2020, 51, 80–80. [Google Scholar] [CrossRef] [PubMed]
- Odland CA ; Edler R ; Noyes NR ; Dee SA ; Nerem J ; Davies PR. Evaluation of the Impact of Antimicrobial Use Protocols in Porcine Reproductive and Respiratory Syndrome Virus-Infected Swine on Phenotypic Antimicrobial Resistance Patterns. Appl Environ Microbiol 2022, 88, e0097021–e0097021. [CrossRef]
- Dee SA; Philips R. Using vaccination and unidirectional pig flow to control PRRSV transmission. Journal of Swine Health and Production 1998, 6, 21–25. [Google Scholar]
- Linhares D; Cano J; Torremorell M; Morrison R. Comparison of time to PRRSv-stability and production losses between two exposure programs to control PRRSv in sow herds. Preventive Veterinary Medicine 2014, 116, 111–119. [Google Scholar] [CrossRef]
- Berton P; Normand V; Martineau G-P; Bouchet F; Lebret A; Waret-Szkuta A. Evaluation of porcine reproductive and respiratory syndrome stabilization protocols in 23 French Farrow-to-finish farms located in a high-density swine area. Porcine Health Management 2017, 3, 11. [Google Scholar] [CrossRef]
- Holtkamp DJ; Polson DD; Torremorell M; Classen DM; Becton L; Henry S; et al. Terminology for classifying swine herds by porcine reproductive and respiratory syndrome virus status. Journal of Swine Health and Production 2011, 19, 44–56. [Google Scholar]
- Schwarz S; Kehrenberg C; Walsh TR. Use of antimicrobial agents in veterinary medicine and food animal production. International Journal of Antimicrobial Agents 2001, 17, 431–437. [Google Scholar] [CrossRef]
- Collineau L; Belloc C; Stärk KDC; Hémonic A; Postma M; Dewulf J; et al. Guidance on the Selection of Appropriate Indicators for Quantification of Antimicrobial Usage in Humans and Animals. Zoonoses and Public Health 2017, 64, 165–184. [Google Scholar] [CrossRef]
- Alarcón LV; Allepuz A; Mateu E. Biosecurity in pig farms: a review. Porcine Health Management 2021, 7, 5. [Google Scholar] [CrossRef]
- Anses. Sales survey of veterinary medicinal products containing antimicrobials in France in 2020. ANSES-ANMV, 2021.
- Hémonic A; Chauvin C; Delzescaux D; Verliat F; Corrégé I. The French Working Group ‘antimicrobials in the swine industry. Reliable estimation of antimicrobial use and its evolution between 2010 and 2013 in French swine farms. Porcine Health Management 2018, 4, 8. [Google Scholar] [CrossRef]
- European Medicines Agency. Sales of veterinary antimicrobial agents in 31 European countries in 2021. 2022.
- Chauvin C; Madec F; Guillemot D; Sanders P. The crucial question of standardisation when measuring drug consumption. Vet Res 2001, 32, 533–543. [Google Scholar] [CrossRef] [PubMed]
- Kasabova S; Hartmann M; Werner N; Käsbohrer A; Kreienbrock L. Used Daily Dose vs. Defined Daily Dose—Contrasting Two Different Methods to Measure Antibiotic Consumption at the Farm Level. Frontiers 2019, 6. [Google Scholar]
- EMA. Defined daily doses for animals (DDDvet) and defined course doses for animals (DCDvet). 2016.
- Kreienbrock, L. Evidenced Based Approach for a Definition of Defined Daily Dosages of Antibiotics Used in German Pig Production. Veterinary Evidence 2018, 3. [Google Scholar] [CrossRef]
- Taverne F ; Jacobs J ; Heederik D ; Mouton J ; Wagenaar J ; van Geijlswijk I ; et al. Influence of applying different units of measurement on reporting antimicrobial consumption data for pig farms. BMC Vet Research 2015, 11, 250.
- Jensen VF; Jacobsen E; Bager F. Veterinary antimicrobial-usage statistics based on standardized measures of dosage. Preventive Veterinary Medicine 2004, 64, 201–215. [Google Scholar] [CrossRef] [PubMed]
- Carson CA; Reid-Smith R; Irwin RJ; Martin WS; McEwen SA. Antimicrobial use on 24 beef farms in Ontario. Can J Vet Res 2008, 72, 109–118. [Google Scholar]
- Waret-Szkuta A ; Coelho V ; Collineau L ; Hémonic A ; Buy C ; Treff M ; et al. How Input Parameters and Calculation Rules Influence On-Farm Antimicrobial Use Indicators in Animals. Frontiers in Veterinary Science, 2019, 6.
- Veterinary Medicines Directorate, UK Government. Understanding the mg/PCU calculation used for antibiotic monitoring in food producing animals 2016.
- Bondt N; Jensen VF; Puister-Jansen LF; van Geijlswijk IM. Comparing antimicrobial exposure based on sales data. Preventive Veterinary Medicine 2013, 108, 10–20. [Google Scholar] [CrossRef] [PubMed]
- Coyne LA; Pinchbeck GL; Williams NJ; Smith RF; Dawson S; Pearson RB; et al. Understanding antimicrobial use and prescribing behaviours by pig veterinary surgeons and farmers: a qualitative study. Vet Record 2014, 175, 593–593. [Google Scholar] [CrossRef]
- Singer RS ; Porter LJ ; Thomson DU ; Gage M ; Beaudoin A ; Wishnie JK. Raising Animals Without Antibiotics: U.S. POM-V. Frontiers in Veterinary Science 2019, 6.
- 30 Collineau L; Rojo-Gimeno C; Léger A; Backhans A; Loesken S; Nielsen EO; et al. Herd-specific interventions to reduce antimicrobial usage in pig production without jeopardising technical and economic performance. Preventive Veterinary Medicine 2017, 144, 167–178. [Google Scholar] [CrossRef]
- Visschers VH; Backhans A; Collineau L; Iten D; Loesken S; Postma M; et al. Perceptions of antimicrobial usage, antimicrobial resistance and policy measures to reduce antimicrobial usage in convenient samples of Belgian, French, German, Swedish and Swiss pig farmers. Preventive Veterinary Medicine 2015, 119, 10–20. [Google Scholar] [CrossRef] [PubMed]
- Anses. Suivi des ventes de médicaments vétérinaires contenant des antibiotiques en France en 2020. Anses-ANMV, 2021.
- Anses. Suivi des ventes de médicaments vétérinaires contenant des antibiotiques en France en 2021. Anses-ANMV, 2022.
- Trevisi P; Amatucci L; Ruggeri R; Romanelli C; Sandri G; Luise D; et al. Pattern of Antibiotic Consumption in Two Italian Production Chains Differing by the Endemic Status for Porcine Reproductive and Respiratory Syndrome. Frontiers in Veterinary Science 2022, 9. [Google Scholar]
- David J-C; Buchet A; Sialelli J-N; Delouvée S. Antibiotic Use in Relation with Psychological Profiles of Farmers of a French Pig Cooperative. Vet Sciences 2021, 9, 14. [Google Scholar] [CrossRef]
- O’Neill L; Rodrigues da Costa M; Leonard FC; Gibbons J; Calderón Díaz JA; McCutcheon G; et al. Quantification, description and international comparison of antimicrobial use on Irish pig farms. Porcine Health Management 2020, 6, 1–14. [Google Scholar]
Figure 1.
Distribution of antibiotic families regarding the quantities of active ingredient consumed during both periods (19 farms).
Figure 1.
Distribution of antibiotic families regarding the quantities of active ingredient consumed during both periods (19 farms).
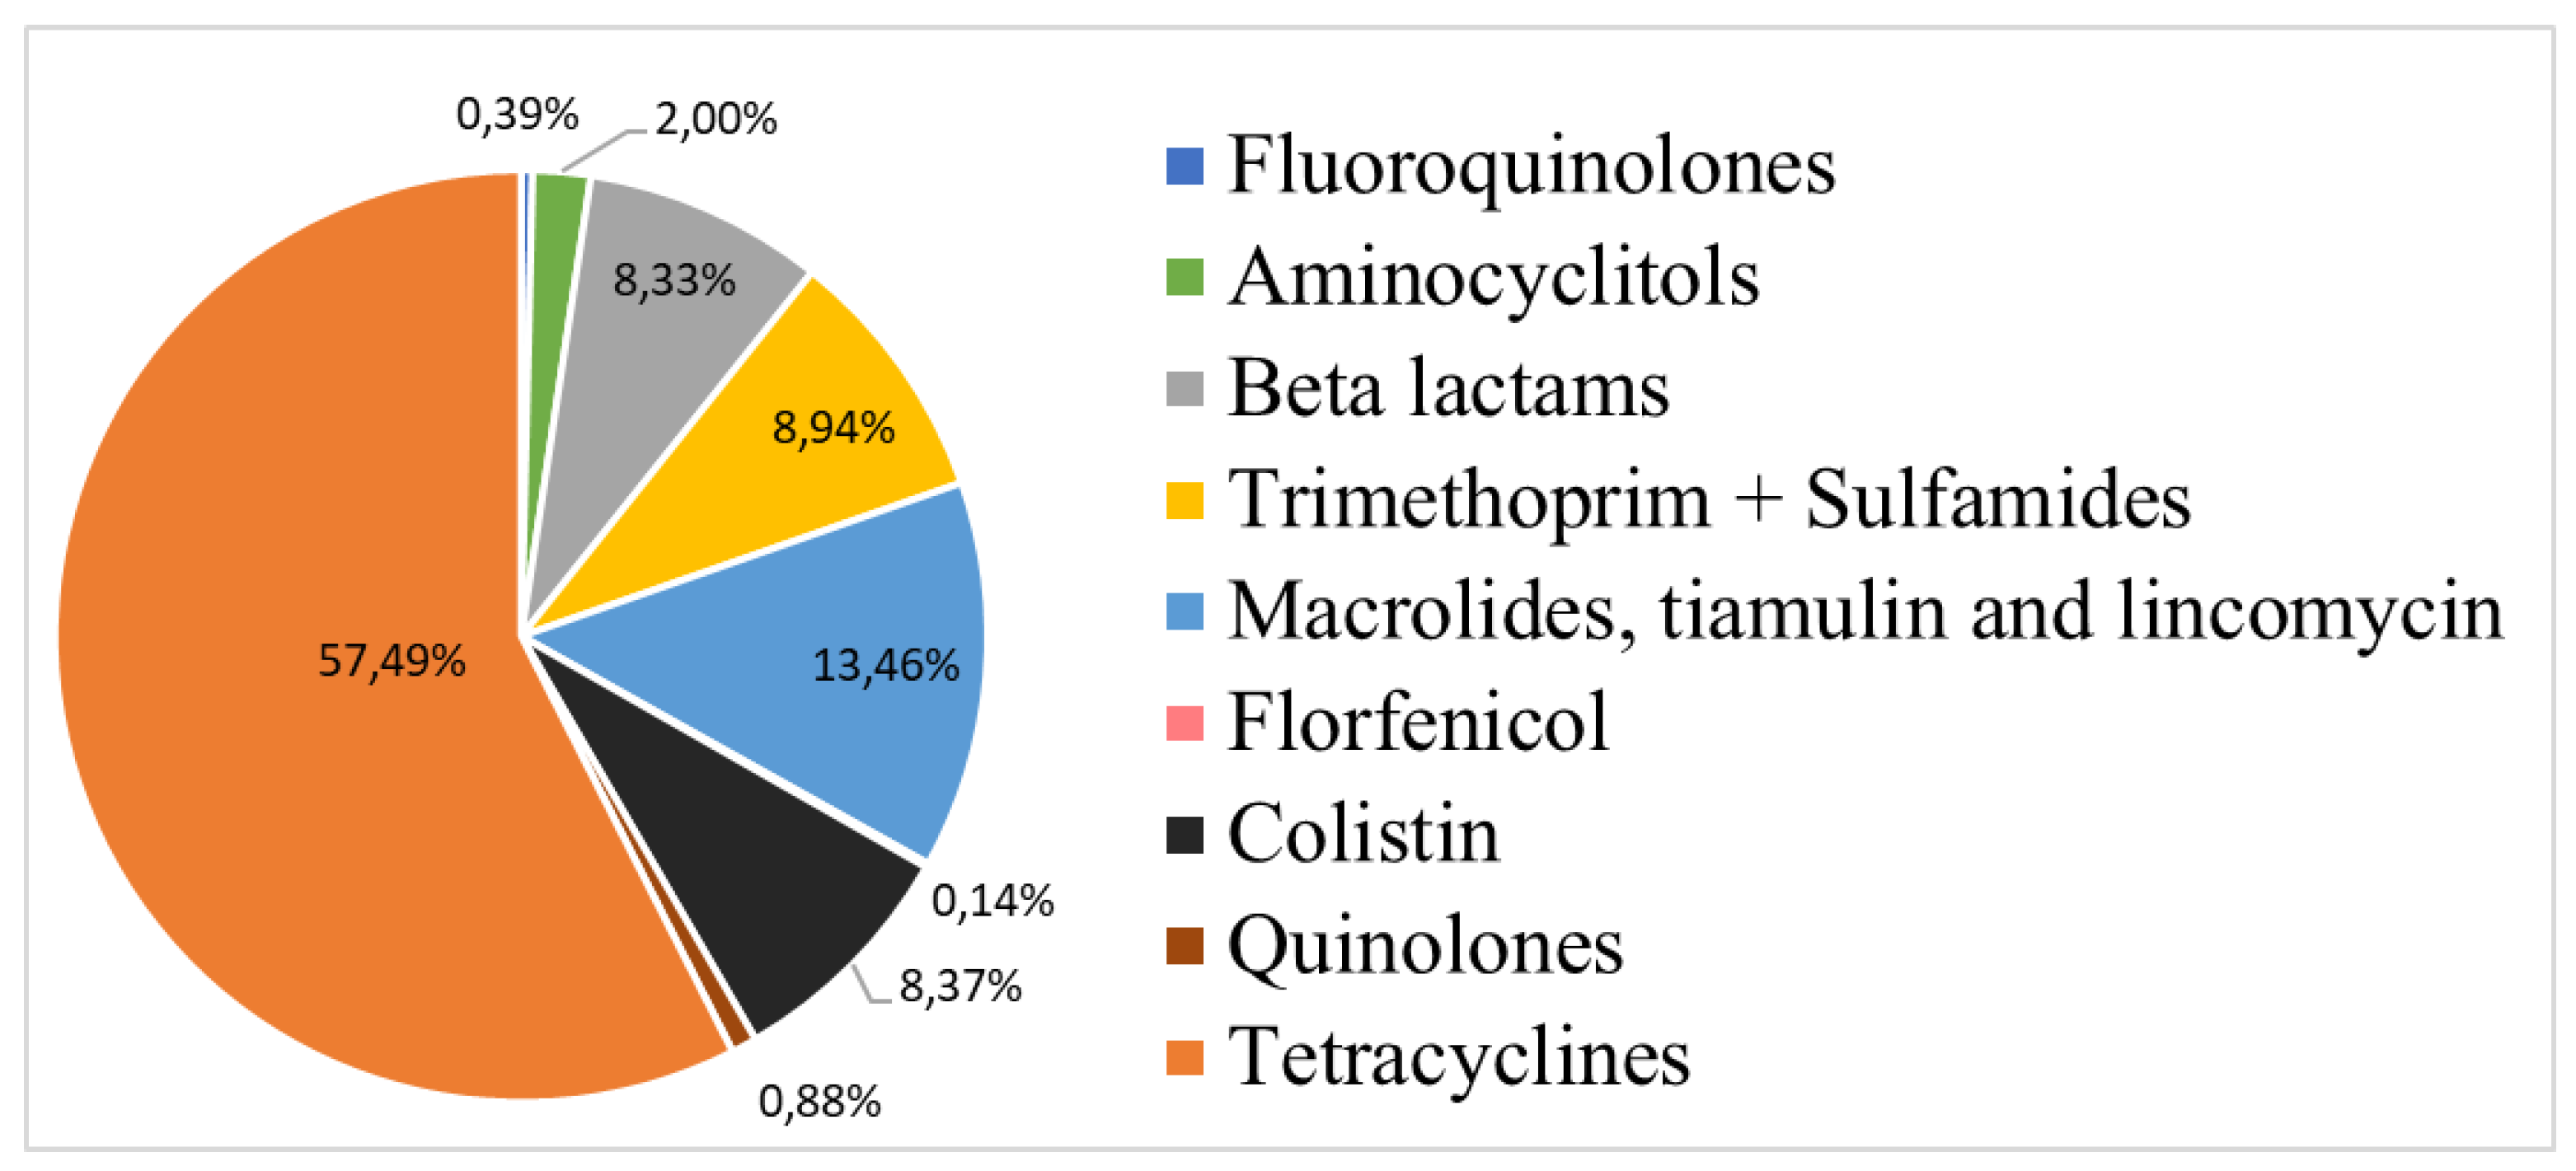
Figure 2.
Overall consumption per farm between P1 and P2 for (a) ALEA and (b) mg/PCU. The bars represent the sum of all treatments implemented during each period.
Figure 2.
Overall consumption per farm between P1 and P2 for (a) ALEA and (b) mg/PCU. The bars represent the sum of all treatments implemented during each period.
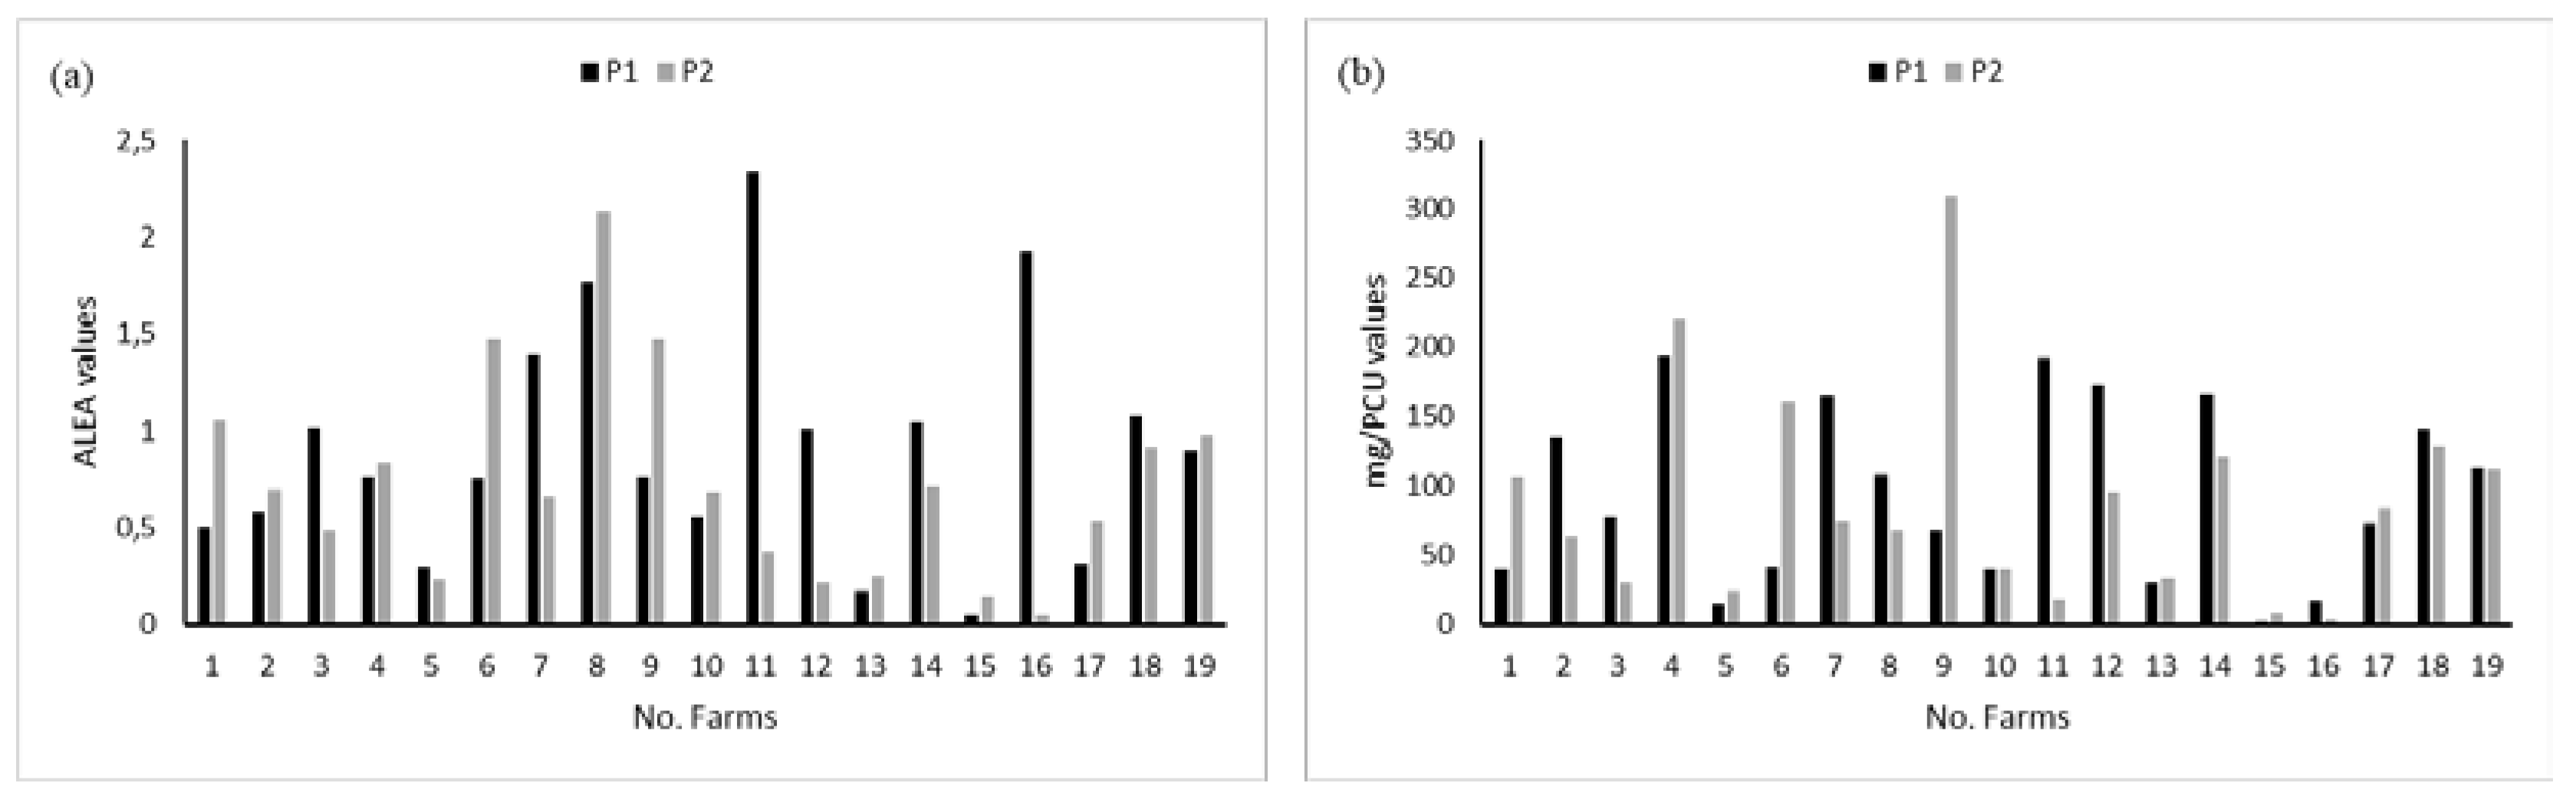
Figure 3.
Comparisons of mean antibiotic consumption between P1 and P2 measured as ALEA (a) and as mg/PCU (b). The bars represent the average value of antibiotic usage obtained from all farms during the two periods. Two datasets for each indicator (ALEA and mg/PCU) were analysed by Kruskal-Wallis test; ‘*’ means p < 0.05 and ‘•’ means p < 0.10.
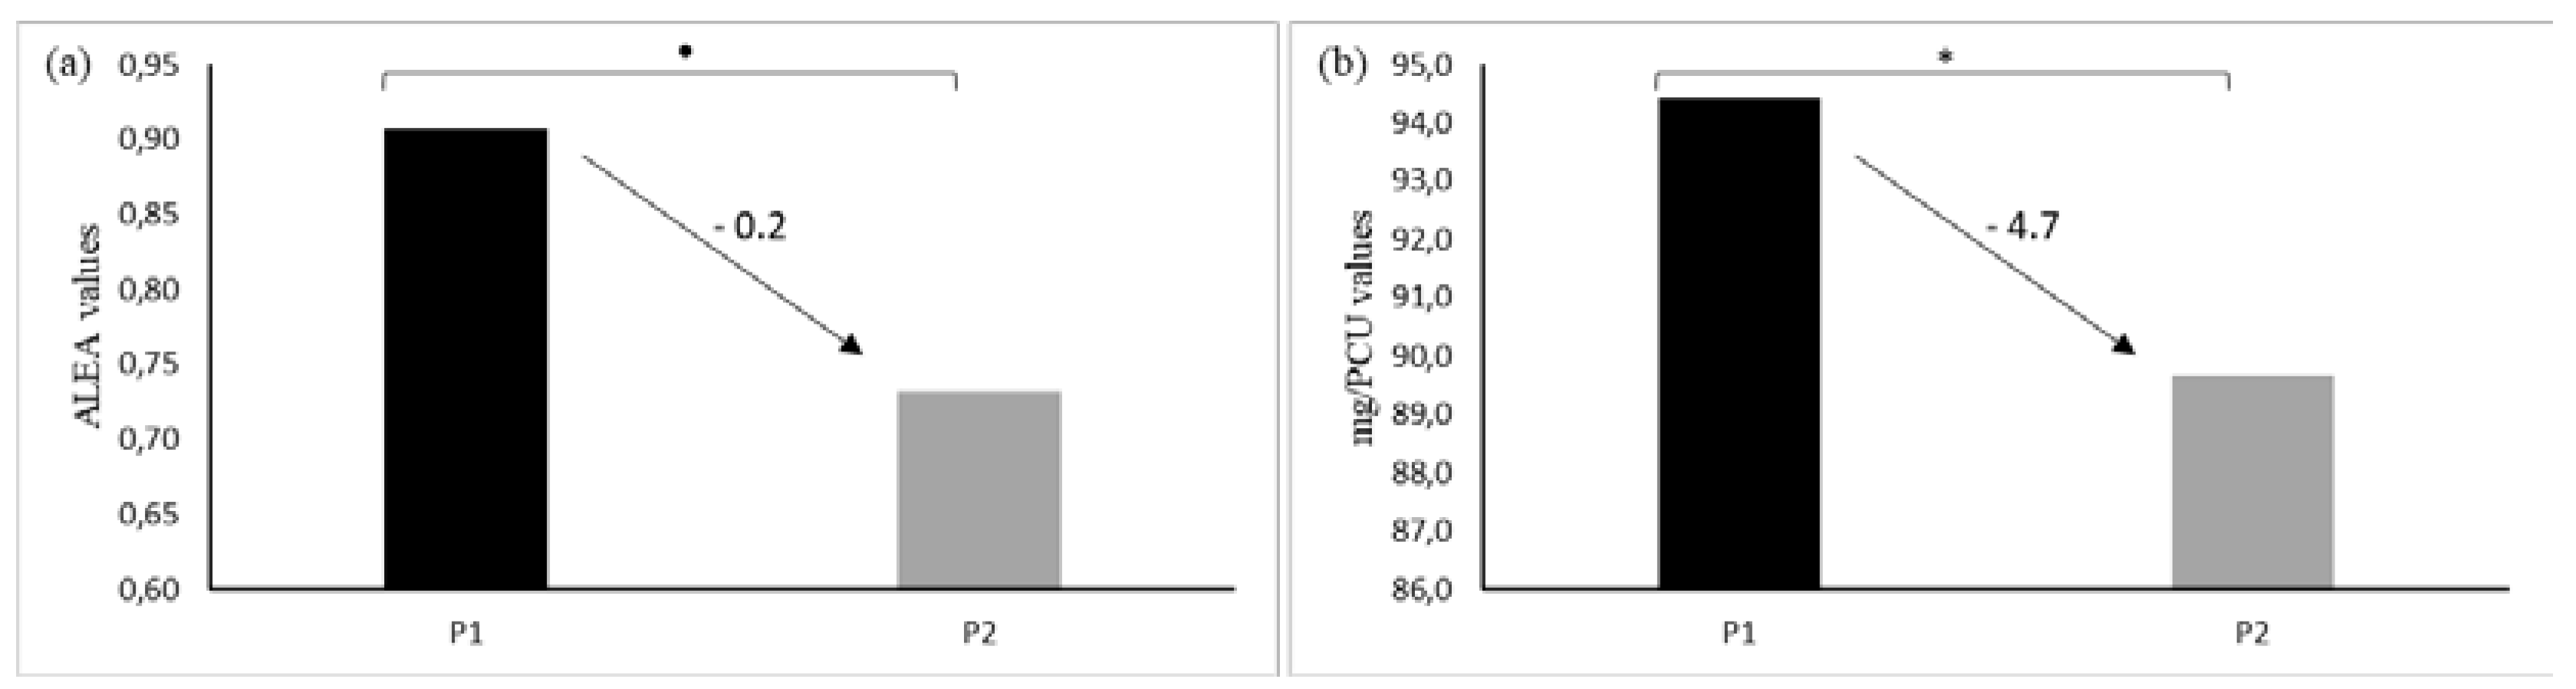
Figure 4.
Distribution of antibiotic usage values using two different indicators: ALEA, a French indicator (a), and the European indicator expressed in mg/PCU (b). Black blocks show antibiotic usage in P1; grey blocks usage in P2. The horizontal line in each block represents the median.
Figure 4.
Distribution of antibiotic usage values using two different indicators: ALEA, a French indicator (a), and the European indicator expressed in mg/PCU (b). Black blocks show antibiotic usage in P1; grey blocks usage in P2. The horizontal line in each block represents the median.
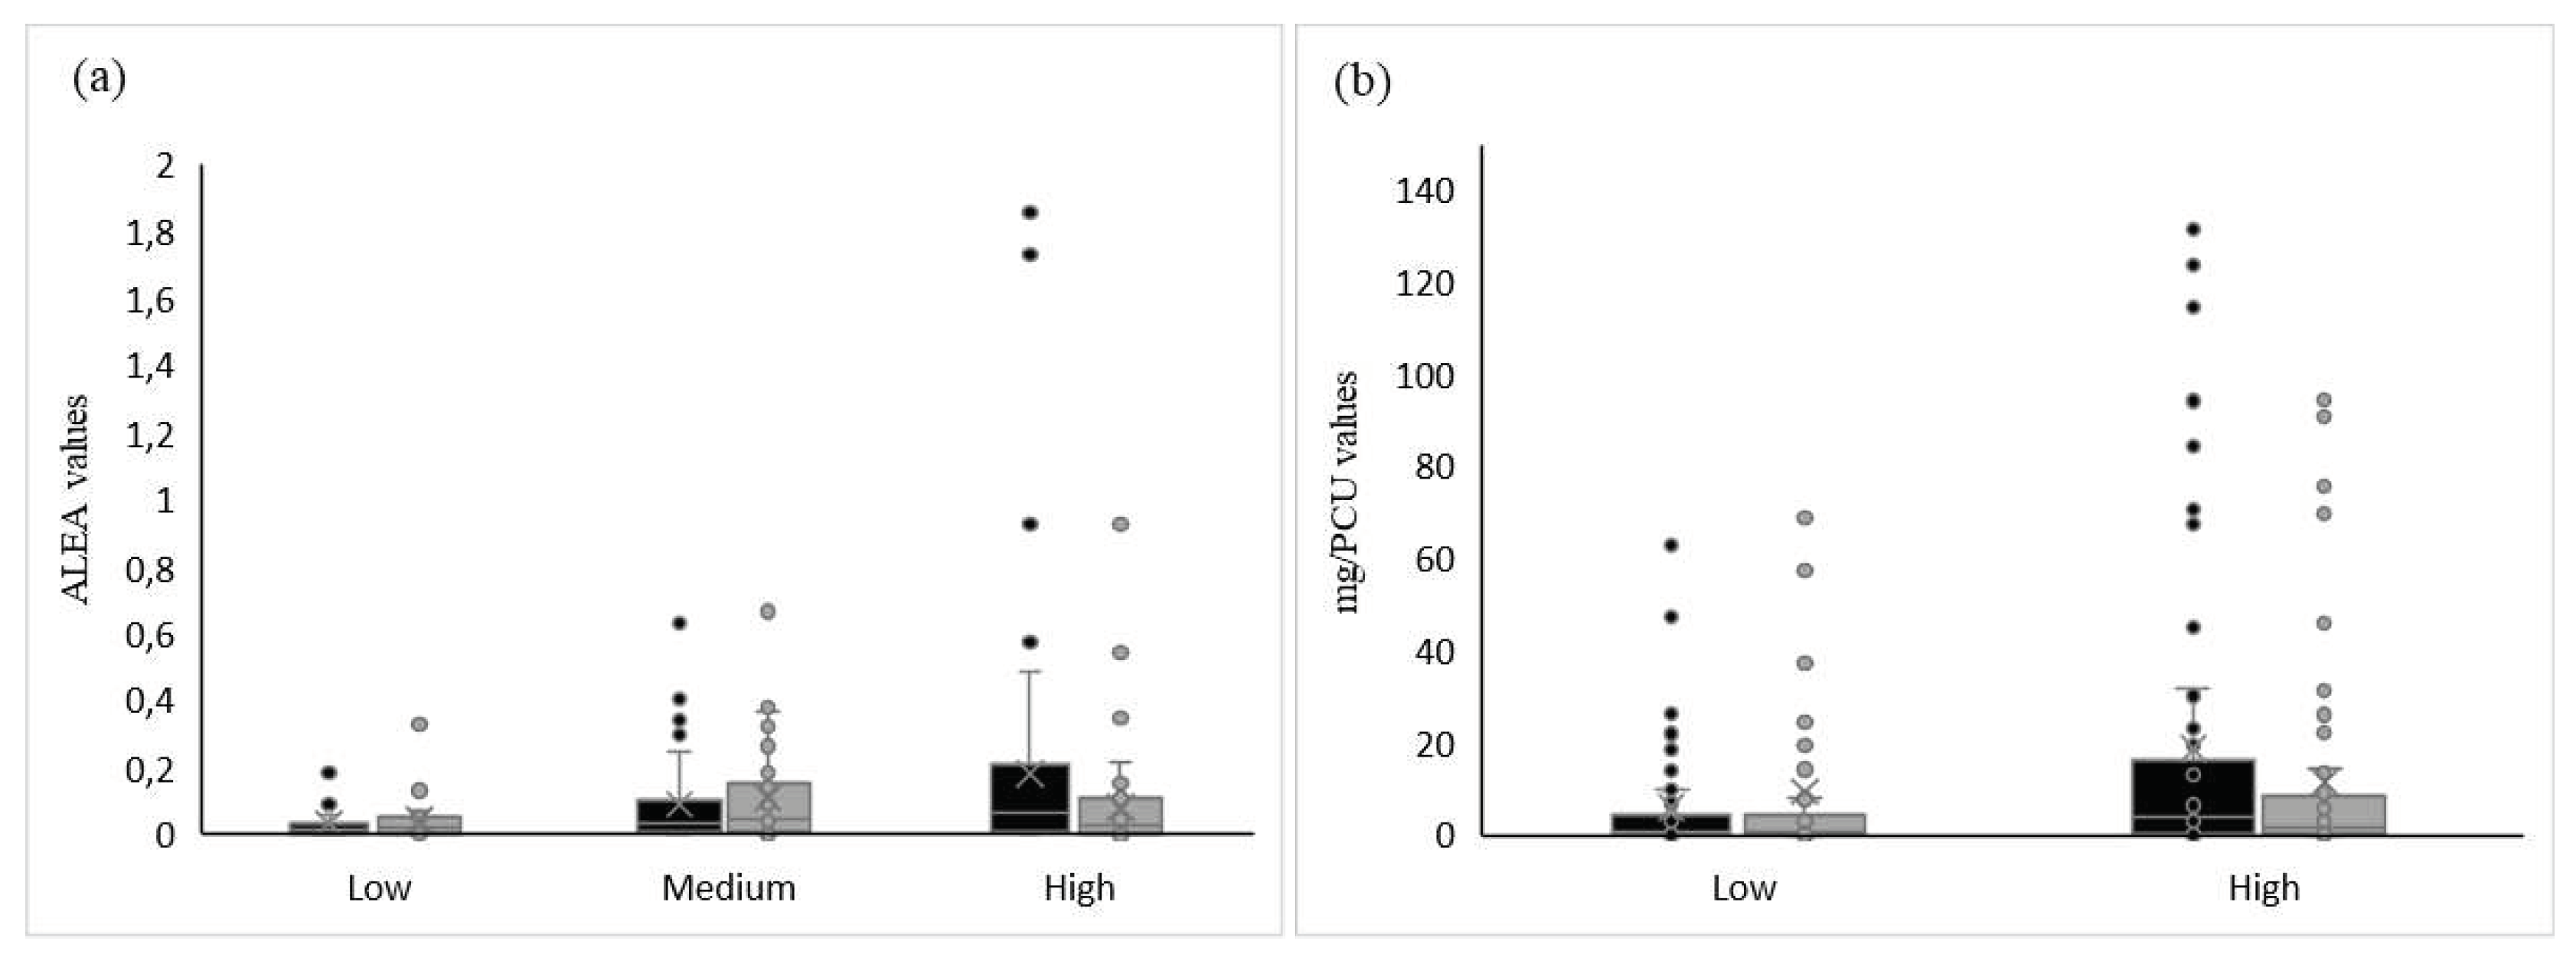
Table 1.
Selected farm characteristics.
| Number of farms | 19 farrow-to-finish farms |
|---|---|
| Average herd size in number of sows [range] | 273 [100-600] |
|
Number of farms per batch management: Three batches Five batches Seven batches Ten batches Twenty batches |
1 1 14 2 1 |
|
Age at weaning: 21 days 28 days |
4 15 |
Table 2.
Quantity of antibiotics administered to animals over both periods per treatment type.
| Average antibiotic usage per treatment | |||||
|---|---|---|---|---|---|
| Absolute quantity | Exposure indicators | ||||
|
Numbers of treatments |
Treatment types | mg | Percent |
ALEA 1 ± SD 3 |
mg/PCU 2 ± SD 3 |
| Period 1 | |||||
| Treatments (n=256) | Individual | 234.6 | 4% | 0.03 ± 0.11 | 0.6 ± 1.2 |
| Collective | 5934.6 | 96% | 0.13 ± 0.19 | 17.7 ± 27.6 | |
| Period 2 | |||||
| Treatments (n=311) | Individual | 167.6 | 3% | 0.02 ± 0.04 | 0.4 ± 0.8 |
| Collective | 4971.7 | 97% | 0.10 ± 0.12 | 13.7 ± 26.5 | |
1 ALEA (Animal Level of Exposure to Antimicrobials), the French indicator, expresses the ratio between the liveweight receiving a treatment course and the total biomass that could have been treated. 2 mg/PCU, defined as the amount of active substance/population correction unit (PCU). 3 SD = Standard Deviation.
Table 3.
Categories used to compare antibiotic reduction consumption levels in P1.
| Indicators | Categories | Number of farms | Limits1 |
|---|---|---|---|
| ALEA | |||
| Low | 4 | < 0.5 | |
| Medium | 8 | 0.5 – 0.9 | |
| High | 7 | > 0.9 | |
| mg/PCU | |||
| Low | 10 | < 100 | |
| High | 9 | ≥ 100 |
Disclaimer/Publisher’s Note: The statements, opinions and data contained in all publications are solely those of the individual author(s) and contributor(s) and not of MDPI and/or the editor(s). MDPI and/or the editor(s) disclaim responsibility for any injury to people or property resulting from any ideas, methods, instructions or products referred to in the content. |
© 2023 by the authors. Licensee MDPI, Basel, Switzerland. This article is an open access article distributed under the terms and conditions of the Creative Commons Attribution (CC BY) license (http://creativecommons.org/licenses/by/4.0/).
Copyright: This open access article is published under a Creative Commons CC BY 4.0 license, which permit the free download, distribution, and reuse, provided that the author and preprint are cited in any reuse.


