Academic and corporate research has been focusing on analyzing stock performances, financial markets, and investment strategies for decades. Lynch and Rothchild (1989) disclosed several simple but profitable long-term (five to 15 years) investment strategies in the book One Up on Wall Street. Accordingly, investors should devote no attention to interest rates and market movements but a company.
A play is a colloquial definition of an investment action and can be used for playing the market, when investors are investing in the markets (Kenton 2021). Lynch, a famous former fund manager at Fidelity Investments, described certain investments as a play (Lynch & Rothchild 1989).
Value stocks (also known as value investing) generally describe an investment strategy in which investors seek undervalued stocks, implying that the intrinsic value is higher than the current market value (Haye 2022). Many studies have investigated the performance of value stocks and concluded that those outperform growth stocks and the market indices on a one-year average (Graham and Dodd 1934; Lakonishok et al. 1994; Bauman et al. 1998; Cheng and Wang 2014). Spin-offs are a form of corporate restructuring. The parent company separates one of its subsidiaries (child), which becomes an independent entity listed on a stock exchange (Navatte and Schier 2017).
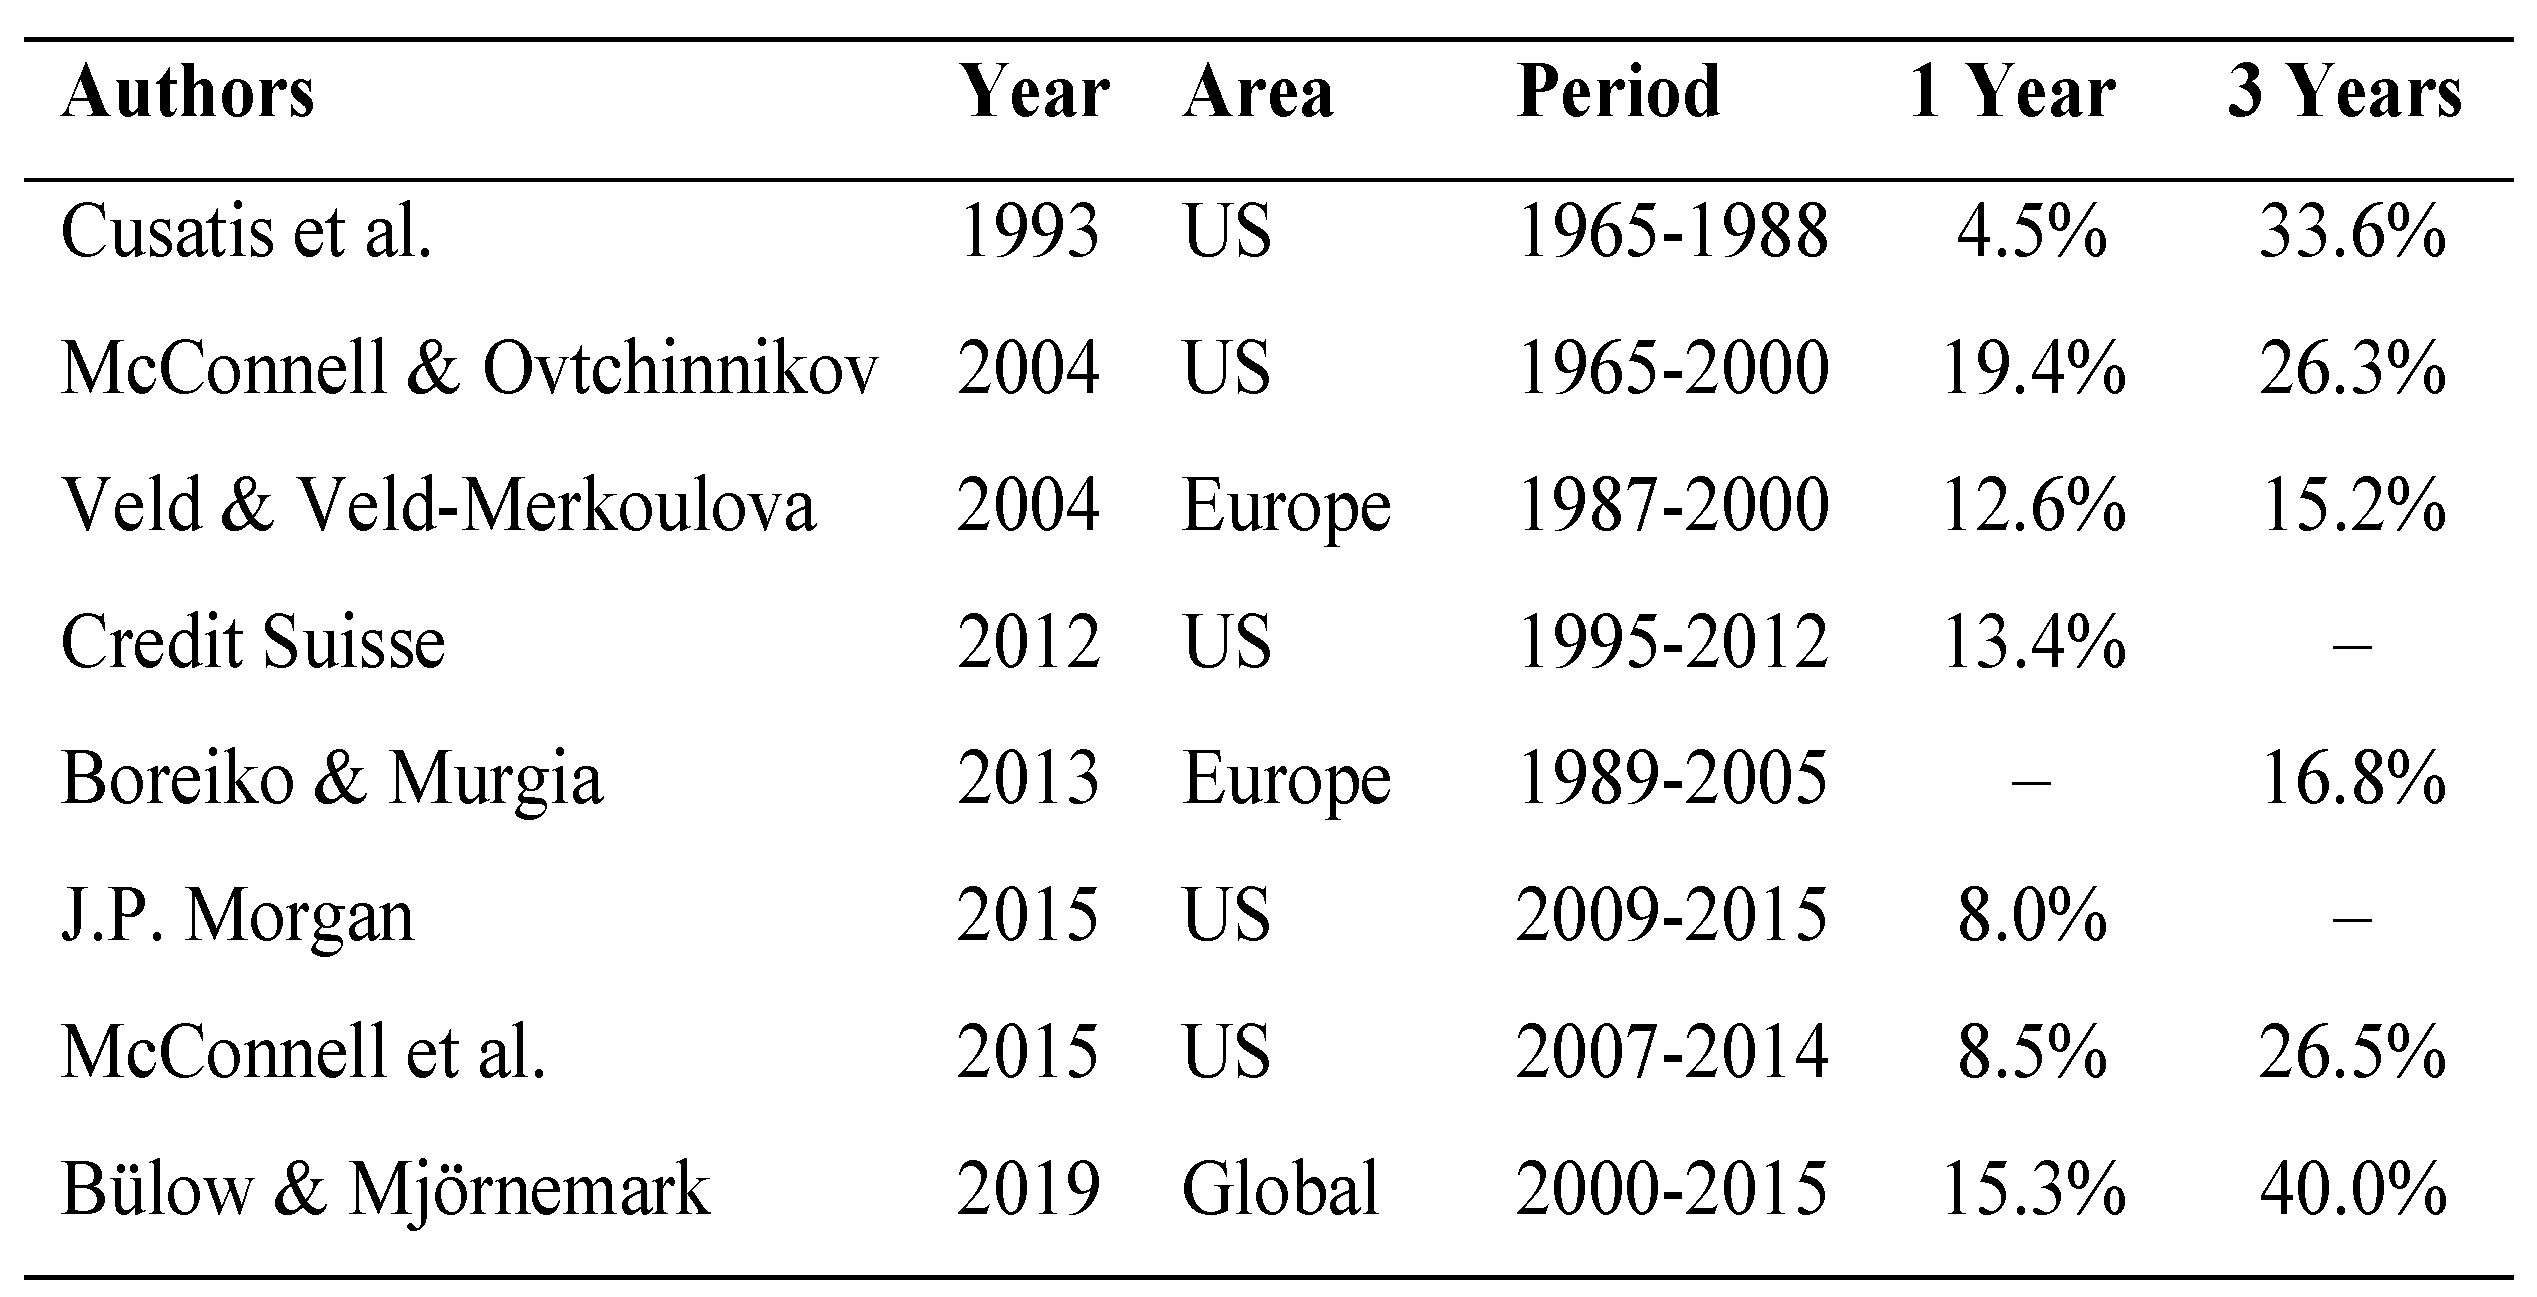
Cusatis et al. (1993) published the first research on the long-term stock performance of spin-offs, concluding that spin-off subsidiaries generate an excess return of 4.5% and 33.6% after one and three years following the initial public offering (IPO). Later studies confirmed significant excess return from spin-off subsidiaries after one and three years (McConnell and Ovtchinnikov 2004; Veld and Veld-Merkoulova 2004; Credit Suisse 2012; J.P. Morgan 2015; McConnell et al. 2015; Bülow and Mjörnemark 2019). McConnell et al. (2015) found that less than half of the spin-off subsidiaries generated a positive excess return after one year. Motivated by that, Bülow and Mjörnemark (2019) successfully distinguished better-performing spin-off subsidiaries from worse through categorizing multiple qualitative and quantitative variables such as analyst coverage, leverage, or enterprise value (EV)/earnings before interest and taxes (EBIT).
Although no official definition regarding turnarounds exists, Majaski (2021) suggests that a turnaround occurs when a company shifts from poor performance to a financial recovery period. Danielson and Dowdell (2001) provided one of the few pieces of research regarding the performance of successful turnaround stocks and concluded that an average excess return of 355% over five years can be obtained with a buy-and-hold strategy. Analyzing the performance of spin-offs has gained popularity in academic and professional research in the last decade. However, studies have only focused on an investment period of up to three years after the spin-off transaction. Many studies have only focused on an investment period of up to three years, and little research has been conducted to investigate the risk-adjusted returns of the three investment plays. Thus, this research extends the investment period and applies the capital asset pricing model (CAPM) for the return calculation.
This article analyzes the long-term stock performance and risk-adjusted excess returns of up five years for value stocks, spin-offs, and turnarounds. The second goal of this research is to distinguish stocks with a superior return performance from worse within an investment play based on the two multiples, P/E and P/B. Hence, a two-step approach was applied. Firstly, this article presents the identified global stocks for each investment play between 2000 and 2019 with an individual screening process and analyzes the average and risk-adjusted excess return based on the CAPM for up to five years. Secondly, this research aims to differentiate better-performing investment plays from worse ones through the independent application of the P/E and P/B ratios. Therefore, eight portfolios will be constructed that distinguish themselves with lower or higher P/E or P/B ratios. Through these portfolios, it is analyzed whether the P/E or P/B ratio impacts the returns of each investment play. Consequently, this article aims to answer the following research questions.
Do value stocks, spin-offs, and turnarounds outperform the S&P 500 index on average and deliver a risk-adjusted excess return on a one-, three- and five-year investment period? What impact does the application of the P/E and P/B ratios have on the return performance of the three investment plays?
1. Theoretical Framework
Fama (1970) reviewed the efficient market hypothesis (EMH), which asserts that a company’s stock price reflects all relevant information and new information is unpredictable.
Jensen (1978) shared the view of Fama (1970) that it is not possible to make an economic profit out of trading information. According to Bodie et al. (2017), stock prices should follow a random walk and are unpredictable, which was discovered by Kendall and Hill (1953). Accordingly, movements on a stock exchange shows little serial correlation over time.
Due to the increasing number of financial economists who have questioned the EMH, Malkiel (2005) reviewed his earlier study (Malkiel 1973) and argued that if financial markets were predictable, actively managed investment funds would outperform a passive index fund. The results showed that this was not the case, and large market prices reflect all available information.
Banz (1981) investigated the relationship between return performance and firm size based on the total equity value outstanding of companies listed on the New York Stock Exchange (NYSE). Thereafter, a portfolio including stocks with a smaller market cap outperformed a portfolio with only larger market cap companies by 8% and delivered higher risk-adjusted returns. These findings are known as the small-size effect. The EMH seems to be technically incorrect, yet it is profoundly accurate in theory. Science constantly seeks a better hypothesis Therefore, the EMH is valid if there is no evidence for a better explanation (Sewel 2011).
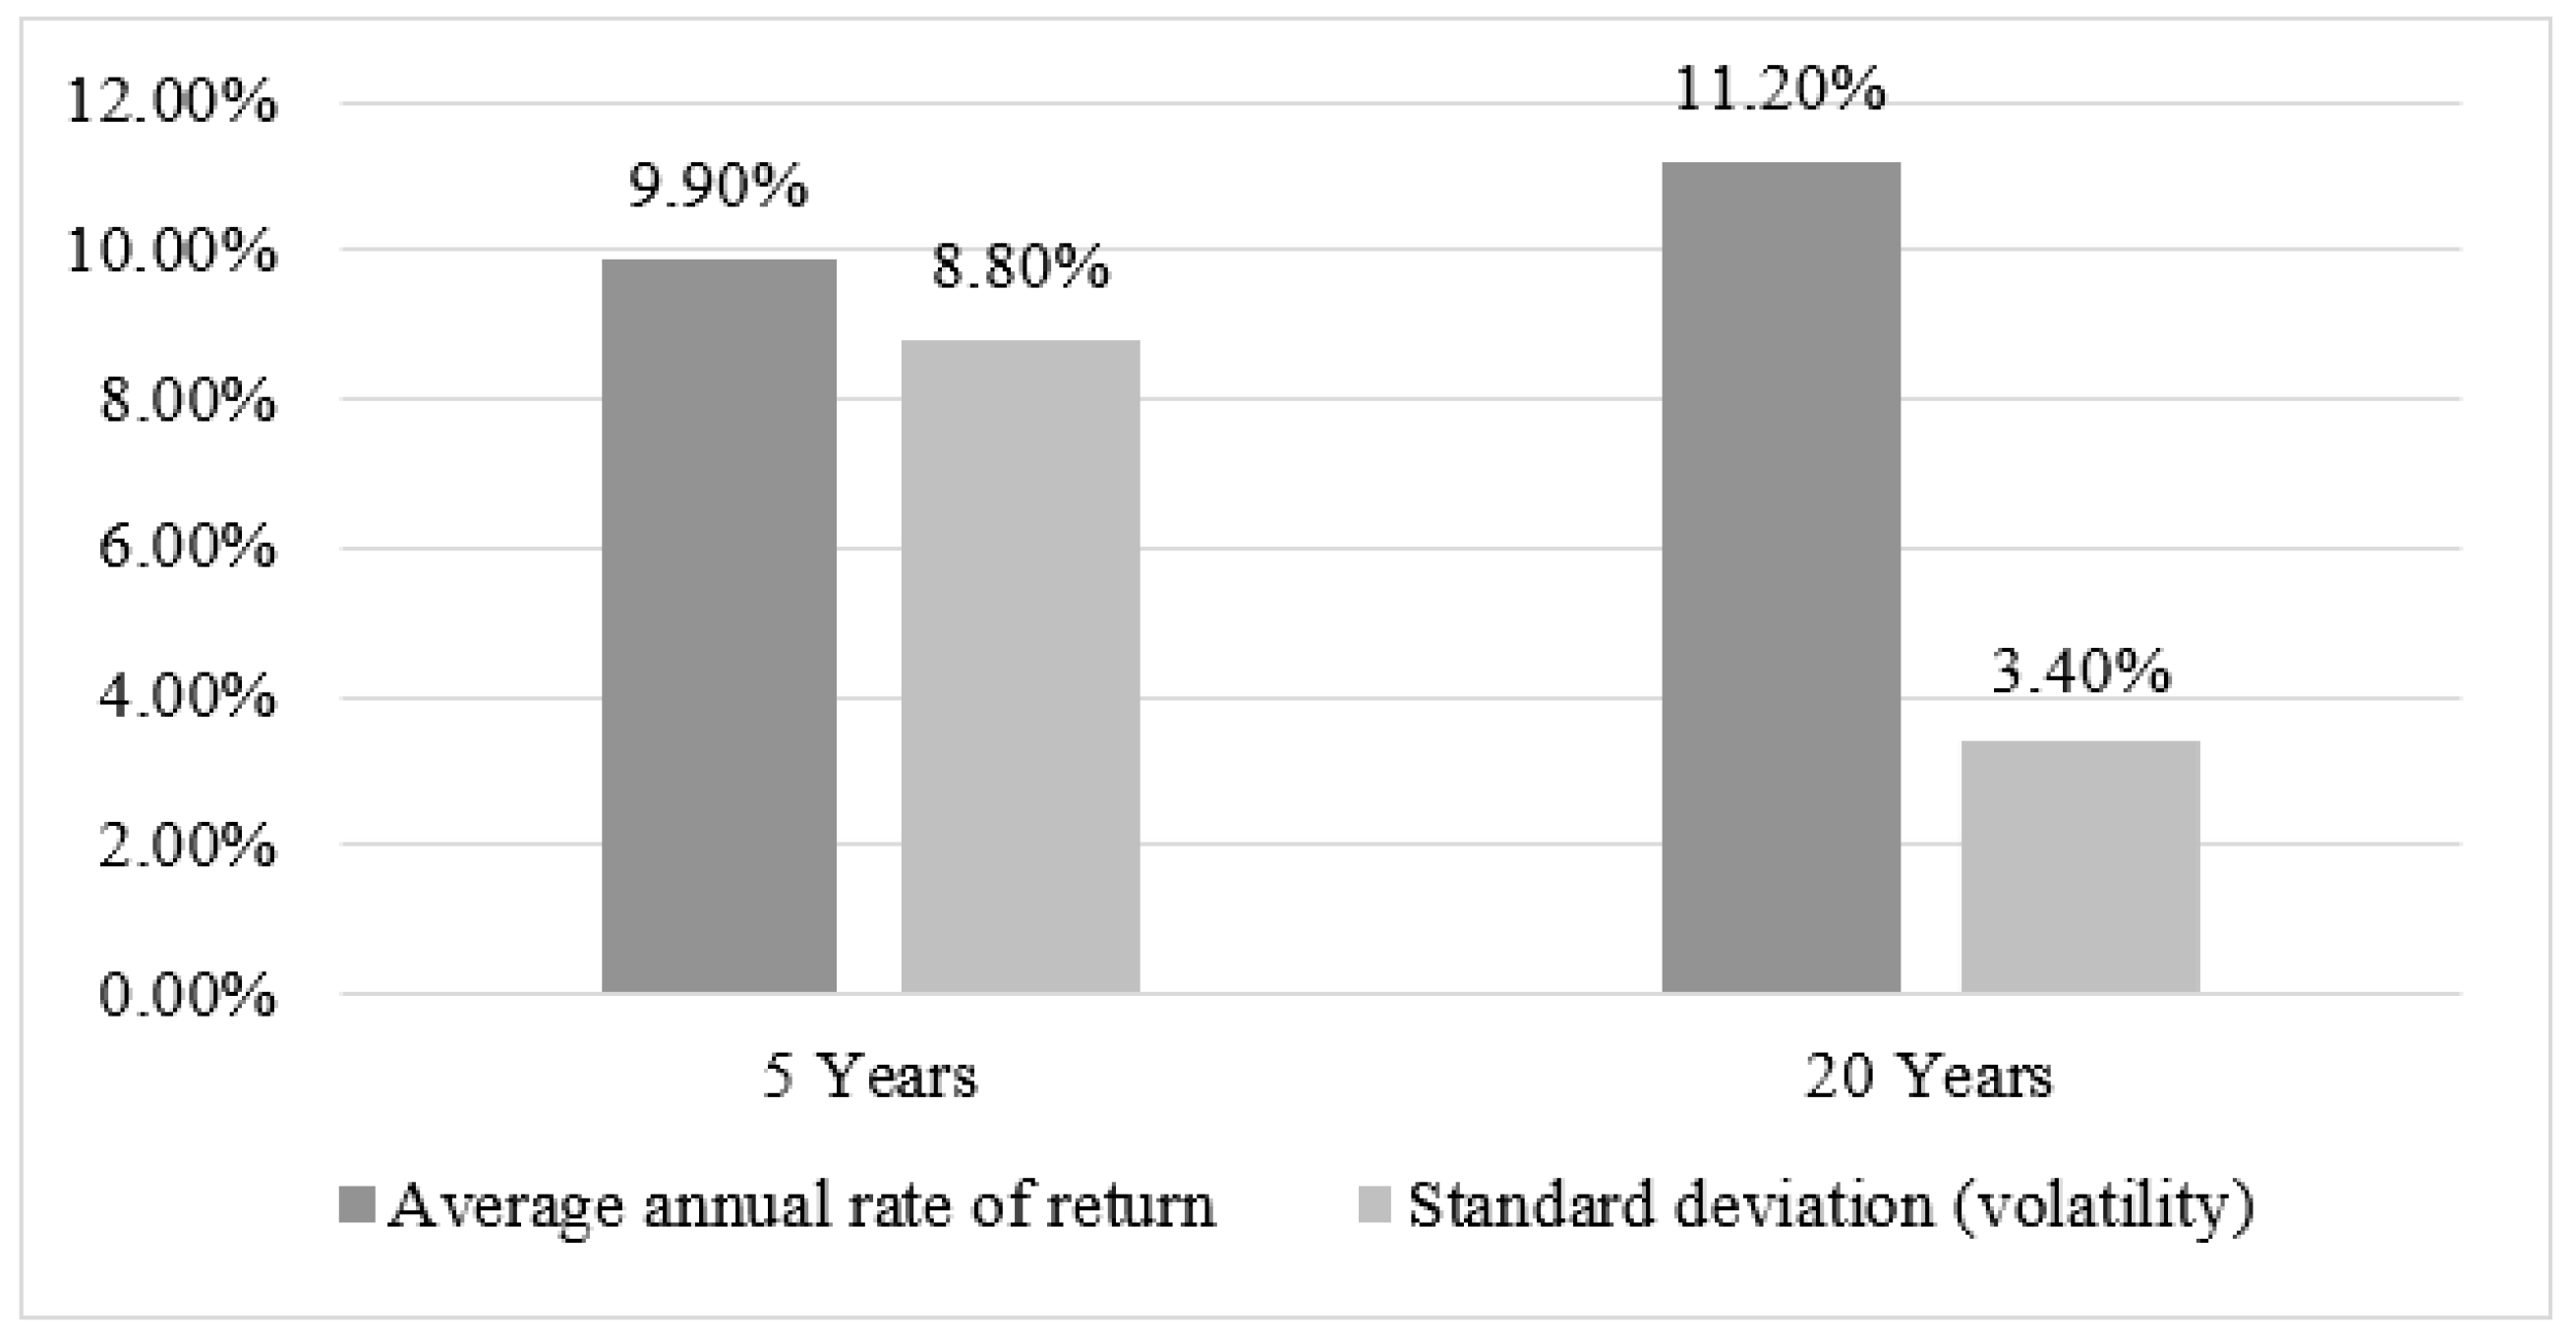
Figure 1 shows the historical average annualized returns and risk of the S&P 500 equity index over a five- and 20-year period. The index showed an average return of 9.9% and a standard deviation of 8.8% over five years. With an extended period of 20 years, equities’ average annualized returns increased to 11.2%, whereas the average standard deviation dropped to 3.4%.
Intuitively, it seems that it might be possible to reject the EMH over a shorter time, such as five years, since the standard deviation is significantly higher than over 20 years. This would explain why market anomalies might exist over the short term. However, over 20 years, the average volatility of equities was significantly reduced, making it rather difficult to challenge the EMH.
The price/earnings (P/E) ratio constitutes a common valuation multiple for comparing equities selling at different price levels (UBS 2022). The P/E ratio is calculated by dividing the current market price of a stock by its projected twelve-month earnings per share. The alternative calculation is the market capitalization divided by expected net earnings in the next 12 months. Bodie et al. (2017) defined the P/E ratio with the following equation:
P0 = current stock value (achieved with dividend discount model) D1/(k − g)
= capitalization rate
g = growth rate
E1 = projected earnings in the following twelve months
PVGO = present value of growth opportunities
The price-to-book (P/B) ratio represents, besides the P/E ratio, one of the most widely used valuation multiples (Bodie et al. 2017). The P/B ratio is obtained by dividing the firm’s market capitalization by its book value listed on the balance sheet (UBS 2022). Earlier studies often applied the book-to-market (B/M) ratio, which is the reciprocal of the P/B ratio. Following the formula for the P/B ratio:
The capital asset pricing model (CAPM) was introduced and developed by Treynor (1961), Sharpe (1964), Lintner (1965), and Mossin (1966) based on earlier research from Markowitz (1959). The CAPM constitutes one of the most widely used asset pricing models in the financial literature and education (Fama and French, 2004). Accordingly, the CAPM predicts the relationship between risk and the expected return of a security or portfolio. The model enables the calculation of the expected return of a single asset or portfolio based on the risk-factor beta.
𝐸(𝑅𝑝) = expected return of portfolio p
𝑅𝑓 = risk-free rate
𝑅𝑚 = return of a market portfolio/index
𝛽𝑝 = beta coefficient of portfolio p
The expected return is frequently associated with the required return from investors, as every return below the expected return from the CAPM would not satisfy the investor’s requirements based on the risks. Numerous pivotal finance-related studies have covered performance measures with the CAPM (see Treynor, 1965; Jensen, 1968; Sharpe, 1994; Modigliani and Modigliani, 1997). According to the CAPM formula, the excepted return for an asset is calculated as follows: The CAPM formula advocates that the expected return of a single asset or portfolio p is equal to the risk-free rate, an US treasury bill, plus an asset’s beta (𝛽) times the market risk premium [𝑅𝑚 − 𝑅𝑓]. Through beta, the CAPM includes a risk factor, which is calculated by the covariance between the market portfolio and the asset, divided by the variance of the market portfolio. As a result, beta accounts for the asset’s systematic risk, which only includes the uncertainties of a market or a whole economy, but not idiosyncratic (individual company) risk (Bodie et al. 2017).
Jensen’s alpha is a risk-adjusted performance metric based on the CAPM that measures whether the actual performance of an asset or portfolio differed from the expected return. Jensen (1968) tested whether an investment in mutual funds over 20 years can lead to a superior return than the expected return from the CAPM. Even though the investment did not show an outperformance, Jensen’s alpha turned into a standardized measurement of abnormal returns. A positive alpha asserts that an investment outperformed the expected (required) return. Therefore, investors achieve a risk-adjusted excess return. On the opposite, if the alpha is negative, an asset or portfolio underperformed with the risk taken. According to Hübner (2005), the alpha should not be statistically different from zero if the CAPM holds and markets are efficient. Jensen’s alpha can be derived from the following equation:
If
𝛼𝑝 > 0, the asset/portfolio outperformed the expected return of the CAPM benchmark
𝛼𝑝 < 0, the asset/portfolio underperformed the expected return of the CAPM benchmark
The Treynor ratio introduced by Treynor (1965) provides a performance metric to measure the generated excess return by each unit of systematic risk taken of a portfolio. Therefore, it is also known as the reward-to-volatility ratio. A high Treynor ratio implies that a portfolio obtained more excess return with the systematic risk taken, measured by the beta coefficient. Following the formula:
Where
𝑅𝑝 = actual return of portfolio p
𝑅𝑓 = risk-free rate
𝛽𝑝 = beta coefficient of portfolio p
1.1. Value Stocks
Value investing generally refers to an investment strategy in which investors seek stocks trading at a discount to their intrinsic or book value and benefit from an undervaluation. To find value stocks, investors utilize a variety of indicators to determine a stock’s intrinsic value. Thereby, investors often apply metrics such as P/B, P/E, free cash flow, operating expenses, dividends, and share buybacks. Although there is no official definition of value stocks, equities with low P/E or P/B ratios are often associated with value stocks. However, even though these multiples are often included in the identification process, stocks with a low P/E and P/B do not simply constitute a value stock.
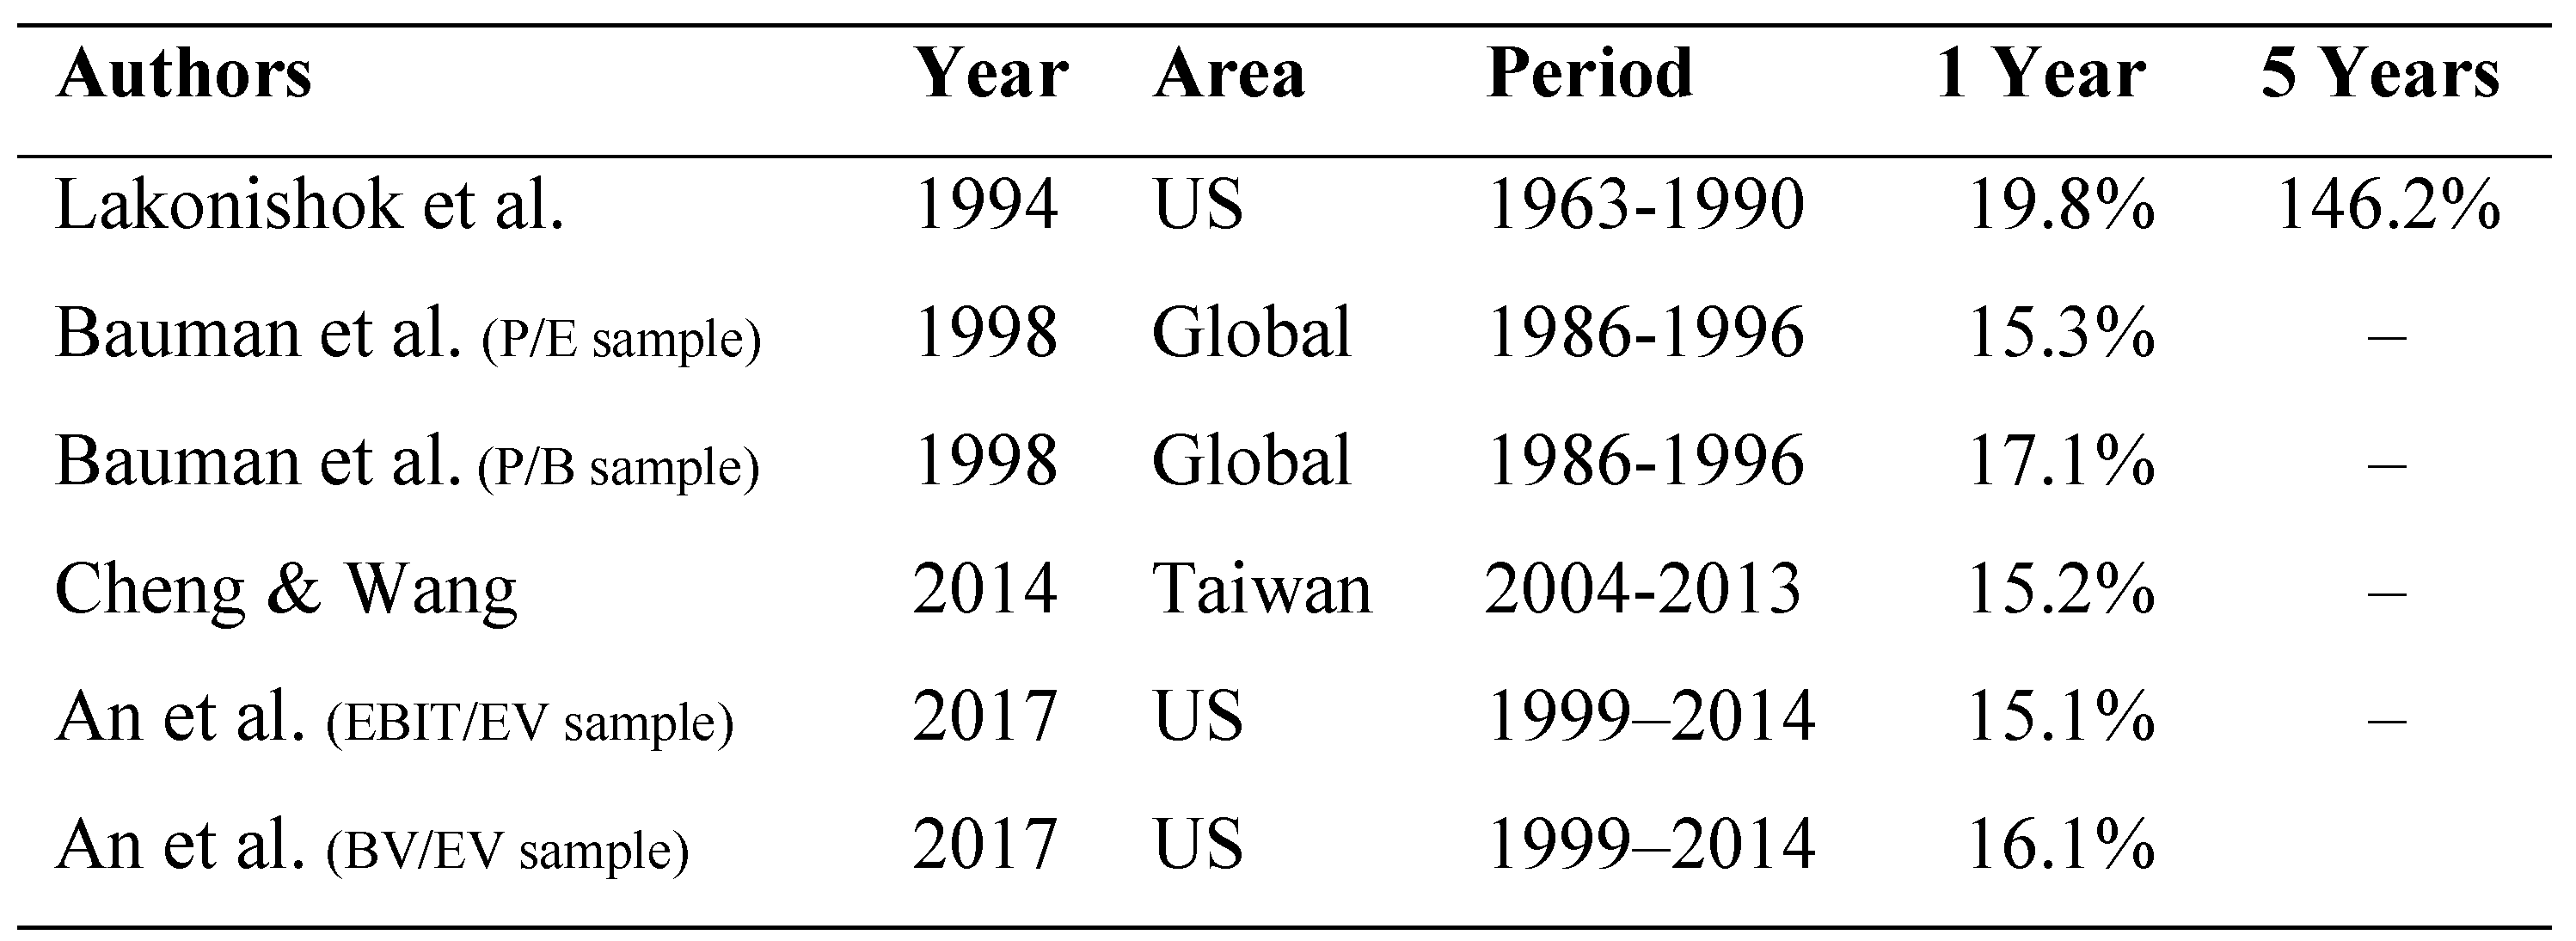
Lakonishok et al. (1994) divided stocks into deciles according to the B/M ratio, cash flow to market value, P/E ratio, and five-year growth rate of sales and found that those stocks provide a better return than glamorous stocks. He found similar results with the ratios P/E and cash-flow-to-price that value stocks outperform growth stocks. These findings confirmed other studies that value stocks provide a superior return compared to growth stocks (Chan et al. 1991; Fama and French 1992; Bauman et al. 1998). According to Bauman et al. (1998), value stocks with the highest P/E ratio performed an average return of 15.3% and the value stocks with the lowest P/B ratio of 17.1%. In contrast, growth stocks delivered an average annual return of 12.4% and 13.4%, respectively (Baumann et al. 1998). An et al. (2017) applied a different approach and defined value stocks with an EBIT/EV and book value (BV)/EV of 75 or above. According to An et al. (2017), EBIT/EV delivers an advantage, even though this metric was not often applied in academic research. EBIT removes the effect of changing interest and tax rates.
Table 1 provides an overview of earlier research regarding the long-term returns of value stocks.
According to Cheng and Wang (2014), a portfolio with high scores regarding the nine financial variables delivered an average one-year return of 15.2%. The value stock portfolio significantly outperformed the Taiwan capitalization-weighted stock index, yielding an average annualized return of 3.6%.
1.2. Spin-offs
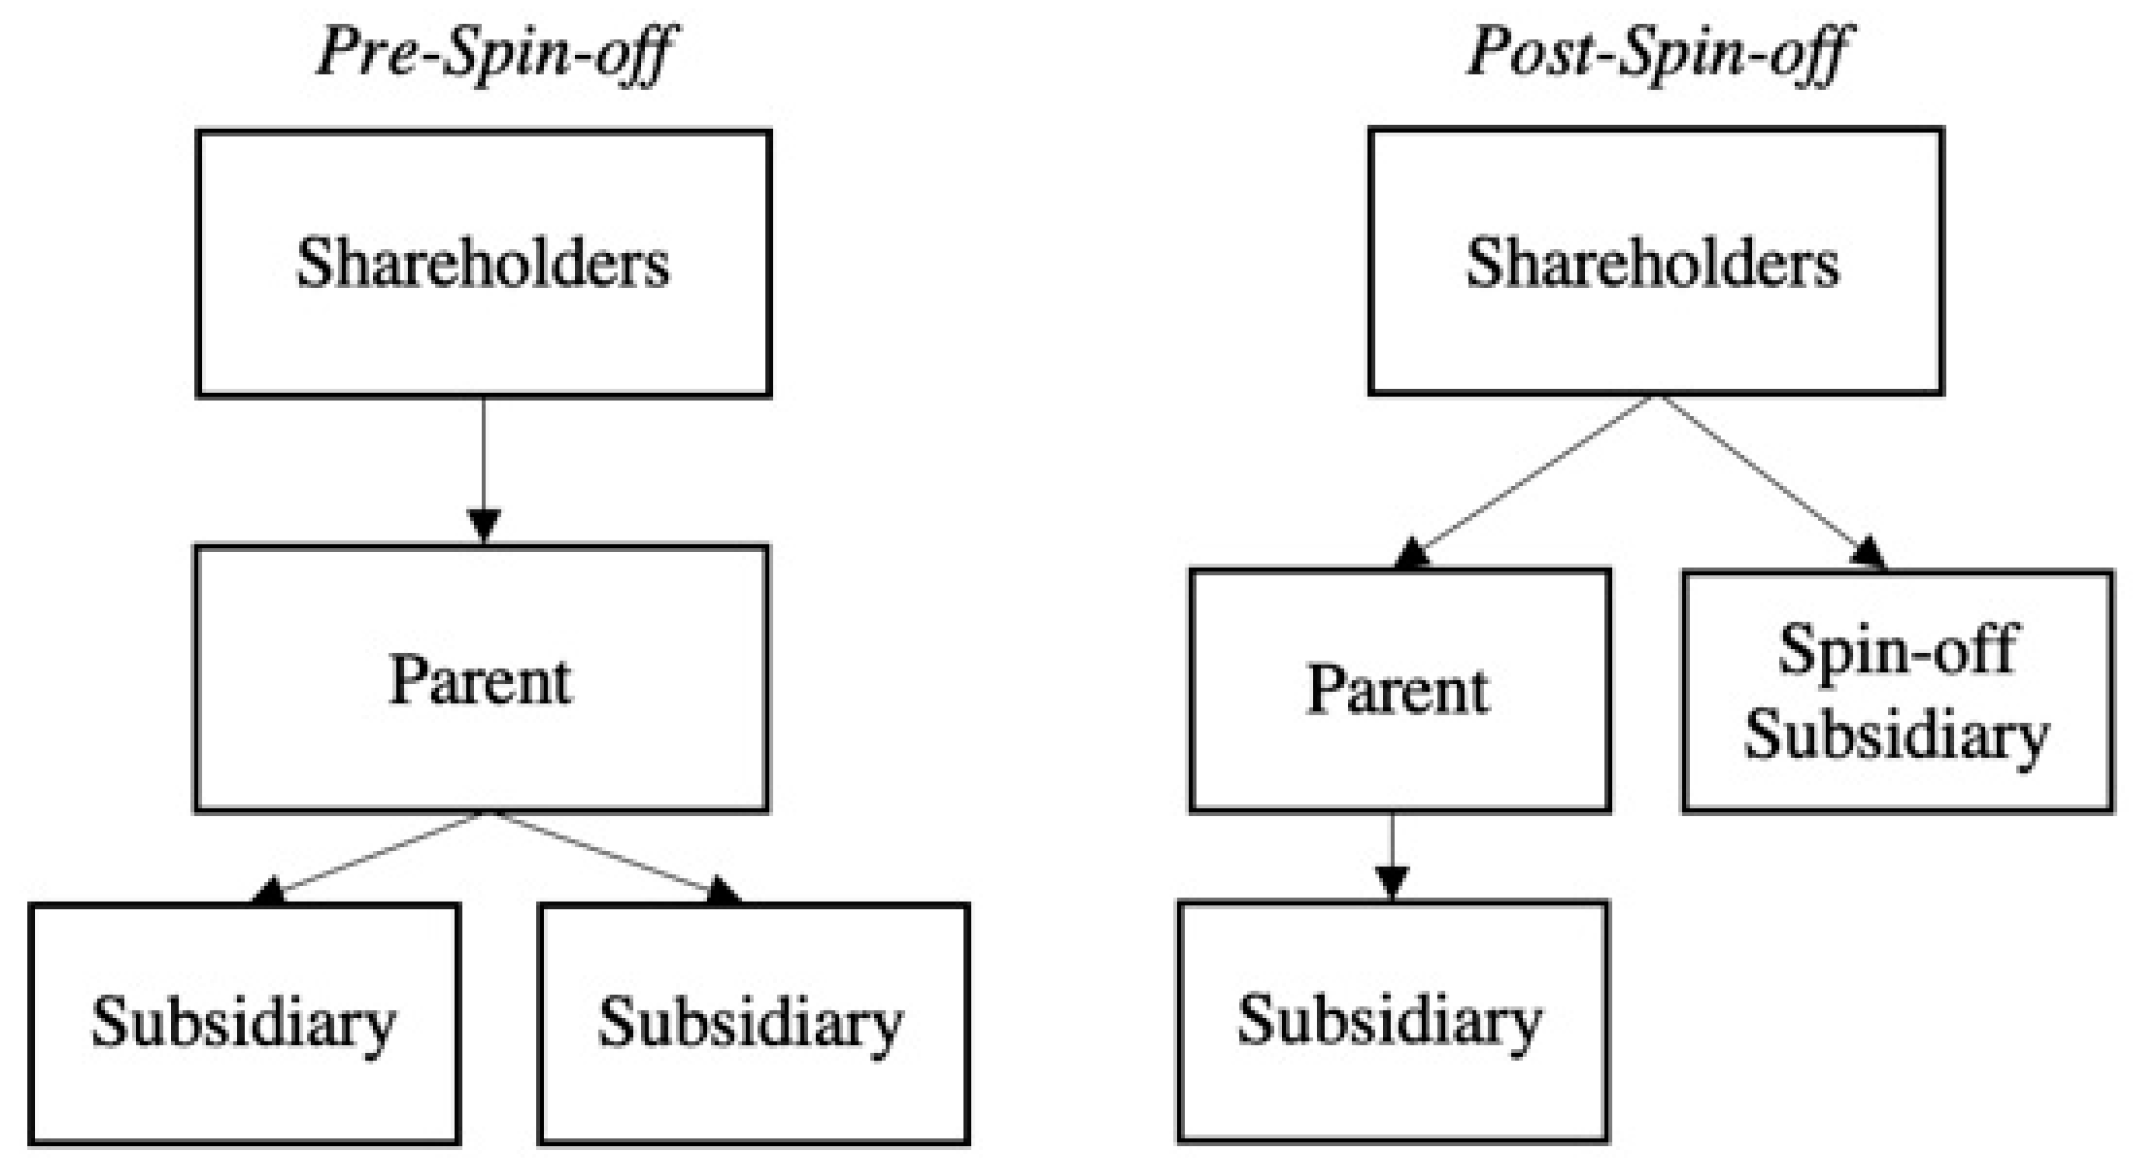
According to J.P. Morgan (2015), the number of announced spin-offs (excluding Reverse Morris Transactions and canceled spin-offs) by S&P 500 companies has rebounded in 2015 to an all-time high since the financial crisis in 2009. A spin-off is a possible form of corporate restructuring. The parent company separates one of its subsidiaries, which becomes an independent entity listed on a stock exchange (Navatte and Schier 2017).
Shareholders of the pre-spin-off parent company remain owners of both entities (parent and spin-off) and the stocks are distributed pro-rata of the parent company and divested spin-off subsidiary (Bülow and Mjörnemark 2019).
Figure 2 provides an overview of the corporate structure before and after a spin-off transaction.
According to Tübke (2004), there are three different typologies of spin-off processes. Firstly, the entrepreneurial spin-off process is characterized by a large parent corporation, which experienced a high operating efficiency and a substantial R&D budget. Secondly, restructuring-driven spin-offs are created at the request of the parent company in order to increase cash flow and assist its strategic restructuring efforts. Finally, the third spin-off process is a mixture of both. Various scholars have investigated the rationale of value creation for the parent company to spin off a subsidiary, such as the decreasing information asymmetry by increasing efficiency and transparency (Krishnaswami and Subramaniam 1999; Bergh et al. 2008). On the other hand, the increased strategic focus by allowing the parent to focus on the core product and competencies is mentioned (Tübke, 2004) along with a more accurate valuation of the parent company (Ammann et al. 2012). A further rationale is the tax treatment, as a spin-off transaction does not have any tax consequences for the divesting parent company (Veld and Veld-Merkoulova 2009).
Following a large majority of scientific and corporate research, stocks of spin-off subsidiaries provide a positive excess return in the long run.
Table 2 summarizes the long-term return performance of spin-off entities and provides rather conclusive evidence that spin-off subsidiaries strongly outperform the market benchmark.
1.3. Turnarounds
Majaski (2021) defines a turnaround as when a corporation that had a period of poor performance transitions to a time of financial recovery. Thereafter, turnarounds are notable due to the indication of a company’s upward movement or progress following a period of negative financial results. A turnaround is similar to a reorganization in which a company transforms a period of loss into one of profitability and success while maintaining its long-term stability. Some common characteristics of turnaround firms are management changes, business strategy adjustments, managing cash flows by cutting costs and divesting assets, and stock undervaluation (Kotak Securities 2022). Accordingly, turnaround stocks are frequently undervalued, with low P/E and P/B ratios, as the market participants assess the firms with a lower value.
Table 3 summarizes earlier research on the long-term excess return of turnaround stocks compared to the market benchmark. In contrast to value stocks and spin-offs, only a few papers regarding the excess return of a turnaround stock exist. There is a consensus that successful turnarounds deliver an excess return. However, the extent of excess return varies significantly among earlier studies.
2. Results
Each investment play contained the highest sample from the US (32.5% of all value stocks, 56.5% of all spin-offs, and 23.7% of all turnarounds). There are possible explanations why the most stocks came from the US in each investment play. Firstly, through the NYSE and National Association of Securities Dealers Automated Quotations (NASDAQ), the US provides the largest stock exchange operators by the market capitalization of the listed corporations (Statista 2022). Secondly, the US possesses high accounting standards and disclosure requirements. Therefore, the chances that Refinitiv included all relevant information were higher and fewer stocks had to be removed from the sample.
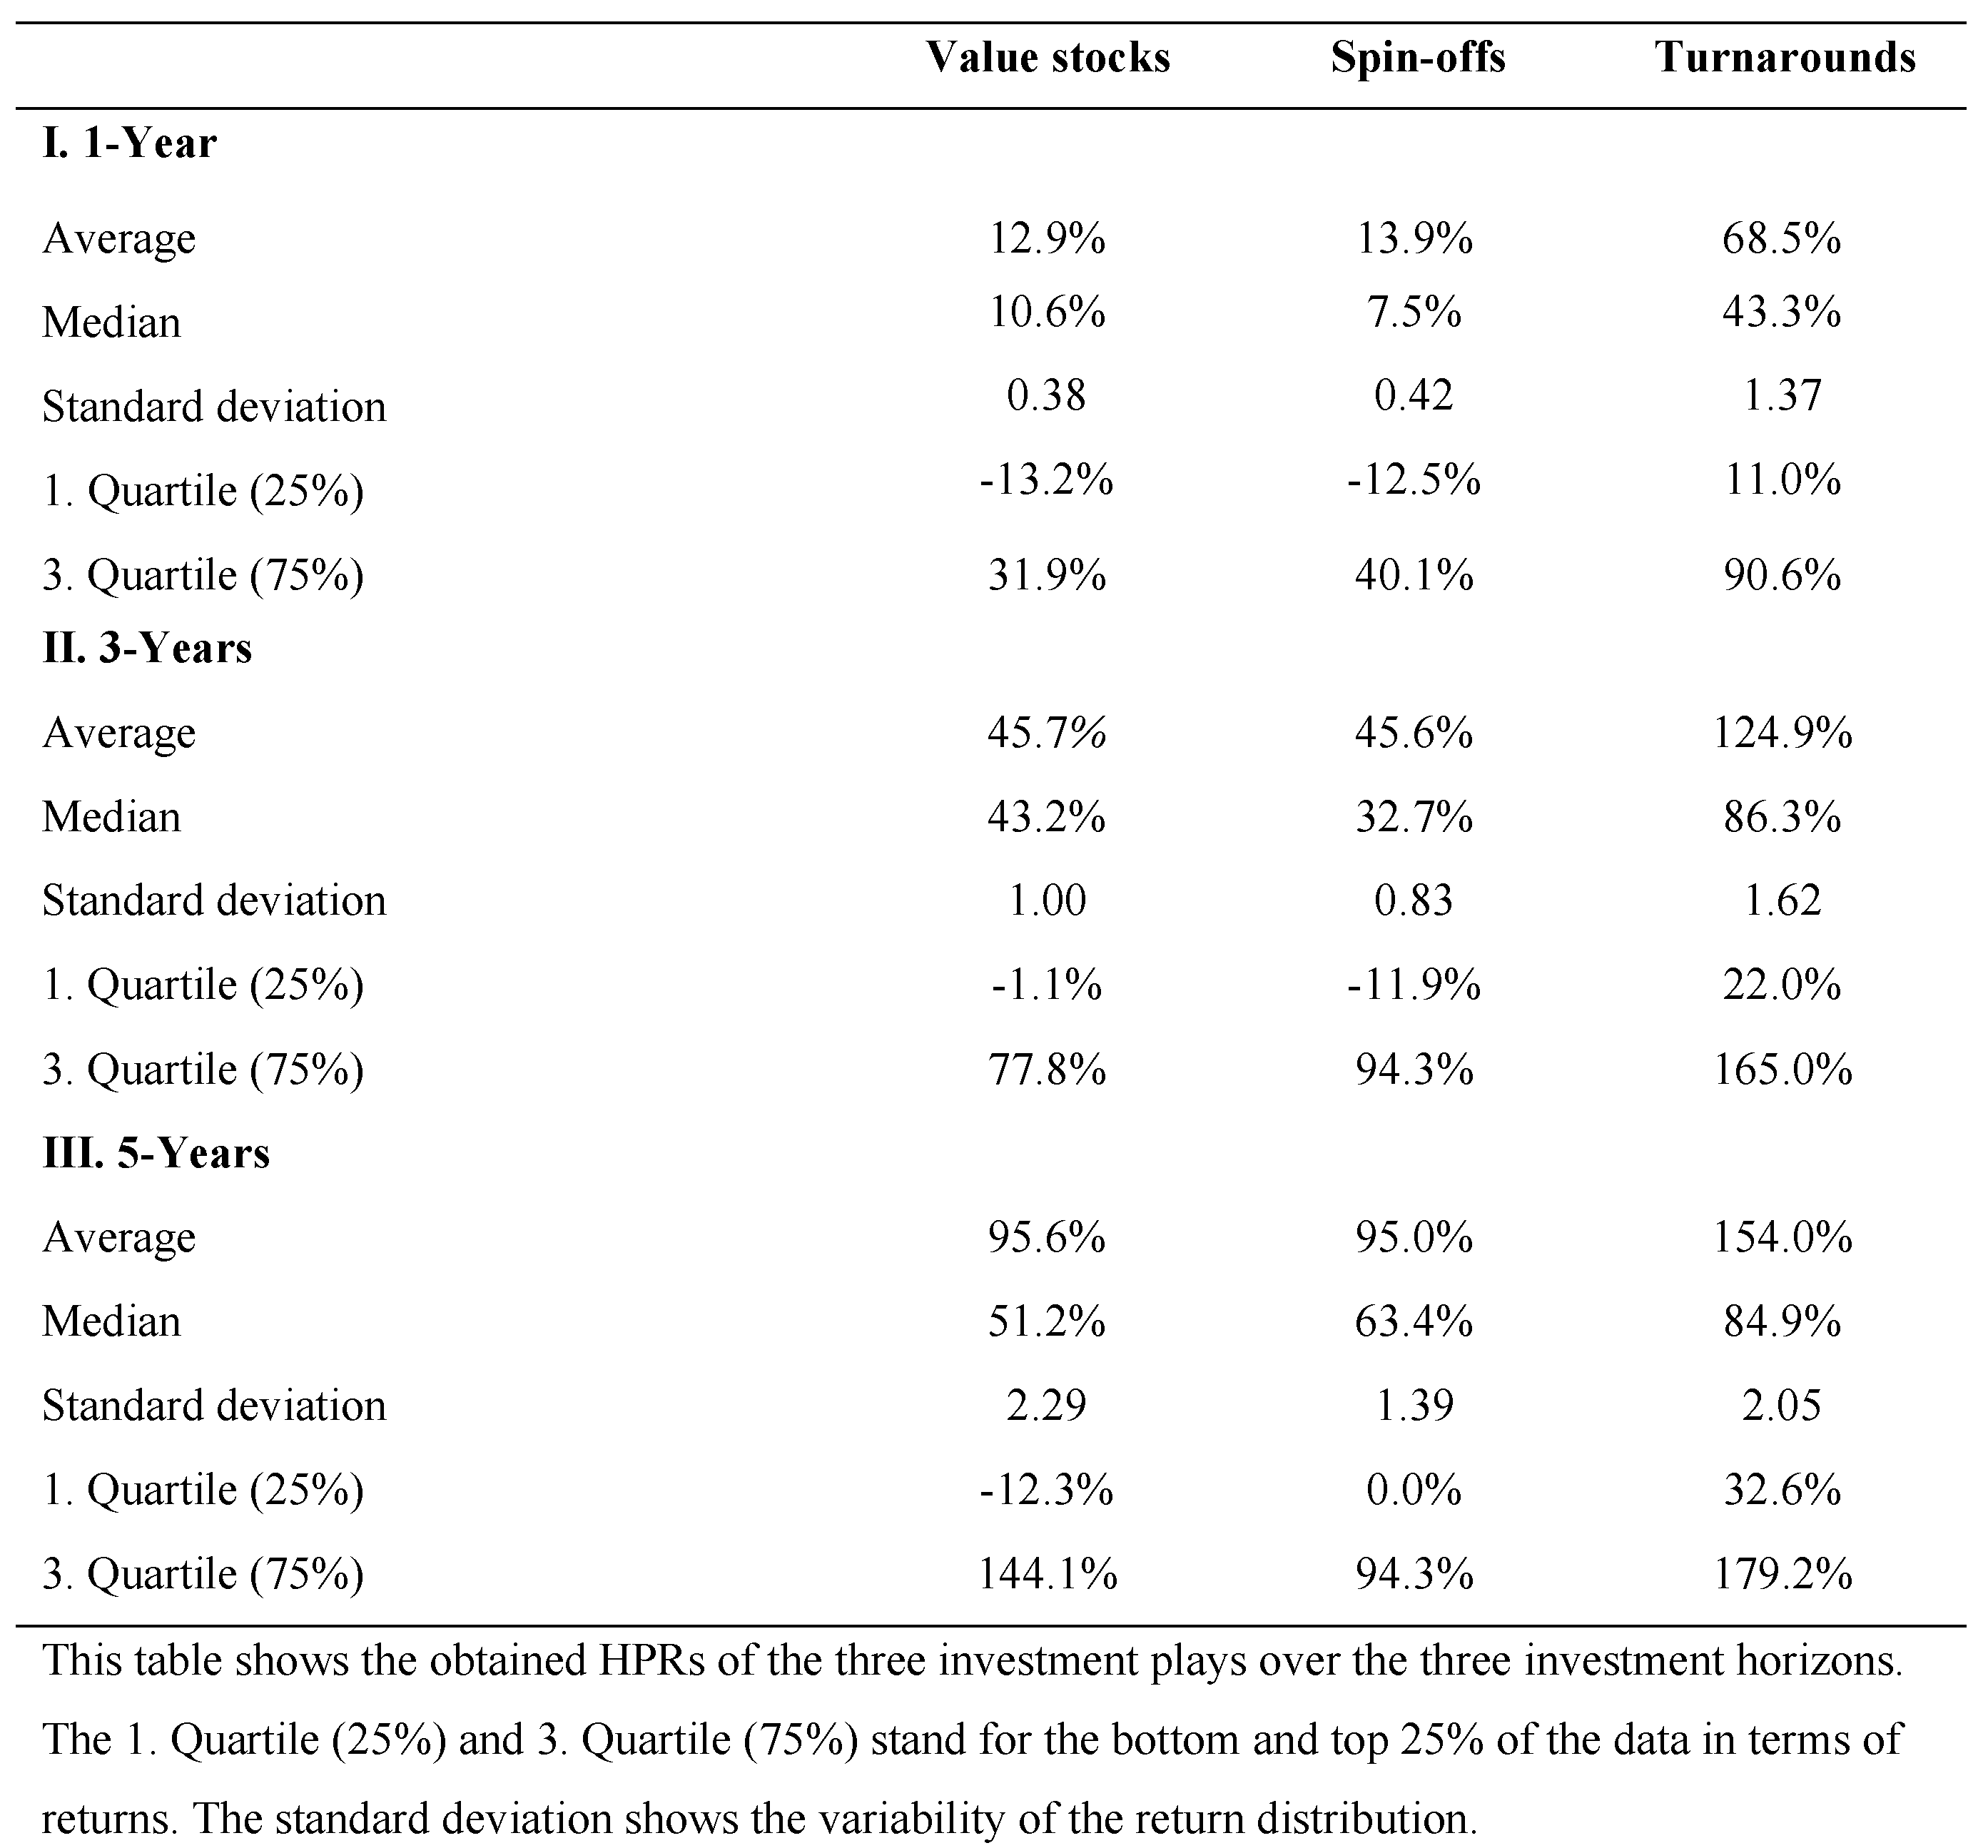
Table 4 provides the HPRs over the analyzed time horizons for the three investment plays. Overall, there is evidence that the three investment plays perform a significant average return over an up to five-year investment horizon. Over one year, the average return of value stocks was 12.9% and increased to 45.7% and 95.6% on a three-year and five-year holding period. On the other hand, the median returns of the value stocks of 10.6% and 43.2% remained slightly below the average return over one and three years. The five-year median return of the value stocks was 51.2%, significantly below the average return. Notably, 25% of the value stocks delivered on average after five years a return of -12.3% or below and 25% provided a return of 144.1% or above. This wide distribution of the returns of value stocks over five years led to a significant standard deviation of 2.29 (229%).
Spin-offs achieved an average return of 13.9% over one year holding period, 45.6% over three years, and 95.0% over five years. Moreover, 75% of all spin-offs provided a positive return after five years. Turnarounds experienced the highest returns over three investment periods compared to value stocks and spin-offs. Over one year, the average return of turnarounds was 68.5%, 124.9% after three, and 154.0% after five years. In addition, 75% of turnaround stocks performed a remarkable return of 179.2% on average after five years.
Congruent over the three investment plays and investment periods, the returns showed a right-skewed distribution since the average returns were higher than the median. The right-skewness implies that significant positive returns existed. Therefore, it is rationale to conduct further analysis on the returns of the investment plays to see whether better-performing stocks can be separated from worse-performing.
Out of the 20 years sample period, five years experienced a negative one-year return. On a three-year basis, value stocks showed a negative return from 2000 (investment period 2000 to 2002) and 2005 (investment period 2005 to 2007). Furthermore, only the value stocks of 2003 realized a negative return over five years, which might be explained since the investment period ended in the financial crisis.
The strongest three- and five-return performance was in 2002 and 2006. However, these returns were limited as only seven companies in 2002 and one company in 2006 were identified as value stocks through the applied screening. As a result, the value stocks of 2002 realized an average five-year HPR of 449%. However, due to the presentability, the chart’s scale in Figure 5 only reached up to 300%. Besides those outliners, the value stocks from the years 2014 to 2016 showed the best five-year performance with an average of over 100%.
Like value stocks, the annual returns of spin-offs did not show a clear return pattern. Spin-offs realized a negative one-year return in five years (2001, 2002, 2007, 2014 and 2017), which were almost congruent with negative returns from the value stocks.
A possible explanation for this could be the general market movements. The five-year return from 2002 is restricted as only one spin-off was identified this year. Thereby, the same issue as with the value stocks occurred. Then the spin-off transaction from 2002 realized a five-year HPR of 646.8%. However, due to the presentability of the chart, the returns did only reach up to 250%. Therefore, the highest five-year HPR besides the outliner was performed in 2008, which applies to the investment period from 2008 to 2012.
As mentioned before, turnarounds achieved the highest average returns out of the three investment plays. Remarkably, the five-year return was above 100% in 12 years. Since the time of investment in turnarounds was at the beginning of the third year of the z-score pattern and only successful turnarounds between 2000 and 2019 were included, there was no one-year return in 2019.
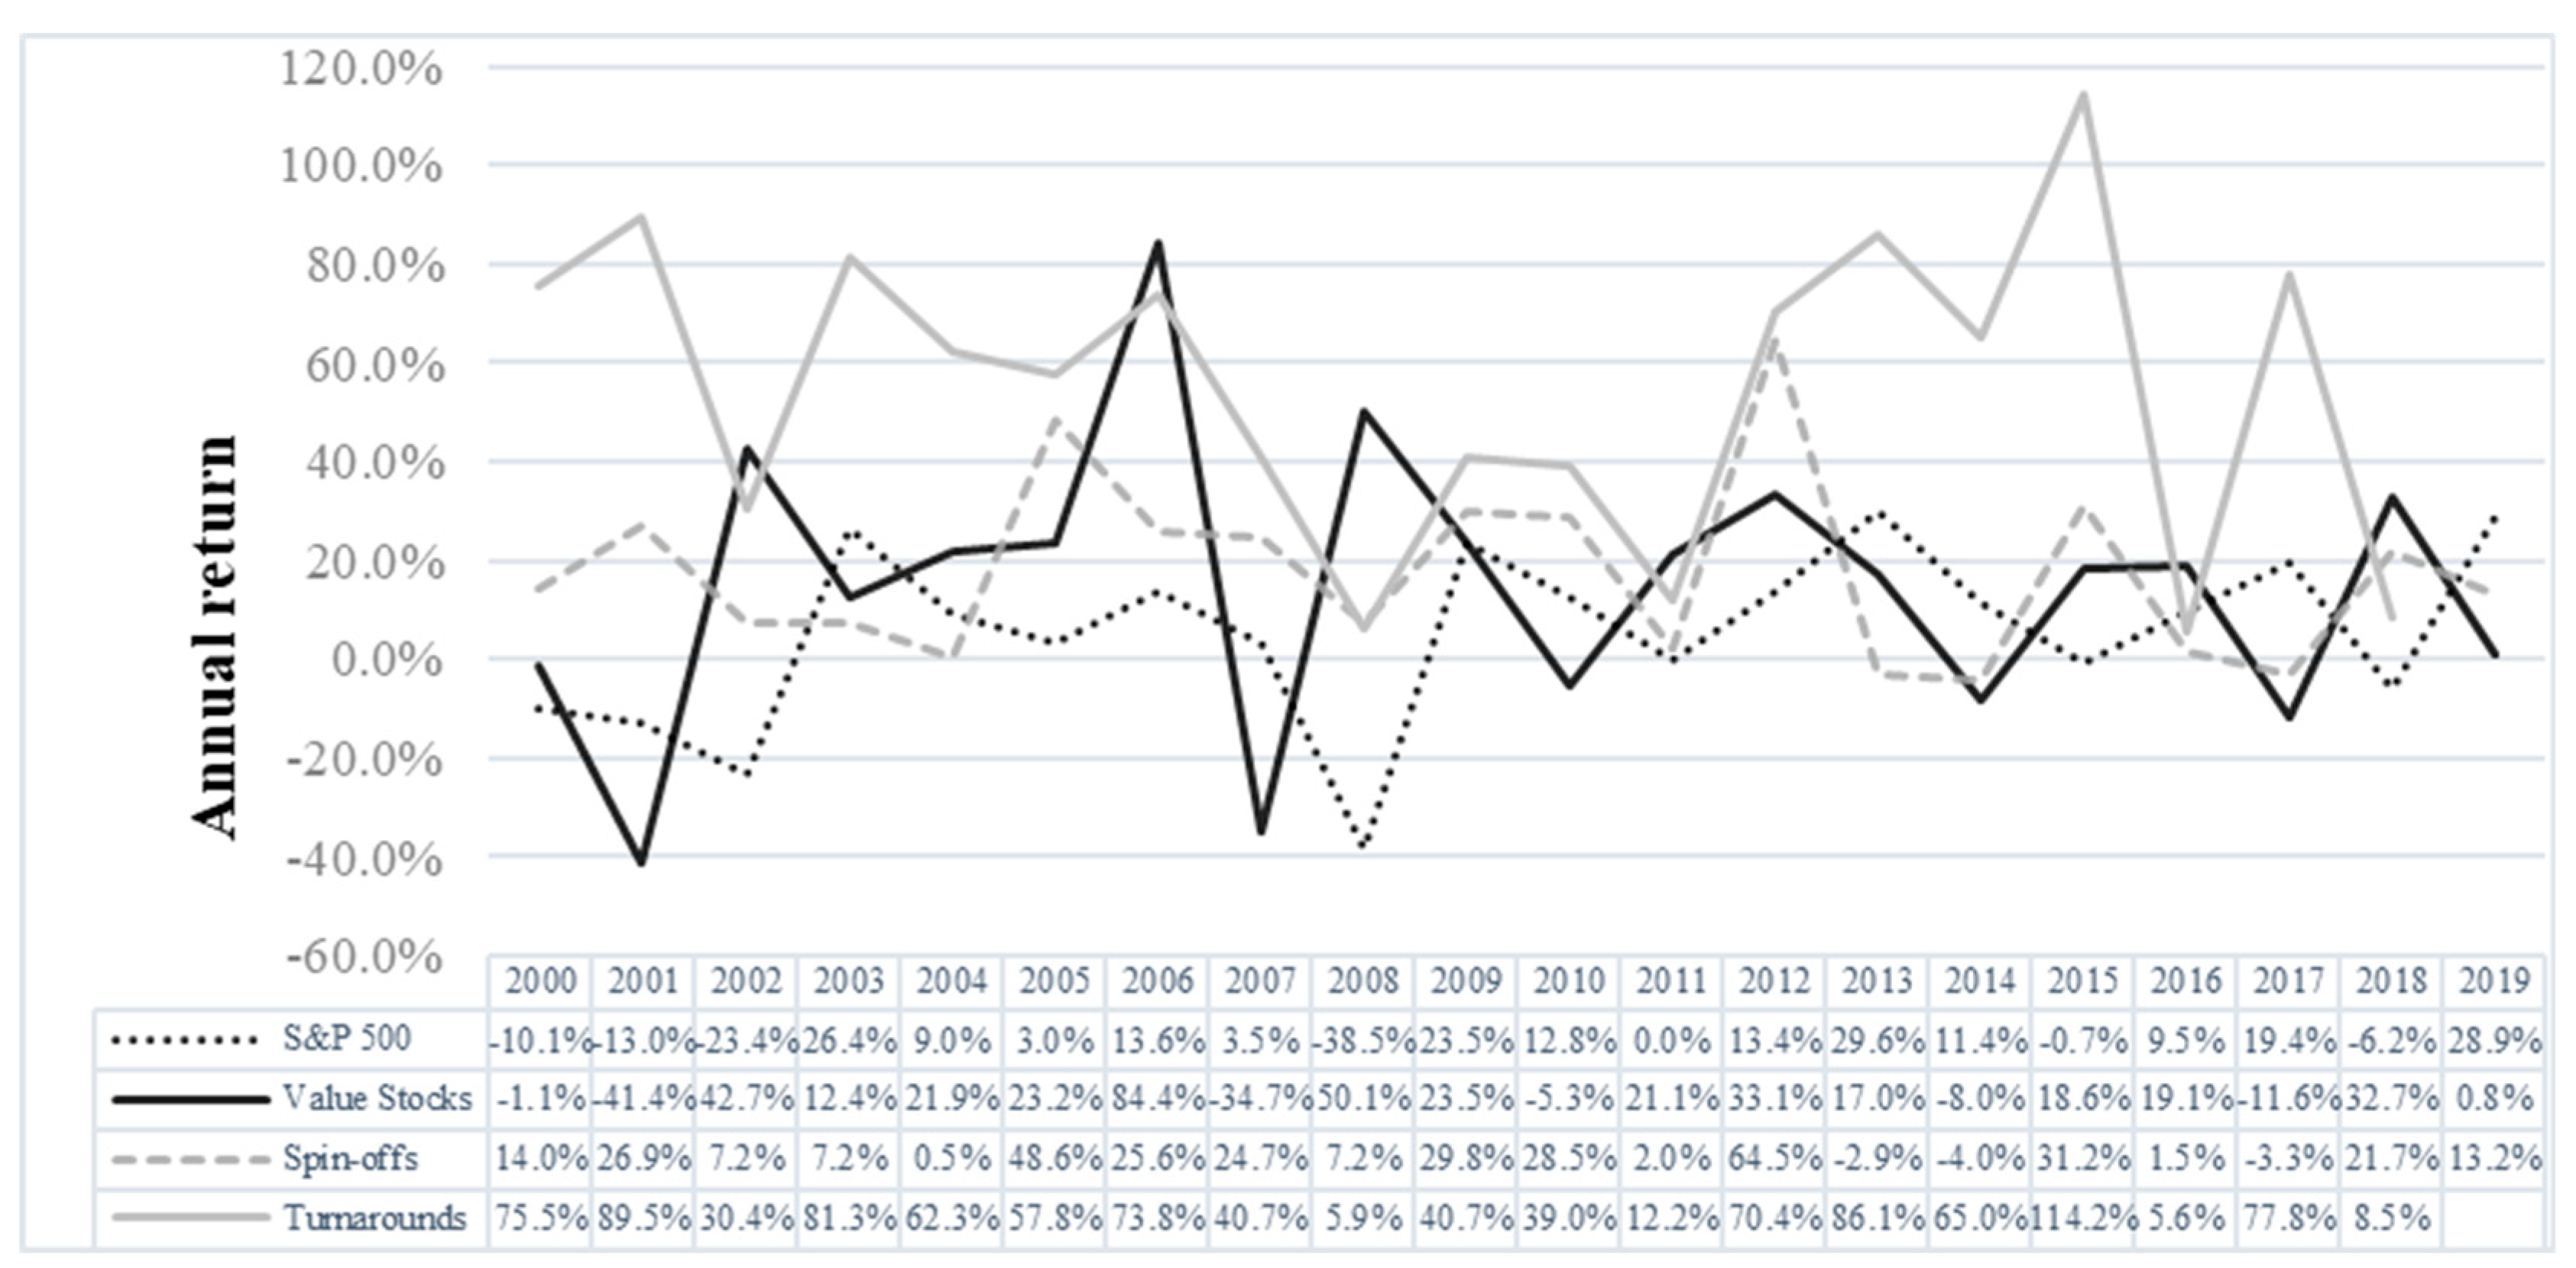
Figure 3 displays the development of the average one-year returns of the S&P 500 index and the three investment plays. Turnaround stocks were the only investment play that never experienced a loss on average after one year. Moreover, the annual return performance of turnaround stocks showed strong volatility over the years. As indicated in
Figure 3, the difference between the highest one-year return of 114.2%, obtained in 2015, and the lowest return of 5.6% in 2016, was 108.6%.
The maximum one-year return by spin-off stocks was obtained in 2012 at 64.5%. Value stocks experienced the lowest returns on average in 2001 with -41.4% and 2007 with -34.7%. On the other hand, the highest one-year return by value stocks was realized in 2006 with 84.4%. Turnarounds, spin-offs and value stocks showed a random annual return pattern over the 20 years with no significant correlation to the S&P 500 index return.
Table 5 shows the average and median returns of the S&P 500 over the three investment horizons. The S&P 500 performed an average return of 5.6% over one year, 17.6% over three years and 33.6% over five years. Two periods with a significantly lower performance impacted the overall average return. Firstly, between 2000 and 2002, the S&P 500 delivered a cumulative return of -40.1%. Secondly, due to the financial crisis in 2007/08, the S&P 500 index yielded a return of -38.5% in 2008. Therefore, the average annual return of the S&P 500 index from 2000 to 2008 significantly differed from 2009 to 2019.
Whereas the average annual return between 2009 to 2019 was 12.9%, the S&P 500 only provided an average annual return of -3.3% between 2000 and 2008. Moreover, the average return of the S&P 500 index over one and three years was lower than the average median return.
As one of the main goals of this article is to identify the abnormal returns,
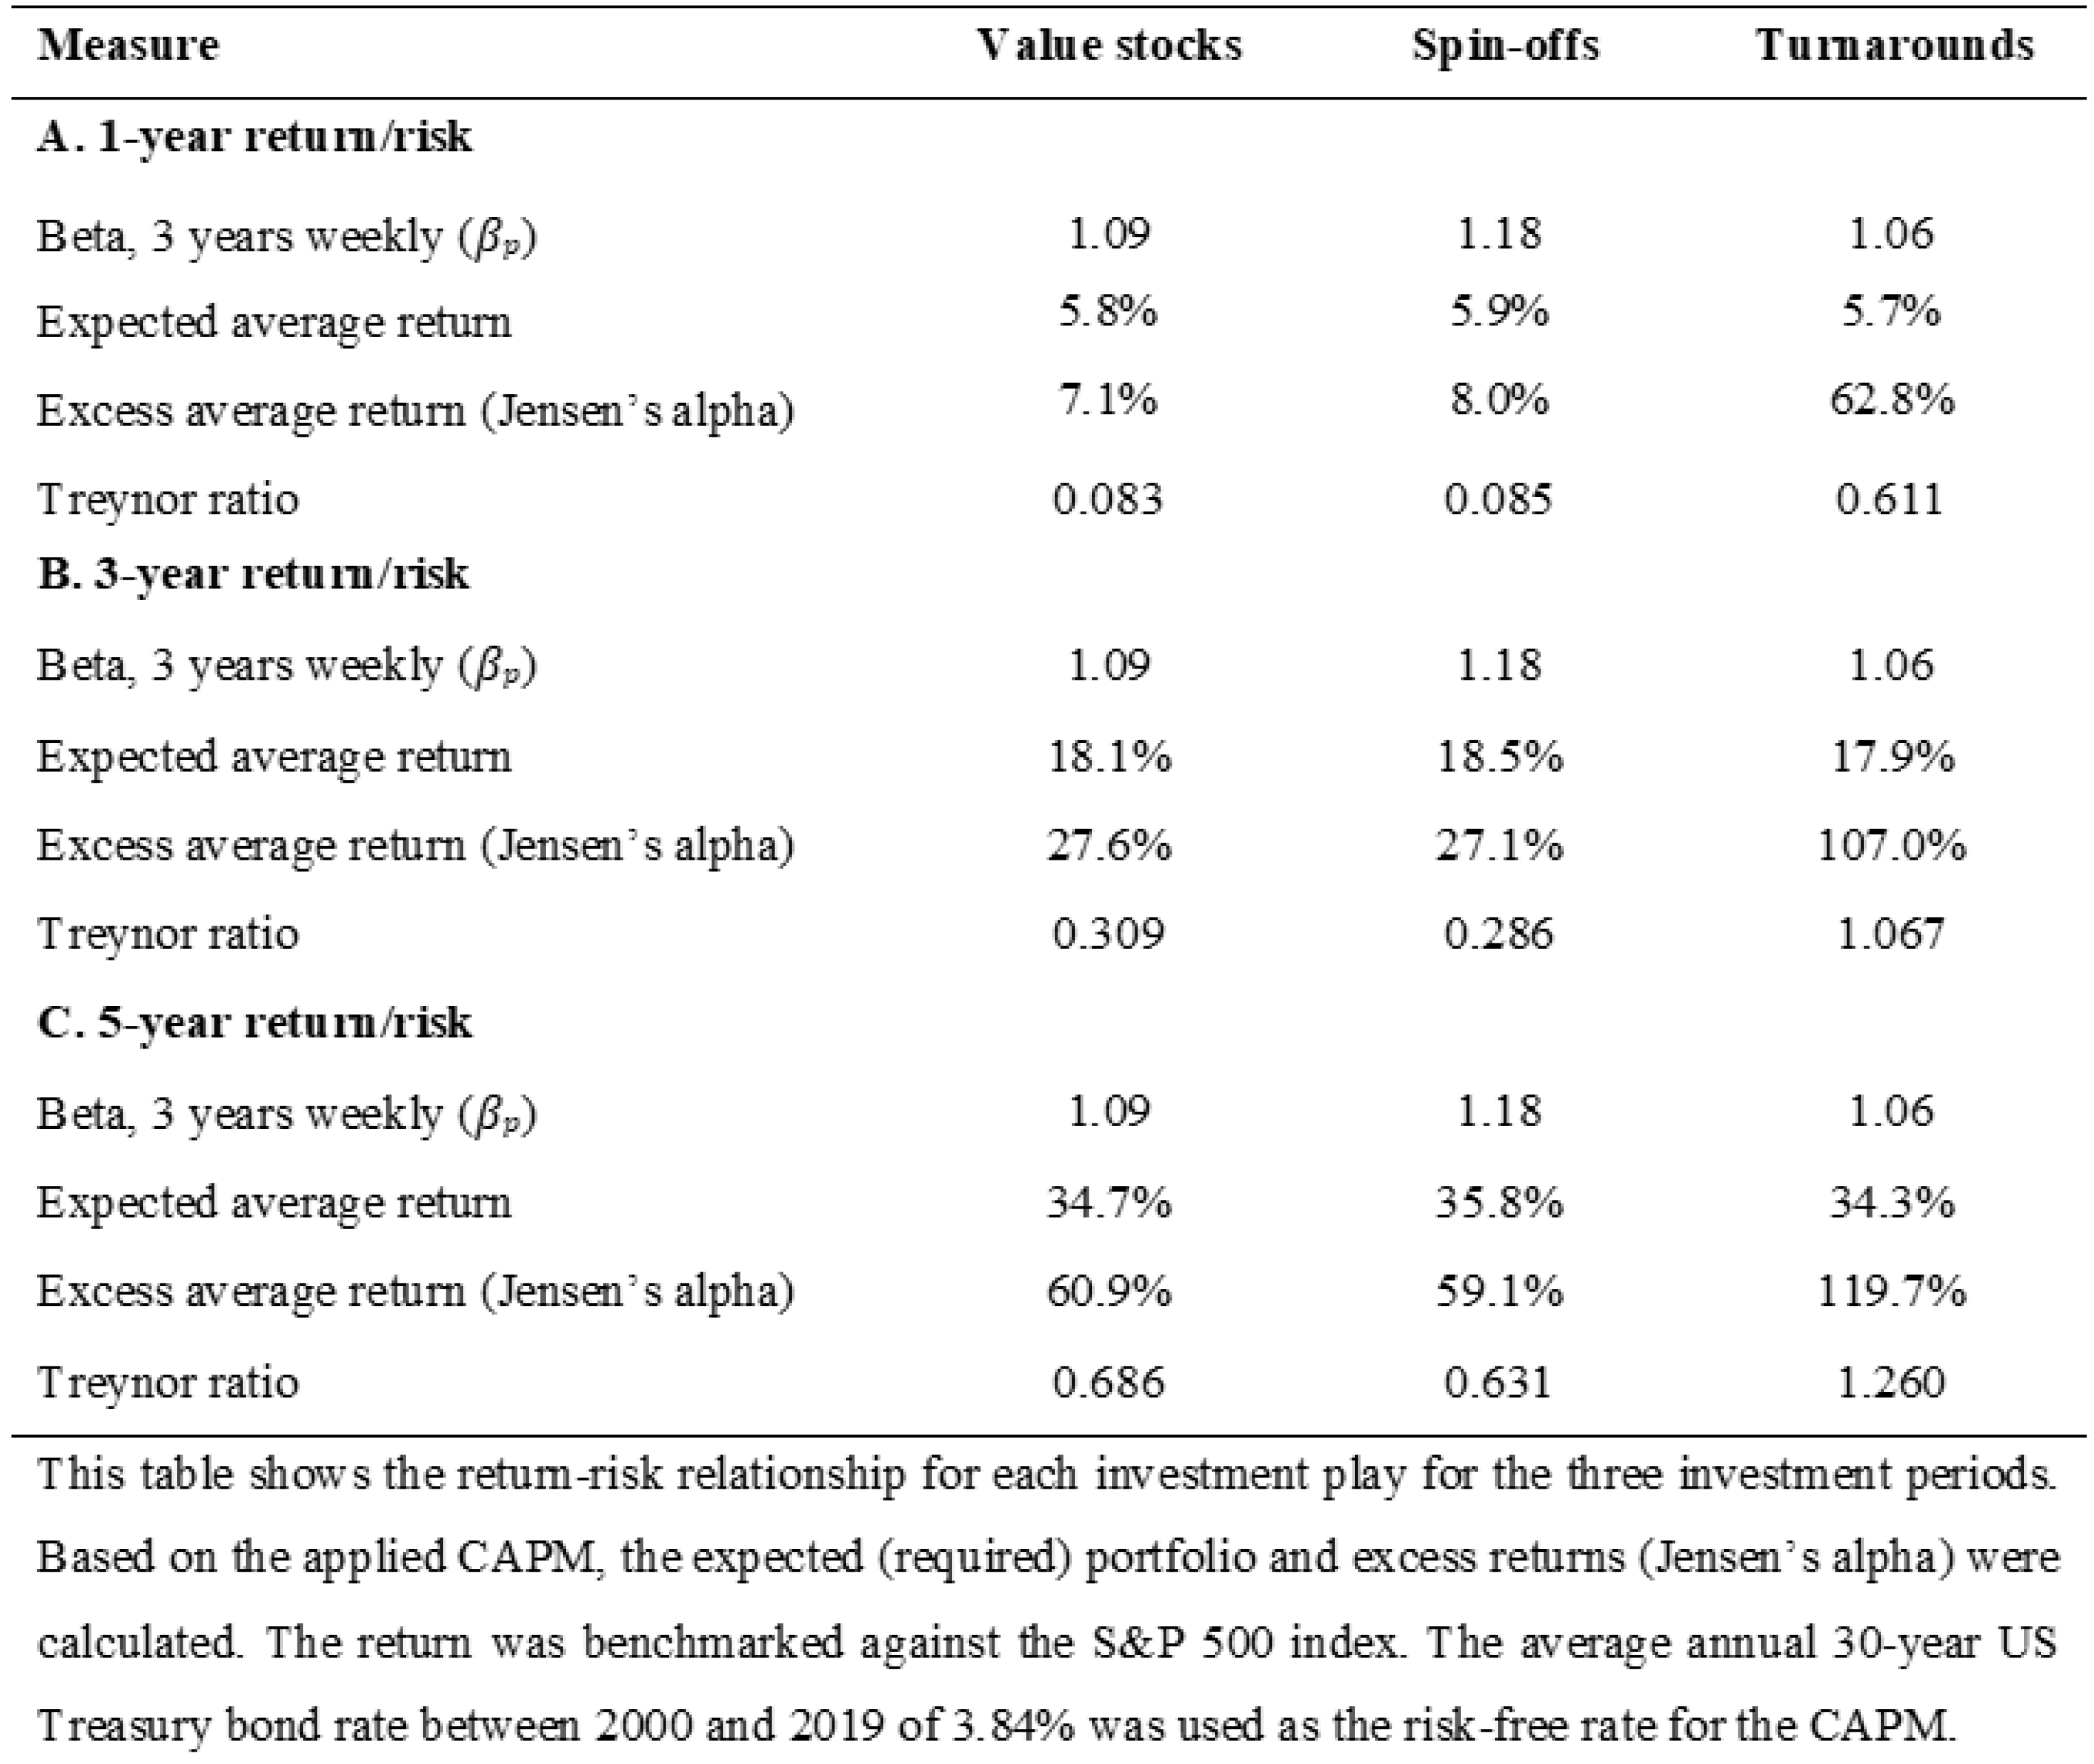
Table 6 shows the risk-adjusted excess returns for each investment play based on the CAPM. Overall, the results indicate that all three investment plays deliver a positive risk-adjusted excess return over the three investment periods.
Value stocks and spin-offs experienced a similar alpha over the three investment horizons on average. The average betas of the three investment plays confirmed the portfolio theory that an increasing number of equities in a portfolio reduce idiosyncratic risk, which leads to a beta-coefficient close to one.
Turnarounds had, on average, the lowest beta and the highest returns. Hence, turnarounds realized the highest excess returns with an average alpha of 62.8% after one year, 107% after three years and 119.7% after five years. Since turnarounds provided the highest returns and lowest betas, they also realized the highest Treynor ratio in all investment periods. Turnaround stocks outlined a Treynor ratio of 1.067 after three and 1.260 after five years, concluding that investors earned 106.7% and 126.0% per unit of systematic risk (beta) taken by investing in a turnaround portfolio.
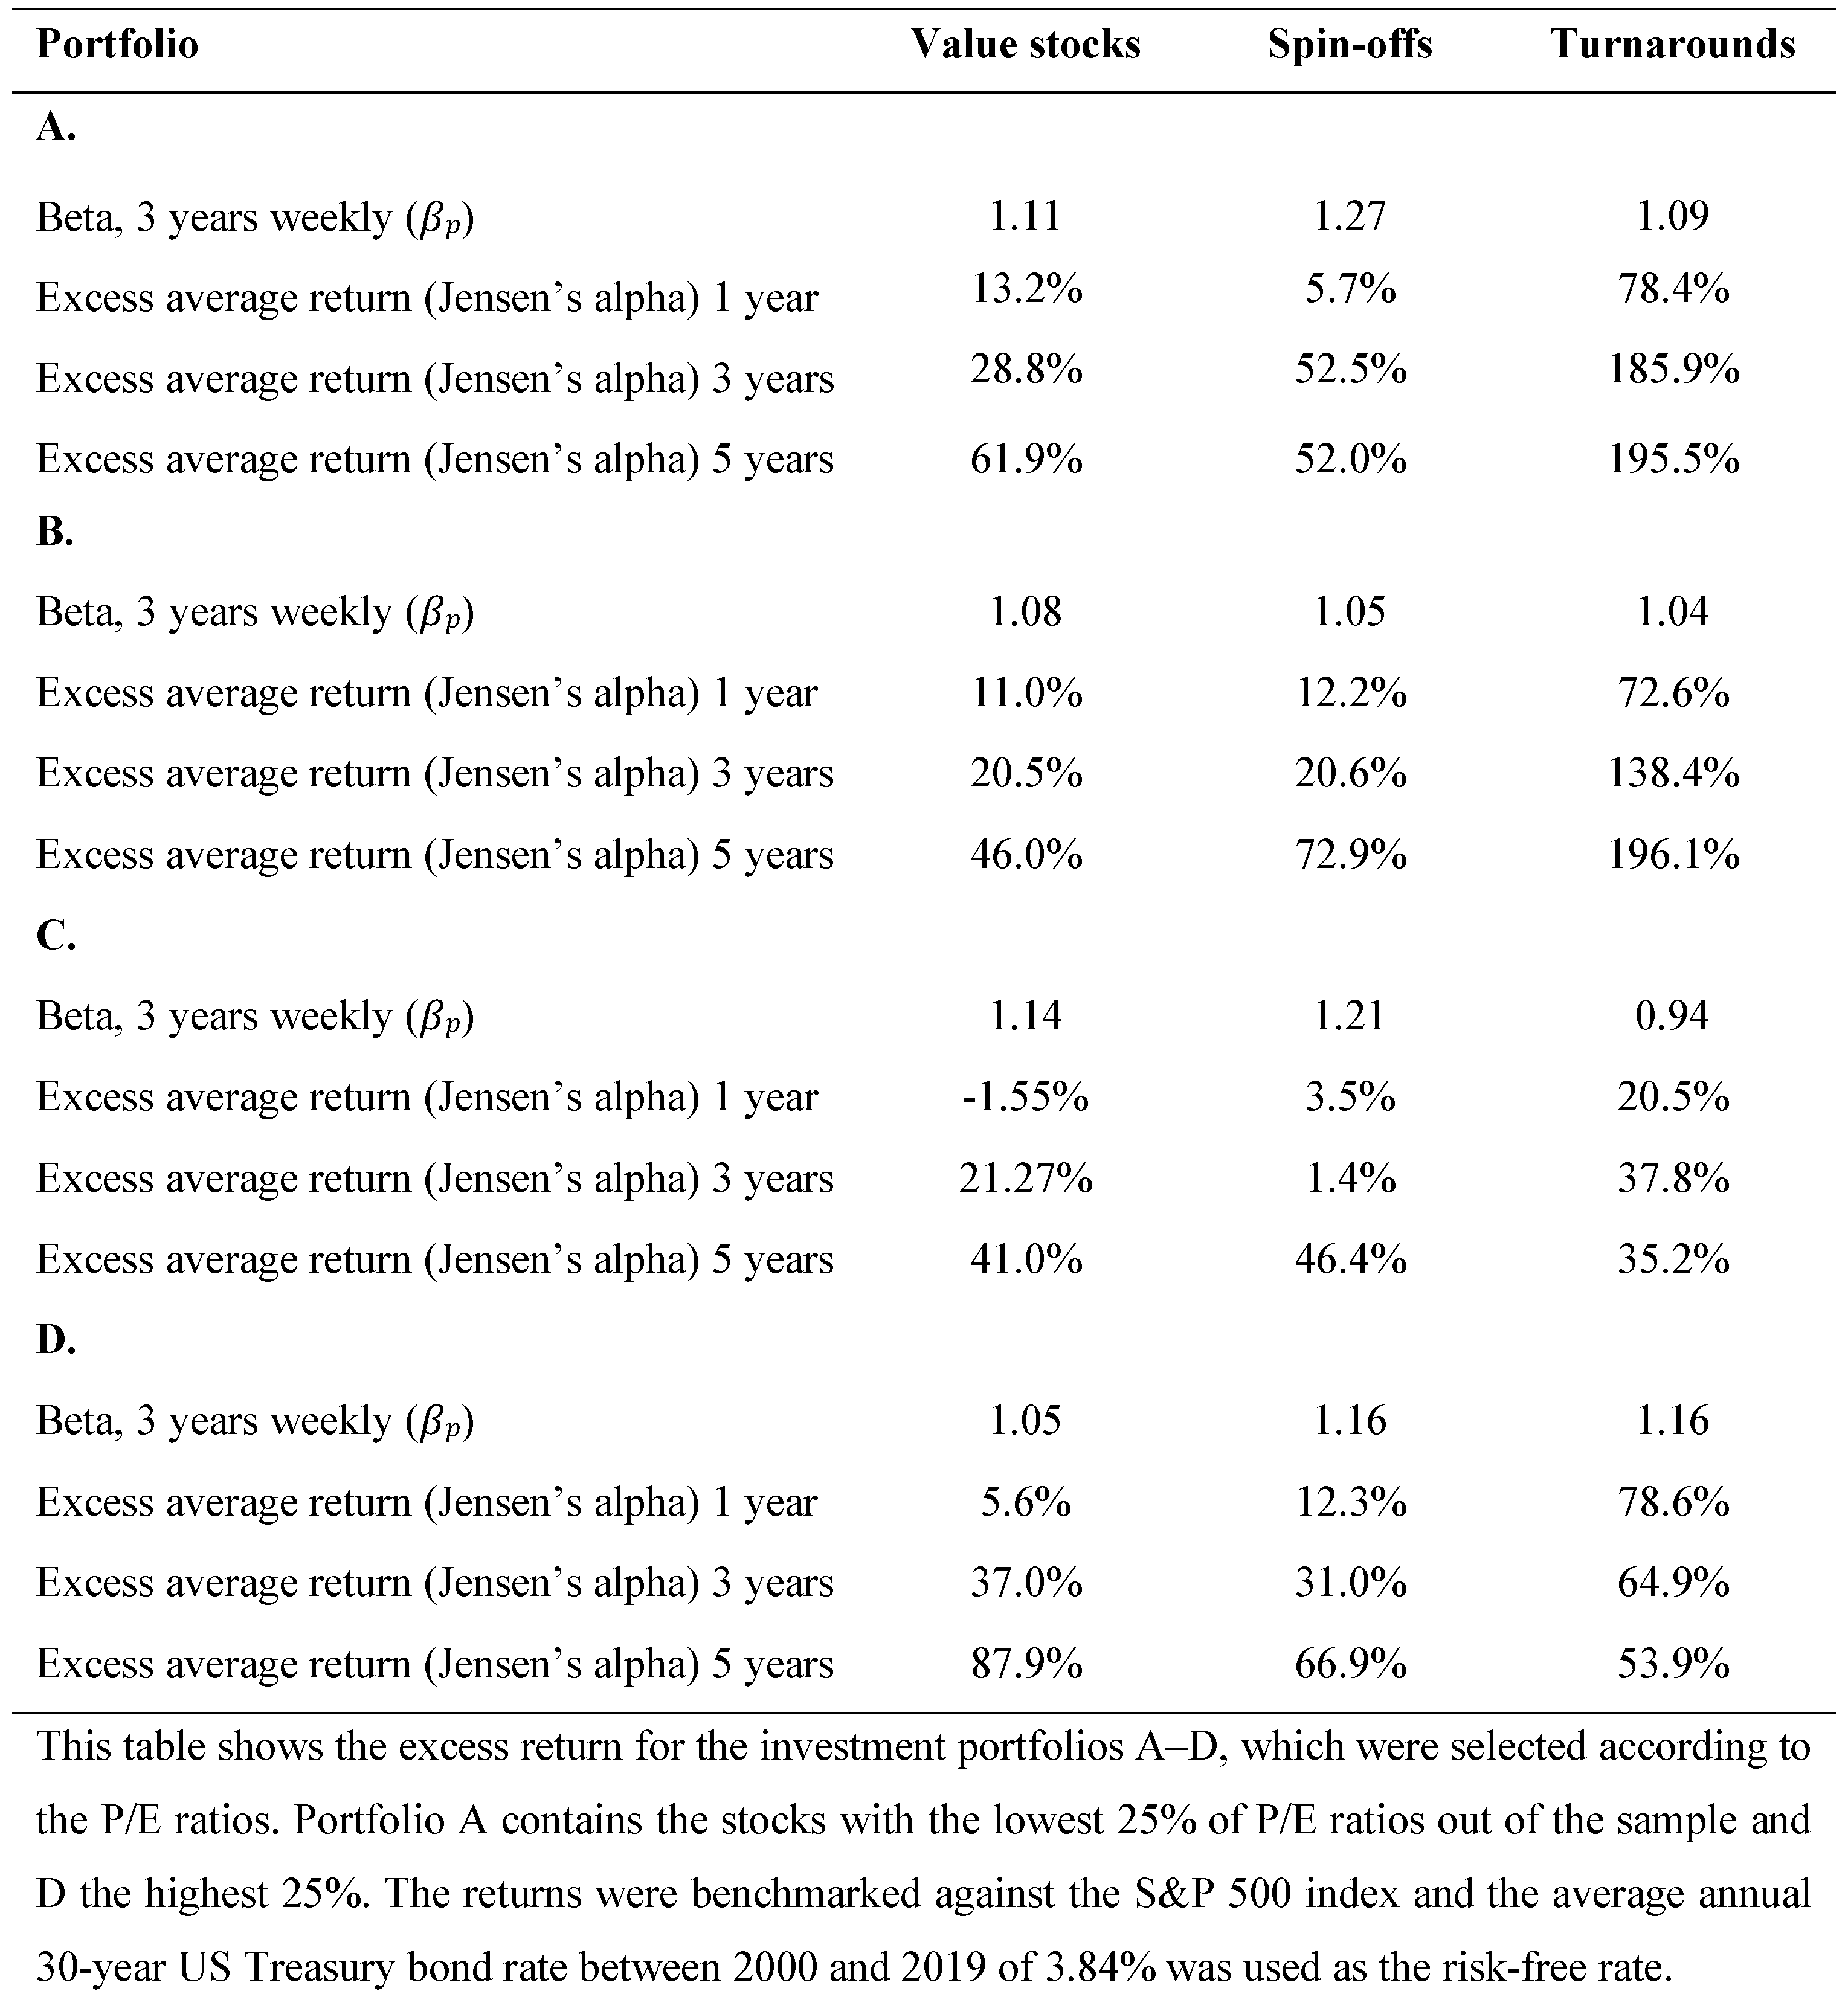
In addition, value stocks delivered a higher Treynor ratio than spin-offs over three and five years. Therefore, investors in value stocks received a higher excess return for each beta unit. In order to see whether low P/E portfolios deliver an excess return, the risk-adjusted returns from portfolios A to D are shown in
Table 7.
Value stocks with a low P/E realized the highest average returns after one year with an alpha of 13.2%. On the other hand, value stocks in portfolio C underperformed on average after one year and realized a negative excess return.
Even though turnarounds with lower P/E ratios in portfolios A and B had a higher beta coefficient than portfolio C, a higher excess return was obtained. Turnarounds in portfolio A performed a significant average positive alpha of 185.9% after three and 195.5% after five years. Congruent with the average returns, the P/E ratio had little impact on the risk-adjusted excess returns of spin-offs.
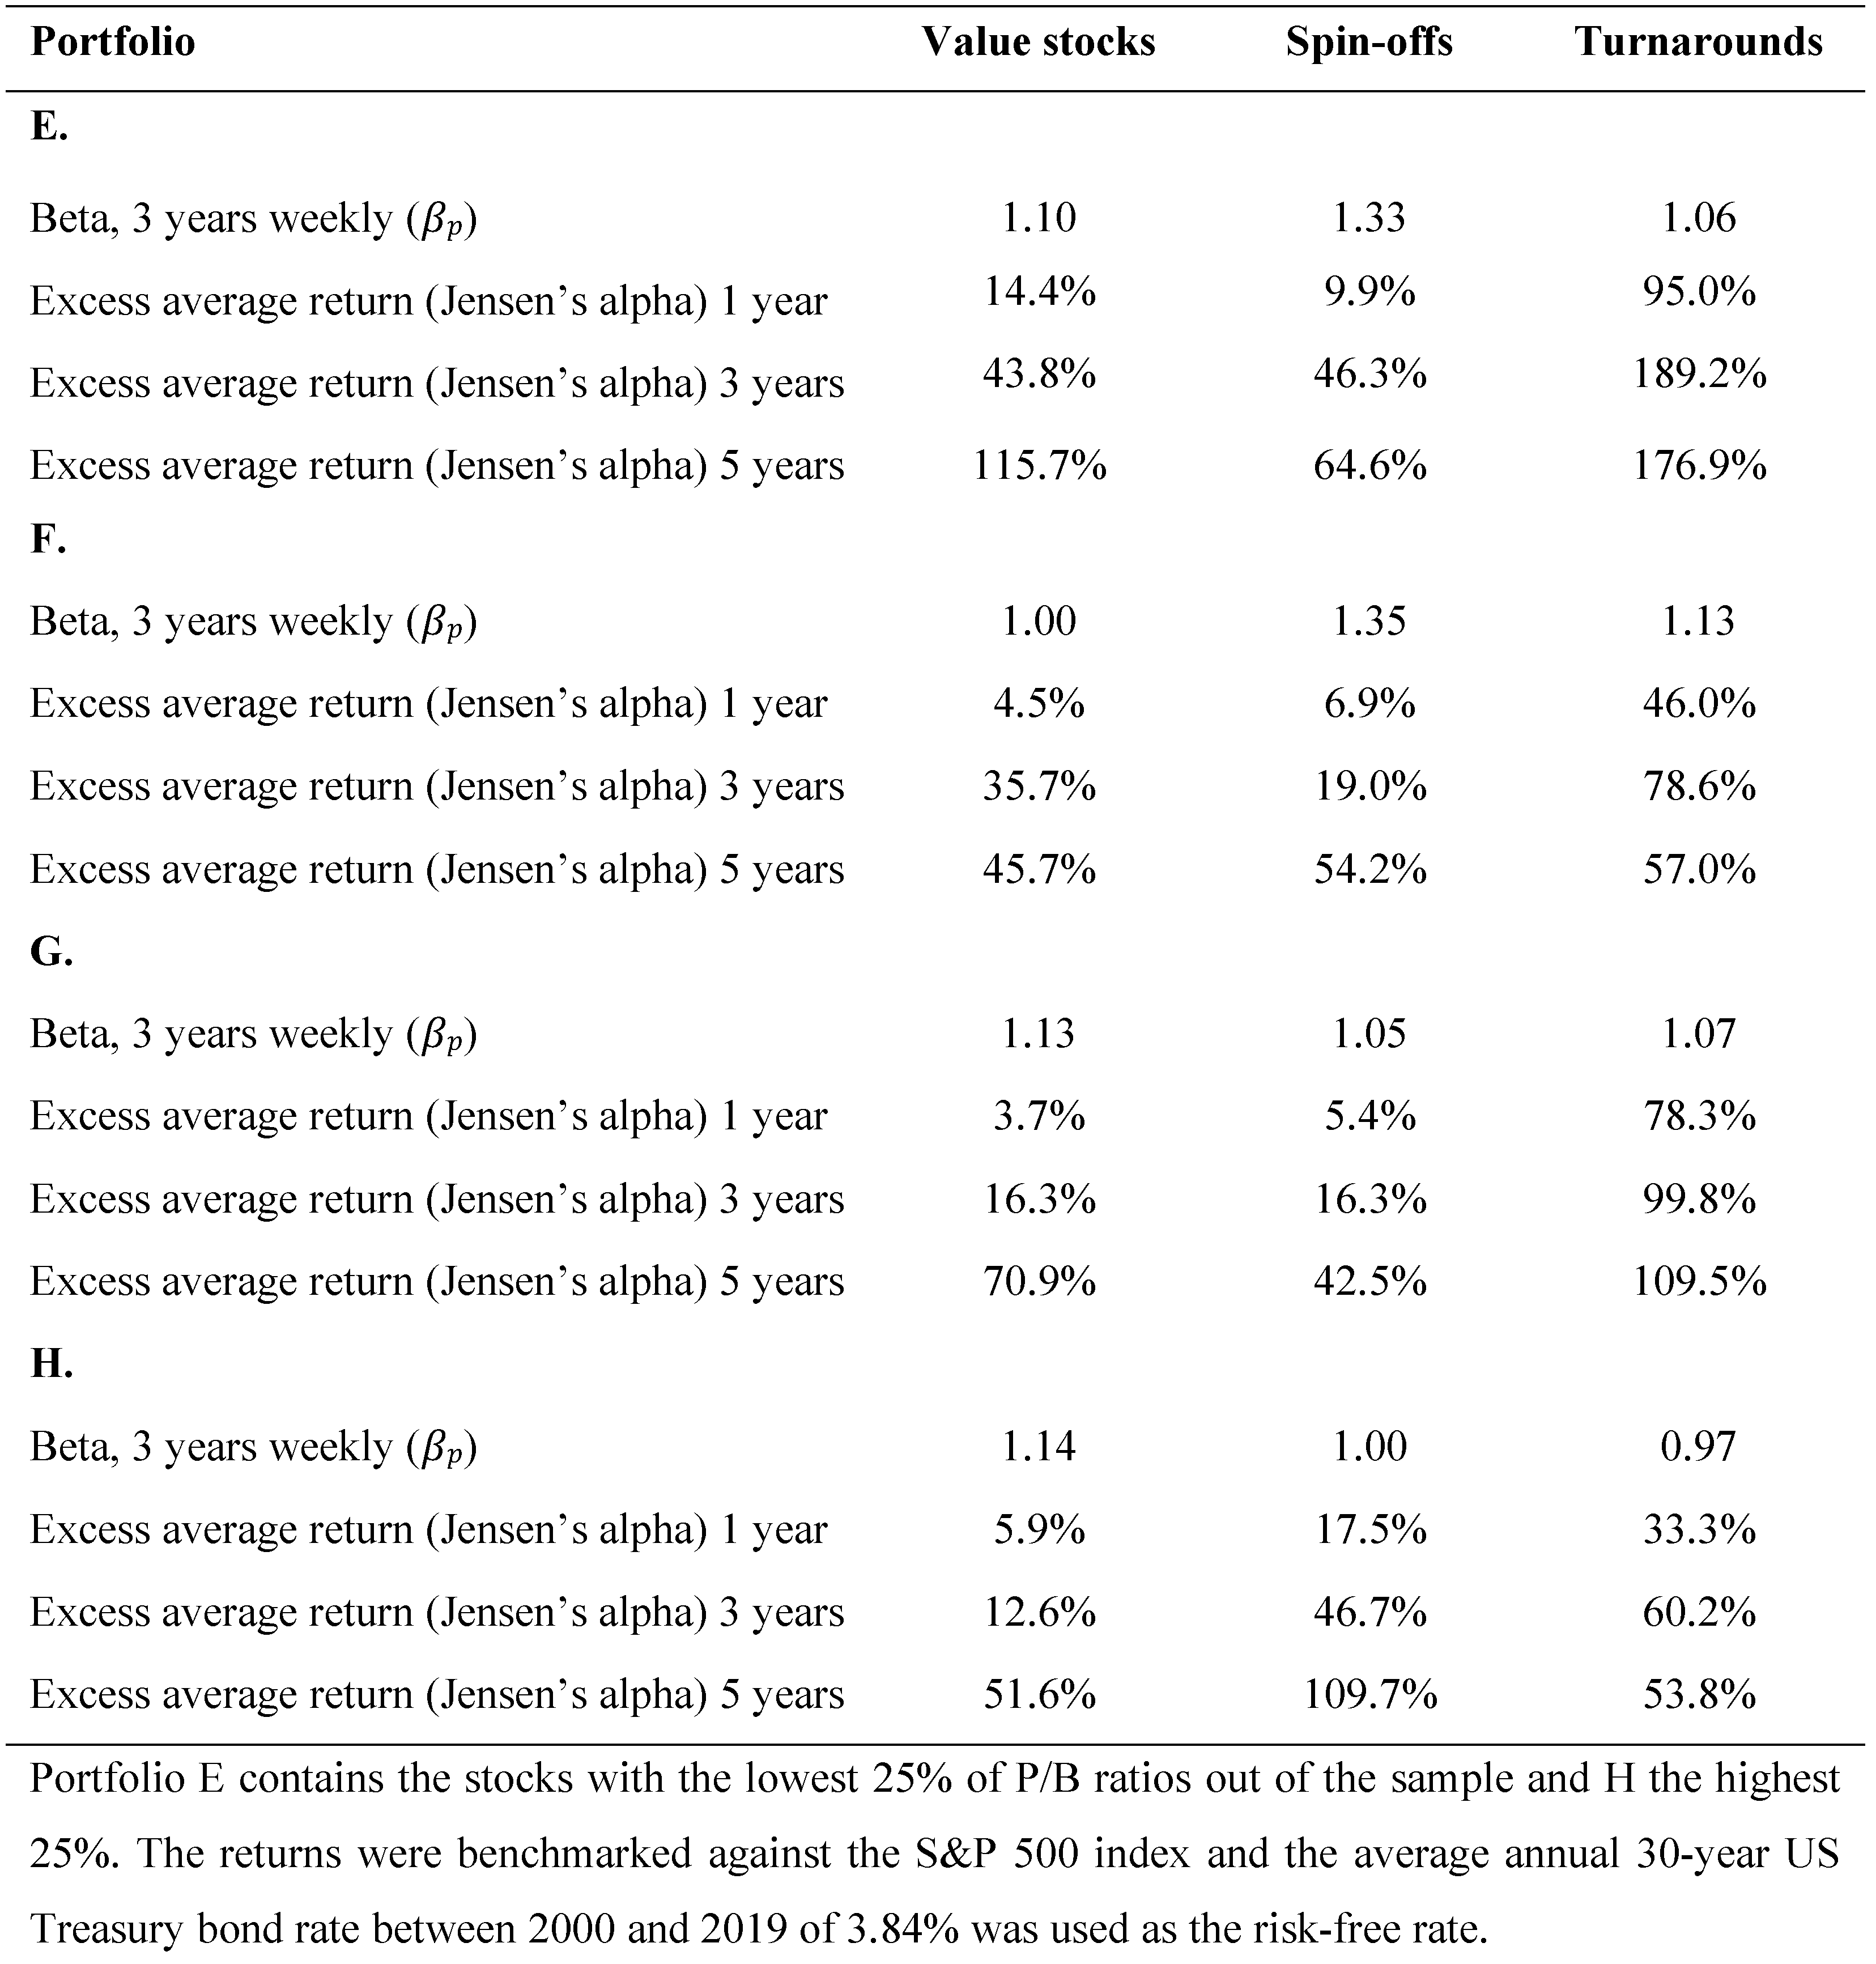
Table 8 shows the risk-adjusted returns from the portfolios E to H, which were constructed based on the P/B ratios. Value stocks with the lowest P/B ratios in portfolio E provided a significantly higher average excess return of 14.4% after one year, 43.8% three years, and 115.7% five years compared to value stocks with a higher P/B ratio. Turnarounds with the lowest P/B ratio realized the highest average excess returns. Even though turnarounds in portfolio H had a lower beta coefficient on average, a substantially lower average excess return was delivered on all three investment horizons. Like before, the P/B did not have an impact on the excess return of spin-offs.
3. Discussion
The results show that the three investment plays strongly outperformed the S&P 500 index over one, three, and five years and delivered a significant risk-adjusted excess return. The strong returns of the three investment plays indicate that investors can outperform the S&P 500 and that the EMH does not hold for up to five years. Therefore, it appears that the market does not efficiently evaluate value stocks, spin-offs, and turnarounds. Moreover, it indicates that market anomalies occur. The following sections discuss the findings in detail regarding the three investment plays.
3.1. Value Stocks
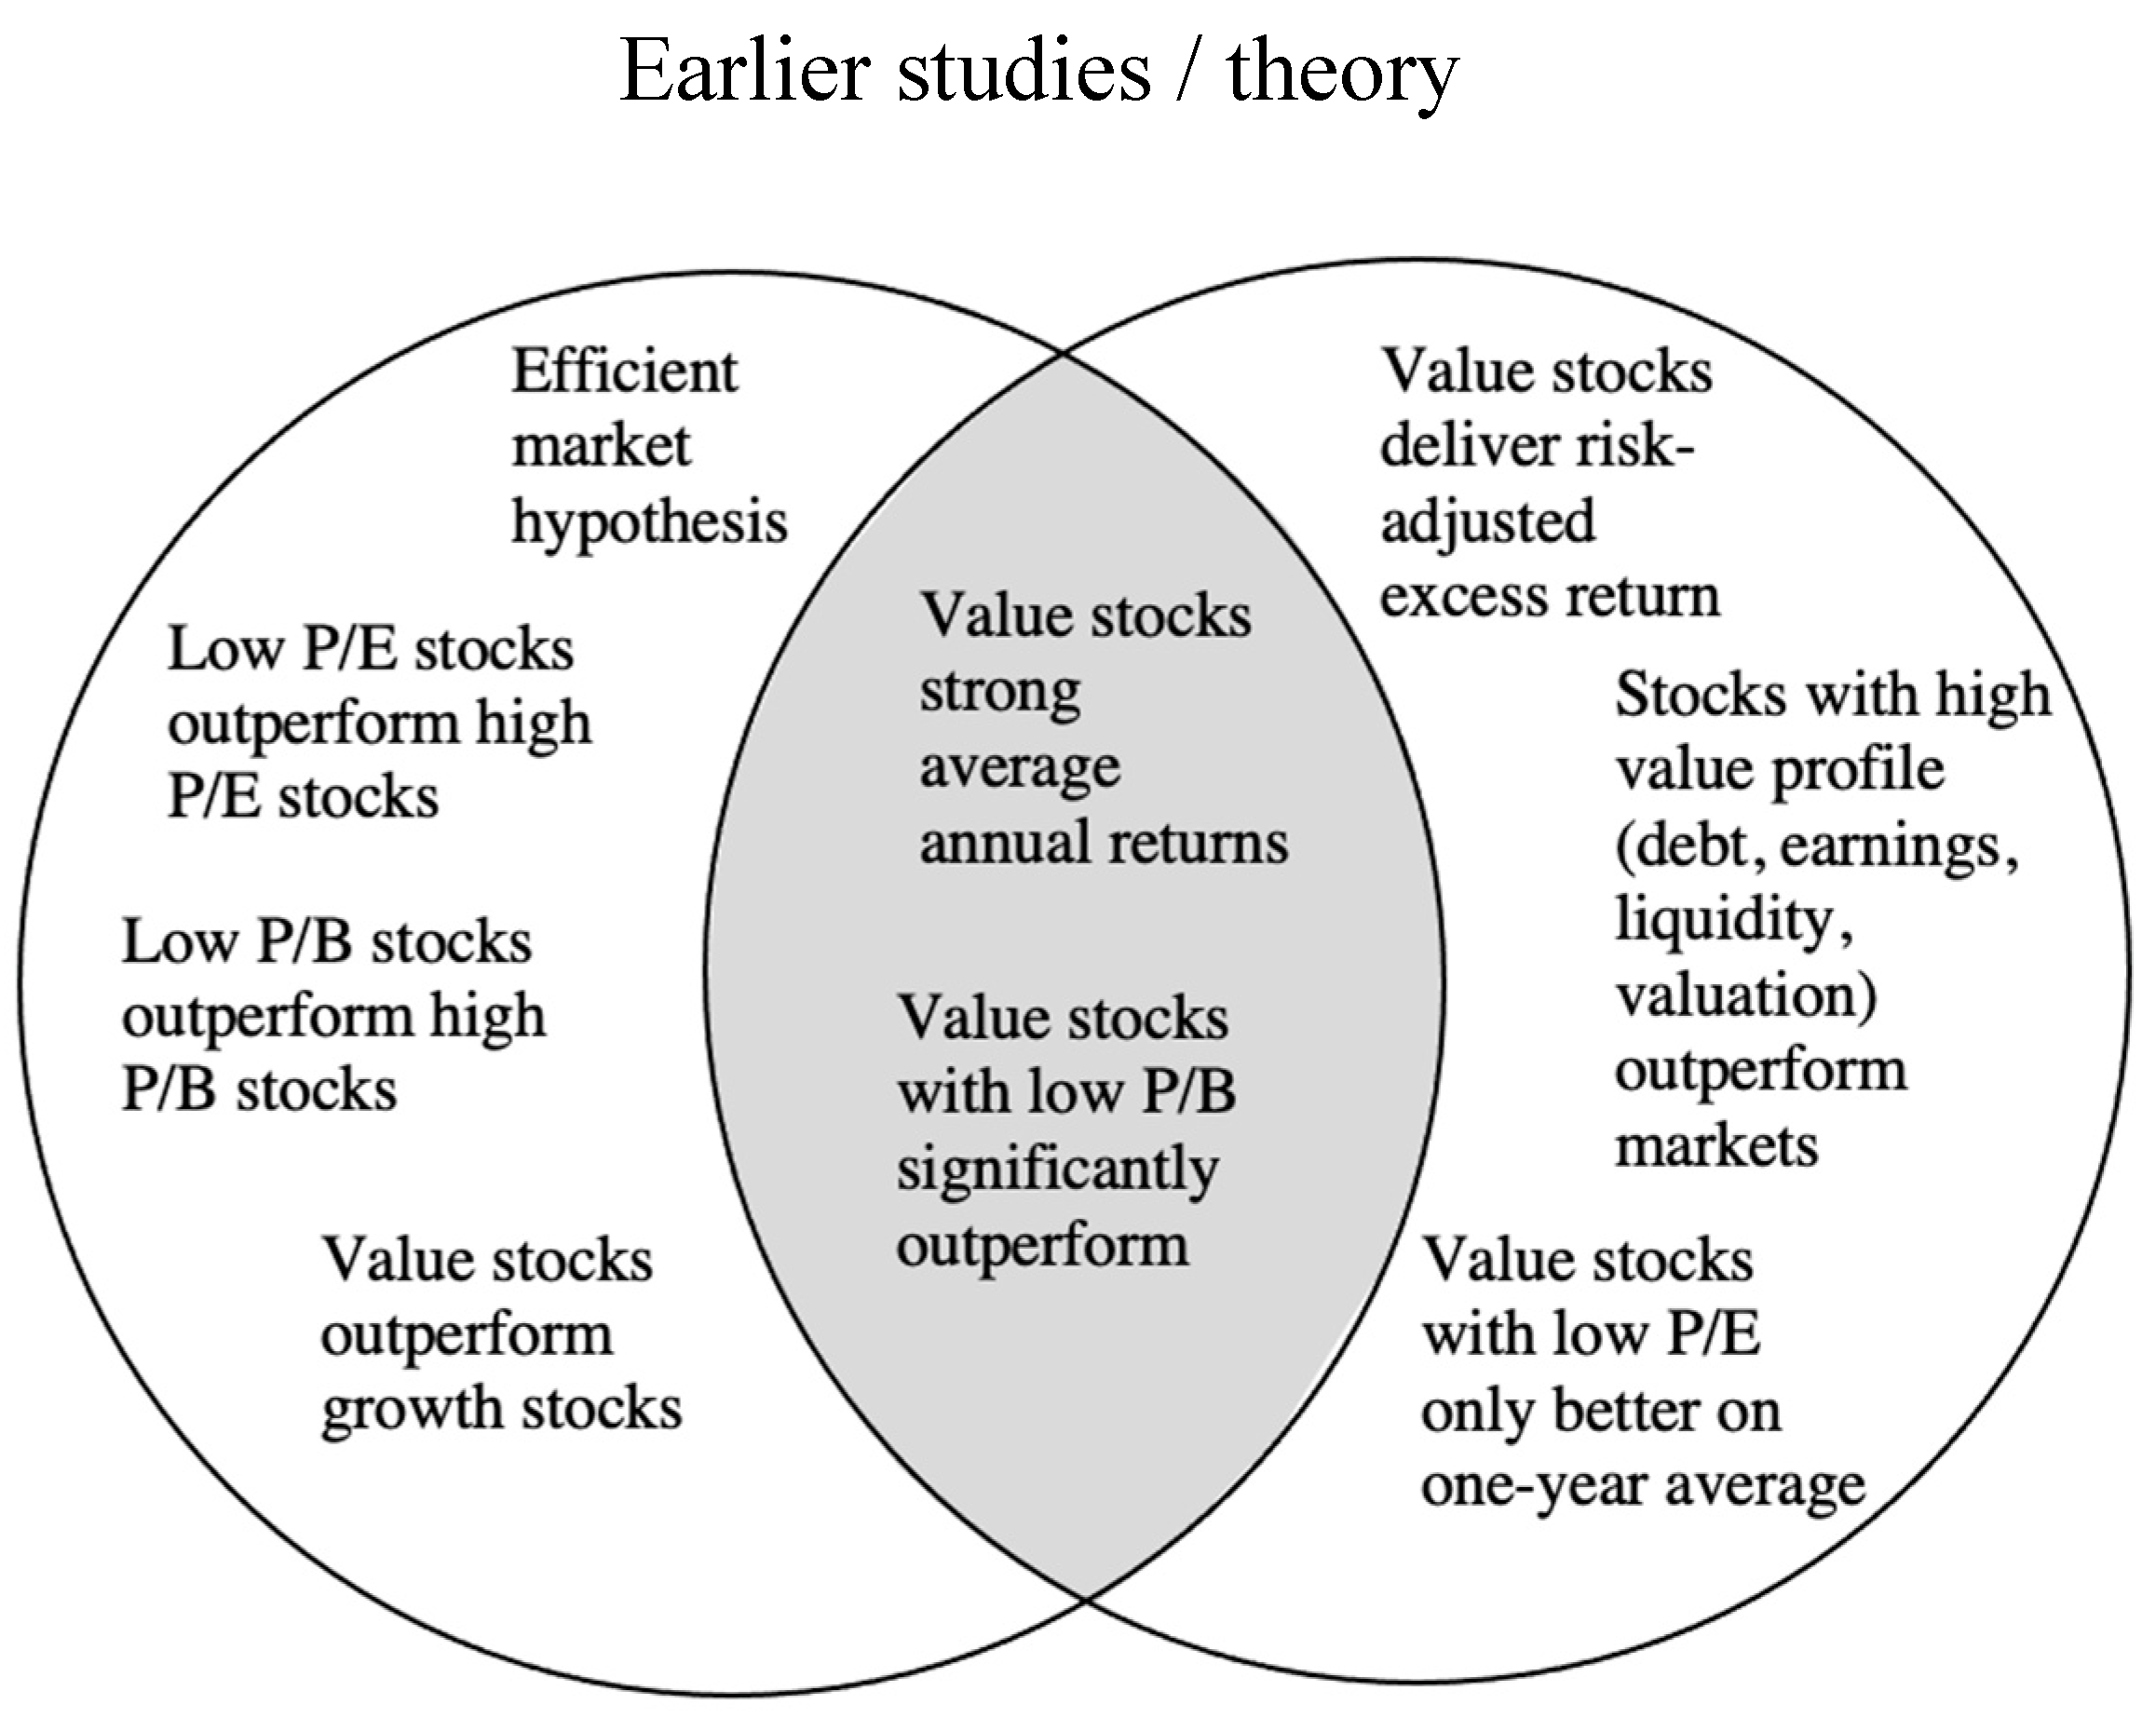
Figure 4 opposes the findings of earlier research with the results. The results in chapter three confirmed the findings from earlier studies by Lakonishok (1994), Bauman (1998), Cheng and Wang (2014) and An et al. (2017) that value stocks deliver an excess return on average after one year. One interesting and surprising finding is that value stocks provide a strong risk-adjusted excess return on average after three and five years. Even though value investing is a popular strategy, the findings assert that value stocks could potentially be anomalous. This study demonstrated that value stocks associated with a low P/E and low P/B ratio realized a significant excess return. This aligns with the claims of Basu (1977) and Fama and French (1992). However, by enhancing the investment horizon up to three and five years, this study finds that the value stocks with a low P/E ratio do not outperform stocks with a high P/E ratio. This result contradicts earlier findings from Basu (1977).
Moreover, this study discovered that value stocks especially provide a significant excess return after five years. This finding was unexpected and suggested that stocks with high-value patterns regarding liquidity, earnings, and leverage deliver a significant excess return in the long term. This could indicate that investors of value stocks get rewarded with a significant return in the long term. In addition, this study found that especially investors of value stocks with the applied screening and a low P/B ratio get rewarded with a significant positive return in the long run.
3.2. Spin-offs
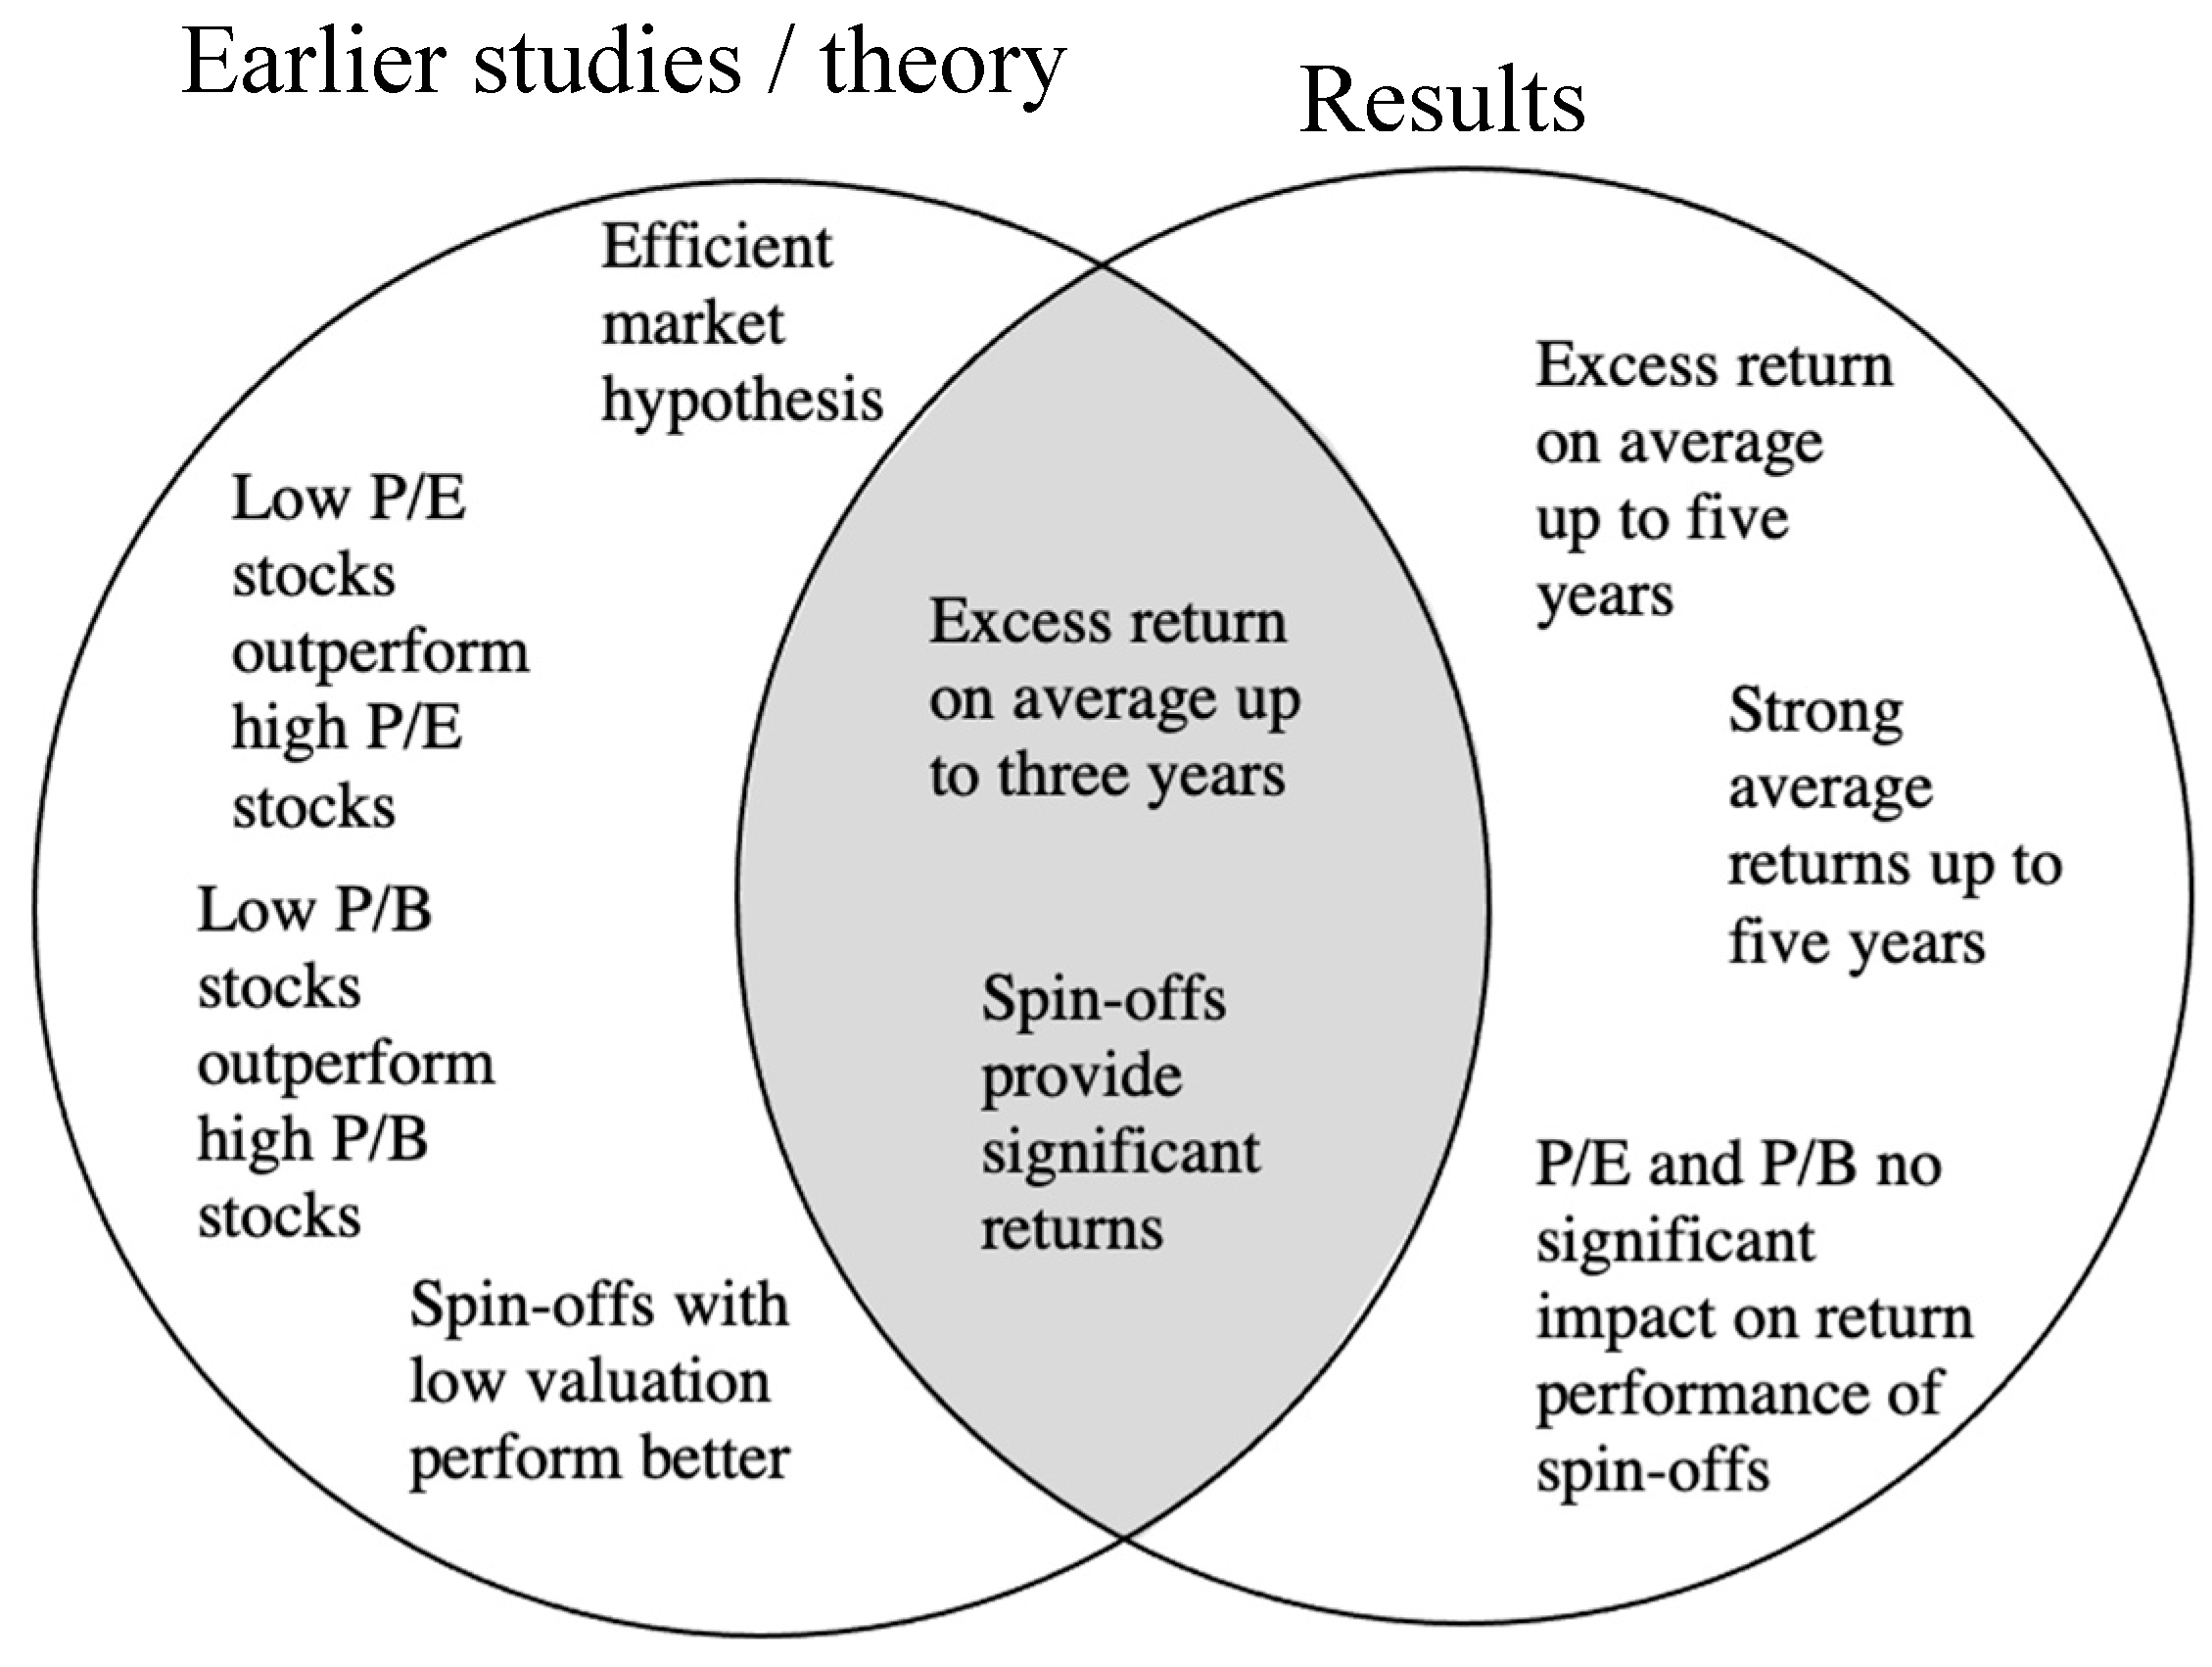
Furthermore, contrary to the general claims from Basu (1977) and Fama and French (1992) that stocks with a lower P/E or P/B realized a higher return, the results from portfolios A to H showed that spin-off stocks with a lower P/E or P/B ratio did not outperform spin-off stocks with a higher ratio, as mentioned in
Figure 5.
Lower P/E and P/B spin-offs might not outperform the higher ones since spin-offs are corporate transactions, whereas value stocks and turnarounds are based on financial metrics. Therefore, less attention might be given to the two multiples on the spin-off IPO day than the transaction. Another reason that spin-offs with a low P/E or P/B ratio could be that the market had not yet recognized the actual value of the spin-off entity on the IPO day. Therefore, the P/E and P/B ratios would not reflect the market participants’ estimates.
The insignificance of the valuation metric P/B on the returns of spin-offs contradicts the findings of Bülow and Mjörnemark (2019) that spin-offs with a lower valuation (captured with EV/EBIT or P/B) provide a superior return than spin-offs with a higher valuation.
3.3. Turnarounds with Low P/E or P/B
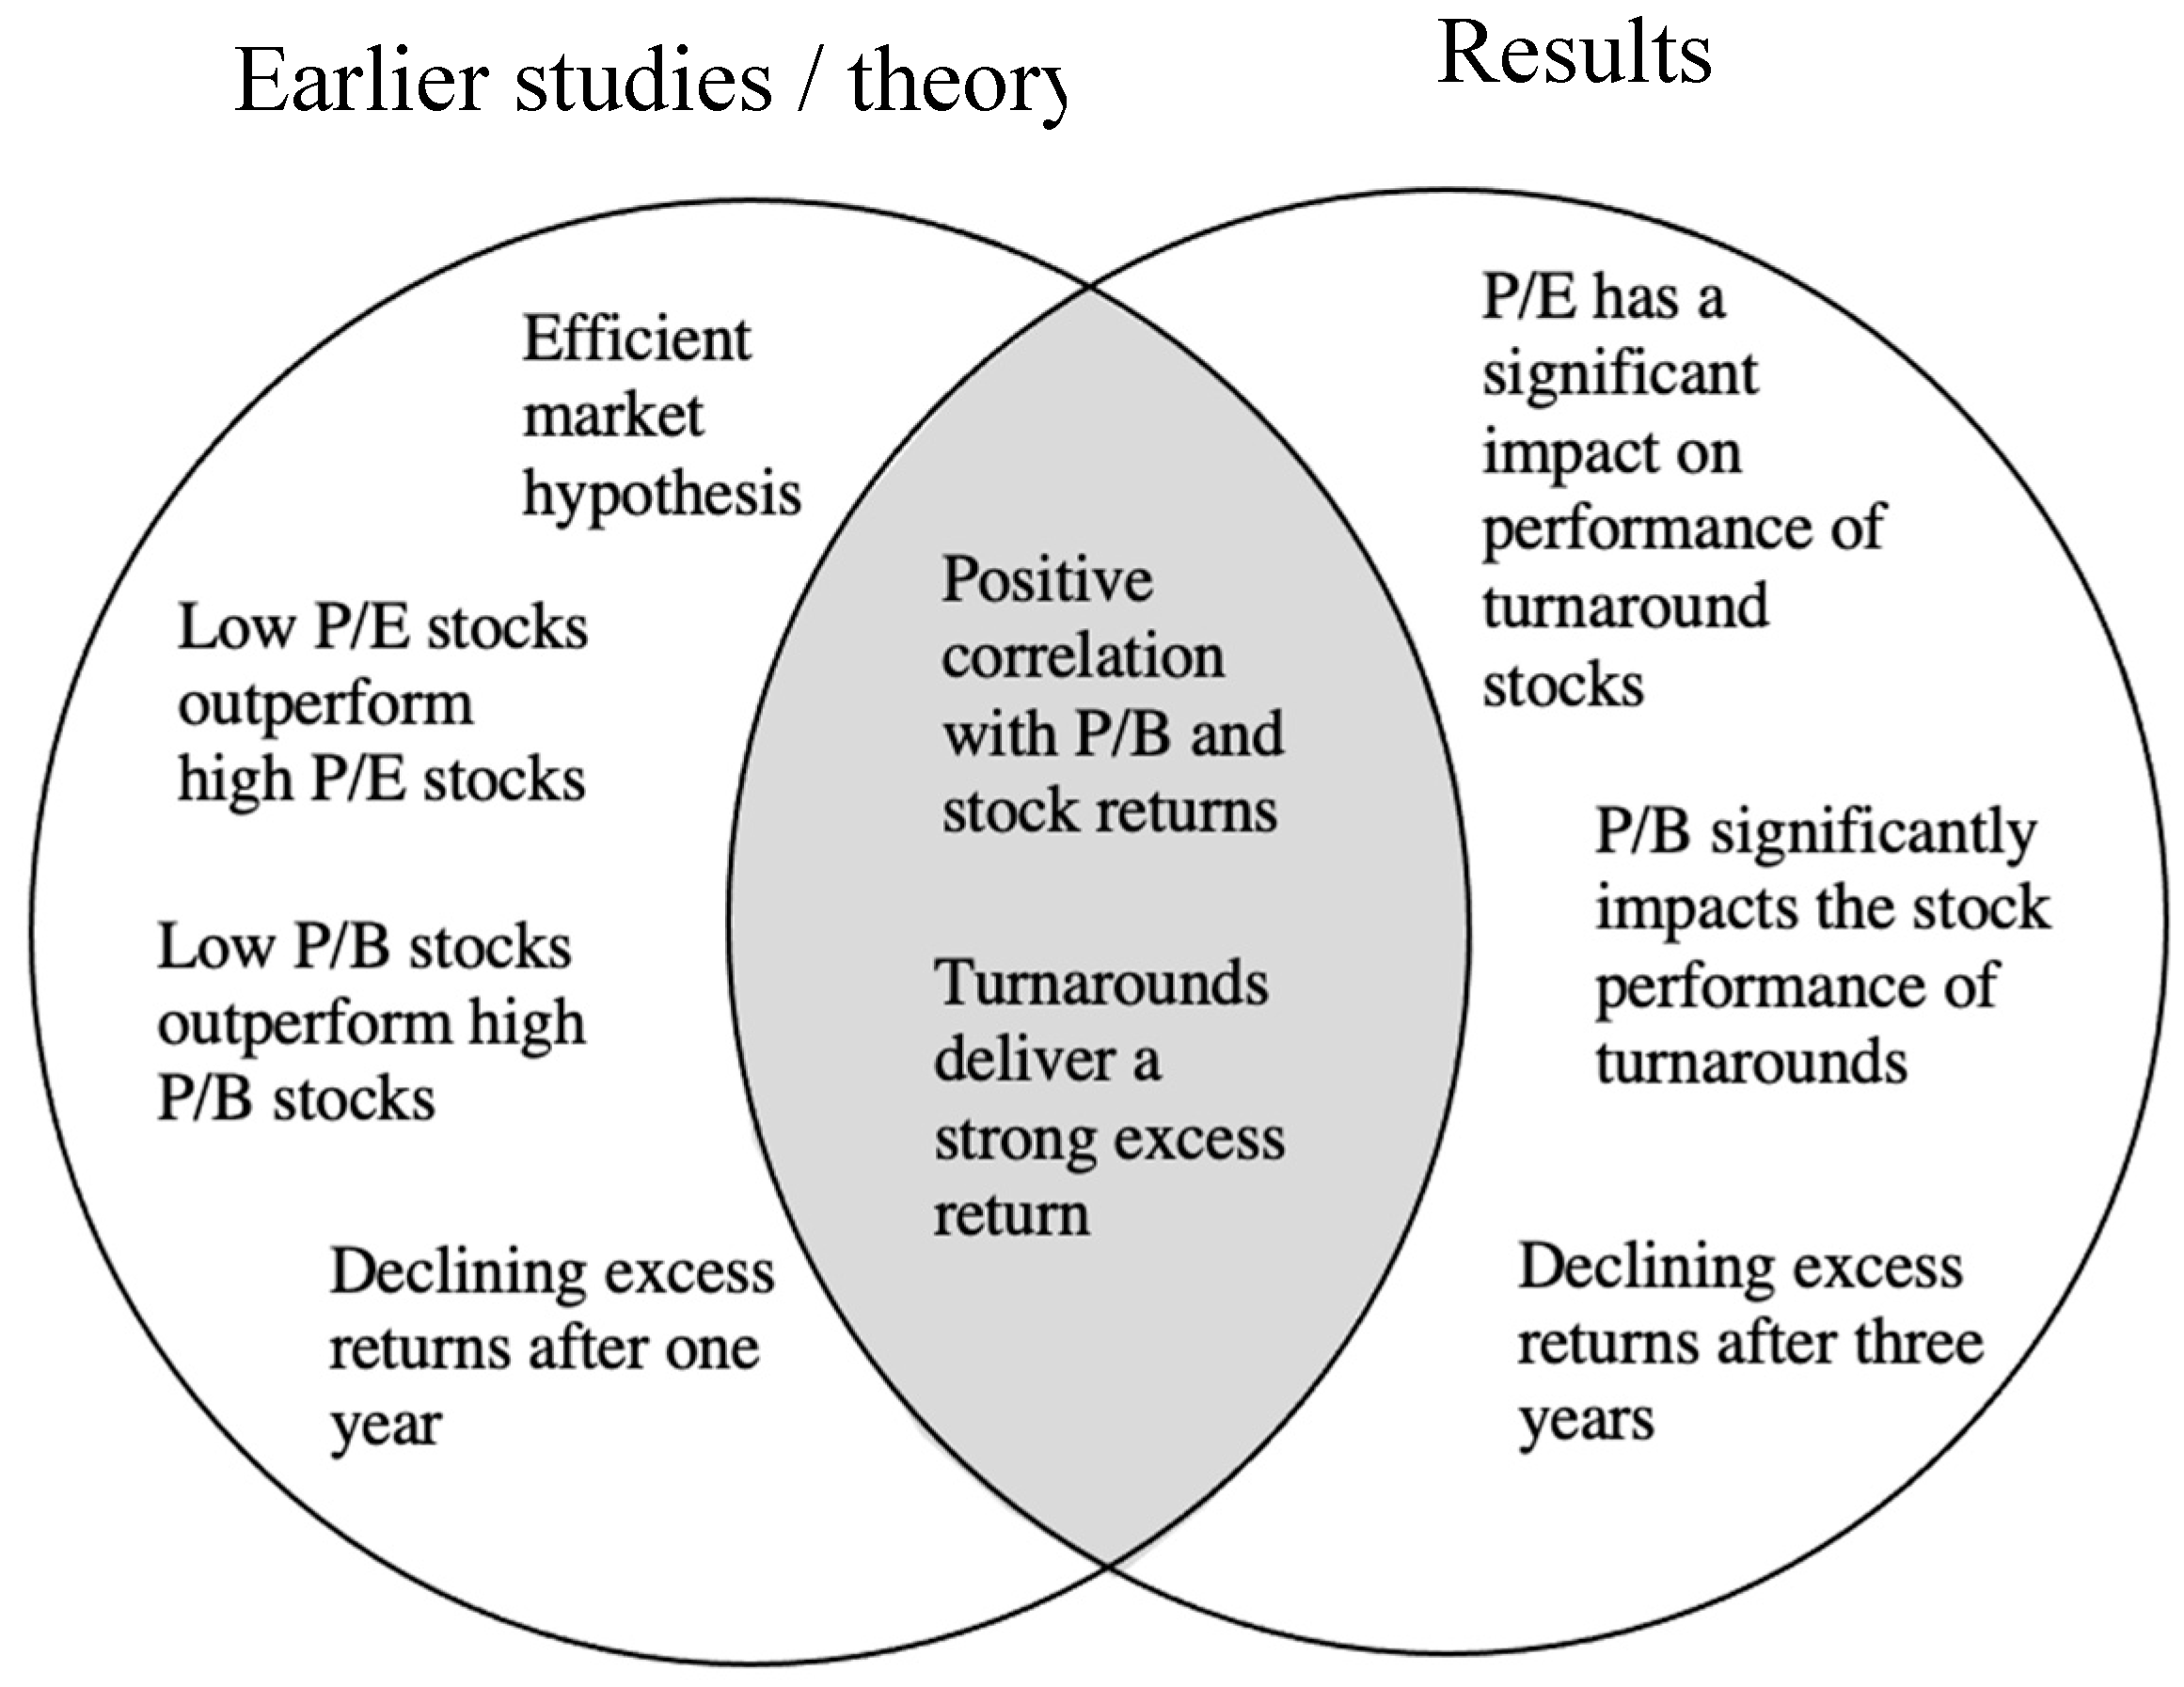
Figure 6 provides an overview of earlier studies and the results of this article regarding turnarounds. Turnaround stocks confirmed the strong excess return of earlier studies after one, three, and five years (Danielson and Dowdell 2001; Ciorogariu and Goumas 2011; Najera 2017). However, the extent of the excess return differs significantly from earlier research. This may arise since turnarounds are generally heterogeneous and different identification methods were applied in past research.
In particular, only Ciorogariu and Goumas (2011) applied Altman’s z-score and simultaneously investigated the performance of a successful turnaround portfolio. In contrast to Ciorogariu and Goumas (2011), this study showed a substantially higher average excess return of turnarounds after one year. Najera (2017) asserted that the return profile of turnaround stocks declines after one year of the turnaround event. In contrast, this article demonstrated that the return of turnaround stocks grows significantly from the one-year to the three-year return and fades after three years.
This result may be explained by the fact that a company’s turnaround process may be completed after three years of the timing of investment in this research, which would provide evidence of the reducing excess return growth. A possible explanation for the divergence of the results could be that the timing of investment in this research is not congruent with Najera (2017).
Nevertheless, the declining excess returns throughout the turnaround are intuitive and emphasize that it is a recovery process. Moreover, this article found evidence that turnaround stocks with a lower P/B ratio deliver a significantly higher return after three and five years than turnarounds stocks with a lower P/B ratio.
This confirms the assertion from Aharoni et al. (2013) that turnaround stocks have a negative relationship between stock returns and the P/B ratio (positive with B/M ratio). A further finding of this article was that turnarounds with a lower P/E ratio realize higher returns than turnarounds with a low P/E ratio after three and five years. Turnaround stocks confirmed Basu’s (1977) and Fama and French’s (1992) assertion that stocks with lower P/E or P/B ratios deliver a superior return. Hence, successful turnaround stocks with the lowest P/E and P/B ratios may constitute a profitable play for investors.
Overall, the results of turnaround stocks indicate that the EMH does not hold, and investors can substantially outperform the S&P 500 for up to five years. Therefore, it appears to be correct that anomalies exist with turnaround stocks, which confirms the claim of Stanley et al. (2001).
4. Materials and Methods
4.1. Data and sample
The data for this empirical study was retrieved from a major and reliable provider of financial data named Refinitiv. Contrary to earlier research, this article included global stocks in the sample. Most studies concentrated solely on the US market, whereas less attention was given to the European or Asian markets. In addition, the majority of studies have only focused on one or a few single regions. The analyzed stock data were collected from January 1, 2000, until December 31, 2019. A 20-year time period is more extended than most studies in the past and allowed for obtaining a higher sample size. Consistently for all investment plays, this article retrieved the historical total returns (over one, three, and five years), 3-year weekly beta, net income, total book capital, and market capitalization.
4.2. Value Stocks
Value stocks are often associated with a low P/E and P/B ratio. However, as this article analyzes the impact on the returns by applying the P/E and P/B ratios in a second step, it was impossible to use these multiples to screen value stocks. Therefore, this article applied a similar approach to Cheng and Wang (2014). Among other variables, they identified value stocks with the debt ratio, current ratio, gross profit margin, asset turnover, and return on assets, using applied profitability, leverage, cash flow, and liquidity measures for the identification process.
In the first step, this research screened stocks, which generally displayed a high value concerning liquidity, earnings, valuation, and leverage. Then, in the second step, P/E and P/B ratios were applied to the portfolio creation. A significant advantage of this method was that it considers various value aspects in the screening.
For an individual year, the sample included value stocks that showed in the previous year the following metrics: a market cap of over five billion USD, positive net income, cash ratio above one, debt/equity ratio below 150%, EV/EBITDA below ten and earnings quality country rank of above 80. This screening had a few rationales.
Firstly, small companies were excluded through the minimum market cap as they might not have a large trading volume. Secondly, net earnings had to be positive, as otherwise, calculating the P/E ratio would not have been possible. Thirdly, with a sufficient cash ratio and lower debt/equity ratio, a general level of security/value is perceived as the chances of financial distress are reduced. Moreover, the EV/EBITDA ratio is a primary valuation metric next to the P/E ratio. In comparison to the net earnings, EBITDA is not affected by taxes, capital structure, or depreciation of assets.
The Earnings Quality Model created by StarMine is a quantitative multi-factor approach that provides a percentile ranking of global stocks based on the sustainability of earnings. The ranking is scaled from zero to 100, whereas a country rank from 80 implies that the company displays more persistent and fundamental earnings than 80% of the companies in the country. Moreover, companies with high scores are more likely to outperform their benchmark (Refinitiv 2022).
However, there are limitations regarding this sample. Firstly, many companies, such as banks, were excluded through the leverage requirement in the screening as a high leverage ratio lies in the nature of their business. Secondly, the Earnings Quality Model did not include many companies between 2000-2005 with a score above 80. Therefore, to obtain a sample in those years, this screening metric was not applied in this period.
4.3. Spin-offs
This article included spin-off transactions that were announced between January 2000 and December 2019. In order to increase the sample, announced spin-off transactions in 2019 but effective in 2020 was added to the 2019 sample. The effective date refers to the date when the entire spin-off transaction was completed and effective. Many studies have focused simultaneously on the returns of the parent company and spin-off subsidiary. However, this article only analyzed the returns of spin-off subsidiaries. Moreover, this research considered only transactions with a rank value inclusive net debt of target above 1.5 billion USD. The rank value inc. net debt of target is a common figure in merger and acquisition transactions and is calculated as follows (Thomas Reuters 2022):
Refinitiv only provides a rank value inc. net debt of the transaction when information regarding the company’s balance sheet is available and the deal value was publicly disclosed. By applying the rank value inc. net debt of target above 1.5 billion USD, only larger spin-off transactions were included in the sample. The sample covered a total of 131 global spin-offs. Among others included in the sample, notable prominent spin-off subsidiaries were AbbVie Inc, Philipp Morris International Inc, PayPal Holdings Inc, and Mondelez International Inc. There are a few limitations regarding this sample.
Firstly, this article only considered companies with positive net earnings in the first year after the IPO, as positive net earnings were required to obtain a P/E ratio. Therefore, companies with negative financial results were not included.
Secondly, numerous spin-off transactions had to be removed from the initial sample. This is because either financial data was unavailable in the Refinitiv database, the companies had negative earnings, or they were delisted in years following the spin-off transaction. The delistings resulted from a merger, acquisition by another company, bankruptcy, or privatization by taking publicly listed companies from the stock exchange. Financial data from delisted companies are challenging to obtain and frequently unavailable. Hence, this research removed these companies from the sample.
4.4. Turnarounds
Data regarding turnarounds are difficult to compile. It is not uniquely defined what characteristics turnarounds experience. Moreover, no databank provides successful companies that emerged from Chapter 11 in the US. However, like in previous studies regarding bankruptcy and turnaround firms, this article applied the Altman z-score from Altman (1968) (Morse and Shaw 1988; Griffin and Lemmon 2002; Agarwal and Taffler 2008; Ciorogariu and Goumas 2011). Altman’s z-score is based on the five financial measures: profitability, leverage, liquidity, solvency, and activity, and is commonly used to determine whether a manufacturing firm is likely to go bankrupt within the next two years (Altman 1968). Oehninger et al. (2020) designed and investigated an early warning system to avoid a corporate downfall and concluded that the z-score is a reliable indicator of a possible crisis for a company.
According to Altman (2000), the z-score has a prediction accuracy between 82% and 94% one year prior to failure, and 68% to 75% two years prior to failure. Following the formula of Altman’s z-score:
Where:
X1 = working capital / total assets
X2 = retained earnings / total assets
X3 = EBIT / total assets
X4 = market value of equity / total liabilities
X5 = sales / total assets
A score closer to zero implies that a company tends to head towards bankruptcy, whereas a score of three or above indicates financial health. Companies with a z-score below 1.80 are considered financially distressed. Between a score of 1.80 and 2.99 lies the grey zone and above 2.99 is the safe zone. As the z-score is only calculated on an annual basis, the turnaround process of companies was explained over four years. This article defined distressed firms with a z-score below 1.80 in four consecutive years. On the other hand, successful turnaround firms outlined a z-score below 1.80 in two consecutive years, followed by a z-score of above 1.8 in the third year and above 2.99 in year four.
Table 9 summarizes the z-score patterns of failed and successful turnarounds.
This article considered only turnarounds with a positive net income and company market cap of over one billion USD in year three of the turnaround process. This research applied these metrics in year three of the turnaround process as this year determined the timing of investment. Consequently, only turnarounds with a positive net income were included in order to obtain the P/E ratio. This might restrict the sample. Furthermore, a positive net income emphasized the turnaround process, as the Altman z-score not automatically assumes a positive net income, with a z-score above 1.80 respectively 2.99. Companies with missing financial data in Refinitiv were excluded from the sample. This screening resulted in a total sample of 118 turnarounds.
4.5. Calculations of Return
For each investment play, the holding period return (HPR) was calculated as if an investor pursued a passive investment strategy over the investment horizons. Most studies have focused on the returns on the announcement day of a corporate transaction or long-term returns up to three years after time t.
Therefore, this article extended the examined return period to five years after the investment date. Hence, the HPR of t + one year, t + three years, and t + five years were calculated for the three investment plays. T represents the investment point, which was different for each investment play. The HPR includes value appreciation plus investment income (dividends) for the specified period and is calculated as follows (Bodie et al. 2017):
Alternatively formulated:
t = year
D = dividends
Refinitiv defined HPR as the total return in a period. The total return compounded the returns daily and calculated the paid dividends in the period as a reinvestment in the security. Each investment return was benchmarked against the S&P 500 index. This index was applied since it is a well-diversified index regarding industries and only companies with a minimum market cap of 11.8 billion USD are included (S&P Global 2021). Overall, the S&P 500 constitutes one of the most critical global stock indices. Moreover, since most identified stocks in the data sample appeared from the US, it was rational to apply a US benchmark.
4.6. Capital Asset Pricing Model
This article applied the average annual 30-year US treasury bond rate between 2000 and 2019 of 3.84% as the risk-free rate. The 30-year US treasury bond rate had substantially declined over the investigated period between 2000 and 2019. Therefore, it made sense to use the average bond rate over the 20 years. Moreover, the model did not include a country risk premium for companies outside the US since a substantial part of the sample of each investment play were US companies listed on a US stock exchange.
4.7. Portfolio Structures
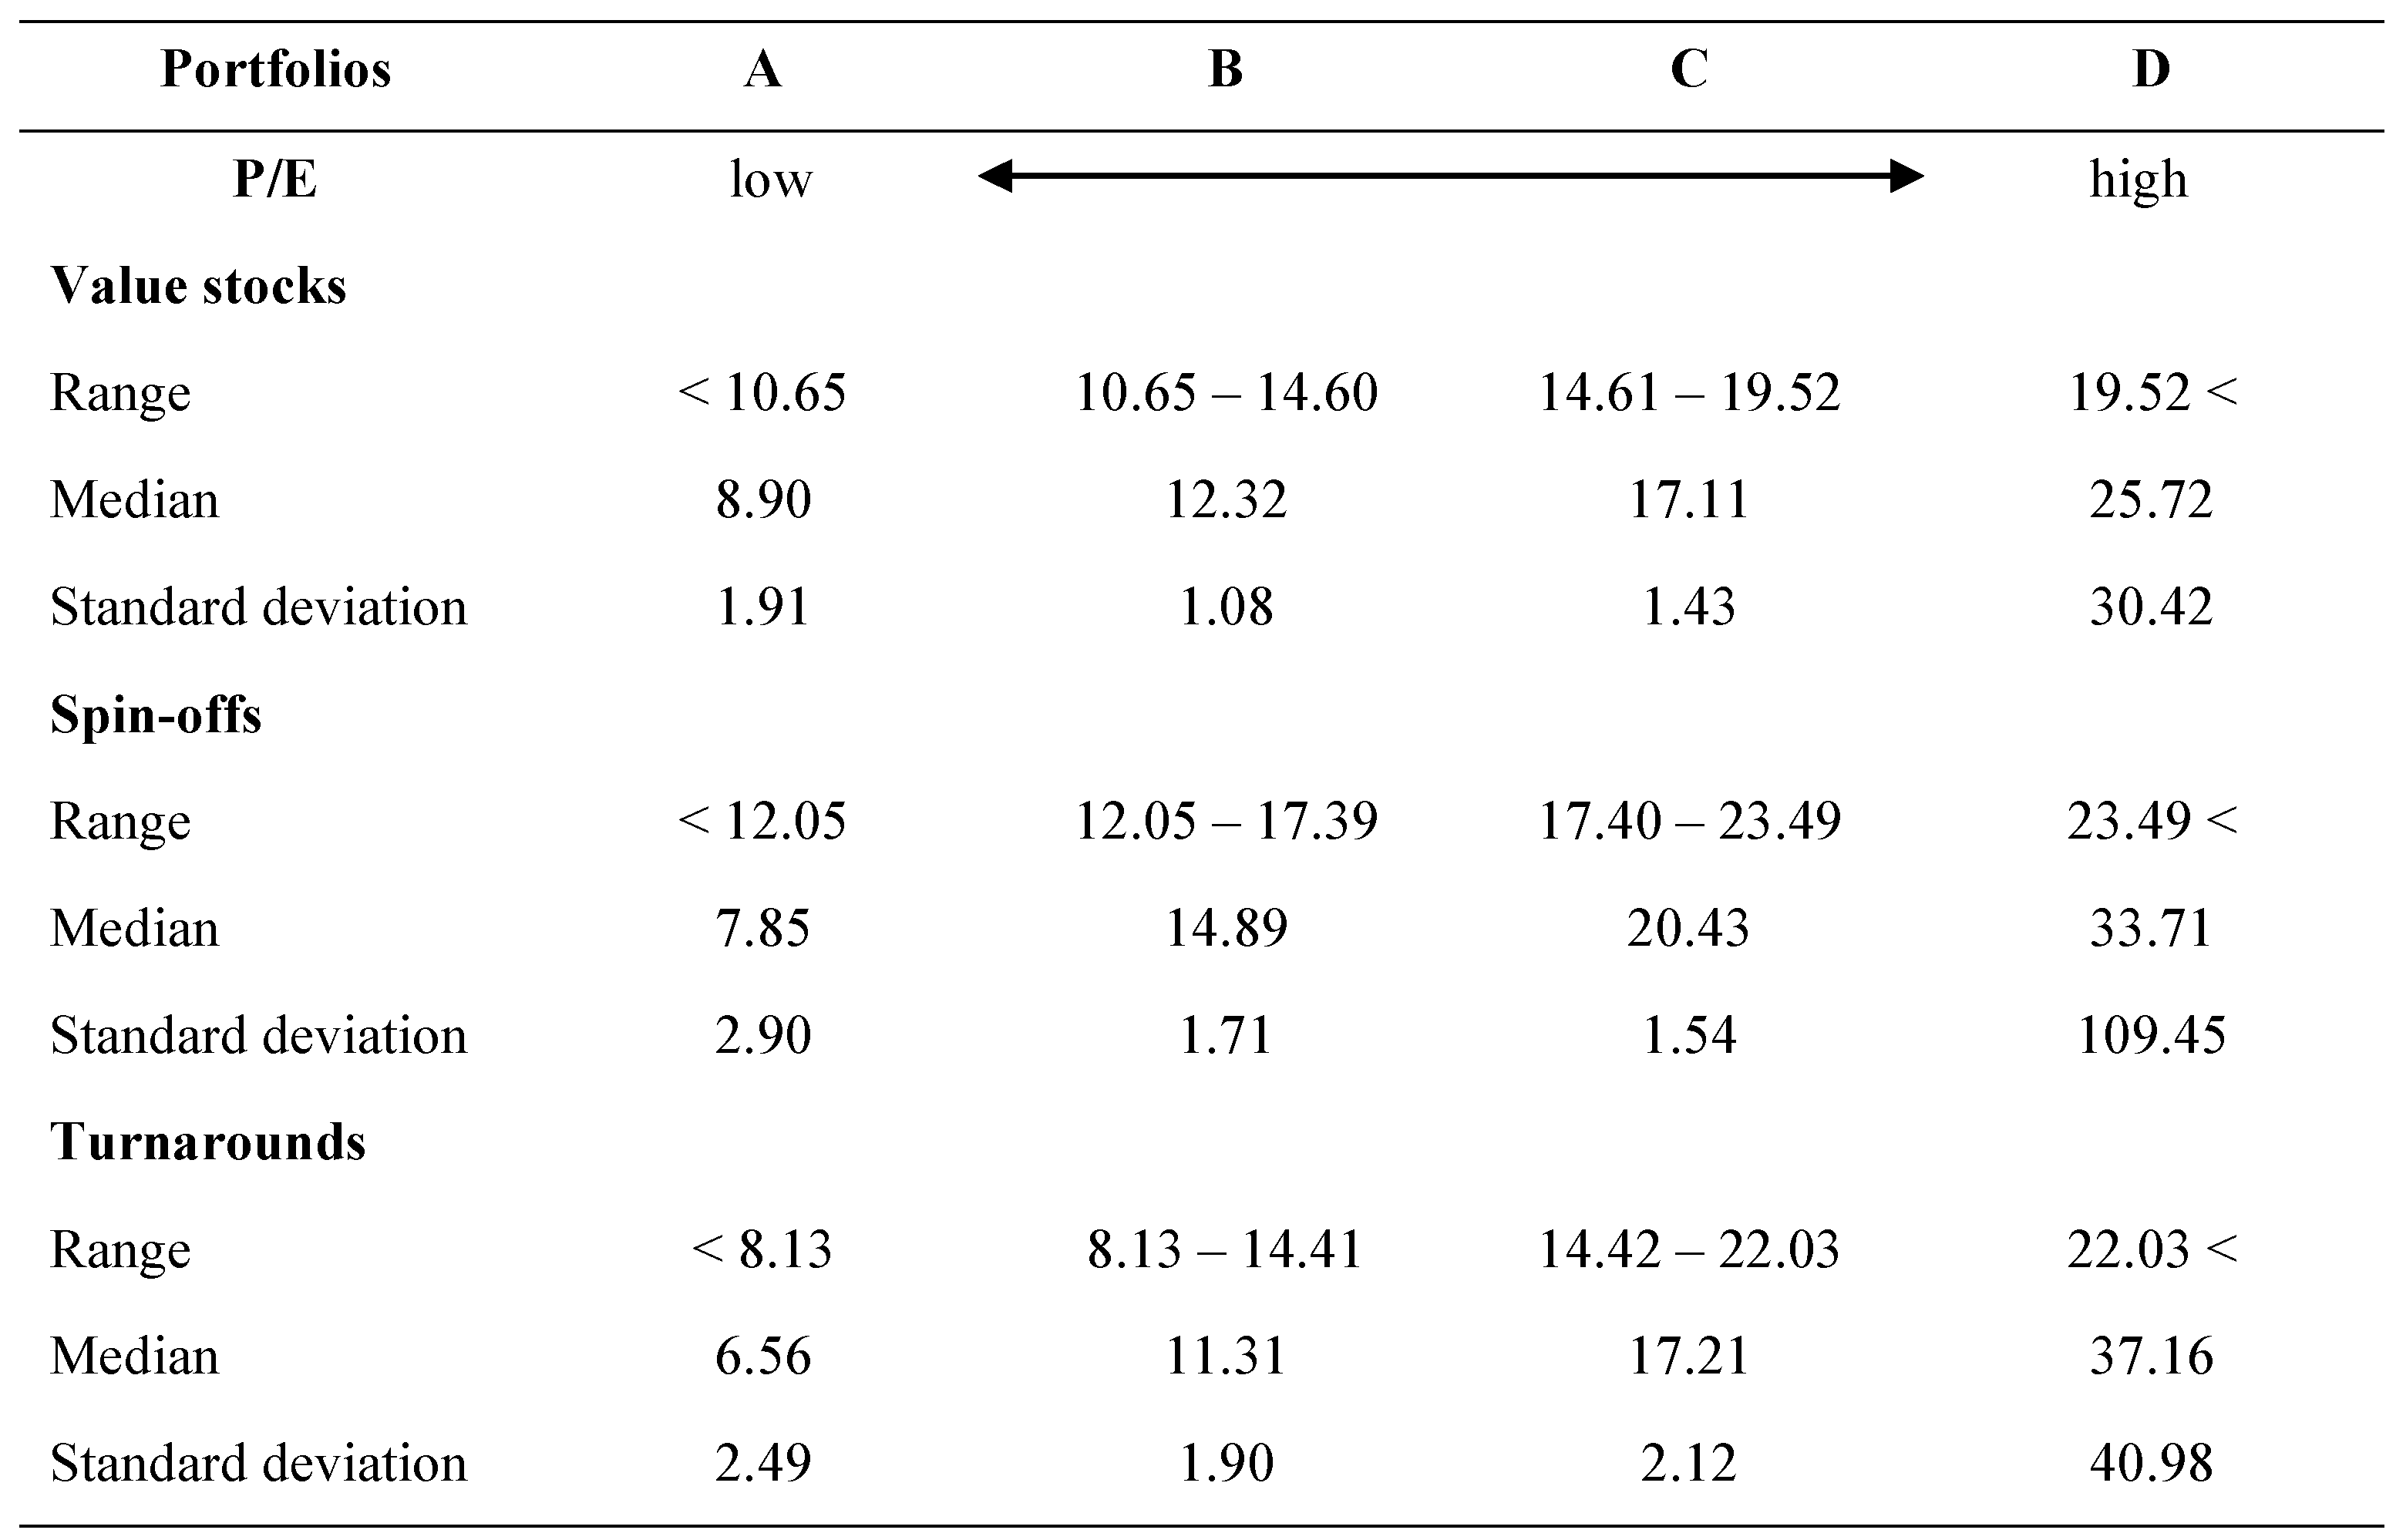
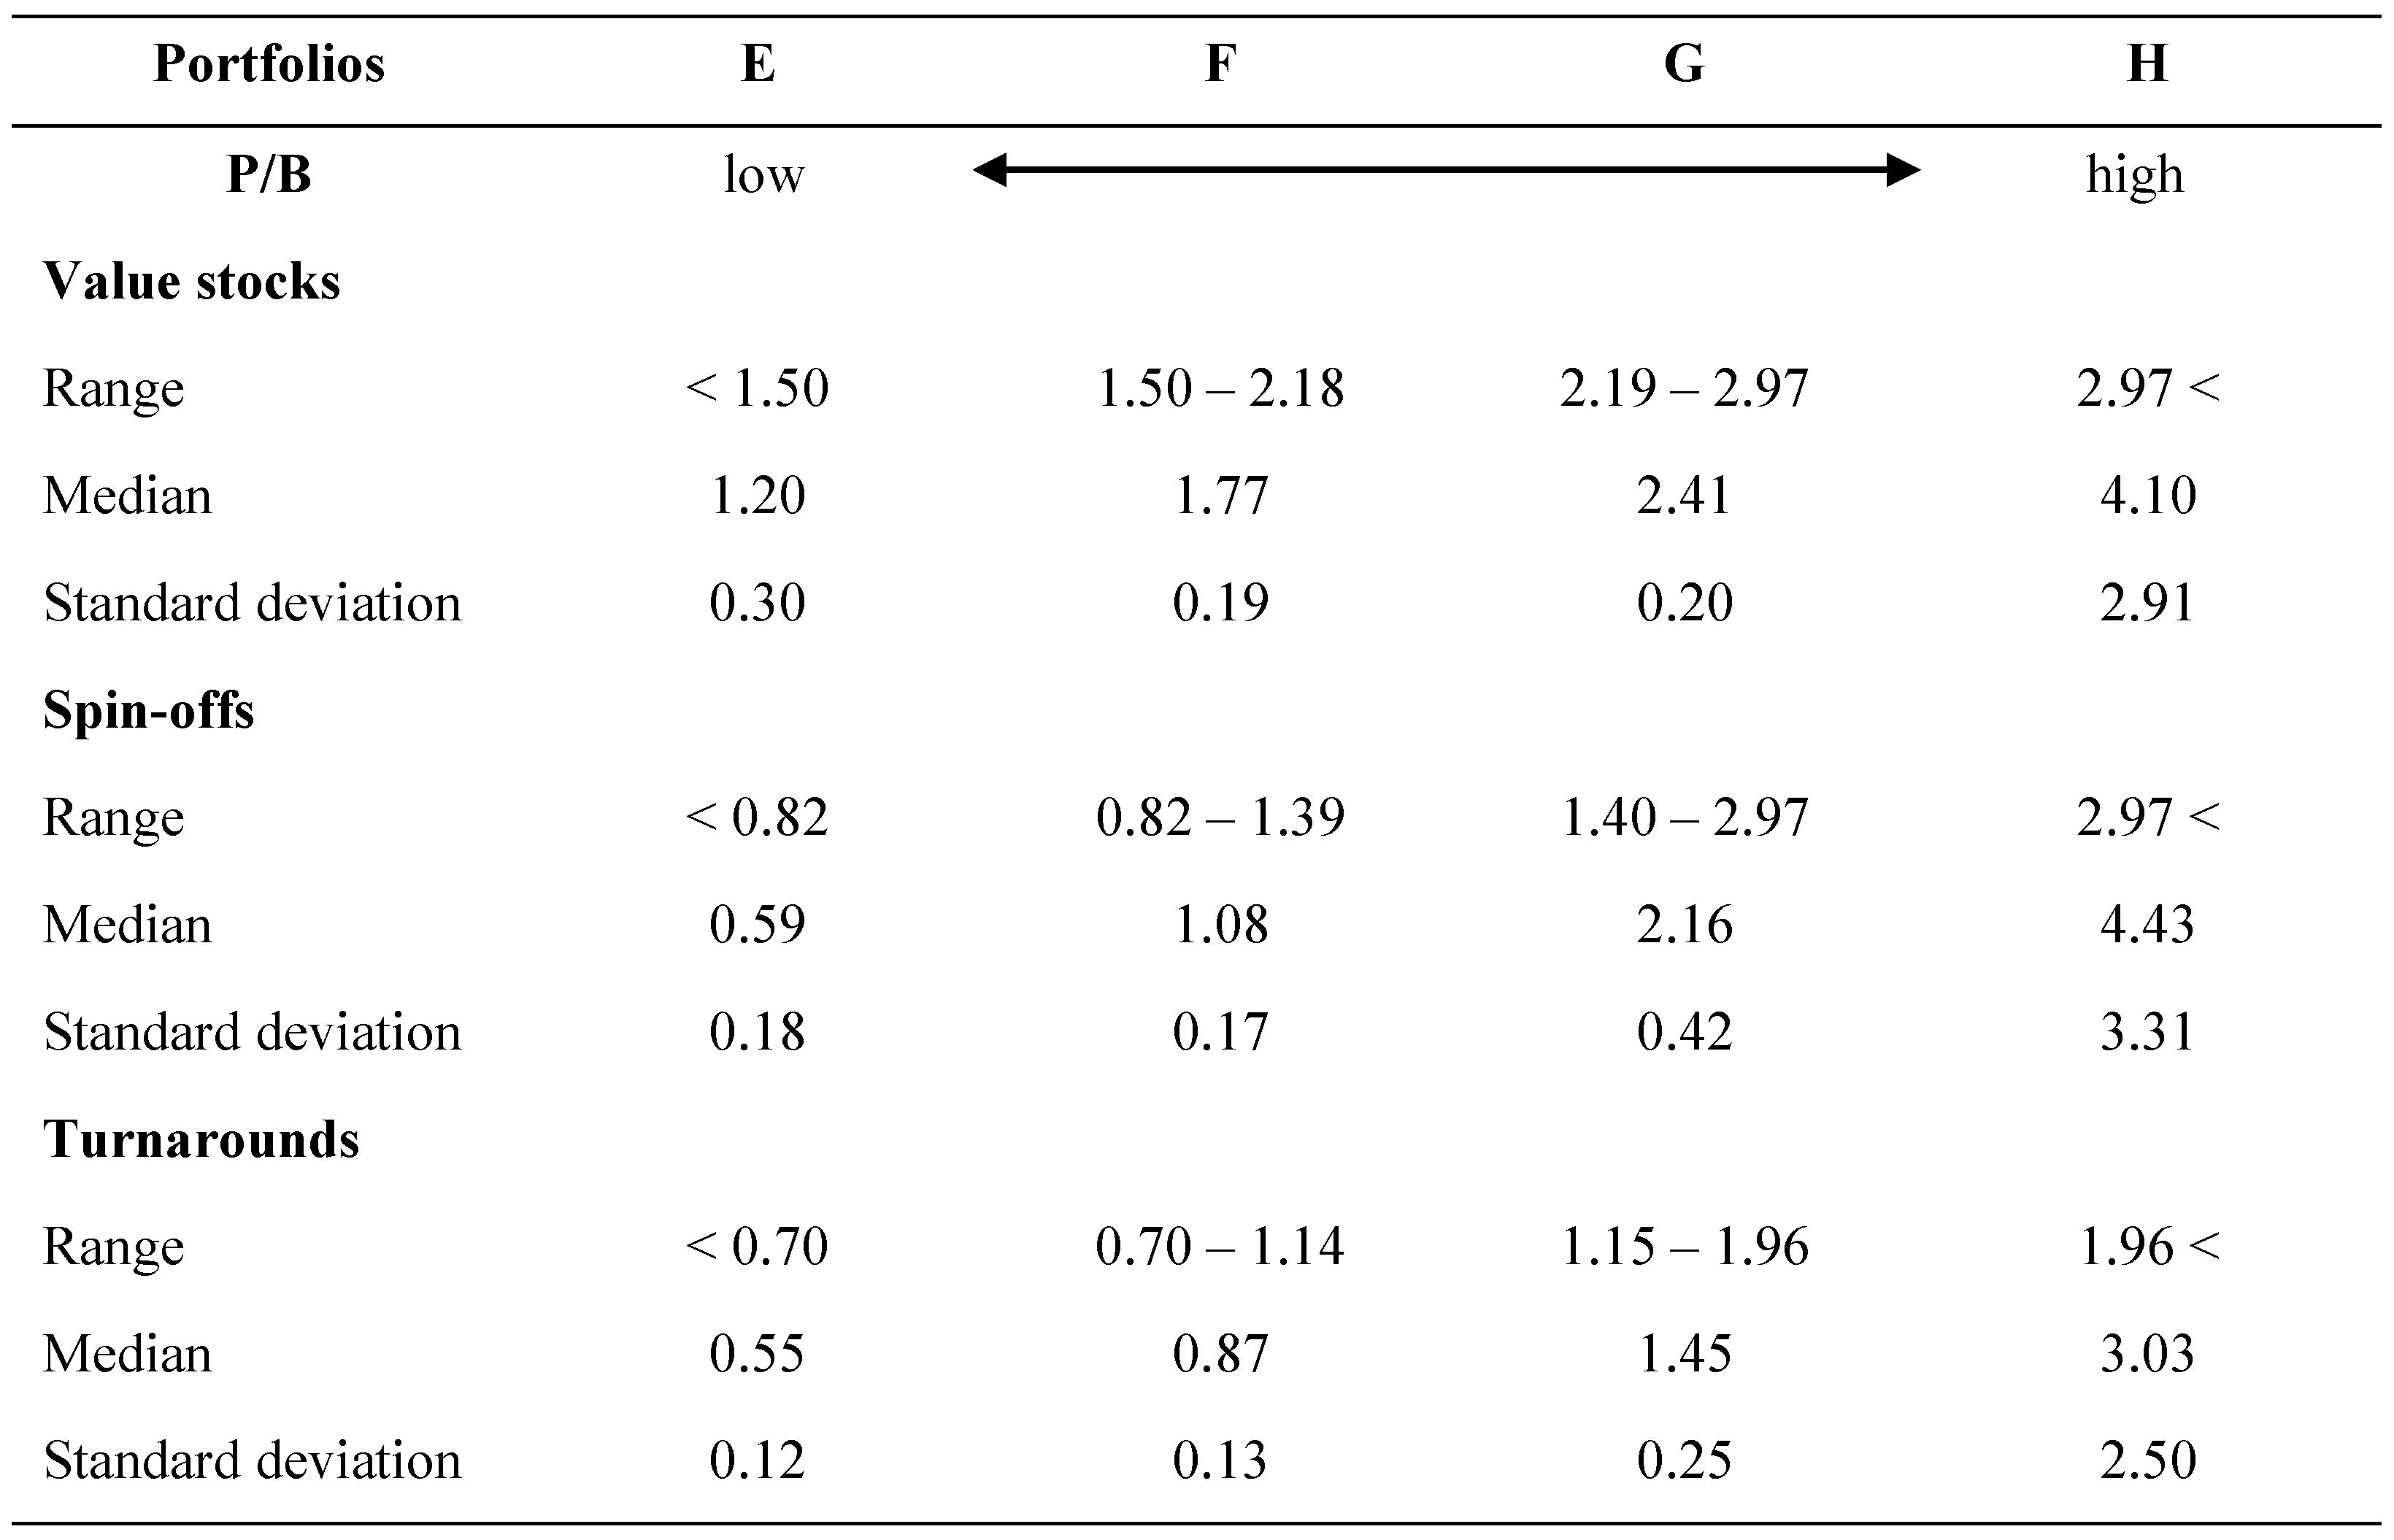
In order to see whether stocks with lower P/E or P/B ratios of each investment play provide a superior return compared to stocks with higher ratios, this research constructed eight portfolios with the letter A-H. Portfolios A–D distinguished themselves with the P/E ratio and portfolios E–H with the P/B ratio. Within a portfolio and investment play, each stock from the data sample was equally-weighted.
Table 10 shows the categorized portfolios A–D, constructed based on the P/E ratios. The 25%-/75%-quartile and median P/E ratios were used to group the portfolios.
Therefore, each portfolio from A–D contained 25% of the obtained sample of each investment play. The stocks with the lowest 25% of P/E ratios of each investment play were held in Portfolio A, and Portfolio D included the stocks with the highest 25% P/E ratios. Of the stocks outside of the US, the majority were listed on a stock exchange in a well-developed country. Therefore, the countries’ risks were neglected.
Even though P/E ratios strongly vary among industries, there were no further adjustments regarding the portfolio construction. Each investment play had several strong outliners with P/E ratios above 100. Hence, the standard deviation for the Portfolio D of each investment play was substantially higher than in Portfolios A–C. A P/E ratio below 15 is considered cheap as a rule of thumb.
Notably, besides value stocks, over 50% of the turnaround stocks had a P/E ratio of below 15. This confirms the claim from Kotak Securities (2022) that turnaround stocks frequently encounter cheap valuations regarding the P/E ratio.
Table 11 shows the portfolios E–H, constructed with the same procedure and data sample as A–D. Each portfolio included 25% of the data of each investment play, allocated due to the P/B ratio. Whereas Portfolio E included the stocks with the lowest 25% of P/B ratios of each investment play, Portfolio H contained the stocks with the highest 25% of P/B ratios.
Turnaround stocks had the lowest P/B ratios, which again confirms the assertion from Kotak Securities (2022) that undervaluation concerning the P/B ratio is typical. Additionally, the three investment plays also had outliners with P/B ratios above five, which significantly increased the standard deviation of portfolio H for each investment play.
5. Conclusions
The goal of the current research was to determine whether the three investment plays outperform the S&P 500. The second aim of this article was to investigate the effects of the P/E and P/B ratios on the returns of each investment play. This study has demonstrated that value stocks, spin-offs, and turnarounds outperform the S&P 500 on average on a one-, three- and five-year investment horizon. The analysis of the three investment plays confirmed earlier studies that investment plays constitute a profitable investment opportunity. In addition, this research exemplified that private investors could achieve an excess return (alpha) through a passive buy-and-hold investment strategy. Overall, this article provided a deeper insight into the long-term performance of value stocks, spin-offs, and turnarounds.
One of the most significant findings to emerge from this study is that the P/E and P/B ratios strongly impact the return of turnarounds and value stocks. However, the P/E and P/B ratios did not impact the performance of spin-offs. Additionally, the success of each investment play contradicts the EMH. Firstly, investors would be able to outperform the market by simply investing in these stocks, which concludes that markets tend to be not efficient. Secondly, investors could utilize the P/E and P/B ratios to achieve a superior investment performance in value stocks and turnarounds. This counters the semi-strong form of the EMH.
However, the joint-hypothesis problem introduced by Fama (1991) remains, which constitutes a major limitation of this study. It is not clear whether the abnormal returns resulted from an inefficient market or a flawed asset pricing model. Therefore, there is no clear evidence that stock markets are efficient or inefficient. This article applied the CAPM, a widely applied concept in financial research.
The CAPM includes the beta-factor, hence the systematic risk of a security or portfolio. However, there might be additional risks that were not captured in the CAPM. This would explain the strong abnormal returns. Further limitations apply to the turnaround stocks. This study showed the hypothetical possible return that private investors can achieve by investing after year two of the turnaround point. As the z-score increased in the years three and four, it was clear that it was a successful turnaround. However, after year two, investors do not know whether the Altman z-score will increase after the timing of investment.
Nevertheless, predictability models regarding turnaround probability with a high success rate exist, as Ciorogariu and Goumas (2011) demonstrated. Therefore, combining an accurate predictability model with the turnaround timing would create a process that investors could realistically apply. More importantly, it would enable investors to exploit the strong HPRs of turnaround stocks.
Additionally, each investment play had individual stocks which performed exceptionally well, with an HPR of 500% or above after five years. Therefore, it could be argued that individual stocks strongly carry the excess return of each investment play. The application of logarithmic returns could partially solve this issue, as the return calculation of positive and negative returns is symmetric. However, to reduce this limitation, the median returns of each investment play were still well above the returns of the S&P 500.
In general, this article demonstrated that stocks still constitute a solid investment opportunity for private investors and asset managers who follow a long-term passive investment strategy in a well-diversified portfolio. Moreover, even though stock markets are more competitive nowadays and much more data is processed, it seems that overlooked opportunities still exist for investors. Then one of the main questions that remains is if the three investment plays lead to a better investment performance, why has the market not yet recognized the superiority of those opportunities.
Funding
This research received no external funding.
Conflicts of Interest
The authors declare no conflict of interest.
References
- (Aranceta-Bartrina 1999a) Aranceta-Bartrina, Javier. 1999a. Title of the cited article. Journal Title 6: 100–10.
- (Aranceta-Bartrina 1999b) Aranceta-Bartrina, Javier. 1999b. Title of the chapter. In Book Title, 2nd ed. Edited by Editor 1 and Editor 2. Publication place: Publisher, vol. 3, pp. 54–96.
- (Baranwal and Munteanu [1921] 1955) Baranwal, Ajay K., and Costea Munteanu. 1955. Book Title. Publication place: Publisher, pp. 154–96. First published 1921 (optional).
- (Berry and Smith 1999) Berry, Evan, and Amy M. Smith. 1999. Title of Thesis. Level of Thesis, Degree-Granting University, City, Country. Identification information (if available).
- (Cojocaru et al. 1999) Cojocaru, Ludmila, Dragos Constatin Sanda, and Eun Kyeong Yun. 1999. Title of Unpublished Work. Journal Title, phrase indicating stage of publication.
- (Driver et al. 2000) Driver, John P., Steffen Röhrs, and Sean Meighoo. 2000. Title of Presentation. In Title of the Collected Work (if available). Paper presented at Name of the Conference, Location of Conference, Date of Conference.
- Altman, E. I. (1968). Financial Ratios, Discriminant Analysis and the Prediction of Corporate Bankruptcy. Journal of Finance 23(4): 589–609.
- Altman, E. I. (2000). Predicting Financial Distress of Companies: Revisiting the Z-Score and Zeta. New York: New York University, Center for Law and Business.
- Ammann et al. (2012). Is there really no conglomerate discount?. Journal of Business Finance & Accounting 39(1-2): 264–288.
- An et al. (2017). Do Value Stocks Outperform Growth Stocks in the U.S. Stock Market?. Journal of Applied Finance and Banking 7(2): 99–112.
- Banz, R. W. (1981). The Relationship between Return and Market Value of Common Stocks. Journal of Financial Economics 9(1): 3–18.
- Basu, S. (1977). Investment Performance of Common Stocks in Relation to Their Price-Earnings Ratios: A Test of the Efficient Market Hypoarticle. Journal of Finance 32(3), 663–682.
- Bauman, W. S. et al. (1998). Growth versus Value and Large-Cap versus Small-Cap Stocks in International Markets. Financial Analysts Journal 54(2), 75–89.
- Bergh, D. D. et al. (2008). Restructuring through spin-off or sell-off: transforming information asymmetries into financial gain. Strategic Management Journal 29(2): 133–148.
- Bodie, Z. et al. (2017). Essentials of Investments. 10th edition. New York: McGraw-Hill.
- Bülow, S. and Mjörnemark, N. G. (2019). The Spinoff Scorecard: An Investment Strategy to Separate the Best Performing Spinoffs from the Worst (published Master’s Article). Copenhagen: Copenhagen Business School.
- Chan, L. K. C. et al. (1991). Fundamentals and Stock Returns in Japan. Journal of Finance 46(5): 1739–1764.
- Cheng, M. Y., and Wang, M. C. (2014). A Study of Value Investing: Profit, Dividend, and Free Cash Flow. International Review of Management and Business Research 3(4): 1889–1904.
- Ciorogariu, E. and Goumas, A. (2011). Turnarounds - Modeling the Probability of a Turnaround (published Master’s article). Lund: Lund University.
- Credit Suisse (2012, September 6). Quantitative Research: Do Spin-Offs Create or Destroy Value? Retrieved from https://research-doc.credit-suisse.com/docView?language=ENG&source=emfromsendlink&format=PDF&document_id=999089271&extdocid=999089271_1_eng_pdf&serialid=pvH393UArco6JvZIguX4cJ5jXWIkrqD%2Bb1l3MzX4YTI%3D.
- Cusatis, P. J. et al. (1993). Restructuring through spinoffs: The stock market evidence. Journal of Financial Economics 33(3): 293–311.
- Danielson, M. G. (2001). The Return-Stages Valuation Model and the Expectations within a Firm’s P/B and P/E Ratios. Financial Management: 93–124.
- Fama, E. F. (1970). Efficient Capital Markets: A Review of Theory and Empirical Work. Journal of Finance 25(2): 383–417.
- Fama, E. F. (1991). Efficient Capital Markets: II. Journal of Finance 46(5): 1575–1617.
- Fama, E. F., and French, K. R. (1992). The Cross-Section of Expected Stock Returns. Journal of Finance 47(2): 427–465.
- Fama, E. F., and French, K. R. (2004). The capital asset pricing model: Theory and evidence. Journal of economic perspectives 18(3): 25–46.
- Furrer, O., Pandian, J. R., and Thomas, H. (2007). Corporate strategy and shareholder value during decline and turnaround. Management Decision 45(3): 372–392.
- Graham, B., & Dodd, D. (1934). Security Analysis. 1st Edition. New York: McGraw-Hill.
- Griffin, J. M., and Lemmon, M. L. (2002). Book-to-Market Equity, Distress Risk, and Stock Returns. Journal of Finance 58(5): 2317–2336.
- Jensen, M. C. (1968). The Performance of Mutual Funds in the Period 1945-1964. Journal of Finance 23(2): 389–416.
- Jensen, M. C. (1978). Some anomalous evidence regarding market efficiency. Journal of Financial Economics 6(2/3): 95–101.
- J.P. Morgan (2015, June). Shrinking to grow: Evolving trends in corporate spin-offs. Retrieved from https://www.jpmorgan.com/content/dam/jpm/cib/complex/content/investment-banking/archive/pdf-56.pdf.
- Kendall, M. G., and Hill, A. B. (1953). The analysis of economic time-series-part i: Prices. Journal of the Royal Statistical Society. Series A (General), 116(1): 11–34. 1: A (General), 116(1).
- Kenton, W. (2021). Play. Retrieved from https://www.investopedia.com/terms/p/play.asp#:~:text=Play%20is%20a%20slang%20term%20that%20refers%20to%20an%20investor,outcome%20of%20the%20investment%20decision.
- Kotak Securities (2022, March 29). What are Turnaround Stocks?. Retrieved from https://www.kotaksecurities.com/ksweb/Meaningful-Minutes/What-are-turnaround-stocks. 29 March.
- Krishnaswami, S., and Subramaniam, V. (1999). Information asymmetry, valuation, and the corporate spin-off decision. Journal of Financial Economics, 53(1), 73–112.
- Lakonishok, J. et al. (1994). Contrarian Investment, Extrapolation, and Risk. Journal of Finance 49(5): 1541–1578.
- Lintner, J. (1965). The Valuation of Risk Assets and the Selection of Risky Investments in Stock Portfolios and Capital Budgets. Review of Economics and Statistics 47(1): 13–37.
- Lynch, P., and Rothchild, J. (1989). One Up on Wall Street. New York: Fireside.
- Majaski, C. (2021, January 5). Turnaround. Retrieved from https://www.investopedia.com/terms/t/turnaround.asp.
- Malkiel, B. G. (1973). A Random Walk Down Wall Street. 1st Edition. New York, W. W. Norton.
- Malkiel, B. G. (2005). Reflections on the Efficient Market Hypothesis: 30 Years Later. Financial Review 40(1): 1–9.
- Markowitz, H. (1959). Portfolio Selection: Efficient Diversification of Investments. Cowles Foundation for Research in Economics, Monograph No. 16. New York: John Wiley & Sons, Inc.
- McConnell, J., and Ovtchinnikov, A. (2004). Predictability of long-term spinoff returns. Journal of Investment Management 2(3): 35–44.
- McConnell, J. et al. (2015). The Stock Price Performance of Spin-Off Subsidiaries, Their Parents, and the Spin-Off ETF, 2001–2013. Journal of Portfolio Management 41(1): 143–152.
- Modigliani, F., and Modigliani, L. (1997). Risk-Adjusted Performance. Journal of Portfolio Management 23(2): 45–54.
- Morse, D., and Shaw. W. (1988). Investing in Bankrupt Firms. Journal of Finance 43(5): 1193–1206.
- Mossin, J. (1966). Equilibrium in a Capital Asset Market. Econometrica 34(4): 768–783.
- Najera, C. S. (2017, February 12). Wounded Wolves: Turnaround Stocks Quant Screening Backtesting. Retrieved from https://papers.ssrn.com/sol3/papers.cfm?abstract_id=2915958.
- Navatte, P., and Schier, G. (2017). Spin-offs: Accounting and financial issues across the literature. Accounting Auditing Control 23(1): 97–125.
- Oehninger, R. et al. (2020). Preventing Corporate Turnarounds through an Early Warning System. International Journal of Management, Knowledge and Learning 9(2): 185–2.
- Refinitiv (2022, Mai 4). StarMine Earnings Quality Model. Retrieved from https://www.refinitiv.com/en/financial-data/analytics/quantitative-analytics/starmine-earnings-quality.
- Sewel, M. (2011). A History of the Efficient Market Hypoarticle. Research Note RN/11/04. London: University College of London.
- Sharpe, W. F. (1964). Capital asset prices: A theory for market equilibrium under conditions of risk. Journal of Finance 19 (3), 425–442.
- Sharpe, W. F. (1994). The Sharpe Ratio. Journal of Portfolio Management 21(1): 49–58.
- S&P Global. (2021). S&P 500: The Gauge of the Market Economy. Retrieved from https://www.spglobal.com/spdji/en/documents/additional-material/sp-500-brochure.pdf.
- Stanley, D. J. et al. (2001). Turnaround growth portfolios and the inefficient stock market. International Advances in Economic Research 7(4): 507.
- Statista. (2022). Largest stock exchange operators worldwide as of March 2022, by market capitalization of listed companies. Retrieved from https://www.statista.com/statistics/270126/largest-stock-exchange-operators-by-market-capitalization-of-listed-companies/#:~:text=The%20New%20York%20Stock%20Exchange,What%20is%20a%20stock%20exchange%3F. 20 March.
- Thomas Reuters (2022, May 10). Definitions: Global New Issues. Retrieved from http://mergers.thomsonib.com/td/DealSearch/help/nidef.htm.
- Treynor, J. L. (1961). Market value, time, and risk. In Korajczyk, R. A. (Ed.): Asset pricing and portfolio performance: Model, strategy and performance metrics. London: Risk Books.
- Treynor, J. L. (1965). How to rate management of investment funds. Harvard business review 43(1): 63–75.
- Tübke, A. (2004). Success factors of corporate spin-offs. Springer Science + Business Media.
- UBS (2022, April 4). Glossary P. Retrieved from https://www.ubs.com/microsites/wma/insights/en/ols-glossary/p.html.
- Veld, C., & Veld-Merkoulova, Y. V. (2004). Do spin-offs really create value? The European case. Journal of Banking & Finance, 28(5), 1111–1135.
- Veld, C., & Veld-Merkoulova, Y. V. (2009). Value Creation Through Spin-Offs: A Review of the Empirical Evidence. International Journal of Management Review 11(4): 407–420.
|
Disclaimer/Publisher’s Note: The statements, opinions and data contained in all publications are solely those of the individual author(s) and contributor(s) and not of MDPI and/or the editor(s). MDPI and/or the editor(s) disclaim responsibility for any injury to people or property resulting from any ideas, methods, instructions or products referred to in the content. |
© 2023 by the authors. Licensee MDPI, Basel, Switzerland. This article is an open access article distributed under the terms and conditions of the Creative Commons Attribution (CC BY) license (http://creativecommons.org/licenses/by/4.0/).
