Submitted:
21 April 2023
Posted:
23 April 2023
You are already at the latest version
Abstract
Keywords:
1. Introduction
2. Materials and Methods
2.1. Tissue samples
2.2. Histological Staining
2.3. Immunolabeling
2.4. Proximity ligation assay (PLA)
2.4. Quantification and statistical analysis
3. Results
3.1. Tissue wounds induce endothelial cell activation and immune cell infiltration
3.2. Tissue damage results in the accumulation of M2 macrophages around the blood vessel
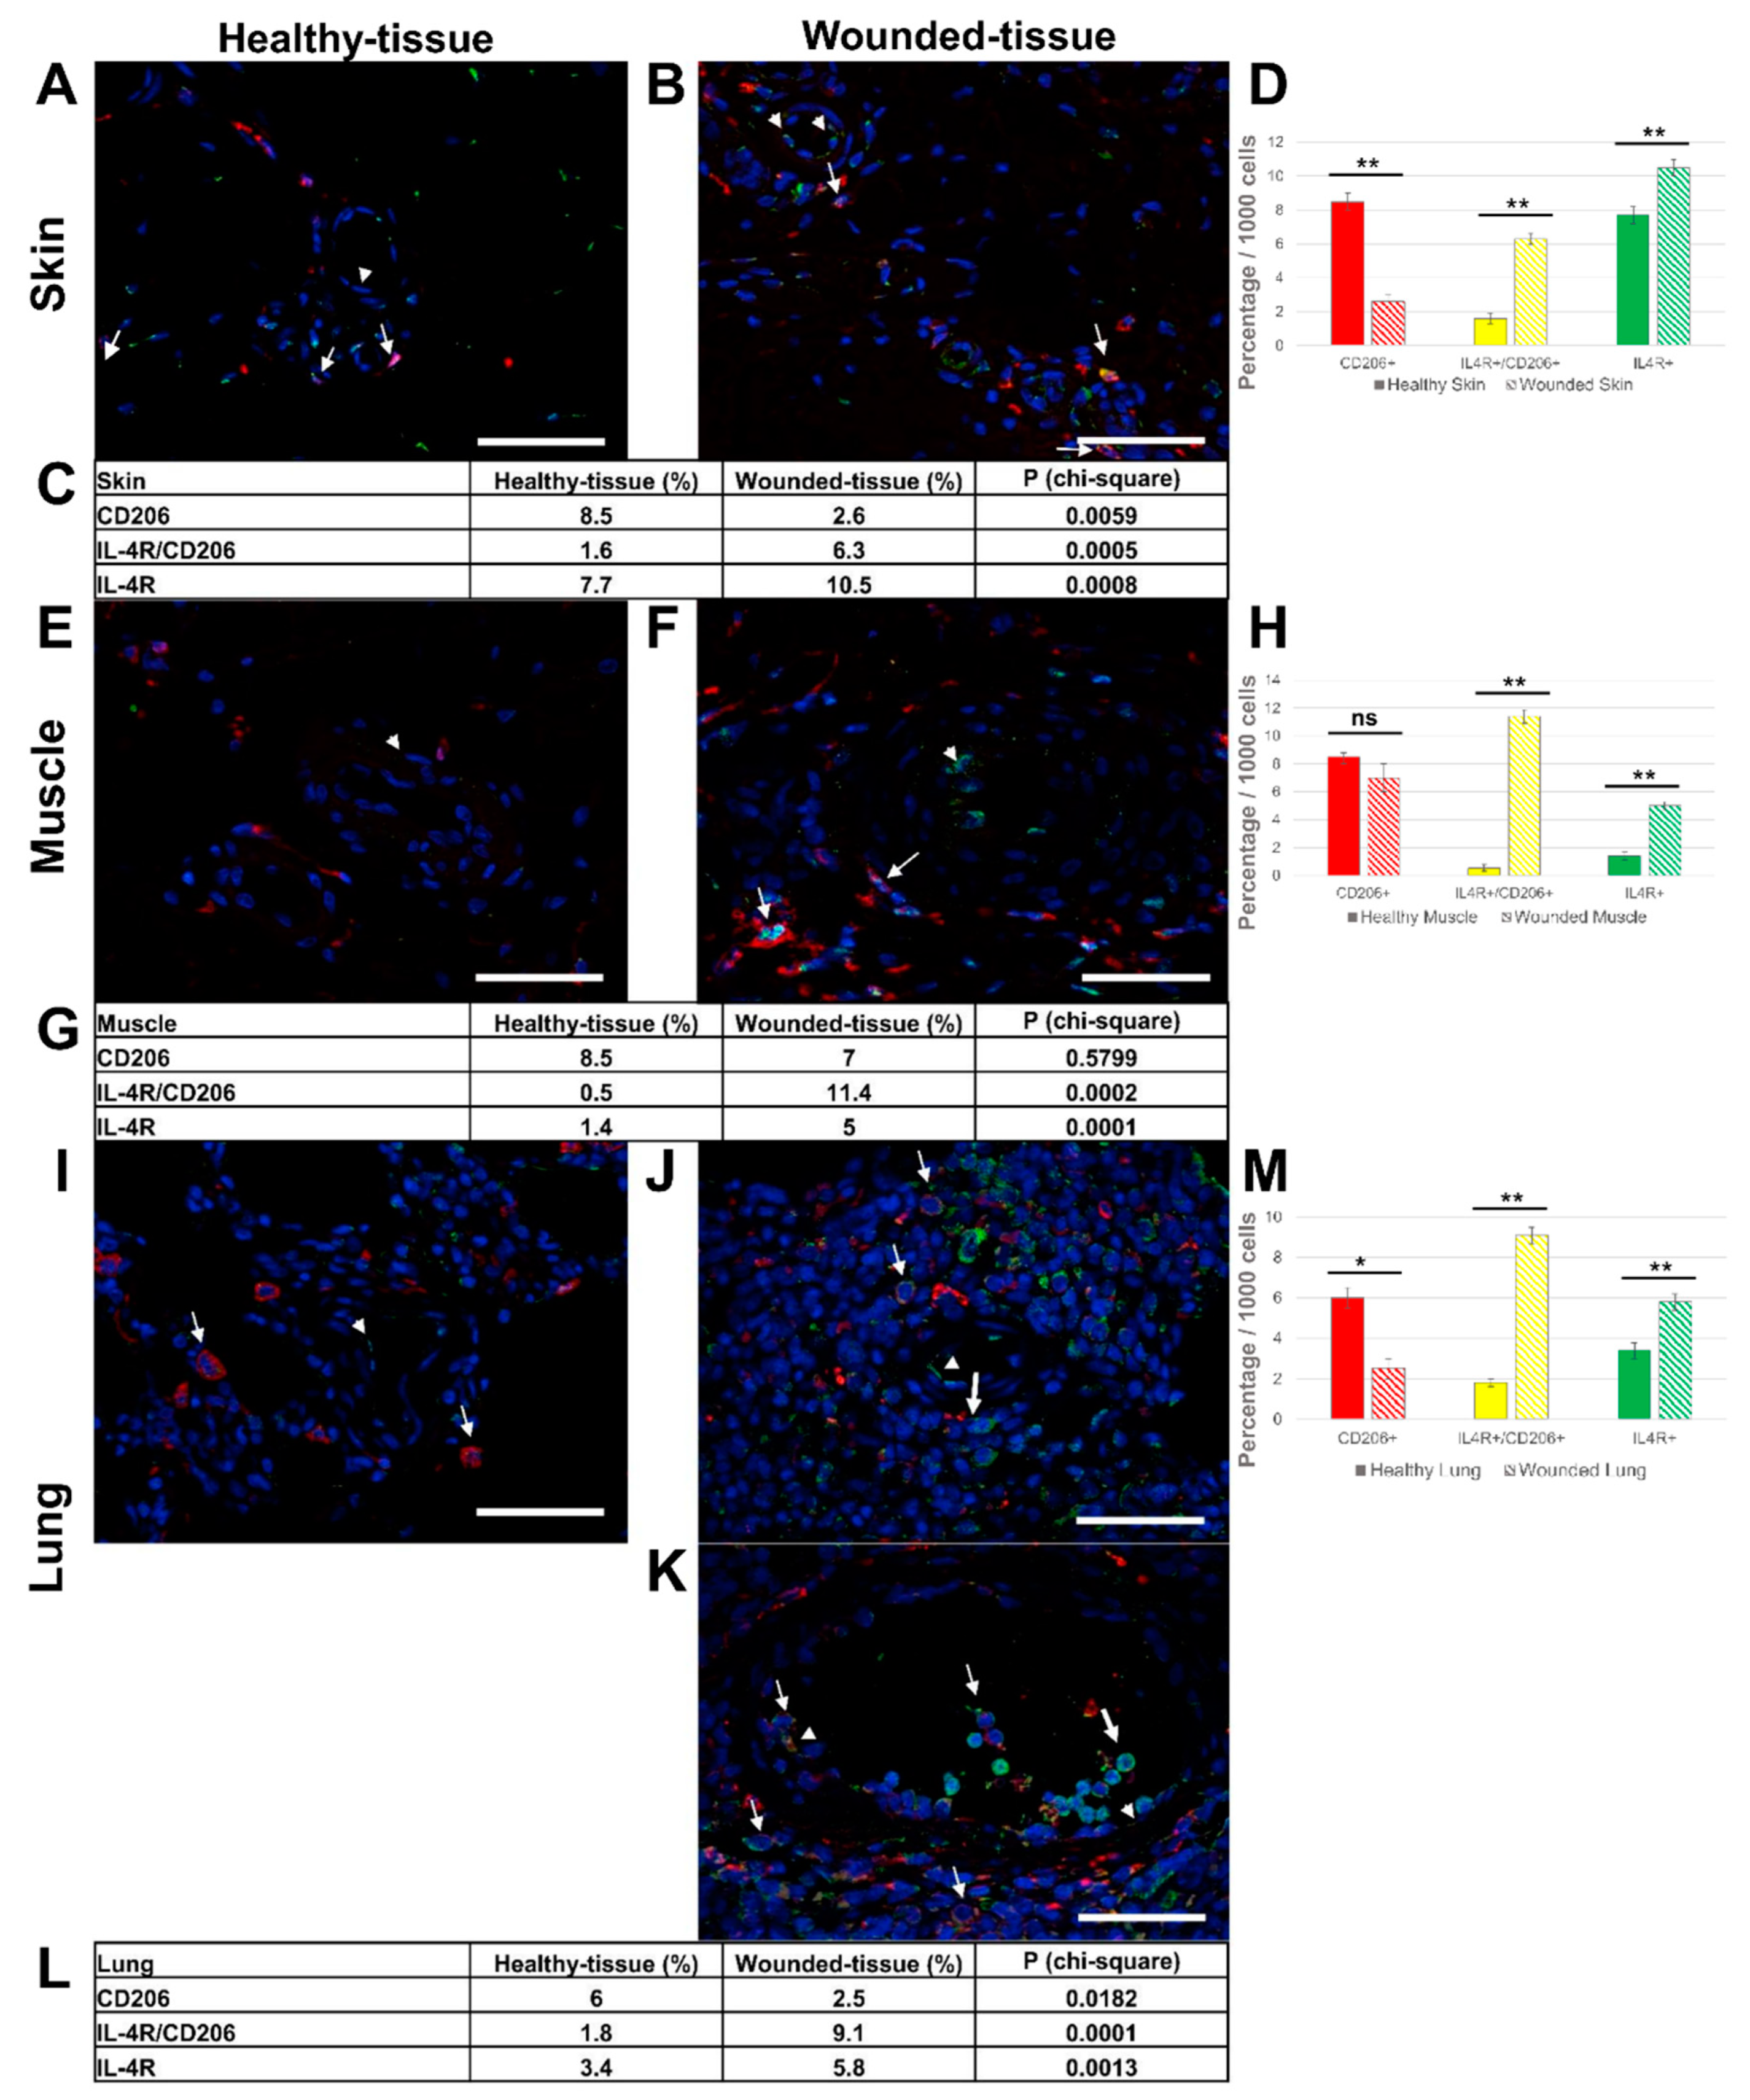
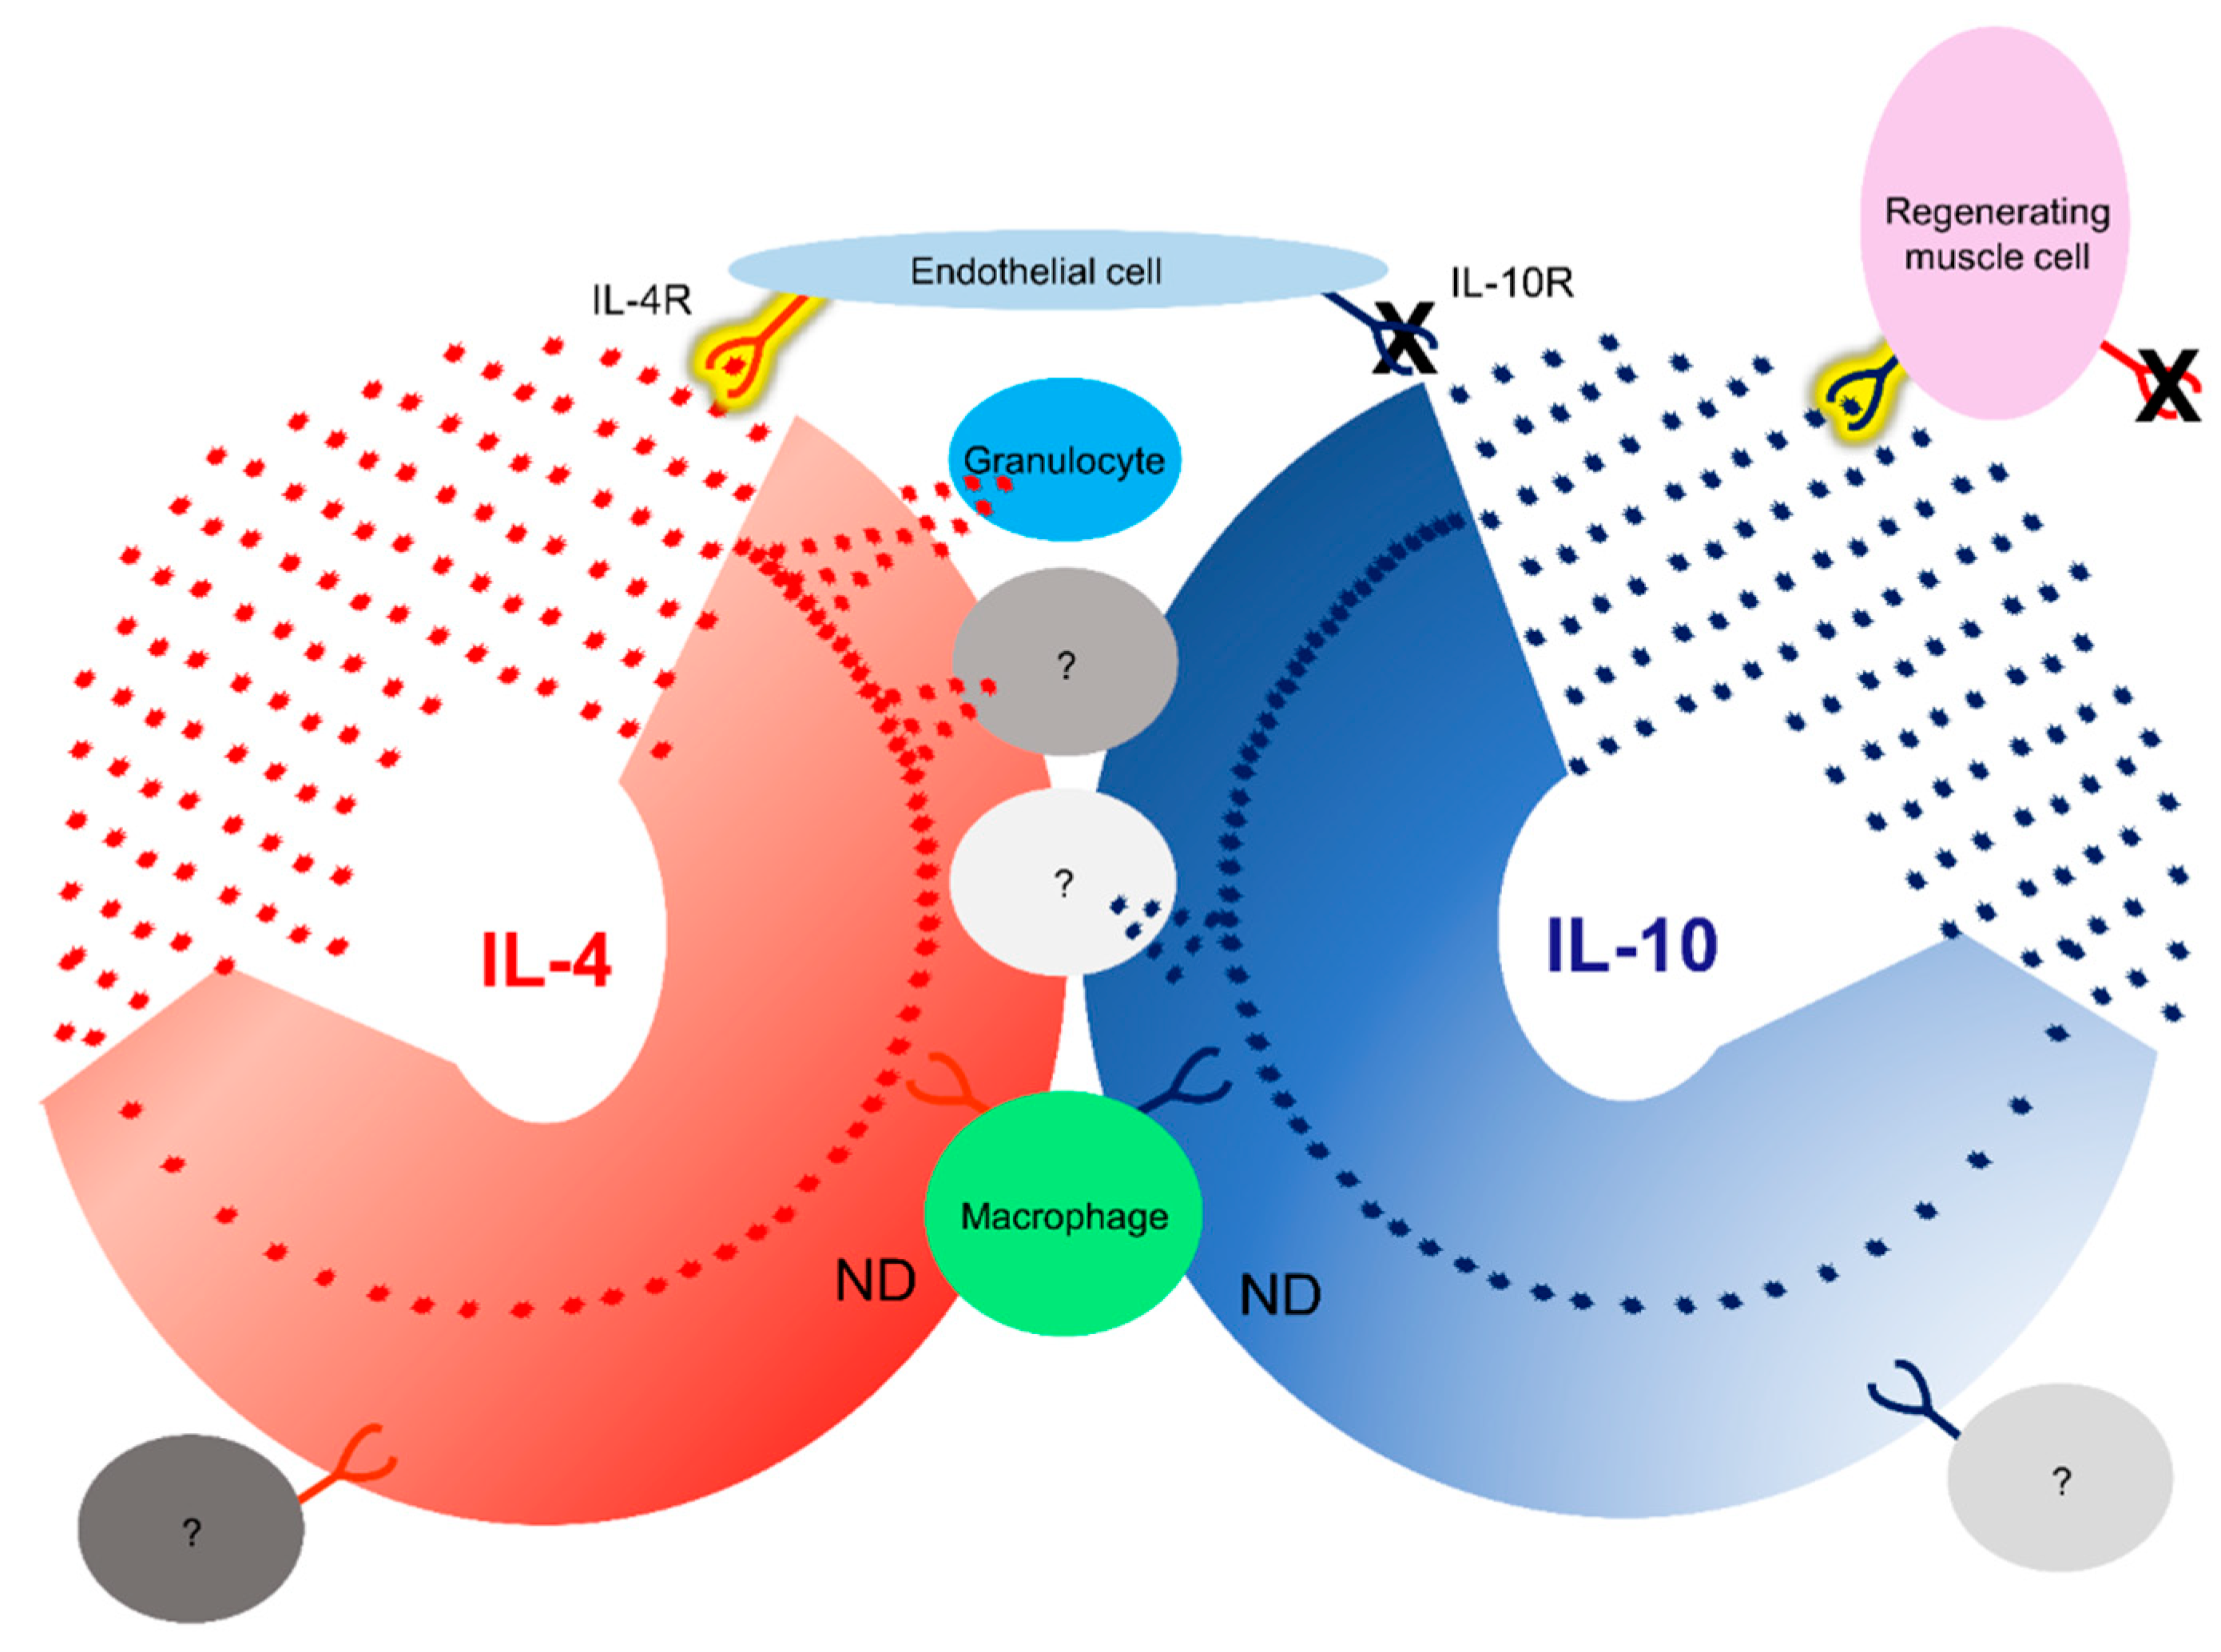
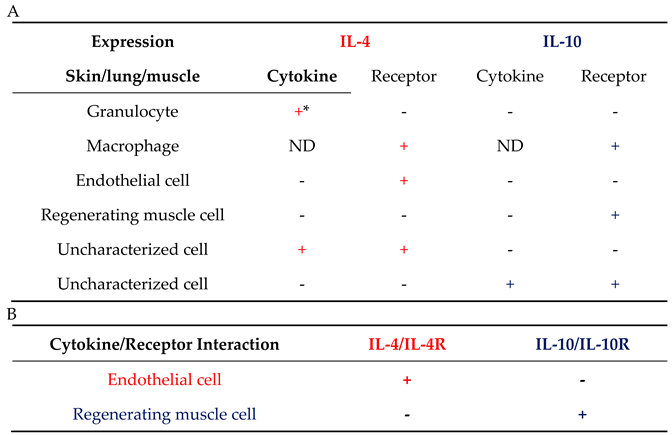
3.3. Tissue injury activates IL-4R expression on the surface of macrophages
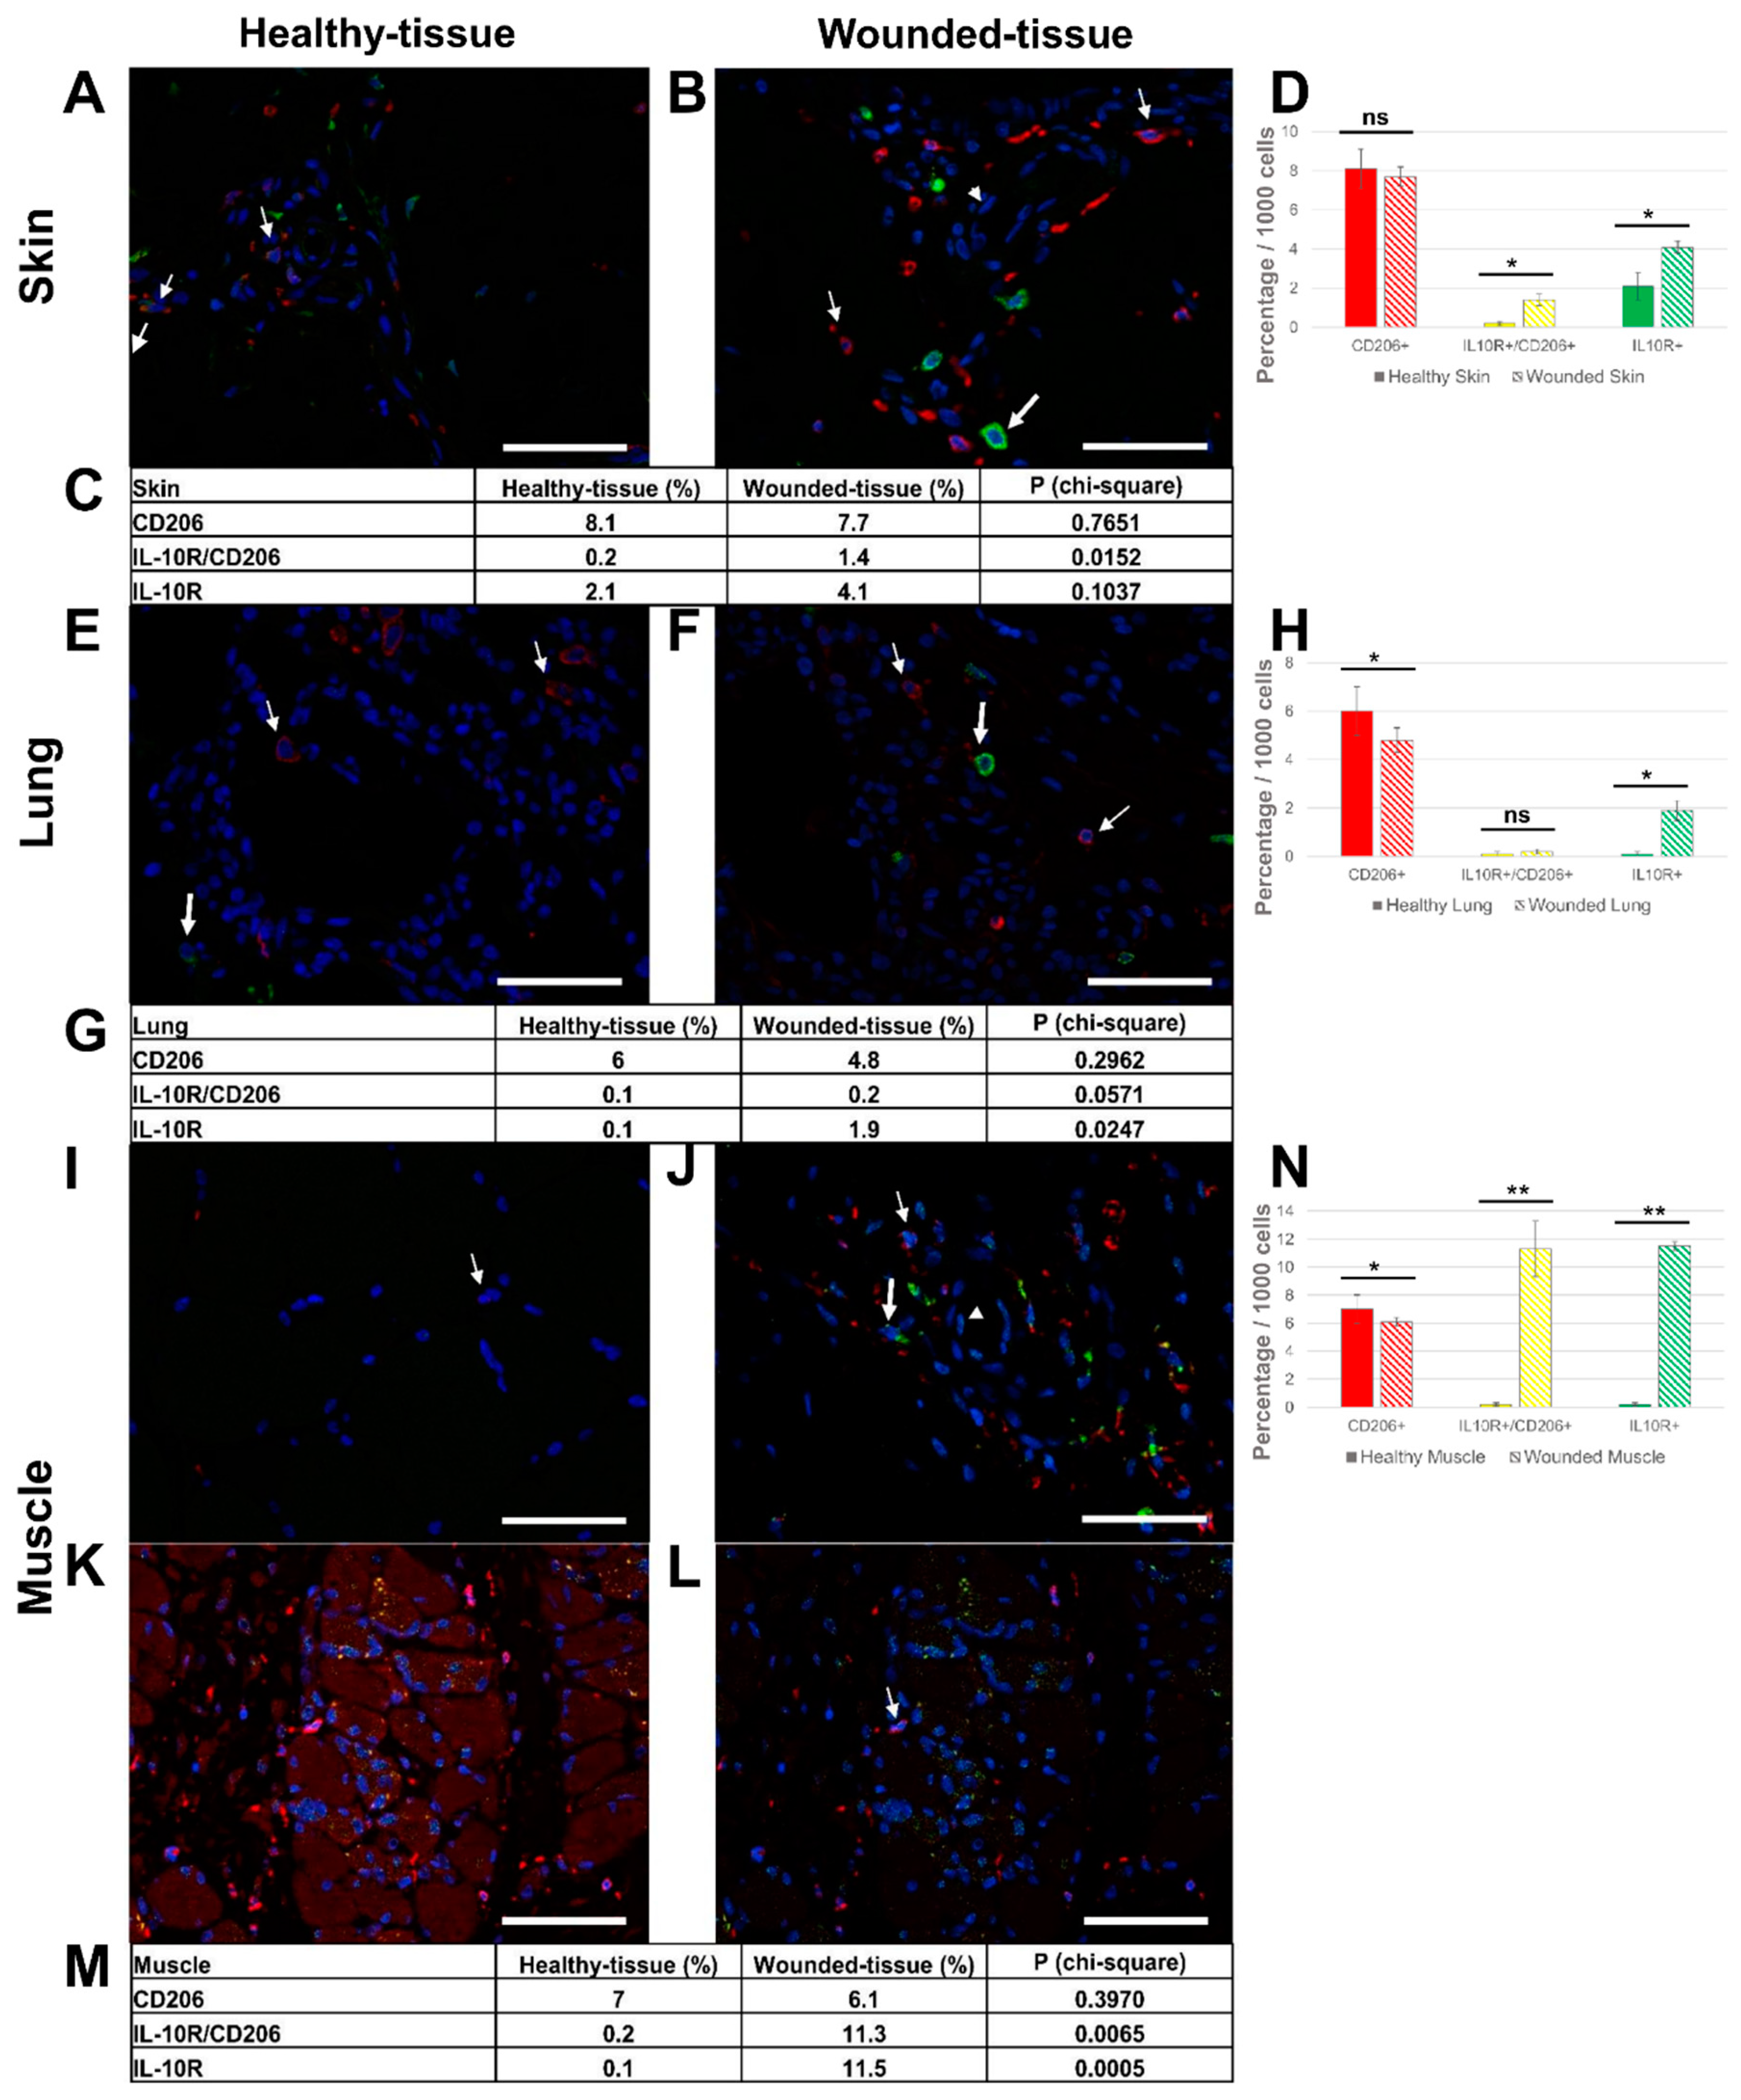
3.4. Injury in muscle tissue displayed high IL-10R expression
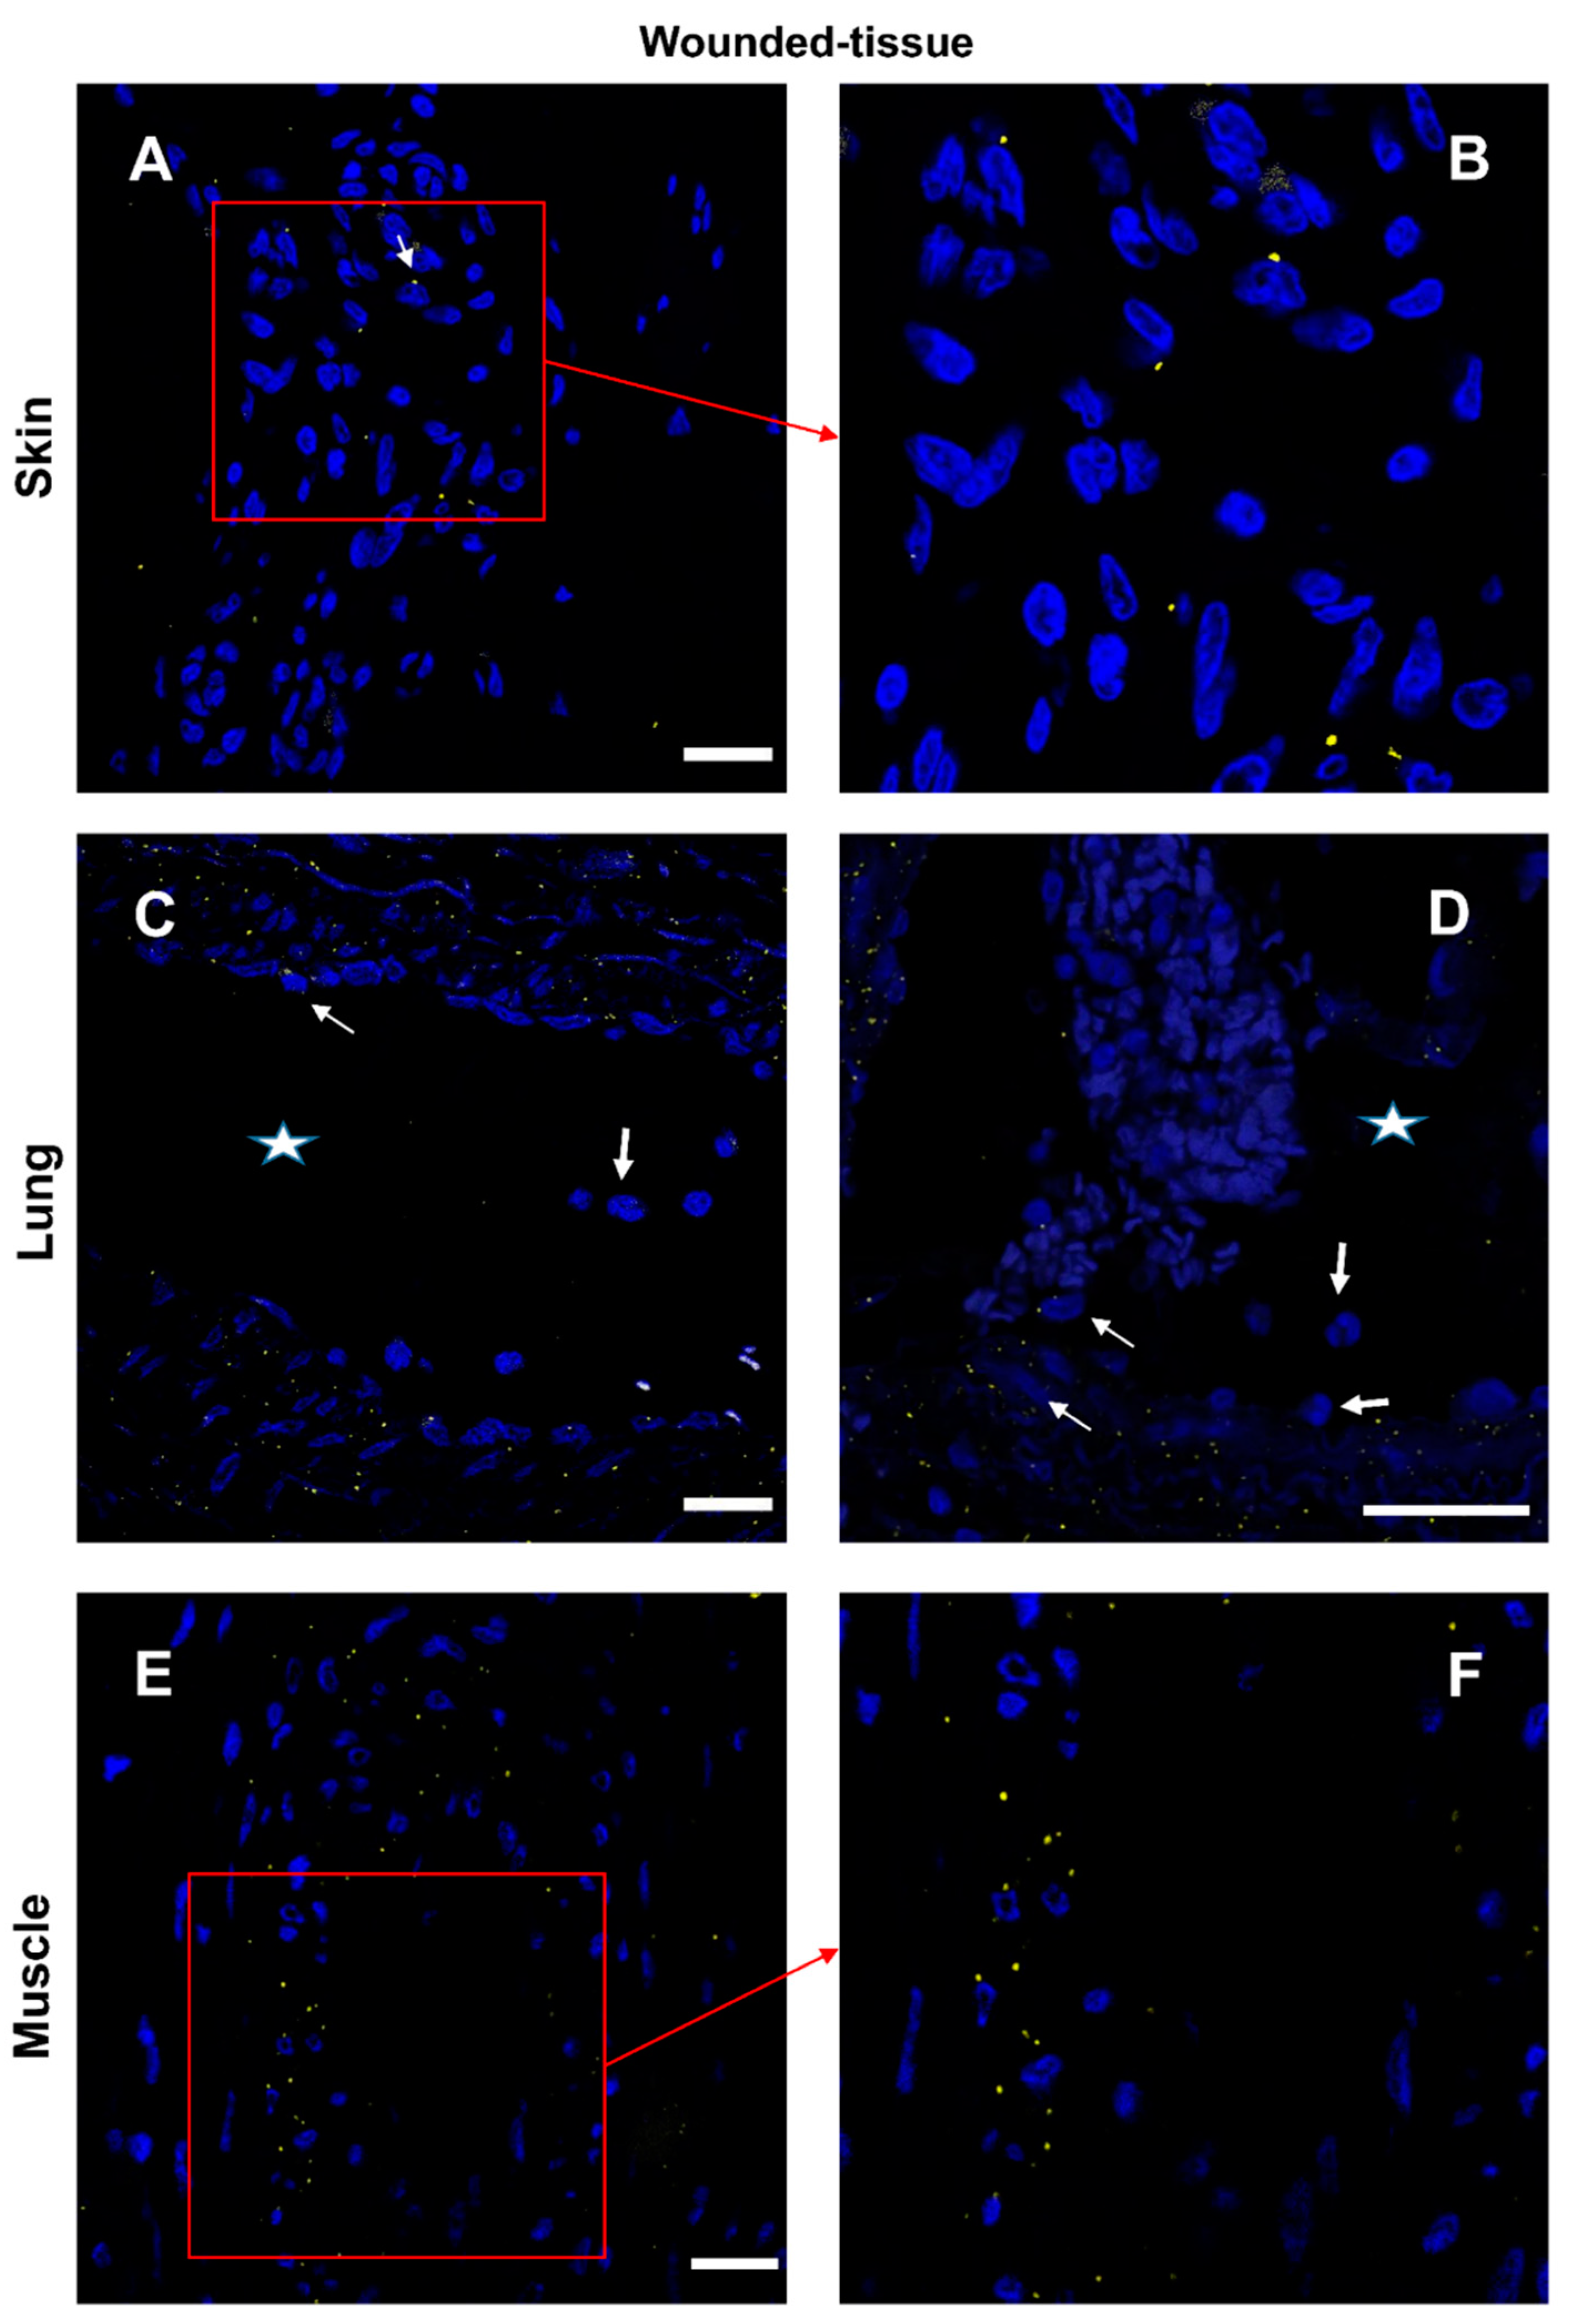
3.5. Granulocytes show high IL-4 expression
3.6. Expression of IL-10 cytokine in different tissues
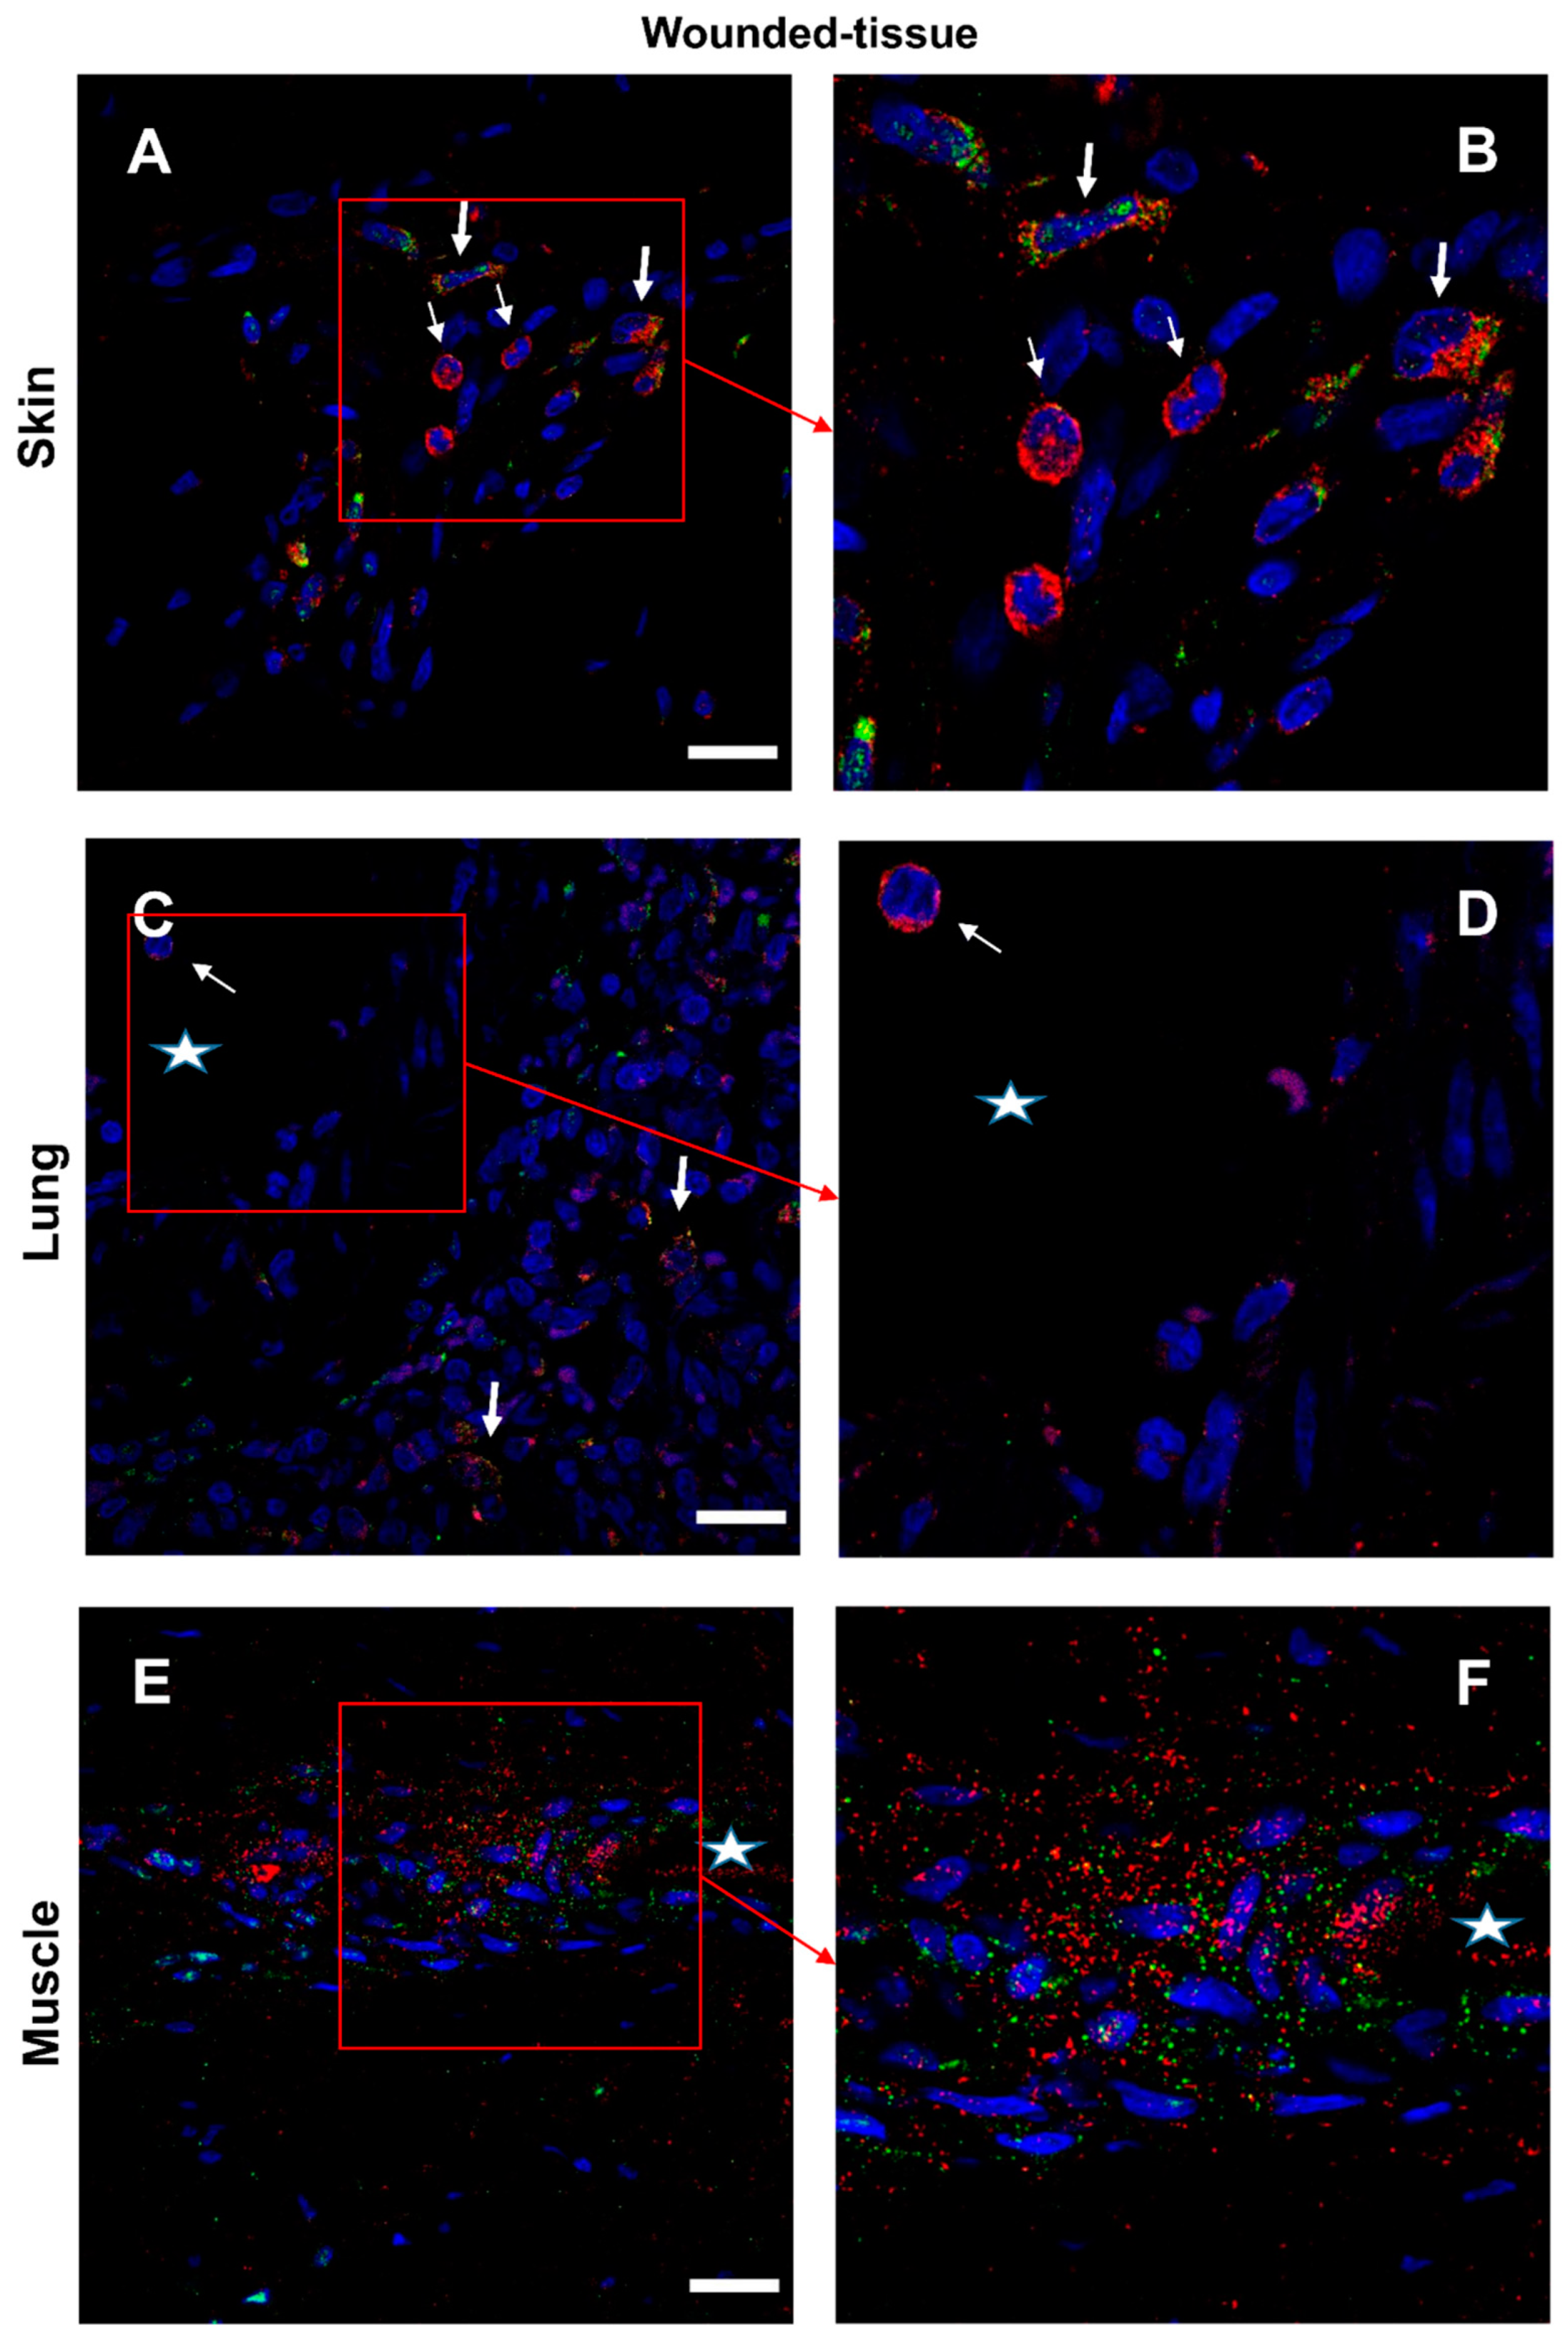
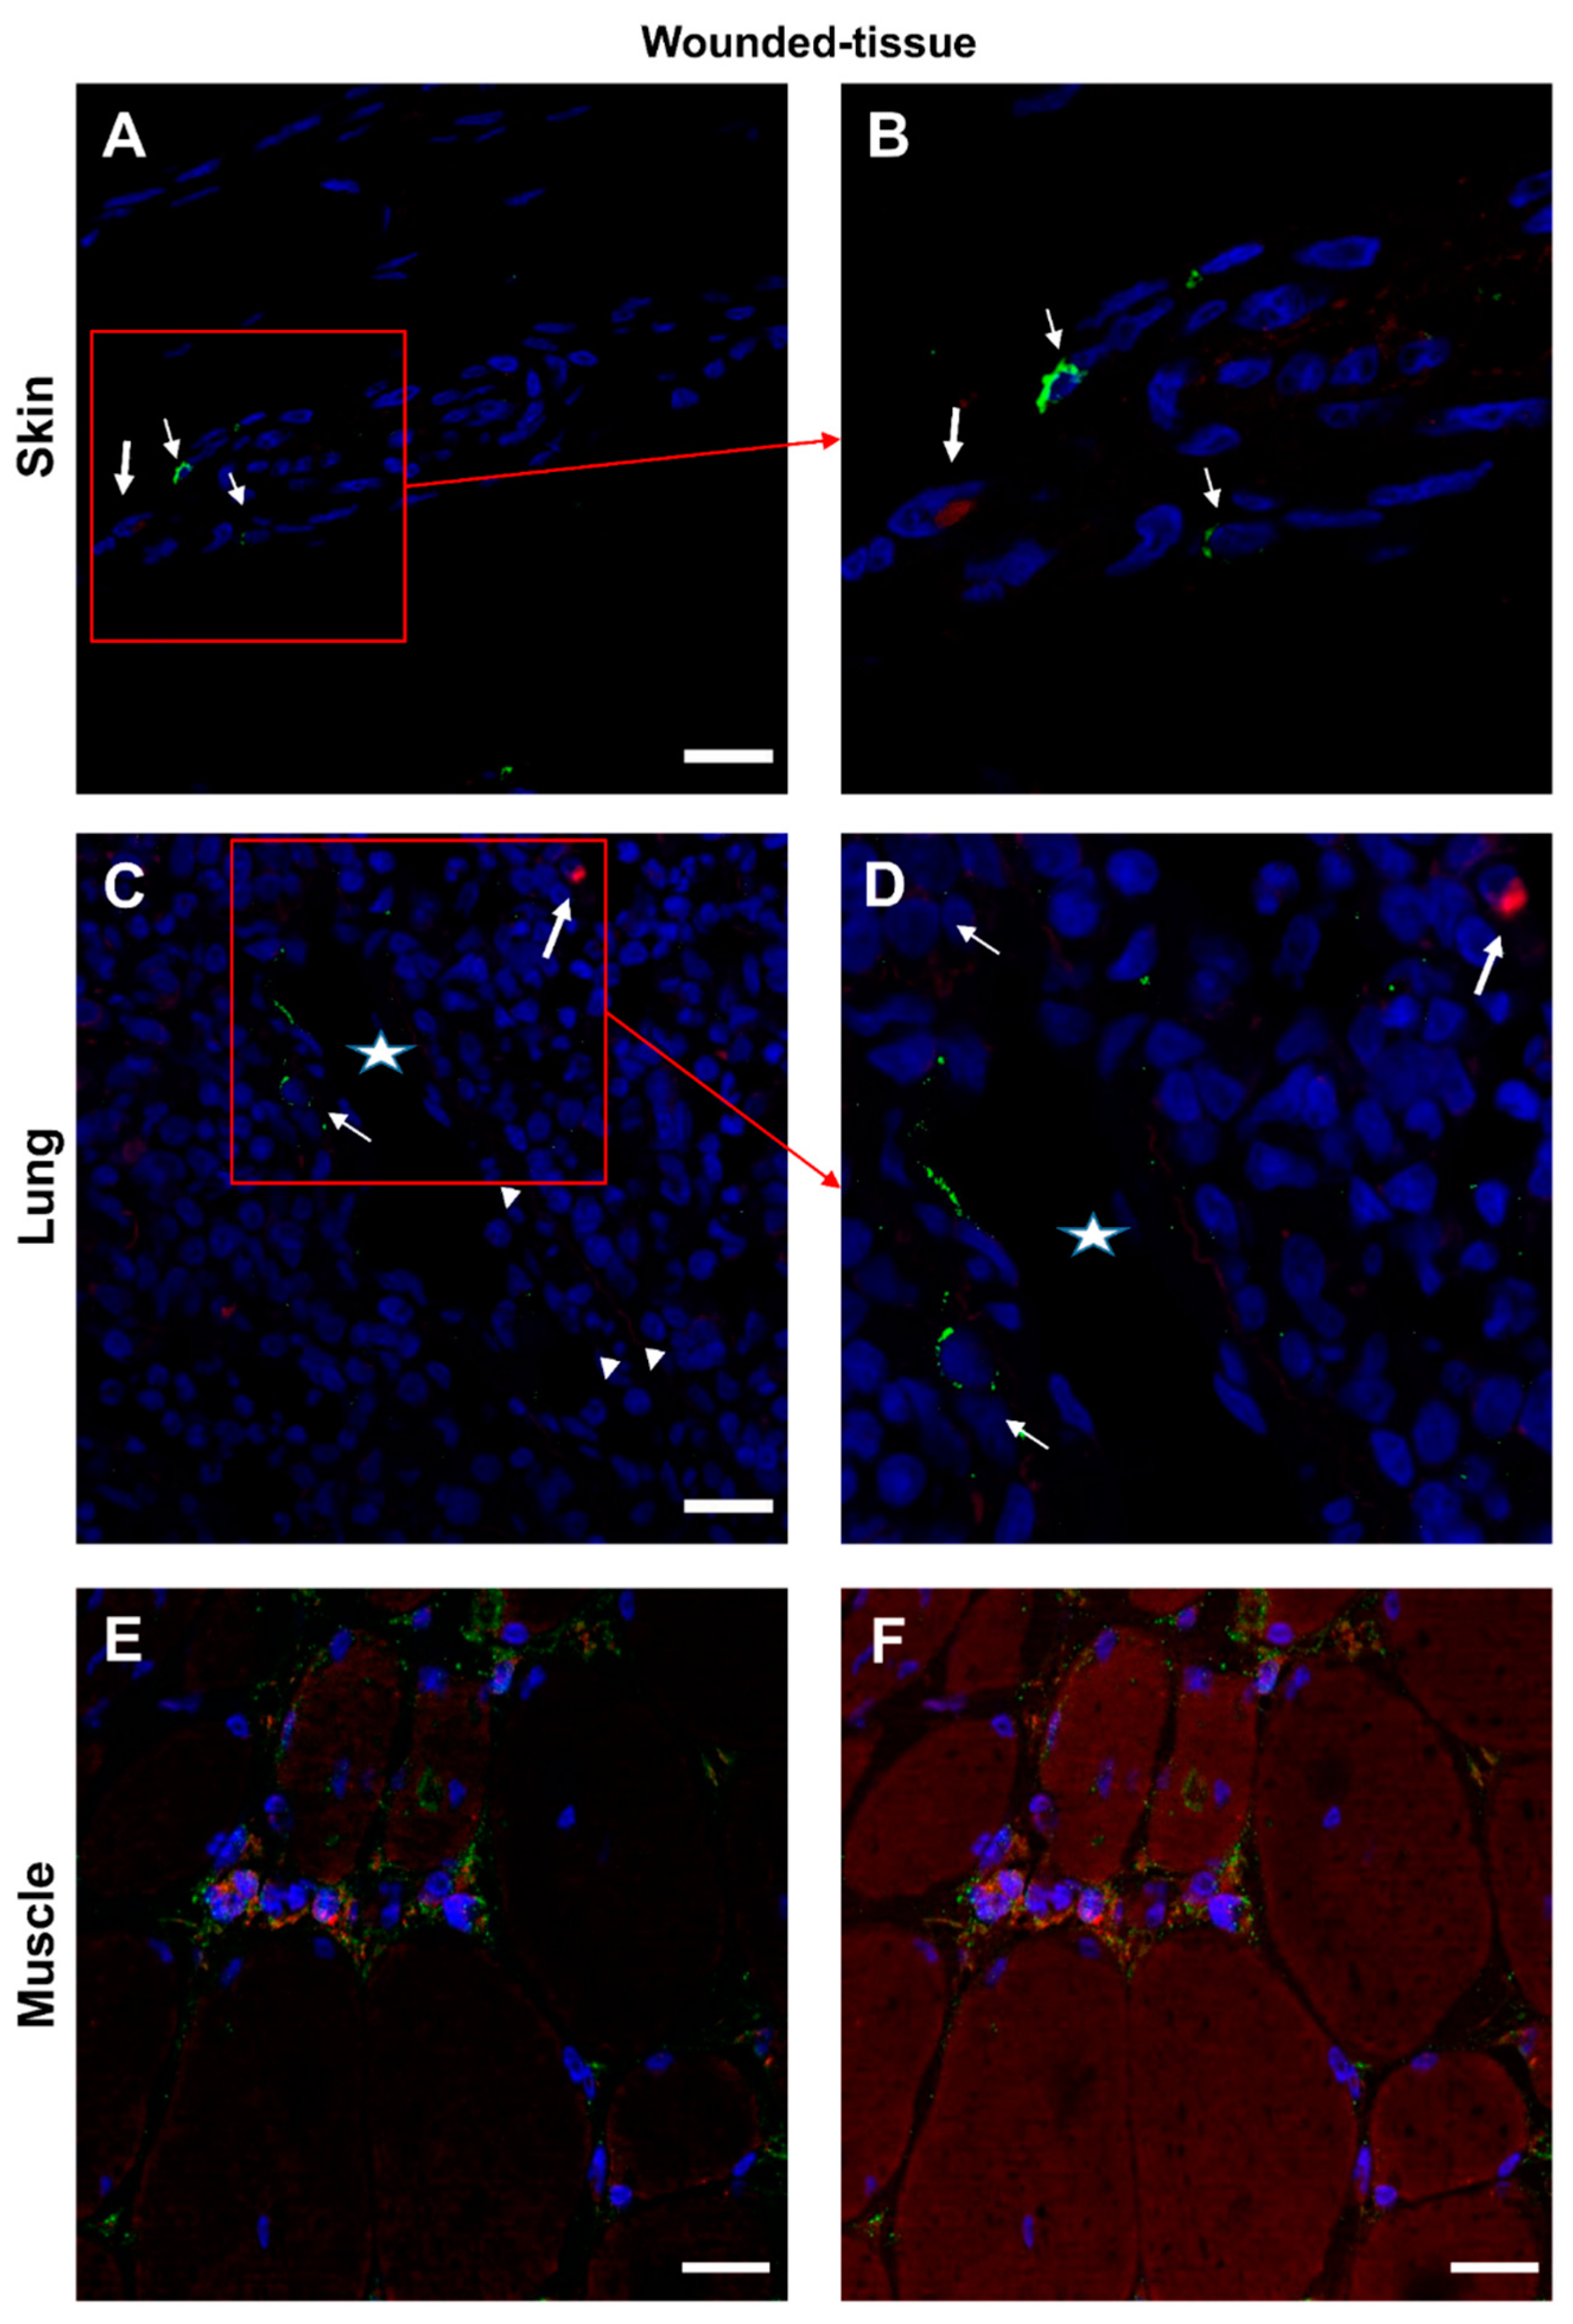
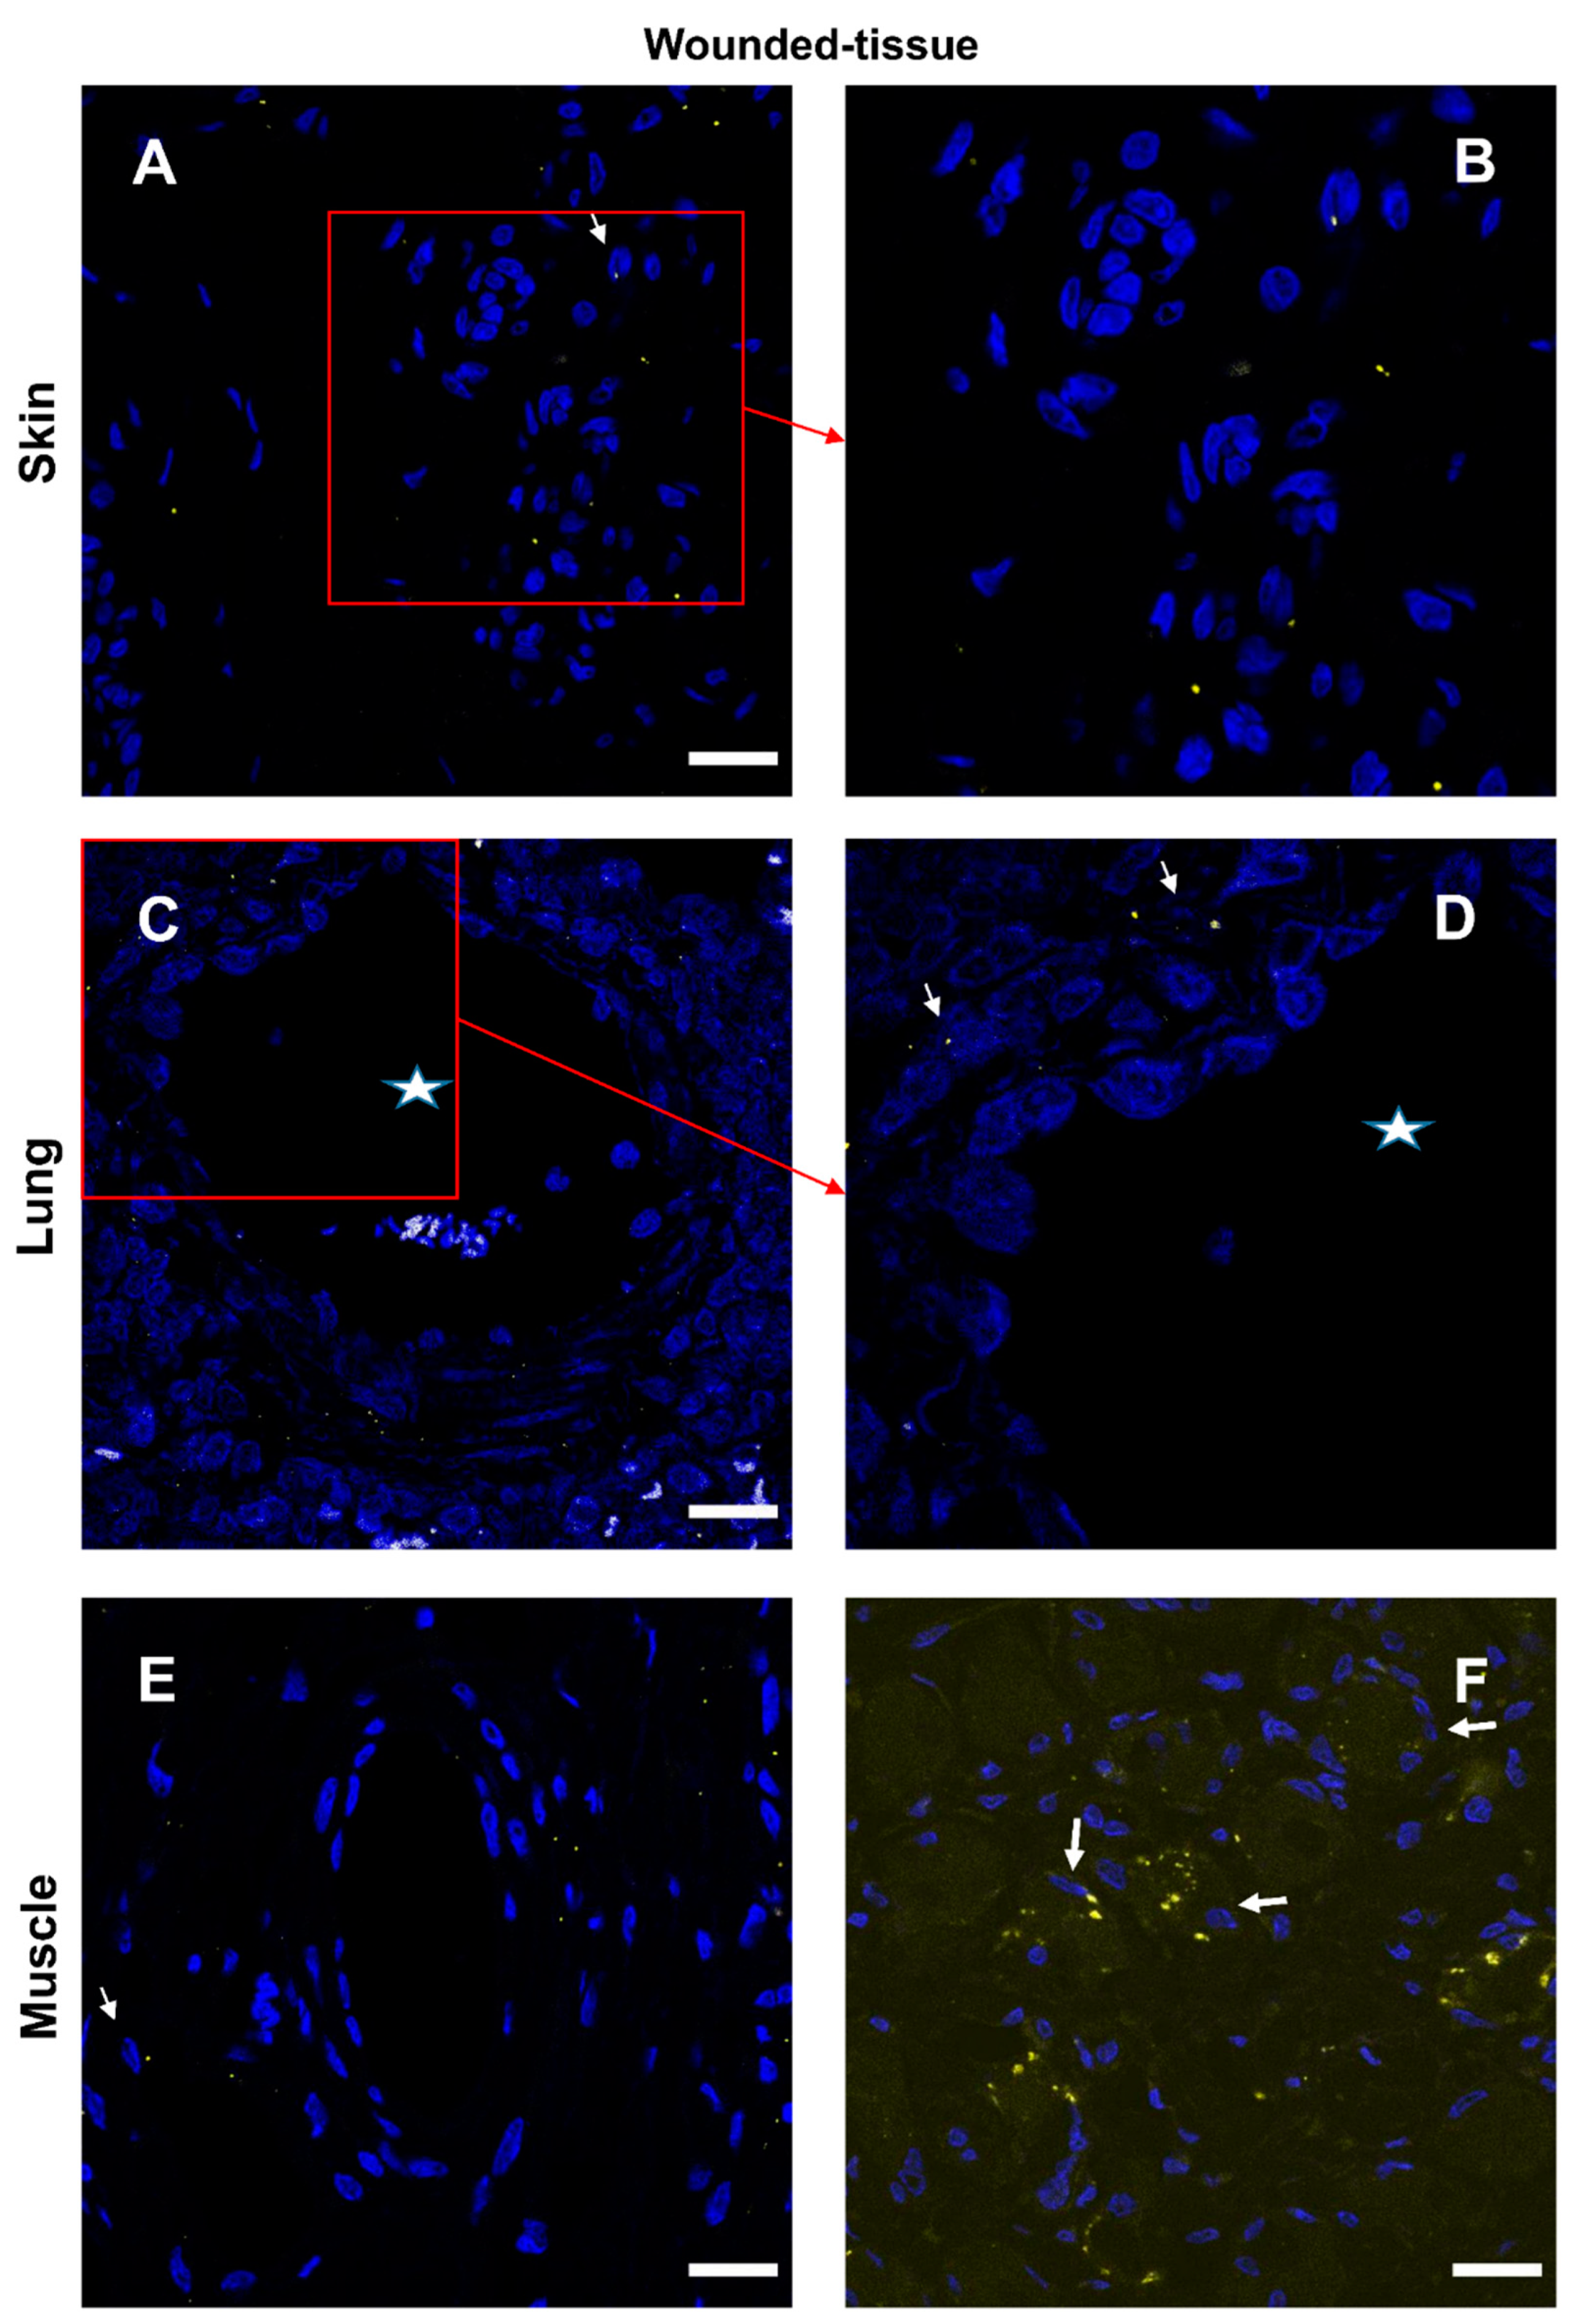
3.7. IL-4/IL-4R and IL-10/IL-10R interaction in situ
4. Discussion
5. Conclusions
Supplementary Materials
Author Contributions
Funding
Institutional Review Board Statement
Acknowledgments
Conflicts of Interest
References
- Martinez, F.O.; Gordon, S. The M1 and M2 Paradigm of Macrophage Activation: Time for Reassessment. F1000Prime Rep 2014, 6, 13. [CrossRef]
- Snyder, R.J.; Lantis, J.; Kirsner, R.S.; Shah, V.; Molyneaux, M.; Carter, M.J. Macrophages: A Review of Their Role in Wound Healing and Their Therapeutic Use. Wound Repair Regen 2016, 24, 613–629. [CrossRef]
- Abdelaziz, M.H.; Abdelwahab, S.F.; Wan, J.; Cai, W.; Huixuan, W.; Jianjun, C.; Kumar, K.D.; Vasudevan, A.; Sadek, A.; Su, Z.; et al. Alternatively Activated Macrophages; a Double-Edged Sword in Allergic Asthma. J Transl Med 2020, 18, 58. [CrossRef]
- Xu, H.-T.; Lee, C.-W.; Li, M.-Y.; Wang, Y.-F.; Yung, P.S.-H.; Lee, O.K.-S. The Shift in Macrophages Polarisation after Tendon Injury: A Systematic Review. J Orthop Translat 2020, 21, 24–34. [CrossRef]
- Arora, S.; Dev, K.; Agarwal, B.; Das, P.; Syed, M.A. Macrophages: Their Role, Activation, and Polarization in Pulmonary Diseases. Immunobiology 2018, 223, 383–396. [CrossRef]
- Shapouri-Moghaddam, A.; Mohammadian, S.; Vazini, H.; Taghadosi, M.; Esmaeili, S.-A.; Mardani, F.; Seifi, B.; Mohammadi, A.; Afshari, J.T.; Sahebkar, A. Macrophage Plasticity, Polarization, and Function in Health and Disease. J Cell Physiol 2018, 233, 6425–6440. [CrossRef]
- Gharib, S.A.; McMahan, R.S.; Eddy, W.E.; Long, M.E.; Parks, W.C.; Aitken, M.L.; Manicone, A.M. Transcriptional and Functional Diversity of Human Macrophage Repolarization. J Allergy Clin Immunol 2019, 143, 1536–1548. [CrossRef]
- Tidball, J.G.; Dorshkind, K.; Wehling-Henricks, M. Shared Signaling Systems in Myeloid Cell-Mediated Muscle Regeneration. Development 2014, 141, 1184–1196. [CrossRef]
- Kieler, M.; Hofmann, M.; Schabbauer, G. More than Just Protein Building Blocks: How Amino Acids and Related Metabolic Pathways Fuel Macrophage Polarization. FEBS J 2021, 288, 3694–3714. [CrossRef]
- Hoeksema, M.A.; Shen, Z.; Holtman, I.R.; Zheng, A.; Spann, N.J.; Cobo, I.; Gymrek, M.; Glass, C.K. Mechanisms Underlying Divergent Responses of Genetically Distinct Macrophages to IL-4. Sci Adv 2021, 7. [CrossRef]
- Howard, M.; Farrar, J.; Hilfiker, M.; Johnson, B.; Takatsu, K.; Hamaoka, T.; Paul, W.E. Identification of a T Cell-Derived b Cell Growth Factor Distinct from Interleukin 2. J Exp Med 1982, 155, 914–923. [CrossRef]
- Isakson, P.C.; Puré, E.; Vitetta, E.S.; Krammer, P.H. T Cell-Derived B Cell Differentiation Factor(s). Effect on the Isotype Switch of Murine B Cells. J Exp Med 1982, 155, 734–748. [CrossRef]
- Mosmann, T.R.; Cherwinski, H.; Bond, M.W.; Giedlin, M.A.; Coffman, R.L. Two Types of Murine Helper T Cell Clone. I. Definition According to Profiles of Lymphokine Activities and Secreted Proteins. J Immunol 1986, 136, 2348–2357.
- Brown, A.M. A Spreadsheet Template Compatible with Microsoft Excel and IWork Numbers That Returns the Simultaneous Confidence Intervals for All Pairwise Differences between Multiple Sample Means. Computer Methods and Programs in Biomedicine 2010, 98, 76–82. [CrossRef]
- Yoshimoto, T.; Bendelac, A.; Watson, C.; Hu-Li, J.; Paul, W.E. Role of NK1.1+ T Cells in a TH2 Response and in Immunoglobulin E Production. Science 1995, 270, 1845–1847. [CrossRef]
- Nonaka, M.; Nonaka, R.; Woolley, K.; Adelroth, E.; Miura, K.; Okhawara, Y.; Glibetic, M.; Nakano, K.; O’Byrne, P.; Dolovich, J. Distinct Immunohistochemical Localization of IL-4 in Human Inflamed Airway Tissues. IL-4 Is Localized to Eosinophils in Vivo and Is Released by Peripheral Blood Eosinophils. J Immunol 1995, 155, 3234–3244.
- Moro, K.; Yamada, T.; Tanabe, M.; Takeuchi, T.; Ikawa, T.; Kawamoto, H.; Furusawa, J.-I.; Ohtani, M.; Fujii, H.; Koyasu, S. Innate Production of T(H)2 Cytokines by Adipose Tissue-Associated c-Kit(+)Sca-1(+) Lymphoid Cells. Nature 2010, 463, 540–544. [CrossRef]
- Saenz, S.A.; Siracusa, M.C.; Perrigoue, J.G.; Spencer, S.P.; Urban, J.F.J.; Tocker, J.E.; Budelsky, A.L.; Kleinschek, M.A.; Kastelein, R.A.; Kambayashi, T.; et al. IL25 Elicits a Multipotent Progenitor Cell Population That Promotes T(H)2 Cytokine Responses. Nature 2010, 464, 1362–1366. [CrossRef]
- Paul, W.E. History of Interleukin-4. Cytokine 2015, 75, 3–7. [CrossRef]
- Junttila, I.S. Tuning the Cytokine Responses: An Update on Interleukin (IL)-4 and IL-13 Receptor Complexes. Front Immunol 2018, 9, 888. [CrossRef]
- Iwaszko, M.; Biały, S.; Bogunia-Kubik, K. Significance of Interleukin (IL)-4 and IL-13 in Inflammatory Arthritis. Cells 2021, 10. [CrossRef]
- Song, X.; Traub, B.; Shi, J.; Kornmann, M. Possible Roles of Interleukin-4 and -13 and Their Receptors in Gastric and Colon Cancer. Int J Mol Sci 2021, 22. [CrossRef]
- Fiorentino, D.F.; Bond, M.W.; Mosmann, T.R. Two Types of Mouse T Helper Cell. IV. Th2 Clones Secrete a Factor That Inhibits Cytokine Production by Th1 Clones. J Exp Med 1989, 170, 2081–2095. [CrossRef]
- Yssel, H.; De Waal Malefyt, R.; Roncarolo, M.G.; Abrams, J.S.; Lahesmaa, R.; Spits, H.; de Vries, J.E. IL-10 Is Produced by Subsets of Human CD4+ T Cell Clones and Peripheral Blood T Cells. J Immunol 1992, 149, 2378–2384.
- Moore, K.W.; de Waal Malefyt, R.; Coffman, R.L.; O’Garra, A. Interleukin-10 and the Interleukin-10 Receptor. Annu Rev Immunol 2001, 19, 683–765. [CrossRef]
- Nguyen, T.-V.V.; Frye, J.B.; Zbesko, J.C.; Stepanovic, K.; Hayes, M.; Urzua, A.; Serrano, G.; Beach, T.G.; Doyle, K.P. Multiplex Immunoassay Characterization and Species Comparison of Inflammation in Acute and Non-Acute Ischemic Infarcts in Human and Mouse Brain Tissue. acta neuropathol commun 2016, 4, 100. [CrossRef]
- Kucuksezer, U.C.; Aktas Cetin, E.; Esen, F.; Tahrali, I.; Akdeniz, N.; Gelmez, M.Y.; Deniz, G. The Role of Natural Killer Cells in Autoimmune Diseases. Front Immunol 2021, 12, 622306. [CrossRef]
- Nagata, K.; Nishiyama, C. IL-10 in Mast Cell-Mediated Immune Responses: Anti-Inflammatory and Proinflammatory Roles. Int J Mol Sci 2021, 22. [CrossRef]
- Jarry, A.; Bossard, C.; Bou-Hanna, C.; Masson, D.; Espaze, E.; Denis, M.G.; Laboisse, C.L. Mucosal IL-10 and TGF-Beta Play Crucial Roles in Preventing LPS-Driven, IFN-Gamma-Mediated Epithelial Damage in Human Colon Explants. J Clin Invest 2008, 118, 1132–1142. [CrossRef]
- Saraiva, M.; Vieira, P.; O’Garra, A. Biology and Therapeutic Potential of Interleukin-10. J Exp Med 2020, 217. [CrossRef]
- Howes, A.; Taubert, C.; Blankley, S.; Spink, N.; Wu, X.; Graham, C.M.; Zhao, J.; Saraiva, M.; Ricciardi-Castagnoli, P.; Bancroft, G.J.; et al. Differential Production of Type I IFN Determines the Reciprocal Levels of IL-10 and Proinflammatory Cytokines Produced by C57BL/6 and BALB/c Macrophages. J Immunol 2016, 197, 2838–2853. [CrossRef]
- Frangogiannis, N.G. Regulation of the Inflammatory Response in Cardiac Repair. Circ Res 2012, 110, 159–173. [CrossRef]
- Davies, L.C.; Jenkins, S.J.; Allen, J.E.; Taylor, P.R. Tissue-Resident Macrophages. Nat Immunol 2013, 14, 986–995. [CrossRef]
- Hashimoto, I.; Imaizumi, K.; Hashimoto, N.; Furukawa, H.; Noda, Y.; Kawabe, T.; Honda, T.; Ogawa, T.; Matsuo, M.; Imai, N.; et al. Aqueous Fraction of Sauropus Androgynus Might Be Responsible for Bronchiolitis Obliterans. Respirology 2013, 18, 340–347. [CrossRef]
- Qian, B.-Z.; Pollard, J.W. Macrophage Diversity Enhances Tumor Progression and Metastasis. Cell 2010, 141, 39–51. [CrossRef]
- Stein, M.; Keshav, S.; Harris, N.; Gordon, S. Interleukin 4 Potently Enhances Murine Macrophage Mannose Receptor Activity: A Marker of Alternative Immunologic Macrophage Activation. J Exp Med 1992, 176, 287–292. [CrossRef]
- Gordon, S. Alternative Activation of Macrophages. Nat Rev Immunol 2003, 3, 23–35. [CrossRef]
- Gordon, S.; Lawson, L.; Rabinowitz, S.; Crocker, P.R.; Morris, L.; Perry, V.H. Antigen Markers of Macrophage Differentiation in Murine Tissues. Curr Top Microbiol Immunol 1992, 181, 1–37. [CrossRef]
- McKenzie, G.J.; Bancroft, A.; Grencis, R.K.; McKenzie, A.N. A Distinct Role for Interleukin-13 in Th2-Cell-Mediated Immune Responses. Curr Biol 1998, 8, 339–342. [CrossRef]
- Sica, A.; Mantovani, A. Macrophage Plasticity and Polarization: In Vivo Veritas. J Clin Invest 2012, 122, 787–795. [CrossRef]
- Martinez, F.O.; Sica, A.; Mantovani, A.; Locati, M. Macrophage Activation and Polarization. Front Biosci 2008, 13, 453–461. [CrossRef]
- Nikovics, K.; Favier, A.-L. Macrophage Identification In Situ. Biomedicines 2021, 9. [CrossRef]
- Wynn, T.A.; Chawla, A.; Pollard, J.W. Macrophage Biology in Development, Homeostasis and Disease. Nature 2013, 496, 445–455. [CrossRef]
- Wang, L.-X.; Zhang, S.-X.; Wu, H.-J.; Rong, X.-L.; Guo, J. M2b Macrophage Polarization and Its Roles in Diseases. J Leukoc Biol 2019, 106, 345–358. [CrossRef]
- Lin, J.-S.; Lai, E.-M. Protein-Protein Interactions: Yeast Two-Hybrid System. Methods Mol Biol 2017, 1615, 177–187. [CrossRef]
- Wang, Y.; Wang, N. FRET and Mechanobiology. Integr Biol (Camb) 2009, 1, 565–573. [CrossRef]
- Miller, K.E.; Kim, Y.; Huh, W.-K.; Park, H.-O. Bimolecular Fluorescence Complementation (BiFC) Analysis: Advances and Recent Applications for Genome-Wide Interaction Studies. J Mol Biol 2015, 427, 2039–2055. [CrossRef]
- Fredriksson, S.; Gullberg, M.; Jarvius, J.; Olsson, C.; Pietras, K.; Gústafsdóttir, S.M.; Ostman, A.; Landegren, U. Protein Detection Using Proximity-Dependent DNA Ligation Assays. Nat Biotechnol 2002, 20, 473–477. [CrossRef]
- Gullberg, M.; Gústafsdóttir, S.M.; Schallmeiner, E.; Jarvius, J.; Bjarnegård, M.; Betsholtz, C.; Landegren, U.; Fredriksson, S. Cytokine Detection by Antibody-Based Proximity Ligation. Proc Natl Acad Sci U S A 2004, 101, 8420–8424. [CrossRef]
- Bagchi, S.; Fredriksson, R.; Wallén-Mackenzie, Å. In Situ Proximity Ligation Assay (PLA). Methods Mol Biol 2015, 1318, 149–159. [CrossRef]
- Alam, M.S. Proximity Ligation Assay (PLA). Curr Protoc Immunol 2018, 123, e58. [CrossRef]
- Wang, P.; Yang, Y.; Hong, T.; Zhu, G. Proximity Ligation Assay: An Ultrasensitive Method for Protein Quantification and Its Applications in Pathogen Detection. Appl Microbiol Biotechnol 2021, 105, 923–935. [CrossRef]
- Ezzelarab, M.B.; Cooper, D.K.C. Systemic Inflammation in Xenograft Recipients (SIXR): A New Paradigm in Pig-to-Primate Xenotransplantation? Int J Surg 2015, 23, 301–305. [CrossRef]
- Lunney, J.K.; Van Goor, A.; Walker, K.E.; Hailstock, T.; Franklin, J.; Dai, C. Importance of the Pig as a Human Biomedical Model. Sci Transl Med 2021, 13, eabd5758. [CrossRef]
- Sullivan, T.P.; Eaglstein, W.H.; Davis, S.C.; Mertz, P. The Pig as a Model for Human Wound Healing. Wound Repair Regen 2001, 9, 66–76. [CrossRef]
- Riccobono, D.; Nikovics, K.; François, S.; Favier, A.-L.; Jullien, N.; Schrock, G.; Scherthan, H.; Drouet, M. First Insights Into the M2 Inflammatory Response After Adipose-Tissue-Derived Stem Cell Injections in Radiation-Injured Muscles. Health Physics 2018, 115, 37–48. [CrossRef]
- Nikovics, K.; Durand, M.; Castellarin, C.; Burger, J.; Sicherre, E.; Collombet, J.-M.; Oger, M.; Holy, X.; Favier, A.-L. Macrophages Characterization in an Injured Bone Tissue. Biomedicines 2022, 10. [CrossRef]
- Midway, S.; Robertson, M.; Flinn, S.; Kaller, M. Comparing Multiple Comparisons: Practical Guidance for Choosing the Best Multiple Comparisons Test. PeerJ 2020, 8, e10387. [CrossRef]
- Xu, J.; Yu, L.; Guo, J.; Xiang, J.; Zheng, Z.; Gao, D.; Shi, B.; Hao, H.; Jiao, D.; Zhong, L.; et al. Generation of Pig Induced Pluripotent Stem Cells Using an Extended Pluripotent Stem Cell Culture System. Stem Cell Res Ther 2019, 10, 193. [CrossRef]
- Minutti, C.M.; Knipper, J.A.; Allen, J.E.; Zaiss, D.M.W. Tissue-Specific Contribution of Macrophages to Wound Healing. Semin Cell Dev Biol 2017, 61, 3–11. [CrossRef]
- Pan, D.; Schellhardt, L.; Acevedo-Cintron, J.A.; Hunter, D.; Snyder-Warwick, A.K.; Mackinnon, S.E.; Wood, M.D. IL-4 Expressing Cells Are Recruited to Nerve after Injury and Promote Regeneration. Exp Neurol 2022, 347, 113909. [CrossRef]
- Orecchioni, M.; Ghosheh, Y.; Pramod, A.B.; Ley, K. Macrophage Polarization: Different Gene Signatures in M1(LPS+) vs. Classically and M2(LPS-) vs. Alternatively Activated Macrophages. Front Immunol 2019, 10, 1084. [CrossRef]
- Zizzo, G.; Hilliard, B.A.; Monestier, M.; Cohen, P.L. Efficient Clearance of Early Apoptotic Cells by Human Macrophages Requires M2c Polarization and MerTK Induction. J Immunol 2012, 189, 3508–3520. [CrossRef]
- Xu, W.; Zhao, X.; Daha, M.R.; van Kooten, C. Reversible Differentiation of Pro- and Anti-Inflammatory Macrophages. Mol Immunol 2013, 53, 179–186. [CrossRef]
- Arnold, D.E.; Heimall, J.R. A Review of Chronic Granulomatous Disease. Adv Ther 2017, 34, 2543–2557. [CrossRef]
- Jenkins, S.J.; Ruckerl, D.; Thomas, G.D.; Hewitson, J.P.; Duncan, S.; Brombacher, F.; Maizels, R.M.; Hume, D.A.; Allen, J.E. IL-4 Directly Signals Tissue-Resident Macrophages to Proliferate beyond Homeostatic Levels Controlled by CSF-1. J Exp Med 2013, 210, 2477–2491. [CrossRef]
- Shintani, Y.; Ito, T.; Fields, L.; Shiraishi, M.; Ichihara, Y.; Sato, N.; Podaru, M.; Kainuma, S.; Tanaka, H.; Suzuki, K. IL-4 as a Repurposed Biological Drug for Myocardial Infarction through Augmentation of Reparative Cardiac Macrophages: Proof-of-Concept Data in Mice. Sci Rep 2017, 7, 6877. [CrossRef]
- Huynh, T.; Reed, C.; Blackwell, Z.; Phelps, P.; Herrera, L.C.P.; Almodovar, J.; Zaharoff, D.A.; Wolchok, J. Local IL-10 Delivery Modulates the Immune Response and Enhances Repair of Volumetric Muscle Loss Muscle Injury. Sci Rep 2023, 13, 1983. [CrossRef]
- de Waal Malefyt, R.; Abrams, J.; Bennett, B.; Figdor, C.G.; de Vries, J.E. Interleukin 10(IL-10) Inhibits Cytokine Synthesis by Human Monocytes: An Autoregulatory Role of IL-10 Produced by Monocytes. J Exp Med 1991, 174, 1209–1220. [CrossRef]
- O’Farrell, A.M.; Liu, Y.; Moore, K.W.; Mui, A.L. IL-10 Inhibits Macrophage Activation and Proliferation by Distinct Signaling Mechanisms: Evidence for Stat3-Dependent and -Independent Pathways. EMBO J 1998, 17, 1006–1018. [CrossRef]
- Dagdeviren, S.; Jung, D.Y.; Lee, E.; Friedline, R.H.; Noh, H.L.; Kim, J.H.; Patel, P.R.; Tsitsilianos, N.; Tsitsilianos, A.V.; Tran, D.A.; et al. Altered Interleukin-10 Signaling in Skeletal Muscle Regulates Obesity-Mediated Inflammation and Insulin Resistance. Mol Cell Biol 2016, 36, 2956–2966. [CrossRef]
- Sun, S.-J.; Wei, R.; Li, F.; Liao, S.-Y.; Tse, H.-F. Mesenchymal Stromal Cell-Derived Exosomes in Cardiac Regeneration and Repair. Stem Cell Reports 2021, 16, 1662–1673. [CrossRef]
- Jorda, A.; Campos-Campos, J.; Aldasoro, C.; Colmena, C.; Aldasoro, M.; Alvarez, K.; Valles, S.L. Protective Action of Ultrasound-Guided Electrolysis Technique on the Muscle Damage Induced by Notexin in Rats. PLoS One 2022, 17, e0276634. [CrossRef]
- Hong, E.-G.; Ko, H.J.; Cho, Y.-R.; Kim, H.-J.; Ma, Z.; Yu, T.Y.; Friedline, R.H.; Kurt-Jones, E.; Finberg, R.; Fischer, M.A.; et al. Interleukin-10 Prevents Diet-Induced Insulin Resistance by Attenuating Macrophage and Cytokine Response in Skeletal Muscle. Diabetes 2009, 58, 2525–2535. [CrossRef]
- Chang, C.-M.; Lam, H.Y.P.; Hsu, H.-J.; Jiang, S.-J. Interleukin-10: A Double-Edged Sword in Breast Cancer. Tzu Chi Med J 2021, 33, 203–211. [CrossRef]
- Silk, A.W.; Margolin, K. Cytokine Therapy. Hematol Oncol Clin North Am 2019, 33, 261–274. [CrossRef]
- Ho, I.-C.; Miaw, S.-C. Regulation of IL-4 Expression in Immunity and Diseases. Adv Exp Med Biol 2016, 941, 31–77. [CrossRef]
- Ohara, J.; Paul, W.E. Receptors for B-Cell Stimulatory Factor-1 Expressed on Cells of Haematopoietic Lineage. Nature 1987, 325, 537–540. [CrossRef]
- von Haehling, S.; Wolk, K.; Höflich, C.; Kunz, S.; Grünberg, B.H.; Döcke, W.-D.; Reineke, U.; Asadullah, K.; Sterry, W.; Volk, H.-D.; et al. Interleukin-10 Receptor-1 Expression in Monocyte-Derived Antigen-Presenting Cell Populations: Dendritic Cells Partially Escape from IL-10’s Inhibitory Mechanisms. Genes Immun 2015, 16, 8–14. [CrossRef]
- Moretti, L.; Stalfort, J.; Barker, T.H.; Abebayehu, D. The Interplay of Fibroblasts, the Extracellular Matrix, and Inflammation in Scar Formation. J Biol Chem 2022, 298, 101530. [CrossRef]
- Li, S.; Ding, X.; Zhang, H.; Ding, Y.; Tan, Q. IL-25 Improves Diabetic Wound Healing through Stimulating M2 Macrophage Polarization and Fibroblast Activation. Int Immunopharmacol 2022, 106, 108605. [CrossRef]
- Ronca, R.; Van Ginderachter, J.A.; Turtoi, A. Paracrine Interactions of Cancer-Associated Fibroblasts, Macrophages and Endothelial Cells: Tumor Allies and Foes. Curr Opin Oncol 2018, 30, 45–53. [CrossRef]
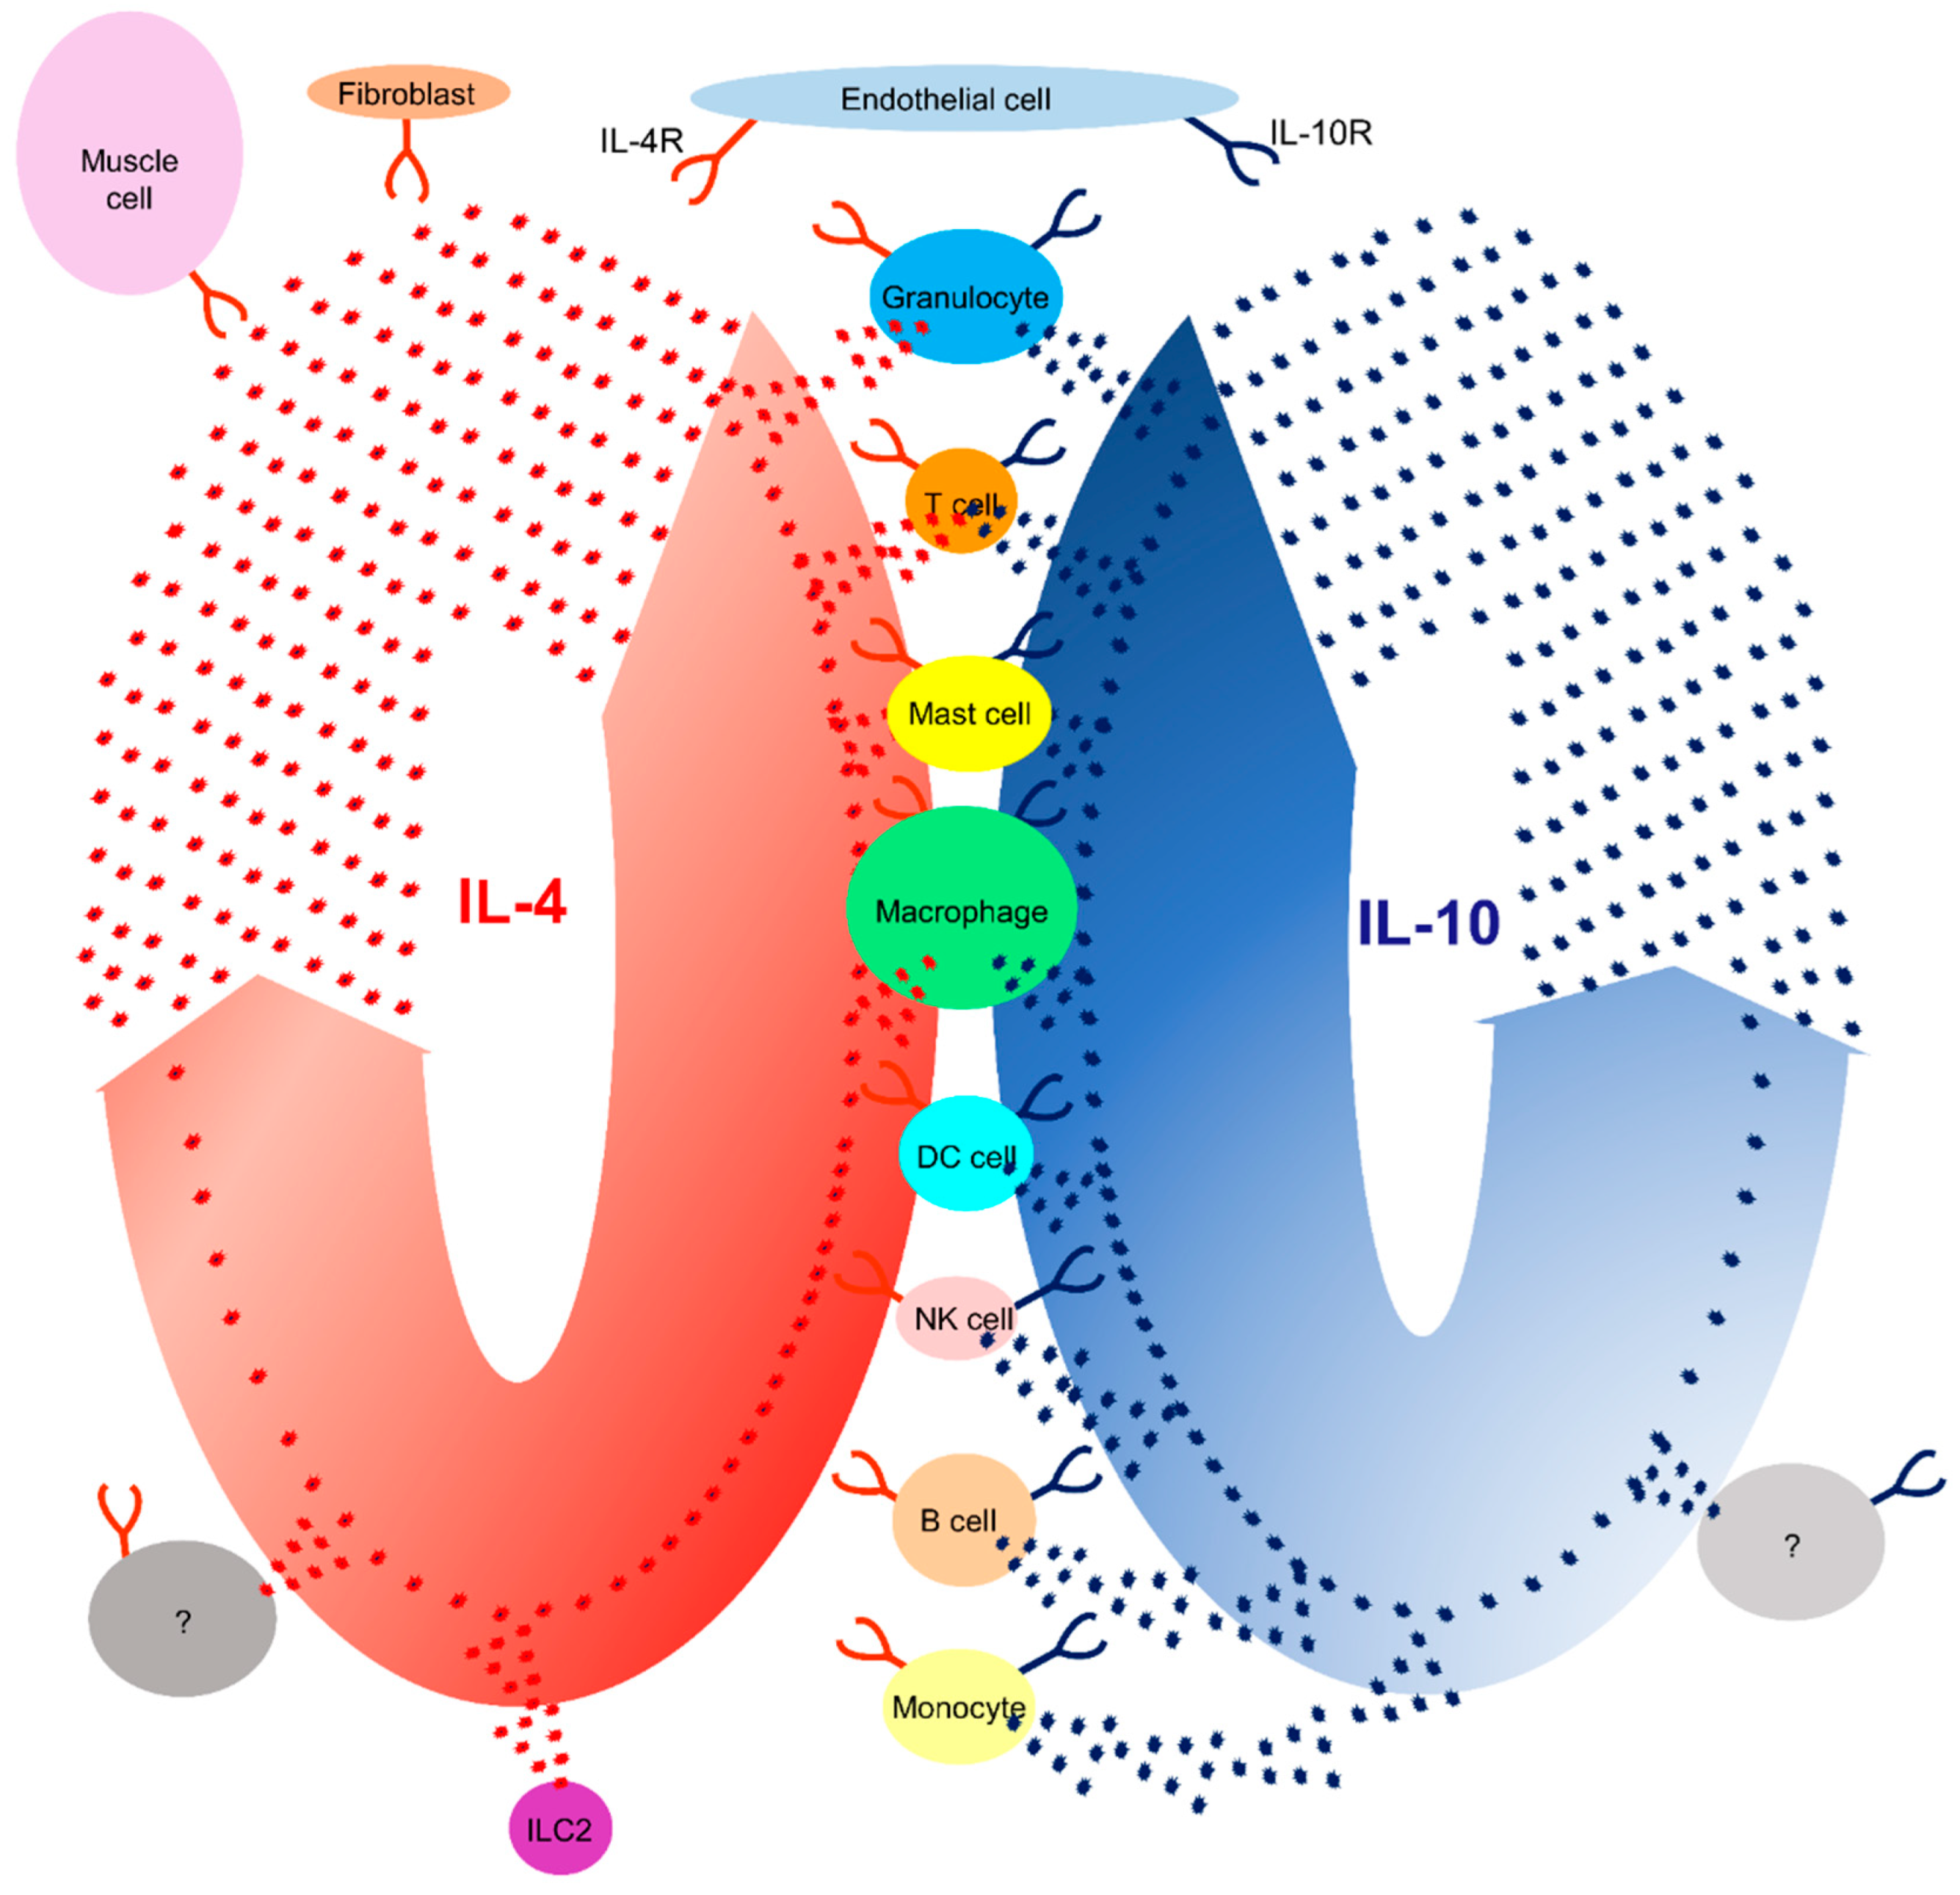
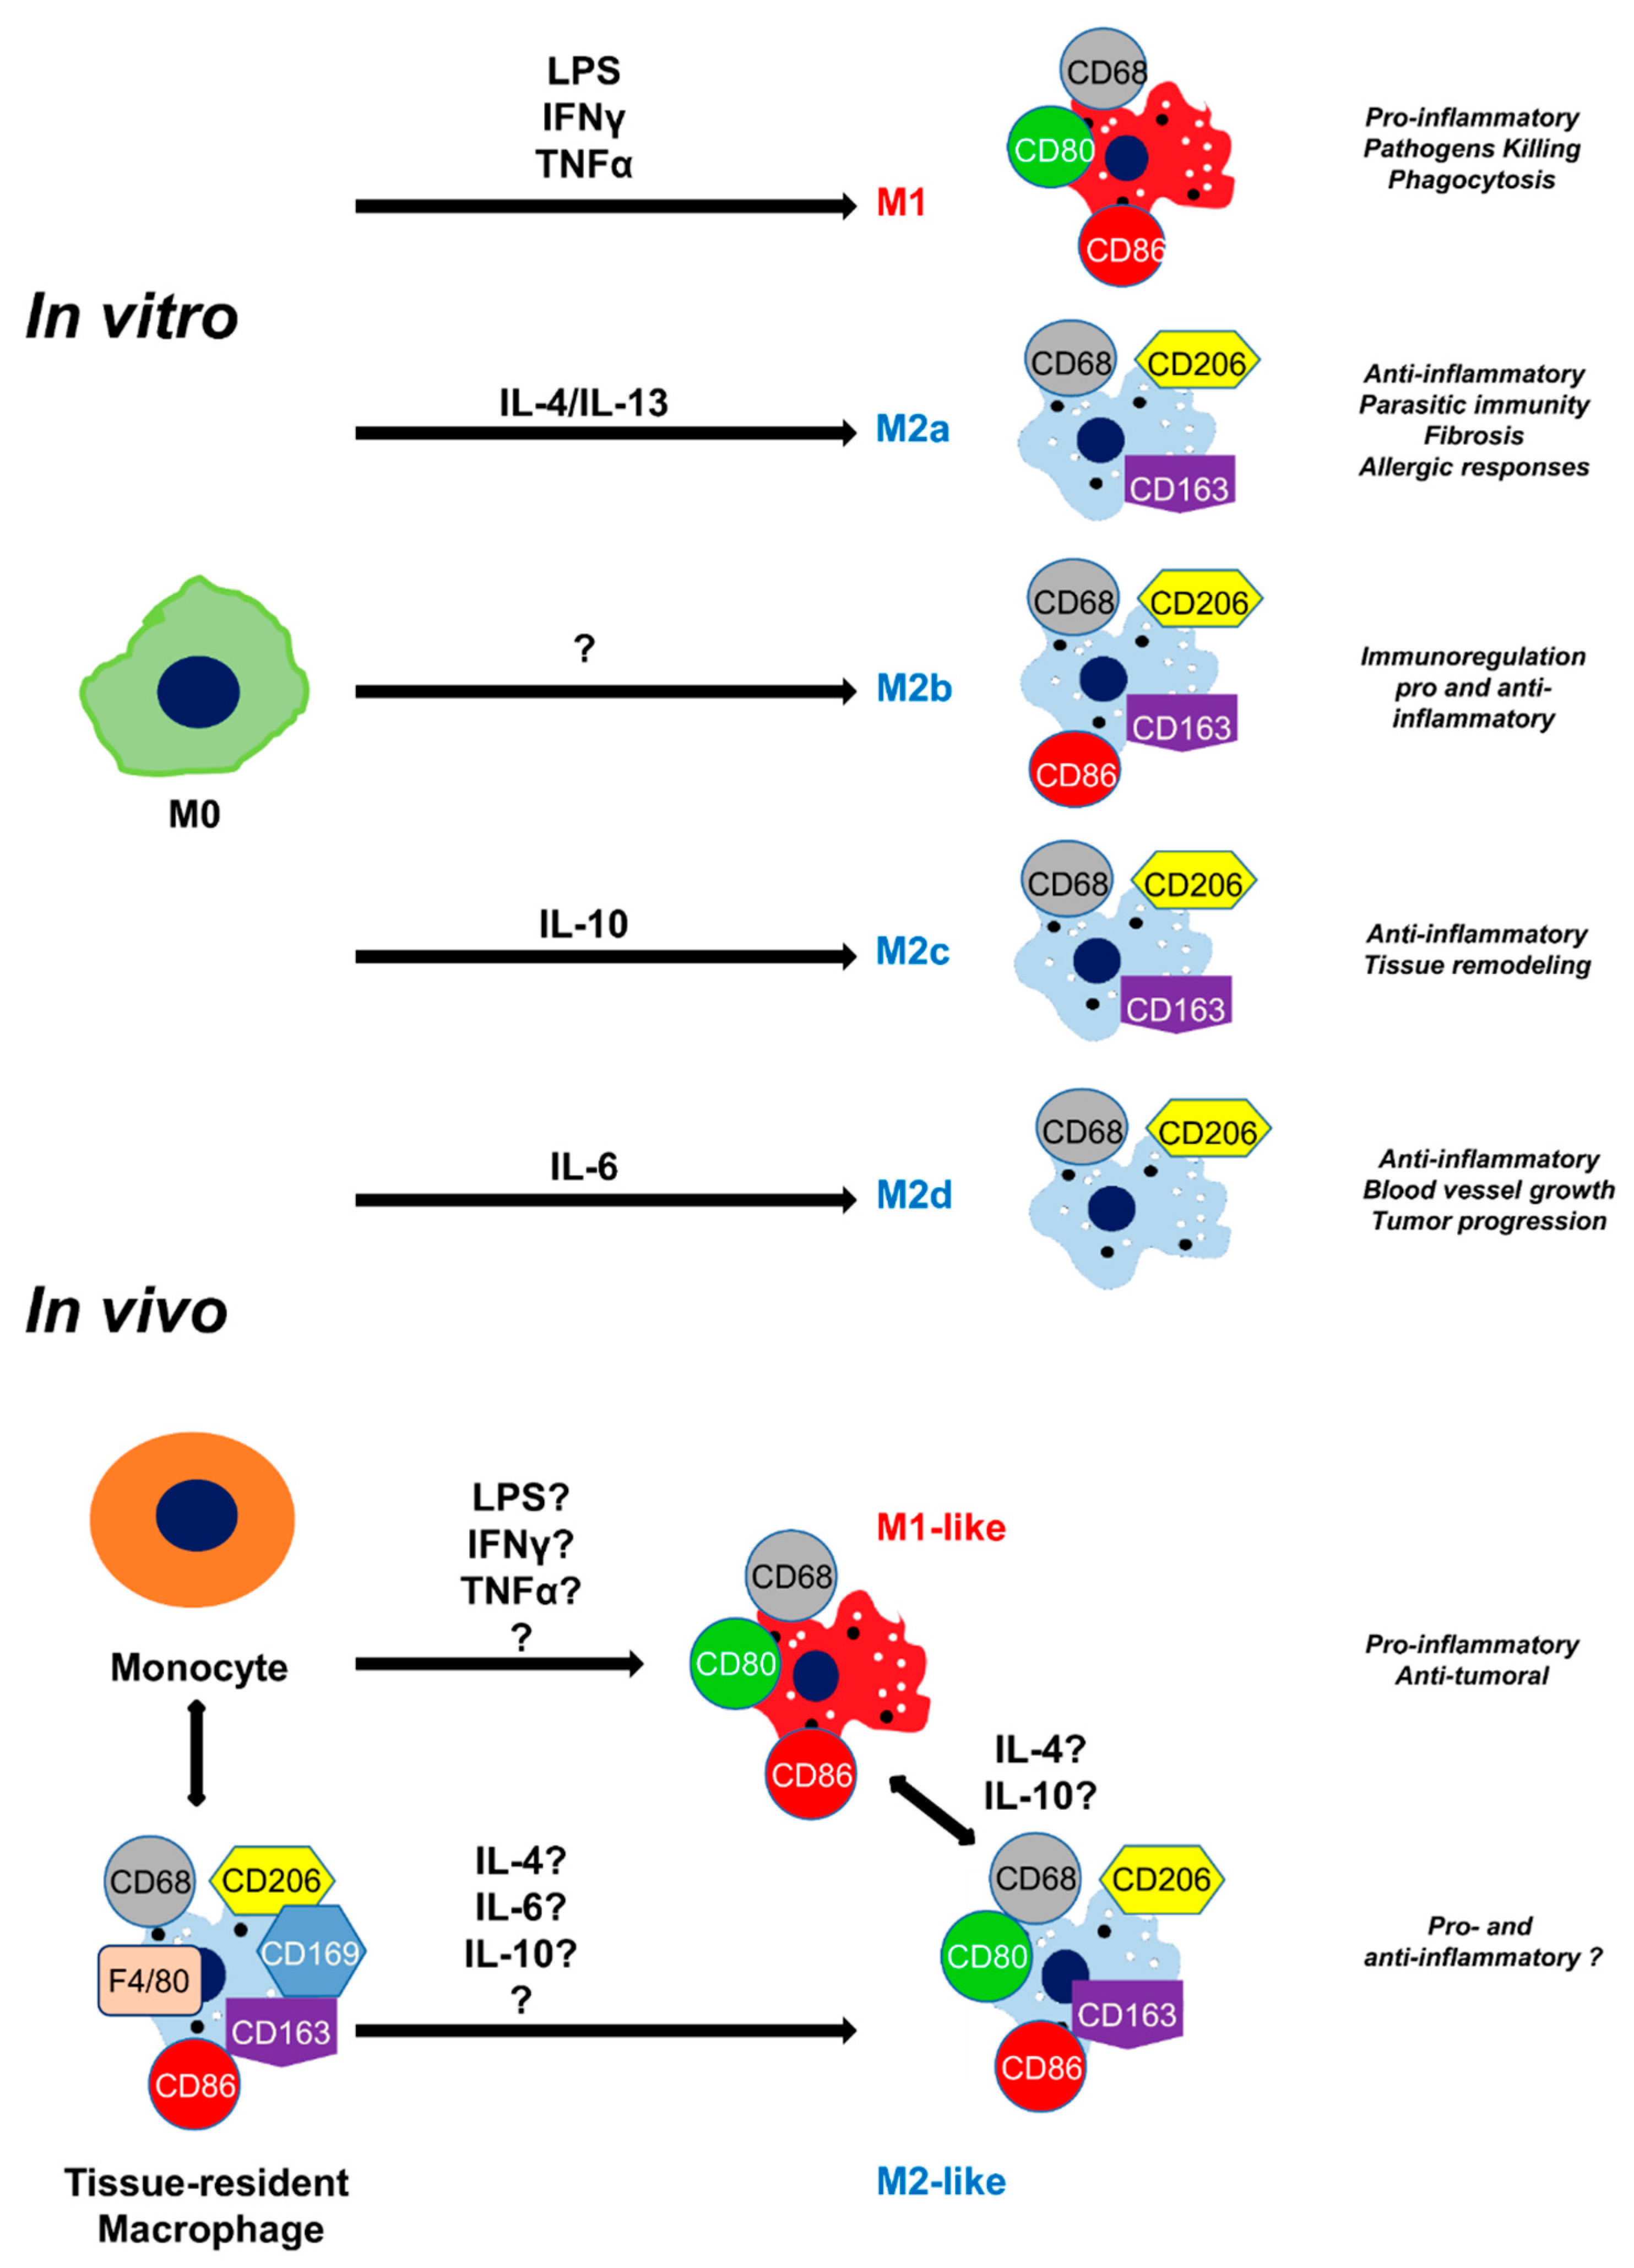
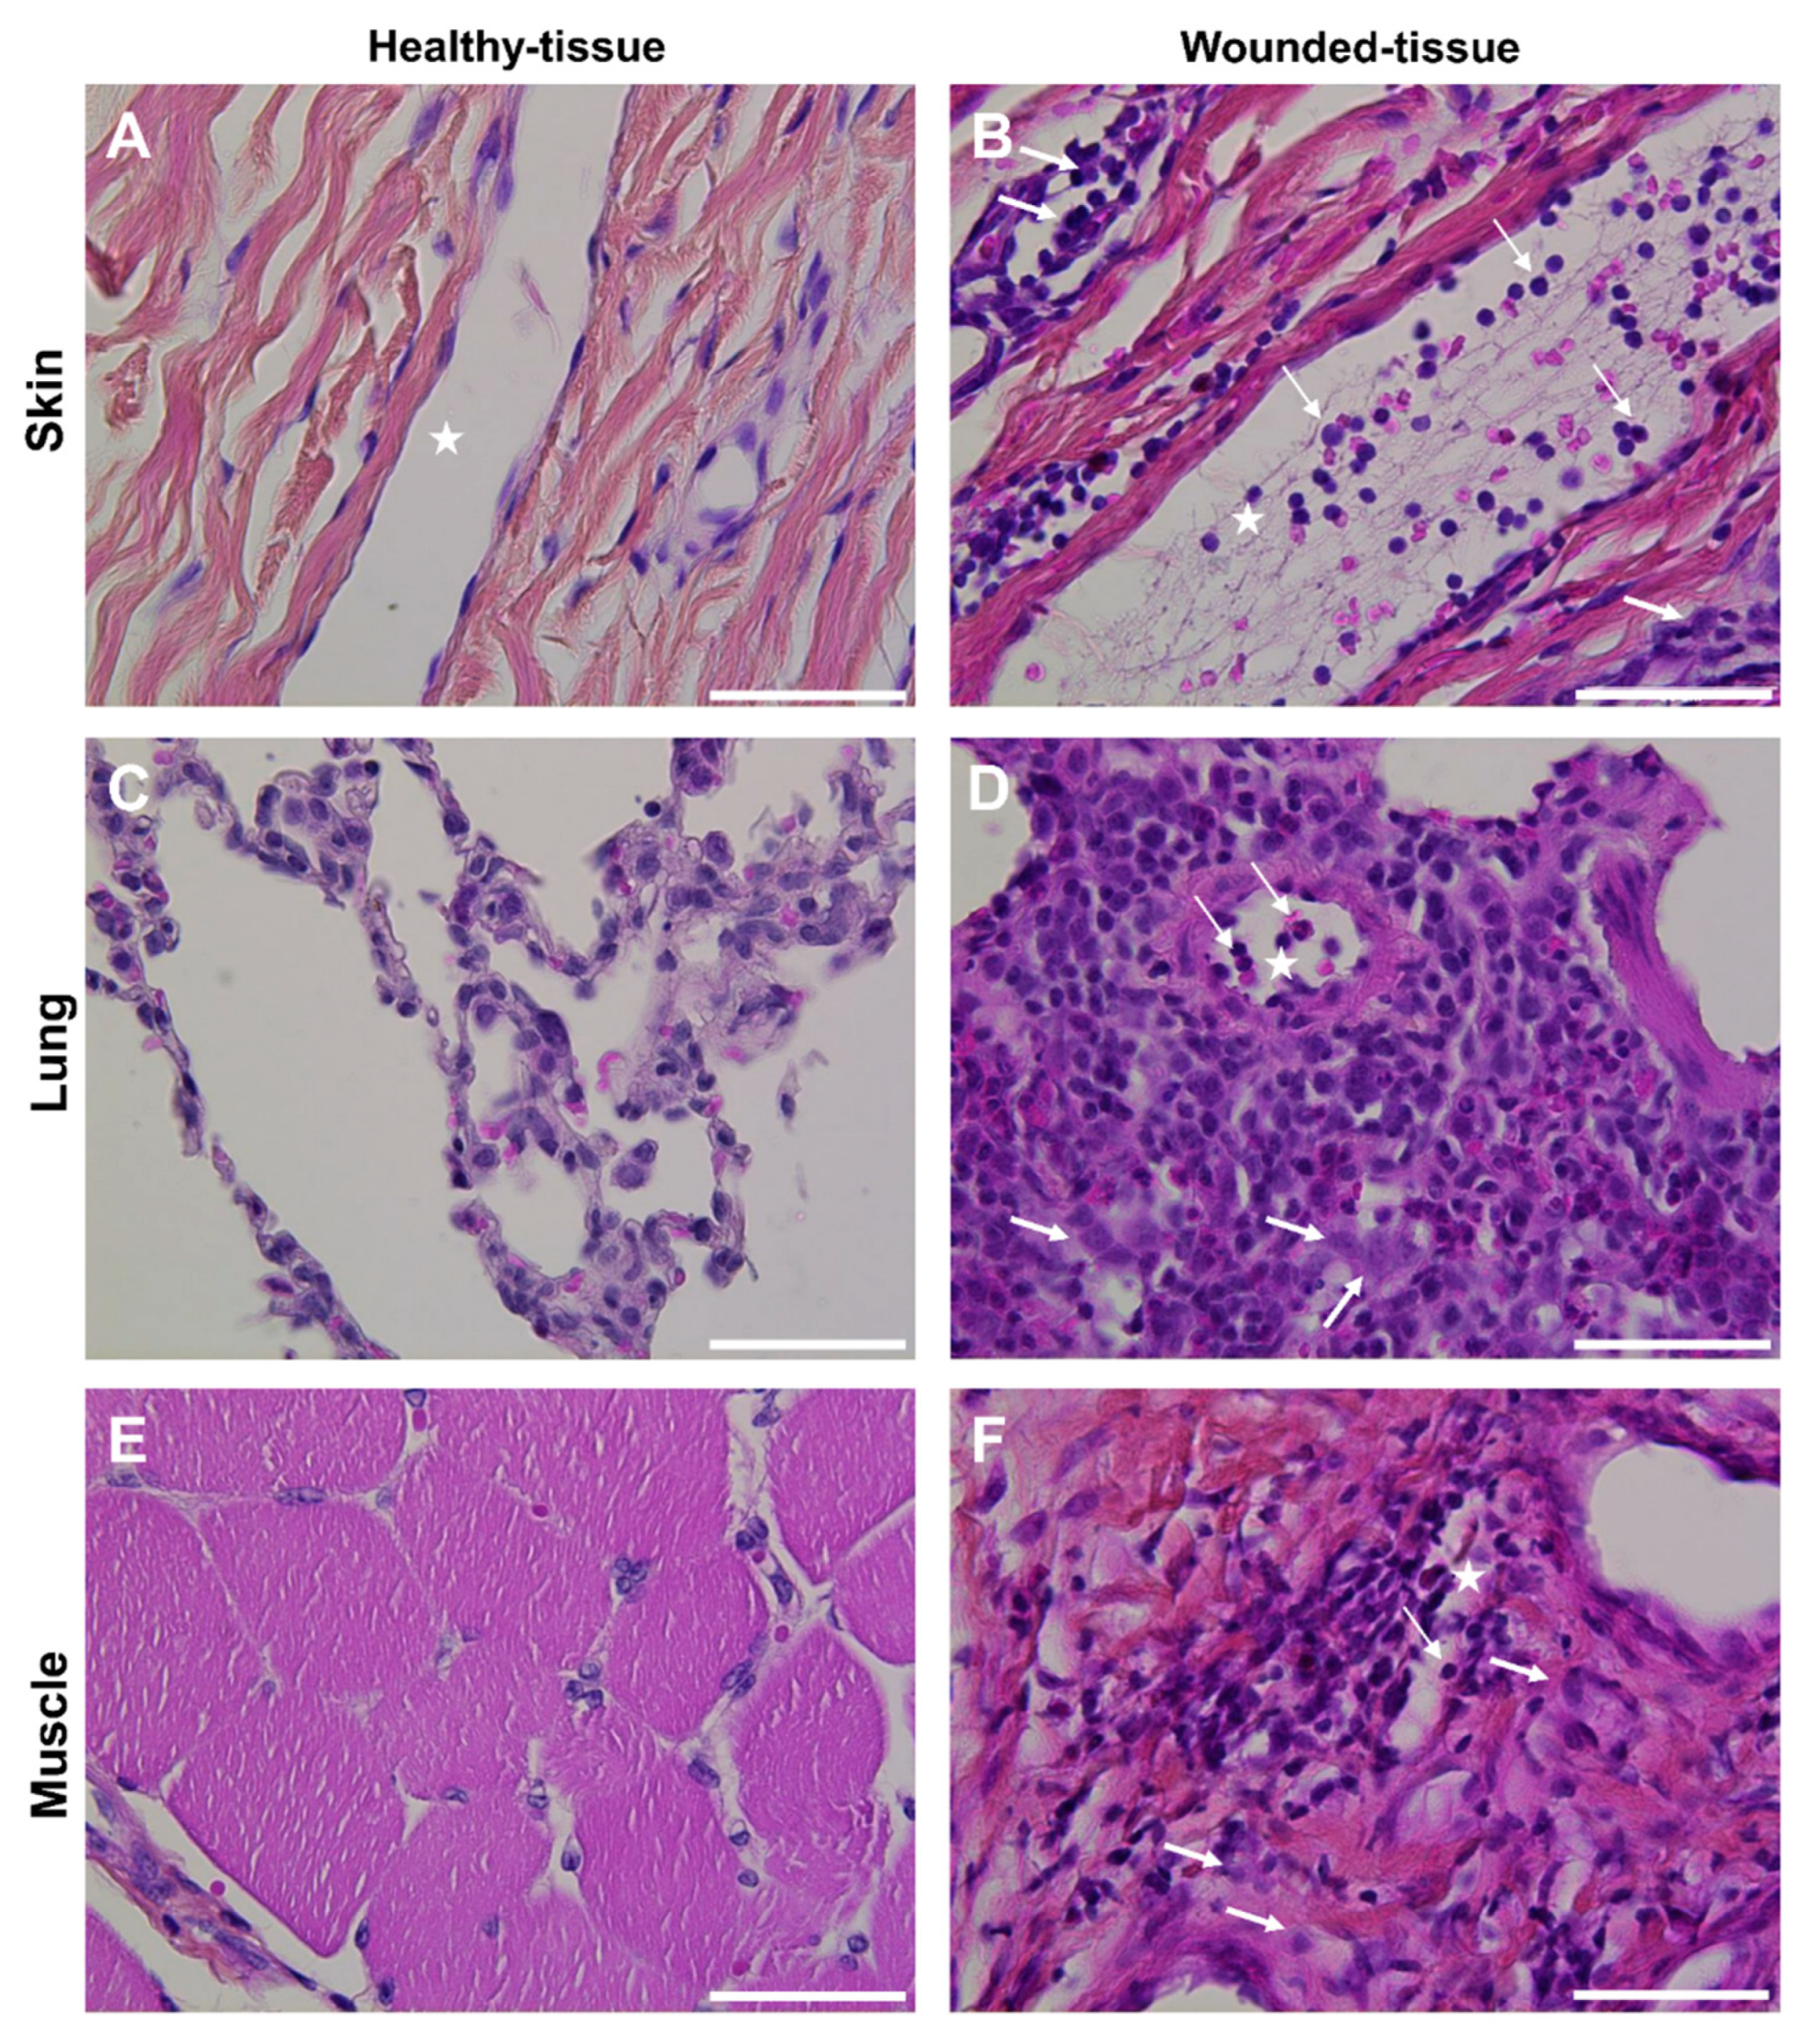
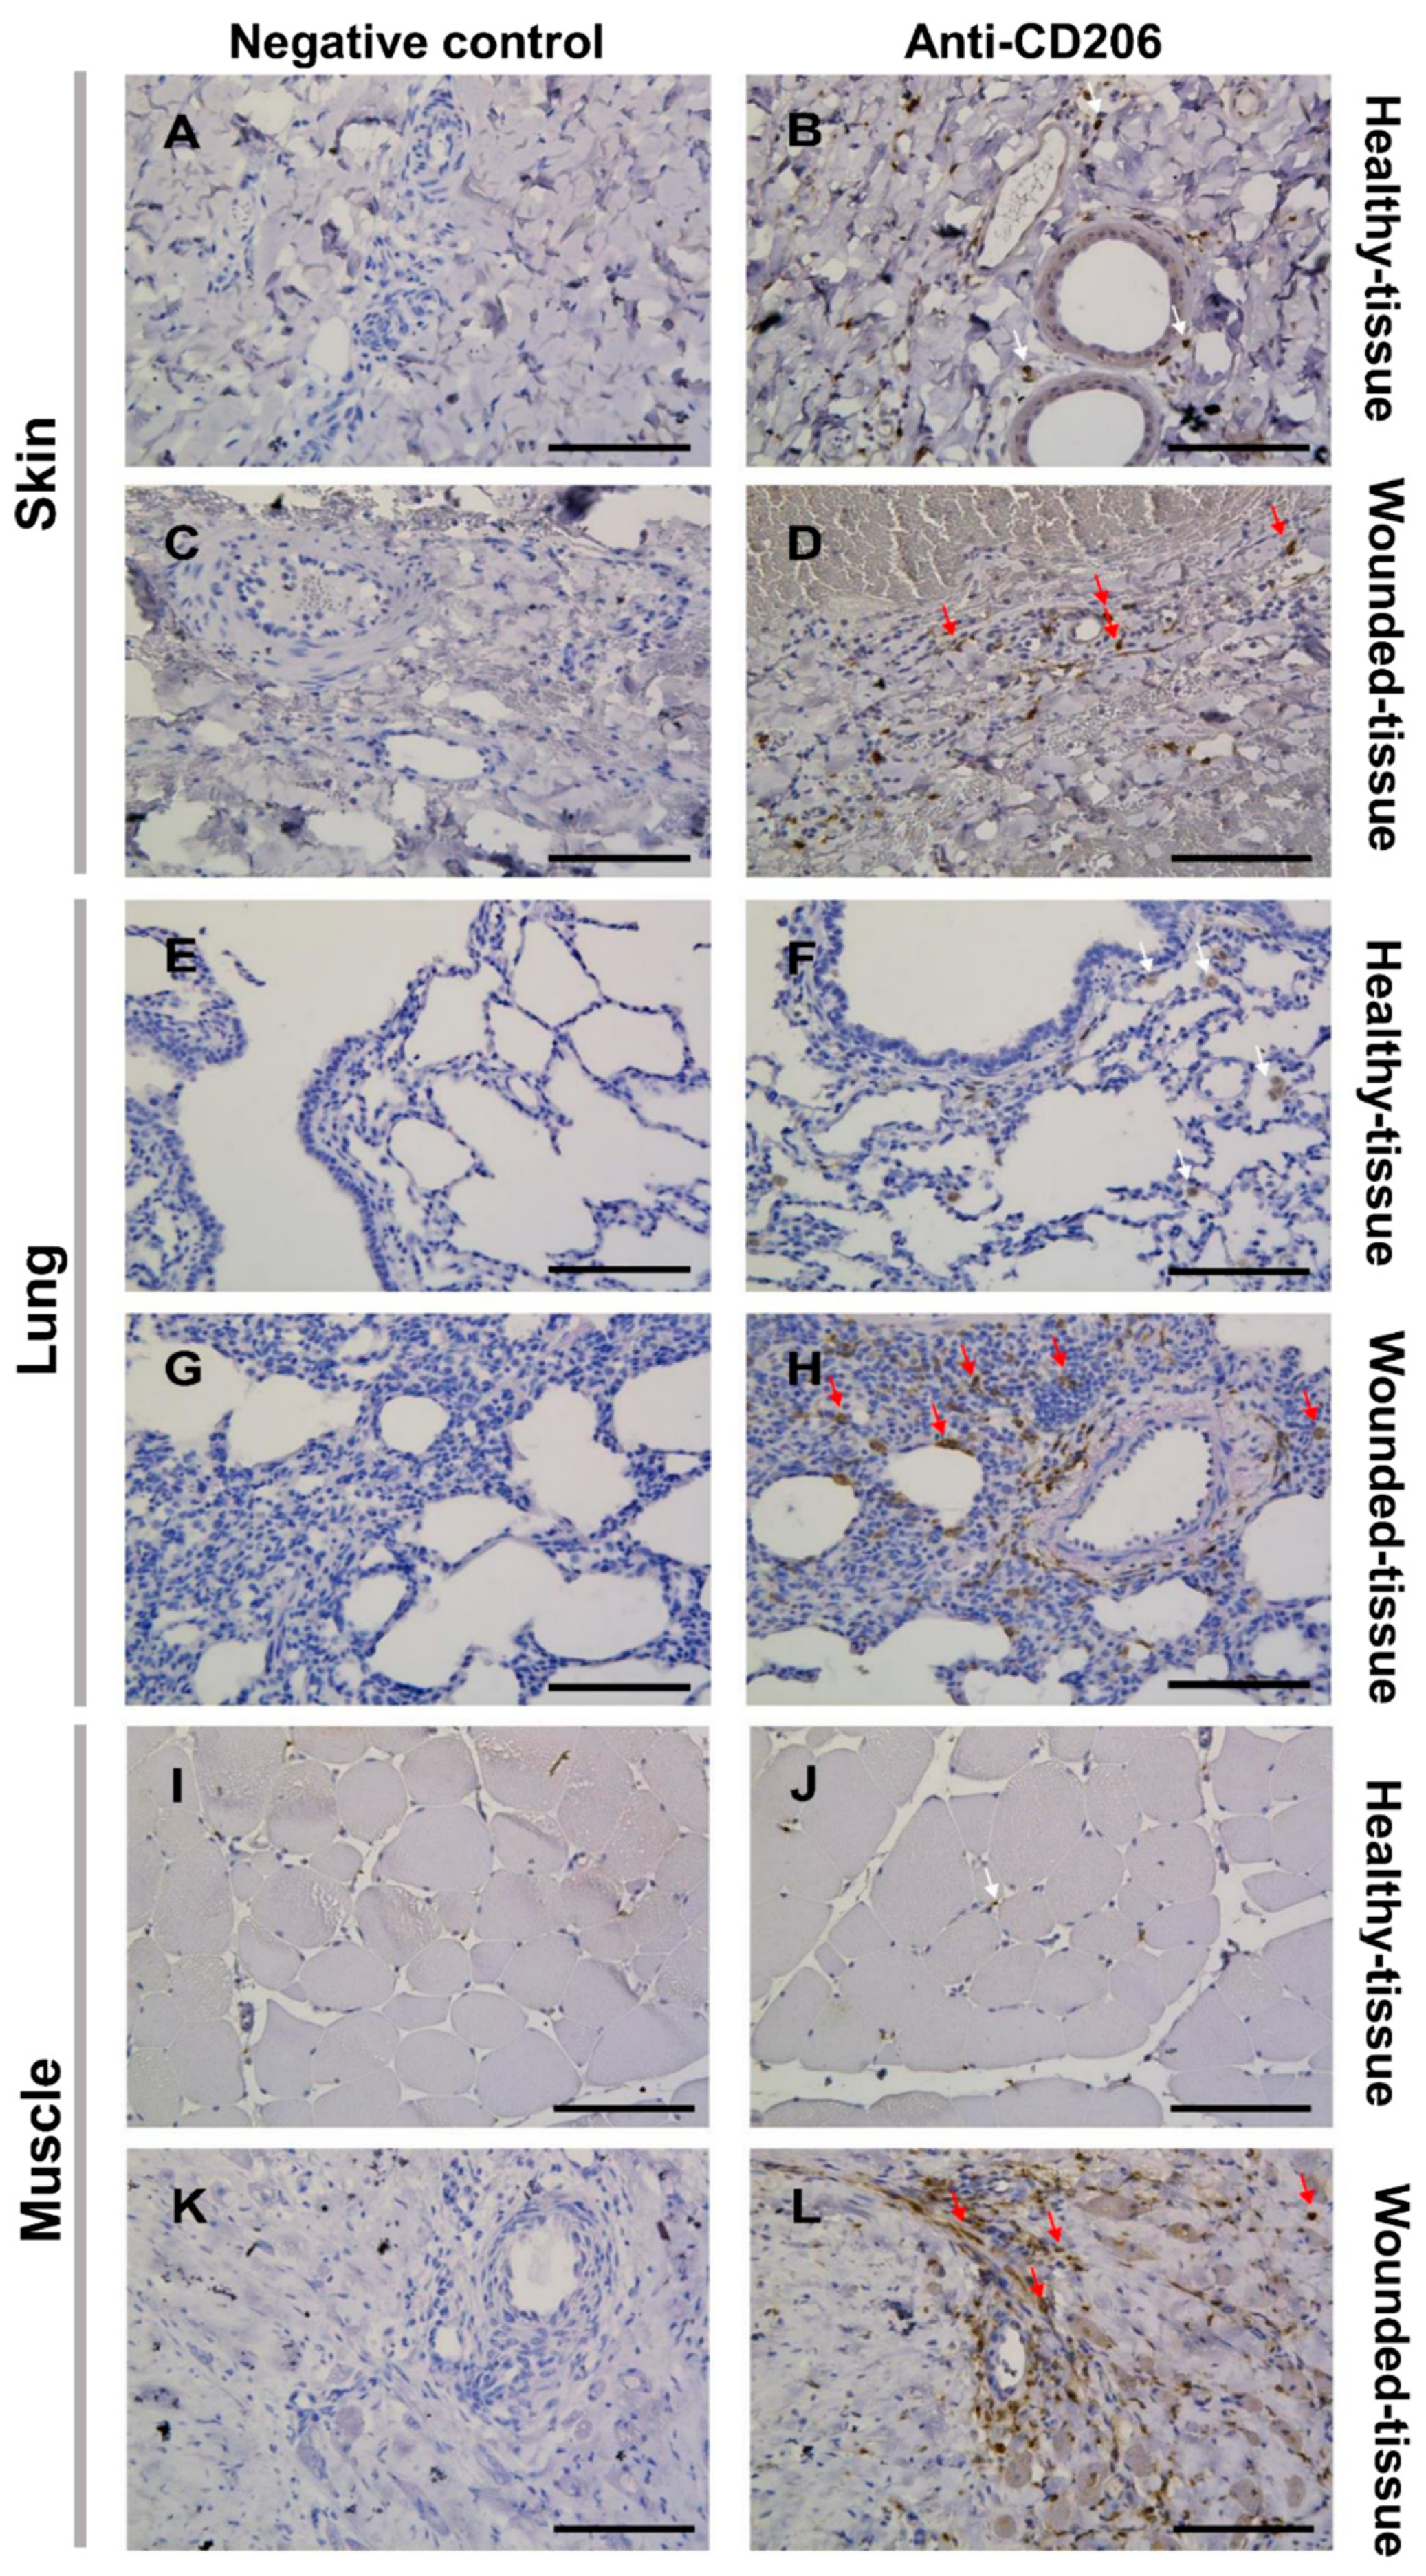
| Expression | IL-4 | IL-10 | |||
| Cytokine | Receptor | Cytokine | Receptor | ||
| Granulocyte | + | + | + | + | |
| T cell | + | + | + | + | |
| Mast cell | + | + | + | + | |
| Macrophage | + | + | + | + | |
| Monocyte | - | + | + | + | |
| B cell | - | + | + | + | |
| DC cell | - | + | + | + | |
| NK cell | - | + | + | + | |
| ILC2 | + | - | - | - | |
| Endothelial cell | - | + | - | + | |
| Fibroblast | - | + | - | - | |
| Muscle cell | - | + | - | - | |
Disclaimer/Publisher’s Note: The statements, opinions and data contained in all publications are solely those of the individual author(s) and contributor(s) and not of MDPI and/or the editor(s). MDPI and/or the editor(s) disclaim responsibility for any injury to people or property resulting from any ideas, methods, instructions or products referred to in the content. |
© 2023 by the authors. Licensee MDPI, Basel, Switzerland. This article is an open access article distributed under the terms and conditions of the Creative Commons Attribution (CC BY) license (http://creativecommons.org/licenses/by/4.0/).


